The Confidential Enquiry into Perioperative Small … · 1 The Confidential Enquiry into...
269
1 The Confidential Enquiry into Perioperative Small Animal Fatalities By David C. Brodbelt MA VetMB DVA DipECVA MRCVS A thesis submitted in partial fulfilment of the requirements for the degree of Doctor of Philosophy Royal Veterinary College, University of London And The Animal Health Trust 2006
Transcript of The Confidential Enquiry into Perioperative Small … · 1 The Confidential Enquiry into...

1
The Confidential Enquiry into Perioperative Small Animal Fatalities
By
David C. Brodbelt
MA VetMB DVA DipECVA MRCVS
A thesis submitted in partial fulfilment of the requirements for the degree of
Doctor of Philosophy
Royal Veterinary College, University of London
And
The Animal Health Trust
2006

2
Abstract
This thesis represents a large scale practice based prospective epidemiological study,
undertaken to estimate the species-specific risks of anaesthetic-related death in small
animals in the UK, to identify risk factors for anaesthetic-related death in dogs, cats and
rabbits and to make recommendations to improve the practice of small animal
veterinary anaesthesia.
A nested case-control study was undertaken in a cohort of small animals anaesthetised
at a group of veterinary practices and referral institutions in the UK. A record of all
small animals anaesthetised at the centres during their period of participation and
whether they were dead or alive, 48 hours later, was made. Anaesthetic-related death (a
case) was defined as perioperative death within 48 hours of termination of the
procedure, except where death was due solely to inoperable surgical or pre-existing
medical conditions. Cases were compared to prospectively randomly selected controls
in dogs and cats. Matched controls from the same clinic as the individual cases were
selected in rabbits. Sick cases (poor health status) were also compared to randomly
selected sick controls in dogs and cats. Following univariable screening, logistic
regression modelling was undertaken. Mixed effects models treating clinic as the
random effect were developed for dogs and cats and a conditional logistic regression
model was built for rabbit mortality.
One hundred and seventeen centres participated in the study between June 2002 and
June 2004. During that time, 98,036 dogs, 79,178 cats and 8,209 rabbits were
anaesthetised or sedated and 163, 189 and 114 anaesthetic-related deaths were
identified respectively, resulting in risks of death of 0.17% (95% Confidence Interval
(95% CI) 0.14 – 0.19%) in dogs, 0.24% (0.21 – 0.27%) in cats and 1.39% (1.11 –
1.64%) in rabbits. Other small animal species tended to have higher risks. In rabbits,
poor health status, procedures lasting 30 or more minutes, and major procedures were
associated with increased odds and the veterinary surgeon being very familiar with the
anaesthetic used with reduced odds of anaesthetic-related death. In dogs, increased odds
were associated with poor health status, extremes of age and weight, increasing
procedure urgency, complexity and duration, and with mask induction of anaesthesia
and maintenance with halothane. In the sick dog study, increased odds were associated
with poor health status, extremes of weight, increasing procedural urgency, halothane

3
anaesthesia and controlled ventilation; preoperative blood testing was associated with
reduced odds. In cats, poor health status, extremes of weight, increasing age, increasing
procedural urgency and complexity, endotracheal intubation and perioperative fluid
therapy were associated with increased odds; pulse and pulse oximetry monitoring were
associated with reduced odds. In the sick cat study, poor health status, increasing weight
and age, and perioperative fluids were associated with increased odds, pulse and pulse
oximetry monitoring and the use of nitrous oxide were associated with reduced odds.
The risks of anaesthetic-related mortality have decreased in dogs and cats since the last
UK study, though they remain substantially greater than the risk reported in man. The
risks in other species appear higher and should be particularly targeted for
improvement. Patient health status, age and weight, and procedural urgency, complexity
and duration would appear valuable factors to aid assessment of anaesthetic risk and
identify patients that require intensive perioperative management. The use of isoflurane
anaesthesia and the avoidance of mask inductions in dogs, the judicial use of
endotracheal intubation in cats and increasing veterinarian familiarity with the
anaesthetic used in rabbits could reduce the risk of anaesthetic-related death. The merits
of pulse and pulse oximetry monitoring and fluid therapy require further evaluation.

4
Memorandum
This thesis represents the unaided work of the author, except where acknowledged. The
views expressed in this work are those of the author and not necessarily of the
University.
Dave Brodbelt
November 2005

5
Table of Contents
THE CONFIDENTIAL ENQUIRY INTO PERIOPERATIVE SMALL ANIMAL FATALITIES... 1
ABSTRACT................................................................................................................................................ 2 TABLE OF CONTENTS ............................................................................................................................... 5 LIST OF FIGURES ...................................................................................................................................... 7 LIST OF TABLES ....................................................................................................................................... 8 LIST OF TABLES ....................................................................................................................................... 8 ACKNOWLEDGEMENTS........................................................................................................................... 11 ACKNOWLEDGEMENTS........................................................................................................................... 11 PREFACE ................................................................................................................................................ 12 CHAPTER 1: LITERATURE REVIEW ......................................................................................................... 14
1.1 Introduction ................................................................................................................................ 14 1.2 Perioperative complication risks ................................................................................................ 15 1.3 Causes of perioperative death .................................................................................................... 29 1.4 Risk factors for mortality ............................................................................................................ 34 1.5 Methodology ............................................................................................................................... 51
CHAPTER 2: MATERIALS AND METHODS................................................................................................ 57 2.1 Introduction ................................................................................................................................ 57 2.2 Pilot Study................................................................................................................................... 57 2.3 Power calculations and sample size estimates ........................................................................... 58 2.4 Aims and Objectives ................................................................................................................... 58 2.5 A Priori Hypotheses.................................................................................................................... 59 2.6 Study population ......................................................................................................................... 60 2.7 Study design................................................................................................................................ 60 2.8 Recruitment, Training and Retention of Centres ........................................................................ 66 2.9 Data collection tool design......................................................................................................... 68 2.10 Database design ....................................................................................................................... 70 2.11 Data validation, checking and cleaning ................................................................................... 71 2.12 Statistical Methods.................................................................................................................... 72 2.13 Discussion................................................................................................................................. 77
CHAPTER 3: PRACTICE CHARACTERISTICS AND ANAESTHETIC MANAGEMENT...................................... 81 3.1 Introduction ................................................................................................................................ 81 3.2 Materials and Methods ............................................................................................................... 81 3.3 Results......................................................................................................................................... 81 3.4 Discussion................................................................................................................................... 89
CHAPTER 4: RISKS OF ANAESTHETIC-RELATED DEATH IN SMALL ANIMALS ......................................... 95 4.1 Introduction ................................................................................................................................ 95 4.2 Materials and Methods:.............................................................................................................. 95 4.3 Results: ....................................................................................................................................... 97 4.4 Discussion: ............................................................................................................................... 103
6
CHAPTER 5: RISK FACTORS FOR ANAESTHETIC-RELATED DEATH IN RABBITS .................................... 110 5.1 Introduction .............................................................................................................................. 110 5.2 Materials and Methods ............................................................................................................. 110 5.3 Results....................................................................................................................................... 112 5.4 Discussion................................................................................................................................. 121
CHAPTER 6 RISK FACTORS FOR ANAESTHETIC-RELATED DEATH IN DOGS .......................................... 131 6.1 Introduction .............................................................................................................................. 131 6.2 Materials and Methods ............................................................................................................. 131 6.3 Results....................................................................................................................................... 133 6.4 Discussion................................................................................................................................. 158
CHAPTER 7: RISK FACTORS FOR ANAESTHETIC-RELATED DEATH IN CATS.......................................... 180 7.1 Introduction .............................................................................................................................. 180 7.2 Materials and Methods ............................................................................................................. 180 7.3 Results....................................................................................................................................... 182 7.4 Discussion................................................................................................................................. 207
CHAPTER 8: GENERAL CONCLUSIONS .................................................................................................. 222 APPENDICES ......................................................................................................................................... 229
Appendix 2.1 American Society of Anesthesiologists Health Status Classification ........................ 229 Appendix 2.2 CEPSAF Case Diary Questionnaire......................................................................... 230 Appendix 2.3 CEPSAF Case-Control Questionnaire ..................................................................... 231 Appendix 2.4 Case Definition and Criteria for Independent Review Panel ................................... 232 Appendix 2.5 Causes of Death Classification................................................................................. 233 Appendix 2.6 Distribution of Cases and Controls over the Study Period....................................... 234 Appendix 2.7 CEPSAF Practice Survey Questionnaire.................................................................. 238 Appendix 6.1 Drug dose associations with anaesthetic-related death in Dogs .............................. 239 Appendix 6.2 The association of drugs with anaesthetic-related death in Dogs ............................ 240 Appendix 7.1 The association of drug dose with anaesthetic-related death in cats ....................... 241
BIBLIOGRAPHY..................................................................................................................................... 242

7
List of Figures
FIGURE 2.1 CONCEPTUAL FRAMEWORK FOR RISK FACTORS FOR ANAESTHETIC-RELATED DEATH ............ 75 FIGURE 3.1 DISTRIBUTION OF PRACTICES IN THE UK.................................................................................. 82 FIGURE 6.1 THE DELTA DEVIANCE DIAGNOSTIC STATISTIC VERSUS THE ESTIMATED PROBABILITY FOR THE
DOG MODEL .................................................................................................................................... 147 FIGURE 6.2 THE DELTA BETA DIAGNOSTIC STATISTIC VERSUS THE ESTIMATED PROBABILITY FOR THE DOG
MODEL............................................................................................................................................. 148 FIGURE 6.3 THE DELTA DEVIANCE DIAGNOSTIC STATISTIC VERSUS THE ESTIMATED PROBABILITY FOR THE
SICK DOG MODEL ........................................................................................................................... 157 FIGURE 6.4 THE DELTA BETA DIAGNOSTIC STATISTIC VERSUS THE ESTIMATED PROBABILITY FOR THE SICK
DOG MODEL.................................................................................................................................... 158 FIGURE 7.1 THE DELTA DEVIANCE DIAGNOSTIC STATISTIC VERSUS THE ESTIMATED PROBABILITY FOR THE
CAT MODEL ..................................................................................................................................... 196 FIGURE 7.2 THE DELTA BETA DIAGNOSTIC STATISTIC VERSUS THE ESTIMATED PROBABILITY FOR THE CAT
MODEL ............................................................................................................................................ 196 FIGURE 7.3 THE ASSOCIATION OF ANAESTHETIC-RELATED DEATH IN SICK CATS WITH INCREASING AGE . 204 FIGURE 7.4 THE DELTA DEVIANCE DIAGNOSTIC STATISTIC VERSUS THE ESTIMATED PROBABILITY FOR THE
SICK CAT MODEL............................................................................................................................ 206 FIGURE 7.5 THE DELTA BETA DIAGNOSTIC STATISTIC VERSUS THE ESTIMATED PROBABILITY FOR THE SICK
CAT MODEL .................................................................................................................................... 206

8
List of Tables
TABLE 3.1 THE AMOUNT OF FIRST OPINION WORK BY CENTRE .................................................................... 83 TABLE 3.2 NUMBER OF VETERINARY SURGEONS PER CENTRE..................................................................... 84 TABLE 3.3 SEDATION AGENTS COMMONLY USED IN DOGS AND CATS.......................................................... 85 TABLE 3.4 PREMEDICATION AGENTS COMMONLY USED IN DOGS AND CATS................................................ 85 TABLE 3.5 INDUCTION AGENTS COMMONLY USED IN DOGS AND CATS ........................................................ 86 TABLE 3.6 INJECTABLE ANAESTHETIC AGENTS COMMONLY USED IN RABBITS ............................................ 87 TABLE 3.7 RISKS OF ANAESTHETIC-RELATED DEATH AS ESTIMATED BY THE INDIVIDUAL CENTRES............ 89 TABLE 4.1 RISK OF DEATH IN SMALL ANIMALS ........................................................................................... 99 TABLE 4.2 ANAESTHETIC-RELATED RISK OF DEATH IN SMALL ANIMALS................................................... 100 TABLE 4.3 RISK OF ANAESTHETIC-RELATED DEATH IN HEALTHY AND SICK DOGS, CATS AND RABBITS..... 101 TABLE 4.4 CLINIC LEVEL RISKS OF ANAESTHETIC-RELATED DEATH BY TYPE OF VETERINARY PRACTICE.. 101 TABLE 4.5 CLINIC LEVEL RISKS OF ANAESTHETIC-RELATED DEATH BY PRACTICE STANDARD .................. 102 TABLE 4.6 TIMING OF DEATH IN DOGS, CATS AND RABBITS ..................................................................... 102 TABLE 4.7 PRIMARY CAUSE OF DEATH IN DOGS, CATS AND RABBITS ........................................................ 103 TABLE 5.1 TIMING OF DEATH OF THE RABBITS ......................................................................................... 112 TABLE 5.2 PRIMARY CAUSE AND TIMING OF DEATH IN RABBITS ............................................................... 113 TABLE 5.3 RABBIT BREEDS....................................................................................................................... 113 TABLE 5.4 INTENDED PROCEDURES IN RABBITS........................................................................................ 114 TABLE 5.5 ANAESTHETIC DRUGS USED IN RABBITS .................................................................................. 114 TABLE 5.6 PATIENT MANAGEMENT IN RABBITS ........................................................................................ 115 TABLE 5.7.A THE ASSOCIATION OF PATIENT AND PROCEDURAL VARIABLES WITH ANAESTHETIC-RELATED
DEATH IN RABBITS .......................................................................................................................... 116 TABLE 5.7.B THE ASSOCIATION OF ANAESTHETIC AGENT WITH ANAESTHETIC-RELATED DEATH IN RABBITS
........................................................................................................................................................ 117 TABLE 5.7.C THE ASSOCIATION OF ANAESTHETIC MANAGEMENT WITH ANAESTHETIC-RELATED DEATH IN
RABBITS .......................................................................................................................................... 118 TABLE 5.8 THE CONDITIONAL LOGISTIC REGRESSION MODEL FOR ANAESTHETIC-RELATED DEATH IN
RABBITS .......................................................................................................................................... 119 TABLE 6.1 COMPARISON OF CONTROLS AND NON-RETURNED CONTROLS IN DOGS ................................... 134 TABLE 6.2 PREMEDICATION GIVEN TO DOGS ............................................................................................ 135 TABLE 6.3 INDUCTION AGENTS USED FOR ANAESTHESIA AND SEDATION IN DOGS.................................... 135 TABLE 6.4 MAINTENANCE AGENTS USED FOR ANAESTHESIA AND SEDATION IN DOGS.............................. 136 TABLE 6.5.A THE ASSOCIATION OF PATIENT VARIABLES WITH ANAESTHETIC-RELATED DEATH IN DOGS.. 139 TABLE 6.5.B THE ASSOCIATION OF FURTHER PATIENT VARIABLES WITH ANAESTHETIC-RELATED DEATH IN
DOGS............................................................................................................................................... 140 TABLE 6.5.C THE ASSOCIATION OF PROCEDURAL FACTORS WITH ANAESTHETIC-RELATED DEATH IN DOGS
........................................................................................................................................................ 141 TABLE 6.5.D THE ASSOCIATION OF ANAESTHETIC AGENTS WITH ANAESTHETIC-RELATED DEATH IN DOGS
........................................................................................................................................................ 142

9
TABLE 6.5.E THE ASSOCIATION OF MANAGEMENT AND MONITORING FACTORS WITH ANAESTHETIC-
RELATED DEATH IN DOGS................................................................................................................ 143 TABLE 6.5.F THE ASSOCIATION OF RECOVERY AND PERSONNEL VARIABLES WITH ANAESTHETIC-RELATED
DEATH IN DOGS ............................................................................................................................... 144 TABLE 6.6 FINAL MIXED EFFECTS LOGISTIC REGRESSION MODEL OF THE RISK OF ANAESTHETIC-RELATED
DEATH IN DOGS ............................................................................................................................... 145 TABLE 6.7.A THE ASSOCIATION OF PATIENT VARIABLES WITH ANAESTHETIC-RELATED DEATH IN SICK DOGS
........................................................................................................................................................ 150 TABLE 6.7.B THE ASSOCIATION OF FURTHER PATIENT VARIABLES WITH ANAESTHETIC-RELATED DEATH IN
SICK DOGS ...................................................................................................................................... 151 TABLE 6.7.C THE ASSOCIATION OF PROCEDURAL FACTORS WITH ANAESTHETIC-RELATED DEATH IN SICK
DOGS............................................................................................................................................... 152 TABLE 6.7.D THE ASSOCIATION OF ANAESTHETICS WITH ANAESTHETIC-RELATED DEATH IN SICK DOGS . 153 TABLE 6.7.E THE ASSOCIATION OF MONITORING VARIABLES WITH ANAESTHETIC-RELATED DEATH IN SICK
DOGS............................................................................................................................................... 154 TABLE 6.7.F THE ASSOCIATION OF RECOVERY AND PERSONNEL FACTORS WITH ANAESTHETIC-RELATED
DEATH IN SICK DOGS....................................................................................................................... 155 TABLE 6.8 FINAL LOGISTIC REGRESSION MODEL OF THE RISK OF ANAESTHETIC-RELATED DEATH IN SICK
DOGS............................................................................................................................................... 156 TABLE 7.1 COMPARISON OF CONTROLS AND NON-RETURNED CONTROLS IN CATS.................................... 183 TABLE 7.2 PREMEDICATION GIVEN TO CATS............................................................................................. 184 TABLE 7.3 INDUCTION AGENTS USED IN CATS .......................................................................................... 184 TABLE 7.4 MAINTENANCE AGENTS USED IN CATS .................................................................................... 184 TABLE 7.5.A THE ASSOCIATION OF PATIENT VARIABLES WITH ANAESTHETIC-RELATED DEATH IN CATS .. 188 TABLE 7.5.B THE ASSOCIATION OF PATIENT VARIABLES WITH ANAESTHETIC-RELATED DEATH IN CATS .. 189 TABLE 7.5.C THE ASSOCIATION OF PROCEDURAL VARIABLES WITH ANAESTHETIC-RELATED DEATH IN CATS
........................................................................................................................................................ 190 TABLE 7.5.D THE ASSOCIATION OF ANAESTHETIC AGENT WITH ANAESTHETIC-RELATED DEATH IN CATS. 191 TABLE 7.5.E THE ASSOCIATION OF MANAGEMENT AND MONITORING FACTORS WITH ANAESTHETIC-
RELATED DEATH IN CATS ................................................................................................................ 192 TABLE 7.5.F THE ASSOCIATION OF RECOVERY AND PERSONNEL FACTORS WITH ANAESTHETIC-RELATED
DEATH IN CATS................................................................................................................................ 193 TABLE 7.6 FINAL MULTIVARIABLE LOGISTIC REGRESSION MODEL OF THE RISK OF ANAESTHETIC-RELATED
DEATH IN CATS................................................................................................................................ 194 TABLE 7.7.A THE ASSOCIATION OF PATIENT VARIABLES WITH ANAESTHETIC-RELATED DEATH IN SICK CATS
........................................................................................................................................................ 198 TABLE 7.7.B THE ASSOCIATION OF PATIENT VARIABLES WITH ANAESTHETIC-RELATED DEATH IN SICK CATS
........................................................................................................................................................ 199 TABLE 7.7.C THE ASSOCIATION OF PROCEDURAL VARIABLES WITH ANAESTHETIC-RELATED DEATH IN SICK
CATS ............................................................................................................................................... 200

10
TABLE 7.7.D THE ASSOCIATION OF ANAESTHETIC AGENTS WITH ANAESTHETIC-RELATED DEATH IN SICK
CATS ............................................................................................................................................... 201 TABLE 7.7.E THE ASSOCIATION OF MANAGEMENT AND MONITORING FACTORS WITH ANAESTHETIC-
RELATED DEATH IN SICK CATS ........................................................................................................ 202 TABLE 7.8 THE FINAL LOGISTIC REGRESSION MODEL OF THE RISK OF ANAESTHETIC-RELATED DEATH IN
SICK CATS....................................................................................................................................... 204

11
Acknowledgements
I would like to thank Dr James Wood and Professor Dirk Pfeiffer for their guidance and
inspiration over the last three years. Their differing perspectives greatly improved this
work. Thanks also must go to Dr Lesley Young who acted as a further source of advice
and an excellent chair for the independent review panel. The independent review panel
must also be acknowledged. Dr Richard Hammond, Dr Karen Blissitt and Ms Prue
Neath, under the guidance of Dr Lesley Young painstakingly evaluated all dog and cat
cases over three long days. The epidemiology unit at the Animal Health trust must also
be thanked, in particular Drs Kristien Verheyen and William Henley, for their
comments and advice.
Dr Polly Taylor should be thanked for encouraging my interest in the study. Dr Mark
Johnston was an invaluable help in starting up the project and a great source of
experience and advice. All of the longsuffering practices and veterinary institutions that
took part in this study must also be thanked. Their enthusiasm and commitment ensured
the study was completed.
I acknowledge Pfizer Animal Health for funding this study.
I am eternally grateful to my family, my wife and my now three children, who listened
to my thoughts on the subject and managed to keep my feet firmly grounded throughout
the doctorate experience.
Finally, I would like to dedicate this to my parents who encouraged me throughout my
education.

12
Preface
There is very little reporting of small animal perioperative complications in the
veterinary literature. Not since the 1980’s were anaesthetic complications evaluated in
small animal practice in the UK (Clarke and Hall 1990). During the 1990’s,
international work has estimated the risk of anaesthetic death in small animal practice
and identified major risk factors for anaesthetic-related death (Dodman and Lamb 1992;
Rintasalo and Vainio 1995; Dyson, Maxie et al. 1998; Joubert 2000), but this work also
is now out of date and may be less relevant to current UK practice. New drugs,
techniques and equipment have been introduced to UK veterinary practice and the risk
associated with small animal anaesthesia needs re-evaluation. The aims of this study
were to prospectively estimate risks of anaesthetic-related death in small animals in the
UK, to identify risk factors for anaesthetic-related death in dogs, cats and rabbits and to
make recommendations to reduce the risk of death in small animal anaesthesia, based on
their scientific understanding.
Specific hypotheses pertaining to the risk factors in dogs, cats and rabbits were
developed prior to the study based on previous published work and clinical experience.
They included that:
a. Sick patients are at increased risks of death compared to healthy patients.
b. Acepromazine, propofol and isoflurane are associated with reduced risk in dogs and
cats.
c. The use of medetomidine is associated with increased risk.
d. The use of intraoperative fluid and having a separate person monitoring anaesthesia
are associated with a reduction in the risk.
e. Endotracheal intubation in cats is associated with increased risk.
f. Mask inductions are associated with increased risk in rabbits.

13
A study was designed to test these hypotheses and a pilot study was then undertaken, to
test data collection tools and to check the design was appropriate. In the light of the
pilot study, the hypothesis that medetomidine was associated with increased odds of
anaesthetic-related death was revised to a reduction in odds in dogs and cats.
The thesis is divided into eight chapters, comprising the literature review, a general
materials and methods chapter, results and an overall discussion chapter. The
characteristics of the participating veterinary centres, their trends in small animal
anaesthetic management and their perceived risks of anaesthetic-related death are
described in Chapter 3. Species-specific risks of anaesthetic-related death were
estimated in Chapter 4. Risk factors for anaesthetic-related death were identified in
Rabbits, Dogs and Cats in Chapters 5 to 7 respectively, and additionally risk factors for
dogs and cats that were already sick were studied in Chapters 6 and 7 respectively.
Overall conclusions in light of the results in the different species are discussed in
Chapter 8.

14
Chapter 1: Literature Review
1.1 Introduction
The assessment of perioperative anaesthetic complications is an important aid to
maintaining and improving anaesthetic standards, and reducing morbidity and mortality.
By quantifying the level of complications, it is possible to evaluate their extent and
provide a benchmark from which to compare any improvements undertaken.
Establishing causes and factors associated with morbidity and mortality allows for the
identification of the underlying aetiology of the complication and may provide the
means to improving standards. This process of critical evaluation of perioperative
complications, or anaesthetic auditing, has been in place in the medical literature since
the 19th century (Bunker 1986) and in the last twenty years has established the
incidence of human anaesthetic mortality to be approximately 0.01 to 0.00167% (Lunn
and Mushin 1982; Buck, Devlin et al. 1988; Tikkanen and Hovi-Viander 1995;
Biboulet, Aubus et al. 2001; Kawashima, Seo et al. 2001). In veterinary medicine the
most recent and comparable work has been undertaken in equine anaesthesia where the
death risk is nearer 1% (Johnston, Taylor et al. 1995; Johnston, Eastment et al. 2002).
Small animal anaesthesia has evaluated perioperative problems, but the most
comparable work is now ten to twenty years out of date (Clarke and Hall 1990; Dyson,
Maxie et al. 1998). This work suggests a practice based mortality risk of nearer 0.1 %,
which though better than equine anaesthesia mortality risks, leaves room for
improvement. With the advent of new drugs and techniques, and improved monitoring,
the need for re-evaluation of perioperative complications in small animal anaesthesia is
great.
Variations in methodology in the medical and veterinary literature restrict the ease of
comparison between studies within and across species. Observational studies are well
suited to the study of perioperative complications; they avoid the potential ethical
problems of intervention studies that may expose a study group to a potential harmful
factor and often they allow the establishment of complication rates and identification of
risk factors (Thrusfield 1986; Hennekens and Buring 1987; Kirkwood 1988). However
they can generally only suggest underlying causes and not conclusively prove causation.
Hence they are often the first major step in establishing underlying causes, but to

15
comprehensively establish causation intervention studies must follow (Thrusfield 1986;
Hennekens and Buring 1987).
Of the possible observational study methods, some work in both the medical and
veterinary literature has taken the form of case studies and series (Phillips, Frazier et al.
1960; Langley 1976; Gillick 1981; Holland 1987; Gannon 1991; Beydon, Conreux et al.
2001). These descriptive reports suggested contributory factors but to evaluate
underlying causes critically, analytical studies are required. Cohort and case control
studies allow the evaluation of risk factors. Cohort studies are appropriate to investigate
problems with multiple outcomes and rare exposures and hence are suited to morbid
studies with multiple complications (Thrusfield 1986; Hennekens and Buring 1987).
Mortality, however, is a rare occurrence and under such circumstances cohort studies
can be inefficient and expensive. In contrast, case-control studies are well suited to rare
diseases, such as anaesthetic mortality, to multiple exposures and are generally cost
efficient (Schlesselman 1982). Drawing cases and controls from a predefined cohort
followed over time, i.e. a nested case-control study, can provide many of the advantages
of the cohort study, with the efficiency of the case-control method, allowing risks to be
documented and multiple exposures and risk factors to be assessed. This methodology
has not been documented in the anaesthetic literature. The majority of work in
anaesthesia has focused on cohort studies and in small animal anaesthesia, reports have
generally been limited by their sample sizes and the small number of fatalities recorded
(Dyson, Maxie et al. 1998; Hosgood and Scholl 1998; Gaynor, Dunlop et al. 1999;
Hosgood and Scholl 2002). With anaesthetic mortality being rare, the use of a case-
control study would be an efficient method for evaluating risk factors and the nested
case-control method would additionally allow estimation of the risk of mortality.
1.2 Perioperative complication risks
Documented perioperative complication rates and risks are valuable as they indicate the
likely current extent of the problem and because they provide a benchmark from which
to compare subsequent work. Rates represent the number of incident cases and hence
relate to a given time period. More often deaths are reported in the context of the
number of anaesthetics undertaken during a specified study period, not in relation to
each patient’s period of time at risk, and as such the figures reported in the literature
represent mortality risks. Current anaesthetic complication risks in the medical

16
literature, though significantly lower than those seen in veterinary medicine, are still of
interest because they provide a comparative standard (Tikkanen and Hovi-Viander
1995; Eagle and Davis 1997; Suan, Perez-Torres et al. 1997; Biboulet, Aubus et al.
2001; Kawashima, Seo et al. 2001). Large animal complication risks in contrast are
higher than those seen in small animal anaesthesia (Young and Taylor 1990; Young and
Taylor 1993; Johnston, Taylor et al. 1995; Mee, Cripps et al. 1998; Eastment, Johnston
et al. 2002; Johnston, Eastment et al. 2002). They do not provide a gold standard, but do
represent patients being anaesthetised under more similar conditions to those seen in
small animal anaesthesia, and hence are also a relevant comparison.
1.2.1 Morbidity versus mortality
Morbid and mortal complications have been evaluated in the medical and veterinary
literature. The study of morbidity has the advantage that is likely to be more sensitive at
identifying a wider range of complications and provides a broader perspective of
perioperative complications. In contrast, mortal complications may only represent the
tip of the iceberg and as such provides a more superficial overview.
By their nature nonfatal complications are more common and hence more efficient at
generating cases. Small animal anaesthetic morbidity risks range from 2 to 10% (Dyson,
Maxie et al. 1998; Hosgood and Scholl 1998; Gaynor, Dunlop et al. 1999; Hosgood and
Scholl 2002), and thus less anaesthetic events are required to generate sufficient
statistical power in a study. However the definition of a morbid anaesthetic outcome is
prone to problems of misclassification. Previous work in large and small animal
anaesthesia has acknowledged the difficulty of insuring consistent recording of morbid
events in the practice setting (Clarke and Hall 1990; Johnston, Taylor et al. 1995;
Johnston, Eastment et al. 2002). Small animal practice standards of monitoring of
anaesthesia are often superficial (Joubert 2000; Wagner and Hellyer 2000; Nicholson
and Watson 2001) and unless a given complication results in obvious patient
disturbance it may go unnoticed. Additionally when applied to a multi-centre study the
potential for inconsistent classification of a number of morbid outcomes is more likely.
Mortal complications, in contrast, are more clearly identified and classification of a
single outcome increases consistency.

17
Evaluating multiple outcomes (e.g. multiple morbid complications) reduces the
appropriateness of the case-control study (Schlesselman 1982; Hennekens and Buring
1987). Within the context of small animal anaesthetic morbidity, the application of a
cohort study is appropriate (i.e. not a rare outcome), but when mortality is also to be
considered (a rare outcome) a cohort study becomes an inefficient method
(Schlesselman 1982; Hennekens and Buring 1987). Hence the simultaneous evaluation
of both morbidity and mortality within the practice setting can prove a difficult task.
Previous small animal studies that have evaluated both morbidity and mortality have
often failed to evaluate both successfully: studies in which morbidity have been
thoroughly considered have had insufficient statistical power to fully investigate
mortality (Dyson, Maxie et al. 1998; Hosgood and Scholl 1998; Gaynor, Dunlop et al.
1999; Hosgood and Scholl 2002), whilst studies evaluating mortality have had limited
value investigating morbidity (Clarke and Hall 1990). Given the difficulties of reliably
recording morbid events (Joubert 2000; Wagner and Hellyer 2000; Nicholson and
Watson 2001) and problems of simultaneously evaluating both morbidity and mortality
within the practice setting (Clarke and Hall 1990; Dyson, Maxie et al. 1998; Hosgood
and Scholl 1998; Gaynor, Dunlop et al. 1999; Hosgood and Scholl 2002), only mortality
is considered in this study.
1.2.2 Considerations for comparing mortality risks
Mortality risks can vary significantly in the literature and to make an appropriate
comparison between figures a number of factors must be considered. The population at
risk may vary from primarily healthy patients (e.g. first opinion veterinary neutering
clinics, human dental anaesthesia patients) to populations with a significant proportion
of systemically ill patients (e.g. referral centres, teaching hospitals). Inevitably these
differing groups of patients will have different risks of mortality. Additionally the
complexity of the operations performed may vary between the populations. These clinic
characteristics are likely to be reflected in mortality risks and in veterinary medicine,
referral based studies will tend to higher risks than those of first opinion practices.
Further, multi-centre studies will tend to reflect a broader, more heterogeneous
population of patients and procedures than single centre studies and will produce
mortality risks representative of a wider spectrum of anaesthetised patients. Single
centre studies often were undertaken for longer periods to record larger samples and

18
may be prone to changes in anaesthetic practice with time.
The case definition of anaesthetic mortality varies between studies, but in general can be
divided into risks where anaesthesia was the sole or primary cause of death and those
where anaesthesia contributed to a multi-factorial death. The length of follow-up will
also affect mortality risks. Shorter periods of follow up e.g. until regaining
consciousness, are less prone to losses of follow-up but may exclude a significant group
of postoperative deaths. In contrast prolonged periods of study (e.g. 30 days) may
include a group of deaths without association to anaesthesia and increase the number of
losses to follow-up where outcome is not recorded. Finally, the method of study may
affect the accuracy of mortality risks, particularly if routinely kept records poorly
document complications. If a retrospective method is adopted that relies on individuals’
recall of events over 1-2 years, there could be a tendency to under reporting of deaths.
This is likely to be a particular problem in veterinary practice based studies, where
records are often incomplete or difficult to extract from management computer systems.
In the small animal context, retrospective practice based studies in which records may
be limited and information is based largely on the memory of a practitioner of an
undefined outcome (‘anaesthetic death’) over an extended period of time (1-2 years),
there could be a tendency to underestimate death risks (Dodman 1977; Dodman and
Lamb 1992; Joubert 2000).
1.2.3 Human literature
In human anaesthesia, retrospective and prospective cohort studies have been
undertaken for over fifty years and mortality risks have gradually decreased with time.
Prospective studies are likely to record more accurate anaesthetic death risks, but where
record keeping is good retrospective studies can be comparable. Of primary interest are
hospital-based studies in the developed world as they generally reflect a high standard
of anaesthesia care and provide a gold standard to aim for. Multi-centre studies reflect a
more heterogeneous population, generally have larger sample sizes than single centre
studies and should produce more representative mortality risks of anaesthetised patients
in general than single –centre studies.
Singe-centre studies have been reported, though often reflect a more specific population
and are limited by small numbers of patients (and deaths) and long study periods that

19
might reflect changing practices of anaesthesia. A single centre cohort undertaken at a
UK teaching hospital published crude mortality risks of 2.9% in the early sixties,
decreasing to 2.2% in the seventies (Farrow, Fowkes et al. 1982; Lunn, Farrow et al.
1982). They estimated a risk of 1 in 0.54% for patients given a good clinical assessment
(approximately ASA 1-2, see Appendix 1.1). However anaesthetic and surgical causes
were not distinguished, making a sensible comparison with other studies difficult.
A single-centre teaching hospital retrospective cohort study undertaken in Australia
between 1963 and 1972 suggested a lower crude mortality risk of 0.2% within 24 hours
of anaesthesia, decreasing to 0.059% for anaesthetic related mortality and 0.007%
where anaesthesia was the sole cause of death (Bodlander 1975). Harrison, at a single-
centre in South African reported death risks where anaesthesia was a significant
contributory factor of 0.033% between 1956 to 1966, and 0.022% between 1967 and
1976 (Harrison 1968; Harrison 1978). Similarly, Pitt-Miller published a single-centre
study of anaesthetic complications occurring over a 20 year period between 1976 and
1987 (1989). Mortality risks of 0.066% and 0.015% were reported in this study for
anaesthetic-related death risks and death risks solely as a result of anaesthesia,
respectively. A further single centre retrospective study undertaken in Vancouver
between 1973 and 1977, suggested a similar risk of death (Turnbull, Fancourt-Smith et
al. 1980). Pederson and colleagues (1990; 1994), reported an anaesthetic-related rate of
0.04% at a single centre in Sweden between 1986 and 1987. Whilst within 48 hours of
anaesthesia, 0.019% patients died of a ‘possibly preventable’ death (Turnbull, Fancourt-
Smith et al. 1980). A subsequent single-centre study reported similar anaesthetic-related
death risks in South Africa between 1986 and 1987 (Coetzee and du Toit 1992). One in
2,941 (0.034%) died where anaesthesia contributed, decreasing to 0.011% of patients
where anaesthesia was directly responsible (Coetzee and du Toit 1992). In contrast a 12-
year study from a single hospital in the West Indies reported a comparable anaesthetic
related death risk of 0.051% but a much reduced risk where anaesthesia was the sole
cause of 0.002% (Pitt-Miller 1989). In Zambia, a prospective teaching hospital study
was conducted in 1987 and an ‘avoidable’ anaesthetic death risk of 0.094%, was
described (Heywood, Wilson et al. 1989). This is higher than most studies of the time
and may reflect differing hospital conditions, with less monitoring and equipment and
lower anaesthetist input into individual cases.

20
Subsequent single centre studies generally reflected lower mortality risks. At the
University Hospital in Kuala Lumpur, between 1980 and 1992, a death risk primarily
due to anaesthesia of 0.004% was documented (Tan and Delilkan 1993). Work in the
late eighties in China also gave a lower death rate at a single hospital, where anaesthesia
contributed, of 0.003% within 7 days of anaesthesia (Wu, Lai et al. 1991). A 30-year
study in Japan, at a single hospital between 1962 and 1992, reported a still lower
anaesthetic death risk of 0.001% (Kubota, Toyoda et al. 1994). Work at a single centre
in France, between 1989 and 1995, published an anaesthetic-related mortality risk of
0.006% within 12 hours of anaesthesia (Biboulet, Aubus et al. 2001). A similar
anaesthetic-related mortality risk of 0.007%, was reported in a nested case-control
undertaken in a single teaching hospital in the USA between 1989 and 1999 (Newland,
Ellis et al. 2002). In contrast a higher death risk of 0.015% within 24 hours of
anaesthesia was reported at a Spanish hospital during 1994, where death was ‘possibly
associated with anaesthesia’ (Suan, Perez-Torres et al. 1997). This higher risk is likely
to partly reflect the more inclusive definition of anaesthetic risk. Though many of these
studies were affected by factors such as their single-centre nature and limited caseload,
the retrospective study method, the long study period or the crude estimation of the
denominator anaesthetic numbers, generally they suggested similar orders of risk for
anaesthetic related mortality and a pattern of reducing risk with time.
Multi-centre studies have reflected more varied populations at risk, though have
generally confirmed similar risks that decreased with time. One of the first major multi-
centre hospital based studies prospectively evaluated mortality within 10 teaching
hospitals in the USA between 1948 and 1952 and documented an overall death risk of
1.33% (Beecher and Todd 1954). When the cause of death was considered, death risks
of 0.064% where anaesthesia was a primary contributory cause and 0.037% where
anaesthesia was directly responsible were reported. Holland reviewed anaesthetic deaths
over 3 decades in New South Wales and reported decreasing numbers of deaths
attributable primarily or in part to anaesthesia over the time periods (1987). Three
hundred and thirty-five deaths were recorded between 1960-69, reducing to 239
between 1970 - 80 and finally to 50 deaths between 1983-85 (Holland 1987). They did
not however provide denominator data and only crudely estimated the number of
anaesthetics undertaken, suggesting approximate anaesthetic related mortality risks of
0.018% in 1960, 0.010% in 1970 and 0.004% in 1984. A multi-centre retrospective

21
cohort conducted during 1975 in Finland found a crude mortality risk within 3 days of
anaesthesia of 0.180%, and an anaesthesia related mortality risk (death primarily due to
anaesthesia) of 0.02% (Hovi-Viander 1980). In a follow-up study in Finland in 1986, an
anaesthetic-related risk of 0.006% and a mortality risk, where anaesthesia was the main
cause of death, of 0.005% were reported (Tikkanen and Hovi-Viander 1995). At a
similar time (between 1978 and 1982), a national prospective multi-centre study in
France published mortality risks due to cardiac arrest, within 24 hours of anaesthesia, of
0.026% where anaesthesia contributed to the death and 0.008% where the death was
totally related to anaesthesia (Pottecher, Tiret et al. 1984; Tiret, Desmonts et al. 1986).
The National Confidential Enquiry into Perioperative Deaths (National CEPOD)
undertook a large scale multi-centre evaluation of perioperative complications in the
UK (Lunn and Mushin 1982). An anaesthetic death risk of approximately 0.01% was
identified (Lunn and Mushin 1982), where anaesthesia was the sole cause of death.
Where anaesthesia contributed to the death, the mortality risk was 0.059%. The follow-
up study of National CEPOD in the mid-eighties indicated an anaesthetic-related death
risk of 0.084% and 0.0006% where anaesthesia was solely responsible for the death
(Buck, Devlin et al. 1988). Similarly a multi-centre study in New South Wales found a
mortality rate in which ‘factors under the control of the anaesthetist’ contributed to the
death in 0.010% in the 1970’s, reducing to 0.005% in the nineteen eighties (Warden,
Borton et al. 1994; Warden and Horan 1996). Whilst a multi-centred randomised
clinical trial of 17,000 patients in the late eighties in the USA reported 0.041% of
patients died were anaesthesia ‘possibly played a role’ (Forrest, Cahalan et al. 1990). A
study undertaken at Zimbabwean teaching hospitals in 1992 indicated an avoidable
anaesthetic mortality rate of 0.033% (McKenzie 1996). This is higher than most of the
reported developed world studies of the nineties and again is likely to reflect lower
standards of facilities and expertise in the developing world.
Subsequently, a risk of 0.003%, where anaesthesia played a significant role, was
reported in a multi-centre study in Western Australia between 1990 and 1995 (Eagle
and Davis 1997). In a further multi-centre retrospective cohort conducted in the late
nineties in Japan, a death risk ‘totally attributable to anaesthesia’ was published as
0.001% and a cardiac arrest risk ‘attributable to anaesthesia’ was 0.008% (Kawashima,
Seo et al. 2001). In general these multi-centre studies are more likely to reflect the

22
risks of anaesthesia across a spectrum of patients and procedures and give a good
indication of the risk of anaesthesia for a broad spectrum of patients
Dental anaesthetic studies have generally reported much lower risks of death. These
risks have generally reflected the reduced risk of the patients undergoing anaesthesia
and the method of collecting information on deaths, more than the standard of
anaesthesia. Though arguably more similar to standards of equipment, personnel and
monitoring of veterinary patients, the generally low-risk health status of the human
dental population renders this a less useful comparison and standard to aim for. Lytle
and Stamper (1989) reported an anaesthetic death risk of 0.0001% between 1983 and
1987 for Southern California oral and maxillo-facial surgery. This was based on a postal
questionnaire relying on the recall of surgeons of complications over the previous 5
years and is likely to be an underestimate at best. Other studies have reported no deaths
during their study periods (D'Eramo 1999; Matsuura, Hirose et al. 2000).
Approximately 1,500,000 patients undergoing oral or maxillo-facial surgery in one of
these studies reported no anaesthetic deaths, though again this was based on data from a
questionnaire sent out to surgeons and is likely to underestimate the extent of
complications (D'Eramo 1999). In the other study, a prospective hospital based survey,
no deaths were described and this is more likely to reflect the low risk status of the
patients anaesthetised and the small study size than the absolute standards of
anaesthesia (13,959 anaesthetics between 1971 and 2000)(Matsuura, Hirose et al. 2000).
On the basis of both retrospective and prospective cohort studies, the anaesthetic
mortality risk in man over the last decade, occurring primarily as a result of anaesthesia,
was of the order of 0.050% to 0.001%, and where anaesthesia played a contributory role
but was not the sole cause, was approximately 0.02% to 0.005% (Tikkanen and Hovi-
Viander 1995; Eagle and Davis 1997; Suan, Perez-Torres et al. 1997; Biboulet, Aubus
et al. 2001; Kawashima, Seo et al. 2001). The distinction between death amongst
healthy and sick patients has generally not been made, the nature of the operations
performed has varied markedly and the nature of the populations studied has differed
greatly between studies, but the overall level of complications is consistent across
studies and gives a valuable estimate of the frequency of anaesthetic deaths from which
to compare to veterinary studies.

23
1.2.4 Large animal work
Work in large animals has concentrated on equine anaesthesia complications. Studies
have focused principally on referral institution populations and death risks most
frequently divided into elective and emergency populations, with the latter principally
representing acute abdominal or ‘colic’ surgery. Mitchell (1970) conducted a
retrospective study at the Royal (Dick) Vet School over a seven-year period, 1962 to
1968. Four hundred and seventy three horses were anaesthetised and seven deaths
occurred (death risk of 1.47%). Short at the University of Missouri, reported a smaller
retrospective study of 125 horses anaesthetised with no deaths (Lumb and Jones 1973).
Heath reported an overall single-clinic perioperative equine mortality risk, between
1968 and 1970, at Colorado State University of 4.35% (13 deaths out of 295
anaesthetics) (Lumb and Jones 1973). The anaesthetic death risk decreased to 1.69%
when only anaesthetic related deaths were considered. In a follow up study at Colorado
State University a reduced overall death risk of 1.18% was published (Lumb and Jones
1984). Many of these fatalities were due to horses undergoing emergency
gastrointestinal surgery and were high-risk patients. The length of follow up was not
reported in these studies so the cut off for anaesthetic related death was unclear. All of
these studies were limited by their small sample size, and can only reflect crude
estimates of death risks. Additionally they may represent very different populations at
risk given individual centres may treat very different populations of horses.
Tevick (1983) retrospectively identified a single-clinic equine perioperative mortality
risk of 2.70% over a 17-year period, reducing to 0.8% due to ‘anaesthesia alone’. The
majority of these deaths were within 24 hours of anaesthesia though 10 occurred after
24 hours (a period of follow-up specified as ‘until the animal left the clinic’).
Gastrointestinal surgery represented the major operation type in those that died and the
majority of these were deemed high-risk cases. This study may have generated a larger
cohort of deaths but again can only reflect the risk of a population similar to that
studied. The long period of study, though helpful for producing a larger number of
anaesthetics limited the value of the reported death risk. Changes in anaesthetic practice
over this extended time period could have resulted in marked changes in death risks
over the study period.

24
Further single centre reports have concentrated on vary different populations.
Evaluating horses specifically undergoing colic surgery, Trim and colleagues (1988)
conducted a single-clinic retrospective survey and found a perioperative death risk of
12.5% within 3 days of anaesthesia and 20% within 16 days. In contrast, a retrospective
study by Young and Taylor excluded gastrointestinal surgery and reported a lower
single clinic death risk over a seven-year period of 0.68% (1990; 1993). The follow-up
period was not specified. More recently, Liverpool Veterinary School reported mortality
risks for both elective and emergency procedures in a retrospective single clinic study
(Mee, Cripps et al. 1998; Mee, Cripps et al. 1998). Of 2,276 anaesthetics, 1,279 were
elective and 995 were emergency procedures. Horses were followed until discharged,
for a maximum of three weeks. Of the elective anaesthetics 8 died where anaesthesia
and surgery contributed to the death (0.63%) and 1 (0.078%) died solely due to
anaesthesia (Mee, Cripps et al. 1998). For emergency procedures 1 in 3 died or were
euthanased, with acute abdominal surgery being at increased risk (Mee, Cripps et al.
1998). For non-colic emergencies the surgical / anaesthetic death risk was 2% and for
colic surgeries it was 4.35%, giving an overall emergency surgical / anaesthetic death
risk of 3.85%. The overall surgical / anaesthetic death risk for elective and emergency
procedures was 2%. Again the major limitation of these studies was the single centre
nature of them. They represented very specific populations at risk and the mortality
risks were relevant only to similar populations. Further all of the described studies were
retrospective and were vulnerable to bias due to losses to follow up and may represent
inaccurate estimates.
The first prospective multi-centre perioperative cohort study of equine anaesthesia, the
Confidential Enquiry into Perioperative Equine Fatalities (CEPEF), was undertaken in
the UK between 1991 and 1997 (Johnston, Taylor et al. 1995; Johnston, Eastment et al.
2002). Of a total of 41,824 horses anaesthetised, 39,025 were alive and 785 were dead
at 7 days postoperatively giving death risks of 1.89% (Johnston, Eastment et al. 2002).
When emergency abdominal surgery and delivery of foals were excluded, the death risk
decreased to 0.90% (Johnston, Eastment et al. 2002). This was followed by CEPEF 3, a
randomised controlled trial of 8,242 horses comparing isoflurane with halothane
anaesthesia (Eastment, Johnston et al. 2002). Though representing inhalation
anaesthesia only, they reported similar risks. An overall death risk of 1.61% horses and
when colic and other emergency surgery were excluded a risk of approximately 0.9%

25
were described. In both of these studies perioperative death was defined as unexpectant
death or euthanasia for perioperative complications within 7 days of anaesthesia. No
attempt was made to distinguish death caused solely by anaesthesia and death occurring
partly as a result of anaesthesia, and the long period of follow up potentially increased
the risk of losses to follow up. Patient health status (ASA Grade) was not classified and
separate death risks for sick and healthy patients were not given, though the majority of
the non-colic patients were healthy. Despite these limitations the death risk for these
studies covered a wide range of clinic and equine procedure types, is currently the most
representative equine study and remains the benchmark from which to compare other
equine studies to.
In summary, the overall anaesthetic death risks was 2.0%, decreasing amongst non-
emergency horses to approximately 1.0% (Young and Taylor 1990; Young and Taylor
1993; Johnston, Taylor et al. 1995; Mee, Cripps et al. 1998; Eastment, Johnston et al.
2002; Johnston, Eastment et al. 2002). Where anaesthesia was considered the sole cause
of death, a risk of 0.1% was estimated (Mee, Cripps et al. 1998). Emergency
anaesthetics had a death risk of nearer 1 in 10 to 30 (Trim, Adams et al. 1988; Johnston,
Taylor et al. 1995; Mee, Cripps et al. 1998; Johnston, Eastment et al. 2002). These
figures are much higher than those seen in human anaesthesia and reflect species
differences as well as standards of anaesthesia.
1.2.5 Small animal work
In small animal anaesthesia, mortality risks are most comparable when the institution
type and patient health statuses are considered. Referral and university-based studies
generally had higher death risks due to the nature of their patients and procedures,
whilst practice-based studies tend to have healthier populations, simpler procedures and
lower death risks. Initial work focused on single-centre referral centre death risks
(Albrecht and Blakely 1951; Lumb and Jones 1973). Work undertaken between 1946
and 1950, at the Angell Memorial Animal Hospital in Boston published an anaesthetic
death risk of 0.26% in dogs, and 0.36% in cats (Albrecht and Blakely 1951). Five
percent of miscellaneous species (rabbits, monkeys, etc) died perioperatively.
Anaesthetic death was defined as any death occurring from the time of induction of
anaesthesia until the patient returned to consciousness or his preoperative condition.
The Wheatridge Animal Hospital in Colorado reported anaesthetic complications

26
occurring between 1960 and 1969 (Lumb and Jones 1973). Perioperative anaesthetic
death risks of 0.23% in dogs (10 deaths) and 0.40% in cats (7 deaths) occurred.
Anaesthetic death was defined as death interrupting recovery from anaesthesia and
resulting from either sole consequence of anaesthesia, death resulting from airway
obstruction while anaesthetised, or resulting from tissue damage due to inadequate
oxygenation during cardiac arrest and subsequent resuscitation. The University of
Missouri Veterinary Hospital reported higher mortality risks of 0.8% in dogs and 0.53%
in cats between 1968 and 1969, (Lumb and Jones 1973). It is clear from these single
centre studies that the definition of anaesthetic-related death varied significantly and the
relevant death risks reflected very different inclusion criteria. It was less clear if the
populations anaesthetised were comparable for other characteristics, such as health
status, age and procedure types, and again because these were single centre studies the
numbers of death reported were small in all of the studies. Hence these early studies
could only give a very approximate assessment of death risks.
Colorado State University undertook a prospective cohort study of anaesthetics between
1955 and 1957 (Lumb and Jones 1973). They reported high anaesthetic death risks, of
approximately 1.08% in dogs and 1.79% in cats. Anaesthetic death was defined, as ‘any
death occurring from the time of induction until the righting reflex returned, regardless
of cause’. The high risks were attributed to students anaesthetising the majority of the
cases under veterinarian supervision, the complex nature of procedures and the poor
patient health status of their referral population. When healthy dogs and cats were
considered (ASA 1 to 2, Appendix 1) these risks decreased to 0.65% dogs and 1.08% in
cats, whilst ill dogs and cats (ASA 3 to 4) had higher death risks (5% in dogs, 10% in
cats). A follow-up to this study at Colorado State University was undertaken between
1979 and 1981 (Lumb and Jones 1984). They reported improved death risks of 0.43% in
dogs and 0.26% in cats of which 50% were ASA grade 1 to 2. They suggested these
improvements were related to the use of safer drugs and techniques and better
supervision of students undertaking anaesthesia. Subsequent to this study, they
undertook a study between 1993 and 1994 (Gaynor, Dunlop et al. 1999). During this
one-year period, 11 dogs (0.43%) and 3 cats (0.35%) died. Deaths included fatalities
that occurred within 24 hours of anaesthesia. The health status of these fatalities was not
stated.

27
Louisiana State University also undertook a prospective cohort study of dogs and cats at
their institution between 1995 and 1996 (Hosgood and Scholl 1998; Hosgood and
Scholl 2002). All dogs and cats over 6 months of age, undergoing inhalation anaesthesia
for at least 30 minutes were evaluated perioperatively for up to 24 hours
postoperatively. Nine hundred and forty two dogs and 138 cats were anaesthetised and
14 dogs and 8 cats died or were postoperatively euthanased within 24-hours, giving
death risks of 1.49% in dogs and 5.80% in cats. These risks would be expected to be
higher given that death was recorded for all patients that died within 24 hours of
anaesthesia independent of cause. However the exclusion of significant strata of
anaesthetised animals, namely very young patients, short inhalation anaesthetics and
those receiving injectable anaesthesia only, would also have affected the reported risks.
Most recently work at the Royal Veterinary College has suggested a referral centre
anaesthetic related mortality risk of 0.58% in dogs (Brodbelt, Hammond et al. 2005).
When healthy dogs (ASA 1-2) were considered the risk was 0.088%, whilst in sick
patients (ASA 3-5) it was 1.37%. This last study emphasises the importance of reporting
risks with health status, as this facilitates a broader comparison. Both these studies again
reflect the limitations of single studies with small numbers of death reported and both
were retrospective making them particularly susceptible to errors due to losses to follow
up.
An early multi-centre cohort of practice anaesthesia evaluated feline mortality
retrospectively in Scotland (Dodman 1977). A death risk of 0.312% in cats was
reported, based on practitioners’ recall of the number of cats that died ‘as a result of
anaesthesia in the last year’. This was followed by a further multi-centre retrospective
cohort study of small animal anaesthetic practice, undertaken in 1989 in Vermont
(Dodman and Lamb 1992). Questionnaires were sent out to 88 practitioners, 41 were
returned and 39 were analysed. The average number of dogs and cats that the
practitioners stated they anaesthetised each week were 15 and 16 respectively. The
number they believed had ‘died as a result of anaesthesia in the last two years’ were 33
dogs and 19 cats, producing death risks of 0.054% and 0.029% respectively (NB the
published figures are incorrect as they reported the total deaths over the two-years study
period, divided by the number of anaesthetics undertaken per year). These risks are
significantly lower than previous studies, but rely on practitioners’ recall over a long
time period and given the unclear case definition that may only refer to deaths
28
primarily due to anaesthesia and were likely to be an underestimate. The health statuses
of the patients anaesthetised were not stated, though are likely to be ‘healthier’ than
those reported in the referral studies, and this may reflect a component of the reported
risks.
A similar retrospective study was undertaken in Finland in 1993 (Rintasalo and Vainio
1995). A questionnaire was sent to all Finnish practices and 114 centres responded.
Based on the recall of practices of anaesthetic deaths (not defined) over the last 24
months, they reported a death risk of 0.126% in small animals. The most recent
retrospective study evaluated complications in a South African practice population in
1999 (Joubert 2000). Six hundred questionnaires were sent out and 162 returned of
which 161 were analysed. An estimated mortality risk of 0.081% in dogs and cats was
recorded, though the definition of perioperative death was not stated. All these studies
highlight the limitations of retrospective studies based on information derived from a
single questionnaire sent out to practices. The interpretation of what constituted an
anaesthetic death may have varied greatly between practices as the guidelines given
were not always clear and the estimation of anaesthetics undertaken and deaths
occurring was likely to be inaccurate.
The first prospective multi-centre cohort study of small animal practice complications
was undertaken between 1984 and 1986 in the UK (Clarke and Hall 1990). Fifty-three
practices were recruited, 41,881 anaesthetic events were recorded and anaesthetic death
risks of 0.230% in dogs and 0.294% in cats were reported (48 and 59 deaths
respectively). For healthy patients (ASA 1-2), the death risks were 0.115% in dogs and
0.181% in cats, whilst in ill patients (ASA 3-5), 3.13% in dogs and 3.33% in cats died
perioperatively. Perioperative deaths in healthy patients (ASA 1-2), occurring during or
shortly after surgery were considered ‘primarily due to anaesthesia’ unless an obvious
surgical cause was present, whilst in sick patients all deaths were reported and no
attempt was made to separate anaesthetic from other causes.
This was followed by a further prospective multi-centre cohort study of anaesthetic
complications in practice in Ontario, Canada (Dyson, Maxie et al. 1998). For 6 months,
76 practices kept anaesthetic diaries of all small animal anaesthetics. Eight thousand
and eighty-seven dogs and 8,702 cats were anaesthetised, with 9 and 8 perioperative
deaths where anaesthesia contributed, recorded respectively. Overall perioperative

29
death risks were 0.111% in dogs and 0.092% in cats, and for healthy dogs and cats
(ASA 1-2) they were 0.067% in dogs and 0.048% in cats. Anaesthetic related death was
considered as perioperative death resulting from cardiac arrest with unsuccessful
resuscitation, though the follow-up period was not specified. The number of
anaesthetics and deaths recorded was relatively small, suggesting the figures could only
reflect a crude approximation.
In summary, the current overall anaesthetic-related death risks in small animal practice
would appear to be of the order of 0.1 – 0.2%, whilst in healthy dogs and cats the risk
decreased to 0.067% to 0.050% in healthy dogs and cats and in sick patients it increased
to 2 to 0.5% (Clarke and Hall 1990; Dodman and Lamb 1992; Dyson, Maxie et al.
1998; Joubert 2000). Current mortality risks solely due to anaesthesia were not
available. In referral institutions the mortality risks were nearer 0.5% in dogs and cats,
but when health status is taken into account these figures were similar to practice reports
(Hosgood and Scholl 1998; Gaynor, Dunlop et al. 1999; Hosgood and Scholl 2002;
Brodbelt, Hammond et al. 2005). Most studies were limited by their small sample sizes
and the most comprehensive study undertaken to date is now nearly 20 years old
(Clarke and Hall 1990). The risk of complications is lower than that seen in large
animal anaesthesia, though it leaves significant room for improvement compared to
human anaesthesia. The reason for these large differences is not immediately apparent
but again may relate to species differences as well as variations in methodology and
standards of anaesthesia.
1.3 Causes of perioperative death
Establishing mortality risks is invaluable for documenting current risks related to
anaesthesia, allowing crude comparisons in standards of anaesthesia, and encouraging
clinical improvement, i.e. the process of clinical audit. The investigation into the causes
of these deaths allows a more complete evaluation of perioperative mortality, and when
risk factors are identified, the knowledge of the major causes of death aids the
understanding of potential underlying mechanisms related to these risk factors.
Perioperative death may result from pre-existing disease, anaesthetic, surgical and
procedural causes or a combination of all of these. Of particular relevance to a study of
anaesthetic deaths are causes of death where anaesthesia contributed, but these deaths
often involve procedural factors and pre-existing disease. The underlying

30
physiological cause may also be multi-factorial, involving the failure of a number of
body systems, and when classifying a specific cause the primary precipitating aetiology
is generally chosen. Cardiovascular and respiratory complications represent the major
causes of perioperative deaths in the comparative and small animal literature, though
gastrointestinal, neurological and hepato-renal causes have been reported. The role of
human error is also relevant to causes of death, for though documentation of the primary
precipitating physiological insult may direct methods to reduce fatalities in the future,
documentation of the role of management errors could identify potentially important
correctable problems. Reported causes of mortality were similar across the species,
though the relative frequency of particular causes may be species-specific.
1.3.1 Cardiovascular causes
Cardiovascular causes form a major proportion of perioperative deaths and include
cardiac pump failure and vascular collapse, resulting in failure of delivery of blood to
the vital tissues. Cardiac arrest has been reported to result from cardiac arrhythmias
associated with increased circulating catecholamines, myocardial hypoxia, specific
anaesthetic agents, pre-existing pathology, specific procedures (e.g. vagal traction and
enucleation) and with myocardial depression due to relative anaesthetic overdose (Hall
and Clarke 1991; Hall and Taylor 1994). Hypovolaemia and circulatory failure are the
other major cause of cardiovascular collapse and often are seen in patients with pre-
existing pathology that are insufficiently stabilised prior to anaesthesia.
In human anaesthesia, cardiac arrest due to arrhythmias, myocardial depression and
circulatory failure and hypovolaemia have been frequently recorded causes of death
occurring in 15 to 50 % of all fatalities (Harrison 1968; Bodlander 1975; Harrison 1978;
Hovi-Viander 1980; Turnbull, Fancourt-Smith et al. 1980; Tiret, Desmonts et al. 1986;
Pitt-Miller 1989; Forrest, Cahalan et al. 1990; Harrison 1990; Pedersen, Eliasen et al.
1990; Wu, Lai et al. 1991; McKenzie 1996; Warden and Horan 1996; Fichtner and Dick
1997; Biboulet, Aubus et al. 2001; Kawashima, Seo et al. 2001).
In equine anaesthesia, cardiac arrest and cardiovascular collapse are a major cause of
death, resulting in 20 to 50% of all reported deaths (Tevik 1983; Young and Taylor
1990; Young and Taylor 1993; Johnston, Taylor et al. 1995; Mee, Cripps et al. 1998;
Mee, Cripps et al. 1998; Johnston, Eastment et al. 2002). In small animal anaesthesia

31
cardiovascular causes also represent a major, if not more common cause. Previous
studies suggest between 30 and 70% of deaths resulted from relative anaesthetic
overdose and myocardial depression, cardiac arrhythmias or circulatory failure and
hypovolaemia (Lumb and Jones 1984; Clarke and Hall 1990; Dyson, Maxie et al. 1998;
Hosgood and Scholl 1998; Joubert 2000). Halothane, ether and thiobarbiturate
anaesthesia were frequently associated with anaesthetic overdose (Clarke and Hall
1990; Dodman and Lamb 1992). Dogs more frequently had cardiovascular
complications than cats in one study (Clarke and Hall 1990). High-risk patients were the
most likely patients to die from circulatory failure, as they were often hypovolaemic
prior to anaesthesia (Clarke and Hall 1990).
1.3.2 Respiratory causes
Respiratory complications represent the other main cause of anaesthetic-related death.
Problems with airway maintenance and inadequacy of ventilation represent the principal
factors resulting in death. Failed intubation, trauma to the upper airway, inadequate
ventilation and delivery of a hypoxic inspired gas mixture have all been documented.
In human anaesthesia, respiratory complications have represented at least as, if not more
common, a cause of death than cardiovascular causes. Inappropriate airway
management and problems with endotracheal intubation caused 5 to 30% of fatalities
(Bodlander 1975; Buck, Devlin et al. 1988; Caplan, Posner et al. 1990; Harrison 1990;
Gannon 1991; Biboulet, Aubus et al. 2001; Kawashima, Seo et al. 2001). Inadequate
ventilation has been the cause in 15 to 40% of reported deaths (Harrison 1978; Hovi-
Viander 1980; Holland 1987; Caplan, Posner et al. 1990; Harrison 1990; McKenzie
1996; Fichtner and Dick 1997). Additionally the supply of a hypoxic gas mixture, and
development of pneumothorax have been reported (Holland 1987; Gannon 1991).
Hence, overall respiratory causes have represented 20 to 50% of all anaesthetic deaths
(Harrison 1968; Harrison 1978; Hovi-Viander 1980; Turnbull, Fancourt-Smith et al.
1980; Tiret, Desmonts et al. 1986; Holland 1987; Heywood, Wilson et al. 1989; Pitt-
Miller 1989; Caplan, Posner et al. 1990; Forrest, Cahalan et al. 1990; Harrison 1990;
Pedersen, Eliasen et al. 1990; Gannon 1991; McKenzie 1996; Warden and Horan 1996;
Fichtner and Dick 1997; Kawashima, Seo et al. 2001)

32
In contrast, equine anaesthetic fatalities have infrequently been due to respiratory
complications. Though Tevik (1983) did not distinguish respiratory from cardiovascular
causes, which when combined accounted for all 10 anaesthetic deaths described, other
studies have reported less than 25% of all deaths resulted from respiratory compromise
(Young and Taylor 1990; Young and Taylor 1993; Johnston, Taylor et al. 1995; Mee,
Cripps et al. 1998; Mee, Cripps et al. 1998; Johnston, Eastment et al. 2002). Johnston
and colleagues’ (1995; 2002) multi-centre study documented only 4% of deaths resulted
from respiratory problems.
Respiratory complications were an underlying cause of death in 30 - 40% of dogs and
about 40 - 50% of cats (Lumb and Jones 1984; Clarke and Hall 1990; Dyson, Maxie et
al. 1998). Endotracheal intubation problems and respiratory obstruction represented the
majority of feline respiratory causes of death (Clarke and Hall 1990; Dyson, Maxie et
al. 1998). In dogs, complications with endotracheal intubation and respiratory failure
were equally reported, though in brachycephalic dogs respiratory obstruction was the
principal cause of respiratory complications (Clarke and Hall 1990; Dodman and Lamb
1992; Dyson, Maxie et al. 1998).
1.3.3 Miscellaneous causes of death
Other causes of perioperative death include inhalation of gastric contents, sepsis, shock
and multiple organ failure, renal failure, failure to regain consciousness and rarely
anaphylactic reactions to the fluids or anaesthetics administered.
In the medical literature, these causes have been infrequently documented. Up to 20%
of all deaths were attributed to shock, sepsis and multi-organ failure and generally these
deaths were seen in the patients that presented for anaesthesia with systemic illness
(Heywood, Wilson et al. 1989; Pitt-Miller 1989; McKenzie 1996; Fichtner and Dick
1997). Other causes reported in the human literature included anaphylactic reactions to
intravenous colloids and blood transfusions, allergic bronchospasm, pulmonary
embolism, inhalation of gastric contents, renal and hepatic failure and equipment failure
(Harrison 1968; Bodlander 1975; Harrison 1978; Hovi-Viander 1980; Turnbull,
Fancourt-Smith et al. 1980; Tiret, Desmonts et al. 1986; Holland 1987; Heywood,
Wilson et al. 1989; Pitt-Miller 1989; Harrison 1990; Pedersen, Eliasen et al. 1990;
Gannon 1991; Warden, Borton et al. 1994; McKenzie 1996; Warden and Horan

33
1996; Beydon, Conreux et al. 2001). This is in contrast to the causes of death in horses.
Non-cardiopulmonary causes have been reported as the cause of death or euthanasia in
up to 77% of all equine fatalities (Tevik 1983; Young and Taylor 1990; Young and
Taylor 1993; Johnston, Taylor et al. 1995; Mee, Cripps et al. 1998; Mee, Cripps et al.
1998; Eastment, Johnston et al. 2002; Johnston, Eastment et al. 2002). Johnston and
colleagues (1995; 2002) attributed death in 55% of all cases to fractures on recovery,
postoperative myopathy and abdominal complication such as sepsis and colitis. Young
and Taylor (1993) reported deaths due to postoperative myopathy and fractures in 7 of 9
deaths. Rarely have horses been reported ‘found dead’ or dying of unknown cause, with
Johnston and colleagues indicating only 5% being ‘found dead’ (2002).
In small animal anaesthesia, causes other than respiratory and cardiovascular
complications have infrequently been reported, though have included postoperative
renal failure, iliac thrombosis in cats, gastric contents inhalation, anaphylactic reactions,
failure to regain consciousness and of unknown cause (Clarke and Hall 1990; Dodman
and Lamb 1992; Dyson, Maxie et al. 1998; Joubert 2000). The latter cause, often arising
when patients were not being closely watched, represented approximately 5 to 20 % of
patients. Generally these non-pulmonary causes were more similar to those reported in
the human literature, though the failure to regain consciousness and unknown cause
may reflect a difference in the standards of monitoring and critical care medicine rather
than specific species differences.
1.3.4 The role of human error
In the medical literature a major focus has been the identification of the role of the
anaesthetist in fatalities. The report of the Confidential Enquiry into Perioperative
Deaths (Buck, Devlin et al. 1988) documented human errors of insufficient knowledge,
failure to apply this knowledge, lack of care in patient management and inexperience as
major factors in over 75% of anaesthetic-associated deaths. Similarly, other studies have
reported approximately two thirds of anaesthetic-related deaths being due to anaesthetic
management deficiencies (Utting 1987; Caplan, Posner et al. 1990; Gannon 1991). The
majority of these errors resulted from problems with patient airway management and
endotracheal intubation and ventilation (Tiret, Desmonts et al. 1986; Holland 1987;
Buck, Devlin et al. 1988; Caplan, Posner et al. 1990; Harrison 1990; Gannon 1991;
Biboulet, Aubus et al. 2001; Kawashima, Seo et al. 2001). In the veterinary literature

34
infrequently has the human error element of deaths been quantified. In small animals,
Clarke and Hall (1990) documented errors of patient management in over 75% of deaths
in healthy (ASA 1-2) dogs and cats and again the majority related to airway
complications during anaesthesia, though in other studies the role of error has not been
reported. Identifying the human element of anaesthetic-related deaths is relevant to
improving standards as it can target recurrent weaknesses in patient management that
could reduce complications if corrected, in addition to the value of documenting the
major body systems most frequently affected by anaesthesia. Further, identifying human
error may help account for some unexpected associations found, and provide a
reasonable alternative explanation for specific associations linking anaesthetic technique
and outcome.
In summary, the range of causes of death was approximately similar across species and
focused on cardiovascular and respiratory complications. Species-specific differences
were present with human and possibly feline patients more likely to die of respiratory
than cardiovascular causes, dogs of cardiovascular causes and horses rarely of
pulmonary causes (Bodlander 1975; Hovi-Viander 1980; Tevik 1983; Buck, Devlin et
al. 1988; Caplan, Posner et al. 1990; Clarke and Hall 1990; Harrison 1990; Dodman and
Lamb 1992; Young and Taylor 1993; Johnston, Taylor et al. 1995; Fichtner and Dick
1997; Dyson, Maxie et al. 1998; Hosgood and Scholl 1998; Mee, Cripps et al. 1998;
Mee, Cripps et al. 1998; Biboulet, Aubus et al. 2001; Kawashima, Seo et al. 2001;
Johnston, Eastment et al. 2002). The role of human error in these deaths was
documented in many of the medical studies (Tiret, Desmonts et al. 1986; Holland 1987;
Buck, Devlin et al. 1988; Caplan, Posner et al. 1990; Harrison 1990; Gannon 1991;
Biboulet, Aubus et al. 2001; Kawashima, Seo et al. 2001) but only rarely in the
veterinary literature (Clarke and Hall 1990). The combination of an understanding of
the physiological basis of fatalities and the role of human management in these deaths
can form in invaluable platform from which to assess anaesthetic deaths and focus
priorities in the improvement of anaesthetic practice.
1.4 Risk factors for mortality
Identifying risk factors associated with anaesthetic mortality is valuable if changes in
anaesthetic practice and reduction in complications are to occur. Factors reported to be
associated with death in the medical literature are relevant as the underlying

35
mechanisms and deficiencies in clinical practice are likely to be similar to those seen in
veterinary anaesthesia. Risk factors identified in large animal anaesthesia are also
informative both because of the species similarities and because the practice of
anaesthesia in other veterinary species will generally be more comparable to small
animal than human anaesthesia.
1.4.1 Human literature
Early case reports and cohort studies evaluated possible causes of death and suggested
possible contributory factors, but did not investigate risk factors per se (Phillips, Frazier
et al. 1960; Hovi-Viander 1980; Holland 1987; Tinker, Dull et al. 1989; Caplan, Posner
et al. 1990; Gannon 1991; Tikkanen and Hovi-Viander 1995; McKenzie 1996; Eagle
and Davis 1997; Suan, Perez-Torres et al. 1997; Beydon, Conreux et al. 2001).
Subsequent studies have attempted to address risk factors within the framework of
cohort and case-control studies, though many of these studies reported risks for specific
factors without comparing them to a baseline of risk, were unadjusted for other factors
and as such could provide only crude assessments of factors (Beecher and Todd 1954;
Farrow, Fowkes et al. 1982; Lunn and Mushin 1982; Buck, Devlin et al. 1988;
Heywood, Wilson et al. 1989; Campling, Devlin et al. 1990; Campling, Devlin et al.
1992; Campling, Devlin et al. 1993; Warden, Borton et al. 1994; Warden and Horan
1996; Biboulet, Aubus et al. 2001; Iwao, Kawashima et al. 2001; Morita, Kawashima et
al. 2001; Irita, Kawashima et al. 2002). More recently a number of studies have been
able to quantify risk associated with specific factors, reporting odds or risk ratios and
additionally some have adjusted for other risk factors or undertaken more detailed
statistical analysis (Fowkes, Lunn et al. 1982; Farrow, Fowkes et al. 1984; Pottecher,
Tiret et al. 1984; Tiret, Desmonts et al. 1986; Pedersen, Eliasen et al. 1990; Pedersen
1994; Howell, Sear et al. 1998; Howell, Sear et al. 1999; Newland, Ellis et al. 2002).
Few intervention studies have been published and often they were limited by sample
size, however one study was able to study a large population and apply more
comprehensive statistical analysis (Forrest, Rehder et al. 1992).
An early case series suggested increased risk associated with chloroform anaesthesia
(Phillips, Frazier et al. 1960). Holland (1987) in a retrospective study of anaesthetic
deaths over thirty years attributed death to poor preparation, incorrect anaesthetic
selection and dosing, poor monitoring, poor maintenance of oxygenation and

36
ventilation and poor perioperative and crisis management, though they did not quantify
the risk associated with these factors. Work in Finland (Hovi-Viander 1980; Tikkanen
and Hovi-Viander 1995) suggested poor patient preparation, poor patient health status
and old age contributed to anaesthetic death though again they did not assess the
magnitude of these risks. Tinker and colleagues (1989) when analysing 1,175
anaesthetic related closed malpractice claims in the USA, identified the lack of pulse
oximetry and capnometry as major contributory factors. In a further closed claims series
of 522 adverse respiratory events (of which 85% of incidents resulted in death or brain
damage), problems of inadequate ventilation and trouble with intubation were major
factors and poor monitoring was thought likely to contribute to the complication
(Caplan, Posner et al. 1990). A review of 25 anaesthetic deaths reported in the UK
highlighted contributory factors of poor communication, inadequate preoperative
assessment and preparation and times periods when the anaesthetist was not present
(Gannon 1991). A multi-centre Zimbabwean study also identified common
characteristics of anaesthetic deaths, including surgeon and anaesthetist inexperience,
procedure type, patient age, and patient sex, but no denominator data on the frequencies
of these factors in the non-fatalities, were reported and the authors were only able to
speculate on the likelihood of these factors being risk factors for death (McKenzie
1996). Similarly an Australian study (Eagle and Davis 1997) and a Spanish report
(Suan, Perez-Torres et al. 1997) documented similar features of the anaesthetic deaths
but neither had data on non-deaths to identify risk factors with. More recently in France,
an analysis of 1004 serious incidents, including mortality, where equipment failure
contributed to the complication, was undertaken (Beydon, Conreux et al. 2001). Failure
of ventilation, infusion and monitoring equipment constituted the majority of these
failures. None of these studies was able to quantify risk in the context of a given
exposure or outcome, but they did provide a starting point and identified a number of
factors potentially contributing to anaesthetic death, including inadequate monitoring,
poor anaesthetic equipment function, poor preoperative management and poor
communication, surgeon and anaesthetist inexperience, patient old age, and poor health
status.
Subsequent studies reported similar and additional risk factors but also attempted to
quantify the risk of death associated with specific factors. Many of these studies did not
however attempt statistical analysis or adjust for other risk factors or confounders.

37
Beecher and Todd in their prospective study (1954) identified the use of the
neuromuscular blocking agent, curare, as a major risk factor and reported mortality risks
for other factors suggesting increased risk with ether, cyclopropane, nitrous oxide,
thiopentone, and regional anaesthesia. They did not however report relative risks,
undertake statistical analysis or attempt to adjust these factors for other exposure
variables, with the exception of stratifying the risk with curare on health status (Beecher
and Todd 1954). Early prospective work undertaken in the UK also identified increased
risk of death with old age, patient sex, preoperative clinical disease and health status,
surgical type, site and urgency and duration of anaesthesia (Farrow, Fowkes et al. 1982;
Fowkes, Lunn et al. 1982). These studies identified mortality rates for patients with
specific exposures, though only published risk ratios for major coexisting diseases, and
they did not undertake further statistical analysis.
The National Confidential Enquiry into Perioperative Deaths (National CEPOD)
identified a number of risk factors within the setting of a national UK survey (Lunn and
Mushin 1982). Factors identified as contributing to death included poor supervision of
trainee anaesthetists, inadequate monitoring, pre-existing disease, old age, urgency of
operation and poor recovery facilities (Lunn and Mushin 1982; Buck, Devlin et al.
1988). However they did not statistically evaluate the risk of these factors or adjust for
confounders. Later reports of the National CEPOD have effectively been case-control
studies (Campling, Devlin et al. 1990; Campling, Devlin et al. 1992; Campling, Devlin
et al. 1993). They compared twenty percent of all anaesthetic deaths, to ‘index’
anaesthetics drawn from operations undertaken on a specified date or from a specified
list of operations. Matched controls were requested from participating hospitals but
were eventually abandoned as insufficient numbers were received (Campling, Devlin et
al. 1992). There was a tendency to increased risk of death with pre-existing disease and
therapy, and poor monitoring of the anaesthetised patient, whilst reduced risk was seen
when premedication was given (Campling, Devlin et al. 1992; Campling, Devlin et al.
1993). Again they did not calculate odds ratios or attempt statistical analysis, but they
did publish the number of deaths and index controls with their respective exposure
statuses, so odds ratios could be calculated.
Work in Zambia identified emergency status, old age, patient sex and anaesthetist
experience as risk factors, and allowed comparisons of risk associated with these

38
factors, though the authors did not attempt statistical analysis or adjust for multiple
factors (Heywood, Wilson et al. 1989). Warden and colleagues reported on causes of
death in an Australian study undertaken between 1984 and 1990, and found
cardiovascular and vascular surgery to carry the highest risk, males to be at greater risk,
and old age to be at increased risk (Warden, Borton et al. 1994; Warden and Horan
1996). They did not quantify the relative risks, though this information was available in
their published report, and they did not statistically evaluate differences or assess
multiple factors. Prospective work in France identified old age, poor health status as
described by the ASA health status classification (see appendix 1), pre-existing disease,
specific procedure type, emergency procedures, long operation time, and the type of
hospital (teaching, non-teaching or private) as factors associated with anaesthetic-
related cardiac arrest (Pottecher, Tiret et al. 1984; Tiret, Desmonts et al. 1986). They
reported relative risks and in the later study compared these single variable relative risks
statistically, finding significant differences for these risk factors (Tiret, Desmonts et al.
1986). Certain factors were graphically stratified on age or health status, but they did
not attempt more detailed analysis. A subsequent French study also evaluated risk
factors and reported mortality risks for specific factors, similarly identifying old age,
increasingly poor health status (ASA grade), regional versus general anaesthesia and
emergency operations, but this study also did not statistically assess risk factors or
adjust for multiple factors (Biboulet, Aubus et al. 2001). A Japanese study undertaken
in 1999, also identified health status (ASA grade) and age as risk factors (Iwao,
Kawashima et al. 2001; Morita, Kawashima et al. 2001; Irita, Kawashima et al. 2002).
Interestingly intravenous anaesthesia was associated with a higher risk of death than
inhalational anaesthesia, though only risks of death in each subpopulation were
reported, and no statistical analysis or adjustment for confounding factors was
undertaken (Seo, Kawashima et al. 2001).
Other studies have attempted to more thoroughly assess risk factors. A Danish
prospective cohort studied 7,000 patients at a single hospital and used regression
analysis to develop a model of mortal risk (Pedersen, Eliasen et al. 1990; Pedersen
1994). Increasing patient age, history of heart disease, pulmonary disease, renal disease,
emergency surgery, and abdominal surgery were all associated with increased risk.
However the power of the study was limited by the small sample size.
39
A matched case-control study of risk factors for cardiovascular death of elective and
emergency procedures was undertaken over a 12-year period in the nineteen-eighties
(Howell, Sear et al. 1998; Howell, Sear et al. 1999). Using multivariable analysis they
identified pre-existing myocardial infarction, hypertension and renal failure as the main
risk factors for cardiovascular death in elective procedures and a history of cardiac
failure in emergency operations (Howell, Sear et al. 1998; Howell, Sear et al. 1999).
They did not however evaluate exposure variables other than pre-existing diseases. A
multi-centre randomised clinical trial of the safety of 4 anaesthetic protocols suggested
increased risk of severe outcome including death, with pre-existing cardiac failure,
myocardial ischaemia or hypertension, poor health status, old age, and cardiovascular,
thoracic or abdominal surgery, though they could find no significant differences
between anaesthetic agents used when assessing risk of death (Forrest, Cahalan et al.
1990; Forrest, Rehder et al. 1992). These results were based on logistic regression
analysis with a number of serious outcome variables, and though they were able to
identify major risk factors they had insufficient deaths to evaluate many factors
associated with a fatal outcome (Forrest, Cahalan et al. 1990; Forrest, Rehder et al.
1992).
Newland and colleagues (2002) undertook a nested case-control, over a 10-year period
between 1989 and 1999, of anaesthetic-related cardiac arrests within 24 hours of
anaesthesia. At the univariable stage old age, poor health status, emergency surgery,
thoracic, spinal or abdominal surgery, afternoon surgery and long operation time were
associated with increased risk of cardiac arrest. When adjusting for other factors only
heath status, surgical type and emergency surgery remained in the model. Again, the
power of this study was limited by its’ small number of cases. Only 15 cardiac arrests
were deemed to be anaesthetic-related. Similarly, a recent prospective multi-centre
cohort study identified health status, age, procedure urgency and complexity (minor,
moderate or major) as risk factors and predictors of operative risk within a logistic
regression model (Donati, Ruzzi et al. 2004). It also had only moderate power with 38
deaths being recorded during the study period, and thus could only identify major risk
factors. Thus these latter studies more comprehensively evaluated risk factors, though
they still did not have sufficient numbers of anaesthetic-related deaths to evaluate more
than a few central risk factors.

40
In summary, factors associated with anaesthetic death in the medical literature include
pre-existing disease and poor health status, old age, long or urgent procedures, thoracic
and abdominal surgery, anaesthetist and surgeon inexperience, poor patient
management and insufficient monitoring. Risks associated with specific drugs have not
been thoroughly evaluated, and only in a few reports have specific risk factors been
quantified and adjusted for confounding variables. Later studies have employed more
advanced statistical tools including logistic regression to evaluate multiple factors
though they have generally been restricted by their small numbers of fatalities to
evaluating only a few central factors including old age, poor health status, surgery
urgency and location of surgery. Nonetheless these medical reports do highlight a
number of factors potentially relevant to veterinary anaesthesia.
1.4.2 Large animal work
Severe complications causing death or necessitating euthanasia have been reported in
case reports in the equine literature and causes of death have been hypothesized
(Blakemore, Jefferies et al. 1984; Brearley, Jones et al. 1986; Klein, Ailes et al. 1989;
Dixon, Railiton et al. 1993; Peek 1993; Lam, Smyth et al. 1995; Mackay, Forest et al.
2002). However such work did not specifically address risk factors and could only form
the basis of hypotheses of contributory factors to study further in analytical studies
(Schlesselman 1982; Thrusfield 1986; Hennekens and Buring 1987).
A number of single-centre retrospective studies have identified risk factors associated
with perioperative complications in horses. In studies undertaken at Colorado State
University postoperative myopathy and anaesthetic overdose were major causes of
death or euthanasia, and many of these fatalities were associated with emergency
gastrointestinal surgery and high-risk status (Lumb and Jones 1973; Lumb and Jones
1984). Tevick (1983) identified gastrointestinal surgery as the principal operation type
in those horses that died and the majority of these were deemed high-risk cases.
Statistical analysis was not performed on these data. However, amongst horses
undergoing acute emergency abdominal surgery, long duration of anaesthesia and
intraoperative hypotension were associated with increased risk of death in a further
single centre retrospective study (Trim, Adams et al. 1988).
41
Interestingly, when factors were evaluated in non-colic horses, similar risk factors were
identified (Young and Taylor 1990; Young and Taylor 1993). Intraoperative fluids and
positive inotropic support were associated with reduced risk of fatal myopathy, whilst
long procedures and old age were associated with increased risk of death or myopathy.
Subsequent work evaluated both elective and emergency procedures in a further
retrospective single clinic study (Mee, Cripps et al. 1998; Mee, Cripps et al. 1998). High
ASA grade in the elective cases was associated with increased risk of death, and
amongst emergency patients acute abdominal surgery (‘colic’ surgery) was at increased
risk. Only limited statistical analysis was undertaken with no adjustment for
confounding variables other than stratification into elective and emergency cases in the
latter study, and all of these single-centre studies had insufficient statistical power to
look at more than a small number of exposure variables adequately.
The prospective multi-centre cohort undertaken by Johnston and colleagues (1995;
2002) evaluated risk factors more thoroughly, calculating odds ratios and using logistic
regression to adjust for confounding factors. They identified anaesthesia of pregnant
mares and foals, horses undergoing abdominal surgery, orthopaedics requiring internal
fixation, long operation time, positioning in dorsal recumbency, lack of sedation and the
use of xylazine as a premedicant with increased risk. Acepromazine premedication and
total intravenous anaesthesia were associated with reduced risk. They excluded colic
surgery and caesarean section from the analysis of risk factors, a potentially important
group to study. Further, health status was not recorded, and though the majority of non-
colics and non-caesarean section horses would have been healthy, this was not
established and could not be adjusted for in the final model. The subsequent phase of
the work, a randomised clinical trial of isoflurane and halothane for maintenance of
anaesthesia did record the horses’ health statuses (Eastment, Johnston et al. 2002). In
general, no difference in outcome between the two anaesthetics was found, but in horses
aged 2 – 5, isoflurane was associated with reduced odds. In both treatment groups
increased risk was seen with orthopaedic and emergency abdominal surgery whilst
reduced risk occurred with monitoring of blood pressure, and with ear, nose and throat
and uro-genital surgery.
This multi-centre recent work has been uniquely able to quantify specific risk factors
and drug associations (Johnston, Taylor et al. 1995; Eastment, Johnston et al. 2002;

42
Johnston, Eastment et al. 2002), but the patterns are similar to those reported in the
other equine studies. The work in equine anaesthesia indicates risk factors similar to
those published in the medical literature. In particular emergency, abdominal and
orthopaedic surgery, long operations, poor health status, and extremes of age were
commonly reported factors associated with death. In addition, risks associated with
specific anaesthetic agents have been addressed and lack of sedation, and xylazine
administration were associated with increased risk whilst acepromazine premedication,
total intravenous anaesthesia, isoflurane in 2-5 year old horses and blood pressure
monitoring were associated with reduced risk. Though these factors relate to a different
species they are valuable, for whereas the medical literature has generally avoided or
been unable to evaluate anaesthetic agents, the later studies in equine anaesthesia have
addressed commonly used drugs. The risk associated with these drugs provides support
for possible hypothesised risk factors in small animal anaesthesia.
1.4.3 Small animal work
Initial work took the form of case reports. Adverse reactions occurring in practice were
reported as case series and the use of high doses of acepromazine and concentrated
solutions of thiopentone (5%) were associated with fatalities (Langley 1976). Gillick
(1981) reported frequent complications in Canada with specific drug combinations. He
stated that increased numbers of complaints were received from clients of dogs and cats
dying after xylazine (an alpha2 adrenoceptor agonists) and ketamine anaesthesia. These
early reports could give no indication of the extent of the problem, but identified
possible hypotheses, including increased risk with alpha2 adrenoceptor agonists, and
provided stimulus for further studies.
Early single institution retrospective studies suggested contributory factors without
being able to provide in-depth analysis (Albrecht and Blakely 1951; Lumb and Jones
1973). The use of ether and pentobarbital in dogs and cats was associated with higher
mortality, and trauma patients, neutering procedures, brachycephalic and fox terrier
breeds were frequently represented amongst the fatalities. However, without
denominator data on the frequency of these factors in the anaesthetised population, it
could not be determined if the increased number of deaths reflects increased risk or
commonly occurring exposure factors. A study at the Wheatridge Animal Hospital

43
suggested increased risk of death with extremes of age, though no quantification of risk
was undertaken (Lumb and Jones 1973).
Work at Colorado State University between 1955 and 1957 identified higher death risks
in cocker spaniels, in spayed versus non-spayed female patients, and for animals
undergoing ovariohysterectomy (Lumb and Jones 1973). Anaesthetist error was a
contributory factor in a number of the deaths, and the recovery period was associated
with the greatest perioperative risk. Ether was associated with higher death risks, whilst
injectable anaesthesia and halothane (dogs only) were associated with lower death risks.
They expressed risk of death associated with each factor per number of anaesthetised
patients receiving that factor and stratified the results on health status (ASA grade),
though no statistical analysis was performed. A follow-up study undertaken between
1979 and 1981 found no breed predisposition, anaesthetic overdose was a common
problem, and endotracheal tube complications were reported (Lumb and Jones 1984).
However neither this study, nor their subsequent report undertaken at Colorado State
during 1993 to 1994 (Gaynor, Dunlop et al. 1999), quantified the risks associated with
specific factors or adjusted for confounding variables and all three studies were limited
by their small sample size and single-centre nature representative only of a specific
referral population.
A prospective cohort study undertaken at Louisiana State University evaluated risk
factors and calculated adjusted odds ratios (OR) using regression analysis (Hosgood and
Scholl 1998; Hosgood and Scholl 2002). Increased risk of serious perioperative
complication (including death) was associated with old age in dogs (OR = 2) and high-
risk status in dogs and cats (ASA 3-5; dogs OR = 3.9, cats relative risk 3.9), whilst
anaesthetic time and surgery type were not associated with risk. These studies were
limited by their small sample size, particularly in the study of cat complications
(Hosgood and Scholl 2002), in which only 9 deaths were reported.
A recent study of perioperative canine complications at the Royal Veterinary College
confirmed the relevance of health status as a risk factor (Brodbelt, Hammond et al.
2005). They undertook a nested case-control study, and found that high-risk status was
associated with an increased risk (OR = 28.5), whilst acepromazine with reduced risk
(OR = 0.1). All these studies were limited by their small sample sizes, and their ability
to look at more than a small number of variables was limited. They illustrated the

44
difficulty of generating sufficient cases and statistical power from single-centre studies.
Additionally they reflected a higher risk population than practice based studies and the
risk factors identified might not be relevant to a practice based population.
An early practice-based study of feline anaesthesia was unable to fully address risk
factors, but identified a trend to reduced risk with thiopentone/halothane anaesthesia
relative to other drugs (Dodman 1977). A retrospective practice based study undertaken
in Vermont by Dodman and Lamb (1992) also did not evaluate risk factors but did
identify high risk with xylazine administration and brachycephalic breeds. Hence these
early reports provided some support for risk factors in practice populations but like
many of the institution based studies did not quantify risk.
The first major prospective multi-centre practice based study, investigated risk factors
associated with death (Clarke and Hall 1990). They estimated death risks in healthy
dogs and cats (ASA 1-2) associated with specific risk factors, though did not compare
risks relative to baseline and statistical analyses were not performed. Higher death risks
were seen in healthy dogs and cats with xylazine use. In cats, endotracheal intubation,
volatile induction of anaesthesia, thiopentone, methohexitone, ketamine, halothane,
ether and nitrous oxide use were also associated with higher death risks. In dogs,
Pekingese were the most commonly reported breed to die. Reduced death risks were
associated with atropine and acepromazine premedication in both dogs and cats. Saffan
administration in cats, and halothane and thiopentone use in dogs were also associated
with lower death risks. In the ill dogs and cats (ASA 3-5), pre-existing disease
commonly contributed to death, though in neither species was it possible to investigate
risk factors further. The lack of statistical analysis limited this study and the inability to
adjust for confounders requires the data to be interpreted cautiously. Nonetheless the
major confounder was likely to be health status and they did stratify the results by
reporting the results of the healthy stratum separate to those of the sick patients. The
systematic analysis of every 10th page of the cohort diary entries when recording the
exposure variables of the anaesthetised population could have predisposed to errors of
bias, though the clinical significance of this was likely to be small. The study is now
nearly 20 years old and with the advent of new anaesthetic agents, improved monitoring
and anaesthetic techniques, the direct application of these results to the modern small

45
animal anaesthetic population was limited. However this remains the most
comprehensive study to date and the only major study conducted in the UK.
The practice based cohort study of anaesthetic complications in Ontario did calculate
odds ratios for morbidity and mortality and apply logistic regression to adjust for
multiple factors and construct a model for perioperative cardiac arrest (Dyson, Maxie et
al. 1998). They concentrated on morbid outcomes and did not have sufficient deaths to
thoroughly evaluate risk factors for death. Nonetheless increased odds ratios for
perioperative cardiac arrest, were found for dogs given xylazine (OR = 43.6) and for
sick patients (ASA 3-5, OR = 7). In cats, sick patients (ASA 3-5) were at greater risk of
death (OR = 21.6), whilst the presence of a technician monitoring the anaesthetic
reduced risk (OR = 0.19).
In summary, only the later studies have critically evaluated risk factor for death (Clarke
and Hall 1990; Dyson, Maxie et al. 1998; Hosgood and Scholl 1998; Hosgood and
Scholl 2002; Brodbelt, Hammond et al. 2005). Commonly reported risk factors for
death are similar to those seen in the medical and equine literature and include poor
health status, old age, and poor monitoring. Interestingly the risks associated with
xylazine and acepromazine appear similar to those reported in large animals, and
intubation of cats appears a high-risk procedure. The majority of these studies have been
limited by their sample sizes when attempting to assess a number of risk factors and to
adjust for potential confounders. Only the more recent practice based multi-centre
studies have been able to look more thoroughly at a range of risk factors, but even these
are now 10 to 20 years old (Clarke and Hall 1990; Dyson, Maxie et al. 1998).
1.4.4 Biological bases of risk factors
Previous studies have highlighted a number of risk factors for anaesthetic death. Given
the knowledge of likely causes of perioperative death it is possible to suggest
mechanisms by which the risk factors contribute to mortality. Establishing causation
with respect to given risk factors is difficult however within the context of an
observational study. When viewed in the light of postulated mechanisms of action of
these risk factors combined with published experimental studies supporting these
mechanisms, a greater body of evidence for a causative association between exposure
factor and outcome is possible (Schlesselman 1982; Thrusfield 1986; Hennekens and

46
Buring 1987). Hence an understanding of the likely mechanisms of action of risk factors
in contributing to death is useful when evaluating the biological plausibility of an
association (Hill 1965).
1.4.4.1 Patient related risk factors
The presence of pre-existing disease has consistently been reported as a risk factor for
anaesthetic death (Lumb and Jones 1984; Clarke and Hall 1990; Dyson, Maxie et al.
1998; Hosgood and Scholl 1998; Hosgood and Scholl 2002; Brodbelt, Hammond et al.
2005). This is not surprising given that disturbance of major body systems will make the
patient less tolerant of physiological depression induced by anaesthesia. Pre-existing
cardiopulmonary pathology is particularly relevant in the immediate perioperative
period, as anaesthetic-related mortality is likely to involve respiratory or cardiovascular
compromise, and most anaesthetics depress one or both systems at clinical levels of
anaesthesia (Hall and Clarke 1991; Hall and Taylor 1994). This pathology may reduce
the therapeutic index of administered anaesthetics and increase the potential for relative
overdose.
Haematological and biochemical abnormalities may also be significant. In particular,
anaemia will reduce oxygen carrying capacity and predispose to hypoxia, whilst
hypoproteinaemia may increase the sensitivity of the patient to highly protein bound
drugs, and result in relative overdose (Hall and Clarke 1991). Renal disease is also
important, particularly if dehydration or uraemia is present, as under these conditions
the kidneys will have a lower tolerance to anaesthesia and the patient will be more
sensitive to anaesthetics given. After hypotensive anaesthesia, chronic renal failure may
be converted to acute disease (Hall and Clarke 1991). Neurological disease may be
relevant with respect to the occurrence of postoperative seizures, increased sensitivity to
anaesthetics and when cardiopulmonary function is affected, e.g. medullary pathology
can depress ventilation and cardiovascular function. Additionally liver and endocrine
disease may influence the response to anaesthesia, with diabetes mellitus and potential
intraoperative cellular hypoglycaemia being particularly relevant (Johnson 1999).
Brachycephalic breeds have been found to be at greater risk (Lumb and Jones 1973;
Clarke and Hall 1990; Dodman and Lamb 1992). When sedated or anaesthetised
redundant pharyngeal tissue may partially obstruct their upper airway; when this is

47
combined with the breeds’ tendency to narrow tracheas, stenotic nares and prolonged
soft palates, significant airway obstruction may result (Hall and Clarke 1991; Thurmon,
Tranquilli et al. 1996) Additionally, some breeds (e.g. boxers) are particularly sensitive
to the vasodilatatory effects of the phenothiazines (Hall and Clarke 1991).
Age has been reported in some studies to be a significant risk factor in dogs but not cats
(Hosgood and Scholl 1998; Hosgood and Scholl 2002), though other studies have been
unable to find an association in either (Clarke and Hall 1990; Dodman and Lamb 1992;
Dyson, Maxie et al. 1998; Brodbelt, Hammond et al. 2005). Greater risk for the
extremities of age would be expected. Young animals have higher surface area to
volume ratios and are physiologically immature making them less tolerant of
anaesthetic effects and more prone to hypothermia and delayed recoveries. Older
patients tend to have reduced cardiopulmonary, and renal reserves making them more
prone to the depressant effects of anaesthesia (Meyer 1999).
1.4.4.2 Procedure related risk factors
Increased risk has been associated with emergency procedures in the human and equine
literature (Lunn and Mushin 1982; Pottecher, Tiret et al. 1984; Tiret, Desmonts et al.
1986; Buck, Devlin et al. 1988; Johnston, Taylor et al. 1995; Biboulet, Aubus et al.
2001; Eastment, Johnston et al. 2002; Johnston, Eastment et al. 2002) though not in
small animal studies. The risk is likely to reflect the combined effect of the nature and
urgency of the operation, the health status of the patient and the inability to stabilise the
patient preoperatively. Procedure duration has also been reported as a risk factor in the
comparative literature (Pottecher, Tiret et al. 1984; Tiret, Desmonts et al. 1986; Trim,
Adams et al. 1988; Young and Taylor 1990; Young and Taylor 1993; Johnston, Taylor
et al. 1995; Biboulet, Aubus et al. 2001; Eastment, Johnston et al. 2002; Johnston,
Eastment et al. 2002; Newland, Ellis et al. 2002) and this may again reflect the
difficulty of the procedure as well as time dependent effects of anaesthesia. Prolonged
anaesthesia predisposes to hypothermia, which can induce cardiopulmonary depression
and reduce drug metabolism, additional to that induced by the anaesthetic agents used
(Waterman 1981; Dhupa 1995).

48
1.4.4.3 Anaesthetic risk factors
Xylazine, an alpha2 adrenoceptor agonist, was associated with increased risk in a
number of veterinary studies (Gillick 1981; Clarke and Hall 1990; Johnston, Taylor et
al. 1995; Dyson, Maxie et al. 1998). The physiological effects of the alpha2 agonists are
well known and include transient hypertension followed by hypotension, bradycardia,
increased systemic vascular resistance and reduced cardiac output (Muir 1977; Greene
and Tranquilli 1988; Savola 1989; Wagner, Muir et al. 1991; Cullen 1996; Ko, Bailey et
al. 1996; Golden, Bright et al. 1998; Pyendop and Verstegen 1998; Pyendop and
Verstegen 1999). Additionally, xylazine has been found to sensitise the heart to
catecholamine-induced arrhythmias under halothane anaesthesia (Muir, Werner et al.
1975; Tranquilli, Thurmon et al. 1986) or a least not increase the threshold to these
arrhythmias (Lemke, Tranquilli et al. 1993; Dyson and Pettifer 1997). Ventilation is
generally preserved or only mild respiratory depression is seen (Bloor, Abdul-Rasool et
al. 1989; Pyendop and Verstegen 1999).
Clarke and Hall (1990) concluded that the majority of the complications with xylazine
were associated with lack of familiarity with the agent and the use of relatively high
doses. Given the cardiovascular effects and slowing of the circulation seen with the
alpha2 adrenoceptor agonists, the effects of subsequently administered anaesthetic
agents will be delayed. If an induction agent is not given slowly to effect at a
significantly reduced dose (relative to the dose when an alpha2 agonist is not used), the
potential for relative overdose is real. Nonetheless, the cardiovascular effects are
dramatic and these alone may play a significant role. The tendency of xylazine to
sensitise the heart to catecholamine-induced arrhythmias could also contribute to
complications. A stressed animal will already have elevated catecholamine levels and
the addition of xylazine and potentially halothane (also potentiating catecholamine
induced arrhythmias) could result in ventricular arrhythmias and cardiac arrest. One of
the cases reported by Clarke and Hall (1990) was an aggressive dog that had to be
forcefully restrained prior to anaesthesia and catecholamine induced arrhythmias was a
likely cause of death.
The risk associated with medetomidine, a more recent and more specific alpha2
adrenoceptor agonist, is unknown, as medetomidine was introduced after the main small
animal studies were published (Clarke and Hall 1990; Dodman and Lamb 1992;

49
Dyson, Maxie et al. 1998). Its’ actions are broadly similar to those of xylazine (Cullen
1996; Pyendop and Verstegen 1998; Pyendop and Verstegen 1999). However it has not
been found to sensitise the heart to catecholamine induce arrhythmias (Pettifer, Dyson
et al. 1996) and this may reduce the risk associated with its use. Medetomidine is a
commonly used sedative and premedicant in small animal practice (Wagner and Hellyer
2000; Nicholson and Watson 2001) and establishing its relative safety would be
valuable.
Acepromazine is another common premedicant used in practice (Clarke and Hall 1990;
Wagner and Hellyer 2000; Nicholson and Watson 2001) and one associated in
observational studies with reduced risk (Clarke and Hall 1990; Johnston, Taylor et al.
1995; Dyson, Maxie et al. 1998; Johnston, Eastment et al. 2002; Brodbelt, Hammond et
al. 2005). It causes vasodilatation and hypotension, with minimal direct cardiac or
respiratory depression (Hall and Clarke 1991; Stepien, Bonagura et al. 1995). It
increases the threshold to catecholamine-induced arrhythmias (Muir, Werner et al.
1975; Dyson and Pettifer 1997). Additionally, by reducing subsequently administered
anaesthetic agent requirements it is can reduce cardiopulmonary depression of the
patient (Heard, Webb et al. 1986; Webb and O'Brien 1988; Hall and Clarke 1991).
The risk associated with halothane, isoflurane and other inhalation agents has not been
fully evaluated in the small animal literature and where studied, isoflurane has been
associated with increased risk (Dyson, Maxie et al. 1998; Brodbelt, Hammond et al.
2005). This may reflect more the selection of this agent for higher risk patients than its
actual safety. However it does induce more respiratory depression than halothane and if
a genuine increased risk has been observed, hypoventilation could be the underlying
reason (Steffey and Howland 1977; Hellebrekers 1986; Grandy, Hodgson et al. 1989;
Hodgson, Dunlop et al. 1998). Isoflurane induces less myocardial depression and
sensitises the heart less to catecholamine-induced arrhythmias and from a
cardiovascular perspective would appear safer than halothane (Joas and Stevens 1971;
Steffey, Gillespie et al. 1975; Steffey and Howland 1977; Hellebrekers 1986; Tranquilli,
Thurmon et al. 1988; Grandy, Hodgson et al. 1989; Lemke, Tranquilli et al. 1993;
Hikasa, Okabe et al. 1996; Hikasa, Ohe et al. 1997; Hodgson, Dunlop et al. 1998).
Interestingly in young horses, isoflurane was associated with reduced odds relative to
halothane (Eastment, Johnston et al. 2002).
50
Intubation of cats has been linked with increased risk (Clarke and Hall 1990; Dyson,
Maxie et al. 1998). Cats are prone to laryngeal spasm and greater care must be taken
when intubating this species than in dogs (Hall and Taylor 1994). Additionally, given
their small tracheal diameters, they are more prone to obstruction with secretions, debris
and blood. Premedication with an anticholinergic that reduces airway secretion may
reduce this risk and interestingly Clarke and Hall (1990) found lower death rates in
those premedicated with atropine.
1.4.4.4 Monitoring and personnel related risks
In small animal anaesthesia the main factor associated with increased risk was the lack
of a separate person monitoring anaesthesia (Clarke and Hall 1990; Dyson, Maxie et al.
1998). This is not surprising as without careful monitoring of the anaesthetic, avoiding
complications is less likely. Increased anaesthetic experience of these people has not
been associated with reduced risk and in one study was associated with increased risk
(Johnston, Eastment et al. 2002). The authors reflected that this was more likely to be a
result of the more experienced anaesthetist undertaking higher risk anaesthesia than
their increasing risk per se.
Monitoring equipment has not been carefully evaluated though the use of heart rate
monitors was associated with increased risk of morbid complications (Dyson, Maxie et
al. 1998). These monitors provide only a heart rate and no indication of pulse quality
and may provide the clinician with a false sense of security. Additionally, they may
have been used more frequently in high-risk patients. In horse, blood pressure
monitoring was found to be protective against cardiac arrest (Eastment, Johnston et al.
2002). Arterial blood pressure measurement in the context of inhalation anaesthesia
provides an indirect indicator of cardiac performance (Wagner and Brodbelt 1997) and
may provide early warning of developing problems. Risk with blood pressure
monitoring has not been evaluated in small animals and is presently uncommonly used
in practice (Wagner and Hellyer 2000; Nicholson and Watson 2001). Pulse oximetry is
another monitoring aid more recently introduced to veterinary practice and is gaining
popularity (Wagner and Hellyer 2000; Nicholson and Watson 2001). It has been used in
medical anaesthesia for some time and allows early recognition of haemoglobin
desaturation and cyanosis (Adams 1989). Its role in anaesthetic safety in small animals

51
has not been evaluated.
In summary, a number of risk factors identified in the literature are supported by
experimental work that provides plausible mechanisms of action of the factors. Though
causation is not established, the hypothesized biological aetiologies add greater strength
to the associations published in these observational studies.
1.5 Methodology
Observational and intervention studies have been used to investigate anaesthetic
complications. Intervention studies have the advantage that they are less prone to
problems of confounding than observational studies when randomisation of the
intervention is undertaken (Hennekens and Buring 1987). However, they are more
costly to undertake and may introduce ethical issues when one intervention group is
exposed to an exposure factor of known increased risk. Observational studies in contrast
do not generally suffer this ethical concern, though issues of bias and confounding may
be more problematic (Thrusfield 1986; Hennekens and Buring 1987).
1.5.1 Observational studies
Observational studies are able to evaluate multiple factors simultaneously, are often
cheaper to undertake and do not present ethical problems (Hennekens and Buring 1987).
They are well suited to the study of anaesthetic complications and represent the majority
of studies reported in the literature on anaesthetic complications.
1.5.1.1 Case series and reports
The early reports of anaesthetic complications took the form of case reports and series
(Phillips, Frazier et al. 1960; Langley 1976; Gillick 1981; Holland 1987; Caplan, Posner
et al. 1990; Gannon 1991). Though providing interesting evidence for potential risk
factors, these studies did not give quantitative data and did not allow assessment of
disease risks or associations with risk factors (Hennekens and Buring 1987). Hence case
reports and series are most valuable as reports to base hypotheses on and to encourage
the undertaking of analytical studies.

52
1.5.1.2 Cohort studies
The vast majority of the veterinary anaesthetic and medical complications literature has
taken the form of cohort studies. Cohort studies have the advantage that they allow
assessment of multiple outcomes, they allow the calculation of disease incidence risks
and they are well suited to evaluating rare exposures (Schlesselman 1982; Hennekens
and Buring 1987). The study of morbidity and mortality involves multiple outcomes and
in theory is well suited to the cohort methodology. Prospective cohort studies, in which
the studies are initiated before the outcome of interest has occurred, additionally have
the advantages of a clear temporal sequence from exposure to outcome and are less
susceptible to bias in the selection of participants and the ascertainment of exposure
status, than case-control or retrospective cohorts (Hennekens and Buring 1987).
However, in general cohort studies can be expensive and time consuming, losses to
follow-up are a concern, and they are inefficient in the evaluation of rare outcomes,
such as anaesthetic death (Schlesselman 1982; Hennekens and Buring 1987).
When a case-control is inserted into a cohort, forming a nested case-control, the cost of
a cohort study can be considerably reduced (Hennekens and Buring 1987). The
assessment of a number of risk factors in only a subset of the population at risk (i.e. the
cases and controls of the study population) can be an efficient method of evaluating a
problem where a diagnostic test is expensive or the outcome rare. This method is
particularly suited to the evaluation of anaesthetic mortality, though only more recently
has it been applied in the literature (Newland, Ellis et al. 2002; Brodbelt, Hammond et
al. 2005).
In the design of a cohort study the methods of selection of the exposed and unexposed
patients is an important consideration and the two groups must be as similar as possible,
save for the factor under investigation (Hennekens and Buring 1987). Sources of
exposure and outcome information must be carefully considered and should be as
complete, comparable and as unbiased as possible. Of particular relevance to studies of
anaesthetic complications is the approach to follow-up. Failure to obtain complete
outcome data, i.e. losses to follow-up, is a major concern in cohort studies and in the
context of anaesthetic complications setting a prolonged period of follow-up increases
the proportion of lost outcome data. Additionally, a long postoperative follow-up period
may increase the chance of including non-anaesthetic related complications. This

53
must be balanced against having too short a follow-up period and missing some
anaesthetic related complications that occur after the specified postoperative period has
finished. In the medical literature up to 30 days postoperatively has been studied (Lunn
and Mushin 1982) whilst in equine anaesthesia a period of 7 days was recently
considered (Johnston, Taylor et al. 1995; Johnston, Eastment et al. 2002). In small
animal anaesthesia shorter periods have generally been evaluated and unlike in the
horse, conditions such as postoperative myopathy or colic involving prolonged intensive
care and subsequent death are unlikely to occur. The exception to this is postoperative
renal failure, which is a serious risk in small animal anaesthesia, but is unlikely to be
recorded unless the outcome is followed for a number of weeks (Hall and Taylor 1994).
Cohort studies allow the calculation of incidence rates and risks in the exposed and
unexposed groups. The major comparative measure of the cohort study is relative risk.
The relative risk (RR) quantifies the association between exposure and disease and
represents the incidence of disease in the exposed group relative to that in the
unexposed group. This can be expressed as a risk ratio when the cumulative incidence
in the exposed is compared to the unexposed group or as a rate ratio when the incidence
rate in the exposed is compared to that of the unexposed (Hennekens and Buring 1987).
1.5.1.3 Case-Control studies
The case-control study has the advantage over the cohort study of being an efficient
method for evaluating rare diseases and diseases with long latencies, is generally
inexpensive, requires relatively few subjects and allows assessment of multiple
exposure factors. However, the case-control study is inefficient for evaluating rare
exposures and multiple outcomes (Schlesselman 1982; Hennekens and Buring 1987). In
the context of anaesthetic complications, they are an efficient method in assessing
mortality, a rare outcome, but not morbidity, which involves multiple outcomes. In the
medical work only a few case-control studies have been published (Campling, Devlin et
al. 1990; Campling, Devlin et al. 1992; Campling, Devlin et al. 1993; Howell, Sear et
al. 1998; Howell, Sear et al. 1999; Newland, Ellis et al. 2002). In the veterinary
literature one small animal preliminary report has been published using the case-control
method (Brodbelt, Hammond et al. 2005), and a more comprehensive equine study has
been undertaken though has yet to be analysed (Johnston 2003).

54
The major potential problem in case-control studies is bias in the selection of cases or
controls (Hennekens and Buring 1987). The exposure and outcome have often both
occurred before the study is initiated and knowledge of the antecedent exposures may
influence the selection of the cases or controls. Of particular concern is the selection of
the controls. The controls are intended to provide an estimate of the exposure rate that
would have been expected to occur in the cases if there were no association between
exposure and the study disease and hence should be representative of the population
from which the cases were derived (Schlesselman 1982). Insuring these controls are
representative is a major problem that threatens any comparisons made between case
and controls.
Hence, sampling procedures for the selection of cases and controls must aim for
unbiased ascertainment of eligible cases and controls. When all eligible cases are used,
as generally occurs in anaesthetic mortality studies, sampling of the controls is the main
concern. Random sampling should minimise the risk of selection bias, but this often
requires data on the underlying cohort (Dohoo, Martin et al. 2003). A process of control
selection often seen in the medical literature is matching. Matching refers to the
selection of one or more controls for each case on the basis of similarity of a factor (or
factors) other than the factors under investigation (Dohoo, Martin et al. 2003). It is used
to increase the power of the study and reduce bias, and often characteristics thought to
be confounders of the study are chosen as matching characteristics. Disadvantages of
matching include increasing the complexity of the study, precluding the evaluation of
the matched factor, requiring matching in the analysis, and the possibility of
overmatching reducing the validity or statistical efficiency of the study (Schlesselman
1982; Hennekens and Buring 1987).
Case-control studies also allow the quantitative assessment of the association of disease
with exposures (i.e. risk factors) within a given population. The relative odds of
exposure to factors of interest are compared between cases and controls giving an odds
ratio (OR) of exposure. Mathematically this is equivalent to the odds ratio of disease in
the cases compared to the controls (Schlesselman 1982; Hennekens and Buring 1987)
OR of exposure = odds of exposure in the cases / odds of exposure in the controls

55
OR of disease = odds of disease in the exposed / odds of disease in the unexposed
For rare diseases the risk of disease (where cases are included in the denominator) is
similar to the odds of disease (cases are not included in the denominator) and hence the
odds ratio is said to approximate the risk ratio or rate ratio. This is the rare disease
assumption. More recently, it has been shown that the rare disease assumption is not
required to obtain measures of the risk ratio and rate ratio if certain conditions of
sampling are met (Smith, Rodrigues et al. 1984; Rodrigues and Kirkwood 1990).
In conclusion, the cohort and case control methodologies are both suited to the
investigation of anaesthetic complications. Cohorts are particularly appropriate to
morbidity studies with common outcomes and for studies with multiple outcomes.
Case-control studies allow assessment of the rare disease of anaesthetic mortality and
are cheaper to perform. In the context of anaesthetic mortality the nested case control is
particularly useful as anaesthetic death risks and risk factors may be assessed
efficiently.
1.5.2 Intervention studies
Intervention studies provide the strongest epidemiological evidence for causation but
may be unfeasible when multiple factors are to be assessed. Their key feature of
randomisation of the allocation of patients to study groups reduces bias and controls for
both known and unknown confounding variables (Sackett, Straus et al. 2000).
Intervention studies however, may be prohibitively expensive and may be unethical if a
study group is exposed to known harmful factors or deprived of known beneficial
factors (Hennekens and Buring 1987). Only a few clinical trials have been published in
the anaesthetic complications literature and have focused on specific aspects such as the
risk with different inhalation agents (Forrest, Cahalan et al. 1990; Forrest, Rehder et al.
1992; Eastment, Johnston et al. 2002; Johnston, Eastment et al. 2004). In the medical
literature the work of Forrest and colleagues (1990; 1992) evaluated four anaesthetic
regimes. It compared risks of morbid complications between experimental groups but
had insufficient power to compare risk of death between groups. In the veterinary
literature only one study has been published and evaluated the risk of death when using
halothane and isoflurane in horses (Eastment, Johnston et al. 2002; Johnston, Eastment

56
et al. 2004). It did not find an overall significant difference between isoflurane and
halothane, though found a reduced risk when using isoflurane in young horses.
Hence though valuable in evaluating the relative safety of different anaesthetics,
intervention studies are often too specific in their focus to be applied when evaluating
anaesthetic complications. They are best used after observational studies have
thoroughly investigated anaesthetic risks, when specific hypotheses need further testing
to establish causation.

57
Chapter 2: Materials and Methods
2.1 Introduction
The study anaesthetic-related death is a rare outcome and as such could be efficiently
evaluated with the case-control study method (Schlesselman 1982; Hennekens and
Buring 1987). Nesting the case-control study within the cohort of all anaesthetised small
animals at participating centres allowed the estimation of the risk of anaesthetic-related
death in these species. A prospective multi-centre study, based on this methodology,
was undertaken in the UK to evaluate anaesthetic-related death in small animal practice.
2.2 Pilot Study
A pilot study was undertaken between 1st of June and the 1st of October 2002 to refine a
priori hypotheses and to identify additional study hypotheses, to test and modify the
study method and data collection tools, and to revise the power and sample size
calculations for the main study. Practices were requested to take part in the study as
described below, and interested centres were contacted by the primary investigator.
After discussing the nature of the study, the time period anticipated for the study and the
likely workload for individual centres, interested centres were recruited and a practice
file, including all questionnaires was delivered to them. Fifty-three centres were
recruited on an ongoing basis during the pilot study during the first two-months of the
four-month pilot. Most centres were visited during the pilot study.
At the end of the pilot study, species-specific mortality risks were estimated and crude
odds ratios were calculated for a number of risk factors identified by a priori
hypotheses and by previous studies. The results were then used to adjust a priori
hypotheses, to reassess sample size calculations, and to modify the method for the main
study. Preliminary results were distributed to participating centres and they were
encouraged to continue with the study. Additional centres, primarily larger centres, were
then recruited to the main study.

58
2.3 Power calculations and sample size estimates
Prior to the pilot study, the study was designed to have a 90% power to detect
associations of factors with odds ratios of at least 2.5 and present in 5% of controls.
Using an efficient 1:4 case control ratio (Schlesselman 1982), around 230 cases and 920
controls would be required in dogs and cats. Assuming a mortality risk, based on
previous work of 0.1% (Clarke and Hall 1990; Dodman and Lamb 1992; Dyson, Maxie
et al. 1998; Joubert 2000), and a case notification rate of 95%, approximately 265,000
anaesthetics would need to be recorded in both species. It was estimated that this
number of anaesthetic events and cases could be recorded over a two-year study period,
if 70 large clinics that performed an average of 7 anaesthetics and sedations a day in
both cats and dogs were recruited, assuming a 260 day working year.
In light of the pilot study, this sample size calculation was revised based on a revised
primary hypothesis. From the pilot study it was calculated that patients’ receiving
medetomidine compared to not receiving medetomidine were approximately at a two to
three-fold reduction in risk of death. Assuming the presence of this factor in dogs in a
least 13% of the population, based on an odds ratio of 0.3 at a power of 90% and
confidence level of 95%, then approximately 140 cases and 560 controls (case: control
ratio 1:4) would be required in dogs. In cats assuming, a level of exposure of 25% and
an odds ratio of 0.5, then 180 cases and 720 controls would be required at the same
power and confidence level. The risk of mortality based on the pilot study was higher
than expected and based on the revised risk, approximately 60,000 to 90,000 anaesthetic
events would be required in dogs and cats. This could be achieved within the study
period by recruiting a number of additional clinics, generating a total of approximately
5,000 anaesthetics a month in dogs and cats. These revised targets would still provide
sufficient power to address a number of other risk factors with similar or more common
exposure frequencies in the control population to those reported for the stated
hypothesis, assuming similarly biologically significant odds ratios.
2.4 Aims and Objectives
The aims of the study were to evaluate anaesthetic-related death in small animal
practice and to provide information to help reduce mortality. The objectives of the study

59
were to:
a. Describe trends in the practice of small animal anaesthesia.
b. Estimate the risk of anaesthetic and sedation-related mortality in dogs, cats and
‘exotic’ species
c. Describe the causes of anaesthetic-related death
d. Identify risk factors for anaesthetic-related death in dogs, cats and rabbits
e. Identify risk factors for anaesthetic-related death in ‘sick’ (ASA grade 3-5) dogs and
cats
f. Make recommendations to improve the practice of small animal anaesthesia
2.5 A Priori Hypotheses
Hypotheses, pertaining to the dog and cat populations and anaesthetic-related death,
were prepared prior to the start of the study based on previous published work and
clinical experiences and modified where appropriate in light of the pilot study. They
included the following hypotheses:
a. Sick patients (ASA grade 3-5, Appendix 2.1) are at an increased risk of death
compared to healthy (ASA 1-2) patients.
b. The use of acepromazine is associated with a two-fold reduction in the odds of death.
c. The use of medetomidine is associated with a two-fold reduction in odds of death.
d. Induction of anaesthesia with propofol is associated with a two-fold reduction in odds
of death compared to thiopentone.
e. Maintenance of anaesthesia with isoflurane is associated with a two-fold reduction in
odds of death compared to halothane.

60
f. The use of intraoperative fluids is associated with a two-fold reduction in odds of
death.
g. Endotracheal intubation in cats is associated with increased odds.
h. Having a separate person monitoring anaesthesia is associated with a two-fold
reduction in the odds of anaesthetic-related death.
The initial hypothesis in relation to medetomidine was that it was associated with a two-
fold increase in odds of anaesthetic related death. In light of the pilot study results this
was modified to a two-fold reduction in odds.
2.6 Study population
The study population consisted of all small animals anaesthetised or sedated by the
participating clinics during their period of participation. Anaesthesia was defined as
chemical restraint, sufficient to allow endotracheal intubation (independent of whether
endotracheal intubation was performed). Sedation was defined as chemical restraint
insufficient to allow endotracheal intubation. For the purpose of this report ‘anaesthesia’
will include anaesthesia and sedation unless stated otherwise. The need for good
compliance and high quality data over an extended study period suggested that
recruiting interested and motivated centres was a greater priority than involving clinics
that more closely represented the distribution of UK practices. For this reason a
convenience sample of veterinary practices and referral veterinary institutions in the UK
were recruited to participate in the study.
2.7 Study design
A nested case-control design was used to investigate the aims and objectives and to test
the hypotheses of the study. A nested case-control study is a case-control study that
draws its cases and controls from a pre-determined cohort population that has been
followed for a period of time (Dohoo, Martin et al. 2003). The cohort study recorded all
anaesthetics and sedations undertaken and all deaths within 48 hours of anesthesia,
allowing the estimation of the risks or death. The case-control study was undertaken
within the framework of the cohort. The cohort provided a source population from

61
which to identify the controls and the anaesthetic-related deaths. The case-control study
was performed to identify risk factors associated with anaesthetic-related death.
2.7.1 Cohort study
All anaesthetic and sedation events occurring at participating centre were recorded and
the risks of perioperative mortality within 48 hours after the procedure were estimated.
The cohort data were recorded as self-administered questionnaires by the centres and
returned on a monthly basis in prepaid envelopes. The questionnaires and envelopes
were supplied at the beginning of the study to participating centres in a CEPSAF study
file with information on the study. Additional forms were sent to the centres throughout
the study period as completed questionnaires were returned to ensure all centres always
had surplus questionnaires and envelopes.
Information was recorded in case diary forms (Appendix 2.2) supplied to the clinics and
included the unique centre code, procedure date, patient identification, species, whether
it received an anaesthetic or sedation, and outcome at 48 hours (recorded as alive, dead
or euthanased). Brief details of the reason for death or euthanasia were recorded in the
diary for patients that died. The method of identification of patient outcome was left to
the individual centres and focused on that method by which the practice was confident
they would be able to record the correct outcome. Methods included active
communication with the owners via a 48-hour postoperative practice consultation or
telephone check-up, and passive responses by the patients’ owners to the practice if a
postoperative fatality occurred. Losses to follow-up were checked with the practices and
the outcome ascertained when possible. Fifteen cats and twenty dogs were recorded in
the cohort with an unknown outcome during the study period (0.02%) and these patients
were excluded from the denominator of patients anaesthetised during the study.
Risks of mortality and euthanasia were estimated and species-specific risks of
anaesthetic-related death were calculated from the number of anaesthetic-related deaths
divided by the number of patients anaesthetised or sedated in the cohort.
2.7.2 Case-control study
The case-control study investigated risk factors for anaesthetic-related death.
Information on the covariates of interest was recorded on the same questionnaire for

62
cases and controls and included patient and procedure details, anaesthetic and
postoperative management, and personnel-related variables (Appendix 2.3). Descriptive
information on the timing of death, clinical signs and circumstances of death, post-
mortem results, cause of death and role of anaesthesia were recorded for the cases. The
questionnaires were self-administered by the centres and were returned in postage paid
envelopes after completion. Questionnaires were supplied to the centres at the start and
throughout the study in the CEPSAF study file with the cohort questionnaires.
Additional forms were sent to the centres throughout the study period as completed
questionnaires were returned to ensure all centres always had surplus questionnaires.
The selection method of the controls is described below.
2.7.2.1 Species specific studies
Separate case-control studies were undertaken for dogs, cats, rabbits, sick dogs and sick
cats. The case-control studies in the dogs, cats and rabbits were nested in the species-
specific cohorts described above. Risk factors were evaluated separately in these three
species. Separate case-control studies were undertaken in a subpopulation of ‘sick’
(ASA grade 3-5, Appendix 2.1) dogs and cats.
2.7.2.2 Case definition and selection
A case was defined as a perioperative death (including euthanasia) occurring after
premedication and within 48 hours of termination of the procedure, except where death
or euthanasia was due solely to inoperable surgical or pre-existing medical conditions.
A death was considered a case if anaesthesia could not be reasonably excluded as a
contributory factor. Cases were identified by the participating centres in the first
instance and subsequently by the investigators from the cohort of anaesthetics recorded
by each practice. Deaths recorded in the cohort, but for which no case-control
questionnaire was submitted by the clinic, were investigated and a case-control
questionnaire was requested if the death could be considered a case. Case-control
questionnaires were requested for all potential cases in all small animal species (dogs,
cats and exotics) to allow for estimation of risks of anaesthetic-related death. In dogs,
15 out of 285 deaths were unaccounted for (case notification rate of 95%), whilst in
cats, 14 out of 248 deaths were unaccounted for (94%).

63
The classification of dog and cat cases was undertaken by an independent review panel.
All potential cases were assessed based on the case definition and a set of documented
criteria (Appendix 2.4). The criteria formalised the decision process for classifying
fatalities as cases, and assessed the body of evidence for anaesthesia contributing to the
death for each case in light of the timing of the death and proximity to the completion of
the anaesthetic (if a postoperative death), the patient’s pre-existing health status, and the
likely contribution of the procedure to the death. The panel consisted of two RCVS
diploma level veterinary anaesthetists, an RCVS diploma level veterinary soft tissue
surgeon and was chaired by an experienced veterinary scientist with a RCVS Diploma
in Veterinary Anaesthesia. The panel met for two sessions over three days during the
study. The panel was unaware of the clinics’ identity and the drugs administered. The
panel also classified the primary cause of death, based on a list of possible causes
(Appendix 2.5). The panel’s decision was accepted as final for all classifications.
Cases were excluded from the analysis if they occurred prior to the administration of an
anaesthetic agents (including premedication) or if they occurred beyond 48 hours after
termination of anaesthesia. Fatalities that did not satisfy the case definition were
excluded. Cases in which insufficient information was available were also excluded
from the analysis (15 dogs and 14 cats for which no questionnaire was returned and for
which there was insufficient information to exclude them from being cases).
For the rabbit dataset, only cases occurring between the 1st of January 2003 and the 31st
December 2003 and that had returned a matched control, were included in the analysis
of risk factors. Rabbit cases outside this time period and for which no matched control
were received were excluded from the analyses of risk factors. These cases were
included in the numerator number of cases when species-specific anaesthetic-related
risks of mortality were estimated.
Case selection followed the same procedure as in the dogs and cats, though the primary
investigator classified the cases in rabbits (and the anaesthetic-related deaths in all other
‘exotic’ animal species), and the primary cause of death based on the criteria described
above.

64
2.7.2.3 Control definition and selection
Controls were defined as dogs or cats that had been anaesthetised, that did not die (or
were not euthanased) within 48 hours of termination of the procedure, and that were
derived from the cohort of dog and cat anaesthetics. Dog and cat controls were
prospectively randomly selected from the cohort of dogs and cats anaesthetised at a 1:4
case to control ratio. This was designed to be an efficient ratio, given the number of
anticipated cases and the estimated investigator and clinic workload in gaining this
control information (Schlesselman 1982). A patient could serve as a control for more
than one anaesthetic event. That is, an animal could be randomly selected as a control
for two or more anaesthetics if it was anaesthetised on more than one occasion. The
same patient could not be selected more than once as a control for the same anaesthetic
episode. A case could serve as a control for all prior anaesthetic episodes.
The randomly selected controls were identified from the cohort data. The monthly clinic
species-specific anaesthetic and sedation totals were entered into a relational database
(Access, Microsoft), exported to a spreadsheet (Excel, Microsoft) and cumulative
frequencies of anaesthetic events were calculated by clinic for dogs and cats. This
allowed the identification of individual dog and cat anaesthetic events by clinic number
and within that clinic the patient number of the month. Thus a patient would be
randomly selected from the monthly cohort and then identified by clinic and the specific
patient number of the month for that clinic (e.g. 53rd dog of 112 dog anaesthetics that
month in clinic 1115). The previous month’s distribution of anaesthetic events was used
to generate the following month’s controls. The controls were identified by clinic
number, species, procedure number of the day, day of the week and week of the month
based on the previous month’s distribution. For example, the 53rd dog would have been
the 3rd dog anaesthetised on the 2nd Tuesday of the month at clinic 1115, based on clinic
1115’s previous month’s cohort data. The 3rd dog anaesthetised on the 2nd Tuesday of
the current month at clinic 1115, would then be requested shortly after the 2nd Tuesday.
The number of controls prospectively randomly selected each month was based on the
number of cases that occurred in the previous month, multiplied by the number of
controls required per case. Initially, over the first 6 months of the main study, the
number of cases occurred faster than anticipated and the number of controls requested
was lower than the global target of 4 per case (approximately 2-3 controls requested

65
per case during this early period). As the study progressed the monthly numbers of
controls was readjusted to reach the anticipated global targets (Appendix 2.6).
The clinics were contacted by phone, email or post by the primary investigator, soon
after the specified control was anaesthetised and completion of the case-control
questionnaire was requested retrospectively to allow retrospective completion of the
form as for the cases. If the same random number was drawn more than once, the
random selection process was repeated for all but the first selection of that control.
Control questionnaires that were not received from the clinic within 2 months of
request, were reallocated to the same clinic for the next month (i.e. the 3rd month after
request). The patient of the same species, operation number, day and week of the month
as for the original selection, was requested from this subsequent month.
In the study of sick animals, Sick controls were defined as high-risk status patients
(ASA grade 3-5, Appendix 2.1) that did not die within 48 hours of anaesthesia. Sick
patients ranged from animals with severe disease limiting activity but not
incapacitating, to patients moribund and not expected to live. The overall study controls
randomly selected from the cohort as described above, were included as Sick controls if
they were classified as sick (i.e. ASA grade 3-5). Additional sick controls were
prospectively randomly selected from the cohort of sick dogs and cats anaesthetised
during the study period to make up an overall 1:1 case to control ratio. The
randomisation process for the additional Sick controls was undertaken in a similar
manner as described above, with the clinic number, day and operation of the day
identified. The distribution of the sick caseload was assumed to be similar to the overall
study caseload across the clinics in the randomisation process. Practices were then
contacted and the specified Sick patient was requested for a given date prior to the
request date. The Sick controls could serve as a control for more than one anaesthetic
episode, but could not serve as a further control for the same episode. A case could
serve as a Sick control for all prior anaesthetic episodes.
Rabbit controls were matched to the case by clinic and proximity of time to the case, at
a 1:1 case to control ratio. The most recent rabbit non-fatality anaesthetised at the same
centre prior to the case was elected as the control unless it was anaesthetised more than
two months before the case. If the latter, the most recent rabbit after the case was
chosen. Cases could serve as controls for anaesthetic episodes prior to the episode

66
that ended in death (as long as the patient died at least 48 hours after the anaesthetic
selected as a control) and rabbits could be selected more than once as a control for
separate anaesthetic episodes.
Controls were excluded from the analysis if they died or were euthanased within 48
hours of termination of the procedure. Sick controls were additionally excluded if they
were classified preoperatively by the centre as risk-status ASA 1 to 2 but still submitted
as sick controls by the centre or if they were classified by the centre as ASA 3-5 but
subsequently reclassified as ASA 1-2 by the author after discussion with the centre.
Cases and controls were excluded from the analysis if a substantial percentage of data
were not recorded (e.g. drugs used uncertain and recovery times not known). Data from
the one centre outside the UK were excluded from the analysis. Data recorded during
the pilot study were included in the overall statistical analysis.
2.7.3 Survey of Practice Characteristics
A questionnaire of practice characteristics was completed by all centres. This
questionnaire (Appendix 2.7) evaluated the characteristics of the practice, the number of
vets and nurses undertaking small animal work, the anticipated weekly workload, the
experience of the personnel and their routine anaesthetic management of small animals.
It also investigated the centres’ perceptions of their risk of anaesthetic-related mortality
and allowed cross-checking of data recorded in the case-control questionnaire. This
survey was undertaken as face-to-face interviews by the primary investigator at the
participating centre, except where geographical or time considerations made it difficult
to attend the centre. In these latter cases the form was posted to the centres and was self-
administered. Of 118 centres that participated, 1 was excluded (see results), 73 were
visited (62% of non-excluded centres) and 44 were not visited (38%).
2.8 Recruitment, Training and Retention of Centres
Interested practices and referral centres were invited to join the study. The study was
publicised by publishing letters and short articles in the veterinary press, explaining the
nature of the study, the likely workload for individual clinics, the benefits to the
participating centres and requesting volunteers to take part. Oral presentations were

67
undertaken at a number of veterinary meetings around the country to encourage
recruitment. Additionally, after the pilot study, all 72 registered veterinary hospitals
recorded on an electronic database (Royal College of Veterinary Surgeons Practice
Directory, electronic version), were written to, requesting further volunteers, followed
by a telephone call to discuss potential participation, and 49 took part in the study
(68%). The study sought and received scientific endorsement from the Association of
Veterinary Anaesthetists, the British Small Animal Veterinary Association and the
British Veterinary Hospital Association. The endorsements raised the profile of the
study and aided recruitment of clinics.
Recruited centres were sent a practice file including all data-collection tools. All clinics
were identified by a unique four-digit code only and anonymity of data was assured.
The primary investigator visited or rang all centres soon after delivery of the file to
explain the study method, answer queries and establish primary and secondary contacts
within the centre. A follow-up call was undertaken approximately one month later to
check progress and answer further questions. Thereafter, ongoing training and contact
with the centres was regularly maintained with communication by telephone, post,
email and fax. All returned data were individually acknowledged and specific queries
were addressed and errors or omissions in the returned data were discussed with the
centres. Most centres were visited during the study, except for those centres where
geographical distance made a visit difficult (73 of 118 centres were visited, 62%). At
these visits further training and data validation were undertaken by discussing further
questions the centres had with the study, checking data queries and by comparing the
study’s recorded caseload with that recorded in the practices operations book or other
records when available. The survey of the practice facilities, personnel and anaesthetic
drugs used was undertaken at these visits.
Regular feedback of information in the form of study updates was undertaken on a six-
monthly basis to aid retention of centres. Biscuits were sent out with these updates to
acknowledge the centres commitment to the study, maintain enthusiasm for the study
and the quality of the data recorded.

68
2.9 Data collection tool design
Data were recorded on paper-based questionnaires. These questionnaires were pre-
tested on four veterinary surgeons and one nurses in practice and at veterinary
institutions prior to the study. Veterinary epidemiologists Kristien Verheyen, James
Wood at the Animal Health Trust and Dirk Pfeiffer at the Royal Veterinary College also
evaluated them at this time. They were then tested in the pilot study and minor
modifications were made prior to continuing with the main study (Schlesselman 1982).
The final questionnaires were then professionally formatted and printed on yellow paper
to aid data collection (Salant and Dillman 1994; Dohoo, Martin et al. 2003)(Appendices
2.2 and 2.3).
2.9.1 Cohort Study Diary.
The Diary format (‘CEPSAF Diary’) was designed to record efficiently the required
information. Data for individual animals were recorded on one-line entries. The unique
four-digit clinic code was recorded by the primary investigator in the top right of each
diary page prior to delivery to the clinic, and a page number box was placed at the top
of each page to allow centres to record the sheet number. Instructions directing clinics
to complete the one-line entry for all anaesthetics and sedations undertaken at the centre
in all small animal species during the study period were printed at the top of each page.
Instructions relating to each field of the diary sheet, including the case definition, were
printed on the reverse of the form. The address and facsimile number, to which the
forms were to be returned to, were included on each sheet.
Following the findings in the pilot study, a case-control questionnaire was requested for
all potential cases in other small animal species (i.e. ‘exotics’), if they satisfied the case
definition. A short description of the reason for death or euthanasia was also requested
for each anaesthetic or sedation that died (or was euthanased within 48 hours), to aid the
investigators’ verification that case-control questionnaires had been completed for all
possible cases. An additional box was added to the form at this stage to allow practices
operating at more than one centre to indicate which branch was submitting the diary
forms. This allowed the identification of the branch when randomising controls. A small
number of centres completed the dairy in an electronic format, after an initial period of

69
completing both the paper and electronic version. The parallel recording of both paper
and electronic versions allowed comparison to the electronic format.
2.9.2 Case-Control Study
Instructions pertaining to the completion of the form and the definition of a case were
printed on the front page. The unique clinic number was recorded by the primary
investigator prior to delivery to the centre on the front page and remained the only
method of identifying the centre returning the form. The importance of anonymity of
the data returned was emphasised.
The case-control questionnaire was designed to record detailed information relating to
all aspects of the selected anaesthetic or sedation. Questions were grouped logically in
sections relating to the patient’s characteristics and preoperative evaluation, the
procedure intended, the anaesthetic management (including postoperative care) and
monitoring of the patient, information on the personnel involved in the procedure, and
for deaths the details of the timing and nature of the fatality. Questions generally took a
closed format with only specified responses permitted. This allowed efficient coding
and categorization of responses (Schlesselman 1982; Dohoo, Martin et al. 2003). Open-
ended questions were reserved for continuous data (e.g. weight or age) and where
further explanatory comments were invited. The latter had the advantage of allowing a
greater depth of information being recorded (Dohoo, Martin et al. 2003) and were
primarily used to clarify or corroborate issues (e.g. if anaesthetic related or not, patient
health status). A semi-open format was applied in some questions to allow uncommon
responses to be recorded and to invite respondents to volunteer further information
(Dohoo, Martin et al. 2003).
Subsequent to the pilot study some questions were modified or removed and
additionally a few questions were added. The format of the questionnaire was reduced
from 12 A4 pages to 8 A4 pages and was bound as two double-sided A3 pages. The
questionnaire was again professionally formatted after the pilot study and printed on
yellow paper.

70
2.9.3 Practice Survey Questionnaire
The practice survey was designed as a three-page questionnaire. Primarily, closed and
semi-open questions were used. This questionnaire was modified in light of the pilot
study and additional questions were added relating to drugs commonly used.
2.10 Database design
A dedicated relational database was designed (Access 2000, Microsoft). Separate tables
were constructed for each of the three questionnaires (case diary, case-control and
practice survey). Details of the practice address and primary and secondary contacts at
the centre were recorded in a separate table. The tables were linked by the clinic
identification code. An additional table was constructed for the outcome data for less
common exotic species (i.e. not including rabbits, guinea pigs, hamsters or ferrets). For
the case diary data, a record consisted of the individual clinic’s monthly species-specific
numbers of anaesthetics and sedations undertaken, and the corresponding number of
euthanasias and deaths occurring during the month for dogs, cats, rabbits, guinea pigs,
hamsters and ferrets. For all other exotic species the same information was recorded as
species monthly totals. For the case-control questionnaires a record consisted of all data
pertaining to a specific anaesthetic event and was given a unique form number in
addition to the clinic number. Due to the number of explanatory variables in the case-
control dataset, the data were recorded in two linked tables. The two tables were linked
by the practice’s identification number and the individual form number. For the practice
survey, a record consisted of all information recorded in the practice survey and was
identified by the unique practice identification number only.
Database forms were designed for each table and mirrored the appearance of the
respective questionnaires, except for the case diary information in which only the
species-specific monthly totals were recorded. For the practice survey and case-control
questionnaires all question numbers on the database forms corresponded to the
respective form numbers on the questionnaires. Categorical data were displayed as the
descriptive category labels bound to the numerical code. The bound numerical codes
were recorded as the data.

71
2.11 Data validation, checking and cleaning
Upon receipt, all data were checked for inconsistencies, errors and omissions and the
centres were contacted to clarify the data. All data were individually acknowledged by
post and then were entered into the dedicated relational database. Control questionnaires
were entered by students at the Royal Veterinary College and the primary investigator.
These data were checked by the primary investigator, against the respective
questionnaires and corrections were made when necessary. Financial and time
restrictions precluded double entry. A random sample of approximately 20% of entered
case-control questionnaires were checked against the questionnaires and for the cat data,
6 individual errors from 170 forms checked were noted (3.5% of forms had one error of
approximately 150 data fields per form), whilst checks of 100 dog case-control
questionnaires, indicated 5 errors (5%). Validation of data was carried out where
possible by comparing the consistency of related explanatory variables. All cases were
cross-checked to the cohort data, and when deaths were recorded in the cohort but no
case-control questionnaire was submitted, the centre was contacted and a case-control
questionnaire was requested if the death satisfied the case definition. Data omissions in
the cohort that could not be corrected were recorded in the database in a separate field
of the respective monthly clinic record.
Response bias was assessed by recording the non-response rates in cases and controls.
Non-response for case-control questionnaires was evaluated by randomly checking 20%
of the non-returned controls in dogs and cats, against the centre’s records of those
patients with regard to patient health status, age, procedure complexity (major versus
minor) and urgency. These data were compared to the control population’s exposure
histories, to assess the differences between responding and non-responding control
patients. The Student’s t test was used for continuous data and 95% confidence intervals
for the difference in the means were reported (Kirkwood 1988). For categorical data, the
respective proportions were compared with the significance test for two proportions and
confidence intervals for the difference between the proportions were calculated via the
Hauck-Anderson corrected classical procedure for equivalence testing (Kirkwood 1988;
Tu 1997; Christley and Reid 2003).
Comparisons of participating centres to UK practices as a whole were made by
comparing a number of key indicators provided by the RCVS man-power surveys,

72
with data recorded in this study. This allowed comparisons to be made as to the
comparability of participating practices to UK practices as a whole.
2.12 Statistical Methods
The risk of anaesthetic-related death for each species was calculated by dividing the
number of cases by the total number of anaesthetic and sedation events recorded in the
cohort. The risk was expressed as the percent risk, and the 95% confidence intervals
(CI) were estimated as described by Kirkwood (1988).
95% CI = p ± (z)(S.E.)
S.E. = √ (p(1-p)/n)
where the standard error was abbreviated by S.E., p the mortality risk, n the sample size,
and z’ the appropriate percentage point of the standard normal distribution (z’≈1.96 for
the 95% CI). When the conditions that np and n(1-p) were greater than or equal to 10
were not met, exact confidence intervals were calculated (Kirkwood 1988).
The risk of anaesthetic-related death reported for each health status strata was estimated
as it was not possible to calculate it from the data (health status was not recorded in the
cohort). The denominator number of anaesthetic events for ‘Healthy’ and ‘Sick’ patients
were estimated by multiplying the proportion of randomly selected controls with the
respective health status (from the case-control study), by the total denominator number
of anaesthetic and sedation events. The numerator numbers of healthy and sick cases
were then divided by these respective denominator estimates of healthy and sick
anaesthetic events to give health status specific risks.
All statistical calculations were performed with STATA software (Intercooled Stata
version 7.0, Statacorp). Descriptive statistics were reported for practice, patient,
procedure, personnel, and anaesthetic management characteristics. The characteristics
of the population at risk were reported based on the randomly selected dog and cat case-
control data and the data provided from the practice surveys. These data were expressed
as the proportion of controls or clinics with the explanatory factor respectively and their
95% confidence intervals were calculated, as above. Additionally, descriptive data in

73
the cases, relating to the circumstances and characteristics of death, were recorded and
their 95% confidence intervals were calculated as described above. The randomly
selected dog and cat controls were compared to the cohort by their proportion of
anaesthetics versus sedations. This provided an indication of the controls’
representitiveness of the population from which they were selected. The respective
proportions were compared with the significance test for two proportions and
confidence intervals for the difference between the proportions were calculated via the
Hauck-Anderson corrected classical procedure for equivalence testing (Kirkwood 1988;
Tu 1997; Christley and Reid 2003).
Univariable analysis, to determine the association of each variable with the odds of
anaesthetic-related death, was undertaken and crude odds ratios (OR) and 95%
confidence intervals (CI) were calculated (Schlesselman 1982). The odds of an event
represents the number of events divided by the number of non-events, such that the
numerator is not included in the denominator (Dohoo, Martin et al. 2003). For example
the odds of disease would be the number with the disease divided by the number
without the disease. The odds ratio (OR) of disease is the odds of disease in the exposed
group divided by the odds of disease in the unexposed group. Alternatively, the odds of
exposure can be measured and it represents the odds of being exposed to a factor in the
diseased group divided by the odds of exposure in the non-diseased group.
Mathematically these are equal, though in a case-control study only the latter is
generally measurable (Schlesselman 1982). An OR =1 indicates the odds are the same
in the exposed and the unexposed groups (or diseased and non-diseased groups), an OR
> 1 suggests the odds are greater in the exposed group and an OR < 1 indicates the odds
are lower in the exposed group.
For categorical variables, the chi-squared test was applied for an approximate test of the
null hypothesis of no association and the 95% confidence intervals were calculated
using the standard errors obtained from the square root of the variance of the score
statistic (Schlesselman 1982; Hosmer and Lemeshow 2000). When the total in the
respective 2 x 2 table was less than 20 or when it was between 20 and 40 and the
smallest of the expected values was less than 5, Fisher’s exact test was applied and
exact 95% confidence intervals were reported (Schlesselman 1982; Kirkwood 1988). If
the total number were greater than 40 the chi-squared test was applied regardless of

74
the smallest expected value (Kirkwood 1988). Additionally, for larger tables (multiple
category variables), the likelihood ratio test P value was calculated for the variable,
comparing the model with the variable included to that with only the dependent
outcome variable (Hosmer and Lemeshow 2000). When appropriate for multiple
category variables, the odds ratio for a one category increase in odds was calculated (a
one degree of freedom test for trend, ‘trend’) (Hosmer and Lemeshow 2000).
For the comparison of two means (i.e. between cases and controls) for continuous data,
the t test was used if the data followed a normal distribution and the non-parametric
Mann Whitney U test was used for non-normal data (Kirkwood 1988). Continuous
variables were additionally categorised into quintiles and these quintiles were collapsed
and odds ratios calculated, when exploring the data in the univariable analysis.
Exploratory stratification and Mantel-Haenszel adjusted odds ratios were calculated for
preliminary evaluation of confounding and interactions (Breslow and Day 1980). Risk
factors significant at the 20% level, and biologically plausible variables, were taken
forward for further evaluation in the multivariable analysis. A multivariable logistic
regression model was then built and the contribution of explanatory variables to the
model was assessed in a manual forward stepwise selection technique (Hosmer and
Lemeshow 2000). The model construction was undertaken in light of a conceptual
framework constructed a priori (Figure 2.1). Variables were retained in the model if the
variable significantly reduced residual deviance, and improved model fit as assessed by
the likelihood ratio test (LRT P < 0.05).

75
Figure 2.1 Conceptual Framework for Risk Factors for Anaesthetic-Related Death
OU
TCO
ME
Anaesthetic-
related death / euthanasia
Cerebral
perfusion failure / hypoxia
Respiratory
failure
Cardiovascular
failure
Hypotherm
ia
Renal
failure Liver failure
Relative
anaesthetic overdose
Fluid therapy
Airw
ay m
anagement
Ventilation
Anaesthetic
managem
ent M
onitoring Separate person
Monitoring
used
Personnel experience
Procedure
Duration
Urgency
Procedural factors
Anaesthetic
agents
Breed
Age W
eight
Health
status
Patient w
orkup
PatientFactors
Stabilisation
Hum
anError

76
The multiple logistic regression model was given by the following equations as
described by Hosmer and Lemeshow (2000), where g(x) represents the logit of the
multiple logistic regression model, π(x) the corresponding logistic regression model, x1
– xp represent the independent variables, and β0 to βp the coefficients:
g(x) = β0 +β1x1 + β2x2 + … + βpxp
π(x) = eg(x) / 1 + eg(x)
Clinic was included as a random effect and a final mixed effects logistic regression
model of risk factors for anaesthetic-related death was built as described by the below
equation, where the random effects follow a normal distribution with mean zero and
constant variance (αi ~ N(0, σα2) (Hosmer and Lemeshow 2000). The statistical
significance level was set at 5%.
g(xij, αi, βs) = αi + x’ijβs
The quality of the model fit was assessed using the Hosmer-Lemeshow test statistic and
by evaluating model residuals with the delta beta and delta deviance influence
diagnostic statistics based on the observed covariate patterns (Hosmer and Lemeshow
2000).
For the rabbit dataset a matched analysis was performed. The maximum likelihood
estimates of the odds ratios, conditional on the number of discordant pairs, were
calculated for the risk factors (Schlesselman 1982). McNemar’s chi-squared test was
applied to test the association and 95% confidence intervals were calculated (Kirkwood
1988). A multivariable conditional logistic regression model was built (Breslow and
Day 1980). Model fit was assessed by breaking the matching and evaluating the
unconditional model fit as described above (Dohoo, Martin et al. 2003).

77
2.13 Discussion
The use of a nested case-control study approach was an efficient method for evaluating
a rare disease, such as anaesthetic death, whilst allowing the estimation of incidence risk
(Hennekens and Buring 1987). However, there were some limitations to this approach.
2.13.1 Cohort Study
The underlying prospective cohort allowed estimation of the risk of anaesthetic-related
death. This was an efficient approach for a rare disease, however the critical issue for
the cohort remained insuring complete as possible, comparable and unbiased assessment
of outcome of all patients (Hennekens and Buring 1987). Classification of sedation
versus anaesthesia was appropriate to veterinary anaesthesia but contrasts to human
definitions in which sedation represents the retained ability of verbal response, this
should be acknowledged when comparing to human work. The losses to follow-up were
minimised in the design by reducing the follow-up period to 48 hours after anaesthesia,
a period of follow-up likely to be identified for all patients by participating centres.
Longer periods such as 7 days, as used in the equine prospective study (Johnston,
Eastment et al. 2002; Johnston, Eastment et al. 2004), were considered likely to increase
losses to follow-up (Hennekens and Buring 1987). This concern was considered more
important that the loss of a small number of anaesthetic-related deaths occurring after
48 hours. Consequently, risk factors identified in the case-control study represented
factors associated with anaesthetic-related death that occurred within 48 hours of
anaesthesia. The losses to follow-up in the study were reduced by ensuring enthusiasm
in participants throughout the study with constant contact, regular updates and biscuits.
2.13.2 Case-Control Study
Case definition and selection were important considerations in evaluating the limitations
of this study (Hennekens and Buring 1987). The use of a simple and clear case
definition and the appointment of an independent review panel to classify all dog and
cat cases against a set criteria, were undertaken to increase consistency of case
classification (Appendix 2.4). The controls were intended to represent the population of
individuals that would have been identified and classified as cases had they developed
the outcome (Hennekens and Buring 1987; Dohoo, Martin et al. 2003). Given the

78
population from which the cases were derived was known (i.e. the cohort), random
selection of the controls across the cohort should have provided representative controls.
Matched controls for the rabbit case-control study may have been less representative of
the underlying population of rabbits at risk, but were undertaken to increase efficiency
of administration.
Selection bias is a major concern for case-control studies (Hennekens and Buring 1987;
Dohoo, Martin et al. 2003). Random selection of the controls across the cohort of
anaesthetised patients should have minimised the differential selection of controls based
on their exposure histories (Breslow and Day 1980; Dohoo, Martin et al. 2003). The
minor tendency to controls being collected later in the study compared to cases
(Appendix 2.6) could have biased the results, particularly if anaesthetic patient
management changed across the practices over the study period. However, given the
relatively short study time (2 years) and the fact that this was only a minor tendency,
would suggest the likely degree of bias was small. The matching process of rabbit
control selection was also unlikely to encourage selection bias as the exposure histories
would not have influenced selection other than for the matching variables, and
individual centres could not influence patient selection. Issues of non-response were an
important consideration, and efforts to ensure a high response rate for cases and controls
were undertaken. The recording of the return of the forms, checking with centres if
case-control forms were not returned when requested, and re-randomising these forms
to the same clinic later in the study period if they were still not returned were all
undertaken to increase the response rate. The response rate in the cases was good at
approximately 95% in both dogs and cats, whilst the 80% response rate in the dog and
cat controls and the rabbit cases and controls was lower but still reasonably good
(Dohoo, Martin et al. 2003). The checks on the non-returned controls were undertaken
to compare the non-responders to the returned controls (Dohoo, Martin et al. 2003) and
the patients appeared similar based on the variables recorded. The use of the
equivalence testing approach with confidence intervals stated for the differences in
proportions, in addition to significance testing, allowed clearer assessment of the
differences between the non-returned and the returned controls, particularly where no
differences were observed (Tu 1997; Christley and Reid 2003).

79
Information or observation bias, particularly errors of misclassification, was a further
potential concern (Breslow and Day 1980; Dohoo, Martin et al. 2003). Misclassification
of exposure histories by the clinics was minimised by data checking the case-control
questionnaires against anaesthetic record forms when available, and by assessing the
plausibility of the data. Data entry errors were minimised by checking the data twice
and randomly checking 20% of the entered data again. In these random checks less than
5% of the cases and controls had an error. Misclassification of the outcome was reduced
by appointing the independent review panel to assess the potential cases, against a
specific criteria list (Appendix 2.4). Recall bias was minimised by requesting the
controls soon after the anaesthetic was undertaken, such that both case and control
questionnaires would have been completed in the immediate days after the event whilst
still fresh in the minds of those completing the questionnaires (Hennekens and Buring
1987; Dohoo, Martin et al. 2003). Hence efforts to minimise misclassification were
made, and if they occurred the likelihood was that they were primarily non-differential
in nature and at worse biased the measured odds towards unity (i.e. underestimate
associations).
The issue of missing data in the case-control study was a concern (Breslow and Day
1980; Katz 1999). Efforts were made at the study conduct stage to minimised missing
data, but some data remained unknown and at the univariable level, separate categories
for unknown values were created for categorical variables, allowing inclusion of this
data and assessment of potential associations of the unknown categories with outcome
(Katz 1999). In the multivariable model building process, independent variables with
large numbers of missing values were only considered in the multivariable analysis if of
major biological importance. For some variables, the approach of value estimation was
employed (Katz 1999), when the actual value was unknown but a specific category was
confidently estimated (e.g. age in cats). Finally, the final multivariable models were
reported with the number of missing values stated (Breslow and Day 1980;
Schlesselman 1982; Katz 1999).
The logistic regression and the conditional logistic regression approaches were efficient
methods of assessing multiple explanatory variables and adjusting for confounding and
effect modification (Dohoo, Martin et al. 2003). Preliminary univariable assessment and
exploratory stratification allowed increased understanding of the data and helped

80
identify a rational approach to the subsequent process of building the multivariable
model (Hosmer and Lemeshow 2000). Methods of assessing model fit included
goodness-of fit tests and residual diagnostics though in the matched study in rabbits
model assessment was more difficult (Hosmer and Lemeshow 2000). The Hosmer-
Lemeshow goodness-of-fit test statistic is a useful test for assessing model fit, though it
is reported to have a low sensitivity, and Hosmer and Lemeshow (2000) recommend
combining this test with diagnostic statistics that assess model fit and influence of
individual observations. These methods were employed and the fit of models were
reported. Further validation of the models, could also have been performed. External
methods of model validation are important to models predicting prognosis or diagnosis
of disease but are less relevant for studies identifying prognostic factors associated with
an outcome whilst adjusting for confounders, such as the current study, and hence were
not undertaken (Katz 1999; Dohoo, Martin et al. 2003).
In summary, the nested case-control study was an efficient method to assess
anaesthetic-related death. Issues of selection bias related to non-response were a
particular concern of this method, but were minimised in the study design and
quantified in the data collection period. The logistic regression approach was a powerful
method of analysis for these datasets of moderate size and allowed a comprehensive
evaluation of major risk factors for anaesthetic-related death.

81
Chapter 3: Practice Characteristics and Anaesthetic Management
3.1 Introduction
Anaesthetic drugs available for small animals in the UK have changed over the last
twenty years since the last UK study (Clarke and Hall 1990). Work in other countries
(Wagner and Hellyer 2000; Nicholson and Watson 2001) suggests anaesthesia in
veterinary practice has followed suit, this has not been established in the UK. The aims
of this chapter were to describe the cohort in terms of the type of practices and the
facilities available, the patient management routinely undertaken, the anaesthetic agents
commonly used and the perceived risks of anaesthetic-related death.
3.2 Materials and Methods
A 3-page questionnaire was developed and tested (Appendix 2.7, Chapter 2). This was
administered to all participating centres during the study period. Practices that were
visited had the questionnaire administered face-to-face by the primary investigator to
the organising contact at the centre. All other centres received a postal version of the
same questionnaire and this was followed up by a telephone interview if the posted
version was not returned. Follow up checks where data were missing were undertaken
by telephone. All data were entered into a relational database (Access 2000, Microsoft)
and then exported to statistical software (Stata 7.0, Statacorp) to allow descriptive
statistics to be compiled. Mean and standard deviations were reported unless the data
appeared non-normally distributed, as assessed by graphical methods, and then median
and interquartile ranges were reported (Kirkwood 1988). When assessing the number of
centres using specific factors the number of centres and percentage of participating
centres was reported. Estimated yearly species-specific caseloads were based on the
estimated weekly totals multiplied by 52. Confidence intervals were calculated for
proportions as described by Kirkwood (1988).
3.3 Results
One hundred and eighteen centres participated in the study, and one centre was
excluded that was outside the UK. All centres completed a practice survey. Seventy-
three completed the questionnaire through a face-to-face interview with the contact

82
veterinary surgeon or nurse (62% of non-excluded centres), and 44 completed the
questionnaire by self-administration (38%). Centres in the UK were predominately
located in England (Figure 3.1), but included practices from Jersey to Aberdeen, five of
the six UK veterinary schools, and one other referral institution (the Animal Health
Trust).
Figure 3.1 Distribution of practices in the UK
a. CEPSAF Study population b. RCVS distribution of UK
practices (RCVS 2004)
3.3.1 Practice Characteristics
Eighty-three practices (71%) were described as small animal practices and at least
approximately 95% of their work, based on veterinary surgeon time, was small animal
work. There were 28 practices (24%) that were classified as mixed, undertaking small
animal, equine and farm animal work, and there were a further 6 centres (5%) termed
veterinary schools or veterinary institutions. The practices were additionally

83
classified as RCVS hospitals (see www.rcvs.org.uk) for 44 centres (38% of all centres),
and BSAVA standard practices (see www.bsava.org.uk) for 17 practices (14%). The
median percentage of first opinion work as opposed to referral work was 99%
(interquartile range 95-100%), whilst the majority of veterinary institutions undertook
less than 25% first opinion work (Table 3.1).
Table 3.1 The amount of first opinion work by centre
* Veterinary institution includes veterinary schools and one veterinary referral institution.
The majority of practices had between 3 and 6 veterinary surgeons undertaking small
animal work with a median of 4 (range 1-42), whilst veterinary institutions had a
median of 23 (range 13-42 veterinary surgeons, Table 3.2). Of these veterinary centres,
67 (57%) had no general certificate holders (i.e. RCVS certificate in subjects other than
anaesthesia), 23 (20%) of the centres had one general certificate holder, 21 (18%) had 2-
4 certificates and 6 had 5 or more (5%, i.e. the veterinary institutions). Six practices had
a diploma holder (i.e. RCVS diploma in subjects other than anaesthesia, 5%) and 2 (2%)
had three to four diploma holders, all veterinary institutions had more than four diploma
holders. Nine practices (8%) had one or two certificate holder in veterinary anaesthesia
and five practices (4%) had a diploma holder in veterinary anaesthesia, whilst all
veterinary institutions had certificate and diploma holders in veterinary anaesthesia. The
veterinary centres had a median of three qualified veterinary nurse (interquartile range
1- 5) and a median of three training or non-qualified nurses (interquartile range 2- 4)
undertaking small animal work.
Percent First
Opinion
Small Animal Mixed Practice Veterinary
Institution*
Total**
(% of total)
0- 24 % 1 0 5 6 (5%)
25 – 49 % 1 0 0 1 (1%)
50 – 74% 5 0 1 6 (5%)
75 – 100% 76 28 0 104 (89%)
Total 83 28 6 117
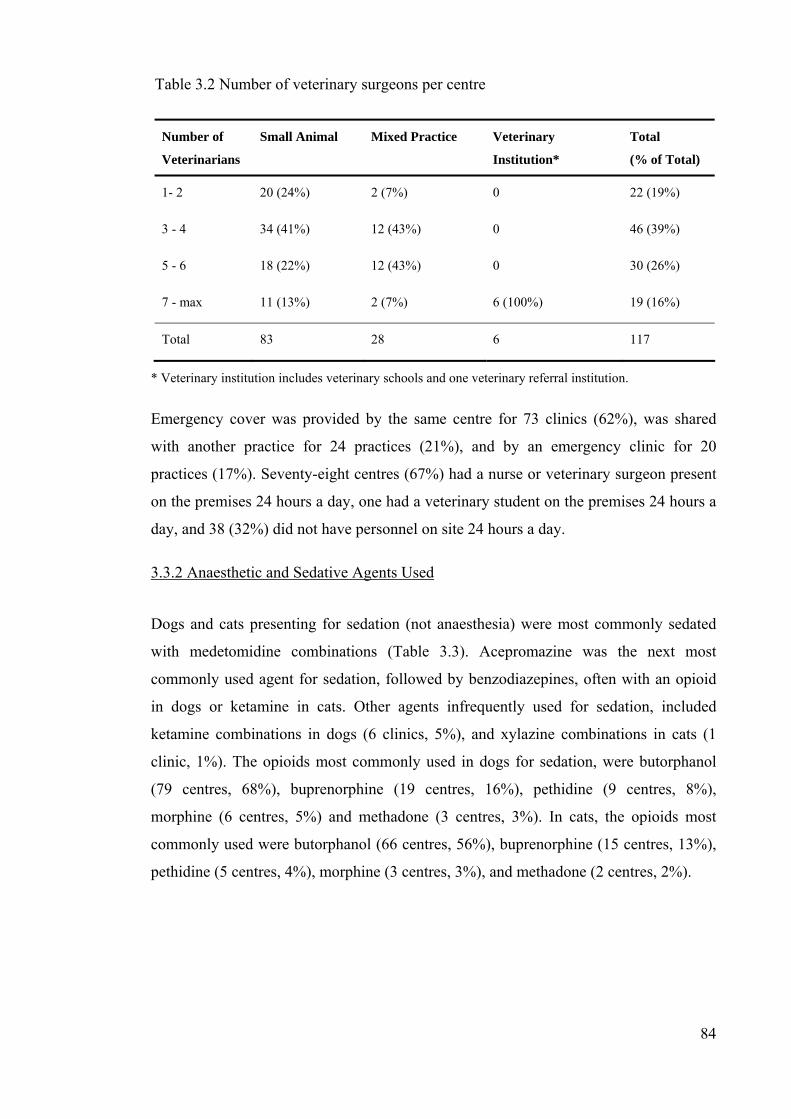
84
Table 3.2 Number of veterinary surgeons per centre
* Veterinary institution includes veterinary schools and one veterinary referral institution.
Emergency cover was provided by the same centre for 73 clinics (62%), was shared
with another practice for 24 practices (21%), and by an emergency clinic for 20
practices (17%). Seventy-eight centres (67%) had a nurse or veterinary surgeon present
on the premises 24 hours a day, one had a veterinary student on the premises 24 hours a
day, and 38 (32%) did not have personnel on site 24 hours a day.
3.3.2 Anaesthetic and Sedative Agents Used
Dogs and cats presenting for sedation (not anaesthesia) were most commonly sedated
with medetomidine combinations (Table 3.3). Acepromazine was the next most
commonly used agent for sedation, followed by benzodiazepines, often with an opioid
in dogs or ketamine in cats. Other agents infrequently used for sedation, included
ketamine combinations in dogs (6 clinics, 5%), and xylazine combinations in cats (1
clinic, 1%). The opioids most commonly used in dogs for sedation, were butorphanol
(79 centres, 68%), buprenorphine (19 centres, 16%), pethidine (9 centres, 8%),
morphine (6 centres, 5%) and methadone (3 centres, 3%). In cats, the opioids most
commonly used were butorphanol (66 centres, 56%), buprenorphine (15 centres, 13%),
pethidine (5 centres, 4%), morphine (3 centres, 3%), and methadone (2 centres, 2%).
Number of
Veterinarians
Small Animal Mixed Practice Veterinary
Institution*
Total
(% of Total)
1- 2 20 (24%) 2 (7%) 0 22 (19%)
3 - 4 34 (41%) 12 (43%) 0 46 (39%)
5 - 6 18 (22%) 12 (43%) 0 30 (26%)
7 - max 11 (13%) 2 (7%) 6 (100%) 19 (16%)
Total 83 28 6 117

85
Table 3.3 Sedation agents commonly used in dogs and cats
* Drug combinations are not mutually exclusive, number of centres and percent of 117.
Premedication of patients prior to anaesthesia was generally undertaken with
acepromazine combinations in dogs and cats (Table 3.4). Over 90% of centres regularly
used acepromazine for premedication in dogs and cats. This was followed by
medetomidine and benzodiazepines in both species. Four centres did not routinely
premedicate cats prior to anaesthesia. Eight centres regularly used atropine as a
premedication in cats (7%). The opioid most commonly used at premedication in dogs
was buprenorphine (70 centres, 60%), but butorphanol (25 centres, 21%), pethidine (23
centres, 20%), morphine (15 centres, 13%) and methadone (7 centres, 6%) were also
used. Similar use of opioids was observed in cats at premedication, with 65 centres
regularly using buprenorphine (56%), 22 butorphanol (19%), 18 pethidine (15%), 10
morphine (9%), and 5 methadone (4%).
Table 3.4 Premedication agents commonly used in dogs and cats
* Drug combinations are not mutually exclusive. Number of centres and percent of 117.
Sedation combinations* Dogs Cats
Acepromazine combinations 44 (38%) 30 (26%)
Medetomidine combinations 98 (84%) 93 (79%)
Benzodiazepine / opioid combinations 6 (5%) 25 (22%)
Other sedatives 6 (5%) 1 (1%)
Premedication combinations* Dogs Cats
Acepromazine combinations 114 (97%) 99 (85%)
Medetomidine combinations 10 (9%) 18 (15%)
Benzodiazepine combinations 3 (3%) 4 (3%)
Xylazine combinations 0 2 (2%)
None 0 4 (3%)

86
Anaesthesia was most often induced with propofol in dogs and cats (Table 3.5). The
next most commonly used agents were thiopentone in dogs and ketamine, thiopentone
and Saffan in cats. Of those centres that regularly used propofol, 67 (of 113 centres
regularly using propofol, 59%) used it in over 75% of their canine anaesthetics and 58
(of 102 centres, 57%) used it in over 75% of their feline patients. In contrast, only 13
centres (of 55 centres, 24%) and 5 centres (of 28, 18%) that regularly used thiopentone,
used it in over 75% of their canine and feline patients respectively.
Maintenance of anaesthesia was primarily undertaken with isoflurane in both dogs and
cats. One hundred and twelve centres (96%) used isoflurane regularly in dogs, and 114
centres (97%) in cats. Only 25 and 24 centres (21%) used halothane regularly in dogs
and cats respectively. Eight centres (7% of centres) used sevoflurane in dogs and cats.
Nitrous oxide was infrequently used in dogs and cats (32 clinics, 27%). Dogs were
intubated at all centres, principally with cuffed endotracheal tubes. Cats were intubated
regularly by 116 centres (99%), of which 44% of centres used cuffed endotracheal
tubes, 25% used uncuffed tubes, and 26% used both cuffed and uncuffed tubes (4% of
centres used tubes but did not specify if cuffed or uncuffed and for 1 centre it was not
clear if they intubated cats).
Table 3.5 Induction agents commonly used in dogs and cats
* Drug combinations are not mutually exclusive, number of centres and percent of 117.
Rabbits generally were anaesthetised with medetomidine and ketamine combinations or
Hypnorm (a combination of fentanyl and fluanisone) (Table 3.6). Two centres did not
anaesthetise rabbits. Most centres primarily used one or the other of the two
Induction agents used* Dogs Cats
Propofol 113 (97%) 102 (87%)
Thiopentone 55 (47%) 28 (24%)
Ketamine combinations 2 (2%) 35 (30%)
Saffan 0 20 (17%)
Medetomidine (without ketamine) 2 (2%) 0
Mask induction 4 (3%) 7 (6%)

87
combinations, though 14 (12%) used both combinations regularly. Other combinations
used for induction of anaesthesia included mask inductions, xylazine and ketamine,
propofol (1 centre) and Saffan (1 centre). Maintenance of anaesthesia was with the
injectable combinations or inhalation agents. Isoflurane was regularly used by 104
centres (89%), halothane by 7 (6%) and sevoflurane by 6 centres (5%). Sixty centres
(51%) indicated they intubated rabbits, and 47 centres (40%) did not intubate rabbits
(10 centres did not give this information).
Table 3.6 Injectable anaesthetic agents commonly used in rabbits
* Drug combinations are not mutually exclusive, number of centres and percent of 117.
Anaesthetic circuits commonly used included the Circle, used regularly by 88 centres
(75%), the T piece (102 centres, 87%), the Lack (55 centres, 47%) and the Bain (40
centres, 34%). The Magill was used regularly by 21 clinics (18%) and the Humphrey’s
ADE was regularly used by 29 centres (25%). Ventilators were owned by 26 centres
(22%), of which 13 (11%) used them regularly.
3.3.3 Perioperative Patient Management and Monitoring
Preoperative screening blood tests were undertaken in a median of 30% of dogs and cats
at the centres (interquartile range 15-50%), with 62 (52%) centres routinely performing
biochemical tests only, and 46 (39%) centres doing both biochemical and
haematological tests (7 (6%) centres did not specify the tests performed, and one centre
did not undertake preoperative blood tests). Intravenous catheters were routinely used in
dog and cat patients in 33 and 25 centres respectively (28% and 21% respectively).
Eight centres (7%) reported they routinely used intravenous fluids in dogs and cats,
whilst the remainder stated they used them principally for high-risk patients, old
Anaesthetic agents used* No. of Centres
Medetomidine and ketamine 88 (75%)
Hypnorm +/- benzodiazepines 22 (19%)
Mask induction 17 (15%)
Xylazine and ketamine 5 (4%)
Other 2 (2%)

88
patients and when procedures were anticipated to be long. The majority of centres
routinely weighed dogs (115 centres, 98%) and cats (107 centres, 92%). Premedication
and sedation of patients was undertaken by both veterinary nurses and veterinary
surgeons at most clinics, though induction of anaesthesia was performed by only the
veterinary surgeon at 93 centres (79%). Twenty-three centres indicated the veterinary
nurse also induced anaesthesia (20%), and one centre did not specify who induced
anaesthesia.
Monitoring of anaesthesia was generally undertaken by a veterinary nurse, with only 3
centres (3%) routinely having a veterinary surgeon monitor the anaesthetics. Written
records of anaesthesia were routinely undertaken at 49 (42%) clinics, occasionally used
at 51 (43%) and never at 14 (12%) of the centres. Equipment available and used for
routine monitoring of anaesthesia of dogs and cats varied across the centres.
Oesophageal stethoscopes were routinely used to monitor anaesthesia at 96 (82%)
clinics, with only two centres not having one. Pulse oximeters were owned by 93
centres (79%) and 84 (72%) used them routinely. Ninety-five clinics (81%) were able to
monitor a patient’s electrocardiogram, but only 20 (17%) routinely did so. Similarly, 56
centres (48%) had non-invasive arterial blood pressure monitoring facilities but only 23
(20% of all centres) used them regularly. Only 7 centres (6%) monitored direct arterial
blood pressure and only 5 (4%) of these did this regularly. Capnography was available
at 26 centres (22%) of which 24 used it (21%) regularly and 18 (15%) centres indicated
they monitored patient temperature of which 4 did this routinely (3%).
3.3.4 Centres’ Perceptions of Risk and Caseload
The estimated median weekly caseload of anaesthetics and sedations, at the time the
centres completed the questionnaire, was 20 dogs (interquartile range (IQR) 13–30,
range 3-125), 20 cats (IQR 12–30, range 5-80) and 3 exotics patients (IQR 2–5, range 0-
20). In the previous year, practices estimated they had a median of 0 anaesthetic-related
deaths in dogs (IQR 0-1, range 0-10), in cats a median of 0 (IQR 0-1, range 0-10), and
in exotics a median of 0 (IQR 0-2, range 0-8). For those centres that estimated the
number of anaesthetic deaths that occurred over the last year (101 centres), the
perceived caseloads over 1 year (based on their current estimated caseloads) were
143,416 dog, 129,272 cat and 21,424 exotics anaesthetics (Table 3.7). The perceived
number of anaesthetic-related deaths was 90 dogs, 80 cats and 125 exotic patients.

89
These resulted in anaesthetic-related risks of approximately 0.063% in dogs, 0.062% in
cats and 0.58% in exotics.
Table 3.7 Risks of anaesthetic-related death as estimated by the individual centres
3.4 Discussion
The survey of practices highlighted a number of trends in practice anaesthetic
management. There was a broad range of types of practices and number and
qualifications of personnel working in the centres. Anaesthetic drug use was similar
across the practices. Patient monitoring was routinely undertaken but was often
superficial and few centres routinely provided perioperative fluid support. The
perceived risk of anaesthetic-related death was low.
The geographical distribution throughout the UK was similar to that of the overall
density of UK practices (RCVS 2004)(Figure 3.1) with most centres in England. The
size of the cohort reflected a broad range of practice types. One hundred and eleven
practices (excluding the 6 veterinary institutions) represented approximately 5.5% of all
UK practices (based on an estimate of 2000 practices)(RCVS 2000). The 14% of this
study cohort that were classified as BSAVA standard practices was similar to the 12%
of all UK practices (248 of 2000)(BSAVA 2004). However the number of hospitals
involved (37%) was much higher than the approximate 5% of all UK practices (BSAVA
2004), and reflects the decision to actively recruit hospitals to the study (see Chapter 2).
The higher percent of small animal practices (70% of centres), as compared to mixed
practices, compared to the 49% of all UK practices (RCVS 2004) was to be expected
given that this was a study of small animals.
Species Events per Year Number of Deaths Risk (95% Confidence Interval)
Dog 143,416 90 0.063% (0.050 – 0.076%)
Cat 129,272 80 0.062% (0.048 – 0.075%)
Exotics 21,424 125 0.58% (0.48 – 0.69%)

90
The mean number of veterinary surgeons per practice (mean 5.4, median 4) appeared
higher than the mean value of 4.2 for the UK (RCVS 2000), though was similar when
veterinary institutions were excluded (mean 4.2, median 4). The number of RCVS
diploma holders in practice was broadly similar in this cohort to the UK (3% for this
study and for the UK (RCVS 2000)). After excluding veterinary institutions, the number
of veterinary surgeons with a RCVS certificate was however higher than the UK
average: approximately 19% of the cohort had a certificate compared to 7% of UK
veterinary surgeons in practice (RCVS 2000). It is likely this study would attract the
more motivated members of the profession and such a group of professionals would be
more likely to have gained further qualifications. The median number of nurses
(including unqualified nurses) per practice of 5.6 (excluding veterinary institutions) was
comparable to the UK mean of 5.8 per practice (RCVS 2000). On the basis of these
indices of practice size and type, the practices were generally comparable to UK
practices as a whole, although there was a tendency to more veterinary surgeons having
further qualifications in this cohort.
The use of anaesthetic drugs was broadly similar across practices. Sedation was
principally undertaken with medetomidine combinations in dogs and cats.
Medetomidine was not available in the last UK study (Clarke and Hall 1990), though
since its introduction it has become popular due to its consistent and profound dose-
dependent sedation and the presence of a specific antagonist (Cullen 1996). This was
similar to work in the USA where 171 of 333 practices regularly used medetomidine
(Wagner and Hellyer 2000).
Premedication in dogs and cats was primarily undertaken with acepromazine combined
with an opioid. This was similar to trends in international studies (Dyson, Maxie et al.
1998; Joubert 2000; Wagner and Hellyer 2000; Nicholson and Watson 2001), and in
part may reflect the previously reported reduced risk associated with acepromazine
compared particularly to xylazine use (Clarke and Hall 1990; Dyson, Maxie et al.
1998). Cats were more often premedicated in this study than reported in previous
surveys (12 - 30% of practitioners did not routinely premedicate cats in previous
studies, compared to 3% in this study)(Dodman and Lamb 1992; Joubert 2000;
Nicholson and Watson 2001). Alpha2 agonists were the next most common group of
sedatives used for premedication and this was similar to previous reports (Joubert

91
2000; Wagner and Hellyer 2000; Nicholson and Watson 2001). Earlier studies tended to
report greater use of xylazine than the more recently released medetomidine. Opioids
were routinely administered preoperatively in both species by participating clinics. This
is in contrast to work reporting use of analgesics in UK practice in dogs and cats, where
many veterinary surgeons did not routinely used perioperative opioids particularly in
cats (Capner, Lascelles et al. 1999; Lascelles, Capner et al. 1999). That more centres
reported routine use of opioids may reflect changes since these publications (i.e. 5
years) or a more anaesthetic and analgesic aware population of centres taking part in
this current study.
Induction agents used changed substantially since the last UK study (Clarke and Hall
1990). Since this study, propofol was introduced to the UK veterinary market, and now
represents the most commonly used induction agent. The rapid recovery properties and
lack of perivascular irritancy (Hall, Clarke et al. 2001), combined with its increasingly
comparable cost to thiopentone (originally it was much more expensive), have helped
increase its popularity. There has been a perception in veterinary practice that propofol
represents a safer drug than thiopentone, inducing less cardiopulmonary depressant
effects (Wagner, Wright et al. 2003), when experimental evidence suggests similar
effects to thiopentone (Quandt, Robinson et al. 1998). Propofol use in the current study
contrasted to international studies where thiopentone remained more commonly used
than propofol in dogs and Saffan and ketamine / alpha2 agonist combinations in cats
(Dodman and Lamb 1992; Dyson, Maxie et al. 1998; Joubert 2000; Wagner and Hellyer
2000; Nicholson and Watson 2001). Mask inductions were relatively rare. This was
comparable to more recent studies (Joubert 2000; Nicholson and Watson 2001), though
was lower than earlier studies where 10-20% of centres routinely used mask inductions
in dogs and cats (Clarke and Hall 1990; Dodman and Lamb 1992; Dyson, Maxie et al.
1998). The trends away from mask inductions was comparable with other more recent
studies, the increasing use of propofol in dogs and cats was a new trend and may reflect
that previous studies were undertaken 5 years or more ago.
Maintenance of anaesthesia by centres was principally undertaken with isoflurane and
only 20% of centres regularly used halothane in dogs and cats. Sevoflurane has been
recently introduced to UK practice and just less than 10% of centres were now regularly
using it in dogs and cats. This trend was comparable to an American study (Wagner

92
and Hellyer 2000) where isoflurane was the main maintenance inhalation agent, though
was in contrast to other recent studies from Australia and South Africa (Joubert 2000;
Nicholson and Watson 2001) and earlier studies where halothane was the main
inhalation agent used (Clarke and Hall 1990; Dodman and Lamb 1992; Dyson, Maxie et
al. 1998). Endotracheal intubation was routinely performed by nearly all centres in dogs
and cats, and this was in contrast to other recent work where cats were less commonly
intubated (Wagner and Hellyer 2000; Nicholson and Watson 2001). Cats are technically
more difficult to intubate (Hall and Taylor 1994) and previous studies have identified a
higher risk associated with intubation of cats (Clarke and Hall 1990; Dyson, Maxie et
al. 1998). It could be expected some practitioners would be reluctant to intubate cats,
but this was not observed in the present study.
The trend for centres to use one anaesthetic combination exclusively was a particular
feature of rabbit anaesthesia and reflected the limited drugs with market authorisation in
rabbits and possibly a lower level of anaesthetic expertise in this species. Hypnorm was
available in the last UK study but medetomidine with ketamine and isoflurane were not
(Clarke and Hall 1990). Intubation of rabbits was less commonly performed than in
dogs and cats and this reflected the greater technical difficulty in intubating a species
where visualisation of the vocal fold under anesthesia is difficult and the airways are
small (Flecknell 1996).
Anaesthetic circuit use in this study was different to that seen in the last UK study
where the To-and Fro and T Piece circuits were commonly used (Clarke and Hall 1990).
Here the Circle and T piece were commonly used with a smaller number of centres
using other non-rebreathing circuits (i.e. the Bain, Magill, Lack) and the newer
combination circuit, Humphrey’s ADE. This is similar to trends elsewhere (Nicholson
and Watson 2001) and the Circle has become popular for patients over 5-10 kg, because
of its more predictable performance compared to the To-and Fro with greater gas
efficiency compared to non-rebreathing circuits (Hall, Clarke et al. 2001). The use of
lower flow circuits, such as the Circle, has become popular with the introduction of the
more expensive agents isoflurane and sevoflurane.
Preoperative blood testing was generally reserved for patients perceived to be at a
greater anaesthetic risk, though some centres routinely offered preoperative blood tests
to all anaesthetic patients. This was comparable to previous international work
93
(Nicholson and Watson 2001). Intravenous catheters were not routinely placed by most
centres, and though similar to previous work (Wagner and Hellyer 2000), this was cause
for concern as perioperative venous access was not immediately available in most
centres. Similarly, intravenous fluid therapy was not routinely provided. Though for
most patients, anaesthesia was induced by a veterinary surgeon, a number of centres
indicated that nurses also routinely induced anaesthesia. Under the Veterinary Surgeons
Act 1966, anaesthesia is considered an act of veterinary surgery and as such a veterinary
surgeon should supervise the anaesthetic. Hence, though not required for induction of
anaesthesia, a veterinary surgeon should be present for active and continuous
supervision and it remained unclear from the questionnaire if this were the case.
Patient monitoring during anaesthesia was generally undertaken by a dedicated
veterinary nurse, as one recent study also reported (Nicholson and Watson 2001). This
appears an improvement since the last UK study, when 20% of practices did not use a
separate person to monitor the anaesthetics (Clarke and Hall 1990). Written anaesthetic
records were not routinely made by many of the centres, and though it may not have
reduced the standard of care, in an increasingly litigious environment, this may become
a cause for concern. The level of written recording was comparable to one study that
evaluated it (Joubert 2000). General standards of electronic monitoring were limited.
Clinical patient assessment was routinely undertaken by most centres, but other
monitoring devices were less frequently employed. Oesophageal stethoscopes were
commonly used though these give little additional information over clinical patient
assessment. Pulse oximeters were routinely used by many centres, more so than in other
recent reports (Joubert 2000; Wagner and Hellyer 2000; Nicholson and Watson 2001).
However, arterial blood pressure measurement, capnography and electrocardiography
were not regularly used even when a substantial number of centres had these monitors.
The level of use of these additional monitors was similar to that reported elsewhere
(Dyson, Maxie et al. 1998; Joubert 2000; Nicholson and Watson 2001). Temperature
monitoring was infrequently undertaken even though very simple. The standards of
monitoring reported were likely to limit the ability of many practices to detect minor
complications before they become major.
The perceived anaesthetic mortality risk in dogs and cats, i.e. 0.06%, was similar to
other studies employing similar retrospective single questionnaire methodology
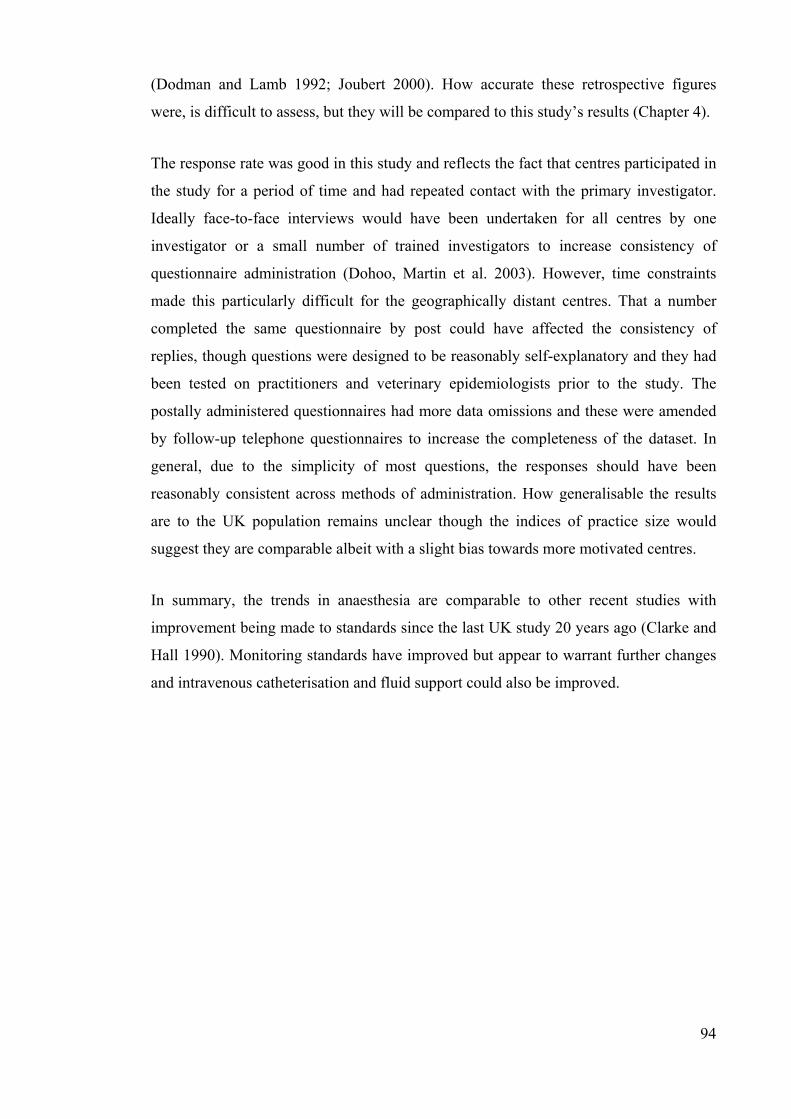
94
(Dodman and Lamb 1992; Joubert 2000). How accurate these retrospective figures
were, is difficult to assess, but they will be compared to this study’s results (Chapter 4).
The response rate was good in this study and reflects the fact that centres participated in
the study for a period of time and had repeated contact with the primary investigator.
Ideally face-to-face interviews would have been undertaken for all centres by one
investigator or a small number of trained investigators to increase consistency of
questionnaire administration (Dohoo, Martin et al. 2003). However, time constraints
made this particularly difficult for the geographically distant centres. That a number
completed the same questionnaire by post could have affected the consistency of
replies, though questions were designed to be reasonably self-explanatory and they had
been tested on practitioners and veterinary epidemiologists prior to the study. The
postally administered questionnaires had more data omissions and these were amended
by follow-up telephone questionnaires to increase the completeness of the dataset. In
general, due to the simplicity of most questions, the responses should have been
reasonably consistent across methods of administration. How generalisable the results
are to the UK population remains unclear though the indices of practice size would
suggest they are comparable albeit with a slight bias towards more motivated centres.
In summary, the trends in anaesthesia are comparable to other recent studies with
improvement being made to standards since the last UK study 20 years ago (Clarke and
Hall 1990). Monitoring standards have improved but appear to warrant further changes
and intravenous catheterisation and fluid support could also be improved.

95
Chapter 4: Risks of Anaesthetic-Related Death in Small Animals
4.1 Introduction
The risks of anaesthetic-related death in small animals have not been quantified in the
UK for 20 years. Approximately 1 in 434 dogs and 1 in 340 cats were reported to die of
anaesthetic-related death in the last UK study (Clarke and Hall 1990). In subsequent
international studies the risk in general practice has been estimated at nearer 1 in 1000
dogs and cats (Dodman and Lamb 1992; Rintasalo and Vainio 1995; Dyson, Maxie et
al. 1998; Joubert 2000). Risks of anaesthetic-related death remain poorly documented
for other small animal species. The aim of this section was to estimate the risk of
anaesthetic-related death in small animal species.
4.2 Materials and Methods:
4.2.1 Case Definition and Study Population
Anaesthetic-related death (a Case) was defined as a perioperative death (including
euthanasia) occurring after premedication and within 48 hours of termination of the
procedure, except where death or euthanasia was due solely to inoperable surgical or
pre-existing medical conditions (Chapter 2). A death was considered a case if
anaesthesia could not be reasonably excluded as a contributory factor. Cases were
identified by the participating centres in the first instance and subsequently by the
investigators from the cohort of anaesthetics recorded by each practice. Deaths recorded
in the cohort, but for which no case-control questionnaire was submitted by the clinic,
were investigated and a case-control questionnaire was requested if the death could be
considered a case. Case-control questionnaires were requested for all potential cases in
all small animal species (dogs, cats and exotics) to allow for estimation of risks of
anaesthetic-related death.
The classification of dog and cat cases was undertaken by an independent review panel.
Potential cases were assessed based on the case definition and a set of documented
criteria (Appendix 2.4) and the cause of death of cases was classified against a further
set of criteria (Appendix 2.5). Case selection and cause of death for other small animal

96
species followed the same procedure as in the dogs and cats, though the primary
investigator classified the cases (Appendix 2.4).
The study population consisted of all small animals anaesthetised and sedated at the
veterinary centres during their participation in the study.
4.2.2 Data Collection Methods
All anaesthetic and sedation events occurring at participating centre were recorded
prospectively as self-administered questionnaires by the centres and returned on a
monthly basis (Appendix 2.2). One line entries were recorded for each patient
anaesthetised or sedated at the participating centres in these case diary forms. The
unique centre code, date of procedure, patient identification number or name, species,
whether it received an anaesthetic or sedation, and outcome at 48 hours (recorded as
alive, dead or euthanased) were recorded for each patient. Brief details of the reason for
death or euthanasia were recorded in the diary for patients that died. Anaesthesia was
defined as chemical restraint, sufficient to allow endotracheal intubation (independent
of whether endotracheal intubation was performed). Sedation was defined as chemical
restraint insufficient to allow endotracheal intubation.
4.2.3 Analysis
Risks for anaesthetic-related death were calculated by species, by dividing the total
number of cases for that species by the total number of patients of the species
anaesthetised. Ninety-five percent confidence intervals were calculated based on the
standard normal distribution, when there were 10 or more cases and non-cases as
described by Kirkwood (1988). When smaller samples were present, exact confidence
intervals, based on the binomial distribution, were calculated (Dohoo, Martin et al.
2003). Differences between risks in dogs, cats and rabbits were compared using the Chi-
squared test followed by a post-hoc normal test to compare two proportions (Kirkwood
1988).
Species-specific clinic-level risks of anaesthetic-related death were additional recorded
and compared by practice type and practice standard. Practice types, derived from the
practice survey (Chapter 2), were classified as small animal practices if they did more
than 95% small animal work based on veterinary surgeons time, mixed if they did

97
95% or less small animal work, and veterinary institution if they were a veterinary
school or non-veterinary school institution (i.e. the Animal Health Trust). Practice
standards were classified by the RCVS hospital and the BSAVA practice standard
schemes (see www.bsava.org.uk and www.rcvs.org.uk), and were categorised as RCVS
Hospital, BSAVA standard, or neither. Veterinary institutions as defined under practice
type were excluded from this second classification due to their differing patient and
procedural populations and differing risks. Clinic-level risks were reported as median
and interquartile ranges and were compared by practice type and practice standard using
the Kruskal Wallis test (Kirkwood 1988).
Species specific risks for healthy (ASA 1-2) and sick (ASA 3-5) patients (see Appendix
2.1) were calculated from the number of cases in each health-status category divided by
the estimated of the number of patients anaesthetised in that health status category. The
number of patients anaesthetised in each health-status stratum was calculated from the
proportion of the controls from the case-control study (see Chapter 2) in the specific
category, multiplied by the total number of anaesthetics and sedations undertaken
during the study period.
Health status risk = Number of Cases in the Health status stratum / (number of patients
anaesthetised) x (number of controls of that health status/total number of controls)
Ninety-five percent confidence intervals were calculated for health status risks based on
the standard normal distribution and within species differences in risk by health status
were compared with the normal test for proportions (1988). Cause of death was reported
for dogs, cats and rabbits and the timing of death as reported on the case-control
questionnaires was documented. Postoperative deaths in dogs, cats and rabbits were
additionally categorised by there time from termination of anaesthesia to death of
euthanasia.
4.3 Results:
One hundred and eighteen centres participated in the study and one centre was excluded
for being outside the UK. Centres participated for a mean duration of 15 months
(standard deviation 6.6 months) with a range of 2 to 25 months. During this time 98,036
dogs, 79,178 cats and 8,209 rabbits were anaesthetised and sedated (Table 4.1). The

98
perioperative mortality risks (all cause) were approximately 0.3% died and 1.5-1.7%
euthanased in dogs and cats, and in rabbits 1.8% died and 2.6% were euthanased (Table
4.1). The risks were significantly greater in rabbits than dogs or cats (P<0.001), and the
risk of euthanasia was greater in cats than dogs (P=0.03). The risk of anaesthetic-related
death was significantly greater in rabbits than cats or dogs and the risk in cats was
significantly higher than in dogs (Dogs 0.17%, Cats 0.24%, Rabbits 1.39%, P<0.001)
(Table 4.2). Risks of anaesthetic-related death for other small animal species were
higher with larger confidence intervals than in dogs and cats and ranged from 0.33% in
ferrets to 16.33% in budgerigars (Table 4.2).
Estimated risks for healthy patients (ASA 1-2) were of 0.05% for dogs, 0.11% for cats
and 0.73% for rabbits (Table 4.3). The risks in sick patients were significantly higher
than in health patients (P<0.0001). Risks for sick patients (ASA 3-5) were 1.33% for
dogs, 1.40% for cats and 7.37% for rabbits.
Median anaesthetic-related risks by practice type in dogs were 0.12% for both small
animal and mixed practices, and 0.31% for veterinary institutions (Table 4.4). In cats,
the median risks were higher than in dogs and were 0.19% for small animal practices,
0.14% for mixed practices, and 0.60% for veterinary institutions. Median risks in
rabbits were 0.79% for small animal practices, 0% for mixed practices, and 3.53% for
veterinary institutions. Median risks for different practice standards in dogs were lowest
for those not classified as a Hospital or BSAVA standard (Table 4.5). In cats, the
median risks were 0.16% for RCVS Hospitals, 0.19% for BSAVA standard, and 0.19%
for practice classified as neither. In rabbits, the risk was higher for practices being
neither Hospital nor BSAVA standard. Within species risks were not significantly
different between practice types or standards.

99
Table 4.1 Risk of death in small animals
* 95% Confidence interval, **Exact 95% Confidence Interval.
Species Number at
Risk
Total
Deaths
Risk of Death
(95% CI)
Total
Euthanased
Risk of Euthanasia
(95% CI)
Dog 98,036 285 0.29% (0.26 – 0.32%)
1,496 1.53% (1.45 – 1.60%)
Cat 79,178 248 0.31% (0.27 – 0.35%)
1,306 1.65% (1.56 – 1.74%)
Rabbit 8,209 146 1.78% (1.49 – 2.06%)
214 2.61% (2.26 – 2.95%)
Guinea Pig 1,288 63 5.13% (3.90 – 6.36%)
65 5.29% (4.04 – 6.55%)
Ferret 600 4 0.67% (0.18 – 1.70%)**
12 2.00% (0.88 – 3.12%)
Hamsters 246 12 4.88% (2.19 – 7.57%)
30 12.20% (8.11 – 16.28%)
Chinchilla 334 11 3.29% (1.38 – 5.21%)
18 5.39% (2.97 – 7.81%)
Rat 398 7 1.76% (0.71 – 3.59%)**
25 6.28% (3.90 – 8.67%)
Other Small Mammals
232 7 3.02% (1.22 – 6.12%)**
20 8.62% (5.01 – 12.23%)
Budgerigar 49 11 22.4% (10.77 - 34.13%)**
3 6.12% (1.28 – 16.87%)**
Parrot 127 5 3.94% (1.29 – 8.95%)**
4 3.15% (0.86 – 7.87%)**
Other Birds 284 10 3.52% (1.38 – 5.66%)
19 6.69% (3.78 – 9.60%)
Reptiles 134 4 2.99% (0.82 – 7.47%)**
6 4.48% (1.66 – 9.49%)**
Other 50 2 4.00% (0.49 – 13.71%)**
3 6.00% (1.26 – 16.55%)**

100
Table 4.2 Anaesthetic-related risk of death in small animals
* 95% confidence intervals (95% CI). **Exact 95% Confidence Interval.
Species Number at Risk
Number of Anaesthetic-Related:
Risk of Anaesthetic related death / euthanasia (95% CI*)
Deaths Euthanased Total Fatalities
Dog 98,036 154 9 163 0.17% (0.14 – 0.19%)
Cat 79,178 179 10 189 0.24% (0.20 – 0.27%)
Rabbit 8,209 111 3 114 1.39% (1.14 – 1.64%)
Guinea Pig 1,288 48 1 49 3.80% (2.76 – 4.85%)
Ferret 601 2 0 2 0.33% (0.04 – 1.20%)**
Hamsters 246 9 0 9 3.66% (1.69 – 6.83%)**
Chinchilla 334 11 0 11 3.29% (1.38 – 5.21%)
Rat 398 7 1 8 2.01% (0.87 – 3.92%)**
Other Small Mammals
232 4 0 4 1.72% (0.47 – 4.36%)**
Budgerigar 49 8 0 8 16.33% (7.32 –29.66%)**
Parrot 127 5 0 5 3.94% (1.29 – 8.95%)**
Other Birds 284 5 0 5 1.76% (0.57 – 4.06%)**
Reptiles 134 2 0 2 1.49% (0.18 – 5.29%)**
Other 50 0 0 0 0% (0 – 7.11%)**

101
Table 4.3 Risk of anaesthetic-related death in healthy and sick dogs, cats and rabbits
*ASA 1-2: no/mild preoperative disease, ASA 3-5: severe preoperative disease. **95% confidence intervals.
Table 4.4 Clinic level risks of anaesthetic-related death by type of veterinary practice
*Median and interquartile ranges. Number of practices reported per stratum.
Species Health status*
Cases Controls (% of total)
Estimated number of Anaesthetics per stratum
Risk of Anaesthetic related death
95% CI**
Dog Healthy ASA 1-2
49 450 (92%) 90,618 0.05 % 0.04 – 0.07 %
Sick ASA 3-5
99 37 (8%) 7,418 1.33 % 1.07 – 1.60 %
Cat Healthy ASA 1-2
81 508 (92%) 72,473 0.11 % 0.09 – 0.14 %
Sick ASA 3-5
94 47 (8%) 6,705 1.40 % 1.12 – 1.68 %
Rabbit Healthy ASA 1-2
56 55 (93%) 7,652 0.73 % 0.54 – 0.93 %
Sick ASA 3-5
41 4 (7%) 557 7.37% 5.20 – 9.54 %
Species Small Animal Practice* (n= 82)
Mixed Practice* (n=28)
Veterinary institution* (n=6)
Dog 0.12% (0 – 0.31%)
0.12% (0 – 0.34%)
0.31% (0.10 – 0.39%)
Cat 0.19% (0 – 0.382%)
0.14% (0 – 0.25%)
0.60% (0.13 – 0.86%)
Rabbit 0.79% (0 – 2.33%)
0 (0 – 2.36%)
3.53% (1.44 – 5.21%)

102
Table 4.5 Clinic level risks of anaesthetic-related death by practice standard
*Median and interquartile ranges. Number of practices are reported per stratum.
Table 4.6 Timing of death in Dogs, Cats and Rabbits
*Postoperative deaths were additionally categorised by time after anaesthesia.
The postoperative period was a particularly common time for dogs, cats and rabbits to
die. Over 60% of cats and rabbits, and nearly 50% of dogs died during this time period
(Table 4.6) and of these postoperative deaths approximately half of the patients died
within 3 hours of termination of the procedure. Cardiovascular and respiratory causes of
death were the most common causes of death in dogs and cats with a substantial
majority being of unknown cause (Table 4.7). In contrast most rabbits died of an
unknown cause, with approximately 40% being of cardio-respiratory causes.
Species RCVS Hospital (n = 43)
BSAVA Standard (n = 17)
Neither (n = 50)
Dog 0.12% (0 – 0.33%)
0.17% (0.11 – 0.34%)
0.08% (0 – 0.31%)
Cat 0.16% (0 – 0.33%) 0.19% (0.12 – 0.32%)
0.19% (0 – 0.38%)
Rabbit 0.63% (0 – 2.73%) 0 (0 – 1.52%)
1.06% (0 – 2.13%)
Timing of Death Dogs Cats Rabbits
After Premedication 1 (1%) 2 (1%) 0
Induction of anaesthesia 9 (6%) 14 (8%) 6 (6%)
Maintenance of anaesthesia 68 (46%) 53 (30%) 29 (30%)
Postoperative death* 70 (47%) 106 (61%) 62 (64%)
0-3 hours postoperative 31 (44%) 66 (62%) 26 (42%)
3-6 hours postoperative 11 (16%) 9 (8%) 7 (11%)
6-12 hours postoperative 12 (17%) 7 (7%) 13 (21%)
12-24 hours postoperative 13 (19%) 12 (11%) 9 (15%)
24-48 hours postoperative 3 (4%) 10 (10%) 3 (5%)
Unknown time 0 2 (2%) 4 (6%)
Total 148 (100%) 175 (100%) 97 (100%)

103
Table 4.7 Primary cause of death in dogs, cats and rabbits
*Number of animals and percent of total. Only cases where a case-control questionnaire was received are included.
4.4 Discussion:
The risk of anaesthetic-related death appears to have substantially decreased from that
reported in the last UK study and are comparable to more recent international studies
(Clarke and Hall 1990; Dodman and Lamb 1992; Rintasalo and Vainio 1995; Dyson,
Maxie et al. 1998; Joubert 2000). Given the relatively highly qualified population of
veterinarians participating in the study compared to the level of qualifications
documented by the RCVS in the UK (RCVS 2000)(Chapter 3), this estimate is likely to
be an overestimate of the risk in the UK. From a comparisons perspective however this
is likely to have been the case in the other studies reported, that is the most motivated
practices and potentially the safest, participate in such studies. Both high-risk (ASA 3-
5) and low-risk (ASA 1-2) patient risks have approximately halved over the twenty
years since the last UK study. Case definition for healthy patients (ASA 1-2) in the last
UK study was similar to that described in the current study with deaths classified as
cases if the underlying disease / surgery could not explain the death, whilst in sick
patients (ASA 3-5) all deaths were included (Clarke and Hall 1990). The results in
healthy patients would be most comparable, whilst the risks in sick patients would be
expected to be higher in the last study independent of major improvements in the
standard of anaesthesia. The reduction in risk, particularly in healthy patients suggests
changes in anaesthetic practice have resulted in improved safety of small animal
anaesthesia. Since the last UK study, drugs such as isoflurane and medetomidine have
Cause of Death Dogs* Cats* Rabbits*
Cardio-Respiratory cause 109 (74%) 126 (72%) 38 (39%)
Neurological cause 7 (5%) 8 (5%) 2 (2%)
Renal 1 (1%) 6 (3%) 0
Unknown 31 (21%) 35 (20%) 57 (59%)
Total 148 (100%) 175 (100%) 97 (100%)

104
been introduced. Monitoring has improved and electronic monitors are more readily
available (Wagner and Hellyer 2000; Nicholson and Watson 2001).
The risks reported were slightly higher than those described in recent international
practice-based studies (Dodman and Lamb 1992; Rintasalo and Vainio 1995; Dyson,
Maxie et al. 1998; Joubert 2000), though only in one of these studies was the definition
of death stated or the percent healthy and sick patients within the study population
reported (Dyson, Maxie et al. 1998). The definition was based on occurrence of
perioperative cardiac arrest and was likely to represent only a proportion of anaesthetic-
related perioperative deaths. The other studies were retrospective studies based on
practitioners’ recall of events over the previous 1 to 2 years, often with poor written
documentation and without clear guidelines for the definition of anaesthetic death, and
were more likely to underestimate the risk of death. All studies were based on smaller
sample sizes and were likely to have larger confidence intervals. Hence, given the limits
in these international studies’ methodologies, the results suggest the standards of
anaesthesia are comparable to international work.
In contrast, the risk of anaesthetic–related death in human anaesthesia consistently
appears much lower. Studies evaluating deaths where anaesthesia played a contributory
role, but was not the sole cause, were most comparable in terms of case definition and
the risk documented was approximately 0.02 to 0.005% (Tikkanen and Hovi-Viander
1995; Eagle and Davis 1997; Suan, Perez-Torres et al. 1997; Biboulet, Aubus et al.
2001; Kawashima, Seo et al. 2001). That there should be such a difference was likely to
reflect differences in standards of anaesthesia in human and veterinary anaesthesia more
than species differences. Anaesthetist expertise and resources available in the medical
setting are significantly greater than that routinely available in veterinary practice. Thus
though standards have improved, there is substantial scope for further improvements.
Sick patients had a substantially higher risk of anaesthetic-death compared to healthy
patients, as previous work reported (Clarke and Hall 1990; Dyson, Maxie et al. 1998),
suggesting this group of patients remain a particular concern. Risks of greater than 1%
in the ASA 3-5 patients highlight a population of patients in which small improvements
could substantially reduce the risk of death. Risk factors associated with anaesthetic-
related death in this group will be addressed in chapters 6 and 7. Comparing overall
risks of death by species, the risks appeared to have reduced by a similar degree in

105
both dogs and cats, but not as dramatically as seen when reported by ASA status. This
reflected changes in patient status of the population anaesthetised, with a trend to more
sick patients being anaesthetised in the present study compared to the last UK study.
Clarke and Hall (1990) reported approximately 4% of dogs and cats anaesthetised were
ASA 3-5, whereas in the current study 8 to 9% of patients were higher risk (based on
the proportion of controls being ASA 3-5, Table 2).
It is interesting to note the significant increased anaesthetic-related death risk reported
in cats compared to dogs, particularly in lower risk patients (ASA 1-2). This agrees with
the results of Clarke and Hall (1990) and Hosgood and Scholl (1998; 2002), but
contrasts with work by Dodman and Lamb (1992) and Dyson and Pettifer (1997). These
latter studies had smaller sample sizes and the lack of difference may have due to
limited power of the studies to detect inter-species differences or to population
differences. That apparently healthy cats (ASA 1-2) had a two-fold higher risk of death
than healthy dogs, would suggest either preoperative assessment is poorer and more cats
are misclassified as healthy when harbouring significant disease, or cats are at a greater
risk of anaesthetic-related death. Recent work reported a prevalence of at least 7% of
sub-clinical cardiac disease in apparently healthy cats (Cote, Manning et al. 2004), and
if genuinely higher than that seen in dogs, undetected cardiac disease could contribute to
the higher risk. Cats are reported to be prone to postoperative renal failure (Hall and
Taylor 1994), and though the 48 hour postoperative follow up may have missed some of
these cases, this species sensitivity also may have contributed to the higher risk. Cats
are smaller than dogs in general and hence would be more prone to hypothermia,
predisposing to prolonged recoveries and increased morbidity (Waterman 1981; Dhupa
1995; Kurz, Sessler et al. 1996). The reduced size might also predispose to overdosing
of anaesthetics administered, particularly if patients were not weighed.
Endotracheal intubation has been associated with increased risk of death in cats but not
dogs (Clarke and Hall 1990; Dyson, Maxie et al. 1998). It is technically more difficult
and laryngospasm more likely in cats than dogs, predisposing to perioperative
complications (Hall and Taylor 1994). Postoperative deaths were more common in cats
than dogs (60% of deaths compared to 47% in dogs, Chapters 6 and 7), and some of
these could have been related to difficult intubations and laryngeal swelling. Clarke and

106
Hall (1990) found that cats were also more likely to die postoperatively and suggested
airway problems contributed.
The risks of other small animal species have been poorly documented and it is alarming
to note the high risk of perioperative death reported in this study. Rabbits were the third
most commonly anaesthetised species, and the risk of death was approximately 7 times
greater than that reported for dogs (Table 1 and 2). With more than 8,000 rabbits being
anaesthetised or sedated during the study and more than a hundred deaths, high risk can
not be attributed to large confidence intervals and uncertainty of risk. Rabbits can
exhibit stress on induction of anaesthesia, have a high surface-area to volume ratio
predisposing to perioperative hypothermia, and have a predilection to preoperative
diseases involving respiratory, digestive and fluid balance disorders (Delong and
Manning 1994; Aeschbacher 1995; Flecknell 1996). A significant number of rabbits
presenting for anaesthesia have been reported to carry pasteurella multocida respiratory
disease (Flecknell 1996). They have fewer easily accessible veins for venous
catheterisation and endotracheal intubation is more technically demanding than in dogs
and cats (Wixson 1994; Aeschbacher 1995). Combined with a perceived increased
sensitivity to the respiratory depressant effects of anaesthetics and a narrow therapeutic
index for many of the anaesthetic agents (Aeschbacher 1995), a higher risk of
anaesthetic death could be anticipated. There are no other large-scale studies of
anaesthetic death risks to compare to, hence it is difficult to say if there has been
improvement in the anaesthesia of rabbits over the last twenty years. However, it is
clear there is scope for substantial reductions in mortality. Chapter 5 will investigate
major risk factors for anaesthetic death in rabbits to aid identification of modifiable
factors and reduce risk.
Mortality risks in other small animal species were generally higher again than those
reported in rabbits. Only overall anaesthetic-related mortality risks were calculated, as
no data on the denominator health status of the patients anaesthetised were available to
allow estimates of ASA stratum-specific risks. Birds appeared to be at particular risk as
were small mammals such as hamsters, chinchillas and mice. It is likely that small body
size contributes to these high risks, with all these species having high surface area to
volume ratios, again predisposing to hypothermia during anaesthesia (Flecknell 1996).
Additionally, they generally have high metabolic rates and would be prone to

107
perioperative hypoglycaemia until they resumed eating postoperatively (Flecknell
1996). Due to their small size, they were less commonly endotracheally intubated and
maintaining a patent airway and adequate ventilation would be more difficult. Only a
small number of each species were anaesthetised, and the relative inexperience of
veterinary surgeons with anaesthetising these patients was likely to have contributed to
the high perioperative mortality risks.
Clinic-based risks, as reported for practice type, were generally similar within species
for dogs and cats. The notable exceptions were the risks reported for veterinary
institutions, which were at least twice as high as those reported for small animal and
mixed practices. This was consistent with previous work in which the risk of
anaesthetic-related death in referral centres was much higher than that of practice based
centres (Hosgood and Scholl 1998; Gaynor, Dunlop et al. 1999; Hosgood and Scholl
2002; Brodbelt, Hammond et al. 2005). Veterinary institutions generally have a higher
risk population to anaesthetise and are undertaking longer and more complicated
procedures on these patients. Hence, the risks of 0.31% in dogs and 0.60% in cats found
in this study are comparable to international studies from veterinary schools (Gaynor,
Dunlop et al. 1999; Brodbelt, Hammond et al. 2005). Risks based on the practice
standard when excluding veterinary institutions, were again comparable between RCVS
hospitals, BSAVA practices and other veterinary practices, suggesting that standards of
anaesthesia were comparable across classifications. These risks however were
unadjusted for other factors, and clinic level risks will be evaluated further within the
multivariable model of risk factors in dogs and cats (Chapters 6 and 7).
Given that the data were collected prospectively within a large-scale multi-centre
cohort, it is likely the overall risks reported for dogs, cats and rabbits were
representative of the population studied. The health-status stratum-specific risks
reported for dogs, cats and rabbits could only be estimated. Based the proportion of
each health status group in the control population derived from the case-control study,
these estimates were dependent on accurate reflection of the control population by the
controls selected. The ASA 3-5 risks were inherently less precise than the ASA 1-2
risks, as a small error in the proportion of controls estimated would have had a large
effect on the relatively small denominator of sick patients anaesthetised. In contrast, the
low risks for the ASA 1-2 group would be only minimally affected by errors in the

108
estimates of the proportion of healthy patients being anaesthetised, as the denominator
would be little affected by small errors in the proportion of healthy controls. Further, in
both dog and cat case-control studies (Chapters 6 and 7), approximately 500 controls
were randomly selected for both species, representing approximately 0.5% and 0.7% of
the anaesthetised population for the dogs and cats. Hence assuming an unbiased
selection of the controls, these estimates are likely to be reasonably reflective of the
populations anaesthetised.
The ASA specific risks in rabbits were more preliminary in nature, as these were based
on 59 controls and were not randomly selected from the study population, but matched
to the cases by clinic and proximity of time (Chapter 5). Hence these risks should be
interpreted with caution. The risks for other small animals were also estimates only, due
to the relatively small sizes and large confidence intervals. Nonetheless the estimates
remain invaluable as there is no other data available for these species.
It is interesting to observe the large proportion of dogs, cats and rabbits that died
postoperatively, representing 50-60% of patients. This is in contrast to previous work in
which nearer 40% of dogs and cats died postoperatively (Clarke and Hall 1990) and
highlights the importance of the postoperative period as a risk period perioperatively.
Further that nearly 50% of these postoperative deaths occurred within 3 hours of
termination of anaesthesia, this suggests that if closer monitoring and management of
patients in this early postoperative period were instituted, then risks could be reduced.
That many causes of death were documented as primarily cardiovascular or of
respiratory origin was not surprising, given the importance of these two systems to
patient homeostasis. The large percentage of unknown cause is of interest however. The
lack of definite cause reflects the level of monitoring used during and after anaesthesia,
such that precise precipitating events may not be detected and patients are not observed
continuously postoperatively. Further the lack of post-mortem evidence (<10% of
patients had a post-mortem), also would preclude the classification of death in some
cases. The greater percent of unknown cause in rabbits would reiterate the above
comments and suggest monitoring of this species might be even less comprehensive
than in dogs and cats.
In conclusion, the risks of anaesthetic-related death appear to have decreased in dogs
and cats over the last twenty years in the UK and are comparable to other risks

109
reported internationally. Sick patients remain particularly at risk of perioperative death
and should be targeted for improvements in anaesthetic management. Cats, rabbits and
other small animal species appear at greater risk of anaesthetic-related death than dogs
and particular attention to these species could reduce mortality substantially. The
postoperative period was particularly high risk and patient monitoring and management
during this period should be targeted to reduce risk.

110
Chapter 5: Risk Factors for Anaesthetic-Related Death in Rabbits
5.1 Introduction
The risks associated with anaesthetic mortality have been poorly documented in rabbits
(Chapter 1). The risk of anaesthetic-related death was much greater in rabbits compared
to dogs and cats in the current study (Chapter 4). Identifying major risk factors
associated with anaesthetic-related death and improving anaesthetic management of this
species could reduce the risk of death significantly. Hence, the aim of this part of the
study was to identify risk factors associated with anaesthetic-related death in rabbits.
5.2 Materials and Methods
Nested within the cohort study (see Chapter 2), a matched case-control study was
undertaken to identify risk factors associated with anaesthetic-related death for rabbits
anaesthetised between the 1st of January 2003 and the 31st December 2003. A case was
defined as a perioperative death (including euthanasia) occurring after premedication
and within 48 hours of termination of the procedure, except where death was due solely
to inoperable surgical or pre-existing medical conditions. A death was considered a case
if anaesthesia could not be reasonably excluded as a contributory factor.
Controls were matched by clinic and proximity of time to the case at a 1:1 case - control
ratio. The most recent non-death (‘control’) at the same centre, prior to the case, was
identified from the CEPSAF diary by the primary investigator and a CEPSAF case-
control questionnaire was requested. If no non-deaths were recorded on the CEPSAF
diary in the preceding two months then the most recent non-death subsequent to the
case was selected at that centre. Rabbits that died or were euthanased within 48 hours of
anaesthesia or sedation were excluded from being considered as controls.
A priori hypotheses for major risk factors were identified. Based on work in other
domestic animals it was hypothesised increasing age, poor patient health status, the use
of alpha2 adrenoceptor agonists, mask induction, increasing operation time, increasing
procedural complexity and dorsal recumbency would be associated with increased risk
of anaesthetic-related death (Clarke and Hall 1990; Dyson, Maxie et al. 1998; Hosgood
and Scholl 1998; Johnston, Eastment et al. 2002). Further, it was hypothesised that

111
the use of isoflurane, the presence of a separate person monitoring the anaesthetic
(relative to the person undertaking the procedure), and increasing personnel anaesthetic
expertise would be associated with reduced risk of anaesthetic-related death.
Descriptive statistics were recorded for common characteristics of the controls.
Univariable analysis of the data was undertaken to determine the association of each
variable with the odds of anaesthetic-related death. Intended duration was calculated for
intraoperative deaths when no procedure was performed, based on the duration of the
same procedure category as described in Table 5.4. For categorical data, maximum
likelihood estimates of odds ratios and their 95% confidence intervals, conditional on
the number of discordant pairs, were calculated (Breslow and Day 1980; Schlesselman
1982; Hosmer and Lemeshow 2000). McNemar’s chi-squared test was applied to test
the statistical significance of the association. An exact test based on the binomial
distribution was applied when appropriate (Breslow and Day 1980; Kirkwood 1988).
For continuous variables, the paired Student’s t test or Wilcoxon Signed Rank test, were
applied depending on the distributional characteristics (Kirkwood 1988). Biologically
important factors and variables significant at the 20% level were retained for evaluation
in the multivariable model. Conditional logistic regression was then used and the
contribution of these explanatory variables to the model was assessed (Hosmer and
Lemeshow 2000). Statistically significant variables (p<0.05), based on the likelihood
ratio test statistic, were retained in the conditional logistic regression model using a
forward stepwise selection approach (Dohoo, Martin et al. 2003). The likelihood ratio
test statistic was elected over the Wald test statistic due to its reported more consistent
performance particularly with small sample sizes (Hauck and Donner 1977; Hosmer and
Lemeshow 2000; Dohoo, Martin et al. 2003). Linearity of continuous variables was
assessed by categorising variables into quartiles and quintiles and evaluating the effect
on odds for incremental increases in the variable (Dohoo, Martin et al. 2003).
Interactions of potential biological importance, of the statistically significant main
effects, were assessed in the final model (Hosmer and Lemeshow 2000). To explore the
model further, an unconditional logistic regression was applied with the pairing variable
retained as a random effect, and residual diagnostics and the Hosmer-Lemeshow
goodness-of –fit test were used to crudely evaluate the model fit (Hosmer and
Lemeshow 2000; Dohoo, Martin et al. 2003).

112
5.3 Results
Eighty-eight anaesthetic-related deaths were recorded during 2003. Of these, 70 (80%)
case-control questionnaires were returned during the data collection period of this case-
control study and matched controls were requested from the same clinic. Sixty control
forms (86% of controls requested) were returned, and one was excluded due to
insufficient information being recorded on the case-control questionnaire. This resulted
in 59 pairs of cases and controls being taken forward for the case-control analysis.
Thirty-five of 117 clinics were represented in this case-control study.
5.3.1 Descriptive Data for Rabbits
Five percent of the cases died on induction of anaesthesia, 31% during maintenance and
64% died postoperatively, of which 50% of the postoperative deaths occurred within 3
hours of anaesthesia (Table 5.1). The primary cause of the anaesthetic-related deaths
was classified as cardio-respiratory causes in 35% of the cases, neurological causes in
2% and of unknown origin in 63% (Table 5.2). Of the cardiopulmonary deaths, 10%
occurred on induction, 48% occurred during anaesthesia, and 42% postoperatively,
whilst 75% of unknown causes occurred postoperatively and 25% on induction or
during anaesthesia (Table 5.2).
Table 5.1 Timing of death of the Rabbits
*Postoperative deaths were additionally categorised by time after anaesthesia.
Timing of Death Number of Cases
Induction of anaesthesia 3 (5%)
Maintenance of anaesthesia 18 (31%)
Postoperative death* 38 (64%)
0-3 hours postoperative 19 (50% of postoperative deaths)
3-6 hours postoperative 4 (11% of postoperative deaths)
6-12 hours postoperative 6 (15% of postoperative deaths)
12-24 hours postoperative 5 (13% of postoperative deaths)
24-48 hours postoperative 4 (11% of postoperative deaths)
Total 59

113
Table 5.2 Primary cause and timing of death in Rabbits
*Number of animals and percent of total.
A number of breeds were represented in the cases and controls, including Rex, Dutch
breed and various Lops (Table 5.3). The rabbits presented for various procedures, with
dental surgery and castration being the most common operations, followed by
ovariohysterectomy, minor procedures (e.g. dematting, abscess lancing, and
radiography) and least commonly, other major procedures (e.g. bladder stone removal)
(Table 5.4). There was a tendency for the cases to present for more complex procedures.
Table 5.3 Rabbit Breeds
*Number of animals and percent of total.
Timing of Death
Cause of Death Induction Maintenance Postoperatively Total*
Neurological cause 0 0 1 1 (2%)
Cardio-Respiratory cause
2 10 9 21 (35%)
Unknown 1 8 28 37 (63%)
Total 3 18 38 59
Variable Cases* Controls*
Rex 1 (2%) 2 (3%)
Dwarf 4 (7%) 7 (12%)
Lop 9 (15%) 16 (27%)
Lionhead 2 (3%) 0
Dutch 7 (12%) 4 (7%)
English 3 (5%) 0
Other 33 (56%) 30 (51%)
Total 59 (100%) 59 (100%)
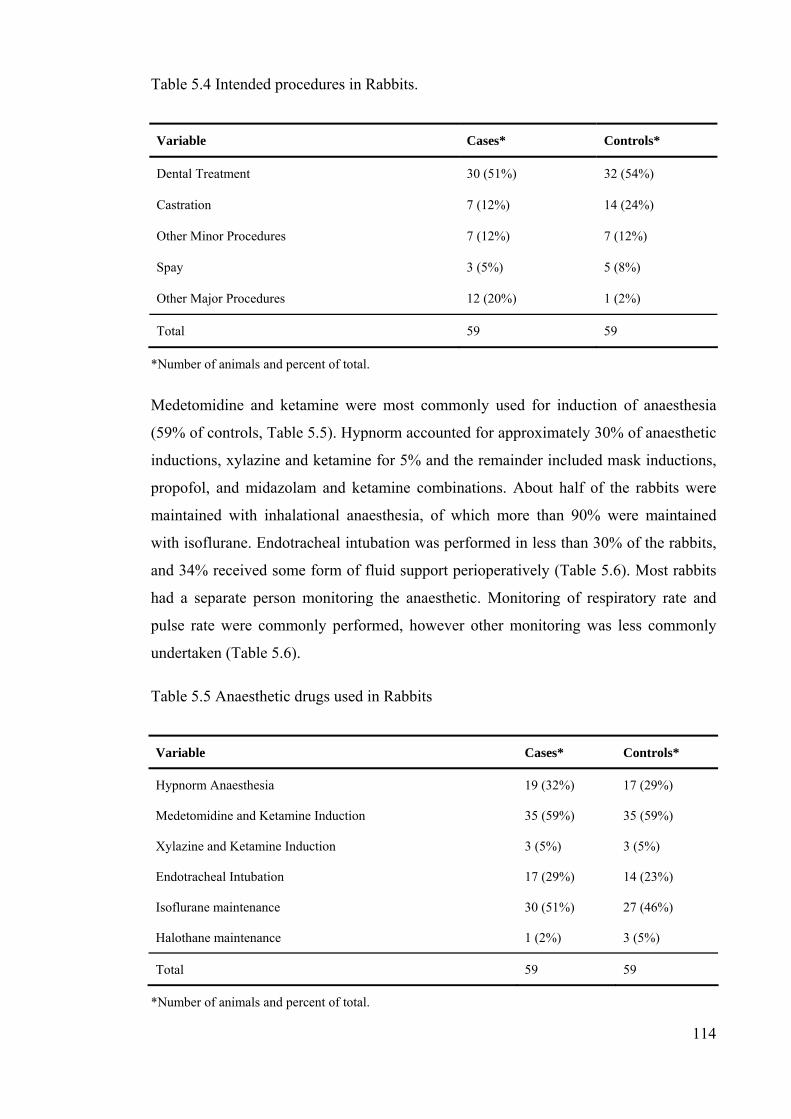
114
Table 5.4 Intended procedures in Rabbits.
*Number of animals and percent of total.
Medetomidine and ketamine were most commonly used for induction of anaesthesia
(59% of controls, Table 5.5). Hypnorm accounted for approximately 30% of anaesthetic
inductions, xylazine and ketamine for 5% and the remainder included mask inductions,
propofol, and midazolam and ketamine combinations. About half of the rabbits were
maintained with inhalational anaesthesia, of which more than 90% were maintained
with isoflurane. Endotracheal intubation was performed in less than 30% of the rabbits,
and 34% received some form of fluid support perioperatively (Table 5.6). Most rabbits
had a separate person monitoring the anaesthetic. Monitoring of respiratory rate and
pulse rate were commonly performed, however other monitoring was less commonly
undertaken (Table 5.6).
Table 5.5 Anaesthetic drugs used in Rabbits
*Number of animals and percent of total.
Variable Cases* Controls*
Dental Treatment 30 (51%) 32 (54%)
Castration 7 (12%) 14 (24%)
Other Minor Procedures 7 (12%) 7 (12%)
Spay 3 (5%) 5 (8%)
Other Major Procedures 12 (20%) 1 (2%)
Total 59 59
Variable Cases* Controls*
Hypnorm Anaesthesia 19 (32%) 17 (29%)
Medetomidine and Ketamine Induction 35 (59%) 35 (59%)
Xylazine and Ketamine Induction 3 (5%) 3 (5%)
Endotracheal Intubation 17 (29%) 14 (23%)
Isoflurane maintenance 30 (51%) 27 (46%)
Halothane maintenance 1 (2%) 3 (5%)
Total 59 59

115
Table 5.6 Patient management in Rabbits
* Number of patients and percent of total number of cases or controls. ** Postoperative deaths only (38 cases).
5.3.2 Univariable Analysis
The unadjusted associations between risk factors and the risk of anaesthetic-related
death, expressed as the conditional odds ratios (Table 5.7a-c), identified increasing
patient risk status, increasing urgency of the procedure, longer intended anaesthetic
duration, later induction times, and longer procedures with increased odds of
anaesthetic-related death. Administration of carprofen was associated with reduced
odds. This association was not significant tendency (p=0.10) when only postoperative
cases were considered (Table 5.7b).
There were no significant differences in the odds of an anaesthetic-related death
associated with the main recumbency of the patient, or the induction and maintenance
anaesthetic agents used. There were insufficient discordant pairs to assess the odds
associated with the monitoring person and the anaesthetist’s postgraduate qualifications.
Additionally, comparing deaths occurring during versus after anaesthesia, there were
similar numbers of patients receiving the two most common anaesthetic induction
combinations, Hypnorm and medetomidine with ketamine. Of the Hypnorm cases, 9
(48%) died during and 10 postoperatively (52%) compared to 11 (31%) during and 24
(69%) postoperatively of the medetomidine and ketamine cases.
Variable Cases* Controls*
Perioperative fluid therapy 27 (46%) 20 (34%)
Separate person monitoring the anaesthetic 56 (95%) 57 (97%)
Pulse rate monitored 44 (75%) 42 (71%)
Respiratory rate monitored 57 (97%) 56 (96%)
Pulse Oximeter used 21 (36%) 16 (27%)
Recovery continuously monitored 13 (34%) ** 16 (27%)
Recovery intermittently monitored (every 5- 15 minutes) 18 (47%) ** 41 (70%)
Recovery not monitored / not known 7 (19%) ** 1 (3%)
Total 59 59

116
Table 5.7.a The association of patient and procedural variables with anaesthetic-related
death in Rabbits
* Odds ratios (OR) and 95% confidence intervals (CI). Numbers in cases and controls represent the number of patients in each category. ** Duration of anaesthesia for cases that died during anaesthesia is based on the duration of similar procedures in the control population.
Variable Categories Cases Controls OR* 95% CI* P value
Age in Years Mean (sd)
3.3 (2.0) 3.2 (2.1) 0.77
Sex Male Female Unknown
34 24 1
38 20 1
1 1.6
0.7 – 3.6
0.30
Neutered Entire Neutered Unknown
41 12 6
42 9 8
1 1.3
0.5 – 3.5
0.62
Weight in Kg Mean (sd)
2.4 (1.0) 2.3 (0.7) 0.33
Overweight Not overweight Overweight Unknown
50 4 5
50 3 6
1 1.3
0.3 – 6.0
0.70
ASA grade ASA 1-2 ASA 3-5
37 22
55 4
1 10.0
2.3 – 42.8
<0.001
Urgency Scheduled Emergency / Urgent
26 33
41 18
1 3.5
1.4 – 8.7
0.004
Intended Procedure
Minor Major
44 15
53 6
1 4.0
1.2 – 14.2
0.02
Procedure Difficulty
Simple Difficult / ModerateNo Procedure
22 29 8
32 27 0
1 2.4
0.8 – 6.8
0.09
Recumbency
Dorsal Lateral Sternal Multiple
17 8 21 13
20 5 28 6
1 5.0 0.5 5.0
0.6 – 42.8 0.2 – 1.5 0.6 – 42.8
0.10 0.20 0.11
Induction Time
9 am - 12 pm 12 pm - 9 pm Unknown
38 21 0
47 11 1
1 3.5
1.2 – 10.6
0.02
Duration in minutes Mean (sd)
40.3 (35.0) 32.0 (18.4) 0.11
Duration Intended**
0 – 29 min 30 - max
13 46
23 36
1 3.0
1.1 – 8.3
0.03
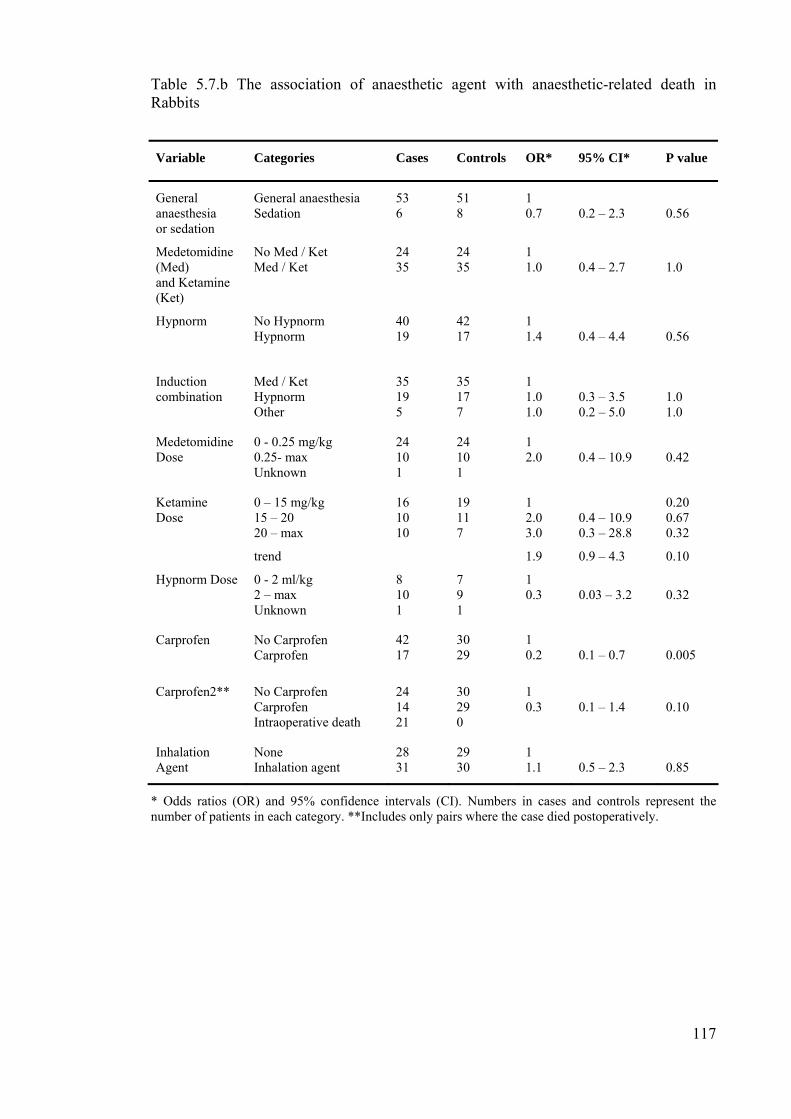
117
Table 5.7.b The association of anaesthetic agent with anaesthetic-related death in Rabbits
* Odds ratios (OR) and 95% confidence intervals (CI). Numbers in cases and controls represent the number of patients in each category. **Includes only pairs where the case died postoperatively.
Variable Categories Cases Controls OR* 95% CI* P value
General anaesthesia or sedation
General anaesthesia Sedation
53 6
51 8
1 0.7
0.2 – 2.3
0.56
Medetomidine (Med) and Ketamine (Ket)
No Med / Ket Med / Ket
24 35
24 35
1 1.0
0.4 – 2.7
1.0
Hypnorm No Hypnorm Hypnorm
40 19
42 17
1 1.4
0.4 – 4.4
0.56
Induction combination
Med / Ket Hypnorm Other
35 19 5
35 17 7
1 1.0 1.0
0.3 – 3.5 0.2 – 5.0
1.0 1.0
Medetomidine Dose
0 - 0.25 mg/kg 0.25- max Unknown
24 10 1
24 10 1
1 2.0
0.4 – 10.9
0.42
Ketamine Dose
0 – 15 mg/kg 15 – 20 20 – max
trend
16 10 10
19 11 7
1 2.0 3.0
1.9
0.4 – 10.9 0.3 – 28.8
0.9 – 4.3
0.20 0.67 0.32
0.10
Hypnorm Dose 0 - 2 ml/kg 2 – max Unknown
8 10 1
7 9 1
1 0.3
0.03 – 3.2
0.32
Carprofen No Carprofen Carprofen
42 17
30 29
1 0.2
0.1 – 0.7
0.005
Carprofen2** No Carprofen Carprofen Intraoperative death
24 14 21
30 29 0
1 0.3
0.1 – 1.4
0.10
Inhalation Agent
None Inhalation agent
28 31
29 30
1 1.1
0.5 – 2.3
0.85

118
Table 5.7.c The association of anaesthetic management with anaesthetic-related death in
Rabbits
* Odds ratios (OR) and 95% confidence intervals (CI). Numbers in cases and controls represent the number of patients in each category.
Variable Categories Cases Controls OR* 95% CI* P value
Mask Induction No mask induction Mask induction Injectable anaesthesia
11 20 28
7 23 29
1 1.0
0.2 – 5.0
1.00
Endotracheal Intubation (ET)
No ET intubation ET intubation Unknown
42 17 0
44 14 1
1 1.4
0.5 – 3.8
0.47
Oxygen No Oxygen Oxygen Unknown
11 48 0
14 44 1
1 2.3
0.6 – 9.0
0.21
Perioperative fluids No fluids fluids Unknown
32 27 0
37 20 2
1 1.8
0.7 – 4.2
0.21
Record of Anaesthesia No record Record Unknown
46 13 0
50 7 2
1 2.3
0.1 – 7.3
0.17
Other duties of monitor
No other duties Assisting the op Performing the op
43 13 3
42 15 2
1 0.8 --
0.3 – 2.0 --
0.45 0.64 --
Pulse oximeter used No Pulseox Pulseox
38 21
43 16
1 1.8
0.7 – 5.0
0.22
Recovery Quality Good Poor or moderate Unknown Intraoperative death
11 16 11 21
37 16 6 0
1 2.3
0.7 – 7.3
0.17
Recovery Location Kennel Not Kennel Unknown Intraoperative death
21 13 4 21
38 21 0 0
1 3.0
0.6 – 14.9
0.16
Surgeon Familiarity with Anaesthetic used
Unfamiliar / familiar Very familiar Unknown
14 43 2
9 49 1
1 0.4
0.1 – 1.1
0.07
Surgeon Postgraduate Qualifications
None Post Qualification
52 7
48 11
1 0.3
0.1 – 1.7
0.16
Anaesthetist Familiarity with anaesthetic used
Unfamiliar / familiar Very familiar Unknown
21 32 6
15 38 6
1 0.5
0.2 –1.3
0.18

119
5.3.3 Multivariable Analysis
Seventeen variables were taken forward to the multivariable level due to being below
the screening significance level (p<0.20). They included health status (ASA grade),
urgency, major versus minor intended procedure, procedure difficulty, patient
recumbency, induction time, duration and intended duration, ketamine dose, receiving
carprofen (for postoperative deaths and pair only), having a record of anaesthesia,
recovery quality, recovery location, veterinarian familiarity with the anaesthetic,
veterinarian postgraduate qualification, anaesthetist familiarity with the anaesthetic.
Eleven independent variables were retained for multivariable analysis due to their
potential biological significance, they included age, sex, the induction combinations
used (3 variable), having an inhalation agent, mask induction, receiving oxygen,
perioperative fluids, other duties of monitoring person, and using a pulse oximeter.
After adjusting for other variables, four factors were retained in the model: health status,
intended duration, intended procedure and veterinary surgeon familiarity with the
anaesthetic used (Table 5.8).
Table 5.8 The conditional logistic regression model for anaesthetic-related death in
Rabbits
* Duration of anaesthesia for cases that died during anaesthesia is based on the duration of similar procedures in the control population. 112 observations of 118.
Variable Categories β s.e. β OR 95% CI LRT P value
ASA grade ASA 1-2 ASA 3-5
3.29
1.09
1 26.9
3.2 – 227.4
< 0.001
Intended Duration of Anaesthesia*
0-29 minutes 30-max
1.60
0.74
1 5.0
1.2 – 21.1
0.01
Intended Procedure Minor Major
2.08
0.93
1 8.0
1.3 – 49.8
0.01
Surgeon Familiarity with Anaesthetic used
Unfamiliar / familiar Very familiar
-1.29
0.74
1 0.3
0.1 – 1.2
0.07

120
Patient health status (ASA grade) was an important risk factor (OR = 26.9, Table 5.8)
and confounder of other variables based on its effect on other variables estimates, and
was the major independent variable around which the model was built. After adjusting
for health status, the intended duration was associated with a 5-fold increase in odds for
procedures over 30 minutes. Intended procedure was retained as the third variable and
major procedures were associated with odds ratio of 8.0. The final variable associated
with outcome was veterinarian familiarity with the anaesthetic used (OR= 0.3), and
though its likelihood ratio test p value was just outside the 5% level (p=0.065), it was
retained on biological grounds.
The use of pulse oximetry was an alternative to veterinarian’s familiarity with the drugs
used, as the fourth variable in the model (LRT P = 0.04). However, patients using pulse
oximetry were associated with a 4.6 increase in odds (95% CI 0.9 – 22.8) and based on
the similar significance and comparable model fit (see below), the veterinarian
familiarity with the anaesthetic was considered more biologically plausible even though
it had a marginally greater p value (P=0.065). The use of carprofen was also associated
with reduced odds, although when considering deaths occurring other than on induction
of anaesthesia or only postoperative deaths, this association was no longer significant,
and hence this variable was not retained. No further variables were significant variables
at the 5% level after adjusting for the four variables. No significant interactions were
detected amongst the explanatory variables.
The unconditional logistic regression was undertaken to attempt to evaluate model fit.
The odds ratios for ASA grade were 11.1 (95% CI 3.2 – 38.2), intended duration 2.6
(95% CI 1.0 – 7.1), intended procedure 2.3 (95% CI 0.7 – 7.3), and veterinarian
familiarity with the anaesthetic 0.5 (95% CI 0.2 – 1.5). Using clinic as the random effect
did not improve this model (rho<0.001, LRT p = 1.0). However the model fit was good
based on the Hosmer-Lemeshow goodness-of-fit test (p = 0.56), and the delta deviance
residual diagnostic statistic (no covariate patterns being greater than 6.0 and only 7
greater than 5.0) (Hosmer and Lemeshow 2000). There were a number of influential
covariate patterns, with just over half of patients (n=61 of 118) having delta betas
greater than 1.0. However, these were considered biologically plausible and reflected
the limited number of covariate patterns based on 4 dichotomous variables (i.e. 16
permutations) (Hosmer and Lemeshow 2000). Model fit was slightly better when

121
pulse oximetry was used as the fourth variable (Hosmer-Lemeshow goodness-of-fit p =
0.81, delta deviance statistic no patterns greater than 4.0, delta beta statistic 36
covariates greater then 1.0), but on biological grounds veterinarian’s familiarity was
preferred and retained in the conditional logistic regression model.
Hence in summary, in the final multivariable conditional logistic regression model,
higher risk patients (ASA 3-5) were associated with a near 27-fold increased odds of
death compared to low risk patients, procedures lasting 30 or more minutes versus less
than 30 minutes were associated with a 5.0 fold increase in odds, major versus minor
procedures were associated with a 8.0 times increase in odds and the veterinary surgeon
being very familiar with the anaesthetic used was associated with a 0.3 odds ratio,
compared to their subjective assessment of being familiar or unfamiliar (Table 5.8).
5.4 Discussion
This study has identified a number of factors associated with anaesthetic-related death
in rabbits. However it is important to interpret the results in lights of the limitations of
the method.
5.4.1 Methodological Considerations
5.4.1.1 Design and Conduct
Case definition and selection were important considerations in evaluating the limitations
of the study (Hennekens and Buring 1987) and were discussed in Chapter 2. The
definition of anaesthetic-related death was potentially open to inconsistent interpretation
by participating centres. Due to this concern, centres were required to return a case-
control questionnaire for all perioperative deaths within 48 hours of anaesthesia unless
there was clear evidence of no role of anaesthesia. In relation to rabbits the primary
investigator then classified all potential cases against the criteria list (Appendix 2.4) to
increase consistency of classification and reduce misclassification.
The use of a matched case-control study presented some advantages and disadvantages.
The efficiency of undertaking the study was increased by matching the controls by
clinic and proximity in time to the cases. Matching for commonly identified
confounders, removes this confounder and can increase the statistical power of the

122
study (Breslow and Day 1980; Hennekens and Buring 1987; Hosmer and Lemeshow
2000). However by their nature, matched studies preclude the evaluation of the matched
variable or covariates associated with it (Breslow and Day 1980; Hennekens and Buring
1987; Hosmer and Lemeshow 2000). Though the primary matched variable, clinic
identification, was not of specific interest, the commonly used induction drugs appeared
closely correlated with the clinic identification, making it difficult to interpret the risks
associated with these drugs (see below). Further the potential for seasonal effects on
anaesthetic-related death could not be examined due to the matching by time of patient.
Matching in the design requires taking account of matching in the analysis using the
appropriate regression method, conditional logistic regression (Breslow and Day 1980;
Hosmer and Lemeshow 2000). This can effectively reduce the sample size, as it only
takes account of those pairs in which the case and control have different exposure
histories (i.e. the discordant pairs) (Breslow and Day 1980; Hennekens and Buring
1987; Hosmer and Lemeshow 2000). Hence, the matched approach facilitated the
administration of the study, but reduced the power of the study to evaluate anaesthetic
agent related effects.
The controls should represent the population of individuals that would have been
identified and classified as cases had they developed the outcome (Hennekens and
Buring 1987; Dohoo, Martin et al. 2003). The matching process ensured patients
contemporary to the cases were selected, and it was likely these would be representative
of the underlying population of patients anaesthetised at participating centres.
Alternatively, randomising the controls across the cohort of rabbits could have been
undertaken, but for efficiency of study administration this was not done. Selection bias,
with differential selection of controls on the basis of their exposure histories, was also a
potential concern (Hennekens and Buring 1987). However, the matching process was
unlikely to encourage selection bias on the basis of the patient exposure histories as the
exposure histories would not influence selection other than for the matching variables
centre identity and date of procedure, and individual centres could not influence patient
selection. The issue of non-response was a further consideration in the rabbit study. The
80% response rate for the cases and the 86% response rate for the controls were
considered good based on a suggested aim of a non-response rate of less than 20 to 30%
(Dohoo, Martin et al. 2003). Further, the comparable response rates in cases and

123
controls, have been suggested to support the likelihood that no major bias occurred due
to non-response (Dohoo, Martin et al. 2003).
Information or observation bias, particularly errors of misclassification, was a further
potential concern (Breslow and Day 1980; Dohoo, Martin et al. 2003). Misclassification
of exposure histories by the participating centres was minimised by checking the case-
control questionnaires against anaesthetic record forms when available, and by
assessing the plausibility of the data. Misclassification of outcome was reduced by
checking the patient details to the cohort to ensure the outcomes agreed. Data entry
errors were minimised by checking the data twice and randomly checking 20% of the
entered data again. There was the potential for recall bias and differential
misclassification, with cases being generally completed soon after their death and
having more accurate exposure histories than controls (90% of cases returned compared
to 25% of controls within 3 months of the anaesthetic). However, the majority of the
information required for the forms would be recorded in the practices’ patient records,
particularly for the main factors of interest. Hence, in general major differential
misclassification should have been limited and if errors were made primarily they
would have been non-differential in general, and at worst reduce the power of the study
and result in associations that tended to unity (Dohoo, Martin et al. 2003).
5.4.1.2 Analysis
Matched sampling requires matched analysis and the conditional logistic regression
approach is appropriate (Breslow and Day 1980; Hosmer and Lemeshow 2000).
Hosmer and Lemeshow (2000) warn against breaking the matching and analysing with
unconditional logistic regression even when the sample size is large, and state that the
analysis should be based on the stratum specific conditional likelihood. Dohoo and
colleagues (2003) identified that unconditional analysis of a matched dataset will bias
the estimates to unity if the matching were done on variables that are confounders,
whereas if the matching were not necessary to avoid confounding bias then the
unconditional analysis will be less efficient with wider confidence intervals and hence
conditional analysis is preferred and was performed here.
The use of the conditional logistic regression approach limited the ease of assessing
model fit (Dohoo, Martin et al. 2003). The Hosmer-Lemeshow goodness-of –fit test

124
is not appropriate for conditional logistic regression models, as it is based on the m-
asymptotic approach (m is the number of subjects with the same covariate patterns, in a
matched study m=1)(Hosmer and Lemeshow 2000). Overall goodness-of –fit tests have
been proposed but are currently not available in standard software (Hosmer and
Lemeshow 2000). Dohoo and colleagues (2003) suggest fitting an unconditional logistic
regression model and applying standard residual diagnostics and goodness-of-fit tests to
give an approximation to model fit assessment, and this was undertaken here.
5.4.2 Descriptive Data
This study highlighted the particularly high risk of death when anaesthetising rabbits
compared to dogs and cats (Clarke and Hall 1990; Dodman and Lamb 1992; Dyson,
Maxie et al. 1998; Gaynor, Dunlop et al. 1999; Joubert 2000; Brodbelt, Hammond et al.
2005), with the postoperative period being a particularly high-risk period. The
classification of the vast majority of anaesthetic-related deaths as of unknown cause is
noteworthy and suggests that the monitoring of this species during and after anaesthesia
needs to be improved. Most rabbits had a separate person monitoring the anaesthetic
during the procedure, and most practices observed respiratory pattern and pulse rate,
however additional monitoring was infrequently used, and the ability to detect early
signs of physiological disturbance may have been limited. Postoperatively, the rabbits
were monitored less frequently than during anaesthesia, which may account for the
higher percent of these deaths being classified as of unknown cause. However, the
observations that 50 percent of the postoperative deaths occurred within the first 3 hours
of termination of anaesthesia and that half of these deaths were classified as due to
cardiovascular or respiratory causes, suggests that if this early period were specifically
targeted for increased monitoring and management, significant reductions in mortality
might be achieved.
The descriptive data from the control rabbits gives an interesting insight into commonly
used drugs and anaesthetic management. Generalisations from these data must be made
with caution as the control rabbits were matched by clinic and, to a lesser extent, in time
to the anaesthetic-deaths, and may not be entirely representative of rabbit anaesthetic
practice across the study population. Nonetheless, in the control population of rabbits,
medetomidine and ketamine was the main combination used, followed by Hypnorm
(fentanyl and fluanisone). This trend is consistent with observations recorded from
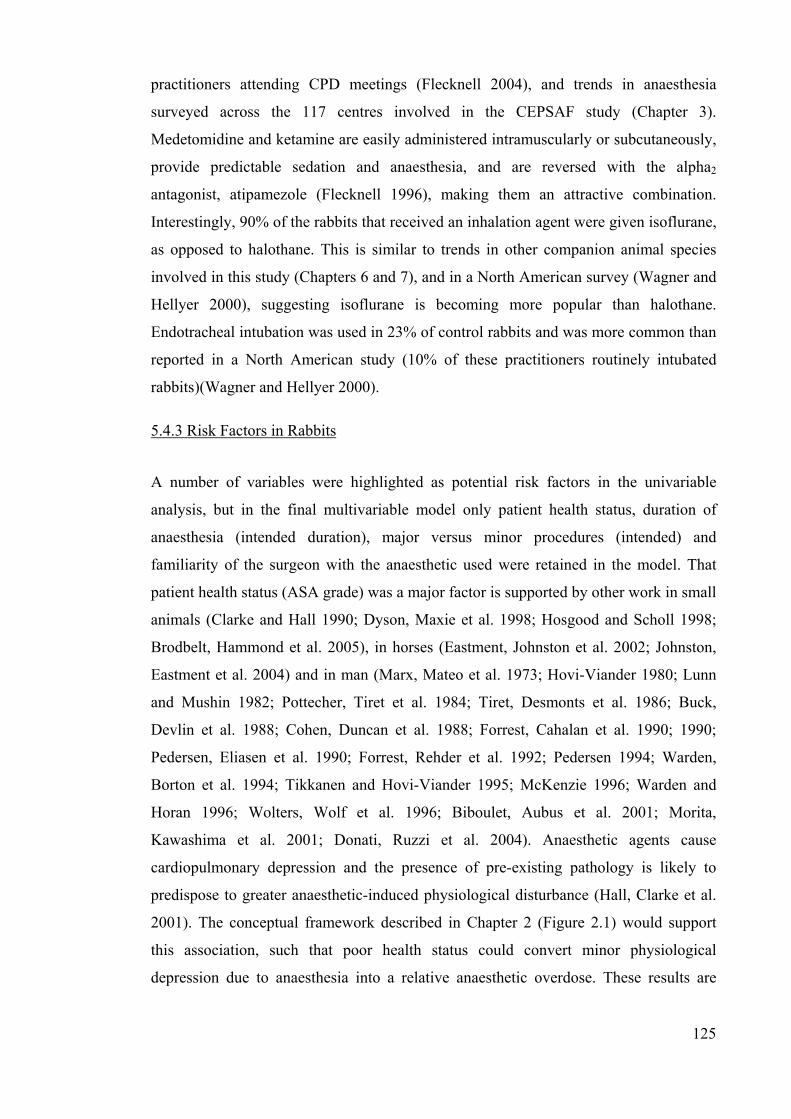
125
practitioners attending CPD meetings (Flecknell 2004), and trends in anaesthesia
surveyed across the 117 centres involved in the CEPSAF study (Chapter 3).
Medetomidine and ketamine are easily administered intramuscularly or subcutaneously,
provide predictable sedation and anaesthesia, and are reversed with the alpha2
antagonist, atipamezole (Flecknell 1996), making them an attractive combination.
Interestingly, 90% of the rabbits that received an inhalation agent were given isoflurane,
as opposed to halothane. This is similar to trends in other companion animal species
involved in this study (Chapters 6 and 7), and in a North American survey (Wagner and
Hellyer 2000), suggesting isoflurane is becoming more popular than halothane.
Endotracheal intubation was used in 23% of control rabbits and was more common than
reported in a North American study (10% of these practitioners routinely intubated
rabbits)(Wagner and Hellyer 2000).
5.4.3 Risk Factors in Rabbits
A number of variables were highlighted as potential risk factors in the univariable
analysis, but in the final multivariable model only patient health status, duration of
anaesthesia (intended duration), major versus minor procedures (intended) and
familiarity of the surgeon with the anaesthetic used were retained in the model. That
patient health status (ASA grade) was a major factor is supported by other work in small
animals (Clarke and Hall 1990; Dyson, Maxie et al. 1998; Hosgood and Scholl 1998;
Brodbelt, Hammond et al. 2005), in horses (Eastment, Johnston et al. 2002; Johnston,
Eastment et al. 2004) and in man (Marx, Mateo et al. 1973; Hovi-Viander 1980; Lunn
and Mushin 1982; Pottecher, Tiret et al. 1984; Tiret, Desmonts et al. 1986; Buck,
Devlin et al. 1988; Cohen, Duncan et al. 1988; Forrest, Cahalan et al. 1990; 1990;
Pedersen, Eliasen et al. 1990; Forrest, Rehder et al. 1992; Pedersen 1994; Warden,
Borton et al. 1994; Tikkanen and Hovi-Viander 1995; McKenzie 1996; Warden and
Horan 1996; Wolters, Wolf et al. 1996; Biboulet, Aubus et al. 2001; Morita,
Kawashima et al. 2001; Donati, Ruzzi et al. 2004). Anaesthetic agents cause
cardiopulmonary depression and the presence of pre-existing pathology is likely to
predispose to greater anaesthetic-induced physiological disturbance (Hall, Clarke et al.
2001). The conceptual framework described in Chapter 2 (Figure 2.1) would support
this association, such that poor health status could convert minor physiological
depression due to anaesthesia into a relative anaesthetic overdose. These results are

126
useful as they help to quantify the risks and have clearly identified patients that need
particularly careful perioperative management.
Increasing intended duration of anaesthesia was associated with increased odds,
suggesting assessing procedure length prior to anaesthesia would aid evaluation of the
likely risks. Adjustment for the anticipated duration of anaesthesia was made for those
cases that died prior to having their procedure performed, based on the average duration
for similar procedures in the control rabbits. Intraoperative deaths would have shorter
procedures than expected and these cases would reduce the association of increased risk
with increasing duration. Intended duration as a predictive factor for outcome may in
part reflect residual confounding by procedure type, for though intended procedure
(major or minor) was also retained in the model, some of the reported effect here could
have reflected intended procedure type as well as duration. The overlap between
procedure duration and procedure type as risk factors was reflected in the conceptual
framework (Figure 2.1). Though intended duration has not been frequently reported, the
association of increasing duration and risk of complications has been reported
previously in horses (Trim, Adams et al. 1988; Young and Taylor 1990; Young and
Taylor 1993; Eastment, Johnston et al. 2002; Johnston, Eastment et al. 2004) and man
(Pottecher, Tiret et al. 1984; Tiret, Desmonts et al. 1986; Newland, Ellis et al. 2002).
Prolonged anaesthesia predisposes to hypothermia (Waterman 1981; Dhupa 1995), and
given their large surface area to volume ratio, rabbits would be particularly susceptible.
Additionally, longer periods of cardiopulmonary depression, if present, were likely to
have greater effects than short period insults, by increasing cellular metabolic
derangement and damage.
Increasing odds associated with increasing intended operation complexity, characterised
by procedures being major or minor in the model, is consistent with work in horses
(Johnston, Eastment et al. 2002; Johnston, Eastment et al. 2004) and man (Farrow,
Fowkes et al. 1982; Fowkes, Lunn et al. 1982; Pottecher, Tiret et al. 1984; Tiret,
Desmonts et al. 1986; Newland, Ellis et al. 2002; Donati, Ruzzi et al. 2004). Intended
procedure reflects the risk associated with patients presenting for a given procedure and
consequently it represents both aspects relating to the impact of the procedure itself and
the patient presenting for that procedure. The procedural aspect was likely to reflect the
increasing stress more complex and invasive procedures imposed on patient

127
physiology. More complex procedures may result in greater fluid and blood loss,
exposure of body cavities and a tendency to greater hypothermia. The aspect pertaining
to the patient presenting for that procedure, also related to the urgency of the procedure
and other factors. These associations were reflected in the conceptual framework.
Interestingly, increasing familiarity of the surgeon with the anaesthetic agents used was
associated with reduced odds. Though, just outside the 5% level the variable was
retained on biological bases and due to the improved model fit with its inclusion.
Johnston and colleagues (1995; 2002) were unable to demonstrate an association with
increasing familiarity or experience in horses, but work in man suggested complications
were associated with staff inexperience (Buck, Devlin et al. 1988; Campling, Devlin et
al. 1992; Campling, Devlin et al. 1993). Personnel experience is likely to reflect the
potential for human error, the type of procedure undertaken, and anaesthetic
management of the patient. There were also trends for reduced risk with the presence of
a postgraduate qualification, suggesting that experience and confidence with the drugs
used may be important for reducing risk. That the risk associated with the anaesthetist
being familiar with the anaesthetic (OR=0.5, LRT p=0.19) was not retained in the
model was likely to reflect the greater number of missing values for this variable
(number of observations = 94) and the subsequent reduction in power.
The lack of an association with other patient and procedural variables, significant in the
univariable analysis, was likely to reflect a combination of confounding, particularly by
health status, and the limited power of this study. The time of induction of anaesthesia
only just dropped out of the final model after adjusting for health status in particular,
suggesting many of the later procedures were at greater risk due to poorer health status
more than the time of day. Nonetheless late operation time has been reported by
Johnston and colleagues (2002) in the horse, where procedures undertaken outside the
normal working day were associated with greater risk. Later starting times of
anaesthesia may reflect emergency procedures, result in less personnel being present
preoperatively, longer periods of water or food deprivation, and may increase personnel
fatigue. The failure of procedure urgency to be retained in the final model also reflected
confounding by patient health status, such that the coefficient for urgency was reduced
and not significant after adjusting fro health status. Urgent procedures often tend to
poorer health status and much of the association initially seen here resulted from

128
that. However, increasing procedural urgency has been associated with increased risk in
horses and man (Lunn and Mushin 1982; Pottecher, Tiret et al. 1984; Tiret, Desmonts et
al. 1986; Buck, Devlin et al. 1988; Pedersen, Eliasen et al. 1990; Johnston, Taylor et al.
1995; Biboulet, Aubus et al. 2001; Eastment, Johnston et al. 2002; Johnston, Eastment
et al. 2002; Newland, Ellis et al. 2002; Donati, Ruzzi et al. 2004) and independent of
patient health status it is likely to reflect the ability to stabilise the patient prior to
anaesthesia.
It is interesting to note that age did not appear to be a risk factor at the univariable or
multivariable level. This is in contrast to work in dogs and horses where increasing age
was associated with increased risk (Hosgood and Scholl 1998; Johnston, Eastment et al.
2002; Johnston, Eastment et al. 2004), and man (Hovi-Viander 1980; Lunn and Mushin
1982; Pottecher, Tiret et al. 1984; Tiret, Desmonts et al. 1986; Buck, Devlin et al. 1988;
Cohen, Duncan et al. 1988; Forrest, Cahalan et al. 1990; 1990; Pedersen, Eliasen et al.
1990; Forrest, Rehder et al. 1992; Pedersen 1994; Warden, Borton et al. 1994; Tikkanen
and Hovi-Viander 1995; McKenzie 1996; Warden and Horan 1996; Biboulet, Aubus et
al. 2001; Morita, Kawashima et al. 2001; Donati, Ruzzi et al. 2004) and may result from
species differences in terms of a lack of an association or a smaller effect of increasing
age such that it was not detected here due to limited power of the study.
The common anaesthetic combinations used were associated with very similar odds in
this study. This may in part reflect similar drug related risks. Though cardiopulmonary
depression is reported to be greater with medetomidine and ketamine compared to
Hypnorm, the presence of a specific reversal agent for medetomidine allowing faster
recoveries could balance this out (Mero, Vainionpaa et al. 1989; Flecknell 1996). The
similar timing of death for animals receiving medetomidine and ketamine compared to
Hypnorm also supports similar drug associated characteristics. An element of the lack
of an association may have been due to matching in the study design. Matching
controls to cases by clinic predisposed to matching for anaesthetic agents as many
clinics used one anaesthetic protocol in rabbits. Hence, the majority of case-control
pairs from individual clinics would have had the same induction agents, and these pairs
would not have been included in the analysis (concordant pairs).The odds ratios
calculated would result from discordant pairs from the subset of centres which used
more than one anaesthetic combination in rabbits. Based on the practice survey

129
(Chapter 3) and the drugs used in the rabbit pairs in the case-control study, there was
evidence of use of both major combinations in 12 of the 35 centres (34%), compared to
19 (54%) using medetomidine and ketamine only and 4 (11%) Hypnorm only. This
suggests the ability to assess the odds associated with medetomidine and ketamine
versus Hypnorm was limited by the matching process.
Unconditional logistic regression, after breaking of the matching, yielded similar odds
ratios for the main anaesthetic agents (medetomidine versus no medetomidine OR = 1.3,
95% CI 0.5 – 3.0; Hypnorm versus no Hypnorm OR= 0.9, 95% CI 0.4 – 2.3), and this
would support similarities of drug associated risks. However the matching process,
more than the matched analysis would have tended to have reduced differences
observed between drugs if they were covariates of the matched variable, and again only
those centres that used more than one anaesthetic protocol would alter the odds from
unity. Dose-response effects were evaluated though these were not significant in the
univariable or multivariable models. Notwithstanding the above limitation in
methodology, if the drugs used had been strongly associated with death, some evidence
would have been observed in this study even if not retained in the final model: this was
not seen.
Reduced odds associated with administration of carprofen (a nonsteroidal anti-
inflammatory agent) in the univariable analysis may have resulted from many cases
dying before the carprofen could be administered, resulting in reduced odds of death
when carprofen was use. Fifty-five percent (16 of 29) of control rabbits received
carprofen during anaesthesia and a further 21% (6 of 29) received it postoperatively,
hence it is likely that a substantial number of intraoperative deaths and some
postoperative deaths would not have received carprofen prior to death, irrespective of
the intention to treat. In an attempt to account for this potential bias, a comparison of
pairs with only postoperative deaths was undertaken. Though there remained a tendency
to reduced odds when carprofen was administered in these postoperative pairs, this was
not significant and the variable was not retained in the final model. Though previous
work does not suggest a protective effect when carprofen is administered, further work
is merited.
In summary, this study has identified the postoperative period to be a particularly high-
risk period for rabbits undergoing anaesthesia and sedation. Poor patient health

130
status, increasing duration of anaesthesia and major procedures were important factors
associated with increased odds. Increased familiarity with the anaesthetic used would
appear to be more important than the specific drugs used. Further work is required to
evaluate the risks associated with specific anaesthetic agents in rabbits.

131
Chapter 6 Risk Factors for Anaesthetic-Related Death in Dogs
6.1 Introduction
Factors associated with anaesthetic death in Dogs have been evaluated infrequently in
the veterinary literature and not for nearly 20 years in the UK (Clarke and Hall 1990;
Dyson, Maxie et al. 1998; Hosgood and Scholl 1998) (see Chapter 1 Literature
Review). The aims of this part of the Study were to evaluate risk factors associated with
anaesthetic-related death in Dogs and in a subpopulation of Sick Dogs (see Chapter 2).
6.2 Materials and Methods
A prospective case-control study was undertaken, nested within the cohort of Dogs
anaesthetised and sedated at participating practices during the study period (see Chapter
2). A case was defined as a perioperative death (including euthanasia) occurring after
premedication and within 48 hours of termination of the procedure, except where death
or euthanasia was due solely to inoperable surgical or pre-existing medical conditions.
A death was considered a case if anaesthesia or sedation could not be reasonably
excluded as a contributory factor. All deaths from the cohort potentially fitting the case
definition were evaluated by the independent review panel and classified against a list
of criteria as case or not. Controls for this part of the study were prospectively and
randomly selected from the cohort of anaesthetised and sedated Dogs at the
participating centres during the Study period at a 1:4 Case: Control ratio for the overall
Dog Study (classified as the ‘Dog Study’).
A sub-population of higher risk dogs was also evaluated (classified as the ‘Sick Dog
Study’). All cases that were classified as ‘Sick’ (ASA 3-5, see Appendix 2.1), were
included as cases in this section of the study. Controls for this study (Sick controls),
were randomly and prospectively selected from the cohort of anaesthetised and sedated
sick dogs at the participating centres during the study period at a 1:1 Case: Control
ratio.
Univariable analysis of the data was undertaken to determine the association of each
variable with the odds of anaesthetic-related death. For categorical data, odds ratios
(OR) were calculated and the 95% confidence intervals (95% CI) were calculated

132
for the risk factors using the standard errors obtained as the square root of the variance
of the score statistic (Breslow and Day 1980; Schlesselman 1982; Hosmer and
Lemeshow 2000). Chi-squared test or Fisher’s Exact test were applied to test the
statistical significance of the associations for categorical variables where appropriate
(Kirkwood 1988). Additionally, for multiple category variables, the likelihood ratio test
P value was calculated for the variable, comparing a logistic regression model with the
variable included to that without the variable (Hosmer and Lemeshow 2000). When
appropriate for multiple category variables, the odds ratio for a one category increase in
odds was calculated (a one degree of freedom test for trend, ‘trend’)(Hosmer and
Lemeshow 2000). For continuous variables, the Student’s t test or Mann-Whitney U
test, were applied (Kirkwood 1988).
Intended duration of anaesthesia was estimated for cases that died before the procedure
was performed, by using the mean duration for controls for the same procedure category
as described by procedure performed in a similar manner to that described in rabbits
(see Table 6.5c). Intended procedure type was recorded in addition to actual procedure
to allow categorisation of those cases that died prior to performing the procedure.
Biologically significant factors and variables significant at the 20% level were retained
for evaluation in the mixed effects logistic regression model. Stratification of
independent variables by potential confounders (e.g. health status) was performed to
explore multivariable associations and effect modification prior to multivariable
analysis (Breslow and Day 1980). Logistic regression was then used and the
contribution of the explanatory variables to the model was assessed using the log
likelihood function (Hosmer and Lemeshow 2000). Variables significant (p<0.05) based
on the likelihood ratio test statistic, were retained in the logistic regression model using
a forward selection approach (Dohoo, Martin et al. 2003). Variables with a large
number of missing values were excluded from this approach, except when considered
biologically important and then a separate category for missing or unknown values was
created (Katz 1999). Biologically plausible first order interactions were assessed in the
final multivariable model (Hosmer and Lemeshow 2000). Clustering at the clinic level
was adjusted for, by using clinic identity as a random effect (Dohoo, Martin et al. 2003).
The fit of the final models was assessed with the Hosmer Lemeshow goodness-of-fit
statistic and by evaluating the models’ residuals with the delta deviance and delta

133
beta influence diagnostic statistics based on the observed covariate patterns (Hosmer
and Lemeshow 2000).
6.3 Results
One hundred and forty nine deaths within 48 hours of anaesthesia or sedation were
classified as cases in dogs. One case was excluded as the centre was withdrawn from the
study due to being outside the UK (See Chapter 4), resulting in 148 cases for the case-
control Study. Ninety-nine cases (67.0%) were graded ASA 3-5 (’Sick’), and 49 cases
were ASA 1-2 (33%, ‘healthy’). During the study period 616, controls were requested,
503 were returned (82% response rate) and sixteen were excluded (2 were euthanased
within 48 hours of the procedure, 4 were duplicates of other controls, 7 were
unavailable until after the analysis was performed, and 3 were submitted by the
excluded non-UK centre). This resulted in 487 controls being included in the analysis of
the Dog Study (Case: Control ratio 1:3.3). Of the 487 controls, 37 were classified as
ASA 3-5 (7.6%) and were also used in the Sick Dog study. An additional 132 Sick
controls were requested over the study period, 67 were returned (51% response rate) and
5 were excluded (3 were ASA grade 2 and 2 were from the excluded non-UK centre). A
total of 99 controls were compared to 99 cases for the Sick Dog study.
The cohort of dogs anaesthetised and sedated (and not dying or being euthanased within
48 hours) during the study consisted of 11,955 sedations (12%) and 84,300 general
anaesthetics (88%), in comparison in the case-control study 36 of 487 controls were
sedations (7%), these proportions were significantly different (P<0.001). However, the
Hauck-Anderson corrected 95% confidence intervals for the difference in proportions of
sedated dogs, between the case-control and cohort studies, were -7.5 to -2.6%, which
biologically was not a substantial difference (Tu 1997; Christley and Reid 2003). When
comparing the dog controls to the non-returned controls (Table 6.1), health status, age
and major versus minor procedures were not significantly different and the 95%
confidence intervals for the difference in proportions suggested reasonable equivalence
between returned and non-returned controls (Christley and Reid 2003). The non-
returned controls were statistically more likely to by urgent or emergency procedures
(compared to scheduled procedures) and were more likely to be sedations (as opposed
to general anaesthetics) than the returned controls, however these trends were not

134
observed in the cat study (Chapter 7) and were likely to reflect the small sample taken
of the non-returned controls.
Table 6.1 Comparison of controls and non-returned controls in Dogs
*95% Confidence interval (CI) for the difference in proportion between the Controls and non-returned Controls. ** Mean and standard deviation are reported and the 95% CI for the difference between controls and non-returned controls.
6.3.1 Dog Study
The control population of dogs had a mean age of 5.7 years (4.1 standard deviation (sd),
with 49% of controls being male and 51% female. Crossbreeds commonly presented
(18%), as did terrier (19%) and gun dog breeds (22%), though few pastoral (6%), utility
(6%) or toy dogs were seen (5%)(Table 6.5c). Neutering was the most common
procedure performed (28%), followed by diagnostic (20%) and minor soft tissue
procedures (Table 6.5c).
Most control dogs (87%) were premedicated prior to anaesthesia (Table 6.2).
Acepromazine combinations were most commonly used (78% of controls), 5% had
medetomidine combinations prior to anaesthesia, and 4% had benzodiazepine and
opioid combinations. Both acepromazine and medetomidine were most often combined
with butorphanol or buprenorphine. Anaesthesia was induced with propofol in the
majority of dogs, followed by thiopentone and other combinations (Table 6.3).
Medetomidine combinations were mostly used for sedation as opposed to anaesthesia
(88% of medetomidine inductions were for sedation). Anaesthesia was primarily
Risk Factor Proportion of
controls
Proportion of non-
returned controls
P value 95% CI* for the
difference in proportions
Sedation 36/487 (7.4%) 5/23 (21.7%) 0.013 -5.3 to 34.0%
ASA 3-5 37/387 (7.6%) 2/21 (9.5%) 0.75 -13.7 to 17.5%
Urgent or Emergency
69/485 (14.2%) 9/21 (42.8%) <0.001 4.2 to 53.0%
Major Procedure
87/487 (17.9%) 3/23 (13.0%) 0.55 -21.6 to 11.9%
Age** 5.7 +/- 4.1 years 6.5 +/- 5.3 years 0.42 -2.8 to 1.1 years

135
maintained with isoflurane (Table 6.4). Those patients that did not receive an inhalation
agent were generally only sedated.
Table 6.2 Premedication given to Dogs
* Number and percent of total (%).
Table 6.3 Induction agents used for anaesthesia and sedation in Dogs
* Number and percent of total (%).
Premedication Cases* Controls*
No Premedication 45 (30%) 62 (13%)
Acepromazine Combinations 64 (43%) 378 (77%)
Medetomidine Combinations 4 (3%) 26 (5%)
Benzodiazepine / Opioid Combinations 35 (24%) 21 (5%)
Total 148 (100%) 487 (100%)
Induction agent Cases* Controls*
Thiopentone 14 (9%) 120 (25%)
Propofol 112 (76%) 319 (65%)
Medetomidine Combinations 4 (3%) 33 (7%)
Mask Induction 12 (8%) 6 (1%)
Other Methods of Induction 6 (4%) 9 (2%)
Total 148 (100%) 487 (100%)

136
Table 6.4 Maintenance agents used for anaesthesia and sedation in Dogs
* Number and percent of total (%).
Approximately 29% of control dogs had intravenous catheters placed perioperatively
and 19% received perioperative intravenous fluids. Intraoperative monitoring was
primarily undertaken by a qualified veterinary nurse (85%), with 5% having an
unqualified nurse, 8% a separate veterinary surgeon and 2% having no person monitor
the patient (Table 6.5g). Forty-four percent had a written record of the anaesthetic.
Monitoring was primarily by monitoring patient pulse and respiratory rates (70% and
94% respectively), though pulse oximetry was also commonly used (51% of controls).
Additional monitoring methods were infrequently used, with only 10% of controls
being monitored with capnography, arterial blood pressure monitoring and
electrocardiography (Table 6.5g). Postoperatively, patients were generally observed by
a nurse, and generally were checked every five minutes or more (34% continuously
monitored, 69% checked every five or more minutes). Postoperative temperature was
only taken in 14% of controls.
The procedures were most often undertaken by a junior veterinary surgeon (59% of
controls, Table 6.5h), whilst a senior veterinary surgeon undertook 35% of procedures
and locum veterinary surgeons 5%. Twenty-three percent (110 controls) of the controls
were undertaken by a veterinary surgeon with a non-anaesthesia postgraduate
qualification, and 3% (13 controls) with a postgraduate qualification in veterinary
anaesthesia (RCVS Certificate / Diploma, European Diploma, PhD). Of 38 controls
monitored by a veterinary surgeon, 58% (22 controls) were monitored by a veterinary
surgeon with a postgraduate qualification in veterinary anaesthesia, and 8% (3 controls)
with a non-anaesthesia postgraduate qualification.
Maintenance agent Cases* Controls*
Isoflurane 104 (70%) 396 (81%)
Halothane 19 (13%) 41 (9%)
Sevoflurane 5 (3%) 10 (2%)
Injectable Maintenance only 20 (14%) 40 (8%)
Total 148 (100%) 487 (100%)

137
6.3.1.1 Univariable Associations
The mean age of cases was significantly older than controls (8.0 years (4.2 sd) and 5.7
years (4.1sd) respectively, p<0.001). Additionally, there were significant trends to
increasing odds of anaesthetic-related death for both extremes of age (Table 6.5a). Mean
patient weight was not different (21.8 kgs (15.3 sd) and 21.5 kgs (12.9 sd) respectively,
p=0.84), but low patient weight and estimation of weight were associated with increased
odds (Table 6.5a). Cocker Spaniels, German Shepherd Dogs (GSD) and West Highland
White Terriers were individual breeds at increased odds compared to cross breeds, and
Pastoral, Utility and Toy dogs were breed groups at increased odds (Table 6.5a).
Referred patients (not primary) and patients having undergone previous anaesthetics or
sedations in the last month were at increased odds (Table 6.5a).
Preoperative disease was markedly associated with increased odds of anaesthetic-related
death (Table 6.5b), as was poor patient health status, as described by the ASA health
status (Anon 1963). Performing preoperative blood and other tests prior to anaesthesia
were associated with increased odds. Preoperative withholding of food and water were
associated with reduced odds. Urgency of the procedure untaken, procedure complexity
(major versus minor) and procedure difficulty (assessed by the operating veterinary
surgeon) were associated with increased odds (Table 6.5c). Procedures undertaken in
dorsal or sternal recumbency compared to lateral recumbency tended towards increased
odds, whilst those in more than one position tended towards reduced odds. Cases had
significantly longer duration of anaesthesia than controls (73.2 min (64.0) and 55.1 min
(41.5) respectively, p<0.001), and increasing duration of anaesthesia was associated
with a tendency to increased odds of death. This association was more clearly seen with
the intended duration (82.1 min (58.3) for case and 55.1 min (41.5) for controls,
p<0.001). Late start times and procedure undertaken during the night and early morning
were associated with increased odds.
Compared to not receiving premedication, having acepromazine or medetomidine was
associated with reduced odds and benzodiazepines or opioids with increased odds
(Table 6.5d). Induction of anaesthesia with propofol and mask inductions were
associated with increased odds compared to thiopentone. Halothane anaesthesia and
maintenance with injectable anaesthesia were associated with an increased odds

138
compared to isoflurane (Table 6.5d). Controlled ventilation was associated with
increased odds as was perioperative fluid therapy (Table 6.5e).
Monitoring by a veterinary surgeon was associated with increased odds of anaesthetic-
related death (Table 6.5f). There was a non-significant tendency to simultaneous
performing of the procedure and monitoring the patient being associated with increased
odds. Good recovery quality was associated with reduced odds, whilst taking the
patient’s temperature postoperatively was associated with increased odds (Table 6.5.f).
Procedures undertaken by a veterinary surgeon with a postgraduate veterinary
qualification and being a veterinary surgeon as the anaesthetist were associated with
anaesthetic-related death (Table 6.5f).

139
Table 6.5.a The association of patient variables with anaesthetic-related death in Dogs
*Odds ratios (OR) and 95% confidence intervals (CI) are reported, with the Likelihood Ratio Test (LRT) P values for multiple category variables at the top of the ‘P Value’ column. **Odds ratios are additionally reported adjusted for health status (ASA2) when confounding by health status was observed.
Variable Categories Cases Controls OR* 95% CI* P value
Categorical Age
0- ≤ 0.5 years 0.5 – 5 years 5 – 12 years 12 years - max
8 25 81 34
23 195 227 42
2.7 1 2.8 6.3
1.1– 7.0 1.7 – 4.6 3.3 – 12.2
<0.001 0.03 <0.001 <0.001
Sex Male Female
69 79
238 249
1 1.1
0.8 – 1.6
0.63
Neutered Entire Neutered Unknown
73 64 11
274 202 11
1 1.2
0.8 – 1.7
0.37
Categorical Weight
0-5 kg 5-15 kg 15- max Unknown
18 39 91 0
22 159 305 1
3.3 1 1.2
1.6 – 7.0 0.8 – 1.9
0.01 <0.001 0.36
Overweight Not overweight Overweight Unknown
114 29 5
384 90 13
1 1.1
0.8 – 1.7
0.73
Scales used
Scales Estimate Unknown
Adjusted ASA2**
122 26 0
466 20 1
1 5.0
2.8
2.6 – 9.3
1.0– 7.8
<0.001
0.04
Breed Crossbred Cocker spaniel GSD WHWT Hounds Working Dogs Terriers Gun Dogs Pastoral Dogs Utility Toy
17 9 9 6 8 13 25 21 13 15 12
88 16 18 9 30 50 90 105 28 30 23
1 2.9 2.6 3.5 1.4 1.3 1.4 1.0 2.4 2.6 2.7
1.1 – 7.8 1.0 – 6.8 1.1 – 11.3 0.5 – 5.5 0.6 – 3.0 0.7 – 2.9 0.5 – 2.1 1.0 – 5.6 1.1 – 5.9 1.1 – 6.6
0.05 0.03 0.05 0.03 0.50 0.47 0.30 0.92 0.04 0.02 0.02
Primary Case
Primary patient Referral patient Unknown
Adjusted ASA2**
118 30 0
437 48 2
1 2.3
1.3
1.4 – 3.8
0.7 – 2.4
<0.001
0.46
Previous Anaesthetics within the month
None One or more Unknown
92 41 15
402 58 27
1 3.1
1.9 – 4.9
<0.001

140
Table 6.5.b The association of further patient variables with anaesthetic-related death in
Dogs
*Odds ratios (OR) and 95% confidence intervals (CI) are reported. Likelihood Ratio Test (LRT) P values are reported for multiple category variables at the top of the ‘P Value’ column. **Odds ratios are additionally reported adjusted for health status (ASA2) when confounding by health status was observed. +‘Trend’ represents the odds ratio for a one-category increase in the variable.
Variable Categories Cases Controls OR* 95% CI* P value
Preoperative disease
None Cardiopulmonary Neurological Digestive Urogenital Other
4 35 9 61 14 24
212 50 14 53 33 113
1 37.1 34.7 61.0 22.5 10.6
10.4 – 132.4 7.7 – 150.4 15.9 – 233.9 6.2 – 82.0 3.5 – 32.5
<0.001 <0.001 <0.001 <0.001 <0.001 <0.001
ASA grade (ASA3)
ASA 1-2 ASA 3 ASA 4-5
Trend+
49 37 62
450 30 7
1 11.3 81.3
9.8
6.1 – 21.1 26.8- 247.3
6.7 – 14.2
<0.001 <0.001 <0.001
<0.001
ASA grade (ASA2)
ASA 1-2 ASA 3-5
49 99
450 37
1 24.6
13.4 – 45.0
<0.001
Preoperative examination
No Yes Unknown
Adjusted ASA2**
4 143 1
18 469 0
1 1.4
0.5
0.5 – 4.1
0.2 – 1.5
0.57
0.18
Preoperative bloods
No Yes Unknown
Adjusted ASA2**
62 84 2
339 146 2
1 3.1
1.5
2.1 – 4.7
1.0 – 2.5
<0.001
0.07
Other tests
No Yes Unknown
Adjusted ASA2**
62 85 1
399 86 2
1 6.3
1.9
4.1 – 9.8
1.2 – 3.1
<0.001
0.87
Starved Preoperatively
No Yes Unknown
Adjusted ASA2**
11 120 17
5 475 7
1 0.1
0.9
0.04 – 0.3
0.3 – 3.0
<0.001
0.85
Water withheld
No Yes Unknown
Adjusted ASA2**
65 63 20
175 291 20
1 0.6
0.9
0.4 – 0.9
0.6 – 1.5
0.01
0.82

141
Table 6.5.c The association of procedural factors with anaesthetic-related death in Dogs
*Odds ratios (OR) and 95% confidence intervals (CI). **ORs adjusted for health status (ASA2).
Variable Categories Cases Controls OR* 95% CI* P value
Urgency
Scheduled Urgent Emergency Unknown
Trend+
48 58 42 0
416 61 8 2
1 8.2 45.5
7.4
4.9 – 13.7 16.8 – 122.9
5.2 – 10.4
<0.001 <0.001 <0.001
<0.001
Procedure Performed Neutering Dental Diagnostics Soft tissue minor Soft tissue major Orthopaedics Neurological No procedure
3 6 18 9 69 11 4 28
134 45 99 120 39 45 5 2
1 6.0 8.1 3.4 79.0 11.4 35.7
1.4 – 25.6 2.2 – 29.5 0.9 – 12.8 15.4 – 406.5 2.8 – 46.2 4.9 – 261.0
<0.001 0.01 0.001 0.06 <0.001 <0.001 <0.001
Intended Procedure Minor Major
Adjusted ASA2**
53 95
400 87
1 8.2
4.2
5.2 – 13.0
2.5 – 7.0
<0.001
<0.001
Procedure Difficulty
Simple Moderate Difficult V difficult No procedure Unknown
28 55 28 8 27 2
286 167 27 4 0 3
1 3.4 10.6 20.4
2.0 – 5.6 5.1 – 21.8 5.3 – 78.6
<0.001 <0.001 <0.001 <0.001
Recumbency Lateral Dorsal Sternal Multiple
36 75 13 24
125 185 36 138
1 1.4 1.3 0.6
0.9 – 2.2 0.6 – 2.6 0.3 – 1.1
0.01 0.14 0.55 0.08
Duration
0-29 min 30-59 min 60-89 min 90 – max unknown
36 37 28 46 1
103 218 90 75 1
1 0.5 0.9 1.8
0.3 – 0.8 0.5 – 1.6 1.0 – 3.0
0.006 0.01 0.69 0.04
Duration intended 0-59 min 60-119 min 120 –max unknown
Trend+
63 53 30 1
321 121 44 1
1 2.2 3.6
1.9
1.5 – 3.4 2.1 – 6.2
1.5 – 2.5
<0.001 <0.001 <0.001
<0.001
Induction Time
8 am - 12 pm 12 pm - 5 pm 5 pm – 8 am unknown
Trend+
72 56 19 1
359 116 8 4
1 2.4 11.8
2.9
1.6 – 3.6 4.8 – 29.5
2.1 – 3.9
<0.001 <0.001 <0.001
<0.001

142
Table 6.5.d The association of anaesthetic agents with anaesthetic-related death in Dogs
*Odds ratios (OR) and 95% confidence intervals (CI). Likelihood Ratio Test (LRT) P values are reported for multiple category variables at the top of the ‘P Value’ column. **ORs adjusted for health status (ASA2). + Includes combinations of premedicant with other drugs.
Variable Categories Cases
Controls OR* 95% CI* P value
General anaesthesia or sedation
General anaesthetic Sedation
140 8
451 36
1 0.7
0.3 – 1.6
0.40
Premedication+ None Acepromazine Medetomidine BZ / Opioids only
45 64 4 35
62 378 26 21
1 0.2 0.2 2.3
0.1 – 0.4 0.1 – 0.7 1.2 – 4.5
<0.001 <0.001 <0.001 0.01
Induction agents Thiopentone Propofol Medetomidine Mask induction Other
14 112 4 12 6
120 319 33 6 9
1 3.0 1.0 17.1 5.7
1.7 – 5.9 0.3 – 3.4 4.7 – 62.2 1.7 – 19.3
<0.001 <0.001 0.95 <0.001 0.01
Inhalation Agents
Isoflurane Halothane Sevoflurane None
104 19 5 20
396 41 10 40
1 1.8 1.9 1.9
1.0 – 3.2 0.6 – 5.7 1.1 – 3.4
0.05 0.05 0.24 0.03
Induction / Maintenance Combinations
Injectable/Isoflurane Injectable/Halothane Injectable/SevofluraneInhalational Only Injectable AnaesthesiaInjectable Sedation
93 19 2 14 12 8
389 41 8 9 4 36
1 1.9 1.0 6.5 12.5 0.9
1.1 – 3.5 0.2 – 5.0 2.7 – 15.8 3.8 – 41.3 0.4 – 2.1
<0.001 0.03 1.0 <0.001 <0.001 0.9
Mask Induction
No mask induct Mask induction
Adjusted ASA2**
114 14
437 9
1 6.0
4.8
2.5 – 14.4
1.5 – 15.7
<0.001
0.01
Endotracheal Intubation (ET)
No ET tube ET tube
11 137
40 447
1 1.1
0.6 – 2.2
0.76
Oxygen No Oxygen Oxygen
7 141
34 445
1 1.5
0.7 – 3.5
0.34
Nitrous oxide No nitrous oxide Nitrous oxide Unknown
127 20 1
400 83 4
1 0.8
0.5 – 1.3
0.30

143
Table 6.5.e The association of management and monitoring factors with anaesthetic-
related death in Dogs
*Odds ratios (OR) and 95% confidence intervals (CI) are reported. Likelihood Ratio Test (LRT) P values are reported for multiple category at the top of the ‘P Value’ column.
**ORs are additionally reported adjusted for health status (ASA2) when confounded by health status.
Variable Categories Cases Controls OR* 95% CI* P value
Ventilation
Spontaneous Controlled Unknown
Adjusted ASA2**
116 31 1
462 22 3
1 5.6
3.0
3.1 – 10.3
1.4 – 6.6
<0.001
0.003
Perioperative fluids
No fluids IV Catheter only Fluids given
34 6 108
345 49 93
1 1.2 11.8
0.5 – 3.1 7.0 – 20.0
<0.001
<0.001 <0.001
Monitoring person Vet Nurse No separate person
33 112 3
40 440 7
3.2 1 1.7
1.9 – 5.4 0.4 – 6.6
<0.001 <0.001 0.45
Other duties of monitor No other duties Performing the op Assisting the op Unknown
119 3 25 1
384 7 95 1
1 1.4 0.9
0.4 – 5.4 0.5 – 1.4
0.71 0.6 0.5
Record No record Record Unknown
72 71 5
268 212 7
1 1.3
0.9 – 1.8
0.24
Pulse monitored No pulse pulse
Adjusted ASA2**
43 105
145 342
1 1.0
0.7
0.7– 1.6
0.4 – 1.2
0.87
0.19
Respiratory rate monitored
No respiratory rate Respiratory rate
15 133
30 457
1 0.6
0.3 – 1.1
0.10
Pulse oximeter used No Pulse oximeter Pulse oximeter
68 80
241 246
1 1.2
0.8 – 1.7
0.45
Capnography used No Capnograph Capnograph
126 22
438 49
1 1.6
0.9 – 2.7
0.10
Arterial Blood Pressure None Direct Indirect
132 3 13
440 5 42
1 2.0 1.0
0.5 – 8.5 0.5 – 2.0
0.66 0.34 0.94
ECG None ECG
124 24
432 55
1 1.52
0.90 – 2.56
0.11

144
Table 6.5.f The association of recovery and personnel variables with anaesthetic-related
death in Dogs
*Odds ratios (OR) and 95% confidence intervals (CI). Likelihood Ratio Test (LRT) P values are reported for multiple category variables at the top of the ‘P Value’ column. **ORs adjusted for health status (ASA2).
Variable Categories Cases Controls OR* 95% CI* P value
Recovery Quality
Good Moderate Poor Unknown No full recovery
24 19 7 2 96
371 86 4 26 0
1 3.4 27.1
1.8 – 6.6 6.8 – 108.2
<0.001 <0.001 <0.001
Recovery observed Continuously Every 5 minutes 10 minutes + Unknown No recovery
28 15 20 2 83
191 161 120 15 0
1 0.6 1.2
0.3 – 1.2 0.6 – 2.1
0.23 0.18 0.68
Rectal Temperature Taken (intraoperative deaths excluded)
No Yes Unknown
Adjusted ASA2**
51 17 1
415 68 4
1 2.0
1.0
1.1 – 3.7
0.5 – 2.0
0.02
0.95
Veterinary surgeon familiarity with anaesthetic
Very Familiar Familiar or Unfamiliar Unknown
125 15 8
435 40 9
1 1.3
0.7 – 2.4
0.40
Veterinary surgeon type Senior Veterinarian Junior Veterinarian Locum Unknown
64 77 6 1
171 289 27 0
1 0.7 0.6
0.5– 1.0 0.2 – 1.5
0.17 0.08 0.27
Veterinary surgeon Postgraduate qualifications
None Anaesthesia General Unknown
91 7 48 2
364 13 110 0
1 2.2 1.8
0.8 – 5.6 1.2 – 2.6
<0.001 0.11 0.01
Anaesthetist Familiarity with Anaesthetic
Very familiar Familiar or Unfamiliar Unknown
126 17 5
386 70 31
1 0.7
0.4 – 1.3
0.31
Anaesthetist type Vet Nurse Unqualified Nurse
35 79 34
43 291 153
1 0.33 0.27
0.20 – 0.56 0.15 – 0.50
<0.001 <0.001 <0.001

145
6.3.1.2 Multivariable Model
Table 6.6 Final mixed effects logistic regression model of the risk of anaesthetic-related
death in Dogs
*Odds ratios (OR) and 95% confidence intervals (CI) are reported, with corresponding Likelihood Ratio Test (LRT) P values. +‘Trend’ represents the odds ratio for a one-category increase in the variable. Number of observations 632 out of 635.
In developing the model, health status as defined by ASA grade was retained in the
model due to its low likelihood ratio test p value, its major role as a confounder and its
biological importance. Urgency was also retained in the model due to its low likelihood
ratio test p value and biological significance. Categorisation of age suggested
Variable Categories β s.e. β OR* 95% CI* LRT P value
ASA grade ASA 1-2 ASA 3 ASA 4 – 5
Trend+
1.80
0.29
6.1
3.4 – 10.8
<0.001
Urgency
Scheduled Urgent Emergency
Trend+
0.92
0.27
2.5
1.5 – 4.3
<0.001
Intended Procedure Minor Major
1.65
0.40
1 5.2
2.4 – 11.5
<0.001
Categorical Age 0- ≤ 0.5 years 0.5 – 5 years 5 – 12 years 12 years - max
0.30 0.35 2.29
0.86 0.39 0.51
1.3 1.4 9.8
0.2 – 7.2 0.7 – 3.1 3.6 – 26.6
<0.001
Duration intended (per 10 minute increment)
0.059 0.032 1.06 1.00 – 1.13 0.05
Categorical Weight
0-5 kg 5-15 kg 15- max
2.03 0.15
0.60 0.35
7.6 1 1.2
2.4 – 24.7 0.6 – 2.3
0.003
Induction and Maintenance Agents
Injectable / Isoflurane Injectable / Halothane Injectable / Sevoflurane Inhalational AnaesthesiaInjectable Anaesthesia Injectable Sedation
1.77 -1.10 1.78 4.27 0.40
0.53 1.65 0.82 0.88 0.64
1 5.9 0.3 5.9 71.4 1.5
2.1 – 16.6 0.0 – 8.5 1.2 – 29.3 12.7 – 402.50.4 – 5.2
<0.001
Intercept - 16.02 2.08
Random Effect Clinic identity (Rho)
0.16 0.03 0.05

146
increased odds of death with low and increasing age. A similar trend was seen when
fitting a fractional polynomial for age, with age to the cube having the lowest P value
(Royston, Ambler et al. 1999). The likelihood ratio test static P values were low
(<0.001) and the model deviances were similar when categorical, linear or polynomial
versions of age were incorporated into the model. Categorical age was preferred over
the fractional polynomial and linear versions due to its easier clinical interpretation
(Dohoo, Martin et al. 2003).
When exploring the association of duration with outcome, the intended duration had
lower likelihood ratio test p values than actual duration, due to the effect of
intraoperative deaths increasing the odds seen with shorter duration procedures.
Categorical intended duration suggested a linear increase in odds with increasing
duration and this was supported when fitting a fractional polynomial for intended
duration, as the linear model had similar deviance to the polynomial model (Royston,
Ambler et al. 1999). The linear version of intended duration was retained over the other
versions due to its lower LRT P value. Categorical weight was retained in the model
due to its likelihood ratio test p value. The induction and maintenance agent
combination was retained as the final variable with the main associations being
increased odds with halothane versus isoflurane and total inhalation anaesthesia. No
biologically significant interactions were observed between the factors present in the
multivariable model.
In the final multivariable model, an increase of one category in poor patient health
status (ASA3) was associated with a 6.1 fold increase in odds, an incremental increase
in procedural urgency was associated with a 2.5 increase in odds, whilst major versus
minor intended procedure was associated with a 5.2 increase in odds. There was a linear
increase in odds of 1.06 per a 10 minute increase in intended duration, patients 12 years
or older were 9.8 times more likely to die, and patients weighing less than 5 kg were
associated with an 7.6 fold increase in odds. Maintenance with halothane and total
inhalational anaesthesia were associated with nearly a 6-fold increase in odds compared
to isoflurane. Injectable anaesthesia was associated with a 71.4 times increase in odds.
The goodness of fit as assessed by the Hosmer Lemeshow goodness-of-fit statistic was
good (P value = 0.81) (Hosmer and Lemeshow 2000). Further evaluation of the model
was undertaken with the use of the delta deviance regression residual (Hosmer and

147
Lemeshow 2000). Only 5 covariate patterns had values over 6 and were identified as
particularly poorly fitting of the data, further supporting the good fit of the model
(Figure 6.1). Evaluation of the delta beta diagnostic statistic identified only 2 relatively
influential covariate patterns with a delta beta greater than 0.5 and none greater than 0.7
(Figure 6.2). These observations were checked for errors and none found. When the
model was run without these two covariate patterns the parameter estimates were
minimally changed, suggesting minimum influence on the observed coefficients. Hence
these covariate patterns were retained in the model. There was evidence of clustering at
the clinic level (rho=0.16, standard error 0.03, p=0.053) and clinic identity was retained
as the random effect in the model.
Figure 6.1 The Delta Deviance diagnostic statistic versus the estimated probability for
the Dog model
*H-L dD, Hosmer-Lemeshow delta deviance diagnostic statistic. Pr(case), probability of being a case. J=437 covariate patterns.
H-L
dD
Pr(case).002611 .988207
.004925
7.83513

148
Figure 6.2 The Delta Beta diagnostic statistic versus the estimated probability for the
Dog model
Pre
gibo
n's
dbet
a
Pr(case).002611 .988207
5.6e-06
.650047
*Dbeta, Delta Beta diagnostic statistic. Pr(case), probability of being a case. J=437 covariate patterns.
6.3.2 Sick Dog Study
The mean age of controls in the sick population was 8.9 (sd 3.9), with 47% male and
53% female. Eighteen percent of controls were crossbred, with terrier and gun dog
breeds also well represented (Table 6.7a). The majority of dogs were primary cases
(80%). Eighty percent were ASA grade 3, 20% ASA grade 4 and the presenting
conditions were mostly cardiopulmonary, digestive or urinary disease (Table 6.7b). The
majority had had preoperative bloods (77%) and additional tests (72%), and most were
starved (89%) (Table 6.7b). In contrast to the general study population, the majority of
Sick Dog procedures were urgent or emergency status (60%), more were major
procedures compared to minor (59%) and mean duration of procedures was longer (78.7
minutes +/- 59.6sd, Dog study 55.1 minutes +/- 41.5 sd, p< 0.001)(Table 6.7c).
Premedication was mostly undertaken with acepromazine combinations (57%), and
rarely with medetomidine (2%) (Table 6.7d). Induction of anaesthesia was primarily
with propofol (84%) and maintenance with isoflurane (87%, Table 6.7d). Eighty-one
percent of dogs had an intravenous catheter placed and 68% received perioperative fluid
therapy. More patients were monitored by a veterinary surgeon (21%, Table 6.7f)
compared to the general study population, though monitoring remained primarily pulse
rate (77%), respiration rate (93%) and pulse oximetry (65%). Further monitoring was
only seen in 10 to 20% of the Sick controls, though more Sick patients were

149
monitored continuously postoperatively (47%) and thirty-one percent had there
temperature taken postoperatively. Junior veterinary surgeons undertook the majority of
procedures (61%), though 34% of veterinary surgeon had a postgraduate qualification
(34%).
6.3.2.1 Univariable Associations
Increased odds of anaesthetic-related death at the univariable level were associated with
extremes of weight, estimating patient weight, previous anaesthetics, ASA grade 4 or 5,
increasing procedure urgency and difficulty, major versus minor procedures,
maintenance other than with isoflurane, controlled ventilation, intravenous fluid
therapy, and poor recovery quality (Tables 6.6a-f). Reduced odds were associated with
preoperative blood tests, starvation, longer procedure duration, premedication agents
used, administration of nitrous oxide and having an unqualified nurse monitor the
anaesthetic. Cases were not significantly different from the controls in age (case 8.2+/-
3.9 years (mean +/- sd), controls 8.9+/-3.9 years, p=0.19), weight (cases 22.8+/-15.8 kg,
controls 21.4+/-12.1 kg, p=0.46) or duration of anaesthesia (cases 71.0+/-67.1 min,
controls 78.7+/-59.6, p=0.39).

150
Table 6.7.a The association of patient variables with anaesthetic-related death in Sick
Dogs
*Odds ratios (OR) and 95% confidence intervals (CI) are reported, with the Likelihood Ratio Test (LRT) P values for multiple category variables at the top of the ‘P Value’ column.
Variable Categories Cases
Controls OR* 95% CI* P value
Categorical Age 0- ≤ 0.5 years 0.5 – 5 years 5 – 12 years 12 years - max
5 11 64 19
2 14 56 27
3.2 1 1.5 0.9
0.5– 21.2 0.6 – 3.5 0.3 – 2.4
0.31 0.21 0.40 0.83
Sex Male Female
44 55
47 52
1 1.1
0.6 – 2.0
0.67
Neutered Entire Neutered Unknown
48 47 4
53 45 1
1 1.2
0.7 – 2.0
0.62
Categorical Weight
0-8 kg 8-20 kg 20- max Unknown
20 18 61 0
11 37 50 1
3.7 1 2.5
1.4 – 10.0 1.3 – 5.0
0.01 0.01 0.01
Overweight Not overweight Overweight Unknown
75 20 4
75 20 4
1 1.0
0.6 – 1.7
1.00
Scales used
Scales Estimate
75 24
94 5
1 6.02
2.1 – 17.2
<0.001
Breed Crossbred Cocker spaniel GSD WHWT Hounds Working Dogs Terriers Gun Dogs Pastoral Dogs Utility Toy
10 5 8 4 4 7 13 17 12 10 9
18 1 7 1 9 6 17 19 7 6 8
1 9.0 2.1 7.2 0.8 2.1 1.4 1.6 3.1 3.0 2.0
0.8 – 108.4 0.6 – 7.6 0.6 – 87.0 0.2 – 3.3 0.5 – 8.3 0.5 – 4.0 0.6 – 4.5 0.9 – 11.0 0.8 – 11.4 0.6 – 7.1
0.26 0.04 0.05 0.07 0.76 0.27 0.56 0.36 0.07 0.09 0.26
Primary Case Primary patient Referral patient Unknown
75 24 0
79 19 1
1 1.3
0.7 – 2.6
0.41
Previous Anaesthetics or Sedations
None One or more Unknown
60 30 9
78 14 7
1 1.7
1.1 – 2.6
0.025

151
Table 6.7.b The association of further patient variables with anaesthetic-related death in
Sick Dogs
*Odds ratios (OR) and 95% confidence intervals (CI) are reported, with the Likelihood Ratio Test (LRT) P values for multiple category variables at the top of the ‘P Value’ column.
Variable Categories Cases Controls OR* 95% CI* P value
Preoperative disease
CardiopulmonaryNeurological Digestive Urogenital Other
26 6 50 9 8
32 4 32 18 13
1 1.9 1.9 0.6 0.8
0.5 – 7.4 1.0– 3.9 0.2 – 1.6 0.3 – 2.1
0.06 0.38 0.06 0.32 0.59
ASA Grade ASA3 ASA4-5
37 62
79 20
1 6.6
3.3 – 13.4
<0.001
Preoperative examination
No Yes Unknown
0 98 1
0 99 0
Preoperative bloods No Yes
38 61
23 76
1 0.5
0.3 – 0.9
0.02
Other tests No Yes Unknown
31 67 1
27 71 1
1 0.8
0.4 – 1.5
0.53
Starved Preoperatively
No Yes Unknown
11 73 15
4 88 7
1 0.3
0.1 – 1.0
0.04
Water withheld
No Yes Unknown
44 36 19
53 34 12
1 1.3
0.7 – 2.4
0.44

152
Table 6.7.c The association of procedural factors with anaesthetic-related death in Sick Dogs
*Odds ratios (OR) and 95% confidence intervals (CI) are reported, with the Likelihood Ratio Test (LRT) P values for multiple category variables at the top of the ‘P Value’ column.
+‘Trend’ represents the OR for a one-category increase in the variable.
Variable Categories Cases Controls OR* 95% CI* P value
Urgency
Scheduled Urgent Emergency
Trend+
16 44 39
40 48 11
1 2.3 8.9
2.9
1.1 – 4.7 3.2 – 24.7
1.9 – 4.5
<0.001 0.02 <0.001
<0.001
Procedure Performed Neutering Dental Diagnostics Minor proceduresMajor procedures None
0 2 14 3 63 17
1 5 22 14 57 0
0 0.6 1 0.3 1.7
0.1 – 3.8 0.1 – 1.5 0.8 – 3.7
0.01 0.44 0.13 0.15
Procedure Intended Minor Major
26 73
44 55
1 2.3
1.2 – 4.1
0.008
Procedure Difficulty
Simple Moderate Difficult Very difficult No procedure Unknown
18 37 20 7 17 1
31 43 20 3 0 2
1 1.5 1.7 4.0
0.7 – 3.1 0.7 – 4.1 0.9– 18.6
<0.001 0.29 0.21 0.05
Recumbency Lateral Dorsal Sternal Multiple
16 62 7 14
15 55 5 24
1 1.1 1.3 0.6
0.5 – 2.3 0.3 – 5.1 0.2 – 1.5
0.33 0.89 0.70 0.22
Duration intended
0-29 min 30-59 min 60-89 min 90 – max Unknown
7 33 30 29 0
8 33 25 32 1
1 1.1 1.4 1.0
0.4 – 3.5 0.4 – 4.4 0.3 – 3.2
0.95 0.82 0.59 0.95
Induction Time 8 am - 12 pm 12 pm - 5 pm 5 pm – 8 am
45 37 17
52 37 10
1 1.2 2.0
0.6 – 2.1 0.8 – 4.8
0.31 0.64 0.13

153
Table 6.7.d The association of anaesthetics with anaesthetic-related death in Sick Dogs
*Odds ratios (OR) and 95% confidence intervals (CI) are reported, with the Likelihood Ratio Test (LRT) P values for multiple category variables at the top of the ‘P Value’ column. + Includes combinations of premedicant with other drugs (e.g. opioids).
Variable Categories Cases Controls OR* 95% CI* P value
General Anaesthesia or Sedation
General anaesthetic Sedation
94 5
92 7
1 0.7
0.2 – 2.3
0.55
Premedication+ None Acepromazine Medetomidine BZ / Opioids only
37 29 3 30
19 56 2 22
1 0.3 0.8 0.7
0.1 – 0.6 0.1 – 5.1 0.3 – 1.5
0.01 <0.0010.79 0.37
Induction agents Thiopentone Propofol Medetomidine Mask induction Other
3 81 2 9 4
6 83 4 2 4
1 12.0 1.0 17.1 5.7
0.5 – 8.1 0.1 – 9.7 0.8 – 102.80.3 – 15.5
0.16 0.35 1.00 0.03 0.50
Inhalation Agent
Isoflurane Halothane Sevoflurane None
70 11 5 13
86 5 1 7
1 2.7 6.1 2.8
0.9 – 8.3 0.7 – 55.5 0.9 – 6.1
0.03 0.07 0.07 0.09
Induction and Maintenance Combinations
Injectable/Isoflurane Injectable/Halothane Injectable/SevofluraneInjectable Only Inhalational Only
63 11 2 13 10
80 5 1 7 6
1 2.8 2.5 2.4 2.1
0.9 – 8.6 0.2 – 29.0 0.9 – 6.3 0.7 – 6.2
0.20 0.06 0.44 0.08 0.16
ET Intubation No ET tube ET tube
8 91
7 92
1 0.9
0.3 – 2.5
0.79
Oxygen No Oxygen Oxygen
4 95
5 94
1 1.3
0.3 – 4.9
0.73
Nitrous oxide No nitrous oxide Nitrous oxide Unknown
88 10 1
77 20 2
1 0.4
0.2 – 1.0
0.04
Ventilation Spontaneous Controlled
74 25
91 8
1 3.8
1.6 – 9.3
0.01
Perioperative fluids No fluids Intravenous Catheter Fluids
12 1 86
17 15 67
1 0.1 1.8
0.0 – 1.0 0.8 – 4.1
<0.001 0.01 0.14

154
Table 6.7.e The association of monitoring variables with anaesthetic-related death in
Sick Dogs
*Odds ratios (OR) and 95% confidence intervals (CI) are reported, with the Likelihood Ratio Test (LRT) P values for multiple category variables at the top of the ‘P Value’ column.
Variable Categories Cases Controls OR* 95% CI* P value
Monitoring person Vet Nurse
30 69
21 78
1.6 1
0.8 – 3.1
0.15
Other duties of monitor
No other duties Performing the op Assisting the op Unknown
81 3 14 1
77 5 17 0
1 0.6 0.8
0.1 – 2.5 0.4 – 1.7
0.64 0.45 0.55
Record No record Record Unknown
49 45 5
46 53 0
1 0.8
0.5 – 1.4
0.43
Pulse monitored No pulse pulse monitored
24 75
23 76
1 1.0
0.5 – 1.8
0.87
Respiratory rate monitored
No respiratory rate Respiratory rate
13 86
7 92
1 0.5
0.2 – 1.3
0.16
Pulse oximeter used No Pulse oximeter Pulse oximeter
39 60
35 64
1 0.8
0.5 – 1.5
0.86
Capnography used No Capnograph Capnograph
80 19
87 12
1 1.7
0.8 – 3.8
0.17
Arterial Blood Pressure
None Direct Indirect
86 3 10
89 3 7
1 1.0 1.5
0.2 – 5.3 0.5 – 4.1
0.75 0.97 0.45
ECG None ECG
80 19
84 15
1 1.3
0.6– 2.8
0.45

155
Table 6.7.f The association of recovery and personnel factors with anaesthetic-related
death in Sick Dogs
*Odds ratios (OR) and 95% confidence intervals (CI) are reported, with the Likelihood Ratio Test (LRT) P values for multiple category variables at the top of the ‘P Value’ column.
Variable Categories Cases Controls OR* 95% CI* P value
Recovery Quality
Good Moderate Poor Unknown No full recovery
13 11 6 2 67
75 16 2 6 0
1 4.0 17.3
1.5– 10.9 2.6– 114.2
<0.001 0.004 <0.001
Recovery observed Continuously Every 5 minutes10 minutes + Unknown No recovery
21 10 10 2 56
47 26 21 5 0
1 0.9 1.1
0.4 – 2.1 0.6 – 2.7
0.92 0.74 0.99
Rectal Temperature Taken (postoperative deaths only)
No Yes Unknown
32 13 1
68 31 0
1 0.9
0.4– 1.9
0.77
Veterinary Surgeon familiarity with Anaesthetic
Very familiar Familiar or Unfamiliar Unknown
80 13 6
83 14 2
1 1.0
0.4 – 2.2
0.93
Veterinarian type Senior Veterinarian Junior Veterinarian Locum Unknown
46 48 4 1
37 60 2 0
1 0.6 1.6
0.4– 1.2 0.3– 9.4
0.22 0.13 0.59
Veterinarian Postgraduate qualifications
None Anaesthesia General Unknown
62 4 31 2
65 6 28 0
1 0.7 1.2
0.2– 2.6 0.6– 2.2
0.74 0.59 0.64
Anaesthetist Familiarity with Anaesthetic
Very familiar Familiar or Unfamiliar Unknown
84 13 2
74 16 9
1 0.7
0.3 – 1.6
0.41
Anaesthetist type Vet Nurse Unqualified person
29 54 16
20 58 21
1 0.6 0.5
0.3 – 1.3 0.2 – 1.3
0.29 0.20 0.15

156
6.3.2.2 Multivariable Model
Health status and procedure urgency remained important variables on which to build the
model (Table 6.8). Patient weight, inhalation agent, ventilation type and preoperative
blood tests were included in the model based on their low likelihood ratio p values. A
significant interaction between ASA grade and preoperative blood tests was detected
and was retained in the model. Clustering by clinic identity was not significant and was
not retained in the model (p=1.0).
Table 6.8 Final logistic regression model of the risk of anaesthetic-related death in Sick
Dogs
*Odds ratios (OR) and 95% confidence intervals (CI) are reported, with corresponding Likelihood Ratio Test (LRT) P values. Number of observations 197 out of 198. +‘Trend’ represents the odds ratio for a one-category increase in the variable.
The model goodness of fit as assessed by the Hosmer – Lemeshow statistic was
adequate (P value = 0.38) (Hosmer and Lemeshow 2000). Additional assessment of
Variable Categories β s.e. β OR* 95% CI* P value
ASA grade ASA 3 ASA 4 – 5
3.61
1.14
37.2
4.0 – 346.2
<0.001
Preoperative bloods No bloods bloods
-0.33
0.49
1 0.7
0.3 – 1.9
0.02
ASA grade X Preoperative bloods - 2.35 1.31 0.09 0.01 – 1.0 0.02
Urgency
Scheduled Urgent Emergency
Trend+
0.73
0.35
2.1
1.1 – 4.1
0.007
Categorical Weight
0-5 kg 5-15 kg 15- max
1.95 0.93
0.64 0.39
7.1 1 2.5
2.0 – 24.7 1.17 – 5.49
0.002
Inhalation Agent Isoflurane Halothane Sevoflurane None
1.58 0.34 0.40
0.54 0.85 0.51
1 4.9 1.4 1.5
1.7 – 14.0 0.3 – 7.4 0.6 – 4.0
0.08
Ventilation Spontaneous Controlled
1.21
0.56
1 3.4
1.1 – 10.0
0.02
Intercept -3.10 0.85

157
model with the regression diagnostic delta deviance, also suggested good model fit,
with only 3 covariate patterns having delta deviances greater than 4 (Figure 6.3).
Evaluation of the delta beta diagnostic statistic identified 9 covariate patterns with a
delta beta greater than 1.0 (Figure 6.4). These observations were checked for errors and
none found. When the model was rerun without these nine covariate patterns, health
status and its interaction with preoperative blood tests were affected due to the
subsequent presence of zero cells in the contingency table. Other parameter estimates
did change, though were generally of a similar order and direction. Further the covariate
patterns remained biologically plausible and were retained in the model.
Figure 6.3 The Delta Deviance diagnostic statistic versus the estimated probability for
the Sick Dog Model
H-L
dD
Pr(case).063043 .994889
.000729
4.90798
*H-L dD, Hosmer-Lemeshow delta deviance diagnostic statistic. Pr(case), probability of being a case. J=78 covariate patterns.

158
Figure 6.4 The Delta Beta diagnostic statistic versus the estimated probability for the
Sick Dog Model
Pre
gibo
n's
dbet
a
Pr(case).051504 .978324
.000045
1.30077
*Dbeta, Delta Beta diagnostic statistic. Pr(case), probability of being a case. J=78 covariate patterns.
Hence after adjusting for other variables increasing ASA grade, low patient weight,
increasing procedure urgency, maintenance of anaesthesia other than with isoflurane
and controlled ventilation were associated with increased odds of anaesthetic-related
death. Preoperative blood tests were associated with reduced odds (Table 6.8).
6.4 Discussion
This chapter has identified a number of potential contributors to anaesthetic-related
death in Dogs. Patient health status and weight, and procedural urgency were useful
factors for aiding patient assessment in both Dogs and Sick Dogs. The choice of
inhalation agent used was a modifiable factor retained in both models and may allow
reduction in risk. In the overall Dog Study procedure complexity and duration, and
patient age were further factors potentially useful to aid patient assessment, whilst in
Sick Dogs, the method of ventilation and the use of preoperative blood tests may
contribute to reduced risk.
159
6.4.1 Methodological Considerations
In assessing the validity of the reported models and the conclusions drawn, it is
necessary to evaluate the limitations of the methodology and given these limitations,
assess how well the model explains the data.
6.4.1.1 Study Design and Conduct
Case definition and selection were important considerations in evaluating the limitations
of this Study (Hennekens and Buring 1987). The definition of anaesthetic-related death
was potentially open to variable interpretation and inconsistent categorisation by
participating centres. Due to this concern, centres were required to return a case-control
questionnaire for all perioperative deaths within 48 hours of anaesthesia unless there
was clear evidence of no role of anaesthesia. Additionally the primary investigator
cross-checked all case-control questionnaires against the cohort diary (Chapter 2) to
ensure all perioperative deaths had case-control questionnaires submitted or if no form
was returned that there was sufficient information to exclude them from being
considered cases. For those deaths where no case-control questionnaire was returned,
the primary investigator contacted the centre to confirm anaesthesia did not contribute
and requested a form if there was any doubt. This allowed a spectrum of deaths to be
considered by the independent review panel (see Chapter 2), without the loss of
potential cases. The independent review panel classified all cases against a strict list of
criteria (Appendix 2.4) in order to increase consistency of classification. Issues of bias
in selecting cases were minimised by using a population-based design and attempting to
include all cases in the population (Hennekens and Buring 1987).
The controls should represent the population of individuals that would have been
identified and classified as cases had they developed the outcome (Hennekens and
Buring 1987; Dohoo, Martin et al. 2003). Given the population from which the cases
were derived was known (i.e. the cohort); randomisation of the controls across the
cohort should have provided representative controls. In the Sick Dog study, the specific
cohort of sick dogs was not known, as health status was not recorded in the cohort
diary. Hence it was assumed that the population of sick dogs would follow a similar
distribution, across clinics and clinic workload, to the overall cohort and the sick dogs
were randomised as for the overall controls. The exact distribution of sick dogs may

160
have varied, with some centres (e.g. referral institutions) anaesthetising more sick dogs
than others. However the majority of centres were primarily first opinion (95%), and as
such were more likely to see a similar distribution of sick dogs.
Selection bias, with differential selection of controls on the basis of their exposure
histories, was a potential concern (Hennekens and Buring 1987). Given the intended
inclusion of all cases this was less of a concern in the cases. However it was a potential
issue for the controls and in this study it was minimised by randomising the controls
across the cohort of patients anaesthetised and sedated (see Chapter 2) (Breslow and
Day 1980; Dohoo, Martin et al. 2003). Differential patient management due to the
process of being studied, the Hawthorne effect (Mangione-Smith, Elliott et al. 2002;
Dohoo, Martin et al. 2003), was also a potential source of bias, and was minimised by
prospectively requesting the controls, soon after each anaesthetic had been undertaken.
The issue of non-response was a consideration. The response rate for the cases was
good: of 287 deaths recorded in the cohort study, only for 15 deaths (5%) was there
insufficient information to exclude them from being cases. The low non-response rate in
the cases should have limited its’ potential bias on the results (Dohoo, Martin et al.
2003). The response rate for the controls of 82% for the Dog Study was considered
good based on a suggested aim of a non-response rate of less than 20 to 30% (Dohoo,
Martin et al. 2003). Nonetheless, the 18% of non-returned controls could have biased
the results if the non-returned controls’ exposure histories differed markedly from the
recorded control population (Dohoo, Martin et al. 2003). A random sample of 20% of
these non-responders generally indicated similar exposure histories for major risk
factors compared to the returned controls. However there was a significant tendency for
non-returned controls to be more likely to be emergency or urgent (versus scheduled)
and to be sedation versus general anaesthesia compared to returned controls. That non-
responding controls were more likely to be emergency or urgent, would suggest the
odds of being an urgent or emergency procedure in the controls was underestimated and
hence the reported increasing odds of death with increasing urgency may have been
over-estimated. Similarly the tendency to reduced odds with sedation versus general
anaesthesia would have been underestimated if more sedations were non-responding
controls than anaesthetics. The latter effect may have contributed to the non-
significance of this finding. However this was a sample of 20% of non-responders
161
and though a random sample, by chance it may not have been representative of all non-
responders. The tendencies discussed above were not found in the Cat study (Chapter 7)
and hence over-interpreting this potential bias should be cautioned. The lower response
rate of 51% in Sick Dog studies was of greater concern however and these results must
be interpreted more cautiously. Substantial non-response bias could have occurred.
Some of these non-responders resulted from the practice not having an appropriate
patient within the previous 2 to 3 weeks, however, a number would have been patients
for which a questionnaire was not returned. Assessing the direction of bias was more
difficult in this group because individual sick patients could not be directly identified
from the cohort data as health status was not recorded in the cohort. Hence the risk
factors identified in this population must be treated as preliminary findings.
Information or observation bias, particularly errors of misclassification, was a further
potential concern (Breslow and Day 1980; Dohoo, Martin et al. 2003). Misclassification
of exposure histories by the participating centres, was minimised by checking the case-
control questionnaires against anaesthetic record forms when available, and by
assessing the plausibility of the data. Data entry errors were minimised by checking the
data twice and randomly checking 20% of the entered data again. In these random
checks less than 5% of the cases and controls had an error. Misclassification of outcome
was reduced by appointing an independent review panel to assess the potential cases,
against a specific criteria list (Chapter 2). Recall bias was minimised by requesting the
controls soon after the anaesthetic was undertaken, such that both case and control
questionnaires would have been completed in the immediate days after the event whilst
still fresh in the minds of those completing the questionnaires (Hennekens and Buring
1987; Dohoo, Martin et al. 2003). Further, the majority of the important information
required for the forms would have been recorded in the practices’ patient records. Hence
efforts to minimize misclassification were made, and if they occurred the likelihood was
that they were primarily non-differential in nature and at worst biased the measured
odds towards unity (i.e. underestimated associations) (Dohoo, Martin et al. 2003).
6.4.1.2 Analysis
In the model building process, the likelihood ratio test statistic (LRT statistic) was
preferred to the Wald test statistic when interpreting the significance of independent
variables. The Wald test has been reported to be less reliable and consistent

162
compared to the LRT statistic, particularly for small sample sizes, and hence the latter
approach was used (Hauck and Donner 1977; Hosmer and Lemeshow 2000; Dohoo,
Martin et al. 2003).
The issue of missing case-control data would primarily be a concern if omissions were
non-random and biased the results (Breslow and Day 1980; Katz 1999). Efforts were
made at the Study conduct stage to minimised missing data, but some data remained
unknown. At the univariable level, separate categories for unknown values were created
for categorical variables, allowing inclusion of this data and assessment of potential
associations of the unknown categories with outcome. Variables with large numbers of
missing values were not included in the multivariable analysis. For example
postoperative temperature was incompletely answered and was omitted from the
multivariable analysis. Other variables with fewer missing values were considered in
the multivariable analysis but where there was a choice of variables with similar LRT P
values, the more complete variable was selected. If variables are retained in the final
model with missing values, some authors suggest reporting the univariable analysis with
the reduced data set (Katz 1999). The alternative of reporting the number of missing
values in the final multivariable model and retaining them in the univariable analysis
was preferred, as the missing values tended to occur in a few variables only (e.g. age)
(Breslow and Day 1980; Schlesselman 1982; Katz 1999).
Specific numerical problems have been reported during logistic regression analysis, and
of particular concern are zero cells in the contingency tables, covariates that complexly
separate the outcome groups, and collinearity of the data (Hosmer and Lemeshow
2000). The problem of zero cells in the contingency cells was dealt with by collapsing
categories with zero cells and sparse data (Hosmer and Lemeshow 2000). This was done
at the univariable and multivariable stages for a number of variables. For example ASA
grade 5 was only reported in the cases, not the controls (as expected) hence this
category was combined with ASA 4 at the univariable stage. Similarly for a number of
categorical variables with sparse data in specific categories, some categories were
combined in anticipation of zero cells at the multivariable stage. Collinearity was
observed between some variables and where possible the variables were combined, or
only the biologically more valuable variable was retained (Katz 1999; Hosmer and
Lemeshow 2000). The conceptual framework developed a priori (Chapter 2) also

163
informed on the likelihood of correlation between variables and helped identify overlap
between variables. This aided the decision making on which variables were retained in
the model building process. For example procedure difficulty was recorded as well as
procedure type. These were considered likely to be not independent, and as such
procedure type (intended procedure) was retained in the model and procedure difficulty
excluded.
Concerns of confounding were addressed by measuring and adjusting for the anticipated
variables in the multivariable analysis (Breslow and Day 1980; Hennekens and Buring
1987; Dohoo, Martin et al. 2003). Previous work in small animals (Clarke and Hall
1990; Dyson, Maxie et al. 1998; Brodbelt, Hammond et al. 2005), and the Pilot Study of
the present study (see Chapter 2), identified health status as a major source of
confounding and this was the key variable to adjust other factors by. The issue of
residual confounding remained for certain variables where incomplete adjustment for
the confounder could be made. Residual confounding will be discussed within the risk
factor discussion. The potential for interactions was also addressed during the model
building process and potential interactions were identified at the univariable stage by
stratifying the results by major variables. In the final model two way interactions
between independent variables were also assessed. In the main dog model no major
interactions were identified whilst in the Sick dog the reported interactions were
documented.
Methods of assessing model fit are important when evaluating the analysis performed.
Model fit as assessed by the Hosmer Lemeshow goodness-of-fit test statistic (Hosmer
and Lemeshow 2000) was good in both models. Visual evaluation of the respective
tables of expected and observed deciles, supported reasonably good fit of both models
(Dohoo, Martin et al. 2003). Further evaluation of the model with assessment of
diagnostic statistics was also good. Regression diagnostics used to evaluate the
influence of covariate patterns on the model and overall model fit, include delta
deviance (Hosmer and Lemeshow 2000; Dohoo, Martin et al. 2003). Delta deviances
greater than 4 or 5 are generally considered poorly fitting covariate patterns (Hosmer
and Lemeshow 2000), and in both studies there were few large delta deviances. The
delta beta diagnostic test statistic is a regression diagnostic that provides a summary
measure of the influence of individual covariate patterns on the estimated

164
parameters (Hosmer and Lemeshow 2000; Dohoo, Martin et al. 2003). Covariate
patterns with delta betas greater than 1.0 are said to be influential and should be
investigated (Hosmer and Lemeshow 2000). The Dog study had no large delta betas and
the Sick Dog study had only a few moderately influential covariate patterns. These
patterns were considered biologically plausible and retained. Performing the analysis
without the few moderately influential covariate patterns did not substantially affect the
model coefficients, and it was concluded the models explained the data well (Hosmer
and Lemeshow 2000; Dohoo, Martin et al. 2003).
Validation of the model, additional to assessing model fit, could have been undertaken
by collecting new data or dividing the existing data set (Katz 1999; Hosmer and
Lemeshow 2000). Collecting further data is preferred but as in the present study this
was not feasible. Alternatives to this include split-group, jackknife and bootstrap
methods, all variations of subdividing the dataset and re-evaluating the model with the
smaller subgroups. These methods of model validation are particularly important to
models predicting prognosis or diagnosis of disease but are rarely undertaken for studies
identifying factors associated with an outcome whilst adjusting for confounders, as was
the current work (Katz 1999; Dohoo, Martin et al. 2003).
6.4.2 Descriptive Data
The descriptive details from the Controls provided further information on trends in
anaesthesia to complement and support the clinic level data reported in Chapter 3. The
common use of acepromazine was consistent with clinic level data (Chapter 3), and
previous reports (Clarke and Hall 1990; Dyson and Pettifer 1997; Joubert 2000; Wagner
and Hellyer 2000; Nicholson and Watson 2001). The predominance of propofol use for
induction in anaesthesia was also consistent with the clinic level data (Chapter 3) and
more recent work in the USA (Wagner and Hellyer 2000), but contrasts with earlier
work in the UK and elsewhere (Clarke and Hall 1990; Dodman and Lamb 1992; Dyson,
Maxie et al. 1998; Joubert 2000; Nicholson and Watson 2001). Maintenance of
anaesthesia was primarily with isoflurane, indicating similar trends in anaesthetic use in
Dogs in practice in the USA and UK (Wagner and Hellyer 2000). Patient monitoring, as
highlighted in the Chapter 3, was limited, with observation of pulse and respiratory rates
being the principle methods used. Encouragingly, separate personnel generally
monitored the patient and pulse oximetry was used in just over half of controls.

165
Other methods were used in only 10% of the controls. This was comparable to other
recent veterinary practice-based work (Dyson and Pettifer 1997; Joubert 2000; Wagner
and Hellyer 2000; Nicholson and Watson 2001), though contrasts with the more
elaborate medical requirements of the minimum monitoring standards published by
Eichhorn and colleagues and recommended by the American Society of
Anesthesiologists (1986).
6.4.3 Risk Factors in the Dog Study
Patient health status, as described by the ASA Grade (Anon 1963), was an important
factor associated with anaesthetic-related death, with a 6-fold increase in odds seen with
an increase of one increment in patient status. The observation of increased risk with
poorer health status was valuable in quantifying the risks and for identifying patients
that need particularly careful perioperative management and provided further evidence
of its relevance to veterinary species. Further, within the model, health status was a
major confounder to adjust for. The association with health status has been consistently
reported in other species within this study (Chapters 5 and 7), in other small animal
studies (Clarke and Hall 1990; Dyson, Maxie et al. 1998; Hosgood and Scholl 1998;
Brodbelt, Hammond et al. 2005), in horses (Eastment, Johnston et al. 2002; Johnston,
Eastment et al. 2004) and in human anaesthesia (Marx, Mateo et al. 1973; Hovi-Viander
1980; Lunn and Mushin 1982; Pottecher, Tiret et al. 1984; Tiret, Desmonts et al. 1986;
Buck, Devlin et al. 1988; Cohen, Duncan et al. 1988; Forrest, Cahalan et al. 1990; 1990;
Pedersen, Eliasen et al. 1990; Forrest, Rehder et al. 1992; Pedersen 1994; Warden,
Borton et al. 1994; Tikkanen and Hovi-Viander 1995; McKenzie 1996; Warden and
Horan 1996; Wolters, Wolf et al. 1996; Biboulet, Aubus et al. 2001; Morita,
Kawashima et al. 2001; Donati, Ruzzi et al. 2004). Anaesthetic agents cause
cardiopulmonary depression and the presence of pre-existing pathology is likely to
predispose to greater anaesthetic-induced physiological disturbance (Hall, Clarke et al.
2001).
Procedural urgency was also an important factor to adjust other variables by, and
potentially is an important predictive factor. Increasing urgency by one increment
(scheduled to urgent to emergency) was associated with a 2.5 fold increase in odds.
Though a component of the effect of urgency could reflect residual confounding by
health status, given the small number of categories of ASA grade, the magnitude to

166
of effect suggests a genuine association. Increased risk has been associated with
emergency procedures in the human and equine literature, though not in small animals
(Lunn and Mushin 1982; Pottecher, Tiret et al. 1984; Tiret, Desmonts et al. 1986; Buck,
Devlin et al. 1988; Pedersen, Eliasen et al. 1990; Johnston, Taylor et al. 1995; Biboulet,
Aubus et al. 2001; Eastment, Johnston et al. 2002; Johnston, Eastment et al. 2002;
Newland, Ellis et al. 2002; Donati, Ruzzi et al. 2004). Urgency could reflect the ability
to thoroughly assess and stabilise the patient preoperatively, as well as personnel
staffing levels (many emergency and urgent procedures would be done with less support
staff) and personnel fatigue (emergency procedures were often performed in the night
by staff having worked during the day).
The association of increasing odds of anaesthetic-related death with increasing age, with
dogs 12 years or older being approximately 10 times more likely to die than young
dogs, was an interesting finding suggesting age per se and not the tendency to poorer
health status, to be a factor for anaesthetic-related death. Again residual confounding by
health status could have contributed to the increased odds, but was unlikely to explain
the majority of the ten–fold increase in odds for older dogs reported. There was a
tendency to an interaction between health status and age such that the greatest increase
in odds in old patients was in the healthy patients (ASA 1-2) though it was not retained
in the model as it was not statistically significant. The latter observation was supported
however by the lack of an association with age in the Sick dog model. Nonetheless the
increasing odds with old age is supported by work in a referral population of dogs, that
demonstrated old age being associated with perioperative death (Hosgood and Scholl
1998). Other small animal studies were unable to demonstrate this, though this may
have been the result of their limited power more than a lack of an association (Clarke
and Hall 1990; Dyson, Maxie et al. 1998; Brodbelt, Hammond et al. 2005). Work in
horses also supported this association (Eastment, Johnston et al. 2002; Johnston,
Eastment et al. 2002; Johnston, Eastment et al. 2004), and in human anaesthesia the risk
associated with increasing age has been well documented (Hovi-Viander 1980; Lunn
and Mushin 1982; Pottecher, Tiret et al. 1984; Tiret, Desmonts et al. 1986; Buck,
Devlin et al. 1988; Cohen, Duncan et al. 1988; Forrest, Cahalan et al. 1990; 1990;
Pedersen, Eliasen et al. 1990; Forrest, Rehder et al. 1992; Pedersen 1994; Warden,
Borton et al. 1994; Tikkanen and Hovi-Viander 1995; McKenzie 1996; Warden and
Horan 1996; Biboulet, Aubus et al. 2001; Morita, Kawashima et al. 2001; Donati,

167
Ruzzi et al. 2004). Biologically, the association is supported by the tendency for old
patients to be more susceptible to the depressant effects of anaesthetics, to hypothermia
via impaired thermoregulatory mechanisms and to prolonged recoveries due to
tendencies to reduced metabolic function and hypothermia (Waterman 1981; Dhupa
1995; Meyer 1999; Hall, Clarke et al. 2001).
Patient weight was also associated with anaesthetic-related death, with patients under 5
kg being 7 times more likely to die. A component of this association could be residual
confounding by age in particular as the younger patients would generally be the smallest
though this is not established. In dogs, the association has not been reported previously,
though small patients do tend to an increased risk of hypothermia (Waterman 1981;
Dhupa 1995; Murison 2001). Smaller patients could also have been prone to drug
overdose, as small errors in estimation of patient weight or drug dose calculation would
have had greater effects than in larger patients. There was a tendency for breed being
associated with outcome and in part this may relate to certain breeds being at increased
odds due to their small size. However, breed was not entirely confounded by weight and
was not included in the final model more due to insufficient study power to assess a
large number of breeds. Non-significant tendencies to increased odds were seen with
brachycephalic breeds (as represented by toy and utility breeds) and previous work has
also suggested increased risk with brachycephalic breeds (Clarke and Hall 1990).
Intended procedure was retained in the final model with major procedure patients being
5.2 times more likely to die than minor procedure patients. A more specific
categorisation was significant at the univariable level (Table 6.5c), but the large number
of categories in this version was limited by model power and problems of zero cells in
the contingency table (Hosmer and Lemeshow 2000). Intended procedure was preferred
to actual procedure due to the problem of categorising those patients that died prior to a
procedure (28 cases). Categorising these patients separately was difficult as it suggested
an increase in odds if no procedure was performed, whilst excluding them would have
excluded a significant stratum of patients. Intended procedure represented a predictive
variable and could be valuable in aiding preoperative assessment of the odds of death
based on the anticipated complexity of the procedure. Further, it approximated to actual
procedure and could indicate the likely association with actual procedure an outcome. A
component of this association could have reflected residual confounding by duration

168
of anaesthesia with intended major procedures reflecting increased odds due to the
intended longer duration, but given both variables were retained in the model it was
unlikely to explain the entire effect reported. The association of procedure complexity
has been reported before in rabbits in this study (Chapter 5), in equine anaesthesia
(Eastment, Johnston et al. 2002; Johnston, Eastment et al. 2002; Johnston, Eastment et
al. 2004) and in human anaesthesia (Farrow, Fowkes et al. 1982; Fowkes, Lunn et al.
1982; Pottecher, Tiret et al. 1984; Tiret, Desmonts et al. 1986; Newland, Ellis et al.
2002; Donati, Ruzzi et al. 2004). A procedural association was likely to reflect the
increasing stress more complex and invasive procedures imposed on patient physiology.
More complex procedures may result in greater fluid and blood loss, exposure of body
cavities and a tendency to greater hypothermia.
Increasing intended duration of anaesthesia was another important factor with odds
increasing 1.06 times for each ten-minute increase in intended duration. The problem of
intraoperative deaths made assessment of actual duration more difficult. Intraoperative
deaths had shorter durations of anaesthesia than intended, consequently reducing the
duration of anaesthesia in the cases and the association of increasing odds with
increasing duration. To adjust for this, the intended duration was estimated for
intraoperative deaths, based on the mean duration of controls in the same procedural
category (Table 6.5c). Alternatively, only postoperative deaths could have been
considered but this would have reduced the power of the study. Survival analysis could
have been considered as seen in a study of long term outcome in man (Monk, Saini et
al. 2005) and as was preliminarily undertaken in the CEPEF Study (Johnston, Taylor et
al. 1996), however there was insufficient cohort data in the current study to undertake
this. The intended variable thus was primarily a predictive variable such that intended
duration predicted longer actual durations. Increasing odds with increasing intended
duration would thus aid assessment of risk prior to anaesthesia and would also support a
tendency to increased odds with increasing actual duration of death. The association of
increasing intended duration and risk was seen in rabbits in the present study (Chapter
5) and increasing risk with increasing actual duration has been reported previously in
horses (Trim, Adams et al. 1988; Young and Taylor 1990; Young and Taylor 1993;
Eastment, Johnston et al. 2002; Johnston, Eastment et al. 2004) and man (Pottecher,
Tiret et al. 1984; Tiret, Desmonts et al. 1986; Biboulet, Aubus et al. 2001; Newland,
Ellis et al. 2002). Prolonged anaesthesia predisposes to hypothermia (Waterman

169
1981; Dhupa 1995) and longer periods of cardiopulmonary depression, were likely to
have greater effects than short period, by increasing cellular metabolic derangement and
damage (Hall, Clarke et al. 2001).
Maintenance and induction agent combinations were retained in the model with the
major associations being approximately 6-fold increases in odds associated with
halothane maintenance and total inhalational anaesthesia compared to injectable
induction and isoflurane maintenance. The 71-fold increase in odds with injectable
anaesthesia was likely to reflect those patients that died prior to maintenance with an
inhalational agent. Of twelve cases that were anaesthetised with only injectable agents,
11 died before a procedure was performed and only 4 controls were maintained with
injectable anaesthetics. Hence a true association with injectable anaesthesia was
difficult to assess.
The increased odds with halothane contrasts with previous small animal work that
suggested halothane was associated with reduced odds of complication (Dyson, Maxie
et al. 1998), though is consistent with a randomised trial, in which isoflurane was
associated with reduced odds in young horses (Eastment, Johnston et al. 2002; Johnston,
Eastment et al. 2004). The increased odds reported in the small animal study may have
resulted from residual confounding by health status such that veterinary surgeons were
less likely to choose halothane for sicker patients, and though the results were adjusted
for ASA grade, only the binary variable was used (ASA 1-2 versus ASA 3-5). Though
isoflurane induces greater respiratory depression and vasodilation than halothane, it
causes less direct myocardial depression, and sensitises the heart less to catecholamine-
induced arrhythmias and on balance would appear to cause less overall cardiovascular
depression (Joas and Stevens 1971; Steffey, Gillespie et al. 1975; Steffey and Howland
1977; Hellebrekers 1986; Tranquilli, Thurmon et al. 1988; Grandy, Hodgson et al.
1989; Lemke, Tranquilli et al. 1993; Hikasa, Okabe et al. 1996; Hikasa, Ohe et al. 1997;
Hodgson, Dunlop et al. 1998).
The increased odds with total inhalational anaesthesia is consistent with previous work
in small animals and horses in which mask inductions have tended to increased risk of
complications (Clarke and Hall 1990; Johnston, Taylor et al. 1995; Dyson, Maxie et al.
1998; Johnston, Eastment et al. 2002). Inhalational inductions potentially can be
stressful, slower to reach tracheal intubation, and could induce greater

170
cardiopulmonary depression if excessive depth is reached prior to endotracheal
intubation (Hall, Clarke et al. 2001). In a recent study mask inductions were associated
with greater cardiopulmonary depression than injectable combinations in a population
of high-risk patients (Mattson, Kerr et al. 2005).
It is interesting that the main intravenous induction agent appeared to affect outcome
minimally. Though there is a perception in veterinary practice that propofol is a ‘safe’
drug (Wagner, Wright et al. 2003; Bilborough 2005), the cardiopulmonary profiles of
propofol and thiopentone are similar (Glen 1980; Fahy, Mourik et al. 1985; Rolly and
Versichelen 1985; Robinson, Sams et al. 1986; Sebel and Lowdon 1989; Turner and
Ilkiw 1990; Branson and Gross 1994; Hall, Clarke et al. 2001). Dose effects were
evaluated for the major drugs used, and there were consistent tendencies to reduced
odds with increasing dose (Appendix 6.1). This was counter-intuitive given most of
these agents exhibited dose-dependent cardiopulmonary depressant effects (Glen 1980;
Fahy, Mourik et al. 1985; Robinson, Sams et al. 1986; Sebel and Lowdon 1989; Turner
and Ilkiw 1990; Branson and Gross 1994; Hall, Clarke et al. 2001), and a major
component of this observation was the result of confounding by health status, such that
Sicker patients were generally administered smaller doses. However the associations
observed were not completely confounded by health status, but they were not retained
in the model due to limited Study power to evaluate these subpopulations and further
work on dose effects is warranted.
Though there were tendencies to reduced odds with acepromazine and medetomidine
(adjusted OR= 0.5, 95% CI 0.2 – 1.3 and OR=0.2, 95% CI 0.0 – 1.3 respectively),
premedication did not improve the model (LRT p=0.3) and was not retained in the
model. Acepromazine premedication has been associated with reduced risk in small
animals and horses (Clarke and Hall 1990; Johnston, Taylor et al. 1995; Dyson, Maxie
et al. 1998; Johnston, Eastment et al. 2002; Brodbelt, Hammond et al. 2005). The lack
of a major association in the current model, may reflect in part limited power to detect
significant associations for rare (and particularly common) exposures, as medetomidine
was used for premedication in 5% of controls and acepromazine in 77% of controls.
Case-control studies are more limited than cohort studies in their power to detect
associations for rare exposures (Hennekens and Buring 1987). Further work is merited
to evaluate the previous association of reduced odds with acepromazine.

171
Notwithstanding the above discussion, the tendency for reduced odds with the
administration of medetomidine was an interesting observation, particularly as there
was no evidence of increased risk. An older alpha2 adrenoceptor agonist, Xylazine, was
associated with increased risk in a number of small animals studies (Gillick 1981;
Clarke and Hall 1990; Dyson, Maxie et al. 1998). The cardiopulmonary effects of the
alpha2 agonists include transient hypertension followed by hypotension, bradycardia,
increased systemic vascular resistance, reduced cardiac output and minimal respiratory
depression (Muir 1977; Greene and Tranquilli 1988; Savola 1989; Wagner, Muir et al.
1991; Cullen 1996; Ko, Bailey et al. 1996; Golden, Bright et al. 1998; Pyendop and
Verstegen 1998; Pyendop and Verstegen 1999). Additionally, xylazine has been found
to sensitise or not increase the threshold of the heart to catecholamine-induced
arrhythmias under halothane anaesthesia (Muir, Werner et al. 1975; Tranquilli,
Thurmon et al. 1986; Lemke, Tranquilli et al. 1993; Dyson and Pettifer 1997).
Though medetomidine’s actions are similar to those of xylazine (Cullen 1996; Pyendop
and Verstegen 1998; Pyendop and Verstegen 1999), medetomidine has not been found
to sensitise the heart to catecholamine induced arrhythmias (Pettifer, Dyson et al. 1996).
Combined with a greater awareness of the physiological effects of this group of drugs
(in part due to the previous studies mentioned), and an improved understanding of how
to use these drugs, it is plausible that medetomidine was associated with reduce odds.
Clarke and Hall (1990) concluded that the majority of the complications with xylazine
were associated with lack of familiarity with the agent, and their impact on
subsequently administered induction agents. Hence, having assumed originally
medetomidine would be associated with increased odds of anaesthetic-related death, this
was not found in the current study. The odds tended to be reduced and were of a similar
magnitude to that of acepromazine, another common premedicant. Medetomidine would
appear a relatively safe premedicant, though given the relatively infrequent use of it as a
premedicant in the current study, additional work would be merited to further quantify
the potential for reduction in risk.
6.4.4 Risk Factors in the Sick Dog Study
Health status was consistently identified as a major risk factor in this project with poor
health status patients being at particular risk of anaesthetic-related death. In light of the
Pilot Study (see Chapter 2) and the small scale study undertaken in a referral

172
population (Brodbelt, Hammond et al. 2005), it was identified that the overall study
population would generate insufficient poor health status controls to be able to evaluate
associations in this important subpopulation carefully. Additionally it was thought the
potential for improving patient outcome was particularly great in this group if important
associations were identified. Hence this sub-study was undertaken.
Within the Sick Dog study, health status and procedure urgency were retained in the
model, suggesting that in this more homogeneous population of high risk patients,
increasingly poor health status and increasing urgency were still important determinants
of outcome. The association with extremes of weight was also retained in the model,
and biologically it would be expected that small high-risk patients would also be prone
to increased odds of anaesthetic-related death due to greater risk of drug overdose and
hypothermia (Waterman 1981; Dhupa 1995; Murison 2001). Further, overweight sick
patients may also be less tolerant of anaesthesia, having poorer cardiopulmonary
reserves (Hall, Clarke et al. 2001).
Premedication was not retained in the final model, though similar tendencies to reduced
odds particularly with acepromazine, were seen at the univariable stage. That
premedication was not included in the final model may also reflect limits of power.
Inhalation agent was retained in this model, with isoflurane being associated with
reduced odds, though after including the interaction between health status and
preoperative bloods (see below) its LRT p value was just above 5%. On examining the
residuals and model fit with and without this variable (see later), there were fewer large
delta betas (delta betas >1.0: 9 covariate patterns versus 18) when inhalation agent was
retained in the model, and combined with the near significance (p= 0.08), it was felt
important to include this variable. Poorer health status patients would be expected to be
particularly sensitive to the greater myocardial depression observed with halothane
compared to isoflurane anaesthesia (Joas and Stevens 1971; Steffey, Gillespie et al.
1975; Steffey and Howland 1977; Hellebrekers 1986; Tranquilli, Thurmon et al. 1988;
Grandy, Hodgson et al. 1989; Lemke, Tranquilli et al. 1993; Hikasa, Okabe et al. 1996;
Hikasa, Ohe et al. 1997; Hodgson, Dunlop et al. 1998).
Mode of ventilation was a significant variable in this model. Confounding by procedure
type, a variable not retained in the final model, could have contributed to this
association with procedures performed under controlled ventilation being more

173
complicated and higher risk than those performed with spontaneous ventilation.
However preliminary stratification and Mantel Haenzel adjustment of ventilation for
major versus minor procedure yielded a similarly increased odds with controlled
ventilation (Hosmer and Lemeshow 2000). Further, stratum specific odds for ventilation
by procedure type indicated greater increased odds with controlled ventilation for minor
compared to major procedures (minor procedures controlled ventilation OR= 7.4, 95%
CI 1.5 – 37.6; Major procedures controlled ventilation OR=2.8, 95% CI 1.5 – 9.3). This
would suggest an element of the increased odds with controlled ventilation in the major
procedure group resulted from these being more complicated procedures, but in both
strata the association remained. A direct effect on outcome however was also possible,
controlled ventilation could induce greater cardiovascular depression than spontaneous
ventilation, due to increased intra-thoracic pressure during inspiration decreasing
venous return and filling of the heart, lower arterial carbon dioxide reducing sympatho-
adrenal stimulation of the heart, and higher end-tidal inhalation agent inducing greater
dose-dependent cardiovascular depression, due to more efficient delivery of the agent
(Horwitz, Bishop et al. 1968; Cullen and Eger 1974; Steffey, Gillespie et al. 1974;
Steffey, Gillespie et al. 1975; Thurmon, Tranquilli et al. 1996; Hall, Clarke et al. 2001).
Controlled ventilation without the use of muscle relaxants was commonly undertaken in
these animals, as muscle relaxants are rarely used in veterinary anaesthesia and were
used only in 2 cases and 5 controls in the Dog study and 2 cases and 2 controls in the
Sick Dog study (approximately 1% of cases and controls). This contrasts with the use of
muscle relaxants in human anaesthesia, where they are an integral part of balanced
anesthesia and contribute to the provision of good surgical conditions whilst allowing a
reduced level of inhalation agent (Minimum alveolar concentration or MAC sparring
effect). The MAC sparring effects of muscle relaxants can reduce cardiovascular
depression during anaesthesia (Hall, Clarke et al. 2001) and could be particularly
relevant to reducing the impact of controlled ventilation on cardiovascular function in
the poorer health status patients. The use of muscle relaxants could contribute to the
observed differences in effect of method of ventilation observed in man and animals.
The association with preoperative blood testing, though not the basis of an a priori
hypothesis, was interesting. There was significant heterogeneity within ASA grades for
this association and the interaction was included in the model (Hosmer and

174
Lemeshow 2000; Dohoo, Martin et al. 2003). The association was not the result of
confounding by procedure urgency as this was adjusted for in the model, and the
percent of procedures that were urgent or emergency (92%) in the ASA 4-5 cases that
did not have a blood test, was similar to that of the ASA 4-5 cases that did had a blood
test (94%), suggesting the lack of a blood test was not the result of insufficient time to
take one. Nor was there heterogeneity amongst the cases with respect to ASA grades 4
and 5, as in both ASA 4-5 cases that had and did not have a blood test, 39% were ASA
5 and 61% ASA 4. Further, the association did not result from more ASA 4-5 cases that
did not have a blood test, occurring when there might have been reduced access to blood
tests (i.e. weekend or the evening), as of 24 ASA 4-5 cases that did not receive blood
tests, only 10 of them occurred overnight or on the weekend. Assuming the worst case
scenario that all these cases would have had a blood test if they had had easy access to
the tests, the revised crude odds of being a case in the ASA 4-5 stratum would still have
been much lower to the odds in the ASA 3 stratum (ASA 4-5 OR=0.2, Exact 95% CI
0.0 – 1.1 versus ASA 3 OR 0.80, 95% CI 0.3 – 1.9). The biological significance of this
observation could result from the particularly high-risk Sick patients (ASA 4-5),
benefiting most from greater preoperative workup, preparation and stabilisation, than
the less high-risk ASA 3 group. Interestingly, ASA 4-5 cases were over 3 times more
likely to receive perioperative fluids if they had had a preoperative blood test.
Previous work is limited on the role of perioperative workup and risk, and the role of
preoperative blood testing has proved contentious in veterinary anaesthesia (Hall,
Clarke et al. 2001; Clutton 2005). The Association of Veterinary Anaesthetists, debated
the merit of routine blood testing and concluded that routine blood tests were unlikely to
improve patient outcome unless there was concurrent clinical evidence of pre-existing
pathology (Hall, Clarke et al. 2001). A single centre study concluded routine blood
testing was not warranted in terms of likely effect on patient management, (Alef, Von
Praun et al. 2004). Hence though routine blood tests may not be justified, the results
strongly suggest that preoperative blood tests in the higher-risk patients may be valuable
and merit further investigation.
In summary, the associations identified in this poor health status subpopulation were
similar to many of those reported in the overall Dog study. Patient health status and
urgency remained important factors, as were patient weight and the inhalation agent

175
used. Additionally the model identified controlled ventilation and the presence of
preoperative blood tests as associated with outcome and these factors warrant further
evaluation. Issues of non-response in this sub-study however must caution the over-
interpretation of these specific findings, and rather the results should form the basis of
further work.
6.4.5 Causation and Association
The observed associations reported were unlikely to be explained by major bias or
confounding. However the transition from association to causation remains difficult in
observational studies (Schlesselman 1982). Hill (1965) described a number of criteria
against which to assess the likely role of observed factors in the causation of an
outcome. The strength of the association, consistency with other work, specificity of the
association, temporality of the relationship, presence of a biological gradient, biological
plausibility, coherence with the known biology of the disease or subject under study,
presence of supporting experimental evidence, and presence of analogy to a similar
condition are all criteria to base an assessment of the likely role of an association in
causation (Hill 1965).
Based on these criteria patient health status, procedure urgency and complexity, patient
age and the inhalation agent used, would appear to causally contribute to anaesthetic-
related death. Patient health status has been consistently reported throughout this study
in a number of species and in previously published work (Marx, Mateo et al. 1973;
Hovi-Viander 1980; Lunn and Mushin 1982; Pottecher, Tiret et al. 1984; Tiret,
Desmonts et al. 1986; Buck, Devlin et al. 1988; Cohen, Duncan et al. 1988; Clarke and
Hall 1990; Forrest, Cahalan et al. 1990; 1990; Pedersen, Eliasen et al. 1990; Forrest,
Rehder et al. 1992; Pedersen 1994; Warden, Borton et al. 1994; Tikkanen and Hovi-
Viander 1995; McKenzie 1996; Warden and Horan 1996; Wolters, Wolf et al. 1996;
Dyson, Maxie et al. 1998; Hosgood and Scholl 1998; Biboulet, Aubus et al. 2001;
Morita, Kawashima et al. 2001; Hosgood and Scholl 2002; Donati, Ruzzi et al. 2004;
Johnston, Eastment et al. 2004; Brodbelt, Hammond et al. 2005). The association was
found to be strong (OR=6.1), there was temporality of patient disease and subsequent
outcome, there was a biological gradient (increasing odds with increasingly poor status),
and the results were plausible and coherent with current knowledge. Its likely principal
mode of influence, as suggested in the conceptual framework (Figure 2.1), involved

176
reduced tolerance of physiological disturbance induced by anaesthetic agents in the
poorer health status patients, such that minor physiological depression could be
converted to major depression and relative anaesthetic overdose.
Similarly, the association with urgency of the procedure has been reported across
species in the current study and in previous work (Lunn and Mushin 1982; Pottecher,
Tiret et al. 1984; Tiret, Desmonts et al. 1986; Buck, Devlin et al. 1988; Pedersen,
Eliasen et al. 1990; Johnston, Taylor et al. 1995; Biboulet, Aubus et al. 2001; Eastment,
Johnston et al. 2002; Johnston, Eastment et al. 2002; Newland, Ellis et al. 2002; Donati,
Ruzzi et al. 2004). The magnitude of the association, though not as large as seen for
health status was still biologically relevant (OR=2.5 for trend), and again there was a
biological gradient for increased odds with increasing urgency, and there was
appropriate temporality of urgency and outcome. Urgency was likely to reflect in part
reduced ability to stabilise a patient and improve health status (see Figure 2.1, Chapter
2), but also it was likely to be related to personnel experience, given many emergency
procedures occurred outside normal working hours. Hence the association was plausible
and coherent with current understanding of anaesthesia and the risks associated with
poor patient stabilisation prior to anaesthesia (Hall, Clarke et al. 2001).
The complexity of the procedure, represented by intended procedure, would appear also
to contribute to anaesthetic-related death. This finding was demonstrated across species
in the current study, and in previous work in equine anaesthesia (Eastment, Johnston et
al. 2002; Johnston, Eastment et al. 2002; Johnston, Eastment et al. 2004) and in human
anaesthesia (Farrow, Fowkes et al. 1982; Fowkes, Lunn et al. 1982; Pottecher, Tiret et
al. 1984; Tiret, Desmonts et al. 1986; Newland, Ellis et al. 2002; Donati, Ruzzi et al.
2004). The association was strong (OR= 5.2), it was plausible, temporal and coherent
with the current understanding of the physiological impact of surgery on anaesthesia
(Clarke 1970; Hall, Young et al. 1978; Kehlet 1984). The relationship between intended
and actual procedure was discussed in rabbits (Chapter 5), and intended procedure
reflected both aspects relating to the impact of the procedure itself and the patient
presenting for that procedure. Based on the conceptual framework (Chapter 2) the
aspect pertaining to the patient presenting for that procedure, was likely to reflect in part
the urgency of the procedure and patient health status, and as such there would be some
overlap with these other factors. Nonetheless, an element of this association was

177
likely to reflect the impact of the procedure itself supporting its inclusion as a separate
variable.
The association with age was consistent with work in a number of species (Hovi-
Viander 1980; Lunn and Mushin 1982; Pottecher, Tiret et al. 1984; Tiret, Desmonts et
al. 1986; Buck, Devlin et al. 1988; Cohen, Duncan et al. 1988; Forrest, Cahalan et al.
1990; 1990; Pedersen, Eliasen et al. 1990; Forrest, Rehder et al. 1992; Pedersen 1994;
Warden, Borton et al. 1994; Johnston, Taylor et al. 1995; Tikkanen and Hovi-Viander
1995; McKenzie 1996; Warden and Horan 1996; Hosgood and Scholl 1998; Biboulet,
Aubus et al. 2001; Morita, Kawashima et al. 2001; Eastment, Johnston et al. 2002;
Johnston, Eastment et al. 2002; Donati, Ruzzi et al. 2004; Johnston, Eastment et al.
2004). There was a strong association, age exhibited a gradient of odds with increasing
age, the association was plausible and it was consistent with the understanding of the
physiological changes with age (Thurmon, Tranquilli et al. 1996). Hence, increasing age
appears to causally contribute to the outcome.
The reduced odds ratio with isoflurane was a strong association and was consistently
seen in both dog studies. Though it contrasted with a previous small animal study
(Dyson, Maxie et al. 1998), it was consistent with results in young horses in a
randomised controlled trial in horses (Eastment, Johnston et al. 2002; Johnston,
Eastment et al. 2004) and experimental studies of the two agents (Joas and Stevens
1971; Steffey, Gillespie et al. 1975; Steffey and Howland 1977; Hellebrekers 1986;
Tranquilli, Thurmon et al. 1988; Grandy, Hodgson et al. 1989; Lemke, Tranquilli et al.
1993; Hikasa, Okabe et al. 1996; Hikasa, Ohe et al. 1997; Hodgson, Dunlop et al.
1998). Isoflurane induces less direct myocardial depression, and sensitises the heart less
to catecholamine-induced arrhythmias and on balance would appear to cause less
overall cardiovascular depression and reduce the risk of death.
Other factors observed in the Dog studies require further evaluation before concluding
they causally contribute to anaesthetic-related death. These other associations were not
based on a priori hypotheses and data-derived hypotheses should be interpreted
cautiously (Hennekens and Buring 1987). The association with weight was reported in
both the Dog and Sick Dog studies, and the magnitude of increased odds was large with
low weight. Though the association has not been documented in small animals
previously, small patients would be at a greater risk of hypothermia (Waterman

178
1981; Dhupa 1995; Meyer 1999; Hall, Clarke et al. 2001) and this could underlie the
association. However, an element of the association could represent residual
confounding by age, due to neonates being at increased risk due to their age whilst
concurrently being smaller. Stratifying the odds for weight by age tended to increased
odds in all categories of age, though the odds were greatest for the younger age
categories, suggesting some residual confounding by age. Though plausible and based
on a strong association the interdependence with age made a clear assessment of the role
of weight difficult and further work is merited.
Increasing odds with increasing duration have been reported previously in horses (Trim,
Adams et al. 1988; Young and Taylor 1990; Young and Taylor 1993; Eastment,
Johnston et al. 2002; Johnston, Eastment et al. 2004), in man (Pottecher, Tiret et al.
1984; Tiret, Desmonts et al. 1986; Biboulet, Aubus et al. 2001; Newland, Ellis et al.
2002) and also in rabbits in the current study. However the magnitude of this
association was not great in the Dog Study and not retained in the final model in the
Sick Dog Study. Though biologically plausible, based on the strength of association
reported it would be premature to overstate the role of increasing duration on
anaesthetic-related death. This association requires further work. The associations of
preoperative blood testing and method of ventilation reported in Sick dogs, though
biologically plausible and of a reasonable strength of association were not hypothesis-
based and have not been reported in the small animal literature before. From the
perspective of the conceptual framework (Chapter 2), preoperative blood testing was
likely to reflect the urgency of procedure and the ability to stabilise the patient prior to
anaesthesia, and as such some collinearity of these variables was likely in the Sick Dog
study. Further, mode of ventilation could have impacted directly on outcome, but given
procedure was not retained in the model, ventilation may well have reflected the impact
of procedure more than the effect of controlled ventilation per se. Nonetheless, these are
interesting observations but require further evaluation before concluding they causally
contribute to anaesthetic-related death.
In summary, a number of factors were identified as potential contributors to the multi-
factorial process of anaesthetic-related death in dogs. Severity of preoperative disease,
procedural urgency and complexity, and age formed a useful core of variables to aid
patient risk assessment preoperatively. Extremes of patient weight were associated

179
with increased odds and may assist patient assessment. Modifiable factors included
inhalation agent and the use of isoflurane could reduce the risk of anaesthetic-related
death compared to halothane. Preoperative blood testing may be valuable and the
method of ventilation may affect outcome for higher risk patients, but these factors
merit further investigation.

180
Chapter 7: Risk Factors for Anaesthetic-Related Death in Cats
7.1 Introduction
Factors associated with anaesthetic death in cats, like dogs, have been reported
infrequently in the veterinary literature and not for nearly 20 years in the UK (Clarke
and Hall 1990; Dyson, Maxie et al. 1998; Hosgood and Scholl 1998) (see Chapter 1).
The aims of this part of the study were to evaluate risk factors associated with
anaesthetic-related death in cats and in a subpopulation of sick cats (ASA 3-5, see
Chapter 2).
7.2 Materials and Methods
A case-control study was undertaken, nested within the cohort of cats anaesthetised and
sedated at participating practices during the study period (see Chapter 2). A case was
defined as a perioperative death (including euthanasia) occurring after premedication
and within 48 hours of termination of the procedure, except where death or euthanasia
was due solely to inoperable surgical or pre-existing medical conditions. A death was
considered a case if anaesthesia or sedation could not be reasonably excluded as a
contributory factor. All deaths from the cohort potentially fitting the case definition
were evaluated by the independent review panel and classified against a list of criteria
as case or not. Controls were randomly and prospectively selected during the study
period from the cohort of anaesthetised and sedated cats at the participating centres at a
1:4 Case: Control ratio for the overall cat study (‘Cat Study’).
A sub-population of poor health-status cats was also evaluated (‘Sick Cat Study’). All
cases that were classified as ‘Sick’ (ASA 3-5, see Appendix 2.1), were included as cases
in this section of the study. Controls for this study (Sick controls), were randomly and
prospectively selected from the cohort of anaesthetised and sedated sick cats at the
participating centres during the study period at a 1:1 Case: Control ratio.
Univariable analysis of the data was undertaken to determine the association of each
variable with the odds of anaesthetic-related death. For categorical data, odds ratios
(OR) were calculated and the 95% confidence intervals (95% CI) were calculated for
the risk factors using the standard errors obtained as the square root of the variance
181
of the score statistic (Stata 7.0, Statacorp)(Breslow and Day 1980; Schlesselman 1982;
Hosmer and Lemeshow 2000). Chi-squared test or Fisher’s Exact test were applied to
test the statistical significance of the associations for categorical variables where
appropriate (Kirkwood 1988). Additionally, for multiple category variables, the
likelihood ratio test P value was calculated for the variable to give an overall p value,
comparing a logistic regression model with the variable included to that without the
variable (Hosmer and Lemeshow 2000). When appropriate for multiple category
variables, the odds ratio for a one category increase in odds was calculated (a one
degree of freedom test for trend, ‘trend’)(Hosmer and Lemeshow 2000). For continuous
variables, the Student’s t test or Mann-Whitney U test, were applied (Kirkwood 1988).
The assessment of duration of anaesthesia was complicated by the fact that deaths prior
to the procedure being undertaken tended to increase the odds associated with shorter
duration of anaesthesia. To overcome this problem, “intended” duration of anaesthesia
was estimated for cases that died before the procedure was performed, by using the
mean duration for controls for the same procedure category as described by procedure
performed (Table 7.5c). Intended procedure type was recorded in addition to actual
procedure to allow categorisation of those cases that died prior to performing the
procedure.
Biologically significant factors and variables significant at the 20% level were retained
for evaluation in a mixed effects logistic regression model. Stratification of independent
variables by potential confounders (e.g. health status) was performed to explore and
identify multivariable associations and effect modification prior to multivariable
analysis (Breslow and Day 1980). Logistic regression was then used and the statistical
significance of the explanatory variables to the model was assessed using the log
likelihood function (Hosmer and Lemeshow 2000). Variables significant (p<0.05) based
on the likelihood ratio test statistic were retained in the logistic regression model using a
forward selection approach (Dohoo, Martin et al. 2003). Variables with a large number
of missing values were excluded from this approach, except when considered
biologically important and then a separate category for missing or unknown values was
created (Katz 1999). Biologically plausible first order interactions were assessed in the
final multivariable model (Hosmer and Lemeshow 2000). Clustering at the clinic level
was adjusted for, by using clinic identity as a random effect (Dohoo, Martin et al.

182
2003). The fit of the final models was assessed with the Hosmer Lemeshow goodness-
of-fit statistic and by evaluating the models’ residuals with the delta deviance and delta
beta influence diagnostic statistics based on the observed covariate patterns (Hosmer
and Lemeshow 2000).
7.3 Results
One hundred and seventy five deaths within 48 hours of anaesthesia or sedation were
classified as cases in cats. Eighty-one cases (46%) were graded healthy (ASA 1-2) and
94 as sick (54%, ASA 3-5). During the study period 693 controls were requested in the
Cat study, 557 were returned (80% response rate) and two were excluded (duplicates of
other controls). This resulted in 555 controls being included in the analysis of the Cat
Study (Case: Control ratio 1:3.2). Of the 555 controls, 47 were classified as Sick / ASA
3-5 (8.5% of Controls) and were included as Controls in the Sick Cat Study. An
additional 127 Sick Controls were requested over the study period, 75 were returned
(59% response rate) and 9 were excluded (1 was euthanased within 48 hours, 8 were
ASA grade 2), resulting in 66 further Sick Controls. A total of 113 controls were
compared to 94 cases for the Sick Cat Study (Case: Control ratio 1:1.2).
The cohort of cats anaesthetised and sedated (and not dying or being euthanased within
48 hours) during the study consisted of 9,625 sedations (12%) and 67,999 general
anaesthetics (88%), in comparison in the case-control study 55 of 555 controls were
sedations (10%), these proportions were not significantly different (P=0.06). Further,
the Hauck-Anderson corrected 95% confidence intervals for the difference in
proportions of sedated cats, between the case-control and cohort studies, were -5.1 to -
0.0%, which would suggest reasonable equivalence (Tu 1997; Christley and Reid 2003).
When comparing the cat controls to the non-returned controls (Table 7.1), health status,
procedure urgency, sedation versus anaesthesia, age and major versus minor procedures
were not significantly different and the 95% confidence intervals for the difference in
proportions suggested reasonable equivalence between returned and non-returned
controls (Christley and Reid 2003) and minimal non-response bias.

183
Table 7.1 Comparison of controls and non-returned controls in Cats.
* 95% Confidence interval (CI) for the difference in proportion between the Controls and non-returned Controls. ** Mean and standard deviation are reported and the 95% CI for the difference between controls and non-returned controls.
7.3.1 Cat Study
The control population of cats had a mean age of 5.3 years (5.1 sd) with 48% male and
52% female. Domestic shorthairs (DSH) were commonly presented (82%), followed by
Domestic longhairs (DLH) (8%), Persians (3%) and other Pure-breeds (6%). Neutering
was the most common procedure performed (41%), followed by diagnostic procedures
(20%), minor soft tissue procedures (21%) and dental surgery (11%, Table 7.5c).
Most control cats (71% of controls) were premedicated prior to anaesthesia (Table 7.2).
Acepromazine combinations were most commonly used (63% of controls), 4% had
medetomidine combinations prior to anaesthesia, 4% had benzodiazepine and opioid
combinations and 29% had no premedication. Anaesthesia was induced primarily with
propofol (51% of controls), followed by medetomidine and ketamine or medetomidine
and opioid combinations (23%), thiopentone (11%), and Saffan (9%, alphadolone /
alphaxalone) (Table 7.3). Medetomidine combinations were also commonly used for
sedation (80% of sedations). Anaesthesia was generally maintained with isoflurane
(59% of controls, Table 7.4). Thirty-four percent of patients were maintained with
injectable agents only.
Risk Factor Proportion of
controls
Proportion of non-
returned controls
P value 95% CI* for the
difference in proportions
Sedation 55/555 (9.9%) 2/23 (8.7%) 0.84 -15.5 to 13.1%
ASA 3-5 47/555 (8.5%) 3/23 (13.0%) 0.44 -12.0 to 21.1%
Urgent or Emergency
97/555 (17.5%) 2/23 (8.7%) 0.27 -23.2 to 5.7%
Major Procedure
35/555 (6.3%) 3/23 (13.0%) 0.20 -9.8 to 23.2%
Age** 5.3 +/- 5.1 years 4.1 +/- 4.1 years 0.27 -1.0 to 3.6 years

184
Table 7.2 Premedication given to Cats
* Number and percent of total (%).
Table 7.3 Induction agents used in Cats
* Number and percent of total (%).
Table 7.4 Maintenance agents used in Cats
* Number and percent of total (%).
Premedication Cases* Controls*
No Premedication 54 (31%) 159 (29%)
Acepromazine Combinations 90 (51%) 351 (63%)
Medetomidine Combinations 10 (6%) 22 (4%)
Benzodiazepine / Opioid Combinations 21 (12%) 23 (4%)
Total 175 (100%) 555 (100%)
Induction agent Cases* Controls*
Thiopentone 18 (11%) 63 (11%)
Propofol 114 (65%) 282 (51%)
Saffan 9 (5%) 52 (9%)
Medetomidine Combinations 18 (10%) 129 (23%)
Benzodiazepine / Ketamine Combinations 5 (3%) 13 (2%)
Mask Induction 7 (4%) 13 (2%)
Other Methods of Induction 4 (2%) 3 (1%)
Total 175 (100%) 555 (100%)
Maintenance Agent Cases* Controls*
Isoflurane 131 (75%) 327 (59%)
Halothane 5 (3%) 29 (5%)
Sevoflurane 3 (2%) 8 (1%)
Injectable Agents only 36 (21%) 191 (34%)
Total 175 (100%) 555 (100%)

185
Approximately 20% of control cats had intravenous catheters placed perioperatively and
15% received perioperative intravenous fluids. Intraoperative monitoring was
undertaken primarily by a qualified veterinary nurse (56%). Thirty one percent had an
unqualified nurse, 4% a separate veterinary surgeon and 9% having no separate person
monitoring the patient. Thirty percent had a written record of the anaesthetic.
Monitoring was primarily undertaken by monitoring patient pulse and respiratory rates
(66% and 92% respectively), though the use of a stethoscope and pulse oximetry were
also common (45% and 42% of controls respectively). Additional monitors were
infrequently used, with only 4% of controls being monitored with capnography, arterial
blood pressure monitoring and electrocardiography. Postoperatively, patients were
generally observed by a nurse, though most were only checked every five minutes or
more (33% continuously, 62% checked every five or more minutes). Postoperative
temperature was only taken in 11% of controls.
The procedures were most often undertaken by a junior veterinary surgeon (63% of
controls), whilst a senior veterinary surgeon undertook 31% of procedures and locum
veterinary surgeons 6%. Eighteen percent (101 controls) of the procedures were
undertaken by a veterinary surgeon with a non-anaesthesia postgraduate qualification,
and 6% (34 controls) with a veterinary anaesthesia qualification (RCVS Certificate or
Diploma, European Diploma, PhD). Of the 58 cat controls monitored by a veterinary
surgeon, 57% (33 controls) were monitored by a veterinary surgeon with a postgraduate
qualification in veterinary anaesthesia, and 2% (1 control) with a non-anaesthesia
postgraduate qualification.
7.3.1.1 Univariable Associations
There was an increase in the odds of anaesthetic-related death with increasing, age (12
years and older, OR = 3.5, Table 7.5a). Both low and high patient weight were
associated with increased odds compared to those weighing 2-6 kg (OR = 6.5 and 4.0
respectively). There were no breed associations. Patients having undergone previous
anaesthetics or sedations in the last month also showed a tendency to increased odds
(OR = 1.6). Preoperative disease was markedly associated with increased odds of
anaesthetic-related death (Table 7.5b). A one category increase in poor patient health
status (ASA grade 1-2, 3, 4-5)(Anon 1963) was associated with a 6.5-fold increase in
odds. Performing preoperative blood and other tests prior to anaesthesia were

186
associated with increased odds (OR = 2.3 and 3.6 respectively), whilst withholding of
food and water were associated with reduced odds (OR = 0.4 and 0.6 respectively).
Increasing procedure urgency was significantly associated with outcome (one category
increase in urgency OR = 4.2, Table 7.5c) and more complex procedures and increasing
procedure difficulty (assessed by the operating veterinary surgeon) were also associated
with increased odds (Table 7.5c). Procedures undertaken in more than one position or
not in lateral recumbency tended towards increased odds. Cases had significantly longer
durations of anaesthesia than controls (cases 44.8 +/- 42.7 min, controls 34.1 +/- 29.8
min, p<0.001; mean and standard deviation (SD)) and increasing duration of anaesthesia
was associated with an increased odds of death for procedures over 90 minutes (OR =
3.3). This association was more clearly seen with the intended duration (cases 50.3 +/-
40.7 min, controls 34.1 +/- 29.8 min, p<0.001, mean and SD). Late start times were
associated with increased odds (procedures after 5 pm OR = 9.2).
Compared to not receiving premedication, having benzodiazepine or opioid
premedication was associated with increased odds (OR = 2.7, Table 7.5d). Induction of
anaesthesia with propofol, benzodiazepines and ketamine or by mask, tended to be
associated with increased odds compared to thiopentone. Saffan and
medetomidine/ketamine combinations tended towards being associated with reduced
odds. Increasing doses of thiopentone and propofol were associated with reduced odds
(Appendix 7.1). Injectable anaesthesia was associated with reduced odds compared to
injectable induction followed by maintenance with isoflurane (OR = 0.5, Table 7.5d).
Sedation compared to general anaesthesia tended to be associated with reduced odds
(OR = 0.6). Endotracheal intubation (OR = 3.0), oxygen administration (OR = 3.0),
receiving perioperative fluids (OR = 8.5) and controlled ventilation (OR = 10.6) were
associated with increased odds.
Monitoring patient pulse and the use of pulse oximetry were associated with reduced
odds (OR = 0.5 and 0.6 respectively), whilst using a stethoscope or measuring arterial
blood pressure were associated with increased odds (OR = 1.6 and OR = 2.1
respectively). Time to sternal recumbency was longer in the cases (cases 57.8 +/- 112.1
min (n=44), controls 17.7 +/- 16.0 (n=470), p<0.001), postoperative temperature was
lower in the cases (cases 35.9 +/- 1.3 0C (n=18), controls 36.8 +/- 1.1 0C (n=51),
p=0.006), whilst less frequent patient monitoring postoperatively was associated

187
with reduced odds (observed every 5 or more minutes OR = 0.5, 95% CI 0.3 – 0.8).
Procedures undertaken by a veterinary surgeon with a non-anaesthesia postgraduate
qualification tended to be associated with increased odds of anaesthetic-related death
(OR = 1.7, Table 7.5f).

188
Table 7.5.a The association of patient variables with anaesthetic-related death in Cats
*Odds ratios (OR) and 95% confidence intervals (CI) are reported, with the Likelihood Ratio Test (LRT) P values presented for multiple category variables at the top of ‘P Value’ column.
Variable Categories Cases Controls OR* 95% CI* P value
Categorical Age 0- 0.5 years 0.5 – 5 years 5 – 12 years 12 years – max Unknown
6 54 59 56 0
24 287 153 84 2
1.3 1 2.0 3.5
0.5 – 3.4 1.3 – 3.1 2.2 – 5.6
<0.001 0.55 <0.001 <0.001
Sex Male Female
92 83
268 287
1 0.8
0.6 – 1.2
0.32
Neutered Entire Neutered Unknown
38 129 8
261 285 9
1 3.1
2.1 – 4.7
<0.001
Categorical Weight
0-2 kg 2-6 kg 6 - max Unknown
9 144 19 3
5 518 17 15
6.5 1 4.0 0.7
2.1 – 19.9 2.0 – 8.0 0.2 – 2.5
<0.001 <0.001 <0.001 0.61
Overweight Not overweight Overweight Unknown
145 25 2
492 36 27
1 2.4
1.4 – 4.1
0.002
Scales used
Scales Estimate Unknown
135 37 3
421 123 10
1 0.9
0.6 – 1.4
0.76
Breed DSH DLH Persian Other Pure BreedUnknown
140 12 7 16 0
455 43 19 35 3
1 0.9 1.2 1.5
0.5 – 1.8 0.5 – 2.9 0.8 – 2.8
0.82 0.77 0.69 0.20
Primary Case Primary patient Referral patient Unknown
164 11 0
533 21 1
1 1.7
0.8 – 3.6
0.16
Previous Sedations or Anaesthetics within the month
None One or more Unknown
144 23 8
474 47 34
1 1.6
0.9 – 2.7
0.07

189
Table 7.5.b The association of patient variables with anaesthetic-related death in Cats
*Odds ratios (OR) and 95% confidence intervals (CI) are reported. Likelihood Ratio Test (LRT) P values are presented for multiple category variables at the top of ‘P Value’ column. **ORs adjusted for health status (ASA2) are reported when confounded by health status.
+‘Trend’ represents the OR for a one-category increase in the variable.
Variable Categories Cases Controls OR* 95% CI* P value
Preoperative disease
None Cardiopulmonary Neurological Digestive Urogenital Other
15 49 2 55 22 32
304 34 4 90 20 103
1 29.2 10.1 12.2 22.2 6.3
12.5 –68.3 1.7 – 61.6 6.2 – 24.6 8.8 – 56.2 3.3 – 12.5
<0.001 <0.001 0.002 <0.001 <0.001 <0.001
ASA grade (ASA3)
ASA 1-2 ASA 3ASA 4-5
Trend+
81 42 52
508 39 8
1 6.8 40.8
6.5
4.0 – 11.4 16.3-101.9
4.7 – 9.1
<0.001 <0.001 <0.001
<0.001
ASA grade (ASA2)
ASA 1-2 ASA 3-5
81 94
508 47
1 12.5
7.7 – 20.3
<0.001
Preoperative examination
No Yes Unknown
Adjusted ASA2**
10 165 0
47 506 2
1 1.5
0.9
0.8 – 3.1
0.4 – 2.0
0.23
0.83
Preoperative bloods
No Yes Unknown
Adjusted ASA2**
96 78 1
408 145 2
1 2.3
1.4
1.6 – 3.3
0.9 – 2.1
<0.001
0.09
Other tests
No Yes Unknown
Adjusted ASA2**
109 65 1
476 78 1
1 3.6
1.6
2.4 – 5.4
1.0 – 2.6
<0.001
0.06
Starved Preoperatively
No Yes Unknown
Adjust for ASA2**
7 151 17
9 529 17
1 0.4
0.9
0.1 – 1.0
0.3 – 3.0
0.04
0.89
Water withheld
No Yes Unknown
Adjust for ASA2**
82 71 22
213 320 21
1 0.6
0.8
0.4 – 0.8
0.5 – 1.2
0.003
0.31

190
Table 7.5.c The association of procedural variables with anaesthetic-related death in
Cats
Variable Categories Cases
Controls OR* 95% CI* P value
Urgency
Scheduled Urgent Emergency
Trend+
83 67 25
458 89 8
1 4.2 17.2
4.2
2.8 – 6.3 7.1 – 42.0
3.1 – 5.7
<0.001 <0.001 <0.001
<0.001
Procedure Performed Neutering Dental Diagnostics Soft tissue minorSoft tissue major Orthopaedics/ Neurological None
10 31 16 36 40 11 31
228 111 61 118 17 20 0
1 6.4 5.9 7.0 53.6 12.5
2.9 – 13.9 2.5 – 14.3 3.2 – 15.0 16.4 – 175.2 4.4 – 35.8
<0.001 <0.001 <0.001 <0.001 <0.001 <0.001
Intended Procedure Minor Major
115 60
520 35
1 7.8
4.7 – 12.7
<0.001
Procedure Difficulty
Simple Moderate Difficult / V DiffNo procedure Unknown
63 54 27 31 0
403 135 15 0 2
1 2.6 11.5
1.7 – 3.9 5.5 – 24.1
<0.001 <0.001 <0.001 <0.001
Recumbency Lateral Dorsal Sternal Multiple Unknown
58 44 14 56 3
291 56 29 178 0
1 3.9 2.4 1.6
2.4 – 6.5 1.2 – 4.9 1.0 – 2.4
<0.001 <0.001 0.01 0.03
Duration
0-29 min 30-59 min 60-89 min 90 –max unknown
76 48 23 25 3
283 182 57 28 5
1 1.0 1.5 3.3
0.7 – 1.5 0.9 – 2.6 1.8 – 6.1
<0.001 0.93 0.14 <0.001
Duration intended 0-29 min 30-59 min 60-89 min 90 –max unknown
57 58 32 25 3
283 182 57 28 5
1 1.6 2.8 4.4
1.5 – 3.4 2.1 – 6.2
0.29 0.03 <0.001 <0.001
Induction Time
8 am - 12 pm 12 pm - 5 pm 5 pm – 8 am unknown
Trend+
84 76 13 2
414 123 7 11
1 3.0 9.2
3.0
2.1 – 4.5 3.4 – 24.3
2.2 – 4.2
<0.001 <0.001 <0.001
<0.001
*Odds ratios (OR) and 95% confidence intervals (CI). Likelihood Ratio Test (LRT) P values are reported for multiple category variables at the top of ‘P Value’. +‘Trend’ represents a one-category increase.

191
Table 7.5.d The association of anaesthetic agent with anaesthetic-related death in Cats
Variable Categories Cases
Controls OR* 95% CI* P value
General Anaesthesia (GA) or Sedation
GA Sedation
164 11
500 55
1 0.6
0.3 – 1.2
0.14
Premedication+ None Acepromazine Medetomidine BZ / Opioids only
54 90 10 21
159 351 22 23
1 0.8 1.3 2.7
0.5 – 1.1 0.6 – 3.0 1.4 – 5.3
0.001 0.15 0.48 0.003
Induction agents Thiopentone Propofol Saffan Medetomidine combinations Benzodiazepines / Ketamine Mask induction Other
18 114 9 18 5 7 4
63 282 52 129 13 13 3
1 1.4 0.6 0.5 1.3 1.9 4.7
0.8 – 2.5 0.2 – 1.5 0.2 –1.0 0.4 – 4.3 0.6 – 5.5 0.9 – 23.9
<0.001 0.23 0.26 0.05 0.62 0.24 0.04
Inhalation Agents
Isoflurane Halothane Sevoflurane None
131 5 3 36
327 29 8 191
1 0.4 0.9 0.5
0.2 – 1.1 0.2 – 3.6 0.3 – 0.7
0.001 0.08 0.92 <0.001
Induction and Maintenance Combinations
Injectable/Isoflurane Injectable/Halothane Injectable/SevofluraneInjectable Only Inhalational Only
122 5 2 36 10
309 28 5 191 22
1 0.5 1.0 0.5 1.2
0.2 – 1.2 0.2 – 5.3 0.3 – 0.7 0.5 – 2.5
0.003 0.10 0.99 <0.0010.72
Endotracheal (ET) Intubation
No ET tube ET tube
27 148
135 419
1 3.0
1.9 – 4.7
<0.001
Oxygen No Oxygen Oxygen Unknown
17 158 0
135 419 1
1 3.0
1.7 – 5.2
<0.001
Nitrous oxide No nitrous oxide Nitrous oxide Unknown
160 14 1
505 47 3
1 0.9
0.5 – 1.8
0.84
Ventilation
Spontaneous Controlled Unknown
Adjust ASA2**
149 26 0
545 9 1
1 10.6
3.5
4.7 – 23.7
1.4 – 8.9
<0.001
0.005
*Odds ratios (OR) and 95% confidence intervals (CI) are reported. Likelihood Ratio Test (LRT) P values are reported for multiple category variables at the top of ‘P Value’ column. + Includes combinations of premedicant with other drugs (e.g. opioids). **ORs are adjusted for health status (ASA2) when confounded by health status.

192
Table 7.5.e The association of management and monitoring factors with anaesthetic-
related death in Cats
Variable Categories Cases Controls OR* 95% CI* P value
Perioperative fluids
No fluids IV Catheter only Fluids given
65 5 105
439 33 83
1 1.0 8.5
0.4 – 2.7 5.5 – 13.2
<0.001 0.96 <0.001
Monitoring person Vet Nurse No one
21 152 2
58 495 2
1.0 0.8 2.8
0.5 – 1.4 0.4 – 21.4
0.44 0.14 0.31
Other Duties of Monitoring Person
No other duties Performing the op Assisting the op Unknown
131 8 34 2
402 48 100 5
1 0.5 1.0
0.2 – 1.1 0.7 – 1.6
0.18 0.08 0.85
Record No record Record Unknown
97 69 9
379 161 15
1 1.7
1.2 – 2.4
0.005
Respiratory rate monitored
No respiratory rate Respiratory rate
25 154
45 510
1 0.7
0.4 – 1.1
0.11
Pulse and pulse oximeter used
None Pulse only Pulseox only Pulse and pulseox
49 56 27 43
100 223 91 141
1.0 0.5 0.6 0.6
0.3 – 0.8 0.3 – 1.0 0.4 – 1.0
0.04 0.003 0.07 0.05
Stethoscope used No Stethoscope Stethoscope
76 99
303 252
1 1.6
1.1 – 2.2
0.01
Capnography used No Capnograph Capnograph
167 8
524 31
1 0.8
0.4 – 1.8
0.60
Arterial Blood Pressure
None Indirect
Adjust ASA2
161 14
533 22
1 2.1
1.4
1.1 – 4.2
0.7 – 2.9
0.03
0.34
ECG None ECG
Adjust ASA2**
163 12
532 23
1 1.7
0.8
0.8 – 3.5
0.3 – 2.0
0.14
0.58
*Odds ratios (OR) and 95% confidence intervals (CI) are reported. Likelihood Ratio Test (LRT) P values are reported for multiple category at the top of ‘P Value’ column. **ORs are adjusted for health status (ASA2) when confounded by health status.

193
Table 7.5.f The association of recovery and personnel factors with anaesthetic-related death in Cats
Variable Categories Cases Controls
OR* 95% CI* P value
Recovery Quality
Good Moderate Poor Unknown No full recovery
39 25 16 3 92
377 152 3 23 0
1 1.6 51.5
1.8 – 6.6 6.8 –108.2
<0.001 0.08 <0.001
Recovery Observed Continuously 5 minutes + Unknown No recovery
49 45 3 77
185 345 16 0
1 0.5 0.7
0.3 – 0.8 0.2 – 2.5
0.007 0.002 0.59
Postoperative Temperature Taken
No Yes Unknown Intraoperative death
79 26 1 69
487 63 4 0
1 2.5
1.5 – 4.3
<0.001
Veterinary surgeon familiarity with anaesthetic
Very Familiar Familiar or Unfamiliar Unknown
164 8 3
496 39 18
1 0.6
0.3 – 1.4
0.22
Veterinary surgeon type Senior Veterinarian Junior Veterinarian Locum Other
62 107 5 1
169 350 32 2
1.2 1 0.5 1.6
0.8 – 1.7 0.2 – 1.3 0.1 – 18.3
0.29 0.32 0.16 0.69
Veterinary surgeon postgraduate qualifications
None Anaesthesia General Unknown
127 10 38 0
438 34 78 5
1 1.0 1.7
0.5 – 2.1 1.1 – 2.6
0.07 0.97 0.02
Anaesthetist familiarity with anaesthetic
Very familiar Familiar or Unfamiliar Unknown
137 20 18
435 77 43
1 0.8
0.5 – 1.4
0.451
Anaesthetist type Vet Qualified Nurse Unqualified Nurse
16 102 57
58 321 176
1 1.2 1.2
0.6 – 2.1 0.6 – 2.2
0.77 0.64 0.62
*Odds ratios (OR) and 95% confidence intervals (CI) are reported for categorical data. Likelihood Ratio Test (LRT) P values are reported for multiple category variables at the top of ‘P Value’ column.

194
7.3.1.2 Multivariable Model
Table 7.6 Final multivariable logistic regression model of the risk of anaesthetic-related
death in Cats
Variable Categories β s.e. β OR* 95% CI* P value
ASA grade ASA 1-2 ASA 3 ASA 4 – 5
Trend+
1.16
0.23
3.2
2.0 – 5.0
<0.001
Urgency
Scheduled Urgent Emergency
Trend+
0.46
0.23
1.6
1.0 – 2.5
0.04
Intended Procedure Minor Major
1.00
0.35
1 2.7
1.4 – 5.4
0.002
Categorical Age 0- 0.5 years 0.5 – 5 years 5 – 12 years 12 years – max
-0.97 0.51 0.73
0.93 0.29 0.32
0.4 1 1.7 2.1
0.1 – 2.4 0.9 – 3.0 1.1 – 3.9
0.06
Categorical Weight
0-2 kg 2-6 kg 6 - max Unknown
2.75 1.03 0.11
0.85 0.50 0.81
15.7 1 2.8 1.1
2.9 – 83.6 1.1 – 7.4 0.2 – 5.5
0.002
Endotracheal (ET) Intubation
No ET tube ET tube
0.66
0.33
1 1.9
1.0 – 3.7
0.06
Pulse and pulse oximeter used
None Pulse only Pulse oximeter only Pulse and pulse oximeter
-1.10 -1.62 -1.81
0.34 0.43 0.40
1 0.3 0.2 0.2
0.2 – 0.6 0.1 – 0.5 0.1 – 0.4
<0.001
Perioperative fluids No fluids IV Catheter only Fluids given
-0.34 1.37
0.65 0.30
1 0.7 3.9
0.2 – 2.5 2.2 – 7.1
<0.001
Intercept - 5.03 0.58
Random Effect of Clinic Identity (rho)
0.08 0.02 0.05
*Odds ratios (OR) and 95% confidence intervals (CI) are reported, with corresponding Likelihood Ratio Test (LRT) P values. Number of observations 723 out of 730. +‘Trend’ represents the OR for a one-category increase in the variable.
In the multivariable model, health status as described by ASA grade, was retained as a
major explanatory variable due to its low likelihood ratio test p value, its role as a
confounder and its biological importance. A one-increment increase in patient health

195
status was associated with a 3.2-fold increase in odds (Table 7.6). Procedure urgency
was retained in the model due to its low LRT p value and biological significance and an
incremental increase in urgency was associated with a 1.6 fold increase in odds. Major
intended procedures were nearly 3 times more likely to die than minor intended
procedures. The odds associated with endotracheal intubation were 1.9.
Age was retained in the model with a 2.1-fold increase in odds seen with older patients.
Fractional polynomial analysis suggested best fit with a linear function (Royston,
Ambler et al. 1999). However, the categorical version was preferred due to it having
fewer missing values, as clinics were able to categorise but not state the exact age for
twelve cats. Thought the P value for age was just above 0.05 (P=0.056), age was
retained as it was considered biologically important and improved model fit. Pulse and
pulse oximetry monitoring were both associated with a 4 to 5 fold reduction in odds.
The use of perioperative fluids was associated with nearly 4 times increased odds of
death. Categorical weight was retained in the model and, both low and high weight were
associated with increased odds of death (OR=15.7 and OR=2.8, respectively).
Endotracheal intubation was also just non-significant at the 5% level (P=0.06) and was
retained in the model on biological grounds.
There was an interaction between the use of pulse oximetry and monitoring pulse, such
that the magnitude in reduction of odds was less when the second method was used. The
LRT was significant (p<0.001) and the two factors were combined as a single variable
to reflect the interaction more clearly. Additionally, there was a tendency towards an
interaction between intended procedure and endotracheal intubation such that the odds
associated with endotracheal intubation was greater in the minor compared to the major
procedure patients (endotracheal intubation OR=2.3 in minor procedures, OR= 0.6 in
major procedures). However this was not significant (LRT p=0.08), the model fit was
not as good when the interaction was included and thus it was not retained in the final
model.
The addition of clinic identity as a random effect was significant (LRT P=0.054),
indicating there was significant extra-binomial clustering of outcome at the clinic level
(Hosmer and Lemeshow 2000), and this was retained in the final model. The within-
clinic correlation described by rho was 0.08 (standard error 0.02). The goodness of fit
as assessed by the Hosmer Lemeshow goodness-of-fit statistic was good (P = 0.90)

196
(Hosmer and Lemeshow 2000). The delta deviance diagnostic statistic also suggested
good model fit with only 7 covariate patterns greater than 7.0 and none greater than 8.0
(Figure 7.1). Evaluation of the delta beta diagnostic statistic identified 7 covariate
patterns with a delta beta greater than 0.8 and none greater than 1.0 (Figure 7.2). These
observations were checked for errors and none found. When the model was run without
these seven covariate patterns the parameter estimates were minimally changed. Hence
these influential covariate patterns were retained in the model.
Figure 7.1 The Delta Deviance diagnostic statistic versus the estimated probability for
the Cat model
H-L
dD
Pr(case).009558 .992609
.002053
8.64613
*H-L dD, Hosmer-Lemeshow delta deviance diagnostic statistic. Pr(case), probability of being a case. J=264 covariate patterns.
Figure 7.2 The Delta Beta diagnostic statistic versus the estimated probability for the
Cat Model
Pre
gibo
n's
dbet
a
Pr(case).009558 .992609
.000027
.902294
*Dbeta, Delta Beta diagnostic statistic. Pr(case), probability of being a case. J=264 covariate patterns.

197
7.3.2 Sick Cat Study
The mean age of controls in the sick population was 9.1 years (sd 5.3), 56% male and
44% female and 83% were neutered. Eighty-three percent of control sick cats were
domestic shorthairs, 5% domestic longhairs and 11% pure breeds. Eighty-one percent
were ASA grade 3, 19% ASA grade 4 or 5, and the presenting conditions were mostly
cardiopulmonary, hepatic, renal, digestive, urogenital and endocrine disease (Table
7.7b). The majority had had bloods tests preoperatively (“Preoperative bloods”, 53%),
many had additional tests (42%), and most were starved (89%, Table 7.7b). In contrast
to the general cat study population, the majority of sick cat procedures were urgent or
emergency status (65%), and the mean duration of procedures was longer (Sick Cats
57.0 minutes (45.9sd), Cats 34.1 minutes (29.8 sd) p=<0.001).
Premedication was mostly undertaken with acepromazine combinations (49%), and
infrequently with medetomidine (7%) or benzodiazepines and opioids (13%). Many cats
did not receive premedication (31%, Table 7.7d). Induction of anaesthesia was primarily
with propofol (67%), with thiopentone (10%), medetomidine combinations (8%),
benzodiazepine and ketamine combinations (8%), mask inductions (4%), and Saffan
(3%) less commonly used. Maintenance of anaesthesia was primarily with isoflurane
(78%, Table 7.7d), and 83% had endotracheal tubes placed. Sixty-two percent of sick
cats had an intravenous catheter placed and 53% received perioperative fluid therapy.
Monitoring remained primarily of pulse rate (74%), respiration rate (90%), by
stethoscope (51%), and with pulse oximetry (52%). Further intraoperative monitoring
(ECG, capnography, blood pressure) was only seen in 10% of the sick controls.
7.3.2.1 Univariable Associations
Increased odds of anaesthetic-related death at the univariable level were associated with
increasing weight, having other tests (not blood tests) undertaken perioperatively,
increasing urgency, increasing procedure difficulty, major versus minor intended
procedures, later induction times, controlled ventilation, fluid therapy, and poor
recovery quality (Tables 7.6a-f). Reduced odds were associated with sedation versus
general anaesthesia, the use of nitrous oxide as a carrier gas, monitoring pulse and pulse
oximetry and monitoring the patient postoperatively.

198
Table 7.7.a The association of patient variables with anaesthetic-related death in Sick
Cats
Variable Categories Cases Controls OR* 95% CI* P value
Categorical Age 0- 0.5 years 0.5 – 5 years 5 – 12 years 12 years – max
4 25 26 38
2 27 46 38
2.2 1 0.6 1.1
0.4 – 13.2 0.3 – 1.3 0.5 – 2.2
0.22 0.39 0.18 0.83
Sex Male Female
54 40
63 50
1 0.9
0.5 – 1.6
0.81
Neutered Entire Neutered Unknown
14 76 4
17 94 2
1 1.0
0.5 – 2.1
0.96
Categorical Weight
0-3 kg 3-6 kg 6 - max Unknown
21 60 12 1
20 89 3 1
1.6 1 5.9
0.8 – 3.1 1.5 – 22.8
0.007 0.21 0.003
Overweight Not overweight Overweight Unknown
75 15 4
100 8 5
1 2.5
0.8 – 4.4
0.04
Scales used
Scales Estimate Unknown
68 24 2
92 20 1
1 1.6
0.8 – 3.2
0.15
Breed DSH DLH Persian Other Pure Breed Unknown
70 9 3 10
94 6 2 11 3
1 0.9 1.2 1.5
0.5 – 1.8 0.5 – 2.9 0.8 – 2.8
0.82 0.77 0.69 0.20
Primary Case Primary patient Referral patient Unknown
84 10 0
102 10 1
1 1.2
0.5 – 3.1
0.68
Previous Sedations or Anaesthetics within the month
None One or more Unknown
74 15 5
87 19 7
1 0.9
0.4 – 2.0
0.84
*Odds ratios (OR) and 95% confidence intervals (CI) are reported, with the Likelihood Ratio Test (LRT) P values for multiple category variables at the top of ‘P Value’ column.

199
Table 7.7.b The association of patient variables with anaesthetic-related death in Sick
Cats
Variable Categories Cases Controls OR* 95% CI* P value
Preoperative disease
Cardiopulmonary Neurological Digestive Urogenital Other
36 2 27 17 12
32 5 35 14 27
1 0.4 0.7 1.1 0.4
0.1 – 2.0 0.3 – 1.4 0.5 – 2.5 0.2 – 0.9
0.13 0.22 0.29 0.86 0.03
ASA grade (ASA4) ASA 3 ASA 4-5
42 52
92 21
1 5.4
2.8 - 10.7
<0.001
Preoperative examination
No Yes
2 92
1 112
1 0.4
0.0 – 4.6
0.46
Preoperative bloods
No Yes Unknown
47 46 1
53 60 0
1 0.9
0.5 – 1.5
0.60
Other tests
No Yes Unknown
Adjusted ASA4**
41 53 0
65 47 1
1 1.8
1.1
1.0 – 3.1
0.6 – 2.0
0.04
0.90
Starved Preoperatively
No Yes Unknown
6 78 10
7 101 5
1 0.9
0.4 – 1.1
0.86
Water withheld
No Yes Unknown
50 30 14
65 45 3
1 0.9
0.5 – 1.6
0.63
*Odds ratios (OR) and 95% confidence intervals (CI) are reported. Likelihood Ratio Test (LRT) P values are reported for multiple category variables at the top of ‘P Value’ column. **ORs are reported adjusted for health status (ASA4) when confounded by health status.

200
Table 7.7.c The association of procedural variables with anaesthetic-related death in
Sick Cats
Variable Categories Cases
Controls OR* 95% CI* P value
Urgency
Scheduled Urgent Emergency
Trend**
22 50 22
40 60 13
1 1.5 3.1
1.7
0.8 – 2.9 1.3 – 7.5
1.1 – 2.6
0.03 0.20 0.01
0.01
Procedure Performed Neutering Dental Diagnostics Minor procedure Major procedure None
1 10 9 21 40 13
0 20 27 37 29 0
1 1.5 1 1.7 4.1
0.5 – 4.4 0.7 – 4.3 1.6 – 10.6
0.02 0.46 0.26 0.001
Intended Procedure Minor Major
48 46
84 29
1 2.8
1.5 – 5.1
<0.001
Procedure Difficulty
Simple Moderate Difficult / V difficult No procedure
23 34 24 13
42 56 15 0
1 1.1 2.9
0.6 – 2.2 1.2 – 6.9
0.02 0.76 0.01
Recumbency Lateral Dorsal Sternal Multiple Unknown
23 33 7 30 1
30 31 14 38 0
1 1.4 0.7 1.0
0.7 – 2.9 0.2 – 1.9 0.5 – 2.1
0.50 0.38 0.43 0.94
Duration
0-29 min 30-59 min 60-89 min 90 –max unknown
31 27 17 18 1
27 44 22 20 0
1 0.5 0.7 0.8
0.3 – 1.1 0.3 – 1.5 0.3 – 1.8
0.36 0.08 0.34 0.56
Duration intended 0-29 min 30-59 min 60-89 min 90 –max
19 33 18 24
27 44 22 20
1 1.1 1.2 1.7
0.5 – 2.2 0.5 – 2.8 0.7 – 4.0
0.71 0.87 0.73 0.21
Induction Time
8 am - 12 pm 12 pm - 5 pm 5 pm – 8 am unknown
Trend**
39 44 9 2
65 45 3 0
1 1.6 5.0
1.9
0.9 – 2.9 1.2 – 20.5
1.2 – 3.0
0.023 0.10 0.01
0.01
*Odds ratios (OR) and 95% confidence intervals (CI) are reported. Likelihood Ratio Test (LRT) P values are reported for multiple category variables at the top of ‘P Value’ column. **‘Trend’ represents the OR for a one-category increase in the variable.

201
Table 7.7.d The association of anaesthetic agents with anaesthetic-related death in Sick Cats
Variable Categories Cases
Controls OR* 95% CI* P value
General Anaesthesia or Sedation
General Anaesthesia Sedation
89 5
98 15
1 0.4
0.1 – 1.1
0.05
Premedication+ None Acepromazine Medetomidine BZ / Opioids only
31 38 7 14
35 55 8 15
1 0.7 0.9 0.9
0.4 – 1.3 0.3 – 2.7 0.4 – 2.2
0.67 0.25 0.82 0.88
Induction agents Thiopentone Propofol Saffan Medetomidine combinations Benzodiazepines / Ketamine Mask induction Other
11 67 3 3 2 6 2
11 76 3 9 9 4 1
1 0.9 1.0 0.3 0.2 1.5 2.0
0.4 – 2.2 0.2 – 6.3 0.1 –1.7 0 – 1.4 0.3 – 7.0 0.1 – 27.2
0.28 0.78 1.00 0.16 0.08 0.61 0.60
Inhalation Agents
Isoflurane Halothane Sevoflurane None
73 3 3 15
88 5 1 19
1 0.7 3.6 1.0
0.2 – 3.1 0.3 – 36.1 0.5 – 2.0
0.64 0.66 0.24 0.90
Induction and Maintenance Combinations
Injectable/Isoflurane Injectable/Halothane Injectable/SevofluraneInjectable Only Inhalational Only
68 3 2 15 6
83 5 1 19 5
1 0.7 2.4 1.0 1.5
0.2 – 3.2 0.2 – 27.8 0.5 – 2.0 0.4 – 5.0
0.89 0.68 0.46 0.92 0.54
Endotracheal (ET) Intubation
No ET tube ET tube
10 84
19 94
1 1.7
0.7 – 3.9
0.20
Oxygen No Oxygen Oxygen
4 90
11 102
1 2.4
0.7 – 8.0
0.13
Nitrous oxide No nitrous oxide Nitrous oxide
86 6
93 20
1 0.3
0.1 – 0.8
0.02
Ventilation
Spontaneous Controlled Unknown
Adjust ASA4**
71 23 0
101 11 1
1 3.0
1.6
1.3 – 6.6
0.7 – 3.6
0.005
0.23
*Odds ratios (OR) and 95% confidence intervals (CI) are reported. Likelihood Ratio Test (LRT) P values are reported for multiple category variables at the top of ‘P Value’ column. + Includes combinations of premedicant with other drugs (e.g. opioids). **ORs are adjusted for health status (ASA4) when confounded by health status.

202
Table 7.7.e The association of management and monitoring factors with anaesthetic-
related death in Sick Cats
Variable Categories Cases Controls OR* 95% CI* P value
Perioperative fluids
No fluids IV Catheter only Fluids given
16 3 75
42 11 60
1 0.7 3.3
0.2 – 2.9 1.6 – 6.6
<0.001 0.64 <0.001
Monitoring person Vet Nurse
17 77
15 98
1.0 0.7
0.3 – 1.5
0.34
Other Duties of Monitoring Person
No other duties Performing the op Assisting the op Unknown
73 2 18 1
79 6 28 0
1 0.4 0.7
0.1 – 1.9 0.4 – 1.4
0.28 0.20 0.29
Record No record Record Unknown
45 41 8
67 45 15
1 1.4
0.8 – 2.4
0.29
Respiratory rate monitored
No respiratory rate Respiratory rate
13 81
11 102
1 0.7
0.3 – 1.6
0.36
Pulse and pulse oximeter used
None Pulse only Pulse oximeter only Pulse and pulse oximeter
23 27 17 27
13 41 16 43
1.0 0.4 0.6 0.4
0.2 – 0.9 0.2 – 1.6 0.1 – 0.8
0.05 0.02 0.30 0.01
Stethoscope used No Stethoscope Stethoscope
38 56
55 58
1 1.4
0.8 – 2.4
0.23
Capnography used No Capnograph Capnograph
88 6
104 9
1 0.8
0.3 – 2.3
0.66
Arterial Blood Pressure
None Indirect Unknown
86 8 0
102 10 1
1 0.9
0.4 – 2.5
0.91
ECG None ECG
83 11
102 11
1 1.2
0.5 – 3.0
0.64
*Odds ratios (OR) and 95% confidence intervals (CI) are reported. Likelihood Ratio Test (LRT) P values are reported for multiple category at the top of ‘P Value’ column.

203
Table 7.7.f The association of recovery and personnel factors with anaesthetic-related death in Sick Cats
Variable Categories Cases Controls OR* 95% CI* P value
Recovery Quality
Good Moderate / Poor Unknown Intraoperative death
15 22 18 39
79 32 2 0
1 3.6
1.6 – 8.1
<0.001
Recovery Observed Continuously 5 minutes or more Unknown Intraoperative death
31 16 8 39
42 68 3 0
1 0.3
0.2 – 0.7
0.001
Postoperative Rectal Temperature Taken
No Yes Unknown Intraoperative death
37 18 0 39
88 23 2 0
1 1.8
0.9 – 3.9
0.09
Veterinary surgeon familiarity with anaesthetic
Very Familiar Familiar/Unfamiliar Unknown
86 7 1
98 11 4
1 0.7
0.3 – 2.0
0.53
Veterinary surgeon type
Senior Veterinarian Junior Veterinarian Locum Other
34 58 2 0
51 54 7 1
0.6 1 0.3
0.3 – 1.1 0.1 – 1.4
0.08 0.10 0.09
Veterinary surgeon Postgraduate qualifications
None Anaesthesia General
64 5 25
73 13 27
1 0.4 1.1
0.1 – 1.3 0.6 – 2.0
0.27 0.13 0.87
Anaesthetist Familiarity with Anaesthetic
Very familiar Familiar/Unfamiliar Unknown
73 11 10
82 22 9
1 0.6
0.3 – 1.2
0.15
Anaesthetist type Vet Qualified Nurse Unqualified Nurse
13 54 27
15 72 26
1 0.9 1.2
0.4 – 2.0 0.5 – 3.0
0.91 0.73 0.70
*Odds ratios (OR) and 95% confidence intervals (CI) are reported for categorical data. Likelihood Ratio Test (LRT) P values are reported for multiple category variables at the top of ‘P Value’ column.

204
7.3.2.2. Multivariable Model
Table 7.8 The final logistic regression model of the risk of anaesthetic-related death in
Sick Cats
Variable Categories β s.e. β OR* 95% CI* LRT P value
ASA grade ASA 3 ASA 4 – 5
2.04
0.48
7.7
3.0 – 19.9
<0.001
Perioperative fluids No fluids IV Catheter only Fluids given
-1.74 2.10
1.15 0.63
1 0.2 8.2
0 – 1.7 2.4 – 28.0
<0.001
Nitrous oxide No nitrous oxide Nitrous oxide
-1.99
0.72
1 0.1
0 – 0.6
0.002
Pulse and pulse oximeter used
None Pulse only Pulse oximeter only Pulse and pulse oximeter
-1.07 -0.75 -2.06
0.60 0.75 0.71
1 0.3 0.5 0.1
0.1 – 1.1 0.1 – 2.0 0 – 0.5
0.02
Categorical Weight
0- 6 kg 6 - max
1.96
1.00
1 7.1
1.0 – 50.2
0.03
Age (polynomial)
(age)-2 – 1.274 Per year increase
0.0016 0.0012 1.001 0.999 – 1.004 0.04
Intercept - 9.13 2.12
Random Effect for Clinic Identity
Rho 0.22 Sigma 0.97
0.07
*Odds ratios (OR) and 95% confidence intervals (CI) are reported, with corresponding Likelihood Ratio Test (LRT) P values. Number of observations 203 out of 207.
Figure 7.3 The association of anaesthetic-related death in Sick Cats with increasing age
0.9
0.95
1
1.05
1.1
1.15
1.2
1 3 5 7 9 11 13 15 17 19
Age (years)
Odd
s R
atio

205
In building the model for sick cats as in sick dogs, ASA grade remained an important
variable on which to build the model, based on its likelihood ratio p value and
biological significance. Increasing ASA grade was associated with a 7.7 fold increase in
odds (Table 7.8). The use of fluid therapy perioperatively was associated with an odds
ratio of 8.2 for patients receiving fluids. Nitrous oxide was associated with an odds ratio
of 0.1, and pulse monitoring and pulse oximetry were also associated with a reduction
in odds and retained in the model. The use of pulse monitoring was associated with an
odds ratio of 0.3, pulse oximetry an odds ratio of 0.5, whilst using both monitors an
odds ratio of 0.1. Patient weight was retained as the variable with patients 6kg or more,
associated with a 7-fold increase in odds. Age, as a categorical factor, was not retained
based on the LRT P value. However, the fractional polynomial version with a one-
power term ((age)-2) remained significant at the multivariable level (Royston, Ambler et
al. 1999). Increased odds were seen with low patient age in this variable when graphed
(Figure 7.5). No significant interactions were found. Clustering at the clinic level was
marginally significant in the mixed effects model (rho= 0.22, sigma = 0.97, P=0.072)
and was retained in the model.
The model goodness-of-fit, as assessed by the Hosmer – Lemeshow statistic, was good
(P value = 0.93) (Hosmer and Lemeshow 2000). Evaluation of the delta deviance
diagnostic statistic (Figure 7.3) also supported good model fit, with only 4 covariate
patterns greater than 4.0, and none greater than 6.0 (Hosmer and Lemeshow 2000). The
delta beta diagnostic statistic identified 3 covariate patterns with a delta beta greater
than 0.6 and none greater than 0.8 suggesting no major influential covariate patterns
(Figure 7.4). The 3 marginally influential observations were checked for errors and none
found. The model was rerun without these three covariate patterns, the parameter
estimates were minimally affected and they were retained in the model.

206
Figure 7.4 The Delta Deviance diagnostic statistic versus the estimated probability for
the Sick Cat Model
H-L
dD
Pr(case).014934 .998025
.003982
5.77565
*H-L dD, Hosmer-Lemeshow delta deviance diagnostic statistic. Pr(case), probability of being a case. J=190 covariate patterns.
Figure 7.5 The Delta Beta diagnostic statistic versus the estimated probability for the
Sick Cat Model
Pre
gibo
n's
dbet
a
Pr(case).014934 .998025
.00007
.786358
*Dbeta, Delta Beta diagnostic statistic. Pr(case), probability of being a case. J=190 covariate patterns.

207
7.4 Discussion
This chapter has identified a number of potential contributors to anaesthetic-related
death in cats. Patient health status, age, weight, use of fluid therapy and patient
monitoring of pulse and use of pulse oximetry were associated with outcome in both the
Cat and Sick Cat studies. Additionally procedure urgency, intended procedure,
endotracheal intubation were associated with anaesthetic death in the Cat study, and
delivery of nitrous oxide was associated with anaesthetic death in the Sick Cat study.
These factors may be useful in the assessment of patients risk and in reducing the odds
of anaesthetic-related death.
7.4.1 Methodological Considerations
The importance of discussing the limitations of the method remains crucial and
considerations of the method are broadly similar to those discussed in the last chapter in
relation to risk factors in dogs (Chapter 6). Methodological issues specific to the cat
studies and distinct from the dog studies will be considered in particular.
7.4.1.1 Study Design and Conduct
Case definition and selection were important considerations in evaluating the limitations
of this study and are as discussed for dog risk factors in the last chapter (Chapter 6)
(Hennekens and Buring 1987). The case definition and data checks were similar to those
reported in the dogs and the independent review panel classified the cat cases against
the same criteria as the dogs (Appendix 2.4). Considerations for the selection of the
cases and controls were also similar to those in the dog study and the limitations of the
assumed underlying population of Sick Cats were comparable. Specifically, the
extrapolation from the overall cat distribution (i.e. the distribution in time and by clinic,
derived from the cohort) to the sick population, may not have been an accurate
representation of this population’s distribution across the centres. However, without
specific data on when the sick patients were anaesthetised during the study period (this
was not recorded in the cohort), the data from the overall cat study cohort were the only
data available. In the Cat study the ratio of 1:3 to 1:4 of case: control ratio was selected
to maximise study power (Schlesselman 1982), in the Sick Cat study a compromise of
1:1 was accepted due to the concern of overloading individual clinics.

208
Issues of selection bias and non-response were comparable to those discussed in the dog
study. The response rate for the cases was comparable to that of the dog study: of 248
deaths recorded in the cohort study, for only 14 deaths (6%) was there insufficient
information to exclude them from being cases. The response rate for the controls was
also good: 80% for the Cat Study (Dohoo, Martin et al. 2003) and the random sample of
20% of these non-responders did not indicate major differences in exposure histories
from the returned controls and it would suggest the control population were not biased
to a great extent by the failure to return these controls. The lower response rate of 59%
in the Sick Cat compared to that of the Sick Dog study and remained a concern. The
potential for bias due to the low response rate remained an important issue in
interpreting the Sick Cat results. As in the dog study information on these Sick patient
non-responders was difficult to identify and hence the extent and direction of any
potential bias could not be quantified.
Information or observation bias was a concern, as for the dog study, and the same
methods were adopted to minimise them (Breslow and Day 1980; Dohoo, Martin et al.
2003). Data entry errors were minimal also, and in random checks less than 5% of the
cases and controls had an error. Misclassification of the outcome was reduced by
appointing the independent review panel, and using a list of criteria to assess patients by
(Chapter 2). Recall bias was minimised by requesting the controls soon after the
anaesthetic was undertaken, such that both case and control questionnaires would have
been completed in the immediate days after the event and the majority of the
information required would have been recorded in the practices’ patient records
(Hennekens and Buring 1987; Dohoo, Martin et al. 2003). Hence efforts to minimize
misclassification, particularly of a differential nature, were made as seen in the dog
study.
7.4.1.2 Analysis
In the model building process, as in the dog study the likelihood ratio test statistic (LRT
statistic) was preferred to the Wald test statistic when interpreting the significance of
independent variables (Hauck and Donner 1977; Hosmer and Lemeshow 2000; Dohoo,
Martin et al. 2003). The issue of missing covariate data was also a concern in this study
(Breslow and Day 1980; Katz 1999). Efforts were made at the study conduct stage to
minimise missing data in the cat study also, but some data remained unknown. At

209
the univariable level, separate categories for unknown values were created for
categorical variables, allowing inclusion of this data and assessment of potential
associations of the unknown categories with outcome. For patient weight, where a
number of patients were of unknown weight (18 patients), an ‘unknown’ category was
created rather than excluding these patients. That the odds of this unknown category
were similar to the reference category and were not strongly associated with outcome
(OR=1.1, 95% CI 0.2 – 5.5) supported this approach (Katz 1999).
In the multivariable model building process, independent variables with a large number
of missing values were only considered in the multivariable analysis if they were of
major biological importance. Again, postoperative temperature was incompletely
recorded and was omitted from the multivariable analysis. Additionally, the approach of
estimation of the value (Katz 1999) was employed for categorised age in the Cat study,
when the actual age was unknown but the individual centres indicated a specific
category of age. In the final model some variables were included with missing values,
resulting in the deletion of these cases, though the number excluded was small (7
deleted patients in the Cat study and 4 in the Sick Cat study). As discussed in the dog
study, the univariable factors were reported including all patients whilst the
multivariable model was reported with the reduced dataset, as the datasets were unlikely
to differ greatly due to the omission of these 7 and 4 patients respectively, and the
missing values were spread over only a few variables (Breslow and Day 1980;
Schlesselman 1982; Katz 1999).
The conceptual framework described in Chapter 2, helped direct model building as in
dogs and rabbits and helped to avoid some numerical problems associated with logistic
regression. As discussed in the Chapter 6, numerical problems include zero cells in
contingency tables, covariates that completely separate the outcome groups, and
collinearity of the data (Hosmer and Lemeshow 2000). The conceptual framework aided
identification of potentially non-independent factors, whilst collapsing categories was
employed where sparse data occurred. Concerns of confounding were addressed by
measuring and adjusting for the anticipated variables in the multivariable analysis as
discussed in the last chapter and similar confounders were seen in the cat study with
health status remaining important (Breslow and Day 1980; Hennekens and Buring 1987;
Dohoo, Martin et al. 2003).

210
Methods of assessing model fit were similar to those reported in Chapter 6 and
suggested the models fit reasonably well for both cat studies. Large delta deviances
greater than 4.0 to 5.0 are generally considered as poorly fitting covariate patterns
(Hosmer and Lemeshow 2000), and though there were some covariate patterns greater
than 5, there were only 7 greater than 7.0 (all less than 8.0) in the Cat model and only 4
greater than 4.0 (all less than 6.0) in the Sick Cat study. Similarly, there were no delta
betas larger than 1.0 in the Cat or the Sick Cat models. Performing the analysis without
the moderately influential covariate patterns did not affect the model coefficients, and
hence it was concluded the models explained the data well (Hosmer and Lemeshow
2000; Dohoo, Martin et al. 2003).
Further validation of the models, as discussed in Chapter 6, could also have been
performed here. As discussed in the last chapter, these methods of model validation are
particularly important to models predicting prognosis or diagnosis of disease but are
less relevant for studies identifying prognostic factors associated with an outcome
whilst adjusting for confounders, such as the current study (Katz 1999; Dohoo, Martin
et al. 2003). Hence in summary, though there remain limitations of the method adopted,
generally these limitations were minor and the models explained the data well.
7.4.2 Descriptive Data
Data from the Controls provided further information on trends in anaesthesia to
complement and support the clinic level data reported in Chapter 3. That acepromazine
combinations were most commonly used was consistent with the clinic level data
(Chapter 3), data in dogs (Chapter 6), and previous reports (Clarke and Hall 1990;
Dyson and Pettifer 1997; Joubert 2000; Wagner and Hellyer 2000; Nicholson and
Watson 2001). The predominance of propofol use for induction in anaesthesia was also
consistent with the clinic level data (Chapter 3) and more recent work in the USA
(Wagner and Hellyer 2000), but contrasts with earlier work in the UK and elsewhere
(Clarke and Hall 1990; Dodman and Lamb 1992; Dyson, Maxie et al. 1998; Joubert
2000; Nicholson and Watson 2001). Interestingly medetomidine combinations were the
next most commonly used agents, whilst significant minorities used Saffan
(alphadolone / alphaxalone) and thiopentone. Maintenance of anaesthesia was primarily
with isoflurane, indicating similar trends in anaesthetic use in cats and dogs and in the

211
USA and UK (Wagner and Hellyer 2000), though compared to the dogs (Chapter 6)
more cats were maintained with injectable agents only (34%).
Patient monitoring remained limited in cats with observation of pulse and respiratory
rates being the principle methods used. Encouragingly, separate personnel generally
monitored the patient and pulse oximetry was used in just over half of the controls.
Other methods of monitoring were used in less than 10% of the controls. As discussed
in Chapter 6, this was comparable to recent veterinary practice-based work (Dyson and
Pettifer 1997; Joubert 2000; Wagner and Hellyer 2000; Nicholson and Watson 2001),
though contrasts with the more detailed medical requirements of the minimum
monitoring standards published by Eichhorn and colleagues and recommended by the
American Society of Anesthesiologists (1986).
7.4.3 Risk Factors in the Cat Study
Patient health status consistently was an important factor associated with anaesthetic-
related death, with a 3.2-fold increase in odds seen with an increase of one category in
patient status (ASA1-2, ASA3, ASA 4-5). The increased odds with poor health status
were consistent with data from dogs and rabbits in the current study dogs (Chapter 5
and 6) and highlights the potential impact of pre-existing disease on patient outcome
across species. Further, health status was important in the construction of the model (see
conceptual framework, Chapter 2), as it was a major confounder to adjust for. The
association with health status has been consistently reported in other veterinary studies
(Clarke and Hall 1990; Dyson, Maxie et al. 1998; Hosgood and Scholl 1998; Eastment,
Johnston et al. 2002; Johnston, Eastment et al. 2004; Brodbelt, Hammond et al. 2005),
and in human anaesthesia (Marx, Mateo et al. 1973; Hovi-Viander 1980; Lunn and
Mushin 1982; Pottecher, Tiret et al. 1984; Tiret, Desmonts et al. 1986; Buck, Devlin et
al. 1988; Cohen, Duncan et al. 1988; Forrest, Cahalan et al. 1990; 1990; Pedersen,
Eliasen et al. 1990; Forrest, Rehder et al. 1992; Pedersen 1994; Warden, Borton et al.
1994; Tikkanen and Hovi-Viander 1995; McKenzie 1996; Warden and Horan 1996;
Wolters, Wolf et al. 1996; Biboulet, Aubus et al. 2001; Morita, Kawashima et al. 2001;
Donati, Ruzzi et al. 2004).
Urgency of the procedure was also an important factor to adjust other variables by in
cats, and potentially was an important predictive factor for assessing patient

212
outcome. Increasing urgency by one increment (scheduled to urgent to emergency) was
associated with a 1.6 fold increase in odds. Again, some of this effect could have
resulted from residual confounding by health status. Increased risk has been associated
with increasing urgency in the human and equine literature (Lunn and Mushin 1982;
Pottecher, Tiret et al. 1984; Tiret, Desmonts et al. 1986; Buck, Devlin et al. 1988;
Pedersen, Eliasen et al. 1990; Johnston, Taylor et al. 1995; Biboulet, Aubus et al. 2001;
Eastment, Johnston et al. 2002; Johnston, Eastment et al. 2002; Newland, Ellis et al.
2002; Donati, Ruzzi et al. 2004). As discussed in Chapter 6 and as indicated in the
conceptual framework (Chapter 2), procedural urgency was likely to reflect the ability
to thoroughly assess and stabilise the patient preoperatively, as well as personnel
staffing levels and personnel fatigue.
The association of increasing odds of anaesthetic-related death with increasing age, with
cats 12 years or older being 2.1 times more likely to die than young cats, was an
interesting finding. The increased odds with increasing age is consistent with the dog
study results (Chapter 6), and work in a referral population of dogs, that demonstrated
old age was associated with perioperative death (Hosgood and Scholl 1998). The
increased odds seen in dogs in the current study was of a greater magnitude (Dogs 12
years or older, OR= 9.8) and though this may reflect species differences, the procedures
were longer in dogs than cats (dogs duration 59.3 +/- 48.2min, cats duration 36.6 +/-
33.6 min, t test p <0.001). An association with age may be more critical for longer
procedures when potential physiological insults could be more prolonged. Work in a
referral population of cats could find no association with age, though this may have
reflected the lower power of that study (7 cases in a cohort of 138 cats) and again the
tendency for shorter procedures in cats (cats median 88 minutes, dogs median 120
minutes) (Hosgood and Scholl 1998; Hosgood and Scholl 2002). Work in horses was
consistent with an association with increasing age (Eastment, Johnston et al. 2002;
Johnston, Eastment et al. 2002; Johnston, Eastment et al. 2004), and in human
anaesthesia the risk associated with increasing age has been well documented (Hovi-
Viander 1980; Lunn and Mushin 1982; Pottecher, Tiret et al. 1984; Tiret, Desmonts et
al. 1986; Buck, Devlin et al. 1988; Cohen, Duncan et al. 1988; Forrest, Cahalan et al.
1990; 1990; Pedersen, Eliasen et al. 1990; Forrest, Rehder et al. 1992; Pedersen 1994;
Warden, Borton et al. 1994; Tikkanen and Hovi-Viander 1995; McKenzie 1996;
Warden and Horan 1996; Biboulet, Aubus et al. 2001; Morita, Kawashima et al.

213
2001; Donati, Ruzzi et al. 2004). Biologically, as discussed in Chapter 6, old patients
may be more susceptible to the depressant effects of anaesthetics, to hypothermia via
impaired thermoregulatory mechanisms and to prolonged recoveries due to tendencies
to reduced metabolic function and hypothermia (Waterman 1981; Dhupa 1995; Meyer
1999; Hall, Clarke et al. 2001).
Patient weight was also associated with anaesthetic-related death, with patients under 2
kg being nearly 16 times more likely to die and larger patients (6kg or more) nearly 3
times more likely to die than 2-6 kg patients. A component of this association with low
weight could be due to residual confounding by age, such that a number of small
patients were also younger. Nonetheless, the increased odds were consistent with the
findings in dogs (Chapter 6) and were biologically plausible. Smaller patients could
have been more prone to drug overdose, to hypothermia and to difficulties in
perioperative management (e.g. intravenous catheter placement). It is interesting that
larger patients were at increased odds, with a number of these classified as overweight.
Obesity could contribute to perioperative complications due to the potential for
respiratory compromise, lower cardiovascular reserves, and greater sink for inhalation
agents to diffuse into in overweight patients (Hall, Clarke et al. 2001).
Intended procedure was retained in the final model with major procedure patients being
three times more likely to die than minor procedure patients. This is consistent with the
work seen in dogs and rabbits in the current study (Chapters 5 and 6), in equine
anaesthesia (Eastment, Johnston et al. 2002; Johnston, Eastment et al. 2002; Johnston,
Eastment et al. 2004) and in human anaesthesia (Farrow, Fowkes et al. 1982; Fowkes,
Lunn et al. 1982; Pottecher, Tiret et al. 1984; Tiret, Desmonts et al. 1986; Newland,
Ellis et al. 2002; Donati, Ruzzi et al. 2004). As discussed in Chapter 6, the procedural
association was likely to reflect the increasing stress more complex and invasive
procedures imposed on patient physiology. The difficulties of evaluating actual
procedure, in relation to categorising patients that died prior to the procedure, were
similar to those discussed in dogs. It was interesting that increasing duration of
anaesthesia was not retained as factor in the final model, though there were univariable
trends to increasing odds with increasing duration. This may reflect shorter procedures
undertaken in cats compared to dogs, with any actual increased odds with increasing
duration having been smaller in magnitude and as such not detected by this study

214
(Type 2 error) (Dohoo, Martin et al. 2003). Alternatively, it could be the result of the
procedural effect including a large component of the duration effect.
Increased odds with endotracheal intubation have been reported before in cats (Clarke
and Hall 1990; Dyson, Maxie et al. 1998). The cat airway is smaller and more sensitive
to trauma, spasm and oedema than that of the dog and as such the process of intubation
if poorly performed could be expected to increase complications (Hall and Taylor 1994;
Hardie, Spodnick et al. 1999; Mitchell, McCarthy et al. 2000). The tendency to an
interaction with intended procedure suggested that the increased odds were primarily
seen in minor procedures, whilst in more major procedures there was a tendency to
reduced odds with endotracheal intubation. Though not retained in the final model this
interaction would suggest that in the more invasive procedures the advantage of
securing an airway outweighed the risks of intubation, whilst in more simple procedures
the process of intubation was more important.
The association with monitoring pulse and the use of pulse oximetry has not been
reported in small animals and was not seen in the dog study (Chapter 6). Using a heart
rate monitor was previously associated with increased odds of perioperative morbidity
(Dyson, Maxie et al. 1998). Theoretical analysis in human anaesthesia suggested pulse
oximetry alone would have detected 40 - 82% of reported perioperative incidents,
combined with capnography 88 - 93% and with capnography and blood pressure 93% of
incidents (Eichhorn, Cooper et al. 1986; Tinker, Dull et al. 1989; Webb, Van der Walt
et al. 1993). That monitoring pulse and using a pulse oximeter were associated with
reduced odds was encouraging, and suggests that some form of assessment of
cardiovascular function (pulse quality and rate) and respiratory function (oxygen
saturation) may be important in minimizing perioperative complications. That other
methods of monitoring were not retained in the model was likely to reflect the limited
power of the study to detect differences in rare exposures, as most other monitoring
devices were used in less than 5% of the controls.
Finally, perioperative fluid therapy was retained in the model, with the administration of
fluids being associated with nearly a four-fold increase in odds. This latter association
was surprising and may reflect, at least in part, residual confounding by health status
and duration of procedure. Nonetheless, a component of the increased odds may be
related to the potential for fluid overload, increased cardiac preload and pulmonary

215
oedema. Cats, as a small species, would be more prone to fluid overdose and with very
few practices measuring central venous pressure or using a fluid pump the potential for
overdose was possible. This is an interesting association and further work is merited to
assess the risks associated with fluid therapy.
No major drug associations were retained in the final model. Though univariable
associations were seen, when adjusting primarily for health status, most associations
were no longer significant. Premedication was not retained in the model, though there
were tendencies to reduced odds (when premedication was included in the multivariable
model) with acepromazine (adjusted OR=0.6, 95% CI 0.3 – 1.1), and benzodiazepines
/opioids (adjusted OR = 0.5, 95% CI 0.2 – 1.4) compared to no premedication, whilst
medetomidine premedication was associated with similar odds (adjusted OR= 1.1, 95%
CI 0.3 – 3.4). The tendency to reduced odds with acepromazine is supported by
previous work (Clarke and Hall 1990; Dyson, Maxie et al. 1998; Johnston, Eastment et
al. 2002; Brodbelt, Hammond et al. 2005), and the lack of increased odds with
medetomidine contrasts to strong evidence associating xylazine (another alpha2 agonist)
with increased odds (Clarke and Hall 1990; Dyson, Maxie et al. 1998).
Similarly there were no clear associations with induction agent used. The perception in
veterinary practice, that propofol is a ‘safe’ drug relative to other agents (Wagner,
Wright et al. 2003; Bilborough 2005), was not observed here. Dose effects were
evaluated for the major drugs used, and as reported in dogs, there were tendencies to
reduced odds with increasing dose, though these were partly confounded by health
status and had limited power given the small number of patients receiving specific drugs
(Appendix 7.1). In contrast to the results reported in dogs (Chapter 6), there were no
associations retained in the final model with maintenance / induction combinations
either. This difference may reflect species differences, inability to detect real differences
present in the cat study (type 2 error) or significance by chance (type 1 error) or bias in
the dog study. Further work is warranted to evaluate the drug associations reported.
In summary, a number of factors have been identified associated with anaesthetic-
related death in cats. Patient health status, age and weight, and procedure urgency and
complexity may be useful in assessing patient risk preoperatively. The method of
airway maintenance, pulse and pulse oximetry monitoring and perioperative fluid

216
therapy may influence outcome and these factors require further evaluation.
7.4.4 Risk Factors in the Sick Cat Study
Health status has consistently been identified as a major risk factor in this project with
poor health status patients being at particular risk of anaesthetic-related death. In light of
the Pilot study (see Chapter 2) and a retrospective case-control study undertaken in a
referral population (Brodbelt, Hammond et al. 2005), it was identified that the overall
study population would generate insufficient poor health-status control patients to be
able to evaluate associations in this important subpopulation carefully. Additionally it
was thought the potential for improving patient outcome was particularly great in this
group if important associations were identified. Hence this sub-study was undertaken.
Poor health status remained an important factor to adjust for in the Sick Cat study,
whilst urgency was not retained as a factor. That urgency of procedure was not a major
factor reflects the trend to mostly urgent and emergency procedures in this poor-health
status group. The increased odds for increasing ASA grade (ASA 5 versus ASA 3-4,
OR=7.7), was greater than that of the overall Cat study (1 category increase, OR = 3.2)
and a component of this difference in association with health status may reflect residual
confounding by urgency of procedure in the Sick Cat study.
The association with low weight was not retained in this model. However, the increased
odds with increased weight (OR= 7.1) were greater than the 2.8-fold increase in odds in
the same 6 kg plus group in the Cat study. The greater magnitude reported in the sick
population in part, may reflect a greater imprecision of sampling, given the smaller
study size and the larger confidence interval (Dohoo, Martin et al. 2003). However, part
of the increased odds with increasing weight could have been related to greater
respiratory compromise, lower cardiovascular reserves, and a greater sink for inhalation
agents to diffuse into, in larger and overweight patients (Hall, Clarke et al. 2001).
Age remained a significant variable associated with outcome in this high-risk group,
though the magnitude of the association was small. Categorical age was not retained but
a fractional polynomial version was, with a tendency to increased odds with low age
being observed. The lack of a major association with increasing age was in contrast to

217
the association reported in the Cat study, and may reflect greater homogeneity of age
within this higher risk group.
The association with administering fluid therapy, observed in the Cat study, was
retained in the Sick Cat study, though the odds ratios reported were more extreme (Sick
Cat study OR = 8.2, for receiving fluids, Cat study OR=3.9). The greater odds observed
with perioperative fluids may reflect less confidence in the actual odds ratio.
Additionally, these more extreme coefficients may reflect cats less able to accommodate
large volumes of fluids, and potentially greater benefits in securing intravenous access
(Hall and Taylor 1994).
Monitoring of pulse and pulse oximetry remained associated with outcome in the sick
cat group, and the magnitude of reduced odds with pulse and pulse oximetry were
comparable to those reported in the Cat study. That patient monitoring was still relevant
in the higher risk group could be expected, given these patients would be particularly
sensitive to cardiovascular and respiratory disturbance (Hall, Clarke et al. 2001).
Finally, the observation that administering nitrous oxide was associated with reduced
odds of anaesthetic-related death, was an interesting finding, and co-administration of
nitrous oxide can reduce the other inhaled anaesthetic agent requirements and reduce
dose-dependent cardiopulmonary depression of this other agent (Steffey, Gillespie et al.
1975; Hall, Clarke et al. 2001). This association has not been reported previously and
merits further evaluation.
In summary, the associations identified in this poor health status subpopulation were
similar to many of those reported in the overall Cat study. In these sick cats, patient
health status remained an important factor to aid patient assessment, as was weight, and
to a lesser extent age. The use of pulse and pulse oximeter monitoring remained
associated with outcome and may be valuable in reducing the odds of anaesthetic-
related death in sick patients. Fluid therapy appeared detrimental to patient outcome
whilst nitrous oxide was associated with reduced odds and both these observations
warrant further evaluation.

218
7.4.5 Causation and Association
The step from association to causation is difficult to establish in an observational study
as discussed in Chapter 6 (Schlesselman 1982). Hill (1965) described a number of
criteria against which to assess the likely role of observed factors in the causation of an
outcome. The strength of the association, the consistency with other work, the
specificity of the association, temporality of the relationship, the presence of a
biological gradient, the biological plausibility, the coherence with the known biology of
the disease or subject under study, the presence of supporting experimental evidence,
and the presence of analogy to a similar condition are all criteria to base an assessment
of the likely role of an association in causation (Hill 1965).
Based on these criteria patient health status and in view of the conceptual framework
developed (Chapter 2), procedure urgency and complexity, patient age and endotracheal
intubation would appear to causally contribute to anaesthetic-related death. Patient
health status has been consistently reported throughout this study in a number of species
and in previously published work (Marx, Mateo et al. 1973; Hovi-Viander 1980; Lunn
and Mushin 1982; Pottecher, Tiret et al. 1984; Tiret, Desmonts et al. 1986; Buck,
Devlin et al. 1988; Cohen, Duncan et al. 1988; Clarke and Hall 1990; Forrest, Cahalan
et al. 1990; 1990; Pedersen, Eliasen et al. 1990; Forrest, Rehder et al. 1992; Pedersen
1994; Warden, Borton et al. 1994; Tikkanen and Hovi-Viander 1995; McKenzie 1996;
Warden and Horan 1996; Wolters, Wolf et al. 1996; Dyson, Maxie et al. 1998; Hosgood
and Scholl 1998; Biboulet, Aubus et al. 2001; Morita, Kawashima et al. 2001; Hosgood
and Scholl 2002; Donati, Ruzzi et al. 2004; Johnston, Eastment et al. 2004; Brodbelt,
Hammond et al. 2005), the association was found to be reasonably strong (OR=3.2),
there was temporality of patient disease and subsequent outcome, there was a biological
gradient (increasing odds with increasingly poor status), and the results were plausible
and coherent with current knowledge.
Similarly, the association with urgency of the procedure has been reported across
species in the current study and in previous work (Lunn and Mushin 1982; Pottecher,
Tiret et al. 1984; Tiret, Desmonts et al. 1986; Buck, Devlin et al. 1988; Pedersen,
Eliasen et al. 1990; Johnston, Taylor et al. 1995; Biboulet, Aubus et al. 2001; Eastment,
Johnston et al. 2002; Johnston, Eastment et al. 2002; Newland, Ellis et al. 2002; Donati,
Ruzzi et al. 2004). The magnitude of the association, though not as large as seen for
219
health status was still biologically significant (OR=1.6 for trend), and again there was a
biological gradient for increased odds with increasing urgency, and there was
appropriate temporality of urgency and outcome. The association was plausible and
coherent with current understanding of anaesthesia and the risks associated with poor
patient stabilisation prior to anaesthesia (Hall, Clarke et al. 2001) and as such it would
appear procedure urgency contributed to anaesthetic-related death.
The complexity of the procedure would appear also to contribute to anaesthetic-related
death. This finding was demonstrated across species in the current study, and in
previous work in equine anaesthesia (Eastment, Johnston et al. 2002; Johnston,
Eastment et al. 2002; Johnston, Eastment et al. 2004) and in human anaesthesia
(Farrow, Fowkes et al. 1982; Fowkes, Lunn et al. 1982; Pottecher, Tiret et al. 1984;
Tiret, Desmonts et al. 1986; Newland, Ellis et al. 2002; Donati, Ruzzi et al. 2004). The
association was strong in cats (OR= 2.7), it was plausible, temporal and coherent with
the current understanding of the physiological impact of surgery on anaesthesia (Clarke
1970; Hall, Young et al. 1978; Kehlet 1984). The comments in dogs and rabbits in
relation to intended and actual procedure would equally apply here, and the measured
association reflected both actual procedure in part and also anticipated procedure and
the type of patient based on that element.
The association with age was consistent with work in other species (Hovi-Viander
1980; Lunn and Mushin 1982; Pottecher, Tiret et al. 1984; Tiret, Desmonts et al. 1986;
Buck, Devlin et al. 1988; Cohen, Duncan et al. 1988; Forrest, Cahalan et al. 1990; 1990;
Pedersen, Eliasen et al. 1990; Forrest, Rehder et al. 1992; Pedersen 1994; Warden,
Borton et al. 1994; Johnston, Taylor et al. 1995; Tikkanen and Hovi-Viander 1995;
McKenzie 1996; Warden and Horan 1996; Hosgood and Scholl 1998; Biboulet, Aubus
et al. 2001; Morita, Kawashima et al. 2001; Eastment, Johnston et al. 2002; Johnston,
Eastment et al. 2002; Donati, Ruzzi et al. 2004; Johnston, Eastment et al. 2004). There
was a strong association in cats 12 years and older (OR=2.1), age exhibited a gradient of
odds with increasing age, the association was plausible and it was consistent with the
understanding of the physiological changes with age (Thurmon, Tranquilli et al. 1996).
Hence, increasing age appears to causally contribute to the outcome.
Increasing odds with endotracheal intubation have been reported before in cats (Clarke
and Hall 1990; Dyson, Maxie et al. 1998), and the odds reported were of a

220
reasonable magnitude (OR=1.9). No biological gradient was possible given only
mortality was studied, however the results are plausible and coherent with the perceived
knowledge of the technical considerations for intubation in cats (Hall and Taylor 1994).
The tendency to an interaction with procedure type as discussed earlier would support
the causal link, and on balance the evidence supports a causal association of intubation
with anaesthetic-related death. The decision to intubate a specific cat should be based on
the risks of the technique versus the need to secure a patent airway.
Other factors observed in the Cat and Sick Cat studies require further evaluation before
concluding they causally contribute to anaesthetic-related death. These other
associations were not based on a priori hypotheses, may not have fitted entirely within
the conceptual framework and data-derived hypotheses should be interpreted cautiously
(Hennekens and Buring 1987). The magnitude of the association with weight was large
in the Cat study, and increased odds associated with extremes of weight were consistent
with work in dogs in the current study. However, previous work has not demonstrated a
weight-related risk in cats and an element of the magnitude of the odds reported with
low weight could represent residual confounding by age, due to neonatal considerations.
A gradient of increasing risk with increasing weight was not demonstrated, and though
plausible and coherent with current understanding specifically of hypothermia in small
patients (Waterman 1981; Dhupa 1995; Meyer 1999; Hall, Clarke et al. 2001), further
work is merited before concluding that weight causally contributed to the outcome.
Monitoring pulse and the use of pulse oximetry were associated with reduced odds in
both the Cat and the Sick Cat studies, and though interesting and the results were of a
reasonably large magnitude (OR=0.2 -0.3), this was not demonstrated in other species in
the current study or in previous work. In human anaesthesia there is work that suggests
pulse oximetry was associated with reducing complications (Eichhorn, Cooper et al.
1986; Tinker, Dull et al. 1989; Webb, Van der Walt et al. 1993) and the findings are
plausible, however further work is merited before the causal link is concluded.
Similarly, the finding that fluid therapy was associated with increased odds requires
further evaluation. The association was strong (OR= 3.9 in the cat study, OR=8.2 in the
sick cat study), and this increasing odds in sicker patients lends a biological gradient to
the evidence. However, though plausible if fluid overload was occurring, as indicated in
the conceptual framework (Chapter 2), fluid therapy may have in part also reflected

221
the procedure undertaken and patient health status, and residual confounding may
account for much of this association. Until further work supports this finding, it should
be viewed cautiously. Finally the association with nitrous oxide in the Sick Cat study
was also interesting, though has not been reported in previous work. Again, it is
biologically plausible (Steffey, Gillespie et al. 1974; Steffey, Gillespie et al. 1975), but
further work is merited to evaluate the association more carefully.
In summary, a number of factors were identified as potential contributors to the multi-
factorial process of anaesthetic-related death in cats. Severity of preoperative disease,
procedural urgency and complexity, and age formed a useful core of variables to aid
patient risk assessment preoperatively. Extremes of patient weight were associated with
increased odds and may assist patient assessment. Modifiable factors included
endotracheal intubation which was associated with increased odds, should be
undertaken carefully and may be appropriate to avoid in certain circumstances.
Monitoring methods, the use of perioperative fluids, and the administration of nitrous
oxide may additionally modify risk and merit further investigation.
222
Chapter 8: General Conclusions
This study has described the current risks of anaesthetic-related mortality in small
animals within a large cohort of small animal practices and has identified risk factors
associated with this outcome in the three most commonly anaesthetised small animals:
dogs, cats and rabbits. The aims of this study were to estimate risks of anaesthetic-
related death, to identify risk factors associated with anaesthetic-related death and to
make recommendations to veterinary practitioners to improve the clinical practice of
small animal anaesthesia.
A convenience sample of motivated and interested practices was chosen over a random
sample due to the amount of data requested, the long data recording period and the need
for good practice compliance. Though care should be taken in extending these
conclusions to all UK small animal practices as less interested, non-involved practices
could have substantially different practices and complication rates, the conclusions
drawn from this sample were valid for this cohort. Given the large sample size and
involvement of approximately 0.5% of UK practices, the range of practice types
involved in the study, and the similar characteristics of practice size and type when
compared to data from the RCVS (RCVS 2000; RCVS 2004), the results are likely to be
relevant, if not directly applicable, to most UK small animal veterinary practices.
The case definition of perioperative death (including euthanasia) occurring after
premedication and within 48 hours of termination of the procedure, except where death
or euthanasia was due solely to inoperable surgical or pre-existing medical conditions,
inevitably allowed some degree of subjectivity and included a spectrum of causes of
death. The consistency of case classification based on this definition and the reduction
of subjectivity were increased by appointing an independent review panel to classify all
cases in dogs and cats against an explicit set of criteria (Appendix 2.4). The deaths
included within this definition were restricted, based on the criteria, to those in which it
was not reasonable to exclude anaesthesia from having contributed to the outcome. This
approach reduced the potential for misclassification bias.
The nested case-control study design was particularly appropriate for the identification
of risk factors, given the rare nature of anaesthetic-related death in the species studied
(Schlesselman 1982; Hennekens and Buring 1987; Dohoo, Martin et al. 2003). A
223
cohort design alone would have been inefficient and practically difficult, requiring the
recording of large amounts of information for every patient. The selection of the
controls for this study however was particularly important, to ensure that they were
representative of the population from which the cases were derived (Schlesselman
1982). The use of the nested case-control approach and randomly and prospectively
selecting the dog and cat controls from the underlying cohort reduced selection bias in
the controls selected and thus increased the validity of any conclusions drawn.
The description of practice trends of this large cohort provided a valuable insight into
the current practice of small animal anaesthesia in the UK. Since the last UK study
(Clarke and Hall 1990), new drugs have been introduced including medetomidine,
propofol, isoflurane and sevoflurane, and pulse oximetry has been widely adopted for
perioperative patient monitoring. However, preoperative patient workup and evaluation
remains limited, other methods of electronic patient monitoring are rarely used and
perioperative fluid therapy is infrequently given.
The risk of anaesthetic-related death in the study population of cats and dogs was
approximately half of that published in the previous UK study when reported by health
status (Clarke and Hall 1990). The overall risks of 0.17% and 0.24% in dogs and cats
respectively, were a reduction compared to risks reported in the last UK study, and are
broadly comparable to other international small studies (Dodman and Lamb 1992;
Rintasalo and Vainio 1995; Dyson, Maxie et al. 1998; Joubert 2000). Given the
relatively highly qualified population of veterinarians participating in the study
compared to the level of qualifications documented by the RCVS in the UK (RCVS
2000), this estimate is likely to be an overestimate of the risk in the UK. From a
comparisons perspective this is likely to have been the case in the other studies also,
that is the most motivated practices and potentially the safest participate in such studies.
Nonetheless, when compared to approximately 0.02 to 0.005% for similarly defined
anaesthetic-related death in man (Tikkanen and Hovi-Viander 1995; Eagle and Davis
1997; Suan, Perez-Torres et al. 1997; Biboulet, Aubus et al. 2001; Kawashima, Seo et
al. 2001), it is clear there remains substantial room for improvement. Further, the
greater than ten-fold increase in risk for sick dogs, cats and rabbits (1.33%, 1.40% and
7.37% respectively), compared to healthy patients (0.05%, 0.11% and 0.73%
respectively), identified high-risk patients as a population in which major reductions

224
in risk should be made. Patient health status was an important risk factor that has been
consistently reported in other small animal studies (Clarke and Hall 1990; Dyson,
Maxie et al. 1998; Hosgood and Scholl 1998; Brodbelt, Hammond et al. 2005), in
horses (Eastment, Johnston et al. 2002; Johnston, Eastment et al. 2004) and in human
anaesthesia (Marx, Mateo et al. 1973; Hovi-Viander 1980; Lunn and Mushin 1982;
Pottecher, Tiret et al. 1984; Tiret, Desmonts et al. 1986; Buck, Devlin et al. 1988;
Cohen, Duncan et al. 1988; Forrest, Cahalan et al. 1990; 1990; Pedersen, Eliasen et al.
1990; Forrest, Rehder et al. 1992; Pedersen 1994; Warden, Borton et al. 1994; Tikkanen
and Hovi-Viander 1995; McKenzie 1996; Warden and Horan 1996; Wolters, Wolf et al.
1996; Biboulet, Aubus et al. 2001; Morita, Kawashima et al. 2001; Donati, Ruzzi et al.
2004).
It was interesting that the majority of these anaesthetic-related deaths occurred
postoperatively. Of the postoperative deaths in dogs, cats and rabbits, 50% occurred
within 3 hours of termination of anaesthesia. Increased awareness of the risks of the
postoperative period is merited and improvements in the monitoring and management of
patients, particularly in the early postoperative period, could reduce complications
substantially.
The species-specific mortality risks in other small animals have not been previously
documented. The risks of greater than 1% in most species were high and work must be
done to improve the anaesthetic management of these species. Rabbits in particular,
merit close attention as they are relatively commonly anaesthetised, but still carry a high
risk of anaesthetic-related death. The major risk factor for anaesthetic-related death in
rabbits was patient health status. Additionally, increasing procedure complexity (major
versus minor), increasing duration of anaesthesia and increasing veterinary surgeon
familiarity with the anaesthetic-agents used were also associated with death. Identifying
potentially high-risk patients, based on their health status, the procedure to be
undertaken and the intended duration of anaesthesia, would be valuable in quantifying
the risks of anaesthesia and targeting patients that require intensive perioperative
management. In a species that is still only infrequently anaesthetised in many practices,
the veterinarians’ familiarity with the anaesthetic used was more important than the
specific drugs used. However, matching by clinic identity in this section of the study
limited the ability to look closely at drug factors in rabbits as many centres used

225
only one protocol for rabbits. Further work will be required to address specific drug-
related associations, but in the absence of this work the use of drugs familiar to the
clinician is to be highly recommended.
Health status was found to be a consistent and important risk factor throughout this
study in the three species examined in detail and this work supports the validity of
applying the ASA grade system to veterinary species. It was a valuable predictor
independent of patient size and age, with the latter variables often being retained as
separate factors within the same models. The stratification of ASA grade into 3
categories in dogs and cats represented the major degrees of pre-existing pathology,
with stratification into minor or no disease (ASA grade 1-2), severe non-incapacitating
disease (ASA grade 3), and life threatening disease (ASA grade 4-5) and from a
biological perspective represented the major divisions of risk by health status. However,
just as the binary division (ASA grade 1-2 versus 3-5) used in rabbits may have
insufficiently accounted for divisions in disease severity, the 3 category stratification
may also have incompletely represented disease severity. Potentially a four category
finer stratification could have been adopted (ASA 1, 2, 3, 4-5) allowing more precise
modelling of disease risk. Interactions by health status were also explored. At the
univariable stage, in dogs there were non-significant tendencies for greater effects seen
with age and intended duration in the healthy patients, than the sick patients. In cats,
evidence of interaction was observed for age, intended procedure and fluid therapy,
such that healthy patients had greater odds with increasing age, whilst the associations
with major intended procedure and fluid therapy were greater in the healthy patients.
These interactions were not significant and not retained in the final models. However,
an alternative approach would have been to explore models in healthy patients only (as
was performed for sick patients) to account for this potential heterogeneity.
Nonetheless, health status as described was strongly associated with outcome and an
important confounder when building the model.
Increasing patient age and low patient weight were also associated with anaesthetic-
related death and careful consideration of the risks of anaesthesia and preoperative
patient preparation would be particularly important in the sick, old and small dog.
Procedural urgency, complexity (major versus minor) and intended duration were
procedural factors associated with outcome and should also be considered when

226
planning the procedure to be undertaken and the perioperative management of the
patient. The induction and maintenance combination was associated with outcome and
was the major modifiable factor identified in dogs. Mask induction of anaesthesia was
associated with a 6-fold increase in odds as was halothane maintenance compared to
isoflurane. The increased odds associated with total inhalational anaesthesia are
consistent with previous work in small animals and horses, in which mask inductions
have tended to be associated with increased risk of complications (Clarke and Hall
1990; Johnston, Taylor et al. 1995; Dyson, Maxie et al. 1998; Johnston, Eastment et al.
2002); re-evaluation of this method is recommended. Increased odds of anaesthetic-
related death with halothane anaesthesia, compared to isoflurane, have not been
demonstrated in small animals, and halothane maintenance was not significantly
different to isoflurane in a randomised controlled trial of horses (Eastment, Johnston et
al. 2002; Johnston, Eastment et al. 2004). However, isoflurane was associated with
reduced odds compared to halothane in young horses in this study (Eastment, Johnston
et al. 2002; Johnston, Eastment et al. 2004). Isoflurane causes less myocardial
depression, greater vasodilatation, and sensitises the heart less to catecholamine-induced
arrhythmias than halothane, potentially reducing afterload on the heart and work of the
heart (Joas and Stevens 1971; Steffey, Gillespie et al. 1975; Steffey and Howland 1977;
Hellebrekers 1986; Tranquilli, Thurmon et al. 1988; Grandy, Hodgson et al. 1989;
Lemke, Tranquilli et al. 1993; Hikasa, Okabe et al. 1996; Hikasa, Ohe et al. 1997;
Hodgson, Dunlop et al. 1998) and as such could be associated with reduced odds.
Further work is merited to evaluate the risks associated with isoflurane.
High-risk dogs were investigated separately in the sub-population of sick patients
anaesthetised in the study. Health status, procedure urgency and complexity (major
versus minor) and patient weight were significant factors retained in the Sick Dog
model and would be valuable to aid assessment of these patients. Halothane was
associated with a 5-fold increase in odds compared to isoflurane and the use of
isoflurane over halothane should be considered in these patients. Additionally,
preoperative blood testing, particularly in the most sick patients (ASA 4-5) was
associated with reduced odds, as was spontaneous ventilation versus controlled
ventilation. Both these observations were not based on a priori hypotheses and have not
been reported previously, and so should be interpreted cautiously. However,
preoperative bloods on their own or as a marker for further preoperative patient

227
workup, may allow better assessment of these sick patients and encourage appropriate
patient management. Few dogs are routinely ventilated for procedures other than for
thoracic surgery which may carry an inherently higher risk, or when ventilation has
been poorly maintained spontaneously and residual confounding may thus underlie this
association. The findings in the Sick dog study proved interesting but given the high
non-response rate in the controls, must be treated cautiously.
The increased odds associated with increasing poor health status was of a similar
magnitude in cats and dogs (OR= 3.2 for a 1 category increase in ASA grade, dogs OR
= 2.9). Urgency of procedure and procedural complexity (major versus minor) were also
associated with death and should be considered when assessing anaesthetic risk in cats.
Extremes of weight and increasing age were associated with increased odds and again
patient health status, age and weight should be major factors used to assess the patient
risk. Endotracheal intubation was associated with increased odds, in contrast to the
results in dogs. This is consistent with previous work (Dyson, Maxie et al. 1998) and
suggests greater care should be taken with endotracheal intubation in cats. Interestingly,
no drug related factors were identified, but patient pulse monitoring and pulse oximetry
were associated with reduced odds. This has not been documented before in small
animals, but is consistent with work in man (Eichhorn, Cooper et al. 1986; Tinker, Dull
et al. 1989; Webb, Van der Walt et al. 1993). Based on these findings, regular
monitoring of pulse and the use of pulse oximetry should be recommended. Whether
these are the only methods required is uncertain, as other methods, such as capnography
and measurement of blood pressure, were infrequently used and hence difficult to assess
in this study. Perioperative fluid therapy was associated with increased odds. This
finding has not been documented previously, though inadvertent fluid overload would
be easier to achieve in cats than dogs given their smaller size. However, the finding may
be the result of residual confounding by health status, procedure length or complexity
and as such requires further evaluation.
Within the sick sub-population of cats studied, similar factors to those reported in the
Cat Study were identified, with the addition of nitrous oxide being associated with
reduced odds. Nitrous oxide does reduce the inhalation agent requirements of other
inhalation agents co-administered (DeYoung and Sawyer 1980) and as such may reduce
dose-dependent cardiovascular and respiratory depression. This finding merits

228
further work and again caution should be exercised with these results given the large
non-response rate for the controls
In conclusion, risks of anaesthetic-related death in small animals remain substantially
higher than that reported in man, dogs and cats and major risk factors for anaesthetic-
related death have been identified in dogs, cats and rabbits. Less commonly
anaesthetised small animal species were at greatest risk. Given the need to anaesthetise
rabbits more often than other minor small animal species and the high risk of death,
rabbits should be targeted as a species requiring immediate improvement in anaesthetic
management. Particular attention to patient management for the poor health status
patients is warranted and closer attention to the immediate postoperative period may
reduce the risk of death. Other patient factors: age and weight and procedure factors:
complexity, duration and urgency were consistently more important than drug factors in
the species studied, though the use of isoflurane may be advantageous over halothane
and monitoring of patient pulse and the use of pulse oximetry should be recommended.
Good anaesthetic practice, combined with the results of experimental work and the
factors highlighted in this study should be used to improve anaesthetic management of
small animals and reduce the risk of anaesthetic-related death.

229
Appendices
Appendix 2.1 American Society of Anesthesiologists Health Status Classification
Class 1 – fit and healthy, no systemic disease.
Class 2 – mild to moderate systemic disease only.
E.g. skin tumour, chronic arthritis, fracture without shock.
Class 3 – severe systemic disease, causing mild symptoms / limiting activity, but not
incapacitating.
E.g. moderate hypovolaemia, anaemia or pyrexia, mild to moderate heart failure.
Class 4 – severe systemic disease that is a constant threat to life.
E.g. severe uraemia, toxaemia, hypovolaemia, heart failure.
Class 5 – moribund patient that is not expected to survive 24 hours with or without the
operation.
E.g. extreme sepsis / shock.
(Anon 1963)

230
Appendix 2.2 CEPSAF Case Diary Questionnaire

CEPSAF Case Diary Sheet No: Clinic No:
Branch Initials (if more than one branch):
ALL anaesthetics and sedations of dogs, cats and exotic species should be entered on this form.
*For patients that die or are euthanased please also indicate the cause of death or reason for euthanasia in ‘Outcome at 48 hours’,e.g. inoperable tumour, anaesthetic related, etc.
Please return to: Dave Brodbelt, Animal Health Trust, Lanwades Park, Kentford, Newmarket, Suffolk CB8 7UU, Fax 01638 555 659
Date Patient name or ID Species: Dog (D), Sedation (Sed) or Outcome at 48 hours:Cat (C) or Exotic Anaesthetic (An) Alive (A), Dead (D)* orSpecies (please specify) Euthanased (PTS)*
1
2
3
4
5
6
7
8
9
10
11
12
13
14
15
16
17
18
19
20
21
22
23
24
25
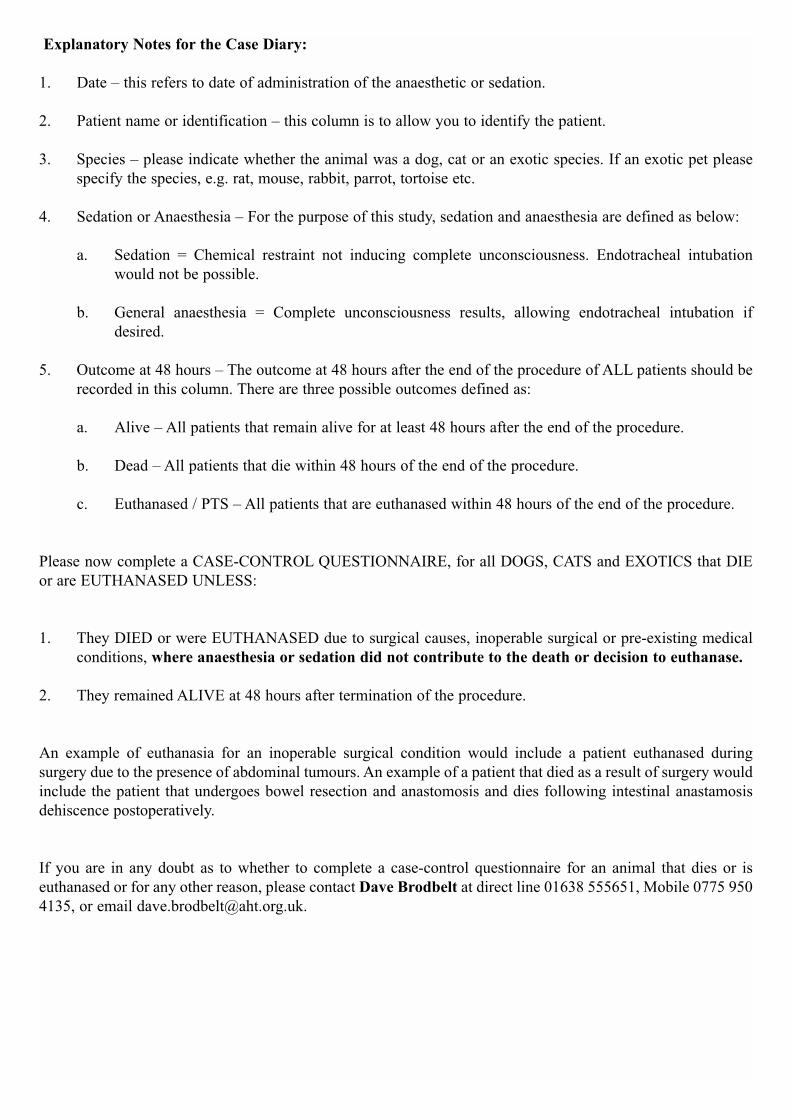
Explanatory Notes for the Case Diary:
1. Date – this refers to date of administration of the anaesthetic or sedation.
2. Patient name or identification – this column is to allow you to identify the patient.
3. Species – please indicate whether the animal was a dog, cat or an exotic species. If an exotic pet pleasespecify the species, e.g. rat, mouse, rabbit, parrot, tortoise etc.
4. Sedation or Anaesthesia – For the purpose of this study, sedation and anaesthesia are defined as below:
a. Sedation = Chemical restraint not inducing complete unconsciousness. Endotracheal intubationwould not be possible.
b. General anaesthesia = Complete unconsciousness results, allowing endotracheal intubation ifdesired.
5. Outcome at 48 hours – The outcome at 48 hours after the end of the procedure of ALL patients should berecorded in this column. There are three possible outcomes defined as:
a. Alive – All patients that remain alive for at least 48 hours after the end of the procedure.
b. Dead – All patients that die within 48 hours of the end of the procedure.
c. Euthanased / PTS – All patients that are euthanased within 48 hours of the end of the procedure.
Please now complete a CASE-CONTROL QUESTIONNAIRE, for all DOGS, CATS and EXOTICS that DIEor are EUTHANASED UNLESS:
1. They DIED or were EUTHANASED due to surgical causes, inoperable surgical or pre-existing medicalconditions, where anaesthesia or sedation did not contribute to the death or decision to euthanase.
2. They remained ALIVE at 48 hours after termination of the procedure.
An example of euthanasia for an inoperable surgical condition would include a patient euthanased duringsurgery due to the presence of abdominal tumours. An example of a patient that died as a result of surgery wouldinclude the patient that undergoes bowel resection and anastomosis and dies following intestinal anastamosisdehiscence postoperatively.
If you are in any doubt as to whether to complete a case-control questionnaire for an animal that dies or iseuthanased or for any other reason, please contact Dave Brodbelt at direct line 01638 555651, Mobile 0775 9504135, or email [email protected].

231
Appendix 2.3 CEPSAF Case-Control Questionnaire

CEPSAFConfidential enquiry into perioperative small animal fatalities
Case control questionnaire
Clinic number Instructions1. This form must be filled in for ALL perioperative DEATHS (including patients euthanased) within 48 hours of termination of the
procedure EXCEPT for:
Patients that DIED or were EUTHANASED for inoperable surgical or pre-existing medical conditions, where anaesthesia orsedation did not contribute to the death or decision to euthanase.
If you are uncertain as to whether or not to complete this form please consult the decision tree at the beginnning of your CEPSAFFolder or contact Dave Brodbelt at the AHT as below.
2. Please also complete this form for DOG and CAT CONTROLS. When completing this questionnaire for a control please do notcomplete page 8 (Section H : Fatality Details).
3. All information provided will be kept strictly confidential.
4. Please answer all questions unless directed not to. Questions require either ticking a box of the appropriate choice or responding witha written answer. If you do not know the answer to a question please write ‘unknown’ next to the question.
5. Please add any further comments that you think might be helpful at the end of the questionnaire.
6. If you have any questions please contact Dave Brodbelt at: Tel 01638 555651, Fax 01638 555659, mobile 0775 950 4135, email [email protected].
When completed please return in the enclosed reply paid envelope, to: Dave BrodbeltCEPSAFAnimal Health Trust Lanwades Park, KentfordNewmarket, Suffolk CB8 7UU
Section A: Patient’s details
1. Patient name or other form of ID:
2. Please state the patient’s species: DOG CAT Exotic (please specify species)
3. What was the patient’s BREED?
4. Please state the sex of patient: Male Female Not known
Entire Neutered Not known
5. What was the patient’s age? years months
6. What was the patient’s weight?
a) How was the patient’s weight assessed? Scales Estimate
b) In your opinion was the patient overweight? YES NO
7. What type of case was this? Primary Referred
8. Did the patient have any other GENERAL ANAESTHESICS in the last month? YES NO Not known
If YES, please specify the number of GA’s: 1 2 3 or more Not known
9. Did the patient have any other SEDATIONS in the last month? YES NO Not known
If YES, please specify the number of sedations: 1 2 3 or more Not known
kg
1|

Section B: Pre-operative evaluation Now we are interested in aspects related to the evaluation of the patient prior to the procedure.10. Preoperatively were there any ongoing medical conditions (eg heart failure, renal disease, etc)?
YES NO Not known If NO, please go to Q11
If YES, please specify the type of illness and current treatment:
Respiratory/cardiac _______________________________________________________________________________________
Liver/kidney _______________________________________________________________________________________
Other, please specify: _______________________________________________________________________________________
11. In the opinion of the veterinary surgeon, PRE-operatively what anaesthetic risk group would you classify the patient as?
Class 1 – fit and healthy, no systemic disease.
Class 2 – mild to moderate systemic disease only, eg skin tumour, chronic arthritis, fracture without shock.
Class 3 – severe systemic disease, showing symptoms or limiting activity but not incapacitating, eg moderate hypovolaemia,anaemia or pyrexia, mild to moderate heart failure.
Class 4 – severe systemic disease that is a constant threat to life, eg severe uraemia, toxaemia, hypovolaemia, heart failure.
Class 5 – moribund patient that is not expected to survive 24 hours with or without the operation, eg extreme sepsis/shock.
In the light of any information gained from undertaking the procedure, POST operatively would you give the patient the sameanaesthetic risk class?
YES NO, revised risk:
12. Was a pre-operative clinical examination performed? YES NO
If YES, by whom was it performed? VET NURSE Other person, please specify:
Please briefly describe any significant clinical findings:
13. Were haematological or biochemical blood tests performed pre-operatively? YES NO
If YES, please specify any significant findings and enclose a copy of the results if available:
14. Were thoracic or abdominal radiographs taken perioperatively? YES NO
If YES, please specify the radiographs taken and any significant findings:
15. Were any other tests performed preoperatively (eg ECG, ultrasound, urine analysis)? YES NO If YES, please specify the tests performed and any significant results
16. Was the patient starved prior to the procedure? YES NO Not known If YES, for how long? (hours)
17. Was water withheld prior to the procedure? YES NO Not known If YES, for how long? (hours)
2|

Section C: Procedure details In this section we would like to ask a few questions related to the procedure undertaken.
18. Date of admission Time of admission (24 hour clock)
19. Date of procedure Date of form completion
20. Please classify the procedure type Emergency – requiring immediate surgery on admission.
Urgent – operation required within the next 24 hours.
Scheduled / Elective - a procedure not requiring attention within the next 24 hours.
21. What procedure was intended?
Was this the procedure performed? YES NO If YES, please go to Q22If NO, please briefly describe why the intended procedure was not carried out and what procedure was performed instead (if any).
22. In the opinion of the surgeon, what was the anticipated risk of death from the procedure?
Minimal risk Low risk Moderate risk High risk
23. In the opinion of the surgeon, how difficult was the procedure that was performed?
Simple Moderate Difficult Very difficult
24. Where did the procedure take place?
Theatre Prep room Consulting room Other:
25. Was the procedure performed at the main practice or at a branch?
Main practice Branch practice – please give branch initials
26. What was the patient’s main body position during the procedure
Dorsal recumbency Left lateral recumbency Right lateral recumbency Sternal recumbency
Multiple positions – please describe briefly:
/ // /
:/ /
3|

Section D: Anaesthetic drugs and sedatives administered
Now we are going to ask some questions about the drugs given to the patient.27. For the procedure undertaken did the patient receive sedation only or general anaesthesia?
GENERAL ANAESTHESIA – please now go to Q28 (defined as complete unconsciousness, allowing ET intubation if required)
SEDATION – please now go to Q29 (defined as chemical restraint without unconsciousness, ET intubation would not be possible)
28. Was any PRE-MEDICATION given prior to anaesthesia? YES NO If NO, please go to Q29.If YES, what drugs were given?
What was the effect of pre-medication?
No effect
Light sedation – patient calm but still alert
Moderate sedation – patient quiet, able to walk, some ataxia
Heavy sedation – patient recumbent, difficult to rouse
Unconscious29. Were any INJECTABLE drugs given for INDUCTION or MAINTENANCE of anaesthesia or sedation (other than premedication
recorded in Q28)?
YES NO If NO, please go to Q30
If YES, what drugs were given?
What was the overall effect of these drugs?
No effect
Light sedation – patient calm but still alert
Moderate sedation – patient quiet, able to walk, some ataxia
Heavy sedation – patient recumbent, difficult to rouse
Unconscious
What was the quality of induction of sedation/anaesthesia?
Good - smooth Moderate Poor – excitable, some struggling
30. Was an INHALATIONAL anaesthetic used? YES NO If NO, please go to Q31
If YES, what was used? Halothane Isoflurane Other, please specify:
When was the inhalation agent given? Induction only Maintenance only Both induction and maintenance
31. Was the patient’s airway intubated? YES NO If NO, please go to Q32
If YES, was it a cuffed or uncuffed tube? Cuffed Uncuffed
Was local anaesthetic used to desensitise the larynx? YES NO Not known
Drug name Dose Concentration Route given Time given
Drug name Dose Concentration Route given Time given
4|

32. Was oxygen supplied during the procedure? YES NO
33. Was nitrous oxide supplied during the procedure? YES NO
34. Was an anaesthetic circuit used during the procedure? YES NO
If YES, what circuit was used (please specify)?
35. What type of ventilation was mainly used? Spontaneous breathing Positive pressure ventilation
36. Were any ANALGESICS or OTHER DRUGS administered PERI-operatively? YES NO If NO, please go to Q37(excluding those given and recorded during pre-medication, Q28)
If YES, what analgesics or other drugs were given?
37. Was an intravenous catheter placed PERI-operatively? YES NO
38. Were fluids administered PERI-operatively? YES NO If NO, please go to Q39
If YES, please state the type of fluids: the amount given:
When were they given? (please tick all appropriate) Pre-operatively During the procedure Post operatively
By which route? Intravenous Subcutaneous Other:
39. Was a full anaesthetic machine check performed before the procedure? YES NO Not applicable
Section E: Monitoring of anaesthesia and sedationIn this section we would like to ask a few questions about the monitoring of the patient during the procedure.
40. Was the patient monitored during the procedure? YES NO If NO, please go to Q43.If YES, who monitored the patient?
Operating Vet Separate Vet Nurse Other: What other duties was this person doing at the time?
No other duties Performing the procedure Assisting with the procedure Answering the telephone
Other, please specify:
41. Is there a written record of the anaesthetic? YES NO If YES, please attach a copy of the anaesthetic record.
42. What methods of monitoring were used during the procedure?
Finger on pulse Pulse oximeter
Observation of breathing / reservoir bag Electrocardiogram
Oesophageal / standard stethoscope Arterial blood pressure – direct method
Respiratory rate monitor Arterial blood pressure – indirect method (eg Doppler, DINAMAP)
Other, please specify:
ml
Drug name Dose Concentration Route given Time given
5|

Section F: Recovery from anaesthesia and sedationIn this section we would like to look at aspects of the patients recovery after the procedure.
43. Time of termination of the procedure: (24 hour clock):
44. Duration of anaesthesia or sedation (in minutes):
45. Was a reversal agent given at the end of the procedure? YES NO
If YES, what drug was given? Dose:
46. Please give the approximate time from termination of the procedure until the patient reached the following:
Sternal recumbency: Standing:
47. What was the quality of recovery? Poor – very violent, fitting etc Moderate - minimal excitement Good – smooth
48. Where was the patient placed to recover?
Kennel/cage Theatre Prep room Other, please specify:
49. Was the patient observed during recovery? YES NO If NO, please go to Q50
If YES, Who observed the recovery? Vet Nurse Other, please specify: How often was the patient checked whilst recovering?
Continuously Every 5 minutes Every 10 minutes Other, please specify:
50. Was the patient’s temperature taken on recovery? YES NO If YES what was it?
51. Were there any NONFATAL serious perioperative complications (eg collapse, hypotension, respiratory obstruction or depression,pulmonary aspiration, fitting, or any problems with ET intubation)?
YES NO If NO, please go to Q52.
If YES, when did this occur? After premedication During the procedure On recoveryWhat type of complication(s) occurred and what were the treatment and outcome (please specify)?
CNS (eg fitting): _______________________________________________________________________________________________
Cardiopulmonary: _____________________________________________________________________________________________
Other, please specify: __________________________________________________________________________________________
_____________________________________________________________________________________________________________
0C
minmin
:
6|

Section G: Personnel detailsHere we are interested in the details of the people involved in the procedure.
52. Please give the initials of the person completing the questionnaire:
Is this the: Veterinary surgeon Anaesthetist Other, please specify:
53. Please give the initials of the MAIN VETERINARY SURGEON involved in the procedure:
How many procedures did they perform on the day?
If on call, were they called out overnight? YES NO Not on Call
How familiar were they with the anaesthetic/sedation used? Very familiar Familiar Unfamiliar
Please state their qualifications: Year of qualifying:
Are they a principal / partner, assistant, locum or other?
Principal / Partner Assistant Locum Other, please specify:
54. Please give the initials of the ANAESTHETIST (person responsible for monitoring the patient):
Is this the same person who undertook the procedure (Q53)? YES NO If YES, please go to Q55.
If NO, how many procedures were they involved with on the day?
If on call, were they called out overnight? YES NO Not on Call
How familiar were they with the anaesthetic/sedation used? Very familiar Familiar Unfamiliar
Please state their qualifications: Year of qualifying:
Are they a vet or a veterinary nurse? VET NURSE Other, please specify:
If a veterinary nurse, are they? Qualified Trainee Unqualified
55. Were there any OTHER persons involved in the procedure? YES NO If NO, please go to Q56 (fatalities only)
If YES, please state their initials:
Were they a vet or a nurse? VET NURSE Other, please specify:
What were they doing? Please specify:
If this is a CONTROL form, thank you for taking the time to complete it. Please now send it back to Dave Brodbelt, Animal Health Trust,Lanwades Park, Kentford, Newmarket, Suffolk, CB8 7UU in a prepaid envelope supplied. If this is FATALITY please complete the last page.
7|

Section H: Fatality details Please complete this section for a DEATH / PTS ONLY
56. Did the patient die or was it euthanased? Died EuthanasedIn the opinion of the veterinary surgeon, was this due:
Solely as a result of anaesthesia or sedation?
Primarily as a result of anaesthesia or sedation?
Only partly as a result of anaesthesia or sedation?
57. When did the patient die? Time: (24 hour clock) Date:
Was this: After premed During sedation/anaesthesia On recovery If the patient died please go to Q58
If the patient was EUTHANASED, why was it euthanased? If EUTHANASED, please now go to Q64
58. Where did the patient die?
Theatre Prep room Kennel Home Other:
59. Did the patient show any abnormal clinical signs, just prior to death? YES NO
If YES, please specify:
60. Was there an ECG on the patient at the time of death? YES NO
If YES, what was the ECG diagnosis?
61. Was any procedure being performed around the time of death? YES NO
If YES, please specify:
62. If applicable, what was the vaporiser setting just before the complication?
63. What was the cause of death? (please specify)
Cardiac complications:_________________________________________________________________________________________
Respiratory complications:______________________________________________________________________________________
Renal / liver complications: _____________________________________________________________________________________
Other: _______________________________________________________________________________________________________
Unknown
64. Was a post mortem examination performed? YES NO Please enclose a copy of the report if available
If YES, what were the findings?
65. Please add any further comments in the space below that you think would be helpful.
Thank you very much for completing this questionnaire.
Please return the completed questionnaire to Dave Brodbelt, CEPSAF, Animal Health Trust, Lanwades Park, Kentford, Newmarket,Suffolk CB8 7UU in the prepaid envelope supplied.
%
/ /:
8|

232
Appendix 2.4 Case Definition and Criteria for Independent Review Panel
1. Case Definition
ALL perioperative DEATHS (including patients euthanased) within 48 hours of termination of the
procedure EXCEPT for: Patients that DIED or were EUTHANASED for inoperable surgical or pre-
existing medical conditions, where anaesthesia or sedation did not contribute to the death or decision to
euthanase. If anaesthesia / sedation can NOT be reasonably excluded as a contributory factor then the
death / euthanasia should be considered an anaesthetic related death.
2. Evidence for an association with anaesthesia / sedation
a. Specific evidence of contribution of anaesthesia to death: Evidence from the description of the fatality.
Post-mortem evidence.
b. Timing of death
During anaesthesia - less evidence required to classify as a case.
Postoperative – greater proximity to end of anaesthesia suggests greater support for classifying as a case.
c. Procedure contribution – Less evidence of procedural contribution to death suggests less evidence
required to classify as a case.
d. Patient Status
Health status – healthier patients require less evidence to classify as a case.
Emergency status – lower urgency requires less evidence to classify as a case.
e. Cause unknown – include as case if there are no known cause of death.
3. Examples
a. Cases
Intraoperative deaths: Respiratory obstruction and death. Cardiac arrest with no evidence of procedural
cause.
Postoperative deaths: No evidence of cause of death. Renal or liver failure occurring when minimal
pathology was present. Neurological complications or fitting requiring euthanasia – where no evidence of
neurological pathology was present preoperatively.
b. Non Cases
Intraoperative deaths: Uncontrolled haemorrhage during splenic tumour removal. Euthanasia for
inoperable surgery or owner declined treatment
Postoperative deaths: Gastric-dilatation-volvulus recovering to preoperative state that dies 18 hours later
of toxic complication. Peritonitis diagnosed and death at 12 hours postoperatively.

233
Appendix 2.5 Causes of Death Classification
Classification of PRIMARY initiating cause of death with respect to physiological
system and the likely specific cause:
a. Cardiovascular Complication: Cardiac arrest / Circulatory failure.
b. Respiratory Complication: failure of delivery of O2 to and removal of CO2 from
alveoli and failure of alveolar gas exchange. Includes: airway obstruction, failure of
ventilation, hypoxia, failure of pulmonary gas exchange.
c. Cardiovascular or Respiratory Failure – insufficient evidence to categorically
conclude which of these two causes was the primary and which was secondary cause.
d. Renal Failure
e. Liver Failure
f. Neurological Complication: Uncontrolled fitting requiring euthanasia, failure to
regain consciousness requiring euthanasia.
g. Unknown

234
Appendix 2.6 Distribution of Cases and Controls over the Study Period
1. Number of Controls and Cases randomly selected monthly in Dogs
a. Controls
Freq
uenc
y
Controls, month of studydate2
0 5 10 15 20 25
0
10
20
30
40
50
60
70
b. Cases
Freq
uenc
y
Cases, month of studydate2
0 5 10 15 20 25
0
10
20
30

235
2. Number of Controls and Cases randomly selected monthly in Cats
a. Controls Fr
eque
ncy
Controls, month of studydate2
0 5 10 15 20 25
0
10
20
30
40
50
60
70
b. Cases
Freq
uenc
y
Cases, month of studydate2
0 5 10 15 20 25
0
10
20
30

236
3. Number of Controls and Cases randomly selected monthly in Sick Dogs
a. Controls
Freq
uenc
y
Controls, month of studydate2
0 5 10 15 20 25
0
5
10
15
b. Cases
Freq
uenc
y
Cases, month of studydate2
0 5 10 15 20 25
0
5
10
15

237
4. Number of Controls and Cases randomly selected monthly in Sick Cats
a. Controls Fr
eque
ncy
Controls, month of studydate2
0 5 10 15 20 25
0
5
10
b. Cases
Freq
uenc
y
Cases, month of studydate2
0 5 10 15 20 25
0
5
10

238
Appendix 2.7 CEPSAF Practice Survey Questionnaire

CEPSAF Confidential Enquiry into Perioperative Small Animal Fatalities
Practice Survey Form Clinic number: Date: A. Clinic Characteristics:
1. Type of practice? Small animal practice Mixed practice: % Small Animal= _______ RCVS Hospital BSAVA standard Neither
% First opinion: ________ % Referral: ___________ 2. Does the practise use computerised case records? YES NO
If YES, What computer system is used? _________________________ 3. How many full time vets (or equivalence) are there at the practice doing small animal work? ______
Do any have any further professional qualifications? YES NO
If YES, please state the number of vets and qualifications: ______________________
Do any have further qualifications in anaesthesia? YES NO
If YES, please state the number of vets and qualifications: ______________________ 4. How many full time nurses (or equivalence) are there at the practice doing SA work? _________
How many are qualified? _____________ How many are training? ________________
5. How many anaesthetics and sedations do you routinely do each week (total for the practice)? Dogs: General Anaesthetics: Sedations: Cats: General Anaesthetics: Sedations: Exotics: General Anaesthetics: Sedations:
6. Are there any branch surgeries? YES NO If NO, please go to Q7. If YES, How many branches are there? _______________
Are animals sedated or anaesthetised at the branch surgeries? YES NO
If YES, at how many branches are anaesthetics or sedations undertaken? _________________
7. What percentage of your out of hours cover do you do yourselves? ______________ If you do not do all your own emergency cover what type of centre does the rest? __________ Is there a vet / nurse / other on the premises 24 hours a day? _____________

B. Anaesthetic Practices: 8. What drugs do you routinely use for sedation?
a. Dogs __________________________________________________________________ b. Cats __________________________________________________________________
9. What drugs do you routinely use for premedication prior to general anaesthesia?
a. Dogs __________________________________________________________________ b. Cats __________________________________________________________________
10. What drugs do you routinely use for induction of anaesthesia? (please include percent of total drugs used)?
a. Dogs ___________________________________________________________________ b. Cats ___________________________________________________________________
11. What drugs do you routinely use for maintenance of anaesthesia (please include percent of use)?
a. Dogs ______________________________________________________________ b. Cats ______________________________________________________________
12. What is you routine rabbit anaesthetic protocol: _______________________________________ (including premed, induction, intubation method, gas used)
13. Do you routinely intubate your patients? Dogs YES NO
Cats YES NO If YES, Do you use cuffed or uncuffed tubes? Dogs Cuffed Uncuffed
Cats Cuffed Uncuffed
14. Do you routinely use oxygen? Dogs YES NO Cats YES NO
15. Do you routinely use nitrous oxide? Dogs YES NO
Cats YES NO
16. Which circuits do you regularly use? (please tick all appropriate)
Circle To and Fro
T piece Bain
Magill Lack Other: ________________________________
17. How many anaesthetic machines does the main practice have? _________________________ How many have a low-oxygen warning device (whistle)? ___________________________
How many BRANCHES have an anaesthetic machine? ________ No. of machines: ________ How many have a low-oxygen warning device? ___________
18. Does the practice have a ventilator? YES NO
If YES do you use it regularly? YES NO

C. Patient Management and Monitoring 19. Do you routinely place an intravenous catheter? Dogs YES NO Cats YES NO 20. Would you ever give fluids to your patients? YES NO
If YES, to which patients? _________________________________________
21. What percentage of you patients have preoperative blood tests? _______ Dogs ______Cats Are these patients generally?
Higher risk Older patients Any patient Other: ____________
Which tests do you routinely do? _________________________________________________ 22. Do you weigh the majority of your patients? DOGS? YES NO
CAT? YES NO 23. Who sedates / premeds patients? Vet Nurse Both Other: __________
24. Who induces anaesthesia? Vet Nurse Both Other: __________ 25. Who routinely monitors the anaesthetics and sedations?
Vet Nurse Both No one Other: ________________ 26. Do patients have anaesthetic records? always sometimes never 27. What anaesthetic monitoring equipment do you have? Which of these do you use regularly?
Have Use Regularly Oesophageal / standard stethoscope
Respiratory rate monitor Pulse Oximeter
Electrocardiogram
Arterial Blood Pressure – Type: _________
Other: ______________________________
28. Does the practice have an emergency box? YES NO
If YES, Where is it kept? _________________________ How often is it checked?
Once a week Once a month Every six months Other: __________
Is there a protocol sheet for CPR in the theatre? YES NO Do you have facilities for suction? YES NO
29. Have you had any anaesthetic / sedation-related deaths in the last year? YES NO
If YES, how many? __________________ Dogs ___________________ Cats __________________ Other species
Thank you for completing this questionnaire, please now post it back in one of the postage paid envelopes to Dave Brodbelt, Animal Health Trust, Lanwades Park, Kentford, Newmarket, Suffolk CB8 7UU, Fax 01638 555 659.

239
Appendix 6.1 Drug dose associations with anaesthetic-related death in Dogs
*Odds ratios (OR) and 95% confidence intervals (CI) are reported. Likelihood Ratio Test (LRT) P values are reported for multiple category variables. **Fisher’s exact test and exact 95% confidence interval.
Variable Categories Cases Controls OR* 95% CI* P value
Acepromazine dose
0 – 0.02 mg/kg 0.02 - 0.03 mg/kg 0.03 – 0.05 mg/kg0.05 - Max
Trend Trend adj ASA2 LRT P value
15 22 23 10
33 93 146 110
1 0.52 0.35 0.20
0.59 0.83
0.24 – 1.13 0.16 – 0.75 0.08 – 0.51
0.45 – 0.78 0.61 – 1.14
0.09 0.01 <0.001
<0.001 0.25 0.01
Medetomidine Dose
0 – 0.01 mg/kg 0.01 mg/kg - max
4 4
17 43
1 0.40
0.09 – 1.81
0.22**
Propofol dose 0 - 3 mg/kg 3 - 4 mg /kg 4 - Max
Trend Trend adj ASA2 LRT P value
42 20 41
37 58 195
1 0.30 0.19
0.54 0.73
0.15 – 0.61 0.10 – 0.34
0.45 – 0.66 0.56 – 0.94
<0.001 <0.001
<0.001 0.02 <0.001
Thiopentone
dose
0 – 7.5 mg/kg 7.5 – 10 mg/kg 10 – max
Trend Trend adj ASA2 LRT P value
5 4 5
10 19 78
1 0.42 0.13
0.28 0.33
0.09 – 2.02 0.03 – 0.60
0.13 – 0.61 0.15 – 0.75
0.26 0.01
<0.001 <0.001 <0.001

240
Appendix 6.2 The association of drugs with anaesthetic-related death in Dogs
*Odds ratios (OR) and 95% confidence intervals (CI) are reported. Likelihood Ratio Test (LRT) P values are reported for multiple category variables.
Variable Categories Cases Controls OR* 95% CI* P value
Acepromazine No acepromazine acepromazine
Adjusted for ASA2
78 70
95 392
1 0.2
0.5
0.1 – 0.3
0.3 – 0.8
<0.001
0.01
Medetomidine No medetomidineMedetomidine
Adjusted for ASA2
140 8
427 60
1 0.4
0.4
0.2 – 0.9
0.2 – 1.1
0.02
0.08
Benzodiazepine No benzodiazepine diazepam midazolam
LRT P value
132 10 6
464 15 8
1 2.4 2.6
1.0 – 5.4 0.9 – 7.8
0.04 0.07
0.04
Opioid No opioid partial agonist pure mu agonist
26 77 45
61 306 120
1 0.6 0.9
0.4 – 1.0 0.5 – 1.6
0.06 0.05 0.66
NSAIDs
No NSAID Carprofen Meloxicam
92 36 20
154 222 111
1 0.3 0.3
0.2 – 0.4 0.2 – 0.5
<0.001 <0.001 <0.001
Thiopentone No thiopentone thiopentone
Adjusted ASA2
134 14
367 120
1 0.3
0.7
0.2 - 0.6
0.4 – 1.4
<0.001
0.34
Propofol No propofol propofol
Adjusted ASA2
35 113
168 319
1 1.7
1.1
1.1 – 2.6
0.6 – 1.8
0.01
0.86
Rectal Temperature (C) 37.08 (1.07)
38.34 (8.12)
0.57
Vet Year of Qualification
1966 – 1984 1985 – 1994 1995 – 1999 2000 - 2003 Unknown
33 49 43 20 3
94 149 158 81 5
1 0.94 0.78 0.70
0.56 – 1.56 0.50 – 1.31 0.37 – 1.32
0.60 0.80 0.34 0.27
Anaesthetist Year of Qualification
1966 – 1984 1985 – 1994 1995 – 1999 2000 - 2003 Unknown
10 16 32 49 41
25 55 82 121 204
1 0.73 0.98 1.01
0.29 – 1.84 0.42 – 2.27 0.45 – 2.27
0.77 0.50 0.95 0.98

241
Appendix 7.1 The association of drug dose with anaesthetic-related death in cats
*Odds ratios (OR) and 95% confidence intervals (CI) are reported. Likelihood Ratio Test (LRT) P values are reported for multiple category variables at the top of ‘P Value’ column.
Variable Categories Cases
Controls OR* 95% CI* P value
Acepromazine dose 0.001 – 0.2 mg/kg 0.02 – 0.03 0.03 - max
3 16 70
15 33 288
1 2.4 1.2
0.6 – 9.9 0.3 – 4.3
0.12 0.20 0.76
Medetomidine dose 0.001 – 0.03 mg/kg 0.03 – 0.06 0.06 - max
5 11 12
13 72 63
1 0.4 0.5
0.1 – 1.4 0.1 – 1.7
0.35 0.39 0.50
Thiopentone dose
0 – 7.5 mg/kg 7.5 - 10 10 - max
4 4 10
1 6 46
1 0.2 0.1
0.0 – 2.8 0.0 – 0.7
0.01 0.16 0.002
Propofol dose
0 – 5 mg/kg 5 – 7 mg 7 - max
43 31 26
53 117 86
1 0.3 0.4
0.2 – 0.6 0.2 – 0.7
<0.001 <0.001 0.001
Saffan dose
0 – 4 mg/kg 4 – 8 mg 8 - max
3 2 4
9 33 8
1 0.2 1.5
0.0 – 1.4 0.2 – 9.3
0.04 0.06 0.66
Ketamine dose
0 – 3 mg/kg 3 – 6 mg 6 - max
7 12 5
16 64 30
1 0.4 0.4
0.1 – 1.3 0.1 – 1.4
0.26 0.12 0.14
242
Bibliography
Adams, A. P. (1989). Capnography and Pulse Oximetry. Recent Advances in Anaesthesia and Analgesia. R. S. Atkinson and A. P. Adams. Edinburgh, Churchill Livingstone. 16: 155-175.
Aeschbacher, G. (1995). Rabbit Anesthesia. The Compendium for Continuing Education 17(8): 1003-1010.
Albrecht, D. T. and C. L. Blakely (1951). Anesthetic Mortality: a Five-Year Survey of the Records of the Angell Memorial Animal Hospital. Journal of the American Veterinary Medicine Association 119: 429.
Alef, M., F. Von Praun, et al. (2004). Should a Preanaesthetic Scanning of Haematological and Biochemical Data be Routine in Dogs? Association of Veterinary Anaesthetists Autumn Congress, Vienna, Blackwells Science.
Anon (1963). New Classification of Physical Status. Anesthesiology 24: 111.
Beecher, H. K. and D. P. Todd (1954). A study of deaths associated with anesthesia and surgery. Annals of Surgery 130: 2-24.
Beydon, L., F. Conreux, et al. (2001). Analysis of the French health ministry's national register of incidents involving medical devices in anaesthesia and intensive care. British Journal of Anaesthesia 86(3): 382-387.
Biboulet, P., P. Aubus, et al. (2001). Fatal and non fatal cardiac arrest related to anesthesia. Canadian Journal of Anaesthesia 48(4): 326-32.
Bilborough, G. (2005). Selling anaesthesia to clients. Veterinary Review 1: 37.
Blakemore, W. F., A. Jefferies, et al. (1984). Spinal cord malacia following general anaesthesia in the horse. Veterinary Record 114: 569-570.
Bloor, B. C., I. Abdul-Rasool, et al. (1989). The Effects of Medetomidine, an Alpha2 Agonist, on Ventilatory Drive in Dogs. Acta Veterinaria Scandinavica 85: 65-70.
Bodlander, F. M. S. (1975). Deaths Associated with Anaesthesia. British Journal of Anaesthesia 47: 36-40.
Branson, K. R. and M. E. Gross (1994). Propofol in Veterinary Medicine. Journal of American Veterinary Medical Association 204(12): 1888-1890.
Brearley, J. C., R. S. Jones, et al. (1986). Spinal cord degeneration following general anaesthesia in a shire horse. Equine Veterinary Journal 18(3): 222-224.

243
Breslow, N. E. and N. E. Day (1980). Statistical Methods in Cancer Research, Volume 1 - The Analysis of Case-Control Studies. Lyon, International Agency for Research on Cancer.
Brodbelt, D. C., R. Hammond, et al. (2005). Risk Factors Associated for Anaesthetic-related Death in Referred Dogs. Veterinary Record In Press.
BSAVA (2004). The British Small Animal Veterinary Association Membership Handbook. Quedgeley, BSAVA.
Buck, N., H. B. Devlin, et al. (1988). The Report of a Confidential Enquiry into Perioperative Deaths 1987. Nuffield Provincial Hospitals Trust, The King's Fund.
Bunker, J. P. (1986). Historical aspects. Epidemiology in Anaesthesia. J. N. Lunn. London, Edward Arnold: 1-7.
Campling, E. A., H. B. Devlin, et al. (1992). The Report of the National Confidential Enquiry into Perioperative Deaths 1990. Nuffield Provincial Hospitals Trust, The King's Fund.
Campling, E. A., H. B. Devlin, et al. (1993). The Report of the National Confidential Enquiry into Perioperative Deaths 1991/1992. Nuffield Provincial Hospitals Trust, The King's Fund.
Campling, E. A., H. B. Devlin, et al. (1990). The Report of the National Confidential Enquiry into Perioperative Deaths 1989. Nuffield Provincial Hospitals Trust, The King's Fund.
Caplan, R. A., K. L. Posner, et al. (1990). Adverse respiratory events in anesthesia: a closed claims analysis. Anesthesiology 72(5): 828-33.
Capner, C. A., B. D. X. Lascelles, et al. (1999). Current British veterinary attitudes to perioperative analgesia in dogs. Veterinary Record 145: 95-99.
Christley, R. M. and S. W. J. Reid (2003). No significant difference: use of statistical methods for testing equivalence in clinical veterinary literature. Journal of American Veterinary Medical Association 222: 433 - 437.
Clarke, K. W. and L. W. Hall (1990). A survey of anaesthesia in small animal practice: AVA/BSAVA report. Journal of the Association of Veterinary Anaesthetists 17: 4-10.
Clarke, R. S. J. (1970). The hyperglycaemic response to different types of surgery and anaesthesia. British Journal of Anaesthesia 42: 45-53.
Clutton, E. (2005). Pre-operative blood tests to determine anaesthetic risks 'a waste of time and money'. Veterinary Review(1): 42.

244
Coetzee, A. and H. du Toit (1992). Peri-operative mortality in the anaesthetic service at Tygerberg Hospital. South African Medical Journal 82(3): 176-8.
Cohen, M. M., P. G. Duncan, et al. (1988). Does Anesthesia Contribute to Operative Mortality? Journal of the American Medical Association 260: 2859-2863.
Cote, E., A. M. Manning, et al. (2004). Assessment of the prevelence of heart mumurs in overtly healthy cats. Journal of American Veterinary Medical Association 225(3): 384-388.
Cullen, D. J. and E. I. Eger (1974). Cardiovascular effects of carbon dioxide in man. Anesthesiology 41: 345.
Cullen, L. K. (1996). Medetomidine Sedation in Dogs and Cats: a Review of its Pharmacology, Antagonism and Dose. British Veterinary Journal 152: 519-535.
D'Eramo, E. M. (1999). Mortality and morbidity with outpatient anesthesia: the Massachusetts experience. Journal of Oral Maxillofacial Surgery 57(5): 531-6.
Delong, D. and P. J. Manning (1994). The Biology of the Laboratory Rabbit. San Diego, Academic Press.
DeYoung, D. J. and D. C. Sawyer (1980). Anesthetic potency of nitrous oxide during halothane anesthesia in the dog. Journal of the American Animal Hospital Association 16: 125 - 128.
Dhupa, N. (1995). Hypothermia in Dogs and Cats. Compendium of Continuing Education 17(1): 61-68.
Dixon, P. M., D. I. Railiton, et al. (1993). Temporary bilateral laryngeal paralysis in a horse associated with general anaesthesia and post anaesthetic myopathy. Veterinary Record 132: 29-32.
Dodman, N. H. (1977). Feline anaesthesia survey. Journal of Small Animal Practice 18: 653-658.
Dodman, N. H. and L. A. Lamb (1992). Survey of Small Animal Anesthetic Practice in Vermont. Journal of the American Animal Hospital Association 28: 439-444.
Dohoo, I., W. Martin, et al. (2003). Veterinary Epidemiologic Research. Charlottetown, AVC Inc.
Donati, A., M. Ruzzi, et al. (2004). A new and feasible model for predicting operative risk. British Journal of Anaesthesia 93(3): 393-9.
Dyson, D. H., M. G. Maxie, et al. (1998). Morbidity and mortality associated with

245
anesthetic management in small animal veterinary practice in Ontario. Journal of the American Animal Hospital Association 34(4): 325-35.
Dyson, D. H. and G. R. Pettifer (1997). Evaluation of the Arrhythmogenicity of a Low Dose of Acepromazine: A Comparison with Xylazine. Canadian Journal of Veterinary Research 61: 241-245.
Eagle, C. C. and N. J. Davis (1997). Report of the Anaesthetic Mortality Committee of Western Australia 1990-1995. Anaesthesia and Intensive Care 25(1): 51-9.
Eastment, J. K., G. M. Johnston, et al. (2002). Is isoflurane safer than halothane in equine anesthesia: results from multicentre randomised controlled trial. Proceedings of the Society of Veterinary Epidemiology and Preventative Medicine, Cambridge, UK.
Eichhorn, J. H., J. B. Cooper, et al. (1986). Standards for patient monitoring during anesthesia at Harvard Medical School. Journal of the American Medical Association 256: 1017-1020.
Fahy, L. T., G. A. V. Mourik, et al. (1985). A comparison of the induction characteristics of thiopentone and propofol (2, 6-di-isopropyl phenol). Anaesthesia 40: 939-944.
Farrow, S. C., F. G. Fowkes, et al. (1982). Epidemiology in Anaesthesia II: Factors affecting Mortality in Hospital. British Journal of Anaesthesia 54: 811-817.
Farrow, S. C., F. G. Fowkes, et al. (1984). Epidemiology in anaesthesia: a method for predicting hospital mortality. European Journal of Anaesthesiology 1(1): 77-84.
Fichtner, K. and W. Dick (1997). The causes of perioperative mortality. A trial of the German "CEPOD study." Anaesthesist 46(5): 419-27.
Flecknell, P. (1996). Handbook of Rodent and Rabbit Medicine. Oxford, Pergamon.
Flecknell, P. (1996). Laboratory Animal Anaesthesia. London, Harcourt Brace & Company.
Flecknell, P. (2004). Frequency of common anaesthetic agents in UK practice. P. Communication. Vienna.
Forrest, J. B., M. K. Cahalan, et al. (1990). Multicenter study of general anesthesia. II. Results. Anesthesiology 72(2): 262-8.
Forrest, J. B., K. Rehder, et al. (1992). Multicenter study of general anesthesia. III. Predictors of severe perioperative adverse outcomes. Anesthesiology 76(1): 3-15.

246
Fowkes, F. G., J. N. Lunn, et al. (1982). Epidemiology in Anaesthesia III: Mortality Risk with Coexisting Physical Disease. British Journal of Anaesthesia 54: 819-825.
Gannon, K. (1991). Mortality associated with anaesthesia. A case review study. Anaesthesia 46(11): 962-6.
Gaynor, J. S., C. I. Dunlop, et al. (1999). Complications and Mortality Associated with Anesthesia in Dogs and Cats. Journal of the American Animal Hospital Association 35: 13-17.
Gillick, A. (1981). High frequency complaints described by Dr Gillick. Ontario Veterinary Association Newsletter 5(1): 12-13.
Glen, J. B. (1980). Animal studies of the anaesthetic activity of ICI 35,868. British Journal of Anaesthesia 52: 731 - 741.
Golden, A. E., J. M. Bright, et al. (1998). Cardiovascular Effects of the Alpha2 Adrenergic Receptor Agonist Medetomidine in Clinically Normal Cats Anesthetised with Isoflurane. American Journal of Veterinary Research 59(4): 509-513.
Grandy, J. L., D. S. Hodgson, et al. (1989). Cardiopulmonary Effects of Halothane Anesthesia in Cats. American Journal of Veterinary Research 50(10): 1729-1732.
Greene, S. A. and W. J. Tranquilli (1988). Xylazine - a Review of its Pharmacology and use in Veterinary Medicine. Journal of Veterinary Pharmacolgy and Therapeutics 11: 295-313.
Hall, G. M., C. Young, et al. (1978). Substrate mobilisation during surgery. Anaesthesia 33: 924-930.
Hall, L. W. and K. W. Clarke (1991). Veterinary Anaesthesia. London, Balliere Tindall.
Hall, L. W., K. W. Clarke, et al. (2001). Veterinary Anaesthesia. London, W. B. Saunders.
Hall, L. W. and P. M. Taylor (1994). Anaesthesia of the Cat. London, Bailliere Tindall.
Hardie, E. M., G. J. Spodnick, et al. (1999). Tracheal rupture in cats: 16 cases (1983 - 1998). Journal of American Veterinary Medical Association 214(4): 508-512.
Harrison, G. G. (1968). Anaesthetic contributory death--its incidence and causes. I. Incidence. South African Medical Journal 42(21): 514-8.
247
Harrison, G. G. (1968). Anaesthetic contributory death--its incidence and causes. II. Causes. South African Medical Journal 42(22): 544-9.
Harrison, G. G. (1978). Death attributable to anaesthesia. A 10-year survey (1967--1976). British Journal of Anaesthesia 50(10): 1041-6.
Harrison, G. G. (1990). Death due to anaesthesia at Groote Schuur Hospital, Cape Town--1956-1987. Part I. Incidence. South African Medical Journal 77(8): 412-5.
Harrison, G. G. (1990). Death due to anaesthesia at Groote Schuur Hospital, Cape Town--1956-1987. Part II. Causes and changes in aetiological pattern of anaesthetic-contributory death. South African Medical Journal 77(8): 416-21.
Hauck, W. W. and A. Donner (1977). Wald's test as applied to hypotheses in logit analysis. Journal of the American Statistical Association 72: 851-853.
Heard, D., A. I. Webb, et al. (1986). Effect of Acepromazine on Anesthetic Requirement of Halothane in the Dog. American Journal of Veterinary Research 47(10): 2113-2115.
Hellebrekers, L. J. (1986). Comparison of Isoflurane and Halothane as Inhalation Anaesthetics in the Dog. Veterinary Quarterly 8(3): 183-188.
Hennekens, C. H. and J. E. Buring (1987). Epidemiology in Medicine. Boston, Little, Brown and Company.
Heywood, A. J., I. H. Wilson, et al. (1989). Perioperative mortality in Zambia. Annals of the Royal College of Surgeons of England 71(6): 354-358.
Hikasa, Y., N. Ohe, et al. (1997). Cardiopulmonary Effects of Sevoflurane in Cats: Comparison with Isoflurane, Halothane and Enflurane. Research in Veterinary Science 63: 205-210.
Hikasa, Y., C. Okabe, et al. (1996). Ventricular Arrhythmogenic Dose of Adrenaline during Sevoflurane, Isoflurane and Halothane Anaesthesia either with or without Ketamine or Thiopentone in Cats. Research in Veterinary Science 60: 134-137.
Hill, A. B. (1965). The Environment and Disease: Association or Causation? Proceedings of the Royal Society of Medicine: 295-300.
Hodgson, D. S., C. I. Dunlop, et al. (1998). Cardiopulmonary Effects of Anesthesia induced and Maintained with Isoflurane in Cats. American Journal of Veterinary Research 59(2): 182-185.
Holland, R. (1987). Anaesthetic Mortality in New South Wales. British Journal of Anaesthesia 59: 834-841.

248
Horwitz, L. D., B. S. Bishop, et al. (1968). Effects of hypercapnia in dogs. Journal of Applied Physiology 25: 346.
Hosgood, G. and D. T. Scholl (1998). Evaluation of Age as a Risk Factor for Perianesthetic Morbidity and Mortality in the Dog. Journal of Veterinary Emergency and Critical Care 8(3): 222-236.
Hosgood, G. and D. T. Scholl (2002). Evaluation of age and American Society of Anesthesiologists (ASA) physical status as risk factors for perianesthetic morbidity and mortality in the cat. Journal of Veterinary Emergency and Critical Care 12(1): 9-15.
Hosmer, D. W. and S. Lemeshow (2000). Applied Logistic Regression. New York, John Wiley.
Hovi-Viander, M. (1980). Death associated with anaesthesia in Finland. British Journal of Anaesthesia 52(5): 483-9.
Howell, S. J., J. W. Sear, et al. (1998). Risk factors for cardiovascular death after elective surgery under general anaesthesia. British Journal of Anaesthesia 80: 14-19.
Howell, S. J., J. W. Sear, et al. (1999). Risk factors for cardiovascular death within 30 days after anaesthesia and urgent or emergency surgery: a nested case-control study. British Journal of Anaesthesia 82(5): 679-84.
Irita, K., Y. Kawashima, et al. (2002). Perioperative mortality and morbidity in the year 2000 in 502 Japanese certified anesthesia-training hospitals: with a special reference to ASA-physical status--report of the Japan Society of Anesthesiologists Committee on Operating Room Safety. Masui 51(1): 71-85.
Iwao, Y., Y. Kawashima, et al. (2001). Perioperative mortality and morbidity for the year 1999 in 466 Japanese certified anesthesia-training hospitals: with special reference to operative regions--report of Committee on Operating Room Safety of Japanese Society of Anesthesiologists. Masui 50(10): 1144-53.
Joas, T. A. and W. C. Stevens (1971). Comparison of the Arrhythmic Dose of Epinephrine during Forane, Halothane and Fluroxene Anesthesia in Dogs. Anesthesiology 35: 48-53.
Johnson, C. B. (1999). Endocrine disease. Manual of Small Animal Anaesthesia and Analgesia. C. Seymour and R. D. Gleed. Cheltenham, BSAVA: 223-230.
Johnston, G. M. (2003). CEPEF: A Case Control Study: Personal Communication.
Johnston, G. M., J. K. Eastment, et al. (2004). Is isoflurane safer than halothane in equine anaesthesia? Results from a prospective multicentre randomised controlled trial. Equine Veterinary Journal 36(1): 64 - 71.

249
Johnston, G. M., J. K. Eastment, et al. (2002). Confidential enquiry of perioperative equine fatalities (CEPEF): mortality results of Phases 1 and 2. Veterinary Anaesthesia and Analgesia 29: 159-170.
Johnston, G. M., P. M. Taylor, et al. (1995). Confidential enquiry of perioperative equine fatalities (CEPEF-1): preliminary results. Equine Veterinary Journal 27(3): 193-200.
Johnston, G. M., P. M. Taylor, et al. (1996). The Confidential Enquiry into Perioperative Fatalities (CEPEF-1): Survival Curves. Veterinary Surgery 25(2): 182.
Joubert, K. E. (2000). Routine veterinary anaesthetic management practice in South Africa. Journal of the South African Veterinary Association 71(3): 166-172.
Katz, M. H. (1999). Multivariable Analysis: A Practical Guide for Clinicians. Cambridge, Cambridge University Press.
Kawashima, Y., N. Seo, et al. (2001). Annual study of perioperative mortality and morbidity for the year of 1999 in Japan: the outlines--report of the Japan Society of Anesthesiologists Committee on Operating Room Safety. Masui 50(11): 1260-74.
Kehlet, H. (1984). The stress repsonse to anaesthesia and surgery: release mechanisms and modifying factors. Clinics in Anaesthesiology 2: 315-339.
Kirkwood, B. R. (1988). Essentials of Medical Statistics. Abingdon, Blackwell Science.
Klein, L., N. Ailes, et al. (1989). Postanesthetic Equine Myopathy Suggestive of Malignant Hyperthermia. Veterinary Surgery 18(6): 479-482.
Ko, J. H., J. E. Bailey, et al. (1996). Comparison of Sedative and Cardiorespiratory Effects of Medetomidine and Medetomidine-Butorphanol Combinations in Dogs. American Journal of Veterinary Research 57(4): 535-540.
Kubota, Y., Y. Toyoda, et al. (1994). Frequency of anesthetic cardiac arrest and death in the operating room at a singe general hospital over a 30-year period. Journal of Clinical Anesthesiology 6(3): 227-238.
Kurz, A., D. I. Sessler, et al. (1996). Perioperative normothermia to reduce the incidence of surgical-wound infection and shorten hospitalization. The New England Journal Of Medicine 334(19): 1209-1215.
Lam, K. H. K., J. B. A. Smyth, et al. (1995). Acute spinal cord degeneration following general anaesthesia in a young pony. Veterinary Record 136: 329-330.
Langley, J. (1976). Anaesthetic deaths survey. Veterinary Record 99: 466.

250
Lascelles, B. D. X., C. A. Capner, et al. (1999). Current British veterinary attitudes to perioperative analgesia for cats and small mammals. Veterinary Record 145: 601-604.
Lemke, K. A., W. J. Tranquilli, et al. (1993). Alterations in the Arrhythmogenic Dose of Epinephrine after Xylazine or Medetomidine Administration in Halothane-Anesthetised Dogs. American Journal of Veterinary Research 54(12): 2132-2139.
Lemke, K. A., W. J. Tranquilli, et al. (1993). Alterations in the Arrhythmogenic Dose of Epinephrine following Xylazine or Medetomidine Administration to Isoflurane-Anesthetised Dogs. American Journal of Veterinary Research 54(12): 2139-2145.
Lumb, W. V. and E. W. Jones (1973). Veterinary Anesthesia. Philadelphia, Lea and Febiger.
Lumb, W. V. and E. W. Jones (1984). Veterinary Anesthesia. Philadelphia, Lea and Febiger.
Lunn, J. N., S. C. Farrow, et al. (1982). Epidemiology in Anaesthesia I: Anaesthetic Practice over 20 Years. British Journal of Anaesthesia 54: 803-809.
Lunn, J. N. and W. W. Mushin (1982). Mortality associated with anaesthesia. Anaesthesia 37: 856.
Lytle, J. J. and E. P. Stamper (1989). The 1988 anesthesia survey of the Southern California Society of Oral and Maxillofacial Surgeons. Journal Oral Maxillofacial Surgery 47(8): 834-42.
Mackay, J. S., T. W. Forest, et al. (2002). Postanaesthetic cerebral necrosis in five horses. Veterinary Record 150: 70-74.
Mangione-Smith, R., M. N. Elliott, et al. (2002). An observational study of antibiotic prescribing behaviour and the Hawthorne effect. Health Services Research 37: 1603-1623.
Marx, G. F., C. V. Mateo, et al. (1973). Computer Analysis of Postanesthetic Deaths. Anesthesiology 39(1): 54-58.
Matsuura, H., I. Hirose, et al. (2000). A report of 14,195 applications of anesthetics to oral and maxillofacial surgery at one teaching dental hospital (1971-2000) centering around airway problems. Journal of Clinical Anesthesiology 12(6): 460-7.
Mattson, S., C. Kerr, et al. (2005). The cardiopulmonary effects of mask induction with

251
isoflurane compared with intravenous induction using ketamine-diazepam or propofol-diazepam in the hypovolemic dog. Spring Meeting of the Association of Veterinary Anaesthetists, Rimini, Italy.
McKenzie, A. G. (1996). Mortality associated with anaesthesia at Zimbabwean teaching hospitals. South African Medical Journal 86(4): 338-42.
Mee, A. M., P. J. Cripps, et al. (1998). A retrospective study of mortality associated with general anaesthesia in horses: elective procedures. Veterinary Record 142(11): 275-6.
Mee, A. M., P. J. Cripps, et al. (1998). A retrospective study of mortality associated with general anaesthesia in horses: emergency procedures. Veterinary Record 142(12): 307-9.
Mero, M., S. Vainionpaa, et al. (1989). Medetomidine-ketamine-diazepam anaesthesia in the rabbit. Acta Veterinaria Scandinavica 85 (suppl): 135-137.
Meyer, R. E. (1999). Geriatric patients. Manual of Small Animal Anaesthesia and Analgesia. C. Seymour and R. D. Gleed. Cheltenham, BSAVA: 253-256.
Mitchell, B. (1970). Equine Anaesthesia: an Assessment of Techniques Used in Clinical Practice. Equine Veterinary Journal: 261-274.
Mitchell, S. L., R. McCarthy, et al. (2000). Tracheal rupture associated with intubation in cats: 20 cases (1996 - 1998). Journal of American Veterinary Medical Association 216(10): 1592 - 1595.
Monk, T. G., V. Saini, et al. (2005). Anesthetic Management and One-Year Mortality after Noncardiac Surgery. Anesthesia and Analgesia 100: 4-10.
Morita, K., Y. Kawashima, et al. (2001). Perioperative mortality and morbidity in 1999 with a special reference to age in 466 certified training hospitals of Japanese Society of Anesthesiologists--report of Committee on Operating Room Safety of Japanese Society of Anesthesiologists. Masui 50(8): 909-21.
Muir, W. W. (1977). Effects of Xylazine on Indices of Myocardial Contractility in the Dog. American Journal of Veterinary Research 38(7): 931-933.
Muir, W. W., L. L. Werner, et al. (1975). Effects of Xylazine and Acetylpromazine upon Induced Ventricular Fibrillation in Dogs Anesthetised with Thiamylal and Halothane. American Journal of Veterinary Research 36: 1299-1303.
Murison, P. (2001). Prevention and treatment of perioperative hypothermia in animals under 5kg bodyweight. In Practice: 412-418.
NCEPOD (1990). NCEPOD and perioperative deaths of children. Lancet 335(8704): 1498-500.

252
Newland, M. C., S. J. Ellis, et al. (2002). Anesthetic-related cardiac arrest and its mortality: a report covering 72,959 anesthetics over 10 years from a US teaching hospital. Anesthesiology 97(1): 108-15.
Nicholson, A. and A. D. J. Watson (2001). Survey on small animal anaesthesia. Australian Veterinary Journal 79(9): 613-619.
Pedersen, T. (1994). Complications and death following anaesthesia. A prospective study with special reference to the influence of patient-, anaesthesia-, and surgery-related risk factors. Danish Medical Bulletin 41(3): 319-31.
Pedersen, T., K. Eliasen, et al. (1990). A prospective study of mortality associated with anaesthesia and surgery: risk indicators of mortality in hospital. Acta Anaesthesiology Scandanavica 34(3): 176-82.
Peek, M. L. (1993). A case of post-anaesthetic myopathy. Equine Veterinary Education 5(4): 183-186.
Pettifer, G. R., D. H. Dyson, et al. (1996). An Evaluation of the Influence of Medetomidine Hydrochloride and Atipamizole Hydrochloride on the Arrhythmogenic Dose of Epinephrine in Dogs during Halothane Anaesthesia. Canadian Journal of Veterinary Research 60: 1-6.
Phillips, O. C., T. M. Frazier, et al. (1960). The Baltimore Anaesthesia Study Committee. Review of1024 postoperative deaths. Journal of the American Medical Association 174: 2015.
Pitt-Miller, P. (1989). Deaths within 24 hours of surgical procedures at the Port-of-Spain General Hospital (January, 1976 to December, 1987). West Indian Medical Journal 38(3): 148-52.
Pottecher, T., L. Tiret, et al. (1984). Cardiac arrest related to anaesthesia: a prospective survey in France (1978-1982). European Journal of Anaesthesiology 1(4): 305-18.
Pyendop, B. H. and J. P. Verstegen (1998). Hemodynamic Effects of Medetomidine in the Dogs: A Dose Titration Study. Veterinary Surgery 27: 612-622.
Pyendop, B. H. and J. P. Verstegen (1999). Cardiorespiratory Effects of a Combination of Medetomidine, Midazolam and Butorphanol in Dogs. American Journal of Veterinary Research 60(9): 1148-1154.
Quandt, J. E., E. P. Robinson, et al. (1998). Cardiorespiratory and anesthetic effects of propofol and thiopentone in the dog. American Journal of Veterinary Research 59: 1137-1143.
RCVS (2000). The UK Veterinary Profession in 2000. London, RCVS.

253
RCVS (2004). Annual Report. London, RCVS.
Rintasalo, J. and O. Vainio (1995). A survey on anaesthetic practice in Finnish veterinary clinics. Suomen Elainlaakarilehti 101(9): 541-544.
Robinson, E. P., R. A. Sams, et al. (1986). Barbiturate anesthesia in Greyhounds and mixed-breed dogs: Comparative cardiopulmonary effects, anesthetic effects, and recovery rates. American Journal of Veterinary Research 47(10): 2105-2111.
Rodrigues, L. C. and B. R. Kirkwood (1990). Case-Control Designs in the Study of Common DIseases. International Journal of Epidemiology 19: 205-213.
Rolly, G. and L. Versichelen (1985). Comparison of propofol and thiopentone for induction of anaesthesia in premedicated patients. Anaesthesia 40: 945-948.
Royston, P., G. Ambler, et al. (1999). The use of fractional polynomials to model continous risk variables in epidemiology. International Journal of Epidemiology 28(964-974).
Sackett, D. L., S. E. Straus, et al. (2000). Evidence-based medicine: How to Practice and Teach EBM. Edinburgh, Churchill Livingstone.
Salant, P. and D. A. Dillman (1994). How to conduct your own survey. London, John Wiley and Sons.
Savola, J. (1989). Cardiovascular Actions of Medetomidine and their Reversal by Atipamezole. Acta Veterinaria Scandanavica 85: 39-47.
Schlesselman, J. J. (1982). Case-Control Studies: Design, Conduct and Analysis. Oxford, Oxford University Press.
Sebel, P. S. and J. D. Lowdon (1989). Propofol: A new intravenous anesthetic. Anesthesiology 71: 260-277.
Seo, N., Y. Kawashima, et al. (2001). Annual report of perioperative mortality and morbidity for the year 1999 with a special reference to anesthetic methods at Certificated Training Hospitals of Japanese Society of Anesthesiologists. Masui 50(9): 1028-37.
Smith, P. G., A. C. Rodrigues, et al. (1984). Assessment of the Protective Efficacy of Vaccines against Common Diseases using Case-Control and Cohort Studies. International Journal of Epidemiology 13: 87-93.
Steffey, E. P., J. R. Gillespie, et al. (1974). Circulatory Effects of Halothane and Halothane-Nitrous Oxide Anesthesia in the Dog: Controlled Ventilation. American Journal of Veterinary Research 35: 1289-1293.

254
Steffey, E. P., J. R. Gillespie, et al. (1975). Circulatory Effects of Halothane and Halothane-Nitrous Oxide Anesthesia in the Dog: Spontaneous Ventilation. American Journal of Veterinary Research 36: 197-200.
Steffey, E. P. and M. A. Howland (1977). Isoflurane Potency in the Dog and Cat. American Journal of Veterinary Research 38(11): 1833-1836.
Stepien, R. L., J. D. Bonagura, et al. (1995). Cardioespiratory Effects of Acepromazine Maleate and Buprenorphine Hydrochloride in Clinically Normal Dogs. American Journal of Veterinary Research 56(1): 78-83.
Suan, C., C. Perez-Torres, et al. (1997). Postoperative mortality in a general hospital. Rev Esp Anestesiol Reanim 44(7): 267-72.
Tan, I. and A. E. Delilkan (1993). Anaesthetic contribution to deaths in the operating theatre at the University Hospital Kuala Lumpur--a retrospective survey. Medical Journal of Malaysia 48(4): 397-402.
Tevik, A. (1983). The role of anesthesia in surgical mortality. Nordisk Vetinarmedecin 35: 175-179.
Thrusfield, M. V. (1986). Veterinary Epidemiology. London, Butterworths.
Thurmon, J. C., W. J. Tranquilli, et al. (1996). Lumb & Jones' Veterinary Anesthesia. Maryland, Williams & Wilkins.
Tikkanen, J. and M. Hovi-Viander (1995). Death associated with anaesthesia and surgery in Finland in 1986 compared to 1975. Acta Anaesthesiology Scandinavica 39(2): 262-7.
Tinker, J. H., D. L. Dull, et al. (1989). Role of monitoring devices in prevention of anesthetic mishaps: a closed claims analysis. Anesthesiology 71(4): 541-6.
Tiret, L., J. M. Desmonts, et al. (1986). Complications associated with anaesthesia--a prospective survey in France. Canadian Anaesthesiology Society Journal 33(3 Pt 1): 336-44.
Tranquilli, W. J., J. C. Thurmon, et al. (1988). Alterations in Epinephrine-Induced Arrhythmias after Xylazine and Subsequent Yohimbine Administration in Isoflurane-Anesthetised Dogs. American Journal of Veterinary Research 49(7): 1072-1075.
Tranquilli, W. J., J. C. Thurmon, et al. (1986). Alterations in the Arrhythmogenic Dose of Epinephrine (ADE) following Xylazine Administration to Halothane-Anesthetised Dogs. Journal of Veterinary Pharmacology and Therapeutic 9: 198-203.

255
Trim, C. M., J. G. Adams, et al. (1988). A retrospective survey of anaesthesia in horses with colic. Equine Veterinary Journal(Supplement): 84 - 90.
Tu, D. (1997). A comparative study of some statistical procedures in establishing therapeutic equivalence of nonsystemic drugs with binary endpoints. Drug Inf Journal 31: 1291-1300.
Turnbull, K. W., P. F. Fancourt-Smith, et al. (1980). Death within 48 hours of anaesthesia at the Vancouver General Hospital. Canadian Anaesthesiology Society Journal 27(2): 159-63.
Turner, D. M. and J. E. Ilkiw (1990). Cardiovascular and respiratory effects of three rapidly acting barbiturates in dogs. American Journal of Veterinary Research 51(4): 598-604.
Utting, J. E. (1987). Pitfalls in anaesthetic practice. British Journal of Anaesthesia 59: 877-890.
Wagner, A. E. and D. C. Brodbelt (1997). Arterial blood pressure monitoring in anesthetized animals. Journal of the Veterinary Medical Association 210: 1279-1285.
Wagner, A. E. and P. W. Hellyer (2000). Survey of anesthesia techniques and concerns in private veterinary practice. Journal of the American Veterinary Medicine Association 217(11): 1652-1657.
Wagner, A. E., W. W. Muir, et al. (1991). Cardiovascular Effects of Xylazine and Detomidine in Horses. American Journal of Veterinary Research 52(5): 651-657.
Wagner, A. E., B. D. Wright, et al. (2003). Myths and misconceptions in small animal anesthesia. Journal of American Veterinary Medical Association 10: 1426-1432.
Warden, J. C., C. L. Borton, et al. (1994). Mortality associated with anaesthesia in New South Wales, 1984-1990. Medical Journal of Australia 161(10): 585-93.
Warden, J. C. and B. F. Horan (1996). Deaths attributed to anaesthesia in New South Wales, 1984-1990. Anaesthesiology and Intensive Care 24(1): 66-73.
Waterman, A. E. (1981). Maintenance of Body Temperature During Anaesthesia. Journal of Veterinary Anaesthesia 9: 73-85.
Webb, A. I. and J. M. O'Brien (1988). The Effect of Acepromazine on the Anaesthetic Potency of Halothane and Isoflurane. Journal of the American Animal Hospital Association 24: 609-613.

256
Webb, R. K., J. H. Van der Walt, et al. (1993). The Australian Incident Monitoring Study. Which monitor? An analysis of 2000 incident reports. Anaesthesia and Intensive Care 21: 529-542.
Wixson, S. K. (1994). The Biology of the Laboratory Rabbit. San Diego, Academic Press.
Wolters, U., T. Wolf, et al. (1996). ASA classification and perioperative variables as predictors of postoperative outcome. British Journal of Anaesthesia 77: 217-222.
Wu, K. H., K. B. Lai, et al. (1991). Surgical and anesthetic mortality in Mackay Memorial Hospital 1988-1989. Zhonghua Yi Xue Za Zhi (Taipei) 47(3): 187-91.
Young, S. S. and P. M. Taylor (1990). Factors leading to serious anaesthetic-related problems in equine anaesthesia. Journal of the Association of Veterinary Anaesthetists 17: 59.
Young, S. S. and P. M. Taylor (1993). Factors influencing the outcome of equine anaesthesia: a review of 1,314 cases. Equine Veterinary Journal 25(2): 147-151.