The Condition of Education 2012nces.ed.gov/pubs2012/2012045_1.pdf · The Condition of Education...
35
The Condition of Education 2012 MAY 2012 Susan Aud William Hussar Frank Johnson Grace Kena Erin Roth National Center for Education Statistics Eileen Manning Xiaolei Wang Jijun Zhang American Institutes for Research Liz Notter Production Manager Synergy Enterprises, Inc. Thomas Nachazel Senior Editor Carolyn Yohn Editor American Institutes for Research NCES 2012-045 U.S. DEPARTMENT OF EDUCATION
Transcript of The Condition of Education 2012nces.ed.gov/pubs2012/2012045_1.pdf · The Condition of Education...
The Condition of Education 2012MAY 2012
Susan Aud William HussarFrank Johnson Grace KenaErin RothNational Center for Education Statistics
Eileen ManningXiaolei WangJijun Zhang American Institutes for Research
Liz Notter Production ManagerSynergy Enterprises, Inc.
Thomas NachazelSenior EditorCarolyn YohnEditorAmerican Institutes for Research
NCES 2012-045U.S. DEPARTMENT OF EDUCATION

U.S. Department of Education Arne Duncan Secretary
Institute of Education Sciences John Q. Easton Director
National Center for Education Statistics Jack Buckley Commissioner
The National Center for Education Statistics (NCES) is the primary federal entity for collecting, analyzing, and reporting data related to education in the United States and other nations. It fulfills a congressional mandate to collect, collate, analyze, and report full and complete statistics on the condition of education in the United States; conduct and publish reports and specialized analyses of the meaning and significance of such statistics; assist state and local education agencies in improving their statistical systems; and review and report on education activities in foreign countries.
NCES activities are designed to address high-priority education data needs; provide consistent, reliable, complete, and accurate indicators of education status and trends; and report timely, useful, and high-quality data to the U.S. Department of Education, the Congress, the states, other education policymakers, practitioners, data users, and the general public. Unless specifically noted all information contained herein is in the public domain.
We strive to make our products available in a variety of formats and in language that is appropriate to a variety of audiences. You, as our customer, are the best judge of our success in communicating information effectively. If you have any comments or suggestions about this or any other NCES product or report, we would like to hear from you. Please direct your comments to
NCES, IES, U.S. Department of Education 1990 K Street NW Washington, DC 20006-5651
May 2012
The NCES Home Page address is http://nces.ed.gov. The NCES Publications and Products address is http://nces.ed.gov/pubsearch.
This publication is only available online. To download, view, and print the report as a PDF file, go to the NCES Publications and Products address shown above.
This report was prepared for the National Center for Education Statistics under Contract No. ED-IES-12-000176 with American Institutes for Research. Mention of trade names, commercial products, or organizations does not imply endorsement by the U.S. Government.
Suggested Citation Aud, S., Hussar, W., Johnson, F., Kena, G., Roth, E., Manning, E., Wang, X., and Zhang, J. (2012). The Condition of Education 2012 (NCES 2012-045). U.S. Department of Education, National Center for Education Statistics. Washington, DC. Retrieved [date] from http://nces.ed.gov/pubsearch.
Content Contact Susan Aud (202) 219-7013 [email protected]
Commissioner of the National Center for Education Statistics
Letter from the
Letter from the Commissioner iii
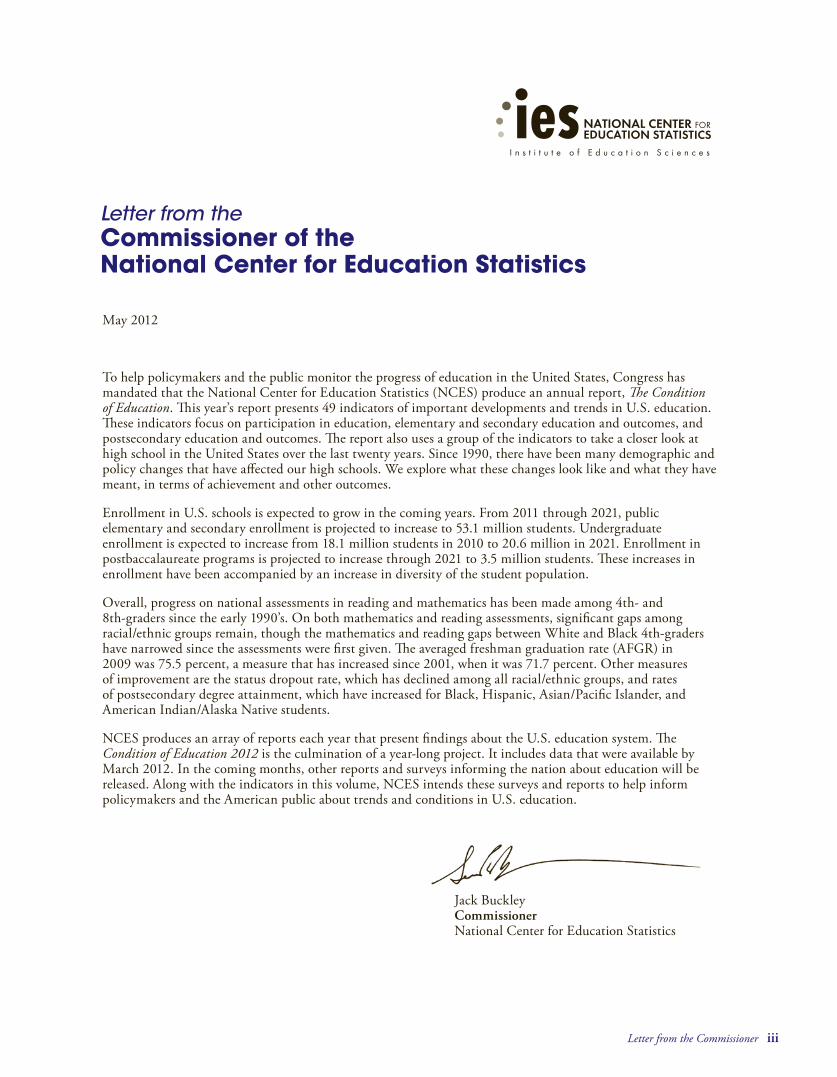
May 2012
To help policymakers and the public monitor the progress of education in the United States, Congress has mandated that the National Center for Education Statistics (NCES) produce an annual report, The Condition of Education. This year’s report presents 49 indicators of important developments and trends in U.S. education. These indicators focus on participation in education, elementary and secondary education and outcomes, and postsecondary education and outcomes. The report also uses a group of the indicators to take a closer look at high school in the United States over the last twenty years. Since 1990, there have been many demographic and policy changes that have affected our high schools. We explore what these changes look like and what they have meant, in terms of achievement and other outcomes.
Enrollment in U.S. schools is expected to grow in the coming years. From 2011 through 2021, public elementary and secondary enrollment is projected to increase to 53.1 million students. Undergraduate enrollment is expected to increase from 18.1 million students in 2010 to 20.6 million in 2021. Enrollment in postbaccalaureate programs is projected to increase through 2021 to 3.5 million students. These increases in enrollment have been accompanied by an increase in diversity of the student population.
Overall, progress on national assessments in reading and mathematics has been made among 4th- and 8th-graders since the early 1990’s. On both mathematics and reading assessments, significant gaps among racial/ethnic groups remain, though the mathematics and reading gaps between White and Black 4th-graders have narrowed since the assessments were first given. The averaged freshman graduation rate (AFGR) in 2009 was 75.5 percent, a measure that has increased since 2001, when it was 71.7 percent. Other measures of improvement are the status dropout rate, which has declined among all racial/ethnic groups, and rates of postsecondary degree attainment, which have increased for Black, Hispanic, Asian/Pacific Islander, and American Indian/Alaska Native students.
NCES produces an array of reports each year that present findings about the U.S. education system. The Condition of Education 2012 is the culmination of a year-long project. It includes data that were available by March 2012. In the coming months, other reports and surveys informing the nation about education will be released. Along with the indicators in this volume, NCES intends these surveys and reports to help inform policymakers and the American public about trends and conditions in U.S. education.
Jack Buckley Commissioner National Center for Education Statistics

iv The Condition of Education 2012
This page intentionally left blank.
v Reader’s Guide
Reader’s GuideThe Condition of Education is available in three forms: this print volume for 2012 and on the National Center for Education Statistics (NCES) website (http://nces.ed.gov/programs/coe), an electronic version, and a downloadable e-book. The Condition of Education website includes the entire content of the 2012 print volume, plus special analyses from the 2000 through 2011 editions, as well as selected indicators from earlier editions of The Condition of Education. (See pages 1 through 6 for a list of all the indicators that appear on The Condition of Education website.)
The print volume of The Condition of Education 2012 is divided into three sections of indicators. Each indicator consists of one page of key findings and technical notes, two figures on the adjacent page, and one or more tables, found in Appendix A. The tables feature the estimates used in the indicator discussion as well as additional estimates related to the indicator. Where applicable, tables of standard errors for estimate tables are available on the NCES website (http://nces.ed.gov/programs/coe). Additional information on data sources can be found in Appendix B. Information on analyses conducted, definitions of variables, and measures can be found in the notes in Appendix C. Finally, a glossary of key terms, a bibliography, and an index are featured in Appendixes D through F.
This icon on the main indicator page lists references for related indicators, tables, glossary terms, and other sources that provide more information related to the indicator. Indicators use the most recent national and international data available during production from either NCES or other sources relevant to the indicator. When the source is an NCES publication, such as the Digest of Education Statistics, the publication can be viewed on the NCES website (http://nces.ed.gov/pubsearch).
Data Sources and Estimates
The data in this report were obtained from many different sources—including students and teachers, state education agencies, local elementary and secondary schools, and colleges and universities—using surveys and compilations of administrative records. Users of The Condition of Education should be cautious when comparing data from different sources. Differences in aspects such as procedures, timing, question phrasing, and interviewer training can affect the comparability of results across data sources.
Most indicators in The Condition of Education summarize data from surveys conducted by NCES or by the Census Bureau with support from NCES. Brief explanations of the major NCES surveys used in this edition of The Condition of Education can be found in Appendix B – Guide to Sources of this volume. More detailed explanations can be obtained on the NCES website (http://nces.ed.gov) under “Surveys and Programs.”
Rea
de
r’s Gu
ide
Appendix B also includes information on non-NCES sources used to compile indicators, such as the American Community Survey (ACS) and the Current Population Survey (CPS). These are Census Bureau surveys used extensively in The Condition of Education. For further details on the ACS, see http://www.census.gov/acs/www/. For further details on the CPS, see http://www.census.gov/cps/.
Data for indicators reported in this volume are obtained primarily from two types of surveys: universe surveys and sample surveys. In universe surveys, information is collected from every member of the population. For example, in a survey regarding certain expenditures of public elementary and secondary schools, data would be obtained from each school district in the United States. When data from an entire population are available, estimates of the total population or a subpopulation are made by simply summing the units in the population or subpopulation.
Since a universe survey is often expensive and time consuming, many surveys collect data from a sample of the population of interest (sample survey). For example, the National Assessment of Educational Progress (NAEP) assesses a representative sample of students rather than the entire population of students. When a sample survey is used, statistical uncertainty is introduced, because the data come from only a portion of the entire population. This statistical uncertainty must be considered when reporting estimates and making comparisons.
Various types of statistics derived from universe and sample surveys are reported in The Condition of Education. Many indicators report the size of a population or a subpopulation, and often the size of a subpopulation is expressed as a percentage of the total population. In addition, the average (or mean) value of some characteristic of the population or subpopulation may be reported. The average is obtained by summing the values for all members of the population and dividing the sum by the size of the population. An example is the annual average salaries of full-time instructional faculty at degree-granting postsecondary institutions. Another measure that is sometimes used is the median. The median is the midpoint value of a characteristic at or above which 50 percent of the population is estimated to fall, and at or below which 50 percent of the population is estimated to fall. An example is the median annual earnings of young adults who are full-time, full-year wage and salary workers.
Standard Errors
Using estimates calculated from data based on a sample of the population requires consideration of several factors before the estimates become meaningful. When using data from a sample, some margin of error will always be present in estimations of characteristics of the total
vi The Condition of Education 2012
population or subpopulation because the data are available from only a portion of the total population. Consequently, data from samples can provide only an approximation of the true or actual value. The margin of error of an estimate, or the range of potential true or actual values, depends on several factors such as the amount of variation in the responses, the size and representativeness of the sample, and the size of the subgroup for which the estimate is computed. The magnitude of this margin of error is measured by what statisticians call the “standard error” of an estimate.
When data from sample surveys are reported, the standard error is calculated for each estimate. The standard errors for all estimated totals, means, medians, or percentages reported in the tables of The Condition of Education can be viewed on the NCES website (http://nces.ed.gov/programs/coe).
In order to caution the reader when interpreting findings in The Condition of Education, estimates from sample surveys are flagged with a “!” when the standard error is 30 percent of the estimate or greater, and suppressed with a “‡” when the standard error is 50 percent of the estimate or greater.
Data Analysis and Interpretation
When estimates are from a sample, caution is warranted when drawing conclusions about one estimate in comparison to another, or about whether a time series of estimates is increasing, decreasing, or staying the same. Although one estimate may appear to be larger than another, a statistical test may find that the apparent difference between them is not reliably measurable due to the uncertainty around the estimates. In this case, the estimates will be described as having no measurable difference, meaning that the difference between them is not statistically significant.
Whether differences in means or percentages are statistically significant can be determined using the standard errors of the estimates. In this publication and others produced by NCES, when differences are statistically significant, the probability that the difference occurred by chance is less than 5 percent, according to NCES standards.
Data presented in The Condition of Education do not investigate more complex hypotheses, account for interrelationships among variables, or support causal inferences. We encourage readers who are interested in more complex questions and in-depth analysis to explore other NCES resources, including publications, online data tools, and public- and restricted-use datasets at http://nces.ed.gov.
For all indicators in The Condition of Education that report estimates based on samples, differences between estimates (including increases and decreases) are stated only when they are statistically significant. To determine whether
differences reported are statistically significant, two-tailed t tests at the .05 level are typically used. The t test formula for determining statistical significance is adjusted when the samples being compared are dependent. The t test formula is not adjusted for multiple comparisons. When the difference between estimates is not statistically significant, tests of equivalence can be used. An equivalence test determines the probability (generally at the .15 level) that the estimates are statistically equivalent, that is, within the margin of error that the two estimates are not substantively different. When the difference is found to be equivalent, language such as “x” and “y” “were similar” or “about the same” has been used. When the variables to be tested are postulated to form a trend, the relationship may be tested using linear regression, logistic regression, or ANOVA trend analysis instead of a series of t tests. These alternate methods of analysis test for specific relationships (e.g., linear, quadratic, or cubic) among variables. For more information on data analysis, please see the NCES Statistical Standards, Standard 5-1, available at http://nces.ed.gov/statprog/2002/std5 1.asp.
A number of considerations influence the ultimate selection of the data years to feature in The Condition of Education. To make analyses as timely as possible, the latest year of available data is shown. The choice of comparison years is often also based on the need to show the earliest available survey year, as in the case of the NAEP and the international assessment surveys. In the case of surveys with long time frames, such as surveys measuring enrollment, the decade’s beginning year (e.g., 1980 or 1990) often starts the trend line. In the figures and tables of the indicators, intervening years are selected in increments in order to show the general trend. The narrative for the indicators typically compares the most current year’s data with those from the initial year and then with those from a more recent period. Where applicable, the narrative may also note years in which the data begin to diverge from previous trends.
Rounding and Other Considerations
All calculations within The Condition of Education are based on unrounded estimates. Therefore, the reader may find that a calculation, such as a difference or a percentage change, cited in the text or figure may not be identical to the calculation obtained by using the rounded values shown in the accompanying tables. Although values reported in the supplemental tables are generally rounded to one decimal place (e.g., 76.5 percent), values reported in each indicator are generally rounded to whole numbers (with any value of 0.50 or above rounded to the next highest whole number). Due to rounding, cumulative percentages may sometimes equal 99 or 101 percent rather than 100 percent.
Indicators in this volume that use the Consumer Price Index (CPI) use a base academic year of 2010–11 and a base calendar year of 2011 for constant dollar calculations. For more information on the CPI, see Appendix C – Finances.
vii Reader’s Guide
Race and ethnicity
The categories denoting race and ethnicity in The Condition of Education are in accordance with the 1997 Office of Management and Budget (OMB) standard classification scheme. These classifications are based primarily on the respondent’s self-identification, as is the case with data collected by the U.S. Census Bureau, or, in rare instances, on observer identification. Under the OMB standards, race and ethnicity are considered separate concepts. “Hispanic or Latino” is an ethnicity category, not a race category. Race categories presented in The Condition of Education 2012 exclude persons of Hispanic ethnicity; thus, the race/ethnicity categories are mutually exclusive.
Ethnicity is categorized as follows:
■ Hispanic or Latino: A person of Cuban, Mexican, Puerto Rican, South or Central American, or other Spanish culture or origin, regardless of race.
Racial groupings are as follows:
■
■
■
■
■
■
American Indian or Alaska Native: A person having origins in any of the original peoples of North and South America (including Central America) who maintains tribal affiliation or community attachment.
Asian: A person having origins in any of the original peoples of the Far East, Southeast Asia, and the Indian subcontinent; for example, Cambodia, China, India, Japan, Korea, Malaysia, Pakistan, the Philippines, Thailand, and Vietnam.
Black: A person having origins in any of the Black racial groups of Africa.
Native Hawaiian or Other Pacific Islander: A person having origins in any of the original peoples of Hawaii, Guam, Samoa, or other Pacific Islands.
White: A person having origins in any of the original peoples of Europe, North Africa, or the Middle East.
Two or more races: A person who selected two or more of the following racial categories when offered the option of selecting one or more racial designations: White, Black, Asian, Native Hawaiian or Other Pacific Islander, or American Indian or Alaska Native.
In The Condition of Education, the following terms are typically used to represent the above categories: White, Black, Hispanic, Pacific Islander, American Indian/Alaska Native, and Two or more races. Not all categories are shown in all indicators. For more information on race/ethnicity, see Appendix C – Commonly Used Measures.
Symbols
In accordance with the NCES Statistical Standards, many tables in this volume use a series of symbols to alert the reader to special statistical notes. These symbols, and their meanings, are as follows:
— Not available.
† Not applicable.
# Rounds to zero.
! Interpret data with caution. The coefficient of variation (CV) for this estimate is 30 percent or greater.
‡ Reporting standards not met. Either there are too few cases or the coefficient of variation (CV) for this estimate is 50 percent or greater.
* p < .05 Significance level.
Rea
de
r’s Gu
ide

viii The Condition of Education 2012
This page intentionally left blank.
ix Contents
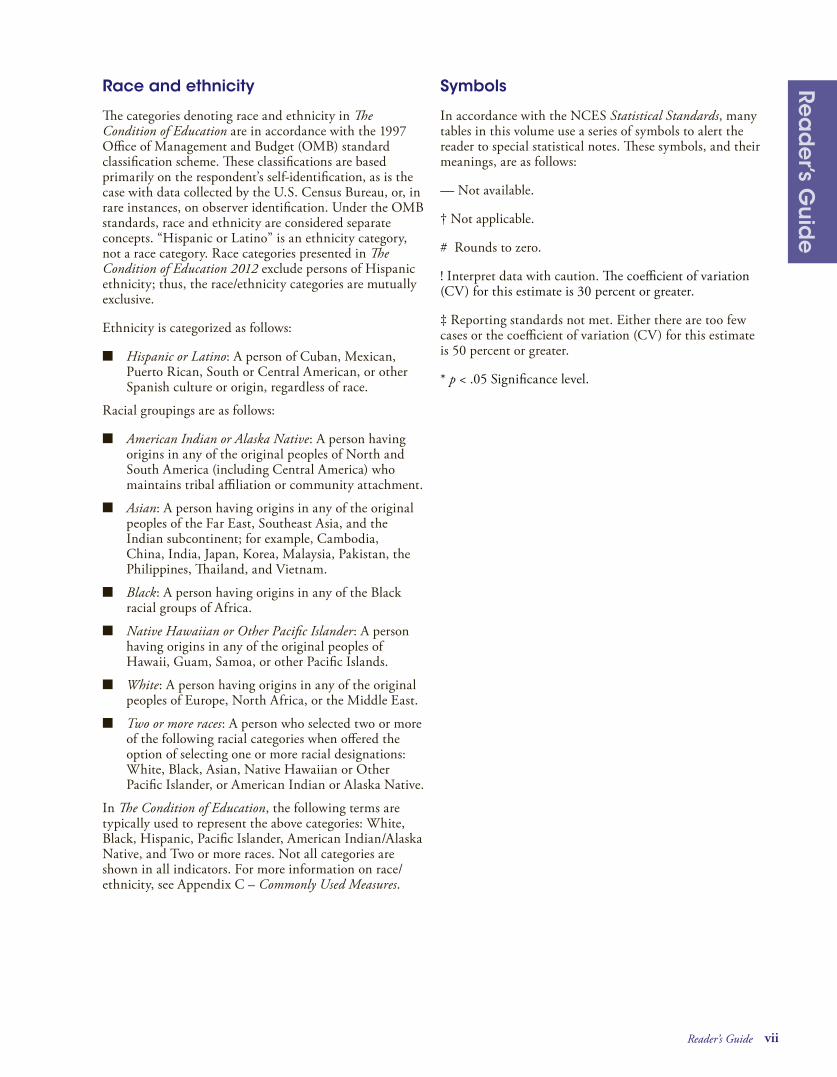
Contents
Letter from the Commissioner of the National Center for Education Statistics ............................................................ iii
Reader’s Guide ...............................................................................................................................................................v
List of Tables ................................................................................................................................................................xii
List of Figures ............................................................................................................................................................xvii
Introduction .................................................................................................................................................................. 1
Overview ......................................................................................................................................................... 1
A Closer Look at High School Students in the United States Over the Last 20 Years ....................................... 6
Section 1—Participation in Education .................................................................................... 15See page 14 for a brief introduction to this section.
All Ages1 Enrollment Trends by Age ..............................................................................................................................16
Preprimary Education2 Early Education and Child Care Arrangements of Young Children ................................................................18
Elementary/Secondary Education3 Public School Enrollment .............................................................................................................................. 20
4 Charter School Enrollment ............................................................................................................................ 22
5 Private School Enrollment ............................................................................................................................. 24
6 Racial/Ethnic Enrollment in Public Schools .................................................................................................. 26
7 Family Characteristics of 5- to 17-Year-Olds .................................................................................................. 28
8 English Language Learners in Public Schools ................................................................................................ 30
9 Children and Youth With Disabilities .............................................................................................................32
Postsecondary Enrollment10 Undergraduate Enrollment ............................................................................................................................ 34
11 Postbaccalaureate Enrollment ........................................................................................................................ 36
Section 2—Elementary and Secondary Education ................................................................ 39See page 38 for a brief introduction to this section.
School Characteristics and Climate12 Characteristics of Elementary and Secondary Schools .................................................................................... 40
13 Concentration of Public School Students Eligible for Free or Reduced-Price Lunch ....................................... 42
14 School Crime and Safety................................................................................................................................ 44
15 Distance Education in Public High Schools ................................................................................................... 46
16 Public High School Retention Rates .............................................................................................................. 48
17 Characteristics of Full-Time Teachers ............................................................................................................ 50
18 Characteristics of School Principals ................................................................................................................52
Page
Co
nte
nts

x The Condition of Education 2012
Finance19 Public School Revenue Sources ...................................................................................................................... 54
20 Public School Expenditures ........................................................................................................................... 56
21 Variations in Instruction Expenditures ...........................................................................................................58
22 Education Expenditures by Country .............................................................................................................. 60
Assessments23 Reading Performance ......................................................................................................................................62
24 Mathematics Performance ............................................................................................................................. 64
25 U.S. History, Geography, and Civics Performance ......................................................................................... 66
26 International Reading, Mathematics, and Science Proficiency ....................................................................... 68
Student Effort, Persistence, and Progress27 Extracurricular Activities of High School Students .........................................................................................70
28 Student Absenteeism .......................................................................................................................................72
29 Youth Neither in School nor Working ............................................................................................................74
30 Employment of High School Students ............................................................................................................76
31 High School Coursetaking .............................................................................................................................78
32 Public High School Graduation Rates ........................................................................................................... 80
33 Status Dropout Rates ......................................................................................................................................82
34 Immediate Transition to College ................................................................................................................... 84
35 Postsecondary Graduation Expectations ........................................................................................................ 86
Section 3—Postsecondary Education .................................................................................... 89See page 88 for a brief introduction to this section.
Characteristics of Postsecondary Students36 Characteristics of Undergraduate Institutions ................................................................................................ 90
37 College Student Employment ........................................................................................................................ 92
Programs and Courses 38 Undergraduate Fields of Study ....................................................................................................................... 94
39 Graduate Fields of Study ................................................................................................................................ 96
Finance and Resources40 Price of Attending an Undergraduate Institution ........................................................................................... 98
41 Undergraduate Grants and Loans .................................................................................................................100
42 Postsecondary Revenues ...............................................................................................................................102
43 Postsecondary Expenses ................................................................................................................................104
44 Faculty Salaries, Benefits, and Total Compensation ......................................................................................106
Completions45 Postsecondary Graduation Rates ...................................................................................................................108
46 Degrees Conferred by Public and Private Institutions ...................................................................................110
47 Degrees Earned .............................................................................................................................................112
48 Educational Attainment ................................................................................................................................ 114

xi Contents
Economic Outcomes49 Annual Earnings of Young Adults ................................................................................................................. 116
APPENDIX A—Tables ...............................................................................................................119The supplemental tables are listed in the List of Tables on the following pages.
APPENDIX B—Guide to Sources ............................................................................................ 291
APPENDIX C—Notes .............................................................................................................. 301Note 1. Commonly Used Measures ............................................................................................................................302
Note 2. Finance......................................................................................................................................................... 309
Note 3. International Education Definitions ..............................................................................................................312
APPENDIX D—Glossary .......................................................................................................... 315
APPENDIX E—Bibliography .................................................................................................... 325
APPENDIX F—Index ................................................................................................................ 329
Co
nte
nts
xii The Condition of Education 2012
List of Tables
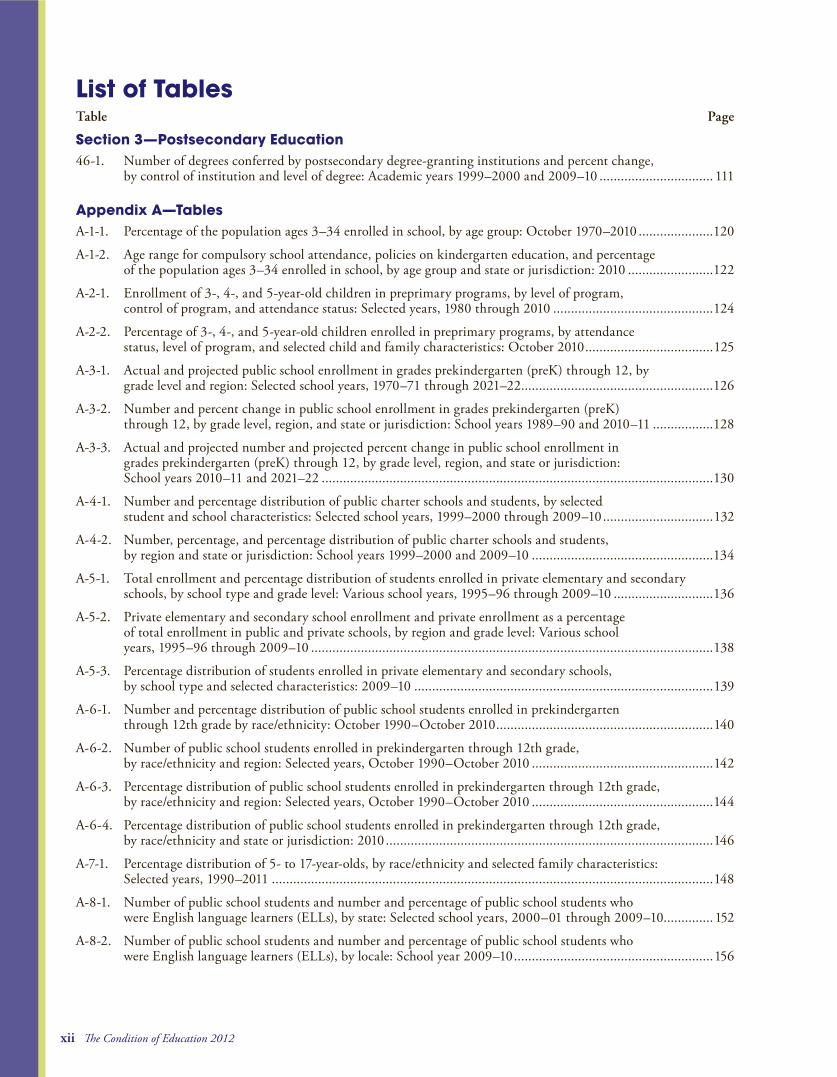
Section 3—Postsecondary Education46-1. Number of degrees conferred by postsecondary degree-granting institutions and percent change,
by control of institution and level of degree: Academic years 1999–2000 and 2009–10 ................................ 111
Appendix A—TablesA-1-1. Percentage of the population ages 3–34 enrolled in school, by age group: October 1970–2010 .....................120
A-1-2. Age range for compulsory school attendance, policies on kindergarten education, and percentage of the population ages 3–34 enrolled in school, by age group and state or jurisdiction: 2010 ........................122
A-2-1. Enrollment of 3-, 4-, and 5-year-old children in preprimary programs, by level of program, control of program, and attendance status: Selected years, 1980 through 2010 .............................................124
A-2-2. Percentage of 3-, 4-, and 5-year-old children enrolled in preprimary programs, by attendance status, level of program, and selected child and family characteristics: October 2010 ....................................125
A-3-1. Actual and projected public school enrollment in grades prekindergarten (preK) through 12, by grade level and region: Selected school years, 1970–71 through 2021–22 ......................................................126
A-3-2. Number and percent change in public school enrollment in grades prekindergarten (preK) through 12, by grade level, region, and state or jurisdiction: School years 1989–90 and 2010–11 .................128
A-3-3. Actual and projected number and projected percent change in public school enrollment in grades prekindergarten (preK) through 12, by grade level, region, and state or jurisdiction: School years 2010–11 and 2021–22 ..............................................................................................................130
A-4-1. Number and percentage distribution of public charter schools and students, by selected student and school characteristics: Selected school years, 1999–2000 through 2009–10 ...............................132
A-4-2. Number, percentage, and percentage distribution of public charter schools and students, by region and state or jurisdiction: School years 1999–2000 and 2009–10 ...................................................134
A-5-1. Total enrollment and percentage distribution of students enrolled in private elementary and secondary schools, by school type and grade level: Various school years, 1995–96 through 2009–10 ............................136
A-5-2. Private elementary and secondary school enrollment and private enrollment as a percentage of total enrollment in public and private schools, by region and grade level: Various school years, 1995–96 through 2009–10 .................................................................................................................138
A-5-3. Percentage distribution of students enrolled in private elementary and secondary schools, by school type and selected characteristics: 2009–10 ....................................................................................139
A-6-1. Number and percentage distribution of public school students enrolled in prekindergarten through 12th grade by race/ethnicity: October 1990–October 2010 .............................................................140
A-6-2. Number of public school students enrolled in prekindergarten through 12th grade, by race/ethnicity and region: Selected years, October 1990–October 2010 ...................................................142
A-6-3. Percentage distribution of public school students enrolled in prekindergarten through 12th grade, by race/ethnicity and region: Selected years, October 1990–October 2010 ...................................................144
A-6-4. Percentage distribution of public school students enrolled in prekindergarten through 12th grade, by race/ethnicity and state or jurisdiction: 2010 ............................................................................................146
A-7-1. Percentage distribution of 5- to 17-year-olds, by race/ethnicity and selected family characteristics: Selected years, 1990–2011 ............................................................................................................................148
A-8-1. Number of public school students and number and percentage of public school students who were English language learners (ELLs), by state: Selected school years, 2000–01 through 2009–10.............. 152
A-8-2. Number of public school students and number and percentage of public school students who were English language learners (ELLs), by locale: School year 2009–10 ........................................................156
Table Page
xiii List of Tables
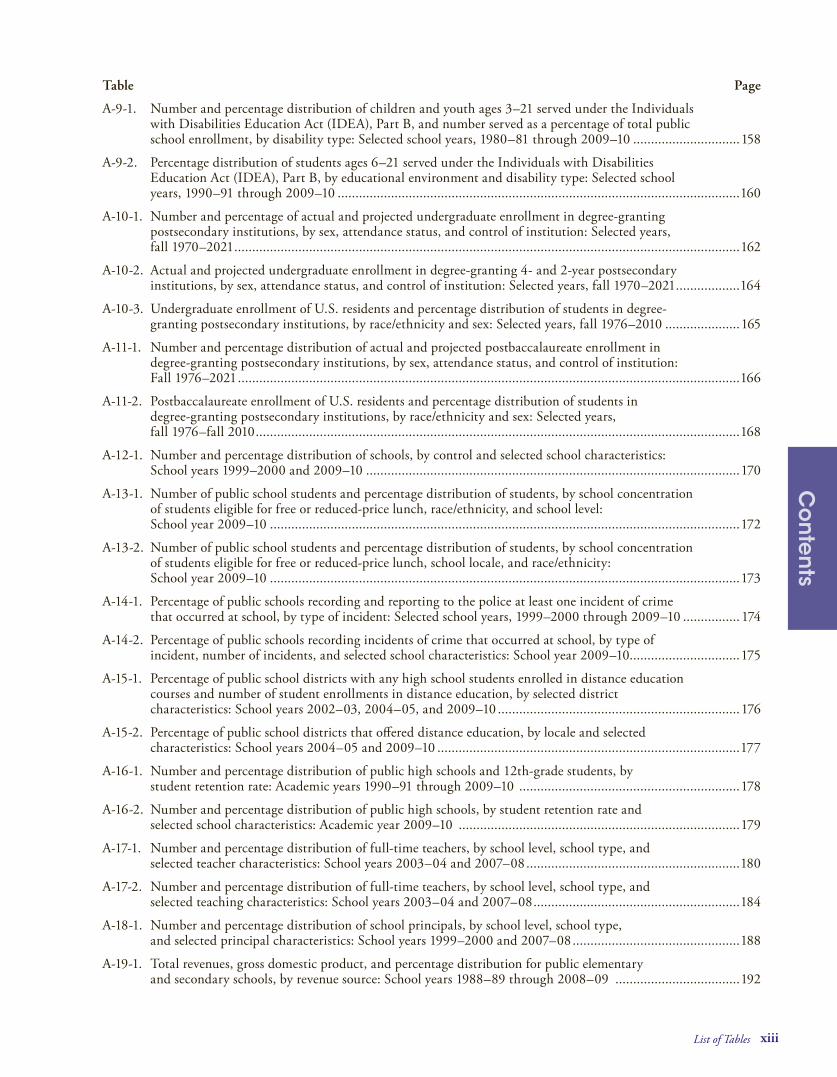
A-9-1. Number and percentage distribution of children and youth ages 3–21 served under the Individuals with Disabilities Education Act (IDEA), Part B, and number served as a percentage of total public school enrollment, by disability type: Selected school years, 1980–81 through 2009–10 ..............................158
A-9-2. Percentage distribution of students ages 6–21 served under the Individuals with Disabilities Education Act (IDEA), Part B, by educational environment and disability type: Selected school years, 1990–91 through 2009–10 .................................................................................................................160
A-10-1. Number and percentage of actual and projected undergraduate enrollment in degree-granting postsecondary institutions, by sex, attendance status, and control of institution: Selected years, fall 1970–2021 ..............................................................................................................................................162
A-10-2. Actual and projected undergraduate enrollment in degree-granting 4- and 2-year postsecondary institutions, by sex, attendance status, and control of institution: Selected years, fall 1970–2021 ..................164
A-10-3. Undergraduate enrollment of U.S. residents and percentage distribution of students in degree- granting postsecondary institutions, by race/ethnicity and sex: Selected years, fall 1976–2010 .....................165
A-11-1. Number and percentage distribution of actual and projected postbaccalaureate enrollment in degree-granting postsecondary institutions, by sex, attendance status, and control of institution: Fall 1976–2021 .............................................................................................................................................166
A-11-2. Postbaccalaureate enrollment of U.S. residents and percentage distribution of students in degree-granting postsecondary institutions, by race/ethnicity and sex: Selected years, fall 1976–fall 2010 ........................................................................................................................................168
A-12-1. Number and percentage distribution of schools, by control and selected school characteristics: School years 1999–2000 and 2009–10 .........................................................................................................170
A-13-1. Number of public school students and percentage distribution of students, by school concentration of students eligible for free or reduced-price lunch, race/ethnicity, and school level: School year 2009–10 ....................................................................................................................................172
A-13-2. Number of public school students and percentage distribution of students, by school concentration of students eligible for free or reduced-price lunch, school locale, and race/ethnicity: School year 2009–10 ....................................................................................................................................173
A-14-1. Percentage of public schools recording and reporting to the police at least one incident of crime that occurred at school, by type of incident: Selected school years, 1999–2000 through 2009–10 ................ 174
A-14-2. Percentage of public schools recording incidents of crime that occurred at school, by type of incident, number of incidents, and selected school characteristics: School year 2009–10...............................175
A-15-1. Percentage of public school districts with any high school students enrolled in distance education courses and number of student enrollments in distance education, by selected district characteristics: School years 2002–03, 2004–05, and 2009–10 ....................................................................176
A-15-2. Percentage of public school districts that offered distance education, by locale and selected characteristics: School years 2004–05 and 2009–10 .....................................................................................177
A-16-1. Number and percentage distribution of public high schools and 12th-grade students, by student retention rate: Academic years 1990–91 through 2009–10 ..............................................................178
A-16-2. Number and percentage distribution of public high schools, by student retention rate and selected school characteristics: Academic year 2009–10 ...............................................................................179
A-17-1. Number and percentage distribution of full-time teachers, by school level, school type, and selected teacher characteristics: School years 2003–04 and 2007–08 ............................................................180
A-17-2. Number and percentage distribution of full-time teachers, by school level, school type, and selected teaching characteristics: School years 2003–04 and 2007–08 ..........................................................184
A-18-1. Number and percentage distribution of school principals, by school level, school type, and selected principal characteristics: School years 1999–2000 and 2007–08 ...............................................188
A-19-1. Total revenues, gross domestic product, and percentage distribution for public elementary and secondary schools, by revenue source: School years 1988–89 through 2008–09 ...................................192
Table Page
Co
nte
nts
xiv The Condition of Education 2012
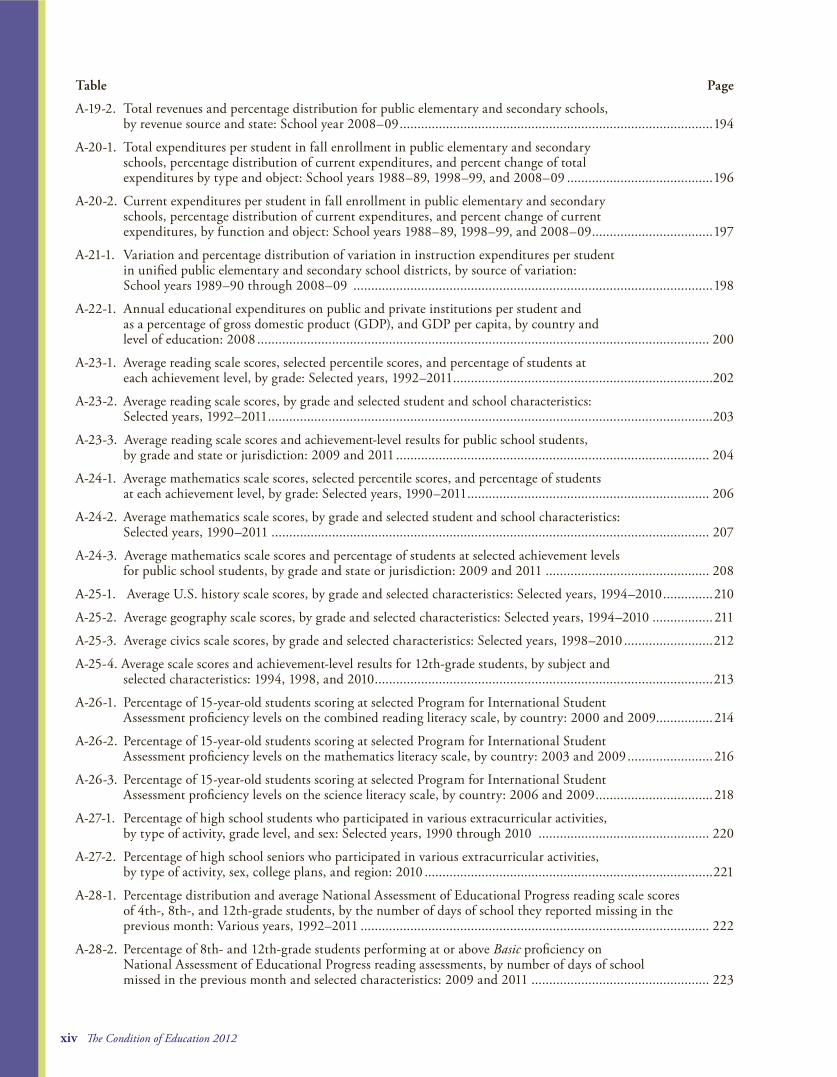
A-19-2. Total revenues and percentage distribution for public elementary and secondary schools, by revenue source and state: School year 2008–09 ........................................................................................194
A-20-1. Total expenditures per student in fall enrollment in public elementary and secondary schools, percentage distribution of current expenditures, and percent change of total expenditures by type and object: School years 1988–89, 1998–99, and 2008–09 .........................................196
A-20-2. Current expenditures per student in fall enrollment in public elementary and secondary schools, percentage distribution of current expenditures, and percent change of current expenditures, by function and object: School years 1988–89, 1998–99, and 2008–09 ..................................197
A-21-1. Variation and percentage distribution of variation in instruction expenditures per student in unified public elementary and secondary school districts, by source of variation: School years 1989–90 through 2008–09 .....................................................................................................198
A-22-1. Annual educational expenditures on public and private institutions per student and as a percentage of gross domestic product (GDP), and GDP per capita, by country and level of education: 2008 ............................................................................................................................... 200
A-23-1. Average reading scale scores, selected percentile scores, and percentage of students at each achievement level, by grade: Selected years, 1992–2011 .........................................................................202
A-23-2. Average reading scale scores, by grade and selected student and school characteristics: Selected years, 1992–2011 .............................................................................................................................203
A-23-3. Average reading scale scores and achievement-level results for public school students, by grade and state or jurisdiction: 2009 and 2011 ........................................................................................ 204
A-24-1. Average mathematics scale scores, selected percentile scores, and percentage of students at each achievement level, by grade: Selected years, 1990–2011 .................................................................... 206
A-24-2. Average mathematics scale scores, by grade and selected student and school characteristics: Selected years, 1990–2011 ........................................................................................................................... 207
A-24-3. Average mathematics scale scores and percentage of students at selected achievement levels for public school students, by grade and state or jurisdiction: 2009 and 2011 .............................................. 208
A-25-1. Average U.S. history scale scores, by grade and selected characteristics: Selected years, 1994–2010 ..............210
A-25-2. Average geography scale scores, by grade and selected characteristics: Selected years, 1994–2010 .................211
A-25-3. Average civics scale scores, by grade and selected characteristics: Selected years, 1998–2010 .........................212
A-25-4. Average scale scores and achievement-level results for 12th-grade students, by subject and selected characteristics: 1994, 1998, and 2010 ...............................................................................................213
A-26-1. Percentage of 15-year-old students scoring at selected Program for International Student Assessment proficiency levels on the combined reading literacy scale, by country: 2000 and 2009................214
A-26-2. Percentage of 15-year-old students scoring at selected Program for International Student Assessment proficiency levels on the mathematics literacy scale, by country: 2003 and 2009 ........................216
A-26-3. Percentage of 15-year-old students scoring at selected Program for International Student Assessment proficiency levels on the science literacy scale, by country: 2006 and 2009 .................................218
A-27-1. Percentage of high school students who participated in various extracurricular activities, by type of activity, grade level, and sex: Selected years, 1990 through 2010 ................................................ 220
A-27-2. Percentage of high school seniors who participated in various extracurricular activities, by type of activity, sex, college plans, and region: 2010 .................................................................................221
A-28-1. Percentage distribution and average National Assessment of Educational Progress reading scale scores of 4th-, 8th-, and 12th-grade students, by the number of days of school they reported missing in the previous month: Various years, 1992–2011 .................................................................................................. 222
A-28-2. Percentage of 8th- and 12th-grade students performing at or above Basic proficiency on National Assessment of Educational Progress reading assessments, by number of days of school missed in the previous month and selected characteristics: 2009 and 2011 .................................................. 223
Table Page
xv List of Tables
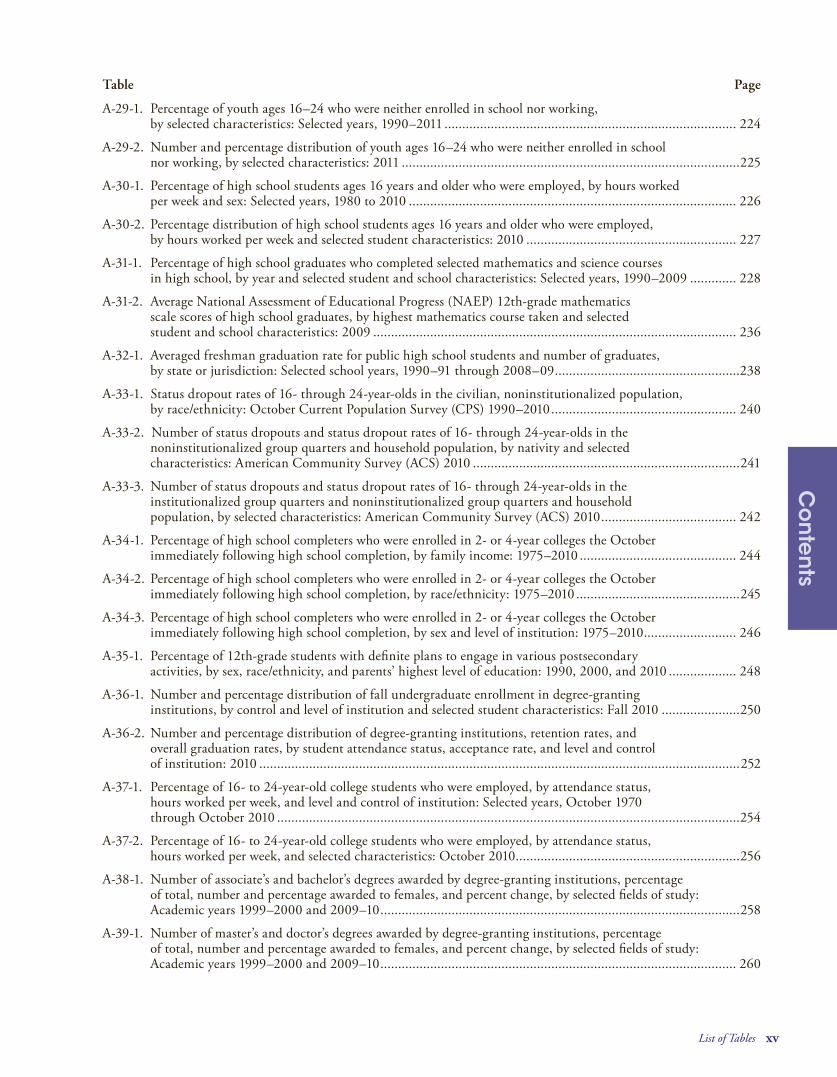
A-29-1. Percentage of youth ages 16–24 who were neither enrolled in school nor working, by selected characteristics: Selected years, 1990–2011 .................................................................................. 224
A-29-2. Number and percentage distribution of youth ages 16–24 who were neither enrolled in school nor working, by selected characteristics: 2011 ...............................................................................................225
A-30-1. Percentage of high school students ages 16 years and older who were employed, by hours worked per week and sex: Selected years, 1980 to 2010 ............................................................................................ 226
A-30-2. Percentage distribution of high school students ages 16 years and older who were employed, by hours worked per week and selected student characteristics: 2010 ........................................................... 227
A-31-1. Percentage of high school graduates who completed selected mathematics and science courses in high school, by year and selected student and school characteristics: Selected years, 1990–2009 ............. 228
A-31-2. Average National Assessment of Educational Progress (NAEP) 12th-grade mathematics scale scores of high school graduates, by highest mathematics course taken and selected student and school characteristics: 2009 ...................................................................................................... 236
A-32-1. Averaged freshman graduation rate for public high school students and number of graduates, by state or jurisdiction: Selected school years, 1990–91 through 2008–09 ....................................................238
A-33-1. Status dropout rates of 16- through 24-year-olds in the civilian, noninstitutionalized population, by race/ethnicity: October Current Population Survey (CPS) 1990–2010 .................................................... 240
A-33-2. Number of status dropouts and status dropout rates of 16- through 24-year-olds in the noninstitutionalized group quarters and household population, by nativity and selected characteristics: American Community Survey (ACS) 2010 ...........................................................................241
A-33-3. Number of status dropouts and status dropout rates of 16- through 24-year-olds in the institutionalized group quarters and noninstitutionalized group quarters and household population, by selected characteristics: American Community Survey (ACS) 2010 ...................................... 242
A-34-1. Percentage of high school completers who were enrolled in 2- or 4-year colleges the October immediately following high school completion, by family income: 1975–2010 ............................................ 244
A-34-2. Percentage of high school completers who were enrolled in 2- or 4-year colleges the October immediately following high school completion, by race/ethnicity: 1975–2010 ..............................................245
A-34-3. Percentage of high school completers who were enrolled in 2- or 4-year colleges the October immediately following high school completion, by sex and level of institution: 1975–2010 .......................... 246
A-35-1. Percentage of 12th-grade students with definite plans to engage in various postsecondary activities, by sex, race/ethnicity, and parents’ highest level of education: 1990, 2000, and 2010 ................... 248
A-36-1. Number and percentage distribution of fall undergraduate enrollment in degree-granting institutions, by control and level of institution and selected student characteristics: Fall 2010 ......................250
A-36-2. Number and percentage distribution of degree-granting institutions, retention rates, and overall graduation rates, by student attendance status, acceptance rate, and level and control of institution: 2010 .......................................................................................................................................252
A-37-1. Percentage of 16- to 24-year-old college students who were employed, by attendance status, hours worked per week, and level and control of institution: Selected years, October 1970 through October 2010 ..................................................................................................................................254
A-37-2. Percentage of 16- to 24-year-old college students who were employed, by attendance status, hours worked per week, and selected characteristics: October 2010 ...............................................................256
A-38-1. Number of associate’s and bachelor’s degrees awarded by degree-granting institutions, percentage of total, number and percentage awarded to females, and percent change, by selected fields of study: Academic years 1999–2000 and 2009–10 .....................................................................................................258
A-39-1. Number of master’s and doctor’s degrees awarded by degree-granting institutions, percentage of total, number and percentage awarded to females, and percent change, by selected fields of study: Academic years 1999–2000 and 2009–10 .................................................................................................... 260
Table Page
Co
nte
nts
xvi The Condition of Education 2012
A-40-1. Average total costs of attending an undergraduate institution for first-time, full-time students, by control and level of institution, living arrangement, and component of student costs: Academic years 2009–10 and 2010–11 .........................................................................................................262
A-40-2. Average amount of grant and scholarship aid and average net price for first-time, full-time students receiving aid and percentage distribution of students, by institution control and level and income level: Academic year 2009–10 .......................................................................................................................263
A-41-1. Participation of full-time, first-time, degree-seeking undergraduate students in financial aid programs, by institution control, level, and type of aid: Academic year 2009–10 .......................................................... 264
A-41-2. Participation of full-time, first-time, degree-seeking undergraduate students in financial aid programs, by institution control, level, and type of aid: Academic years 2006–07 through 2009–10 ........................... 266
A-42-1. Total and per full-time-equivalent (FTE) student revenue of postsecondary degree-granting institutions, by control of institution and source of funds: Academic years 2004–05 and 2009–10 ................................. 268
A-42-2. Total and per full-time-equivalent (FTE) student revenue of postsecondary degree-granting institutions, by institution level, institution control, and source of funds: Academic years 2004–05 and 2009–10 ................................................................................................................................................270
A-43-1. Total and per full-time-equivalent (FTE) student expenses, by control of institution and purpose for degree-granting postsecondary institutions: Academic years 2004–05 and 2009–10 ...............................272
A-43-2. Total and per full-time-equivalent (FTE) student expenses, by level and control of institution and purpose for degree-granting postsecondary institutions: Academic years 2004–05 and 2009–10..................274
A-44-1. Percentage distribution of full-time faculty and average total compensation, salary, and fringe benefits in current-year dollars for faculty on 9- and 10-month contracts at degree-granting institutions, by academic rank and control and level of institution: Academic years 1989–90, 1999–2000, and 2010–11 .....276
A-44-2. Inflation-adjusted average total compensation, salary, and fringe benefits for full-time faculty on 9- and 10-month contracts at degree-granting institutions, with percentage change, by academic rank and control and level of institutions: Academic years 1989–90, 1999–2000, and 2010–11 ............................................. 277
A-45-1. Percentage of students seeking a bachelor’s degree at 4-year institutions who completed a bachelor’s degree, by control of institution, sex, and time to degree attainment: Starting cohort years 1996 and 2004 ......................................................................................................................................................278
A-45-2. Percentage of students seeking a bachelor’s degree at 4-year institutions who completed a bachelor’s degree within 6 years, by selected characteristics: Starting cohort years 1996 and 2004 ................................279
A-45-3. Percentage of students seeking a certificate or associate’s degree at 2-year institutions who completed a certificate or associate’s degree within 150 percent of the normal time required to do so, by race/ethnicity, control of institution, and sex: Starting cohort years 2000 and 2007 .................................... 280
A-46-1. Number and percentage distribution of degrees conferred by postsecondary degree-granting institutions, by control of institution and level of degree: Academic years 1999–2000 through 2009–10 ......................................................................................................................................................282
A-47-1. Number of degrees conferred by degree-granting institutions and percentage of degrees conferred to females, by level of degree: Academic years 1999–2000 through 2009–10 ............................................... 284
A-47-2. Number and percentage change in degrees conferred to U.S. residents by degree-granting institutions, percentage distribution of degrees conferred, and percentage of degrees conferred to females, by level of degree and race/ethnicity: Academic years 1999–2000, 2004–05, and 2009–10 ......................................285
A-48-1. Percentage of 25- to 29-year-olds who attained selected levels of education, by race/ethnicity and sex: Selected years, 1980–2011 .............................................................................................................. 286
A-49-1. Median annual earnings and percentage of full-time, full-year wage and salary workers ages 25–34, by educational attainment, sex, and race/ethnicity: Selected years, 1995–2010 ............................................ 288
Table Page
xvii List of Figures
List of Figures
Introduction
Overview1 Percentage of the population ages 3–34 enrolled in school, by age group: October 1970–2010 ........................ 1
2 Averaged freshman graduation rate for public high school students, by state or jurisdiction: School year 2008–09 ....................................................................................................................................... 3
3 Percentage of degrees conferred to U.S.-resident females by degree-granting institutions, by level of degree and race/ethnicity: Academic year 2009–10 ......................................................................... 4
Closer LookCL-1. Actual and projected public school enrollment in grades 9 through 12: School years 1990–91
through 2021–22 ............................................................................................................................................. 6
CL-2. Percentage of high school graduates who completed selected mathematics and science courses in high school: 1990 and 2009 ............................................................................................................................. 7
CL-3. Percentage of high school students ages 16 years and older who were employed, by sex: Selected years, 1990 to 2010 ......................................................................................................................... 9
CL-4. Average scale scores of 12th-grade students, by subject: Selected years, 1994–2010 ........................................10
CL-5. Status dropout rates of 16- through 24-year-olds in the civilian, noninstitutionalized population, by race/ethnicity: October Current Population Survey (CPS) 1990–2010 .......................................................11
CL-6. Percentage of 12th-grade students with definite plans to graduate from a 4-year college, by parents’ highest level of education: 1990, 2000, and 2010 ..........................................................................13
Section 1—Participation in Education1-1. Percentage of the population ages 3–34 enrolled in school, by age group: October 1970–2010 .......................17
1-2. Percentage of the population ages 3–34 enrolled in school, by age group: October 2010 .................................17
2-1. Percentage of 3-, 4-, and 5-year-old children enrolled in full-day preprimary programs: Selected years, 1980 through 2010 ..................................................................................................................19
2-2. Percentage of 3-, 4-, and 5-year old children enrolled in preprimary programs, by race/ethnicity and attendance status: October 2010 .....................................................................................................................19
3-1. Actual and projected public school enrollment in grades prekindergarten (preK) through 12, by grade level: School years 1970–71 through 2021–22 ..................................................................................21
3-2. Projected percent change in public school enrollment in grades prekindergarten (preK) through 12, by state or jurisdiction: Between school years 2010–11 and 2021–22 ..............................................................21
4-1. Number of students enrolled in public charter schools: Selected school years, 1999–2000 through 2009–10 ........................................................................................................................................................ 23
4-2. Percentage of all public students who are in charter schools, by state: School year 2009–10 ........................... 23
5-1. Number of private school students in prekindergarten through grade 12, by school type: Various school years, 1995–96 through 2009–10 ............................................................................................25
5-2. Percentage distribution of private school enrollment, by school type and level: 2009–10 ................................25
6-1. Percentage distribution of public school students enrolled in prekindergarten through 12th grade, by race/ethnicity: Selected years, October 1990–October 2010 ...................................................................... 27
6-2. Number of public school students enrolled in prekindergarten through 12th grade, by region and race/ethnicity: October 1990–October 2010 .................................................................................................. 27
7-1. Percentage of 5- to 17-year-olds living in two-parent households, by race/ethnicity: 1990, 2000, and 2011 .........................................................................................................................................................29
Figure Page
Co
nte
nts
xviii The Condition of Education 2012
7-2. Percentage of 5- to 17-year-olds who were living in poor households, by race/ethnicity: 2006 and 2011 .........29
8-1. Percentage of public school students who are English language learners (ELLs), by state: School year 2009–10 ......................................................................................................................................31
8-2. Percentage of public school students who are English language learners (ELLs), by locale: School year 2009–10 ......................................................................................................................................31
9-1. Percentage distribution of children and youth ages 3–21 served under the Individuals with Disabilities Education Act (IDEA), by disability type: School year 2009–10 .....................................................................33
9-2. Percentage of students ages 6–21 served under the Individuals with Disabilities Education Act (IDEA), Part B, placed in a regular school environment, by amount of time spent in general classes: Selected school years, 1990–91 through 2009–10 ...........................................................................................33
10-1. Actual and projected undergraduate enrollment in degree-granting postsecondary institutions, by sex and attendance status: Fall 1970–2021 .................................................................................................35
10-2. Percentage distribution for undergraduate enrollment of U.S. residents in degree-granting postsecondary institutions, by race/ethnicity: Fall 1980, 1990, 2000, and 2010 ..............................................35
11-1. Actual and projected postbaccalaureate enrollment in degree-granting postsecondary institutions, by sex: Fall 1976–2021 ...................................................................................................................................37
11-2. Percentage distribution for postbaccalaureate enrollment of U.S. residents in degree-granting postsecondary institutions, by race/ethnicity: Selected years, fall 1980–2010 ..................................................37
Section 2—Elementary and Secondary Education12-1. Percentage distribution of schools, by control and racial/ethnic concentration of schools:
School years 1999–2000 and 2009–10 ...........................................................................................................41
12-2. Percentage distribution of schools, by locale and control: School year 2009–10 ..............................................41
13-1. Percentage distribution of public school students, by school locale and poverty level: School year 2009–10 ..................................................................................................................................... 43
13-2. Percentage of public school students in high-poverty schools and low-poverty schools, by race/ethnicity and school level: School year 2009–10 ................................................................................ 43
14-1. Percentage of public schools recording and reporting to the police at least one incident or one serious violent incident of crime that occurred at school: Selected school years, 1999–2000 through 2009–10 ............................................................................................................................................45
14-2. Percentage of public schools recording violent incidents of crime that occurred at school, by number of incidents and school locale: School year 2009–10 .....................................................................45
15-1. Number of public high school student enrollments in distance education courses: School years 2002–03, 2004–05, and 2009–10 ..................................................................................................................47
15-2. Percentage of public school districts that offered distance education, by locale and selected primary modes of instructional delivery: School years 2004–05 and 2009–10 .............................................................47
16-1. Percentage distribution of public high schools, by student retention rate: Selected academic years, 1990–91 through 2009–10 .............................................................................................................................49
16-2. Percentage distribution of public high schools, by student retention rate and percentage of students eligible for free or reduced-price lunch: Academic year 2009–10 ....................................................................49
17-1. Percentage distribution of full-time school teachers, by school level and highest degree earned: School years 2003–04 and 2007–08 ...............................................................................................................51
17-2. Percentage distribution of full-time secondary level teachers, by school type and years of experience: School years 2003–04 and 2007–08 ...............................................................................................................51
18-1. Percentage of male principals, by school type and level: School years 1999–2000 and 2007–08 .....................53
18-2. Percentage distribution of public school principals, by school level and years of experience as a principal: School years 1999–2000 and 2007–08 ...........................................................................................53
Figure Page
xix List of Figures
19-1. Revenues for public elementary and secondary schools, by revenue source: School years 1989–90 through 2008–09 ...........................................................................................................................................55
19-2. Local revenues for public elementary and secondary schools as a percentage of total school revenues, by state: School year 2008–09 ........................................................................................................................55
20-1. Percentage change in total expenditures per student in fall enrollment in public elementary and secondary schools, by expenditure type and objects of current expenditures, in constant 2010–11 dollars: School years 1988–89 to 2008–09 ......................................................................................57
20-2. Current expenditures per student in fall enrollment in public elementary and secondary schools in constant 2010–11 dollars, by expenditure object: School years 1988–89, 1998–99, and 2008–09 .............57
21-1. Variation in instruction expenditures per student in unified public elementary and secondary school districts, by source of variation: School years 1989–90 through 2008–09 ............................................59
21-2. Percentage distribution of source of variation in instruction expenditures per student in unified public elementary and secondary school districts: Selected school years, 1989–90 through 2008–09 .............59
22-1. Annual expenditures per student for elementary and secondary education in selected Organization for Economic Cooperation and Development (OECD) countries, by gross domestic product (GDP) per capita: 2008 ..............................................................................................................................................61
22-2. Annual expenditures per student for postsecondary education in selected Organization for Economic Cooperation and Development (OECD) countries, by gross domestic product (GDP) per capita: 2008..........61
23-1. Average reading scale scores of 4th-, 8th-, and 12th-grade students: Selected years, 1992–2011 ......................63
23-2. Percentage distribution of 4th- and 8th-grade students across National Assessment of Educational Progress (NAEP) reading achievement levels: Selected years, 1992–2011 ........................................................63
24-1. Average mathematics scale scores of 4th- and 8th-grade students: Selected years, 1990–2011 .........................65
24-2. Percentage distribution of 4th- and 8th-grade students across National Assessment of Educational Progress (NAEP) mathematics achievement levels: Selected years, 1990–2011 ................................................65
25-1. Average scale scores of 4th-, 8th-, and 12th-grade students, by subject: Selected years, 1994–2010 .................67
25-2. Percentage of 12th-grade students at selected National Assessment of Educational Progress (NAEP) achievement levels, by subject: 1994, 1998, and 2010 ......................................................................................67
26-1. Percentage of 15-year-old students on the combined reading literacy scale in the United States and Organization for Economic Co-operation and Development (OECD) countries, by selected Program for International Student Assessment (PISA) proficiency levels: 2000 and 2009 ..............................................69
26-2. Percentage of 15-year-old students on the mathematics and science literacy scales in the United States and Organization for Economic Co-operation and Development (OECD) countries, by selected Program for International Student Assessment (PISA) proficiency levels: 2003, 2006, and 2009 ...................................69
27-1. Percentage of high school seniors who participated in various extracurricular activities, by type of activity: Selected years, 1990 through 2010 ..............................................................................................71
27-2. Percentage of high school seniors who participated in various extracurricular activities, by college plans: 2010 .....................................................................................................................................71
28-1. Average National Assessment of Educational Progress reading scale scores of 12th-grade students, by the number of days of school they reported missing in the previous month: Various years, 1992–2009 .....73
28-2. Percentage of 8th- and 12th-grade students, by number of days of school missed in the previous month and race/ethnicity: 2009 and 2011 ......................................................................................................73
29-1. Percentage of youth ages 16–24 who were neither enrolled in school nor working, by sex: Selected years, 1990–2011 ..............................................................................................................................75
29-2. Percentage of youth ages 16–24 who were neither enrolled in school nor working, by household type and citizenship: 2011 ..............................................................................................................................75
30-1. Percentage of high school students ages 16 years and older who were employed, by sex: Selected years, 1980 to 2010 .................................................................................................................................................. 77
Figure Page
Co
nte
nts
xx The Condition of Education 2012
30-2. Percentage of employed high school students ages 16 years and older who worked more than 15 hours per week, by selected student characteristics: 2010 ......................................................................................... 77
31-1. Percentage of high school graduates who completed selected mathematics and science courses in high school: 1990 and 2009 ........................................................................................................................79
31-2. Average National Assessment of Educational Progress (NAEP) 12th-grade mathematics scale scores of high school graduates, by highest mathematics course taken and race/ethnicity: 2009 ................................79
32-1. Averaged freshman graduation rate for public high school students, by state or jurisdiction: School year 2008–09 ......................................................................................................................................81
32-2. Averaged freshman graduation rate for public high school students: Selected school years 1990–91 through 2008–09 ...........................................................................................................................................81
33-1. Status dropout rates of 16- through 24-year-olds in the civilian, noninstitutionalized population, by race/ethnicity: October Current Population Survey (CPS) 1995–2010 .......................................................83
33-2. Status dropout rates of 16- through 24-year-olds in the noninstitutionalized group quarters and household population, by nativity and race/ethnicity: American Community Survey (ACS) 2010 ..................83
34-1. Percentage of high school completers who were enrolled in 2- or 4-year colleges the October immediately following high school completion, by family income: 1975–2010 ...............................................85
34-2. Percentage of high school completers who were enrolled in 2- or 4-year colleges the October immediately following high school completion, by race/ethnicity: 1975–2010 ................................................85
35-1. Percentage of 12th-grade students with definite plans to graduate from a 4-year college, by sex and race/ethnicity: 1990, 2000, and 2010 ............................................................................................ 87
35-2. Percentage of 12th-grade students with definite plans to graduate from a 4-year college, by parents’ highest level of education: 1990, 2000, and 2010 ......................................................................... 87
Section 3—Postsecondary Education36-1. Percentage distribution of fall undergraduate enrollment in degree-granting institutions,
by student attendance status and control and level of institution: Fall 2010 ....................................................91
36-2. Annual retention rates and graduation rates within 150 percent of normal time at all 4-year degree-granting institutions, by student attendance status and acceptance rate: Fall 2010 ...............................91
37-1. Percentage of 16- to 24-year-old college students who were employed, by attendance status and hours worked per week: October 1970 through October 2010 .................................................................93
37-2. Percentage of 16- to 24-year-old college students who were employed, by attendance status, hours worked per week, and sex: October 2010 ...............................................................................................93
38-1. Number of bachelor’s degrees awarded by degree-granting institutions in selected fields of study: Academic years 1999–2000 and 2009–10 .......................................................................................................95
38-2. Percentage of bachelor’s degrees awarded to females by degree-granting institutions in selected fields of study: Academic year 2009–10 ..........................................................................................................95
39-1. Number of master’s degrees awarded by degree-granting institutions in selected fields of study: Academic years 1999–2000 and 2009–10 ...................................................................................................... 97
39-2. Percentage of master’s degrees awarded to females by degree-granting institutions in selected fields of study: Academic year 2009-10 ......................................................................................... 97
40-1. Total cost of attending an undergraduate institution for first-time, full-time students receiving aid, by level and control of institution and living arrangement: Academic year 2010–11 ...................................... 99
40-2. Average total price, grants and scholarship aid, and net price for first-time, full-time students receiving aid at 4-year institutions, by income level: Academic year 2009–10 ............................................................... 99
41-1. Percentage of first-time, full-time undergraduate students receiving any financial aid at 4-year institutions, by institution control: Academic years 2006–07 through 2009–10 ................................101
Figure Page
xxi List of Figures
41-2. Average amount of aid received by full-time, first-time, degree-seeking undergraduate students in financial aid programs, by institution level, control, and type of aid: Academic year 2009–10 ................................................................................................................................101
42-1. Revenue per full-time-equivalent (FTE) student from tuition and fees for postsecondary degree-granting institutions, by institution control and level: Academic year 2009–10 .................................103
42-2. Percentage distribution of total revenues at postsecondary degree-granting institutions, by institution level, institution control, and source of funds: Academic year 2009–10 ..................................103
43-1. Expenses per full-time-equivalent (FTE) student at degree-granting postsecondary institutions, by control of institution and purpose: Academic year 2009–10 .....................................................................105
43-2. Total expenses per full-time-equivalent (FTE) student at 2-year and 4-year degree-granting postsecondary institutions, by control of institution: Academic years 2004–05 and 2009–10.......................105
44-1. Average salary for full-time instructional faculty on 9- and 10-month contracts at degree-granting postsecondary institutions, by control and level of institution: Academic year 2010–11 ................................107
44-2. Inflation-adjusted average total compensation, salary, and fringe benefits for full-time faculty on 9- and 10-month contracts at degree-granting institutions, with percentage change, by academic rank and control and level of institutions: Academic years 1989–90, 1999–2000, and 2010–11 ...........................107
45-1. Percentage of students seeking a bachelor’s degree at 4-year institutions who completed a bachelor’s degree within 6 years, by control of institution and cohort year: Starting cohort years 1996 and 2004 ..............................................................................................................................................109
45-2. Percentage of students seeking a bachelor’s degree at 4-year institutions who completed a bachelor’s degree within 6 years, by control of institution and race/ethnicity: Starting cohort year 2004 .............................................................................................................................109
46-1. Number of degrees conferred by postsecondary degree-granting institutions, by level of degree: Academic years 1999–2000 through 2009–10 .............................................................................................. 111
47-1. Number of degrees conferred by degree-granting institutions, by level of degree: Academic years 1999–2000, 2004–05, and 2009–10 ...................................................................................113
47-2. Percentage of degrees conferred to U.S.-resident females by degree-granting institutions, by level of degree and race/ethnicity: Academic year 2009–10 ......................................................................113
48-1. Percentage of 25- to 29-year-olds who completed at least a high school diploma or equivalency, by race/ethnicity: 1980–2011 ........................................................................................................................ 115
48-2. Percentage of 25- to 29-year-olds with a bachelor’s degree or higher, by race/ethnicity: 1980–2011 ............... 115
49-1. Median annual earnings of full-time, full-year wage and salary workers ages 25–34, by educational attainment: 1995–2010 ......................................................................................................... 117
49-2. Median annual earnings of full-time, full-year wage and salary workers ages 25–34, by educational attainment and sex: 2010....................................................................................................... 117
Figure Page
Co
nte
nts

xxii The Condition of Education 2012
This page intentionally left blank.
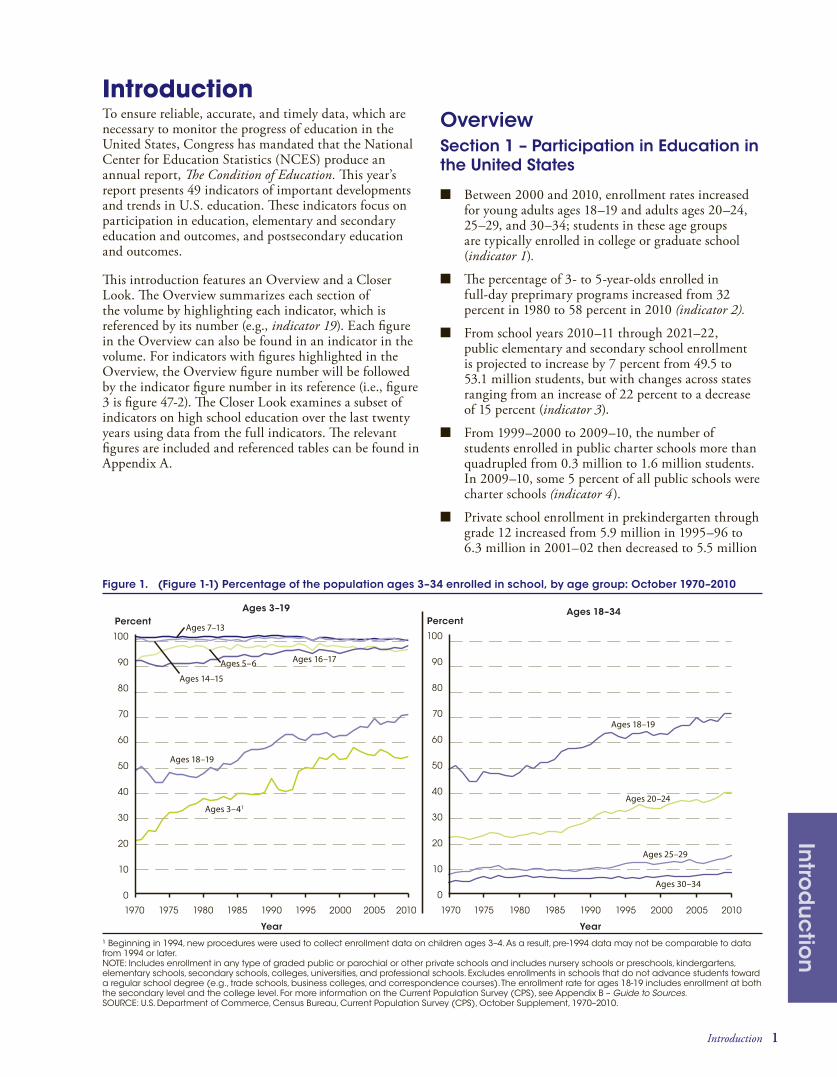
Introduction 1
Intro
du
ctio
n
IntroductionTo ensure reliable, accurate, and timely data, which are necessary to monitor the progress of education in the United States, Congress has mandated that the National Center for Education Statistics (NCES) produce an annual report, The Condition of Education. This year’s report presents 49 indicators of important developments and trends in U.S. education. These indicators focus on participation in education, elementary and secondary education and outcomes, and postsecondary education and outcomes.
This introduction features an Overview and a Closer Look. The Overview summarizes each section of the volume by highlighting each indicator, which is referenced by its number (e.g., indicator 19). Each figure in the Overview can also be found in an indicator in the volume. For indicators with figures highlighted in the Overview, the Overview figure number will be followed by the indicator figure number in its reference (i.e., figure 3 is figure 47-2). The Closer Look examines a subset of indicators on high school education over the last twenty years using data from the full indicators. The relevant figures are included and referenced tables can be found in Appendix A.
OverviewSection 1 – Participation in Education in the United States
■
■
■
■
■
Between 2000 and 2010, enrollment rates increased for young adults ages 18–19 and adults ages 20–24, 25–29, and 30–34; students in these age groups are typically enrolled in college or graduate school (indicator 1).
The percentage of 3- to 5-year-olds enrolled in full-day preprimary programs increased from 32 percent in 1980 to 58 percent in 2010 (indicator 2).
From school years 2010–11 through 2021–22, public elementary and secondary school enrollment is projected to increase by 7 percent from 49.5 to 53.1 million students, but with changes across states ranging from an increase of 22 percent to a decrease of 15 percent (indicator 3).
From 1999–2000 to 2009–10, the number of students enrolled in public charter schools more than quadrupled from 0.3 million to 1.6 million students. In 2009–10, some 5 percent of all public schools were charter schools (indicator 4).
Private school enrollment in prekindergarten through grade 12 increased from 5.9 million in 1995–96 to 6.3 million in 2001–02 then decreased to 5.5 million
Figure 1. (Figure 1-1) Percentage of the population ages 3–34 enrolled in school, by age group: October 1970–2010
0
10
20
30
40
50
60
70
80
90
100
1970 1975 1980 1985 1990 1995 2000 2005 2010
Ages 3–41
Ages 5–6
Ages 7–13
Ages 14–15
Ages 16–17
Ages 18–19
Percent
Year Year
Year
1970 1975 1980 1985 1990 1995 2000 2005 2010
Ages 18–19
Ages 20–24
Ages 25–29
Ages 30–34 0
10
20
30
40
50
60
70
80
90
100 PercentPercentPercent
Ages 3–19 Ages 18–34
¹ Beginning in 1994, new procedures were used to collect enrollment data on children ages 3–4. As a result, pre-1994 data may not be comparable to data from 1994 or later. NOTE: Includes enrollment in any type of graded public or parochial or other private schools and includes nursery schools or preschools, kindergartens, elementary schools, secondary schools, colleges, universities, and professional schools. Excludes enrollments in schools that do not advance students toward a regular school degree (e.g., trade schools, business colleges, and correspondence courses). The enrollment rate for ages 18-19 includes enrollment at both the secondary level and the college level. For more information on the Current Population Survey (CPS), see Appendix B – Guide to Sources. SOURCE: U.S. Department of Commerce, Census Bureau, Current Population Survey (CPS), October Supplement, 1970–2010.

2 The Condition of Education 2012
in 2009–10. Some 10 percent of all elementary and secondary school students were in private schools in 2009–10 (indicator 5).
■
■
■
■
■
■
Between 1990 and 2010, the percentage of public school students who were White decreased from 67 to 54 percent, and the percentage of those who were Hispanic increased from 12 percent (5.1 million students) to 23 percent (12.1 million students) (indicator 6 ).
In 2011, higher percentages of Black (37 percent), Hispanic (34 percent), American Indian/Alaska Native (33 percent), Native Hawaiian/Pacific Islander (32 percent) children, and children of two or more races (20 percent) were living in families below the poverty threshold than were White (12 percent) and Asian (14 percent) children (indicator 7).
The percentage of public school students in the United States who were English language learners (ELLs) was higher in 2009–10 at 10 percent (or an estimated 4.7 million students) than in 2000–01 at 8 percent (or an estimated 3.7 million students) (indicator 8).
The number of children and youth ages 3–21 receiving special education services was 6.5 million in 2009–10, or about 13 percent of all public school students. Some 38 percent of the students receiving special education services had specific learning disabilities (indicator 9).
Between 2000 and 2010, undergraduate enrollment in degree-granting postsecondary institutions increased by 37 percent, from 13.2 to 18.1 million students. Projections indicate that undergraduate enrollment will continue to increase, reaching 20.6 million students in 2021 (indicator 10).
Postbaccalaureate enrollment has increased every year since 1983, reaching 2.9 million students in 2010. In each year since 1988, women have comprised more than half of postbaccalaureate enrollment. In 2010, postbaccalaureate enrollment was 59 percent female (indicator 11).
Section 2 – Elementary and Secondary Education and Outcomes
■
■
In 2009–10, some 5 percent of traditional public schools were combined schools (schools with both elementary and secondary grades), whereas 19 percent of charter schools and 28 percent of private schools were combined schools (indicator 12).
Among public school students in 2009–10, higher percentages of Hispanic (37 percent), Black (37 percent), and American Indian/Alaska Native students (29 percent) attended high-poverty schools than did Asian/Pacific Islander (12 percent) and White students (6 percent) (indicator 13).
■
■
■
■
■
■
■
■
■
■
■
Sixteen percent of public schools recorded at least one incident of serious violent crime in 2009–10; this was lower than the 20 percent of schools recording at least one incident in 1999–2000 (indicator 14).
In 2009–10, some 53 percent of public school districts had high school students enrolled in distance education courses. In these districts, there were over 1.3 million high school student enrollments in distance education in 2009–10, compared to 0.3 million 5 years earlier (indicator 15).
Of approximately 15,500 regular high schools with at least 10 seniors in 2009–10, there were 890 schools (6 percent) in which the number of seniors divided by the number of freshmen 4 years earlier was between 10 and 50 percent (indicator 16 ).
A larger percentage of full-time teachers held a postbaccalaureate degree in 2007–08 than in 2003–04. Forty-nine percent of elementary school teachers and 54 percent of secondary school teachers held a postbaccalaureate degree in 2007–08, compared with 45 and 50 percent, respectively, in 2003–04 (indicator 17).
From 1999–2000 to 2007–08, the percentage of principals who were female increased from 52 to 59 percent at public elementary schools and from 22 to 29 percent at public secondary schools (indicator 18).
From school year 1988–89 through 2008–09, total elementary and secondary public school revenues increased from $350 billion to $611 billion, a 74 percent increase after adjusting for inflation (indicator 19).
Total expenditures per student in public elementary and secondary schools rose 46 percent in constant dollars from 1988–89 through 2008–09, with interest on school debt increasing faster than current expenditures or capital outlay (indicator 20).
After increasing every year from 1997–98 to 2007–08, total variation in instruction expenditures per student was lower among public school districts in 2008–09 than in 2007–08 (indicator 21).
In 2008, the United States spent $10,995 per student on elementary and secondary education, which was 35 percent higher than the Organization for Economic Co-operation and Development (OECD) average of $8,169. At the postsecondary level, U.S. expenditures per student were $29,910, more than twice as high as the OECD average of $13,461 (indicator 22).
The average grade 4 reading score in 2011 was not measurably different from that in 2009. The average grade 8 score, however, was 1 point higher in 2011 than in 2009 (indicator 23).
At grades 4 and 8, the average mathematics scores in 2011 were higher than the average scores for those grades in all previous assessment years (indicator 24).
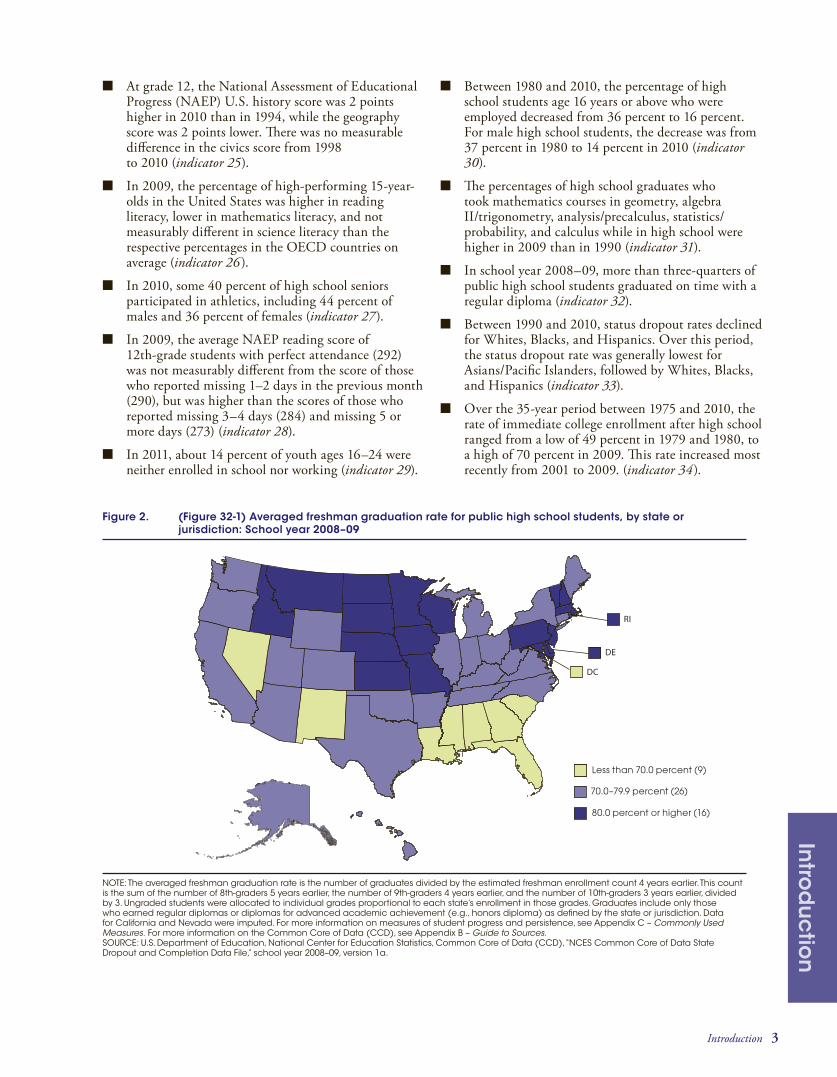
Introduction 3
Intro
du
ctio
n
■
■
■
■
■
At grade 12, the National Assessment of Educational Progress (NAEP) U.S. history score was 2 points higher in 2010 than in 1994, while the geography score was 2 points lower. There was no measurable difference in the civics score from 1998 to 2010 (indicator 25).
In 2009, the percentage of high-performing 15-year-olds in the United States was higher in reading literacy, lower in mathematics literacy, and not measurably different in science literacy than the respective percentages in the OECD countries on average (indicator 26 ).
In 2010, some 40 percent of high school seniors participated in athletics, including 44 percent of males and 36 percent of females (indicator 27).
In 2009, the average NAEP reading score of 12th-grade students with perfect attendance (292) was not measurably different from the score of those who reported missing 1–2 days in the previous month (290), but was higher than the scores of those who reported missing 3–4 days (284) and missing 5 or more days (273) (indicator 28).
In 2011, about 14 percent of youth ages 16–24 were neither enrolled in school nor working (indicator 29).
■
■
■
■
■
Between 1980 and 2010, the percentage of high school students age 16 years or above who were employed decreased from 36 percent to 16 percent. For male high school students, the decrease was from 37 percent in 1980 to 14 percent in 2010 (indicator 30).
The percentages of high school graduates who took mathematics courses in geometry, algebra II/trigonometry, analysis/precalculus, statistics/probability, and calculus while in high school were higher in 2009 than in 1990 (indicator 31).
In school year 2008–09, more than three-quarters of public high school students graduated on time with a regular diploma (indicator 32).
Between 1990 and 2010, status dropout rates declined for Whites, Blacks, and Hispanics. Over this period, the status dropout rate was generally lowest for Asians/Pacific Islanders, followed by Whites, Blacks, and Hispanics (indicator 33).
Over the 35-year period between 1975 and 2010, the rate of immediate college enrollment after high school ranged from a low of 49 percent in 1979 and 1980, to a high of 70 percent in 2009. This rate increased most recently from 2001 to 2009. (indicator 34).
Figure 2. (Figure 32-1) Averaged freshman graduation rate for public high school students, by state or jurisdiction: School year 2008–09
70.0–79.9 percent (26)
DE
RI
DC
Less than 70.0 percent (9)
80.0 percent or higher (16)
NOTE: The averaged freshman graduation rate is the number of graduates divided by the estimated freshman enrollment count 4 years earlier. This count is the sum of the number of 8th-graders 5 years earlier, the number of 9th-graders 4 years earlier, and the number of 10th-graders 3 years earlier, divided by 3. Ungraded students were allocated to individual grades proportional to each state’s enrollment in those grades. Graduates include only those who earned regular diplomas or diplomas for advanced academic achievement (e.g., honors diploma) as defined by the state or jurisdiction. Data for California and Nevada were imputed. For more information on measures of student progress and persistence, see Appendix C – Commonly Used Measures. For more information on the Common Core of Data (CCD), see Appendix B – Guide to Sources. SOURCE: U.S. Department of Education, National Center for Education Statistics, Common Core of Data (CCD), “NCES Common Core of Data State Dropout and Completion Data File,” school year 2008–09, version 1a.
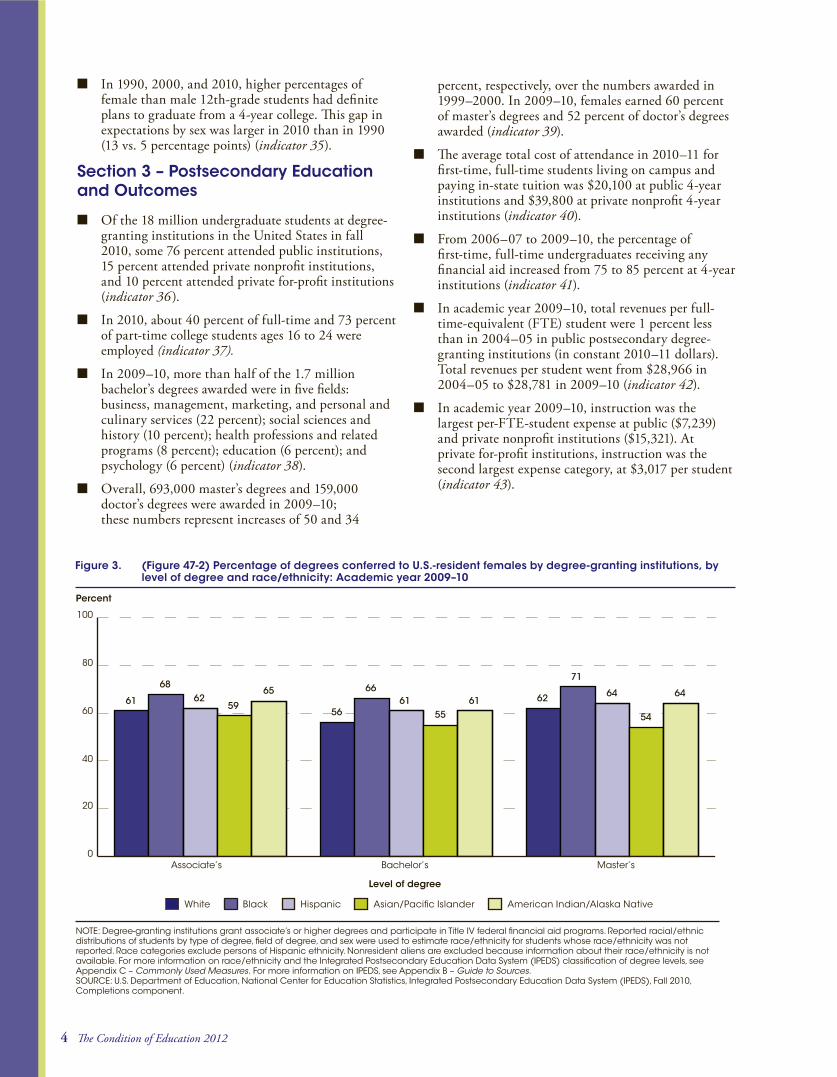
4 The Condition of Education 2012
■ In 1990, 2000, and 2010, higher percentages of female than male 12th-grade students had definite plans to graduate from a 4-year college. This gap in expectations by sex was larger in 2010 than in 1990 (13 vs. 5 percentage points) (indicator 35).
Section 3 – Postsecondary Education and Outcomes
■
■
■
■
Of the 18 million undergraduate students at degree-granting institutions in the United States in fall 2010, some 76 percent attended public institutions, 15 percent attended private nonprofit institutions, and 10 percent attended private for-profit institutions (indicator 36 ).
In 2010, about 40 percent of full-time and 73 percent of part-time college students ages 16 to 24 were employed (indicator 37).
In 2009–10, more than half of the 1.7 million bachelor’s degrees awarded were in five fields: business, management, marketing, and personal and culinary services (22 percent); social sciences and history (10 percent); health professions and related programs (8 percent); education (6 percent); and psychology (6 percent) (indicator 38).
Overall, 693,000 master’s degrees and 159,000 doctor’s degrees were awarded in 2009–10; these numbers represent increases of 50 and 34
percent, respectively, over the numbers awarded in 1999–2000. In 2009–10, females earned 60 percent of master’s degrees and 52 percent of doctor’s degrees awarded (indicator 39).
■
■
■
■
The average total cost of attendance in 2010–11 for first-time, full-time students living on campus and paying in-state tuition was $20,100 at public 4-year institutions and $39,800 at private nonprofit 4-year institutions (indicator 40).
From 2006–07 to 2009–10, the percentage of first-time, full-time undergraduates receiving any financial aid increased from 75 to 85 percent at 4-year institutions (indicator 41).
In academic year 2009–10, total revenues per full-time-equivalent (FTE) student were 1 percent less than in 2004–05 in public postsecondary degree-granting institutions (in constant 2010–11 dollars). Total revenues per student went from $28,966 in 2004–05 to $28,781 in 2009–10 (indicator 42).
In academic year 2009–10, instruction was the largest per-FTE-student expense at public ($7,239) and private nonprofit institutions ($15,321). At private for-profit institutions, instruction was the second largest expense category, at $3,017 per student (indicator 43).
Figure 3. (Figure 47-2) Percentage of degrees conferred to U.S.-resident females by degree-granting institutions, by level of degree and race/ethnicity: Academic year 2009–10
Associate’s Bachelor’s Master’s0
20
40
60
80
100
Percent
Level of degree
61
6862
59
65
56
6661
5561 62
71
64
54
64
White Black Hispanic Asian/Pacific Islander American Indian/Alaska Native
NOTE: Degree-granting institutions grant associate’s or higher degrees and participate in Title IV federal financial aid programs. Reported racial/ethnic distributions of students by type of degree, field of degree, and sex were used to estimate race/ethnicity for students whose race/ethnicity was not reported. Race categories exclude persons of Hispanic ethnicity. Nonresident aliens are excluded because information about their race/ethnicity is not available. For more information on race/ethnicity and the Integrated Postsecondary Education Data System (IPEDS) classification of degree levels, see Appendix C – Commonly Used Measures. For more information on IPEDS, see Appendix B – Guide to Sources. SOURCE: U.S. Department of Education, National Center for Education Statistics, Integrated Postsecondary Education Data System (IPEDS), Fall 2010, Completions component.
Introduction 5
Intro
du
ctio
n
■
■
■
Combining salary with benefits, faculty received an average total compensation package in academic year 2010–11 that was about 8 percent higher than the package they received in 1999–2000, after adjusting for inflation. In 2010–11, the average total compensation package for faculty was about $97,200, including $75,500 in salaries and $21,700 in benefits (indicator 44).
Approximately 56 percent of male and 61 percent of female first-time, full-time students who sought a bachelor’s degree at a 4-year institution in fall 2004 completed their degree at that institution within 6 years (indicator 45).
From academic years 1999–2000 to 2009–10, the number of postsecondary degrees conferred by private for-profit institutions increased by a larger percentage than the number conferred by public institutions and private nonprofit institutions; this was true for all levels of degrees (indicator 46 ).
■
■
■
Between academic years 1999–2000 and 2009–10, the number of degrees earned increased by 50 percent each for associate’s and master’s degrees, 33 percent for bachelor’s degrees, and 34 percent for doctor’s degrees. For all levels of degrees in 2009–10, females earned the majority of degrees awarded (indicator 47).
In 2011, some 32 percent of 25- to 29-year-olds had completed a bachelor’s degree or higher. From 1980 to 2011, the gap in the attainment of a bachelor’s degree or higher between Whites and Hispanics widened from 17 to 26 percentage points, and the gap between Whites and Blacks widened from 13 to 19 percentage points (indicator 48).
In 2010, young adults ages 25–34 with a bachelor’s degree earned 114 percent more than young adults without a high school diploma or its equivalent, 50 percent more than young adult high school completers, and 22 percent more than young adults with an associate’s degree (indicator 49).

6 The Condition of Education 2012
In the United States, the compulsory age for school attendance is determined by each state and the maximum age ranges between 16 and 18 years old (see indicator 1). Enrollment rates for 16- and 17-year-olds have exceeded 90 percent for the past twenty years. Over this same time period the percentage of 25- to 29-year-olds with at least a high school diploma or similar credential has exceeded 85 percent (see indicator 48).
In the last two decades certain aspects of the high school experience, and of the students themselves, have changed. Several indicators in this volume describe high school students in terms of enrollment, coursetaking, after-school activities (including work), achievement and other outcomes, and their expectations for the future. In this section, we take a closer look at high school in the United States by examining how these indicators have changed, or not, over the last 20 years. Note: For those indicators where 20 years of data are not available, the earliest data are used as the starting point.
High Schools and High School Enrollment
In 2010–11, there were approximately 14.9 million public school students in grades 9–12 (see indicator 3). Public school enrollment in grades 9–12 increased from 11.3 million in 1990–91 to just over 15 million through 2007–08, but declined through 2010–11. Public school enrollment in grades 9–12 is projected to continue declining through 2012–13. From 2013–14 through 2021–22, enrollment in grades 9–12 is projected to increase from 14.8 million to 15.5 million.
There has been variation in the increase in public high school enrollment by region. Between 1989–90 and 2010–11, the number of public school students in grades 9–12 increased by 14 percent in the Midwest, from 2.9 million to 3.3 million, by 19 percent in the Northeast, from 2.1 million students to 2.5 million, by 35 percent in the South, from 4.0 million to 5.4 million, and by 52 percent in the West, from 2.4 million to 3.7 million.
Of the 12.5 million public high school students in 1995–96, some 67 percent were White, 16 percent were Black, 12 percent were Hispanic, 4 percent were Asian, and 1 percent were American Indian/Alaska Native (see Projections of Education Statistics to 2020, NCES 2011-026, 5). In 2010–11, public school enrollment in grades 9–12 was 56 percent White, 17 percent Black, 20 percent Hispanic, 5 percent Asian, and 1 percent American Indian/Alaska Native. By 2019–20, it is projected that public high school enrollment will be 53 percent White, 16 percent Black, 23 percent Hispanic, 7 percent Asian, and 1 percent American Indian/Alaska Native.
There were 1.3 million private school students in grades 9–12 in the United States in 2009–10 (see indicator 5). These students accounted for 8 percent of total high school enrollment in that year. Of these students, 618,000 attended Catholic schools, 411,000 attended other religious schools, and 280,000 attended nonsectarian schools. In 1995–96, there were also 618,000 high school students attending Catholic schools. However, Catholic high school enrollment increased over the next six years to 641,000 in 2001–02, before declining back to the 1995–96 level. In the Northeast in 2009–10, some 13 percent of students in grades 9-12 attended private schools, compared to 8 percent of students in the Midwest, 7 percent of students in the South, and 6 percent of students in the West.
A Closer Look at High School Students in the United States Over the Last 20 Years
Figure CL-1. Actual and projected public school enrollment in grades 9 through 12: School years 1990–91 through 2021–22
1990–91 1995–96 2000–01 2005–06 2010–11 2015–16 2021–22
0
2,000
4,000
6,000
8,000
10,000
12,000
14,000
16,000
18,000
Enrollment (in thousands) Projected
15,515
14,955
11,341
School year
NOTE: The most recent year of actual data is 2010–11, and 2021–22 is the last year for which projected data are available. For more information on projections, see NCES 2012-044. Detail may not sum to totals because of rounding. Some data have been revised from previously published figures. SOURCE: U.S. Department of Education, National Center for Education Statistics, Common Core of Data (CCD), “State Nonfiscal Survey of Public Elementary/Secondary Education,” 1990–91 through 2010–11, and National Elementary and Secondary Enrollment Model, 1990–2010.

Introduction 7
Intro
du
ctio
n
In 2009–10, there were 27,500 secondary schools (schools that enrolled students in at least one of the grades between 9 and 12) in the United States (see indicator 12). Of these schools, some 23,300 were traditional public schools, some 1,300 were public charter schools, and 2,800 were private schools. High school students can also attend combined schools, with both elementary and secondary grade spans. In 2009–10, some 25 percent of public schools were secondary schools and 6 percent of public schools were combined schools. In that same year, some 8 percent of private schools were secondary schools and 28 percent were combined schools. In 2009–10, some 75 percent of private secondary schools were Catholic schools (see indicator 5).
Activities Inside School
In this section, we look at how activities inside high schools have changed in the last twenty years, including coursetaking, distance education, absenteeism, and school crime and safety.
In 1983, the National Commission on Excellence in Education, appointed by the U.S. Department of Education, released a report titled A Nation at Risk: The Imperative for Educational Reform. The report contained five recommendations to improve our education system, and the first recommendation was that “state and local high school graduation requirements be strengthened and that, at a minimum, all students seeking a diploma be required to lay the foundations in the Five New Basics by taking the following curriculum during their 4 years of high school: (a) 4 years of English; (b) 3 years of mathematics; (c) 3 years of science; (d) 3 years of social studies; and (e) one-half year of computer science.”
More recently, concerns have been raised that our postsecondary system is not producing enough graduates in fields focused on science, technology, engineering, and mathematics (STEM). For that to happen, high school students must take related course work to prepare them for rigorous college programs in STEM fields.
The percentage of high school graduates who took mathematics and science courses (or combinations of these courses) while in high school—namely, algebra I, geometry, algebra II/trigonometry, analysis/precalculus, statistics/probability, calculus, biology, chemistry, physics, both biology and chemistry, and all three science courses (biology, chemistry, and physics)—increased from 1990 to 2009 in all subjects except algebra I, for which the percentage decreased (see indicator 31). The decrease in the percentage of students taking Algebra I in high school is likely due to an increase in the percentage taking it prior to high school. For example, 7 percent of 1990 graduates had taken calculus in high school, compared with 16 percent of 2009 graduates, and 1 percent of 1990 graduates had taken statistics/probability, compared with 11 percent of graduates in 2009. In science, 49 percent of 1990 graduates had taken chemistry and 21 percent had taken physics. These percentages were 70 percent for chemistry and 36 percent for physics for 2009 graduates. Similarly, 19 percent of 1990 graduates had taken biology, chemistry, and physics in high school, compared with 30 percent of 2009 graduates.
A more recent change in coursetaking has been an increase in enrollments in distance education courses. Distance education courses are defined as courses that are credit-granting, technology-delivered, have either the instructor in a different location than the students and/
Figure CL-2. Percentage of high school graduates who completed selected mathematics and science courses in high school: 1990 and 2009
Algebra I Geometry1 Algebra II/trigonometry2
Analysis/precalculus2
Statistics/probability2
Calculus I Biology1 Chemistry1 Physics1 Biology andchemistry3
Biology,chemistry
andphysics4
0
20
40
60
80
100Percent
77
6964
88
54
76
13
35
1
117
16
9196
49
70
21
36
48
68
19
30
1990 2009Mathematics Science
1 Percentages are for students who earned at least one Carnegie credit. 2 Percentages are for students who earned at least one-half of a Carnegie credit. 3 Percentages are for students who earned at least one Carnegie credit each in biology and chemistry. 4 Percentages are for students who earned at least one Carnegie credit each in biology, chemistry, and physics. NOTE: For a transcript to be included in the analyses, it had to meet three requirements: (1) the graduate received either a standard or honors diploma, (2) the graduate’s transcript contained 16 or more Carnegie credits, and (3) the graduate’s transcript contained more than 0 Carnegie credits in English courses. For more information on race/ethnicity, free or reduced-price lunch, or locale, see Appendix C – Commonly Used Measures. For more information on the National Assessment of Educational Progress (NAEP) or the High School Transcript Study (HSTS), see Appendix B – Guide to Sources. SOURCE: U.S. Department of Education, National Center for Education Statistics, High School Transcript Study (HSTS), 1990 and 2009.
8 The Condition of Education 2012
or have the course content developed in, or delivered from, a different location than that of the students. There were over 1.3 million high school student enrollments in distance education courses in 2009–10, an increase of over 1 million enrollments from 2002–03, when there were 222,000 enrollments (see indicator 15).
In 2009–10, some 53 percent of school districts in the United States had high school students enrolled in distance education courses. Twenty-two percent of districts that offered distance education courses in 2009–10 reported that students enrolled in regular high school programs could take a full course load in an academic term using only distance education courses, while 12 percent reported that students could fulfill all high school graduation requirements using only distance education. In 2009–10, the most widely used technology for the instructional delivery of distance education courses was via the internet using asynchronous (not simultaneous) instruction, with 63 percent of districts that offered distance education courses reporting this as the prime delivery mode.
In 2009, when asked about their school attendance in the previous month, 38 percent of 12th-grade students reported perfect attendance, 39 percent reported missing 1–2 days, 15 percent reported missing 3–4 days, and 8 percent reported missing 5 or more days (see indicator 28). A higher percentage reported perfect attendance in 2009 than in 1992 (38 vs. 35 percent, respectively), and there were lower percentages in 2009 than in 1992 that reported missing 3–4 days (15 vs. 17 percent) and missing 5 or more days (8 vs. 9 percent).
In general, lower student performance is associated with higher student absenteeism. For 12th-grade students, there was no measureable difference in reading scores on the National Assessment of Educational Progress (NAEP) in either 1992 or 2009 between students who had perfect attendance (296 and 292, respectively) and those who reported missing 1–2 days in the previous month (295 and 290). However, in both years, these scores were higher than for those who reported missing 3–4 days (287 and 284, respectively) and 5 or more days (279 and 273).
Another factor in the school environment is safety, including the rate of nonfatal incidents of crime against students ages 12–18 at school. Nonfatal crime includes theft and all violent crime; violent crime includes serious violent crime (rape, sexual assault, robbery, and aggravated assault) and simple assault. The rate of nonfatal crime against students ages 12–18 declined between 1992 and 2010 (see Indicators of School Crime and Safety 2011, NCES 2012-002, 2.1). This pattern held for the following three subcategories: theft, violent crime, and serious violent crime. Specifically, from 1992 to 2010, the rate of nonfatal crime against students at school declined from 154 to 32 crimes per 1,000 students; the theft victimization rate, from 101 to 18 thefts per 1,000 students; the violent crime rate, from 53 to 14 crimes per
1,000 students; and the serious violent crime rate, from 8 to 4 crimes per 1,000 students.
Activities Outside School
In this section we look at two activities that high school students may or may not have participated in outside of school—extracurricular activities and work.
In 2010, some 40 percent of high school seniors participated on athletic teams as an extracurricular activity, which was higher than the percentage who participated in other school clubs/activities (32 percent), music/performing arts (23 percent), academic clubs (14 percent), newspaper/yearbook (10 percent), and student council/government (9 percent) (see indicator 27). Since 1990, there has been little change in the participation of high school seniors in extracurricular activities, other than an increase in the percentage that participate in athletics (from 36 to 40 percent).
In 2010, a higher percentage of female than male high school seniors participated on a newspaper/yearbook (13 vs. 6 percent), in music/performing arts (28 vs. 18 percent), in academic clubs (18 vs. 11 percent), in student council/government (12 vs. 6 percent), and in other school clubs/activities (41 vs. 24 percent), while a higher percentage of male than female high school seniors participated on athletic teams (44 vs. 36 percent). For each of these activities, other than athletics and student council/government, the participation rates for males and females were not measurably different in each group from 1990 to 2010. For the activity of athletics, the percentage of female high school seniors that participated was higher in 2010 (36 percent) than in 1990 (28 percent). For student council/government, the percentage of male high school seniors that participated was lower in 2010 (6 percent) than in 1990 (9 percent).
Between 1990 and 2010, the percentage of high school students ages 16 or older who were employed decreased from 32 percent to 16 percent (see indicator 30). For male high school students, the decrease was from 33 percent in 1990 to 14 percent in 2010. For females, the decrease was from 31 percent to 18 percent. In 1990, some 12 percent of high school students were employed less than 15 hours per week, and 20 percent were employed for 15 or more hours per week; these percentages declined to 7 percent and 8 percent, respectively, by 2010. The percentage of males who were employed for less than 15 hours per week declined from 11 percent in 1990 to 6 percent in 2010. For females, the percentages who were employed less than 15 hours per week declined from 12 percent to 8 percent over the same time period. For male students employed 15 or more hours per week, the decline was from 21 percent in 1990 to 7 percent in 2010; for females, some 18 percent were employed 15 or more hours per week in 1990 and 9 percent were in 2010.
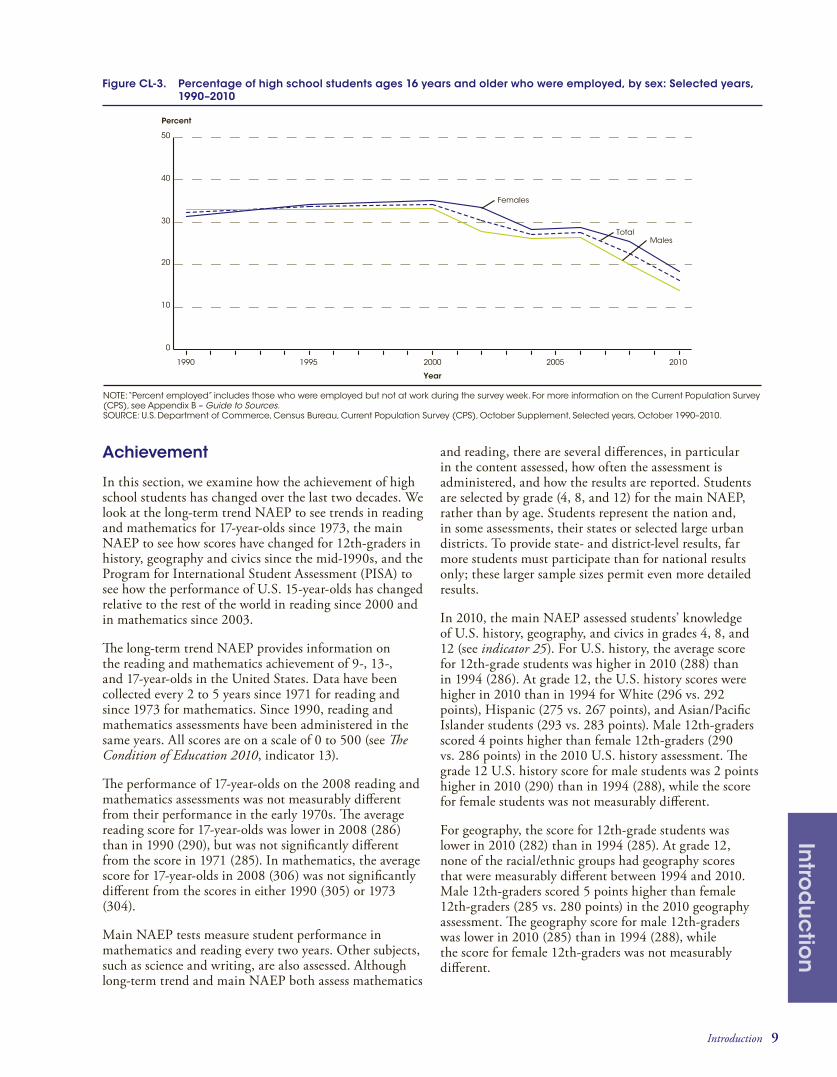
Introduction 9
Intro
du
ctio
n
Figure CL-3. Percentage of high school students ages 16 years and older who were employed, by sex: Selected years, 1990–2010
1990 1995 2000 2005 2010
0
10
20
30
40
50
Percent
Year
MalesTotal
Females
NOTE: “Percent employed” includes those who were employed but not at work during the survey week. For more information on the Current Population Survey (CPS), see Appendix B – Guide to Sources. SOURCE: U.S. Department of Commerce, Census Bureau, Current Population Survey (CPS), October Supplement, Selected years, October 1990–2010.
Achievement
In this section, we examine how the achievement of high school students has changed over the last two decades. We look at the long-term trend NAEP to see trends in reading and mathematics for 17-year-olds since 1973, the main NAEP to see how scores have changed for 12th-graders in history, geography and civics since the mid-1990s, and the Program for International Student Assessment (PISA) to see how the performance of U.S. 15-year-olds has changed relative to the rest of the world in reading since 2000 and in mathematics since 2003.
The long-term trend NAEP provides information on the reading and mathematics achievement of 9-, 13-, and 17-year-olds in the United States. Data have been collected every 2 to 5 years since 1971 for reading and since 1973 for mathematics. Since 1990, reading and mathematics assessments have been administered in the same years. All scores are on a scale of 0 to 500 (see The Condition of Education 2010, indicator 13).
The performance of 17-year-olds on the 2008 reading and mathematics assessments was not measurably different from their performance in the early 1970s. The average reading score for 17-year-olds was lower in 2008 (286) than in 1990 (290), but was not significantly different from the score in 1971 (285). In mathematics, the average score for 17-year-olds in 2008 (306) was not significantly different from the scores in either 1990 (305) or 1973 (304).
Main NAEP tests measure student performance in mathematics and reading every two years. Other subjects, such as science and writing, are also assessed. Although long-term trend and main NAEP both assess mathematics
and reading, there are several differences, in particular in the content assessed, how often the assessment is administered, and how the results are reported. Students are selected by grade (4, 8, and 12) for the main NAEP, rather than by age. Students represent the nation and, in some assessments, their states or selected large urban districts. To provide state- and district-level results, far more students must participate than for national results only; these larger sample sizes permit even more detailed results.
In 2010, the main NAEP assessed students’ knowledge of U.S. history, geography, and civics in grades 4, 8, and 12 (see indicator 25). For U.S. history, the average score for 12th-grade students was higher in 2010 (288) than in 1994 (286). At grade 12, the U.S. history scores were higher in 2010 than in 1994 for White (296 vs. 292 points), Hispanic (275 vs. 267 points), and Asian/Pacific Islander students (293 vs. 283 points). Male 12th-graders scored 4 points higher than female 12th-graders (290 vs. 286 points) in the 2010 U.S. history assessment. The grade 12 U.S. history score for male students was 2 points higher in 2010 (290) than in 1994 (288), while the score for female students was not measurably different.
For geography, the score for 12th-grade students was lower in 2010 (282) than in 1994 (285). At grade 12, none of the racial/ethnic groups had geography scores that were measurably different between 1994 and 2010. Male 12th-graders scored 5 points higher than female 12th-graders (285 vs. 280 points) in the 2010 geography assessment. The geography score for male 12th-graders was lower in 2010 (285) than in 1994 (288), while the score for female 12th-graders was not measurably different.
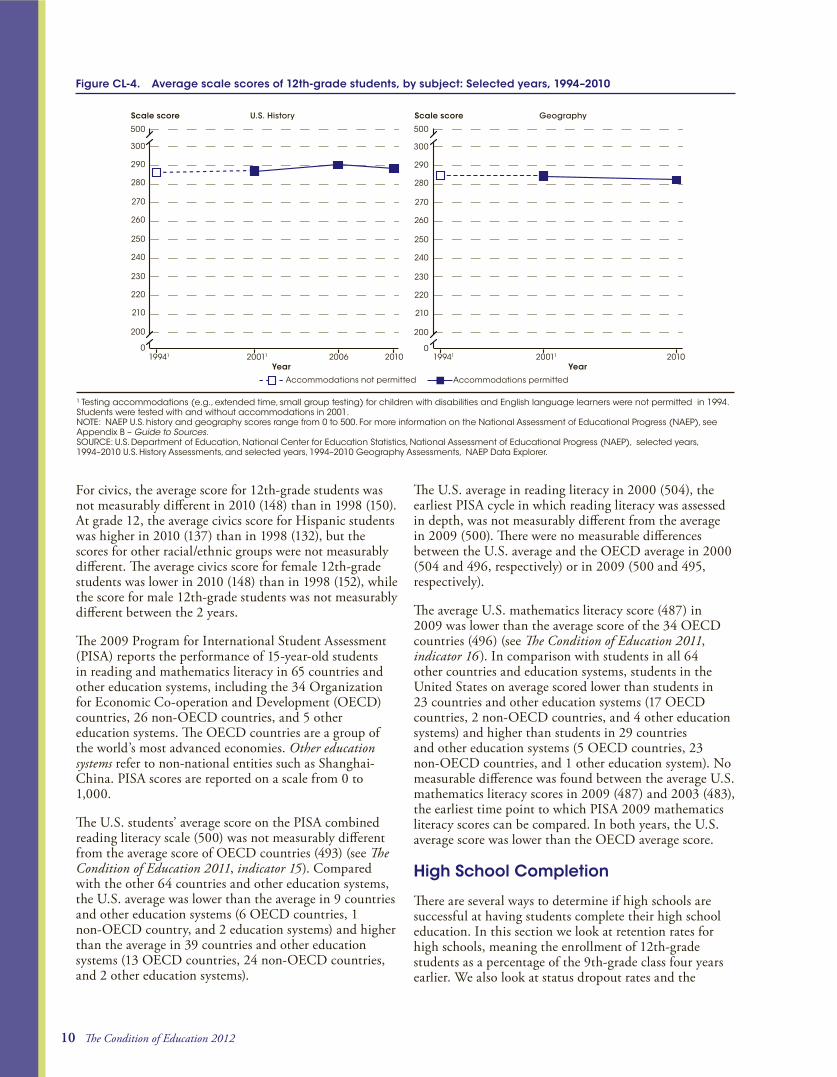
10 The Condition of Education 2012
Figure CL-4. Average scale scores of 12th-grade students, by subject: Selected years, 1994–2010
19941 20011 2006 20100
200
210
220
230
240
250
260
270
280
290
300
500
Scale score U.S. History Geography
Year19941 20011 2010
Scale score
0
200
210
220
230
240
250
260
270
280
290
300
500
Accommodations not permitted Accommodations permitted
Year
¹ Testing accommodations (e.g., extended time, small group testing) for children with disabilities and English language learners were not permitted in 1994. Students were tested with and without accommodations in 2001. NOTE: NAEP U.S. history and geography scores range from 0 to 500. For more information on the National Assessment of Educational Progress (NAEP), see Appendix B – Guide to Sources. SOURCE: U.S. Department of Education, National Center for Education Statistics, National Assessment of Educational Progress (NAEP), selected years, 1994–2010 U.S. History Assessments, and selected years, 1994–2010 Geography Assessments, NAEP Data Explorer.
For civics, the average score for 12th-grade students was not measurably different in 2010 (148) than in 1998 (150). At grade 12, the average civics score for Hispanic students was higher in 2010 (137) than in 1998 (132), but the scores for other racial/ethnic groups were not measurably different. The average civics score for female 12th-grade students was lower in 2010 (148) than in 1998 (152), while the score for male 12th-grade students was not measurably different between the 2 years.
The 2009 Program for International Student Assessment (PISA) reports the performance of 15-year-old students in reading and mathematics literacy in 65 countries and other education systems, including the 34 Organization for Economic Co-operation and Development (OECD) countries, 26 non-OECD countries, and 5 other education systems. The OECD countries are a group of the world’s most advanced economies. Other education systems refer to non-national entities such as Shanghai-China. PISA scores are reported on a scale from 0 to 1,000.
The U.S. students’ average score on the PISA combined reading literacy scale (500) was not measurably different from the average score of OECD countries (493) (see The Condition of Education 2011, indicator 15). Compared with the other 64 countries and other education systems, the U.S. average was lower than the average in 9 countries and other education systems (6 OECD countries, 1 non-OECD country, and 2 education systems) and higher than the average in 39 countries and other education systems (13 OECD countries, 24 non-OECD countries, and 2 other education systems).
The U.S. average in reading literacy in 2000 (504), the earliest PISA cycle in which reading literacy was assessed in depth, was not measurably different from the average in 2009 (500). There were no measurable differences between the U.S. average and the OECD average in 2000 (504 and 496, respectively) or in 2009 (500 and 495, respectively).
The average U.S. mathematics literacy score (487) in 2009 was lower than the average score of the 34 OECD countries (496) (see The Condition of Education 2011, indicator 16 ). In comparison with students in all 64 other countries and education systems, students in the United States on average scored lower than students in 23 countries and other education systems (17 OECD countries, 2 non-OECD countries, and 4 other education systems) and higher than students in 29 countries and other education systems (5 OECD countries, 23 non-OECD countries, and 1 other education system). No measurable difference was found between the average U.S. mathematics literacy scores in 2009 (487) and 2003 (483), the earliest time point to which PISA 2009 mathematics literacy scores can be compared. In both years, the U.S. average score was lower than the OECD average score.
High School Completion
There are several ways to determine if high schools are successful at having students complete their high school education. In this section we look at retention rates for high schools, meaning the enrollment of 12th-grade students as a percentage of the 9th-grade class four years earlier. We also look at status dropout rates and the

Introduction 11
Intro
du
ctio
n
averaged freshman graduation rate (AFGR), and how both of these have changed over time.
Public high schools with senior classes that are substantially smaller than the entering class 4 years earlier are referred to as low-retention high schools. Low-retention high schools are defined here as those with a senior class size that is 70 percent or less of the size of the freshman class that had entered 4 years earlier (see indicator 16 ). To be included, a high school must have had at least 10 seniors in the given year and at least 10 freshman 4 years earlier. In 2009–10, there were approximately 15,500 regular public high schools in the United States with at least 10 seniors that had at least 10 freshmen 4 years earlier.
In 1990–91, some 24 percent of regular public high schools (or 3,100 schools) were low-retention schools (5 percent retained between 10 and 50 percent of their students and 19 percent retained between 51 and 70 percent). The percentage of low-retention high schools declined to 22 percent in 1992–93 (2,800 high schools), then increased to 32 percent (4,600 high schools) in 2000–01 before declining to approximately 26 percent in 2005–06. The percentage then remained relatively sat
26 percent through 2009–10, when 4,100 high schools met the definition. Approximately 518,000 high school seniors attended low-retention high schools in 1990–91, compared to 845,000 in 2000–01 and 755,000 in 2009–10.
The status dropout rate represents the percentage of 16- through 24-year-olds who are not enrolled in school and have not earned a high school credential (either a diploma or an equivalency credential such as a General Educational Development [GED] certificate). Based on the Current Population Survey (CPS), the status dropout rate declined from 12 percent in 1990 to 7 percent in 2010 (see indicator 33). Between 1990 and 2010, status dropout rates also declined for Whites (from 9 percent to 5 percent), Blacks (from 13 percent to 8 percent), and Hispanics (from 32 percent to 15 percent). Over this period, the status dropout rate was generally lowest for Asians/Pacific Islanders, followed by Whites, Blacks, and Hispanics. The gap between Whites and Hispanics narrowed from 23 percentage points in 1990 to 10 percentage points in 2010; the gaps between Whites and Blacks in these two years were not measurably different (4 vs. 3 percentage points).
Figure CL-5. Status dropout rates of 16- through 24-year-olds in the civilian, noninstitutionalized population, by race/ethnicity: October Current Population Survey (CPS) 1990–2010
1990 1995 2000 2005 2010
0
10
20
30
40
50
Percent
Year
Hispanic
Black White
Asian/Pacific Islander
American Indian/Alaska Native
NOTE: Data for American Indians/Alaska Natives in 1999 have been suppressed due to unsestimates. Race categories exclude persons of Hispanic ethnicity. For more information on race/ethnicity and the status dropout rate, see Appendix C – Commonly Used Measures. For more information on the Current Population Survey (CPS), see Appendix B – Guide to Sources. SOURCE: U.S. Department of Commerce, Census Bureau, Current Population Survey (CPS), October Supplement, 1990–2010.
12 The Condition of Education 2012
The averaged freshman graduation rate measures the percentage of public high school students who graduate on time with a regular diploma (see indicator 32). To do so, it uses an estimate of the number of regular diplomas issued in a given year divided by an estimate of the averaged enrollment base for the freshman class 4 years earlier. For each year, the averaged freshman enrollment base is the sum of the number of 8th-graders 5 years earlier, the number of 9th-graders 4 years earlier (when current-year seniors were freshmen), and the number of 10th-graders 3 years earlier, divided by 3. The intent of this averaging is to account for the high rate of grade retention in the freshman year, which adds 9th-grade repeaters from the previous year to the number of students in the incoming freshman class each year.
The overall averaged freshman graduation rate was higher for the graduating class of 2008–09 (75.5 percent) than it was for the graduating class of 1990–91 (73.7 percent). However, from school year 1990–91 to 1995–96, the overall averaged freshman graduation rate decreased from 73.7 percent to 71.0 percent. In terms of changes by state, there was an increase in the graduation rate in 30 states and the District of Columbia from school year 1990–91 to 2008–09. In 1 state (Vermont), the rate increased by more than 10 percentage points; in 6 others (Louisiana, Missouri, New Hampshire, New York, Tennessee, and Wisconsin) and the District of Columbia, rates increased by more than 5 percentage points. The graduation rate decreased from 1990–91 to 2008–09 in 20 states (Alaska, Arizona, Arkansas, Connecticut, Georgia, Hawaii, Indiana, Kansas, Maine, Minnesota, Mississippi, Montana, Nebraska, Nevada, New Mexico, North Dakota, South Carolina, South Dakota, Washington, and Wyoming), with decreases of greater than 5 percentage points occurring in New Mexico (5.3 percent), Wyoming (6.0 percent), and Nevada (20.7 percent).
Postsecondary Plans
Finally, we look at the postsecondary plans for high school students, including the rate at which high school graduates enroll in a 2-year or 4-year college within a year of completing high school, as well as the changing expectations for the attainment of a college degree.
The immediate college enrollment rate is defined as the percentage of high school completers of a given year who enroll in 2- or 4-year colleges in the fall immediately after completing high school. Between 1990 and 2010, the immediate college enrollment rate ranged from 60 to 70 percent (see indicator 34). This rate increased from 1990 to 1997 (60 to 67 percent), declined from 1997 to 2001 (to 62 percent), then increased from 2001 to 2009 (to 70 percent). The rate remained steady from 2009 to 2010.
In each year between 1990 and 2010, the immediate college enrollment rates of high school completers from low- and middle-income families were lower than those of
high school completers from high-income families. Most recently, in 2010, the immediate college enrollment rate of high school completers from low-income families was 52 percent, 30 percentage points lower than the rate of high school completers from high-income families (82 percent). The immediate college enrollment rate of high school completers from middle-income families (67 percent) also trailed the rate of their peers from high-income families by 15 percentage points. In 1990, these gaps were 32 percentage points between high school completers from high-income and those from low-income families, and 22 percentage points between high school completers from high-income and those from middle-income families.
Between 1990 and 2010, immediate college enrollment rates increased for both males and females: the rate for males increased from 58 to 63 percent and that for females, from 62 to 74 percent. Overall, there was no measurable difference in the immediate college enrollment rates between males and females in 1990. By 2010, the immediate college enrollment rate was higher for females than for males. Thus, the enrollment pattern has shifted over time to higher enrollment rates for females than males.
The percentage of 12th-grade students who had definite plans to graduate from a 4-year college was higher in 2010 (60 percent) than in 1990 (48 percent) (see indicator 35). In 2010, the percentage of 12th-grade males with plans to graduate from a 4-year college was higher than the percentage in 1990 (53 vs. 46 percent); for female 12th-graders, the percentage with plans to graduate from college was also higher in 2010 than in 1990 (66 vs. 51 percent). In both years, higher percentages of female than male 12th-graders planned to graduate from college. This gap in expectations regarding college completion by sex was larger in 2010 than in 1990 (13 vs. 5 percentage points).
The percentages of 12th-grade students who planned to graduate from a 4-year college were higher in 2010 than in 1990 at each level of parents’ educational attainment (46 vs. 32 percent for those whose parents attained high school completion or less, 57 vs. 47 percent for those whose parents attained some college, 66 vs. 58 percent for those whose parents attained a bachelor’s degree, and 78 vs. 72 percent for those whose parents attained a graduate or professional degree). In each year shown, higher percentages of 12th-graders whose parents had more education planned to graduate from college when compared with their peers whose parents had less education. For example, in 2010, some 78 percent of 12th-graders whose parents had a graduate or professional degree planned to graduate from college, compared with 46 percent of 12th-graders whose parents had completed a high school education or less. Also in that year, a higher percentage of 12th-graders whose parents had a bachelor’s degree (66 percent) planned to graduate from college than their peers whose parents had completed high school

Introduction 13
Intro
du
ctio
n
Figure CL-6. Percentage of 12th-grade students with definite plans to graduate from a 4-year college, by parents’ highest level of education: 1990, 2000, and 2010
High schoolcompletion or less
Some college Bachelor’s degree Graduate or professionaldegree after college
0
20
40
60
80
100
Percent
Parents’ highest level of education
32
4046 47
55 57 5862
66
7276 78
1990 2000 2010
NOTE: Percentages reflect students who indicated that they “definitely will” graduate from a 4-year college. Parents’ highest level of education reflects a combination of responses for father’s and mother’s level of education. For more information on parents’ education, please see Appendix C – Commonly Used Measures. For more information on the Monitoring the Future study, please see Appendix B – Guide to Sources. SOURCE: University of Michigan, Institute for Social Research, Monitoring the Future, 1990, 2000, and 2010, http://www.monitoringthefuture.org/.
or less. However, the gaps in expectations regarding college completion among these groups of 12th-graders were smaller in 2010 than in 1990. In 2010, there was a 32 percentage point difference between those whose parents had completed high school or less versus those whose parents had a graduate or professional degree. In
1990, this difference was 40 percentage points. Similarly, in 1990 there was a 26 percentage point difference in expectations regarding college degree completion between those 12th-graders whose parents had a bachelor’s degree and those whose parents had completed high school or less.