The Condensed Phase The kinetic theory of gases presents a microscopic model for the behavior of...
28
The Condensed Phase The kinetic theory of gases presents a microscopic model for the behavior of gases. As pressure increases or temperature decreases, gas molecules begin to feel the presence of other gas molecules and interactions between them cannot be ignored. As pressure on a gas is increased, or the temperature of the gas is decreased, the gas liquefies forming a more ordered phase, the liquid phase. Further increase in P or drop in T results in a still more ordered solid phase.
-
Upload
cynthia-stone -
Category
Documents
-
view
218 -
download
1
Transcript of The Condensed Phase The kinetic theory of gases presents a microscopic model for the behavior of...

The Condensed Phase
The kinetic theory of gases presents a microscopic model for the behavior of gases.
As pressure increases or temperature decreases, gas molecules begin to feel the presence of other gas molecules and interactions between them cannot be ignored.
As pressure on a gas is increased, or the temperature of the gas is decreased, the gas liquefies forming a more ordered phase, the liquid phase. Further increase in P or drop in T results in a still more ordered solid phase.

Non-bonding Interactions between molecules:
Intermolecular interactions
NON-BONDING interactions are weaker than bonding interactions (covalent and ionic)
Yet, these interactions are critical in defining physical properties of compounds.

The relative energy of two molecules interacting with each other can be plotted as a function of the distance between the two molecules - Potential energy curves.
Pot
entia
l ene
rgy
(kJ/
mol
)
Separation (Å)

Types of Nonbonding Interactions
1) Dipole-Dipole interactions
Interactions between polar molecules - e.g. between two H2O molecules
2) Ion-Dipole interactionsInteractions between an ion and a polar molecule - e.g. dissolution of NaCl in water.

3) Induced Dipole interactionExample: a water molecule approaching an O2 molecule, can induce a temporary dipole in the O2
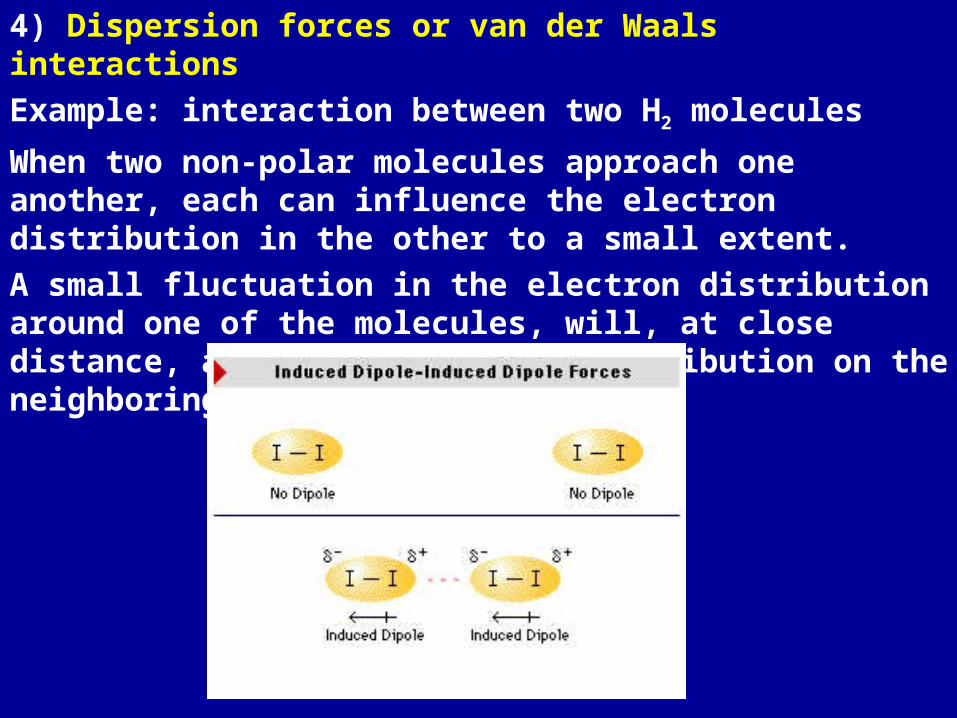
4) Dispersion forces or van der Waals interactions
Example: interaction between two H2 molecules
When two non-polar molecules approach one another, each can influence the electron distribution in the other to a small extent.
A small fluctuation in the electron distribution around one of the molecules, will, at close distance, affect the electron distribution on the neighboring molecule.

Hydrogen-bonding: a special case of dipole-dipole interaction
Hydrogen bonds form when a H atom is covalently bonded to a N, O, or F atom and interacts with the lone electron pair on the N, O or F atom in an adjacent molecule.
H O H H F
H
HH N
water Hydrogen fluoride ammonia

Hydrogen bonds affect physical properties of a molecule,
boiling point (oC)
H2O 100
HF 20
NH3 -34
HCl -85
CH4 -161

Hydrogen bonds in liquid water

Consequences of hydrogen bonding in water
Ice floats because hydrogen bonds hold water molecules further apart in a solid than in a liquid - density of ice is less than density of water
Density of ice at 0oC - 0.9997 g/ml
Density of water at 0oC - 0.9170 g/ml

liquid water solid water
http://www.nyu.edu/pages/mathmol/modules/water/info_water.html

Water has a high specific heat index.
It takes much more heat to raise the temperature of a volume of water than the same volume of air.
Some Consequences:Water is used as a coolant
Effects global climates and rates of global climate change - changes in temperatures are gradual

Water has a high surface tension
surface tension (dynes/cm at 20oC)
Water 73
Methanol 22
Ethanol 22
Ether 17
The surface tension makes air-water boundaries distinctive microhabitats.

“Universal” Solvent
Water can dissolve ionic and polar compounds

Polar compounds in water

H-bonding in DNA
H-bonding defines the shape of the molecule
for example, the overall shape of proteins, the double-helix in DNA.
http://www.umass.edu/microbio/chime/dna/fs_pairs.htm
http://michele.usc.edu/105b/biochemistry/dna.html

Liquid Crystals
http://invsee.asu.edu/nmodules/liquidmod/spatial.html

Vaporization and Condensation
Molecules in a liquid are in constant motion; some moving faster, others slower.
Those molecules with enough kinetic energy escape from the liquid surface, i.e. vaporize.

If the container is kept open, vaporization continues until no more liquid remains; molecules escape from the liquid and heat flows in from the surroundings, replacing the energy lost to vaporization and maintaining the rate of vaporization.
Molecules with higher energy are able to overcome interactions between other molecules

Condensation: When molecules in the gas phase collide with the liquid surface, they loose energy and return to the liquid.
At some point the rate of vaporization and the rate of condensation become equal and the system is at equilibrium (a dynamic equilibrium)
The partial pressure of the vapor above the liquid established at equilibrium is called the equilibrium vapor pressure or the vapor pressure.


Boiling Point - the temperature at which the vapor pressure of the liquid equals the atmospheric pressure.
Normal boiling point - temperature at which the vapor pressure equals 1 atm.
If the external pressure is reduced, the boiling point decreases (e.g. at high altitudes).
If the external pressure increases,the boiling point increases (e.g. a pressure cooker).
Melting point - temperature at which a substance turns from solid to liquid.
At the melting point, the solid and liquid are in equilibrium and co-exist at this temperature

Phase Transitions
When a compound changes its state from a solid to a liquid or a liquid to a gas, it is said to have undergone a phase change or a phase transition.
Changes in temperature and pressure cause phase transitions

Fusion or melting solid --> liquid
Vaporization liquid --> gas
Sublimation solid --> gas
At the melting point, boiling point or sublimation point of the substance, temperature remains the same even if the sample is heated
These points correspond to phase changes, and the energy supplied is being used by the substance to undergo the phase change.
Once the phase change is complete, and if heat is still applied, then the temperature increases.

Phase Diagrams
Plots of pressure vs temperature showing changes in the phase of a substance is called a PHASE DIAGRAM.
solid
liquid
gas

1) Any point along a curve represents an equilibrium between two phases. Any point not on a curve corresponds to a single phase.
2)The line from A to B is the vapor pressure curve of the liquid. The vapor pressure ends at the critical point (B), beyond which a gas cannot be compressed to a liquid - a supercritical fluid exists.
solid
liquid
gas

3) Line from A to C represents variation in the vapor pressure of the solid as it sublimes at different temperatures.
4) Line from A to D represents change in melting point of the solid with increasing pressure
5) Point A, where the three curves intersect is called the TRIPLE point, which corresponds to the pressure and temperature at which all three phases coexist.
solid
liquid
gas

Phase diagram of water and CO2
Note: for CO2 freezing point increases with increasing pressure, but for H2O freezing point decreases with increasing pressure.