The compound 33i, a new SIRT2 inhibitor, as a potential treatment … · 2020. 7. 21. · 2016-33)....
174
Facultad de Farmacia y Nutrición The compound 33i, a new SIRT2 inhibitor, as a potential treatment for Alzheimer’s disease Teresa Díaz Perdigón Pamplona, 2019
Transcript of The compound 33i, a new SIRT2 inhibitor, as a potential treatment … · 2020. 7. 21. · 2016-33)....
Facultad de Farmacia y Nutrición
The compound 33i, a new SIRT2 inhibitor, as a potential
treatment for Alzheimer’s disease
Teresa Díaz Perdigón
Pamplona, 2019

Facultad de Farmacia y Nutrición
Memoria presentada por Dña. Teresa Díaz Perdigón para aspirar al grado de Doctor por la Universidad de Navarra.
Fdo. Teresa Díaz Perdigón
El presente trabajo ha sido realizado bajo nuestra dirección en el Departamento de Farmacología y Toxicología de la Facultad de Farmacia y Nutrición de la Universidad de Navarra y autorizamos su presentación ante el Tribunal que lo ha de juzgar.
VºBº Director VºBº Co-Director
Dra. Elena Puerta Ruiz de Azúa Dra. Rosa María Tordera Baviera


Este trabajo ha sido posible gracias a la financiación del Ministerio de Economía y Competitividad (SAF2011-27910 y SAF2017-7595-R) y la Universidad de Navarra (PIUNA-2016-33). La investigación que ha dado lugar a estos resultados ha sido impulsada por la beca predoctoral 2015-2019 de la Asociación de Amigos y la ayuda predoctoral de movilidad internacional del departamento de Educación del Gobierno de Navarra 2018-2019.


A mi familia


“Piensa, cree, sueña y atrévete”
Walt Disney


Acknowledgments
Con estas breves palabras, deseo expresar mi más sincero agradecimiento a las
personas que me han acompañado a lo largo de este camino, y que de una forma u
otra me han ayudado a que esta tesis doctoral sea una realidad. Gracias a todos, ya
que sin vosotros no hubiera sido posible alcanzar esta meta.
En primer lugar, me gustaría brindar un agradecimiento especial a la Universidad
de Navarra por formar a personas y a profesionales, porque independientemente de la
facultad o carrera, todos los que salen de Universidad de Navarra tienen un sello
especial. A continuación, quiero expresar mi gratitud a la Asociación de Amigos de la
Universidad de Navarra por la ayuda predoctoral que ha hecho posible la realización
de este proyecto. Pero en especial, quiero agradecer sinceramente al Departamento
de Farmacología y Toxicología por darme la oportunidad de desarrollar este trabajo de
investigación e iniciar mi camino en la carrera investigadora y docente. Gracias “depar”
porque creo que poca gente tiene la suerte de trabajar en un departamento con gente
tan talentosa, trabajadora, pero a la vez tan cercana. Ha sido una suerte pasar estos
cuatro años con vosotros.
A mis directoras, la Dra. Elena Puerta Ruiz de Azua y la Dra. Rosa Tordera por la
oportunidad de realizar esta tesis doctoral. Gracias por vuestra ayuda desde el
comienzo, vuestra paciencia, profesionalidad, simpatía y cercanía. Gracias por
transmitir vuestro entusiasmo por la ciencia, he aprendido mucho de vosotras. Sin
vuestra ayuda y vuestros consejos esto no hubiera sido posible. Muchísimas gracias,
sois un ejemplo a seguir.
A la Dra. María Javier Ramírez, gracias por tu experiencia, conocimiento e interés.
Maite, gracias por tu alegría, entusiasmo y predisposición a ayudar en todo momento.
A Guadalupe y a Pepe gracias por vuestro buen carácter, vuestra prudencia y
optimismo constante.
A Sandra, por ser el alma del departamento. La alegría del departamento se debe
en gran parte a ti, no solo por cómo acoges y enseñas a los nuevos, sino por el cariño
con el que nos tratas a todos. Gracias por estar ahí con una sonrisa todos los días del
año, mi paso por el departamento no hubiese sido el mismo sin ti Sandri.

Acknowledgments
Me gustaría dar un agradecimiento especial a Borja. Son innumerables los
momentos compartidos y sobretodo insuperables las risas. Gracias por ser mi mano
derecha en todo este camino, por todas las horas compartidas “back to back”, la
tramudez, las mofadas y porque la vida son dos días y hay que disfrutarlos. Creo que
no podría haber tenido mejor compañero y amigo.
Quisiera agradecer a Bea Marcos por su cercanía y también por su paciencia para
iniciarnos en la docencia. Que seamos capaces de dar prácticas y hablar en público,
utilizando la terminología adecuada y sin ponernos nerviosos al final del doctorado es
gracias a ti. Realmente debería agradecer al cuartito por ser una extensión del tuyo.
Por lo tanto, gracias cuartito por haberme permitido tener tantas conversaciones trans-
pasillo.
No me puedo olvidar de todos los que han pasado por el departamento y a los
nuevos que van llegando. Gracias Mikel, Xabi, Merche, Irene, Silvia, Hilda, Carmen,
Frauca, Manu, María y Carlos ya que entre todos sumamos “momenticos memorables
e irrepetibles”.
Al Prof. Suzuki, de la Universidad de Medicina de la Prefectura de Kyoto, Japón,
por haberme donado amablemente, cada vez que ha sido necesario, el compuesto 33i,
utilizado en este trabajo.
A el departamento de Toxicología y al equipo de investigación de Mar Cuadrado-
Tejedor y a Ana García-Osta por la ayuda, conocimientos y la amabilidad recibida,
siempre, por parte de todos.
Por supuesto gracias a todos y cada uno de los huérfanos, gracias a Marta Pai,
Marta Jaén, Diego, Adri, Alba, María y en especial a Marcos. Ha sido toda una suerte
conoceros, sin duda alguna la gran parte de los buenos momentos pasados durante la
tesis os los tengo que agradecer a vosotros, al Pio y a la Quinta. Dentro de unos años
recordaremos que, gracias a nosotros, David construyó un imperio mientras nosotros
solucionábamos la ciencia y el mundo.
A Lucía y a Marina. No hay ninguna duda de que “las spicy girls“ fue amor a
primera vista. Tenemos que dar las gracias a San Fermín y a la chica yeyé por el inicio
de esa amistad y sobre todo por lo rápido y bien que conectamos todas. Aún nos
queda mucho por vivir juntas.

Acknowledgments
A Lázcoz, mi “soulmate” since 2012. ¿Puede el Eramus convertir a una persona
que apenas conocías en una persona imprescindible en tu vida? La respuesta es que
claramente sí. Gracias por escucharme, dar los mejores consejos, estar dispuesta a
cualquier aventura y ver siempre el vaso medio lleno.
A las de siempre, Bea, Laura y Pili. Es tan larga nuestra amistad que este párrafo
se queda corto. Sois y habéis sido mis grandes apoyos, de esas amigas que
multiplican las sonrisas y reducen las tristezas. El haber ido creciendo y descubriendo
la vida juntas hace que nos conozcamos como hermanas. Si mi infancia y juventud ha
sido un privilegio os lo debo vosotras. Estar con vosotras SIEMPRE es una buena
opción. A Ángela y Feta, gracias por los años de amistad y por aportar ese toque de
humor y alegría a la vida. Lo que Miravalles unió que no lo separe nadie.
Soco, gracias por tu humor, paciencia y tu capacidad de escuchar. Gracias por
hacer que ir a casa al mediodía sea un planazo y tan apetecible.
Tío Luis, gracias por tu cariño y haber sido una persona tan importante para esta
familia. Gracias por las nocheviejas y los veranos juntos. Pero sobre todo gracias por
tus historietas y consejos, de valor incalculables.
A la tía Mª José y al tío Miguel por todo el cariño y apoyo. Gracias por estar
siempre pendientes.
Abuelos Carmelo y Carmen. Gracias por ser la bondad personificada y
trasmitirnos valores de humildad y sencillez. Porque teníais razón en que la felicidad
está en las pequeñas cosas, en los pequeños detalles y gestos. Gracias por haber
estado siempre pendientes con mucho amor y cariño. Estoy segura que una ayudita
desde el cielo mediada por San Antonio ha hecho que esté hoy aquí.
Yaya, fuiste pionera en tus tiempos y gracias a ti ya somos tres generaciones de
farmacéuticos. Eres un pilar fundamental para mí. Soy plenamente consciente de la
gran suerte que he tenido de tener a una abuela que da tanto cariño y amor
incondicional. Te quiero.
Acknowledgments
Marina, no puedo estar más agradecida a que me destronases como hija única.
Debemos agradecer a papá y a mamá la simbiosis vital que hemos conseguido. Si
tengo que enumerar momentos que hayan marcado mi vida, formas parte de todos
ellos. Hay poca gente en el mundo que tenga tu generosidad, tu humor y ganas de
hacer el bien. Es un auténtico honor tenerte como referente en mi vida. Sigamos
coleccionando momentos inolvidables juntas.
Esta tesis está dedicada en especial a mis padres, por vuestro amor
incondicional. Gracias por educarnos en valores y recordarnos que la familia es el bien
más preciado y que hay que cuidarlo. Por apoyarnos, por darnos los mejores consejos,
en definitiva, por ser nuestros referentes. Gracias por haber sacado lo mejor de cada
una de nosotras e inculcarnos el sentimiento del esfuerzo. Sé que el mandarnos al
extranjero en ocasiones no fue fácil, pero creo que es el mejor regalo que nos habéis
dado. Gracias por crear hogar. Sois el mejor ejemplo a seguir.


Table of contents
INDEX
INTRODUCTION ........................................................................................................................... 1
1. Epigenetics ....................................................................................................................... 3
2. Sirtuins .............................................................................................................................. 6
3. Sirtuin 2 (SIRT2) ............................................................................................................... 9
3.1. Role of SIRT2 in aging and inflammation .......................................................................... 10
3.2. Role of SIRT 2 neurodegenerative diseases ..................................................................... 11
3.3. Role of SIRT2 in Alzheimer´s disease ............................................................................... 13
3.4. SIRT2 inhibitors ................................................................................................................. 18
4. Animal models of Alzheimer’s disease ........................................................................... 20
4.1. The SAMP8 model ............................................................................................................ 20
4.2. The APP/PS1 model .......................................................................................................... 22
HYPOTHESIS AND AIMS .......................................................................................................... 25
EXPERIMENTAL DESIGN AND METHODS ............................................................................. 31
1. In vitro model .................................................................................................................. 33
2. In vivo models ................................................................................................................. 33
3. Experimental design ....................................................................................................... 34
3.1. Aim 1: In vitro pharmacological and toxicological studies with the compound 33i ............. 34
3.2. Aim 2: To study the behavioural and molecular consequences of SIRT2 inhibition on a
sporadic AD mouse model ............................................................................................................ 34
3.3. Aim 3: To study the behavioural and molecular consequences of SIRT2 inhibition on a
familiar AD mouse model .............................................................................................................. 36
4. HDACs enzyme activity assays ...................................................................................... 37
5. MTT study ....................................................................................................................... 38
6. Ames test ........................................................................................................................ 39
7. Survival and Proliferation assay ..................................................................................... 40
8. Comet assay ................................................................................................................... 41
9. Behavioural tests ............................................................................................................ 43
10. Western blot.................................................................................................................... 46
11. Quantification of Aβ by Enzyme-Linked Immunosorbent Assay .................................... 49
12. RNA Extraction and Real-time Reverse Transcriptase–PCR ........................................ 49
13. Quantification of IL-1β in brain lysates ........................................................................... 50
14. Immunohistochemistry .................................................................................................... 51
15. Chromatin Immunoprecipitation...................................................................................... 52
16. Aβ plaque fluorescent labelling with methoxy-X04 injection .......................................... 54
17. Statistical analysis .......................................................................................................... 55
RESULTS .................................................................................................................................... 57
1. In vitro pharmacological and toxicological studies with the compound 33i .................... 59
1.1. HDACs enzyme activity assays ......................................................................................... 59

Table of contents
1.2. Cytotoxic activity of 33i ...................................................................................................... 59
1.3. Inhibitory activity of 33i towards SIRT2 .............................................................................. 59
1.4. Toxicological evaluation of the compound 33i ................................................................... 62
1.4.1. Evaluation of the potential mutagenicity of 33i compound ......................................... 62
1.4.2. Effect of 33i on the viability of SH-SY5Y cells ............................................................ 63
1.4.3. Evaluation of the potential genotoxicity of 33i compound .......................................... 63
2. Behavioural and molecular consequences of SIRT2 inhibition on a sporadic AD mouse
model ................................................................................................................................ 65
2.1. SIRT2 is increased in 9-month-old SAMR1 and SAMP8 mice........................................... 65
2.2. Effect of 33i on SIRT2 activity ............................................................................................ 65
2.3. Early treatment: Effect of SIRT2 inhibition in 5-month-old SAMP8 mice ........................... 66
2.3.1. Effect of SIRT2 inhibition on behavioural tests .......................................................... 66
2.3.2. Effect of 33i on SIRT1 protein levels ......................................................................... 70
2.3.3. Effect of 33i on AD neuropathological hallmarks ....................................................... 70
2.3.4. Effect of 33i on autophagy and ubiquitin-proteasome system ................................... 72
2.3.5. Effect of 33i on myelination........................................................................................ 74
2.3.6. Effect of SIRT2 inhibition on learning and memory-related proteins .......................... 75
2.3.7. Early 33i treatment reduces the neuroinflammation in 7-month-old SAMP8 mice ..... 77
2.4. Therapeutic treatment: Effect of SIRT2 inhibition in 8-month-old SAMP8 mice ................. 81
2.4.1. Effect of SIRT2 inhibition on behavioural tests .......................................................... 81
2.4.2. Effect of 33i on SIRT2 and SIRT1 protein levels in 8-month-old SAMP8 .................. 84
2.4.3. Effect of therapeutic treatment with 33i on AD neuropathological hallmarks ............. 84
2.4.4. Effect of therapeutic treatment with 33i on myelination ............................................. 87
2.4.5. Effect of 33i on autophagy dysfunction shown by 10-month-old SAMP8 mice .......... 87
2.4.6. Effect of therapeutic SIRT2 inhibition on learning and memory-related proteins ....... 88
2.4.7. Effect of 33i treatment on neuroinflammation in 10-month-old SAMP8 mice ............. 90
3. Behavioural and molecular consequences of SIRT2 inhibition on a familiar AD mouse
model ................................................................................................................................ 93
3.1. Effect of 33i treatment on behavioural alterations in the APP/PS1 mouse model.............. 93
3.1.1. Effect of SIRT2 inhibition on the anxiety-like behaviour shown by the APP/PS1 model
.................................................................................................................................. 93
3.1.2. Effect of 33i treatment to APP/PS1 model in the forced swimming test ..................... 94
3.1.3. Effect of SIRT2 inhibition in the cognitive decline shown by APP/PS1 mice ............. 94
3.2. Effect of 33i treatment on β-amyloid burden ...................................................................... 95
DISCUSSION .............................................................................................................................. 97
1. In vitro pharmacological and toxicological studies ......................................................... 99
2. SAMP8 model ............................................................................................................... 101
3. APP/PS1 model ............................................................................................................ 111
CONCLUSIONS ........................................................................................................................ 113
REFERENCES .......................................................................................................................... 117


Abbreviations
A
Aβ: Amyloid beta
Abca1: ATP-Binding cassete transporter 1
AcH4: Acetylated histone
Ac-α-tubulin: acetylated α-tubulin
AD: Alzheimer’s disease
APP: β-amyloid precursor protein
ApoE: Apolipoprotein E
B
BACE-1: Beta-site amyloid precursor protein cleaving enzyme 1
BBB: Blood-brain barrier
C
CNS: Central nervous system
D
DMSO: Dimethyl sulfoxide
F
fAD: familial AD
FST: Forced swimming test
FTD: Frontotemporal Dementia
H
H: Histone
HAT: Histone acetyl transferase

Abbreviations
HD: Huntington disease
HDAC: Histone deacetylase
I
IL: Interleukin
i.p.: Intraperitoneal
L
LPS: Lipopolysaccharide
LTP: Long term potentiation
M
MPTP: 1-metil-4-phenyl-1,2,3,6-terahydropyridine
MWM: Morris water maze
MMS: Methyl methanesulfonate
N
NFT: Neurofibrillary tangles
NORT: Novel object recognition test
NSF: Novelty-suppressed feeding test
O
O.D.: Optical density
P
PBS: Phosphate buffered saline
PCR: Polymerase Chain Reaction
PD: Parkinson disease

Abbreviations
PSD95: Postsynaptic density protein 95
PSEN1: Presenilin-1
PSEN2: Presenilin-2
p-Tau: phosphorylated Tau
R
RT-PCR: Real time PCR
S
sAD: sporadic AD
sAPPα: Soluble APPβ
SH-SY5Y: Neuroblastoma cell line
sAPPβ: Soluble APPβ
SAMP8: Senescence accelerated mouse prone-8
SAMR1: Senescence accelerated mouse resistant-1
SIRT: Sirtuin
T
TBS: Tris buffered saline
TNF-α: Tumor necrosis factor alpha
W
WB: Western blot


INTRODUCTION


Introduction
3
1. Epigenetics
Conrad Waddington introduced the term epigenetics in the early 1940s
(Waddington., 1942). He defined epigenetics as ‘‘the branch of biology which studies
the causal interactions between genes and their products which bring the phenotype
into being’’ (Waddington., 1968). In the original sense of this definition, epigenetics
referred to all molecular pathways modulating the expression of a genotype into a
particular phenotype. Over the following years, with the rapid growth of genetics, the
meaning of the word has gradually narrowed. Epigenetics has been re-defined and
today is generally accepted as ‘‘the study of changes in gene function that are
mitotically and/or meiotically heritable and that do not entail a change in DNA
sequence’’ (Wu and Morris., 2001). Otherwise stated, epigenetic processes influence
gene expression levels without involving changes of the primary DNA sequence
(Martín-Subero., 2011).
The epigenetic modifications described in current literature generally comprise
posttranslational modifications of histones, covalent modifications of DNA bases and
non-coding RNAs (Strahl and Allis., 2000; Berger et al., 2009; Bannister and
Kouzarides, 2011).
Generally, histone classifications comprise the main histones or their variants H1,
H2A, H2B, H3, and H4 (Phillips and Johns., 1965; Redon et al., 2002; Perche et al.,
2003; Hake and Allis., 2006). The fundamental building block of chromatin is the
nucleosome and consists of DNA spooled around an octamer of histones. Every
octamer contains two units of each principal or variant histone H2A, H2B, H3, and H4
(Kornberg., 1974). Nucleosomes are connected by stretches of “linker DNA” and linker
histones, such as histone 1 (Luger et al., 1997). Together they form the chromatin
which can exist in a condensate transcriptionally inactive state (heterochromatin) or in
a non-condensate and transcriptionally active state (euchromatin) (Berger., 2007) (Fig.
1).
Histones contain a flexible N-terminus that protrudes from the surface of the
nucleosome and is often named the “histone tail”. These tails are subjected to multiple
reversible posttranslational modifications catalysed by specific enzymes (Fischer et al.,
2010). The correlation of specific posttranslational modifications on the histones with
transcriptional events has resulted in the histone code hypothesis (Strahl and Allis.,
2000).

Introduction
4
Figure 1. Structure and organization of the chromatin. DNA wraps around a histones forming nucleosomes. Nucleosomes are connected by stretches of “linker DNA” and linker histones. Together they form the chromatin.
There are a wide set of possible histone modifications: acetylation, methylation,
ubiquitylation, phosphorylation, sumoylation, ribosylation and citrullination (Campos
and Reinberg., 2009).
Within these, one the most studied modification is the acetylation of histones by
histone acetyl transferases (HATs) and the removal of acetyl groups from histones by
histone deacetylases (HDACs) (Campos and Reinberg., 2009). The interplay between
HATs and HDACs alters the net balance of histone acetylation levels, thereby
remodelling chromatin structure. In general, an increase in protein acetylation at
histone-tails results in a more open and relaxed chromatin conformation, thus
facilitating transcription factors interaction with specific gene promoters, activating gene
expression. Oppositely, HDACs function as a component of the transcriptional
repressor complex. HDACs silence gene expression and induce chromatin compaction
through histone protein deacetylation. Accordingly, HDAC inhibition shifts the balance
towards enhanced histone acetylation, chromatin relaxation and gene expression (Fig.
2).
The balance between acetylated and deacetylated states plays a crucial role in
gene expression regulation (Lee et al., 1993; Kurdistani and Grunstein., 2003; Yang
and Seto., 2008).
ac
Histones
Nucleosomeac
Acetylation

Introduction
5
Figure 2. Histone acetylation and deacetylation. In general, an increase in histone acetylation results in a more open and relaxed chromatin conformation, thus facilitating gene transcription. Oppositely, HDACs favors a more closed and compact chromatin conformation repressing gene transcription.
In mammals, HDACs can be grouped into four classes based on their homology
and phylogenetic relationship: class I (HDAC1, 2, 3 and 8), which is similar to yeast
Rpd3; class II HDACs are further divided into two subclasses – IIa (HDAC4, 5, 7 and 9)
and IIb (HDAC6 and 10), similar to yeast Hda1; class III, also called sirtuins (SIRT1, 2,
3, 4, 5, 6 and 7), homologous to yeast Sir2; and class IV (HDAC11), similar to yeast
Hos3. The class I, II, and IV HDACs use zinc to catalyze hydrolysis of the acetylated
lysines; whereas the class III enzymes rely on the cofactor NAD+ for their function (de
Ruijter et al., 2003; Verdin et al., 2003; Blander and Guarente, 2004; Zakhary et al.,
2010; Joshi et al., 2013; Lazo-Gómez et al., 2013) (Table 1).
ac
ac
ac
ac
ac
ac
ac
ac
ac
ac
HDAC HAT
Deacetylated Histones
- Closed cromatin- Inactive transcription
Acetylated Histones
- Open cromatin- Active transcription

Introduction
6
Table 1. Classification and localization of histone deacetylases (HDAC). Adapted from (Gomes et al., 2015; Volmar and Wahlestedt, 2015)
Class Cofactor HDAC enzyme Localization
I Zinc dependent HDAC 1
HDAC 2
HDAC 3
HDAC 8
Nucleus
Nucleus
Nucleus and cytoplasm
Nucleus
IIa Zinc dependent HDAC 4
HDAC 5
HDAC 7
HDAC 9
Nucleus and cytoplasm
Nucleus and cytoplasm
Nucleus and cytoplasm
Nucleus and cytoplasm
IIb Zinc dependent HDAC 6
HDAC 10
Nucleus and cytoplasm
Nucleus and cytoplasm
III (Sirtuins) Nicotinamide
dependent
SIRT 1
SIRT 2
SIRT 3
SIRT 4
SIRT 5
SIRT 6
SIRT 7
Nucleus, cytosol
Cytosol, nucleus
Mitochondria
Mitochondria
Mitochondria
Nucleus
Nucleus
IV Zinc dependent HDAC 11 Nucleus and cytoplasm
2. Sirtuins
The class III HDAC NAD+-dependent, also called sirtuins, constitute a class of
deacetylases highly conserved from prokaryotes to eukaryotes. They were initially
described as transcription-silencing histone deacetylases in yeast and associated with
an increase in lifespan by a process believed to be analogous to caloric restriction
(Kennedy et al., 1995; Guarente, 2000).
In mammals, there are 7 types of isoforms (SIRT1-7) with different functions,
substrates and cellular localizations (Grozinger et al., 2001) (Table 2). Although all of
them share a similar catalytic domain of approximately 275 amino acids, they differ in
the carboxyl terminal protein sequences flanking its core (Wątroba et al., 2017) and
they are involved in a variety of biological processes including gene transcription,
apoptosis, cell cycle progression, autophagy, metabolism, mitochondrial function,
inflammation and aging, among others (Jayasena et al., 2016; Jęśko et al., 2017).
While SIRT1, SIRT6 and SIRT7 are mainly nuclear enzymes, SIRT3, SIRT4 and
SIRT5 are mitochondrial proteins. SIRT2 can be shuttled between nucleus and
cytoplasm, depending on the phase of the cell cycle (Wątroba et al., 2017).

Introduction
7
Moreover, while SIRT1, SIRT2, SIRT3, SIRT5 and SIRT7 deacetylate histone and
non-histone protein substrates, SIRT4 and SIRT6 are primarily mono-ADP-ribosyl
transferases (North et al., 2003; Liszt et al., 2005; Ahuja et al., 2007).
SIRT1, which has highest sequence similarity to yeast Sir2, deacetylates histones
3 and 4 as well as transcription factors. Although it is generally described to be a
nuclear protein, a few studies have described nucleo-cytoplasmic shuttling of SIRT1 in
response to oxidative stress (Kim et al., 2007; Tanno et al., 2007; Hisahara et al.,
2008).
SIRT2 resides mostly in the cytoplasm where it associates with microtubules and
deacetylates α–tubulin (North et al., 2003; Jin et al., 2008). However, when the nuclear
envelope disassembles during mitosis, SIRT2 can also deacetylate histone 4 (Vaquero
et al., 2006).
SIRT3, SIRT4, and SIRT5 localise in the mitochondria and are therefore thought to
play a role in energy metabolism and responses to oxidative stress (Michishita et al.,
2005). Although SIRT1, SIRT6 and SIRT7 are nuclear proteins, the three proteins
display distinct sub-nuclear localisation patterns; SIRT6 associates with
heterochromatin, SIRT7 localizes to nucleoli, whereas SIRT1 is largely associated with
euchromatin within the nucleus (Michishita et al., 2005).
Their presence has been described in the brain and, due to their multiple
functions, it has been suggested that they could be implicated in aging and
neurodegenerative diseases (Jęśko et al., 2017).
Introduction
8
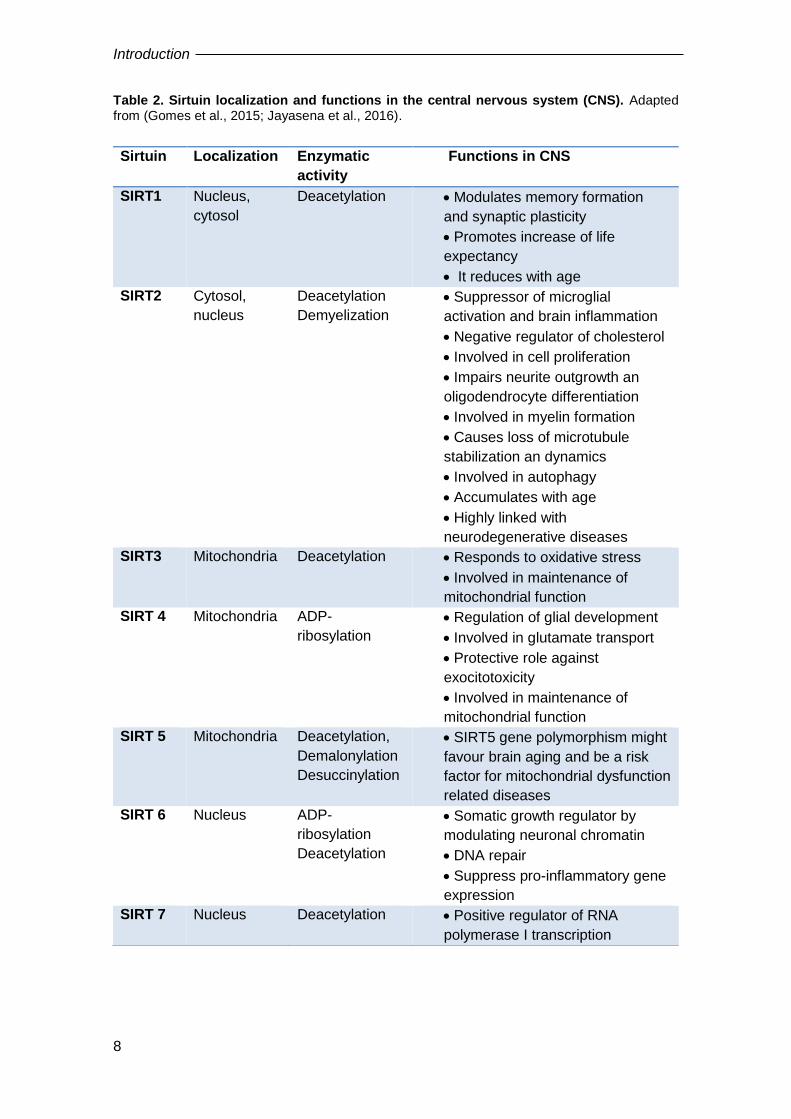
Table 2. Sirtuin localization and functions in the central nervous system (CNS). Adapted from (Gomes et al., 2015; Jayasena et al., 2016).
Sirtuin Localization Enzymatic
activity
Functions in CNS
SIRT1 Nucleus,
cytosol
Deacetylation Modulates memory formation
and synaptic plasticity
Promotes increase of life
expectancy
It reduces with age
SIRT2 Cytosol,
nucleus
Deacetylation
Demyelization
Suppressor of microglial
activation and brain inflammation
Negative regulator of cholesterol
Involved in cell proliferation
Impairs neurite outgrowth an
oligodendrocyte differentiation
Involved in myelin formation
Causes loss of microtubule
stabilization an dynamics
Involved in autophagy
Accumulates with age
Highly linked with
neurodegenerative diseases
SIRT3 Mitochondria Deacetylation Responds to oxidative stress
Involved in maintenance of
mitochondrial function
SIRT 4 Mitochondria ADP-
ribosylation
Regulation of glial development
Involved in glutamate transport
Protective role against
exocitotoxicity
Involved in maintenance of
mitochondrial function
SIRT 5 Mitochondria Deacetylation,
Demalonylation
Desuccinylation
SIRT5 gene polymorphism might
favour brain aging and be a risk
factor for mitochondrial dysfunction
related diseases
SIRT 6 Nucleus ADP-
ribosylation
Deacetylation
Somatic growth regulator by
modulating neuronal chromatin
DNA repair
Suppress pro-inflammatory gene
expression
SIRT 7 Nucleus Deacetylation Positive regulator of RNA
polymerase I transcription

Introduction
9
3. Sirtuin 2 (SIRT2)
Among all sirtuins, SIRT2 expression is found the strongest in the brain (Jayasena
et al., 2016). In addition, it is also expressed in a wide range of tissues and organs
including the muscle, liver, testes, pancreas, kidney, and adipose tissue of mice (Wang
et al., 2007; Kim et al., 2011; Maxwell et al., 2011).
Related to brain cells, SIRT2 is mostly expressed in neurons, oligodentrocytes (Li
et al., 2007; Michan and Sinclair, 2007; Pandithage et al., 2008; Southwood et al.,
2007; Werner et al., 2007; Zhu et al., 2012) and other glial cells such as astrocytes and
microglia (Jayasena et al., 2016; Li et al., 2007; Pandithage et al., 2008). Within the
cell, it is mainly located in the cytoplasm although it can also be found in the nucleus
and mitochondria. As expected, due to its ubiquitous cell distribution, its function is
determined by its localization.
In the cytoplasm, SIRT2 is involved in cytoskeleton stabilization by targeting the
major component of microtubules, α-tubulin (North et al., 2003). Thus, SIRT2 regulates
microtubule dynamics by deacetylating several cytoskeletal proteins and regulates cell
cycle progression.
In the nucleus, SIRT2 is implicated in gene transcription repressing genes
encoding for DNA binding proteins as well as transcription factors that participate in
synaptic plasticity, cell proliferation, differentiation and cell survival (Eskandarian et al.,
2013). It has been described that SIRT2 transiently migrates to the nuclei during
mitosis and deacetylates histone 4 at lysine 16 (Vaquero et al., 2006).
In addition to α-tubulin and histone 4, SIRT2 deacetylates many other substrates
including p53, p300, NF-Kb, CDK9, LDH-A, PRLR, GLUA1 and forkhead transcription
factors of class O, FOXO1 and FOXO3 (Li et al., 2007a; Wang and Tong., 2009;
Nakagawa and Guarente., 2011; Zhu et al., 2012; Jing and Lin., 2015; Huang et al.,
2017; Sundriyal et al., 2017; Wang et al., 2017). It is suggested that all this variety of
substrates might be correlated with key roles of SIRT2 in diverse biological processes
such as the cell cycle, apoptosis, chromosomal stability, autophagy, microtubule
stability, oxidative stress, myelination, immune response, inflammation and energy
metabolism (Saunders and Verdin., 2007; Gan and Mucke., 2008; Milne and Denu.,
2008; Outeiro et al., 2008; Luthi-Carter et al., 2010; Gomes et al., 2015). Importantly,
all these processes are involved in natural aging as well as in neurodegenerative
diseases.

Introduction
10
Many recent studies suggest an important involvement of SIRT2 in bacterial
infections, type II diabetes, obesity, cardiovascular diseases, neurodegenerative
disorders and cancer (Heltweg et al., 2006; Outeiro et al., 2007; Peck et al., 2010;
Chen et al., 2011; Taylor et al., 2011; Park et al., 2012; Chopra et al., 2012; He et al.,
2012; Krishnan et al., 2012; Hoffmann et al., 2014; Cheon et al., 2015; Zhao et al.,
2015; Matsushima and Sadoshima, 2015; Jing et al., 2016). Hence, SIRT2 promises a
therapeutic target for the treatment of these disorders.
3.1. Role of SIRT2 in aging and inflammation
Aging is a natural biological process associated with physiological decline, both
physically and cognitively. Over the last decades, the increase in human life
expectancy and the reduction in death rates have made the world elderly population to
increase exponentially. According to data from World Population Prospects, the 2017
Revision, the number of older people, those aged 60 years or over, is expected to more
than double by 2050, rising from 962 million globally in 2017 to 2.1 billion in 2050.
Currently, Europe has the greatest percentage of population aged 60 or over.
There is a continuum between normal aging and disease in terms of pathological
and biochemical changes in many tissues. In fact, nowadays, especially in high-income
countries, medical attention is dominated by a broad range of chronic conditions for
which age is, by far, the biggest risk factor for osteoporosis, arthritis, diabetes,
sarcopenia and macular degeneration and neurodegenerative disorders (Kirkwood,
2017). Therefore, the pharmacological treatment of these pathologies must be
understood in the context of the molecular biology of the aging process (Bishop et al.,
2010).
There are around 300 hypotheses about aging (e.g., the free radical hypothesis,
the hypothesis of neuroendocrine phenomena, the collagen hypothesis and others…)
(Diaconeasa et al., 2015). Among all of them, accumulating evidence has linked aging
to genetic and epigenetic alterations.
In this sense, previous reports describing the role of SIRT2 expression in
senescence have been contradictory. In mouse brain, three different isoforms of SIRT2
have been detected, SIRT2.1, 2.2 and 2.3, of which the 2.3 isoform showed an
increase with age in the central nervous system (Maxwell et al., 2011). Additionally
Anwar et al., (2016) reported an upregulation of SIRT2 as a specific feature associated
with stress induced premature senescence. On the other hand, another report
indicated that increase in SIRT2 levels in aged rat brain is specific only to occipital

Introduction
11
region and no other regions (Braidy et al., 2015) whereas Kireev et al., (2013) found a
decrease in SIRT2 expression in the dentate gyrus of old rats. Additionally, a more
recent study showed that middle-aged mice lacking SIRT2 exhibited locomotor
dysfunction due to axonal degeneration providing a novel link between SIRT2 and
physiological aging impacting the axonal compartment of the central nervous system
(Fourcade et al., 2017). Despite being contradictory, these reports reinforce the idea of
SIRT2 acting as a powerful regulator of aging with a potential role in
neurodegeneration.
SIRT2 has also been proposed to play a role in neuroinflammation, although this
has been also controversial. For example, upon inhibition or deletion of SIRT2,
stimulation of the immune response by lipopolysaccharide (LPS) led to an overt
production of pro-inflammatory cytokines in an experimental model of colitis and after
traumatic brain injury (Lo Sasso et al., 2014; Yuan et al., 2016), suggesting a role for
SIRT2 in inhibiting the inflammatory response. However, a role for SIRT2 in promoting
inflammation was found upon LPS treatment in microglial cell lines, macrophages, and
mouse brain (Lee et al., 2014; Chen et al., 2015; Wang et al., 2016). This was also
supported by the observed attenuation of cytokine levels in a lethal septic model where
the activity of SIRT2 was pharmacologically reduced (Zhao et al., 2015).
However, ischemic brains of wild type (WT) and Sirt2 knockout mice were
characterized by a similar induction of neutrophils and activated
microglia/macrophages (Krey et al., 2015). Thus, whether and how SIRT2 regulates
inflammation in the brain still remains unclear (Fourcade et al., 2017).
3.2. Role of SIRT 2 neurodegenerative diseases
Neurodegenerative disorders share some features in common, including (i)
polygenic/complex anomalies, together with epigenetic modifications, cerebrovascular
alterations and environmental risk factors; (ii) age-related onset and disease
progression (an increase in prevalence in parallel with age); (iii) progressive neuronal
degeneration starting in early periods of life with clinical manifestations occurring
decades later; (iv) accumulation of abnormal proteins and conformational changes in
pathogenic proteins (abnormal deposits of neurotoxic byproducts); (v) no specific
biomarkers for a predictive diagnosis and unspecific clinical phenotypes for an early
detection; and (vi) limited options for therapeutic intervention with no curative
treatments (Cacabelos, 2017). In this context finding a molecular substrate involved in
all these common pathways underlying the neurodegenerative disease would provide a
novel pharmacological target for these pathologies. In this line, several studies have
Introduction
12
identified a major role for SIRT2 in different neurodegenerative diseases (the role of
SIRT2 specifically in Alzheimer disease will be addressed in depth in the next section):
Regarding Parkinson disease (PD), Outeiro et al., (2007) demonstrated for the
first time that inhibition of SIRT2 rescued alpha-synuclein toxicity and modified
inclusion morphology in a cellular model of PD. Furthermore, SIRT2 inhibitors
protected against dopaminergic cell death both in vitro and in a Drosophila model of
PD. Since then, many other studies have corroborated the beneficial effects of SIRT2
inhibition in different model of this disease and have tried to decipher the underlying
mechanisms (Harrison and Dexter, 2013; Chen et al., 2015; Di Fruscia et al., 2015; de
Oliveira et al., 2017; Silva et al., 2017; Esteves et al., 2018). In this regard, Esteves et
al. (2018) observed that NAD+ metabolism is altered in sporadic PD patient-derived
cells, which contributes to SIRT2 activation and subsequent decrease in acetylated-α-
tubulin levels. Accordingly, pharmacological inhibition of SIRT2 selectively enhanced α-
tubulin acetylation and facilitated the trafficking and clearance of misfolded proteins.
Moreover, MPTP-treated SIRT2 knock-out mice showed no alterations in motor
behaviour, highlighting the association between SIRT2, mitochondrial metabolism,
autophagy and neurodegeneration in PD. On the other hand, De Oliveira et al., (2017)
have provided a mechanistic insight into the interplay between SIRT2 and α-synuclein,
the major component of the pathognomonic protein inclusions in PD. They found that
α-synuclein acetylation is a key regulatory mechanism governing α-synuclein
aggregation and toxicity. Interestingly, genetic manipulation of SIRT2 levels in vitro and
in vivo modulates the levels of α-synuclein acetylation, its aggregation and autophagy,
demonstrating the potential therapeutic value of SIRT2 inhibition in synucleinopathies.
Other authors have also demonstrated the neuroprotective effects of
pharmacological and/or genetic inhibition of SIRT2 in different models of Huntington
disease (HD) (Luthi-Carter et al., 2010; Chopra et al., 2012) suggested that the
neuroprotective effects observed after SIRT2 inhibition in cellular and invertebrate
models of HD could be due to the transcriptional repression of cholesterol biosynthesis,
in agreement with previous studies that showed detrimental effects of cholesterol
accumulation in neurons and justifying the potential benefit of decreasing neuronal
cholesterol (or other sterol species) as a neuroprotective strategy. This study was later
corroborated by Chopra et al., (2012), who observed that SIRT2 inhibition with the
compound AK-7 improved the motor function, extended survival, reduced brain atrophy
and improved the striatal neuronal volume of two genetic mouse models of HD.
Additionally, it ameliorated their neuropathological phenotype by reducing mutant

Introduction
13
huntingtin polyglutamine and cholesterol aggregates.
However, some conflicting results have also emerged. Bobrowska et al., (2012)
showed that genetic reduction or ablation of SIRT2 in a genetic mouse model of HD
(R6/2 mice) had no effect on disease progression or huntingtin protein levels. In
addition, Chen et al., (2015) demonstrate that SIRT2 pharmacological inhibition by the
compound AK7 does not show beneficial effects in mouse models of amyotrophic
lateral sclerosis and cerebral ischemia. Furthermore Singh et al., (2017) have recently
observed in SH-SY5Y cells that elevated SIRT2 protected from rotenone or diquat
induced death. In this context the authors interpreted the higher SIRT2 activity in PD
brain as a compensatory mechanism to combat neuronal stress (Singh et al., 2017).
Altogether, these studies highlight the relevance to further investigate the
connection between SIRT2 and neurological disorders.
3.3. Role of SIRT2 in Alzheimer´s disease
Alzheimer’s disease (AD) is the most common form of dementia and one of the
leading causes of morbidity and mortality in the aging population (Selkoe., 2012). More
than 35 million people worldwide have AD, a memory and other cognitive domains
deterioration that leads to death within 3 to 9 years after diagnosis (Querfurth and
LaFerla., 2010). AD patients suffer from a decline in memory, aphasia, performance
disorders, personality and behaviour changes, eating problems and infections in
advanced dementia. These symptoms lead to the decline of patients’ life quality and
increase cost of care which will be important public health challenges. In terms of
costs, AD accounts for $226 billion/year in the USA and €160 billion/year in Europe
(>50% are costs of informal care, and 10–20% are costs of pharmacological
treatment). It is estimated that in the USA alone, the direct cost of AD in people older
than 65 years of age could be over $1.1 trillion in 2050. Despite its relevance,
paradoxically, no new drugs have been developed for AD during the past 15 years.
Anti-AD drugs are not cost-effective, and less than 20% of patients can obtain a mild
benefit with conventional drugs (Cacabelos and Torrellas., 2014; Cacabelos et al.,
2016).
AD can be categorized into two clinical subtypes, familial AD (fAD) and sporadic
AD (sAD). Although both types of the disease (fAD and sAD) develop similar
pathological phenotypes, the factors triggering the neurodegenerative process are
completely different. In fAD, the pathological buildup is caused by the presence of
autosomal-dominant mutations: amyloid-β protein precursor (APP), presenilin-1

Introduction
14
(PSEN1), or presenilin-2 (PSEN2) (Querfurth and LaFerla, 2010). However, the
etiology underlying sAD, which represents the majority of AD cases (∼98%), is
complex and multi-factorial resulting from a combination of genetic, epigenetic, and
lifestyle factors. In these cases, age in the major risk factor (Bertram et al., 2010). What
is more, the incidence of the disease doubles every 5 years after 65 years of age and
the odds of receiving the diagnosis of AD after 85 years of age exceed one in three
(Hebert et al., 2003). On the other hand, to the date, the apolipoprotein E (APOE) 4
allele of the APOE gene is considered the strongest genetic susceptibility factor for
sAD development. However, only 30% to 50% of all AD cases bear the APOE 4 allele,
and not all APOE 4 carriers develop the disease (Crean et al., 2011). Recent large
genome wide association studies have proposed several new susceptibility genes in
AD, but these variants only contribute a modest level of risk (Bertram et al., 2007).
The principal hallmarks of neurodegeneration in AD are extracellular plaques,
mainly consisting of aggregated amyloid-β (Aβ), and intracellular neurofibrillary tangles
(NFTs) (Alzheimer’s Association, 2015).
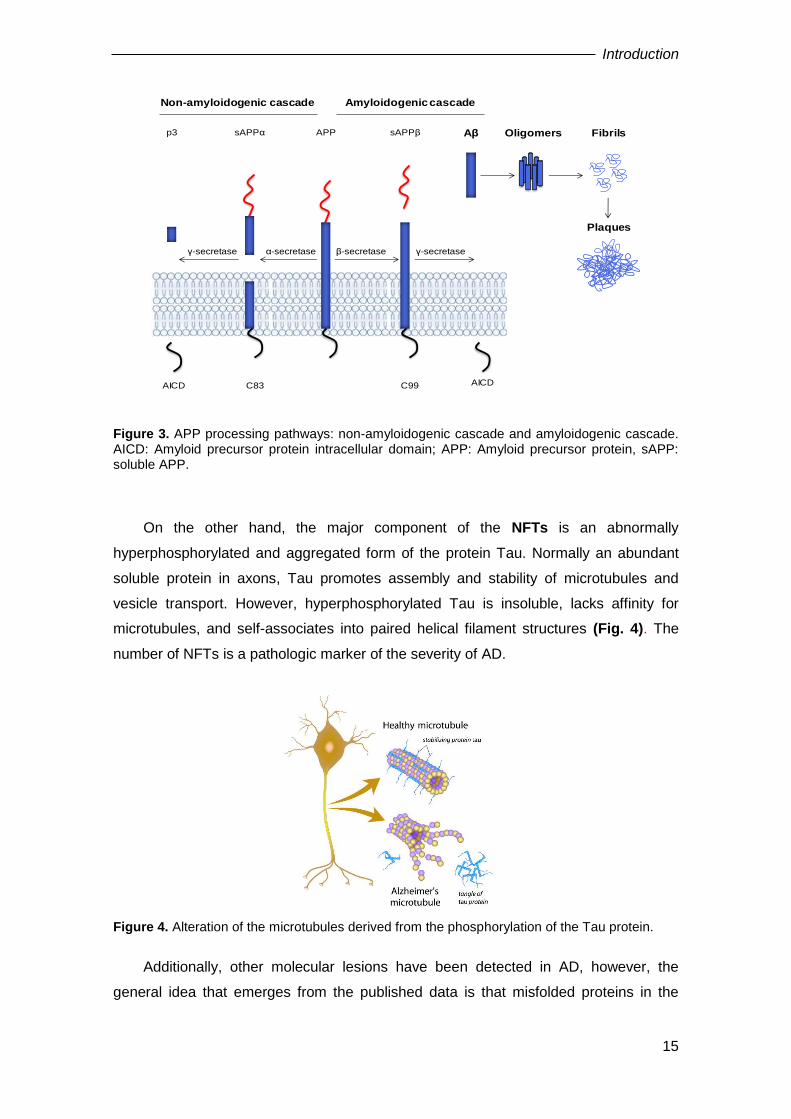
Aβ peptides are natural products of metabolism consisting of 36 to 43 amino
acids. Monomers of Aβ40 are much more prevalent than the aggregation-prone and
damaging Aβ42 species. β-amyloid peptides are generated by means of the
amyloidogenic cascade. Though this pathway, the amyloid precursor protein (APP)
suffers proteolysis by the sequential enzymatic actions of beta-site amyloid precursor
protein–cleaving enzyme 1 (BACE-1), a β-secretase that cleaves APP generating the
soluble sAPPβ and leaving a C99 fragment. Then, γ-secretase, a protein complex with
presenilin 1 at its catalytic core, cleaves residues to produce the Aβ toxic peptides
(Haass and Selkoe., 2007). An imbalance between production and clearance followed
by an aggregation of peptides, causes Aβ to accumulate, and this excess may be the
initiating factor in AD. Altogether, this cascade constitutes the “amyloid hypothesis”. In
non-pathological conditions the non-amyloidogenic cascade is favoured. In this case,
α-secretase cleaves APP within the Aβ sequence leading to the secretion of a soluble
protein (sAPPα) (Busciglio et al., 2002). Aβ spontaneously self-aggregates into multiple
coexisting physical forms. One form consists of oligomers (2 to 6 peptides), which
aggregates into intermediate assemblies (Klein et al., 2001; Kayed et al., 2003). β-
amyloid can also grow into fibrils, which arrange themselves into β-pleated sheets to
form the insoluble fibres of amyloid plaques (Querfurth and LaFerla, 2010) (Fig. 3).
Introduction
15
Figure 3. APP processing pathways: non-amyloidogenic cascade and amyloidogenic cascade. AICD: Amyloid precursor protein intracellular domain; APP: Amyloid precursor protein, sAPP: soluble APP.
On the other hand, the major component of the NFTs is an abnormally
hyperphosphorylated and aggregated form of the protein Tau. Normally an abundant
soluble protein in axons, Tau promotes assembly and stability of microtubules and
vesicle transport. However, hyperphosphorylated Tau is insoluble, lacks affinity for
microtubules, and self-associates into paired helical filament structures (Fig. 4). The
number of NFTs is a pathologic marker of the severity of AD.
Figure 4. Alteration of the microtubules derived from the phosphorylation of the Tau protein.
Additionally, other molecular lesions have been detected in AD, however, the
general idea that emerges from the published data is that misfolded proteins in the
β-secretase γ-secretaseα-secretaseγ-secretase
APPsAPPαp3 sAPPβ Aβ Oligomers Fibrils
Plaques
C83AICD C99 AICD
Non-amyloidogenic cascade Amyloidogenic cascade

Introduction
16
aging brain results in oxidative and inflammatory damage, which in turn leads to energy
failure and synaptic dysfunction (Querfurth and LaFerla., 2010). Growing studies have
been attracted by the role of inflammation in the onset and progression of AD. In fact,
senile plaques and NFT co-localize with activated astrocytes, inducing
neuroinflammation response (Meda and Baron., 2001; Mrak ., 2001; Caricasole et al.,
2003; Tuppo and Arias, 2005; Craft, 2006; Scuderi et al., 2011, 2013, 2014). It is
accepted that neuroinflammation is directly linked to neural dysfunction and cell death,
representing a primary cause of neurodegeneration (Block and Hong., 2005). In fact,
over-release of pro-inflammatory cytokines by glia cells causes neuronal dysfunction
and loss of synapses, which correlates with memory decline.
Interestingly, since long-term memories require gene expression, of the several
types of epigenetic modifications that have been associated with cognitive functions,
histone acetylation has a critical role in memory acquisition and maintenance (Gräff
and Tsai., 2013). In this sense, memory acquisition leads to an increase in histone
acetylation by increasing HAT activity and decreasing HDAC activity, resulting in a
particular pattern of gene expression (McQuown and Wood., 2011). Supporting this
hypothesis it has been demonstrated that this balance between HAT and HDAC is
altered in aging and deficits in age related memory acquisition are due to an increase
in HDAC activity and, therefore, to a decrease in the transcription of several genes
involved in learning (Sharma et al., 2015). Importantly, reduced histone acetylation
correlates with age in the frontal cortex of the human brain, notably at the promoter
regions of several genes involved in neurotransmission (Tang et al., 2011).
Therefore, it has been suggested that pharmacological manipulations reverting
these aging-related epigenetic modifications can revert the cognitive deficits associated
with aging and AD (Mastroeni et al., 2011). In agreement with this hypothesis, inhibitors
of HDAC activity enhance histone acetylation, synaptic plasticity, learning and memory
(Guan et al., 2009; McQuown and Wood., 2011; Cuadrado-Tejedor et al., 2013;
Fonseca, 2016; Krishna et al., 2016).
Regarding SIRT2, a recent study has shown for the first time that SIRT2 protein
levels are increased in AD post-mortem samples from the temporal cortex and
unchanged in the hippocampus (Silva et al., 2017). However, Wongchitrat et al., (2019)
have recently found that mRNA SIRT2 levels in plasma were significantly higher in AD
and healthy aging patients compared to healthy young controls suggesting that it is not
a biomarker of the disease but of the aging process (Wongchitrat et al., 2018).

Introduction
17
Within this framework, few studies have addressed the potential role of SIRT2 in
the etiology of AD.
Although it has been described an association between human SIRT2 SNP
rs10410544 C/T and AD susceptibility in the APOE 4-negative population (Polito et al.,
2013; Wei et al., 2014; Xia et al., 2014), the first study providing a proof-of-concept for
therapeutic benefits of SIRT2 inhibitors in both Tau-associated frontotemporal
dementia (FTD) and AD came in 2012 (Spires-Jones et al., 2012). The authors tested
the hypothesis that SIRT2 inhibition would be non-toxic and prevent neurodegeneration
in rTg4510 brain, which expresses a mutant form of the Tau protein associated with
FTD. In this study, they delivered SIRT2 inhibitor AK1 directly to the hippocampus with
an osmotic minipump and confirmed that AK1 treatment was safe in WT mice and in
the rTg4510 mouse model. Interestingly, SIRT2 inhibition provided some
neuroprotection in the rTg4510 hippocampal circuitry and delayed hippocampal
neuronal degeneration.
Later, Scuderi et al., (2014) evaluated if SIRT2 inhibition with the compound AGK-
2 would prevent reactive gliosis, which, as explained above, is considered one of the
most important hallmark of AD. Their results showed that SIRT2 inhibition increased
cell viability in primary rat astrocytes exposed to Aβ peptide. Additionally, AGK-2 was
able to counteract the overexpression of four neuroinflammation markers (GFAP,
S100B, iNOS and COX2) induced by Aβ42 exposure. In their study, the authors
suggest that SIRT2 inhibition may be an effective agent for neurodegenerative
diseases initiated or maintained by inflammatory processes.
The next study showed that SIRT2 inhibition with the compound AK-7 improved
cognitive performance in two AD transgenic mouse models, 3xTg-AD and APP23
(Biella et al., 2016). Preliminary, in vitro results showed that the inhibition of SIRT2
reduced Aβ production. Later, in vivo data showed an improvement of cognitive
performance in the novel object recognition test and an effect on APP proteolytic
processing leading to a reduction of soluble APPβ and an increase of soluble APPα
protein. However, they were unable to find any differences in the brain levels of the
Aβ40, Aβ42 or Aβ oligomers suggesting that the treatment may be sufficient to trigger a
quick molecular change in APP processing but too short to elicit any change in the pool
of soluble Aβ fragments, which have been accumulating for months. Additionally, in
3xTg-AD mice, they noticed that total Tau protein levels were increased. Interestingly,
AK-7 increased Ac-α-tubulin, which may have promoted microtubule stability and
raised the steady-state levels of Tau.

Introduction
18
Overall, this study demonstrates that SIRT2 inhibition improves cognitive
performance in two different transgenic AD models though the modulation of APP
amyloidogenic processing and Tau stability, however, the molecular mechanisms
involved in such effects require further investigation.
Microtubules are labile dynamic structures that are stabilized by Tau-tubulin
interactions and mediate organelle transport, cell motility, maintain synaptic targets and
(Morris and Hollenbeck., 1995). Interestingly, all these processes exhibit deficits or
alterations in both normal aging and in neurodegenerative disorders (Mattson and
Magnus, 2006; Xie et al., 2010).
In order to further understand the role of SIRT2 on microtubule stability, more
recently, Silva et al., (2017) have demonstrated that over-activation of SIRT2 results in
tubulin deacetylation, Tau phosphorylation and microtubule destabilization which leads
to a dysfunction in autophagy, accumulation of Aβ oligomers and neuritic dystrophy.
Accordingly, SIRT2 inhibition recovers microtubule stabilization and improves
autophagy, favouring cell survival through the elimination of toxic Aβ oligomers. These
results have been recently corroborated by Esteves et al., (2018). In their study, the
authors demonstrate, in different AD in vitro models, that α-tubulin deacetylation by
SIRT2 causes microtubule loss of stability which facilitates Tau dissociation and
consequent phosphorylation. In agreement, after SIRT2 inhibition they observe an
increase of α-tubulin acetylation followed by a decrease in Tau phosphorylation and
increase in Tau/tubulin binding (Esteves et al., 2018).
Overall, these findings establish a link between SIRT2, microtubule stabilization
and AD main neuropathological hallmarks. In this way, the positive effects observed
after SIRT2 inhibition on neuronal homeostasis by improving cytoskeletal dynamics,
axonal transport and autophagy makes SIRT2 inhibition a desirable candidate for age-
related neurodegenerative diseases.
3.4. SIRT2 inhibitors
Increasing number of selective SIRT2 inhibitors have been identified and 12 of
them have come into preclinical studies (Zhou et al., 2018). Within all these, AK-1, AK-
7 and AGK-2 have extensively been used in cellular and animal models of
neurodegenerative diseases including PD (Outeiro et al., 2007; Chen et al., 2015), HD
(Luthi-Carter et al., 2010; Chopra et al., 2012) and AD (Spires-Jones et al., 2012;
Scuderi et al., 2014; Biella et al., 2016; Silva et al., 2017; Esteves et al., 2018). Despite

Introduction
19
their promising therapeutic results, none have been approved. In this sense, their low
selectivity has been reported to be one of their main limitations.
Even though AK-1 (IC50 = 6 µM) is more potent that AK-7 (IC50 = 9 µM), it lacks of
blood-brain barrier permeability, a crucial characteristic for the treatment of
neurodegenerative diseases (Zhou et al., 2018). Furthermore, AGK-2 was until the
date the most potent selective SIRT2 inhibitor (IC50 = 3.5 µM) (Suzuki et al., 2012).
The compound 33i, 2-{3-(3-fluorophenethyloxy)phenylamino} benzamide, is a 2-
anilinobenzamide derivative (MW= 350.39 g/mol) (Fig. 5). It has been synthesized by
Dr Suzuki (Kyoto Prefectural University) with the objective of finding a potent SIRT2-
selective inhibitors based on homology models of SIRT2 (Suzuki et al., 2012).
Figure 5. 33i compound structure (Suzuki et al., 2012).
Among all the compounds synthesized, 33i exhibited potent and selective SIRT2
inhibition in enzyme assays, showing more than 3.5-fold greater SIRT2-inhibitory
activity and more than 10-fold greater SIRT2-selectivity over SIRT1 and SIRT3
compared to AGK2 (Suzuki et al., 2012) (Table 3).
Table 3. SIRT2 inhibitory activity of 33i and AGK2 (Suzuki et al., 2012).
IC50 (µM) Selectivity
Compound SIRT2 SIRT1 SIRT3 SIRT1/SIRT2 SIRT3/SIRT2
33i 0.57 ± 0.12 >300 >300 >530 >530
AGK2 3.5 ± 0.30 30 ± 0.40 91 ± 27 8.6 26

Introduction
20
4. Animal models of Alzheimer’s disease
Due to the complex pathogenesis and pathological mechanisms of AD, numerous
animal models have been developed in order to simulate the disease. As expected
there are be different models to reproduce the origin and symptomatology of both types
of AD: sAD and fAD. Among them, in the present thesis, the SAMP8 mouse model was
used to emulate sporadic AD and the APP/PS1 mouse model was used to reproduce
the familial form of AD.
4.1. The SAMP8 model
The senescence-accelerated prone mouse 8 (SAMP8) mouse model has drawn
attention in gerontological research of dementia since it manifests irreversible
senescence and shares similar characteristics with aged humans.
SAMP8 was developed, along with other 11 SAMP strains, by selective inbreeding
of the AKR/J strain. It is a spontaneous model based on age rather than on mutations,
hence this mouse provides a more global picture of human aging triggered by a
combination of age-related events. Moreover, its biochemical features, short life span
and fast aging progress have made it an adequate model for the study of age-related
neurodegenerative disorders. Conversely, the senescence-accelerated mice resistant-
1 (SAMR1) strain, with a normal pattern of aging (Takeda., 1981), is considered the
control reference strain in almost all the studies using this model.
The main phenotypic characteristic is the progressive cognitive decline and the
neurodegenerative changes that have led to the proposal of the SAMP8 mouse as a
good model of neurodegeneration (Takeda., 1999). More specifically, there is
increasing evidence that the SAMP8 is an acceptable model for sporadic AD showing
several advantages over the gene-modified models as it may represent the complex
multifactorial nature of AD (Pallàs et al., 2008; Woodruff-Pak,. 2008; Tomobe and
Nomura., 2009; Morley et al., 2012; Pallàs., 2012). Studies using a variety of different
cognitive tasks have demonstrated an early-onset of spatial (Orejana et al., 2015),
cortex-dependent (Fontán-Lozano et al., 2008; López-Ramos et al., 2012; Dobarro et
al., 2013) and contextual fear learning and memory decline in SAMP8 mice (Ohta et
al., 2001).
Furthermore, SAMP8 mice present some of the typical AD neuropathological
hallmarks. They are characterized by having elevated biomarkers of oxidative stress
(Alvarez-García et al., 2006; Petursdottir et al., 2007; Bayram et al., 2012) and

Introduction
21
impaired antioxidant defence (Alvarez-García et al., 2006; Gong et al., 2008), neuronal
cell loss (Kawamata et al., 1997), neuroinflammation (Tha et al., 2000; Cuesta et al.,
2010), mitochondrial dysfunction (Carretero et al., 2009), blood–brain barrier
dysfunction (Pelegrí et al., 2007; Del Valle et al., 2009), autophagy alterations (Ma et
al., 2011) as well as amyloid and Tau pathology (Sureda et al., 2006; Porquet et al.,
2013). Regarding Tau pathology, Tau hyperphosphorylation increases occur as early
as 5 months of age (Sureda et al., 2006), suggesting that this process is an early event
and an integral part of aging. Concerning the amyloid pathology, although the Aβ
deposits in SAMP8 mice might not be the same of those found in the brains of AD
patients, the Aβ-immunoreactive granules in SAMP8 mice may be pathologically
related to the Aβ deposits observed in humans. Several studies have demonstrated
that SAMP8 mice show Aβ deposition in the hippocampus that increases in number
and extent with age (del Valle et al., 2010, 2011; Manich et al., 2011; Porquet et al.,
2013). This Aβ deposition consists of clustered granules containing Aβ42, Aβ40, and
other Aβ protein precursor fragments, Tau, microtubule-associated protein 2 (MAP2),
and neuronal nuclei protein (NeuN) (del Valle et al., 2010; Manich et al., 2011).
Interestingly, both the number and size of the Aβ42 immunoreactive plaques are
increased also in the cortex of SAMP8 mice with age (Morley et al., 2000). The
chronological appearance of the most relevant neuropathological hallmarks in this
model is represented in Fig. 6.
Overall, SAMP8 as spontaneous model, with distinct advantages over the gene-
modified models, is considered to be a valuable resource to explore the
etiopathogenesis of sporadic AD.
Figure 6. Phenotypical characteristics developed by the SAMP8 mouse model. Schematic representation of the chronological appearance of the phenotypical characteristics in the sporadic Alzheimer’s disease model.
102 3 4 5 6 7 8 11 12months
9
Oxidate stress
Cognitive decline
Neuroinflammation
Tau phosphorilation
Autophagy dysfunction
10SAMP8
Soluble Aβ

Introduction
22
4.2. The APP/PS1 model
The APP/PS1 mouse model was first described by Jankowsky and co-workers
(2001). In this mouse line, two genetic strategies are combined to reach elevated Aβ
levels: overexpression of the human amyloid precursor protein encoding gene with the
Swedish mutation (APPswe) together with the mutant presenilin-1 gene (PS1dE9),
which additionally impairs amyloid protein processing leading to elevated Aβ42 levels
(Kurt et al., 2001; Radde et al., 2006). In the APPswe mutation, Leu and Lys are
substituted by Asn and Met at the end sites of 670 and 671 coding sequence of APP.
Additionally, PS1dE9 is the ninth exon deletion in the familial AD.
It has been reported that these mice present small amounts of Aβ depositions in
hippocampus at 6 months (Végh et al., 2014) and senile plaques in hippocampus at 8
months and (Krauthausen et al., 2015). Likewise, increasing Aβ levels lead to deficits in
lysosomal proteolysis, axonal transport and autophagy (Bero et al., 2012; Torres et al.,
2012). However, the level of hyperphosphorylated Tau remains low and does not form
neurofilaments (Kurt et al., 2003).
Moreover, APP/PS1 mice are characterised by intensive gliosis (Malm et al., 2007;
Yan et al., 2009; Jardanhazi-Kurutz et al., 2011) and increased levels of
proinflammatory cytokines and TNF-α (Craig-Schapiro et al., 2009; Fuster-Matanzo et
al., 2013; McClean et al., 2015). Furthermore, it has been described that the oxidative
damage caused by over activation of microglia combined with defects in mitochondrial
activity (Trushina et al., 2012) significantly contributes to the observed reduction in
neurogenesis and cognitive deficits (Choudhry et al., 2012; Hamilton and Holscher.,
2012).
APP/PS1 mice show apparent learning and memory dysfunction at 6-8 months
(D’Amelio et al., 2011; Végh et al., 2014). More specifically, in the early phase of the
disease they suffer similarly to humans with AD, apparent loss in working and
contextual memory (Gong et al., 2004; Huntley and Howard., 2010; Kilgore et al., 2010;
Lagadec et al., 2012) and in the later phase of the disease, impaired spatial memory in
the MWM (Gong et al., 2004; Huntley and Howard., 2010; Kilgore et al., 2010; Lagadec
et al., 2012) (Fig. 7).
Regarding non-cognitive symptoms associated with AD, APP/PS1 show circadian
rhythm disruptions, motor functions alterations, depression, and anxiety (Pugh et al.,
2007).

Introduction
23
Figure 7. Development of the amyloid pathology in the APP/PS1 mouse model. Schematic representation of the time line of the appearance of the amyloid pathology in the familial Alzheimer’s disease model.
102 3 4 5 6 7 8 11 12months
9
Cognitive decline
Aβ depositions
Senile plaques
10APP/PS1
Neuroinflammation


HYPOTHESIS AND AIMS


Hypothesis and aims
27
AD is the most common form of dementia and one of the leading causes of
morbidity and mortality in the aging population. Although its exact etiology remains to
be elucidated, it is likely to result from complex interactions between genetic,
epigenetic, and environmental factors, with age as the main risk factor. Therefore,
understanding the changes and alterations that occur during aging is essential to
understand the aetiology of AD and to establish new pharmacological therapies. In this
line, several studies have identified a major role for the histone deacetylase SIRT2 in
aging and different neurodegenerative diseases, including AD.
Among all sirtuins, SIRT2 expression is found strongest in the brain. Although its
biological functions are not well described yet, mounting evidence indicates that excess
of SIRT2 might be deleterious to neurons; hence its inhibition is postulated as a novel
promising therapeutic strategy to tackle a wide variety of hallmarks that are altered
during aging and neurodegenerative diseases.
Based on the observations previously mentioned, the overarching aim of the
present study is to investigate SIRT2 inhibition as a future potential treatment for AD.
For this, we propose to evaluate the effectiveness of the compound 33i, a new potent
SIRT2-selective inhibitor, as a pharmacological strategy to prevent, improve or even
reverse the functional and molecular alterations in two different mouse models of AD
representing the sporadic and familial forms of the disease.
To achieve the main objective, the proposed specific aims are:
1. In vitro pharmacological and toxicological studies with the compound 33i
In this section we aim to confirm in vitro the inhibitory activity of the compound 33i
towards SIRT2 in a neuroblastoma cell line. Moreover, given the relationship
between HDAC inhibitors and DNA toxicity, we aim to investigate any potential
mutagenic or genotoxic effect. To this end, SH-SY5Y cells and Salmonella
typhimurium TA98 will be treated with increasing concentrations of the compound
33i.
1.1. To evaluate the potential inhibitory activity of 33i towards other HDACs.
1.2. To determine the cytotoxicity of 33i using the neuroblastoma cell model (SH-
SY5 cells).

Hypothesis and aims
28
1.3. To validate the inhibitory activity of 33i on SH-SY5Y cells. For this, two well-
known SIRT2 targets will be checked: the nuclear histone 4 and the
cytoplasmic α-tubulin.
1.4. To evaluate potential mutagenicity caused by the 33i or any of its metabolites.
1.5. To evaluate potential genotoxicity caused by the 33i on SH-SY5Y cells.
2. To study the behavioural and molecular consequences of SIRT2 inhibition on a
sporadic AD mouse model.
This section intends to study whether SIRT2 inhibition, by means of the 33i molecule, is
able to prevent/slow the age-dependent progression of the pathology in the SAMP8
mouse. To this purpose, 5-month-old SAMP8 (early treatment) and 8-month-old
SAMP8 (therapeutic treatment) as well as aged-matched SAMR1 mice will be treated
with 33i for 8 weeks. This will let us compare preventive and therapeutic
pharmacological interventions with 33i in different stages of the pathology and relate
them with aging and cognitive decline.
2.1. To confirm in vivo the inhibitory activity of 33i towards SIRT2 in the SAMP8
model.
2.2. To evaluate the behavioural consequences of an early treatment with 33i to 5-
month-old SAMP8 mice.
2.3. To evaluate the effects of an early 33i-treatment on the main
neuropathological hallmarks shown by 7-month-old SAMP8 mice: Tau
pathology, synaptic dysfunction, autophagy and neuroinflammation.
2.4. To evaluate the behavioural consequences of a therapeutic 33i treatment
administered to 8-month-old SAMP8 mice.
2.5. To evaluate the molecular effects of a therapeutic 33i treatment on the main
neuropathological hallmarks shown by 10-month-old SAMP8 mice: Tau
pathology, amyloid pathology, synaptic dysfunction, autophagy and
neuroinflammation.

Hypothesis and aims
29
3. To study the behavioural and molecular consequences of SIRT2 inhibition on a
familiar AD mouse model.
To this purpose, 8-month-old APP/PS1 and its respective control will be treated
with 33i for 8 weeks. This will allow us to evaluate the effects of SIRT2 inhibition on
a familial model of AD as well as evaluate, in a more appropriate model, the effects
of the 33i on the Aβ pathology.
3.1. To evaluate the behavioural consequences of 33i on APP/PS1 mice.
3.2. To evaluate the effects of 33i on Aβ plaques, which the main
neuropathological hallmark shown by this transgenic mouse model.


EXPERIMENTAL DESIGN AND METHODS


Experimental design and methods
33
1. In vitro model
SH-SY5Y cell lines were used as an in vitro model. This cell line is a subline of
SK-N-SH (ATCC (®) HTB-11™) which was originated from a metastatic bone marrow
from a 4-year old female with Neuroblastoma, first reported in 1973 (Biedler et al.,
1973). The parental line was sub-cloned three times from SK-N-SH, first to SH-SY,
then SH-SY5, and finally producing SH-SY5Y which was initially described in 1978
(Biedler et al., 1978). The group of cells have a distinct neuron-like characteristic and
can produce immortalized cell lines, which is easily maintained and sub-cultured,
representing a highly controllable environment due to neuroblastomas having one of
the highest rates of spontaneous tumour regression (Thiele et al., 1999). The human
Neuroblastoma clonal SH-SY5Y cells were obtained from American Type Culture
Collection (ATCC) and stored in aliquots at −150°C. Cells were taken out from the
freezer and plated in a T75 flask (10mL of DMEM in each flask) in the presence of
Dulbecco's Modified Eagle Medium (DMEM, Sigma) supplemented with 10% fetal
bovine serum (FBS) and 0.1% Penicillin and Streptomycin (PEST); (DMEM +/+) and
maintained at 37ºC under 5% CO2/95% air.
2. In vivo models
For aim 2, experiments were carried out in male SAMP8 (28-30 g) and SAMR1
(35-39 g). These animals were bred from founders provided by Dr Pallàs (University of
Barcelona, Spain). Animals were housed (5 per cage) in constant conditions of
humidity and temperature (22 ± 1ºC) with a 12-hour/12-hour light-dark cycle (lights on
at 7:00 hours). Food and water were available ad libitum. Only males were used for the
present study because female SAMP8 mice have less robust memory changes than
male SAMP8 mice (Flood et al., 1995). Animals were weighed and assessed weekly
before starting with the treatment and daily throughout the study. All the procedures
followed in this work and animal husbandry were conducted according to the principles
of laboratory animal care as detailed in the European Communities Council Directive
(2013/53/EC) and were approved by the ethical committee of the University of Navarra.
All efforts were made to minimize animal suffering and to reduce the number of animals
used in the experiments.
For aim 3, male APP/PS1 (40-45 g) and WT (40-45 g) obtained from Jackson
(034832-JAX, MMRRC) (Jankowsky et al., 2004) were used. Animals were housed (5
per cage) in constant conditions of humidity and temperature (22 ± 1ºC) with a 12-
hour/12-hour light-dark cycle (lights on at 6:00 hours). Food and water were available

Experimental design and methods
34
ad libitum. Behavioural testing was performed during the light phase. All experiments
were approved by the Institutional Animal Care and Use Committee at Columbia
University and the New York State Psychiatric Institute.
3. Experimental design
3.1. Aim 1: In vitro pharmacological and toxicological studies with the compound 33i
SH-SY5Y cells were seeded in 6-well plates at a concentration of 1x10⁶ cells/mL
and once settled and confluents they were treated with 33i compound (Suzuki., 2012)
at different concentrations for 3 hours in an incubator at 37°C and 5% CO2.
The compound 33i was dissolved in dimethyl sulfoxide (DMSO) to obtain a stock
solution of 5 mM. For cell viability, survival and proliferation assessment, the following
final concentrations were used: 0.1, 0.5, 1, 5, 10, 20, 50 and 100 μM.
For the confirmation of the inhibitory effect of 33i towards SIRT2, cells were
treated with different concentrations of 33i (0.1, 1 and 5 μM) for 3 and 6 hours. These
concentrations were chosen based on the results obtained in the MTT assay (see point
5). The cells were then transferred in an ice-cold lysis buffer (PBS) and then
centrifuged at 1200 rpm for 10 minutes at 4ºC. Afterwards, the supernatant was
removed, and the samples were stored at -80ºC until use.
To evaluate the mutagenicity, the Ames test was carried out using Salmonella
typhimurium TA98 treated for 24 hours with the following range of 33i concentrations
0.5, 5, 50, 500 and 5000 μg/plate.
To assess the possible genotoxic effects of 33i, the comet assay was performed in
SH-SY5Y cells treated with 33i (0.1, 1, 5, 10 and 20 μM) for 3 hours.
3.2. Aim 2: To study the behavioural and molecular consequences of SIRT2 inhibition on a sporadic AD mouse model
The compound 33i was prepared in suspension using 18% tween 80 and 5%
DMSO in saline and administered i.p. at 5 mg/kg once daily. The dose was chosen
based on a preliminary study carried out in our laboratory (Erburu et al., 2017).
In a first experiment, 2-month-old and 9-month-old SAMP8 and SAMR1 animals
(n=7 animals per group) were sacrificed by cervical dislocation and hippocampal tissue
was prepared for SIRT2 analysis by western blot.

Experimental design and methods
35
In order to evaluate the inhibitory activity and pharmacological effect of 33i, 3-
month-old SAMP8 and SAMR1 animals (n=6 animals per group) were treated with
vehicle (Tween 80 18%, DMSO 5% in saline) or 33i (5 mg/kg i.p. every 24 hours, 5
days) and sacrificed 2 hours after last administration. Hippocampal tissue was
prepared for acetylated histone 4 and abca1 expression.
The next sets of experiments were designed to evaluate whether SIRT2 inhibition
with 33i treatment could prevent (early treatment) or reverse (therapeutic treatment) the
age-dependent progression of the pathology in SAMP8 mice. Sample sizes were
chosen following previous studies in our laboratory using the same model (Orejana et
al., 2012, 2013, 2015) and using one of the available interactive web sites
(http://www.biomath.info/power/index.html).
5-month-old SAMP8, with a mild cognitive impairment but not evident
neuropathological signs (early treatment) or 8-month-old SAMP8 mice, with an
established cognitive impairment and neuropathological alterations (therapeutic
treatment), were treated intraperitoneally once a day with 33i (5 mg/kg) or vehicle (18%
Tween 80, 5% DMSO in saline) for 8 consecutive weeks (Fig. 8). Aged-matched
SAMR1 control mice followed the same experimental designed. Animals were
randomised for treatment.
For the early treatment group, 2 SAMP8 mice had to be withdrawn from the study
since they presented a significant physical deterioration being impossible for them to
carry out the behavioural tests. The final number of animals per group in this
experiment was: SAMR1-vehicle n=10; SAMR1-33i n=12; SAMP8-vehicle n=8;
SAMP8-33i n=10.
For the therapeutic treatment group, 10 animals were selected for each group, but
4 SAMP8-vehicle mice died during the first 3 weeks of treatment and one SAMR1
treated with 33i had to be removed from the experiment due to skin wounds and a poor
general condition. Therefore, the final number of animals in each group that performed
the behavioural tests was SAMR1-vehicle n=10; SAMR1-33i n=9; SAMP8-vehicle n=6;
SAMP8-33i n=10.
Behavioural tests started at the beginning of the 6th week. The days in which the
behavioural study took place, 33i was given at the end of the behavioural tests. Mice
were sacrificed 1 hour after the last trial of the Morris Water Maze. Therefore, the last
drug injection took place 20-24 hours before the sacrifice.

Experimental design and methods
36
For Chromatin immunoprecipitation assay, 3-month-old SAMR1 were treated daily
with 33i (5 mg/kg i.p.) or vehicle (n=4 animals/group) for 5 consecutive days. Mice were
sacrificed 2 hours after last administration.
Figure 8. Experimental design of 33i administration in the SAMP8 model. 5-month-old (early treatment) or 8-month-old (therapeutic treatment) SAMR1 and SAMP8 mice were treated daily with 33i (5 mg/kg i.p.) or the vehicle used to prepare 33i (see material and methods) for 8 consecutive weeks. Behavioural tests started at the beginning of the 6
th week. During these
days, 33i or vehicle were given at the end of the behaviour test. Mice were sacrificed after the last trial of the Morris Water Maze. The last injection was administered 24 hours before the sacrifice.
3.3. Aim 3: To study the behavioural and molecular consequences of SIRT2 inhibition on a familiar AD mouse model
To study the effect of 33i on this mouse model, 8-month old APP/PS1 and WT
mice were treated i.p. once a day with 33i (5 mg/kg) or vehicle (Tween 80 18%, DMSO
5% in saline) for 7 consecutive weeks. The number of animals in each group that
performed the behavioural tests was WT-vehicle n=11; WT-33i n=6; APP/PS1-vehicle
n=12; APP/PS1-33i n=13. The dose was chosen based on the results obtained in the
SAMP8 model (see previous chapter). Behavioural tests started at the beginning of the
6th week. During these days, 33i was given at the end of the behaviour test, being the
last injection 24 hours before the sacrifice. Methoxy-X04 (10 mg/kg) was administered
24h before sacrifice to label Aβ plaques (Fig. 9).
months
Sacrifice
Early treatment Therapeutic treatment
Sacrifice
(Vehicle or 33i, 5mg/kg) (Vehicle or 33i, 5mg/kg)
Behavioural tests
Spontaneous motor activity
Rotarod
Marble burying
Morris Water Maze
SAMR1
SAMP8
3 4 5 6 7 8 9 10
ArcCreERT2
Biochemical studies
AD neurophatological hallmaks
Autophagy
Learning and memory-related proteins
Neuroinflammation

Experimental design and methods
37
months
Treatment
Sacrifice
(Vehicle or 33i, 5mg/kg)
APP/PS1
WT
3 4 5 6 7 8 9 10
ArcCreERT2
Open field
NSF
Marble burying
Light Dark box
Forced swimming test
NORT
Behavioural tests
4-methoxy
Biochemical studies
Quantification of amyloid plaques
Figure 9. Experimental design of 33i administration in the APP/PS1 model. 8-month-old APP/PS1 and WT were treated daily with 33i (5 mg/kg i.p.) or vehicle used to prepare 33i (see material and methods) for 6 consecutive weeks. Behavioural tests were performed at the beginning of the 6
th week. During these days, 33i or vehicle were given at the end of the
behaviour test. The last 33i injection was administered 24 hours before the sacrifice. Methoxy-X04 was administered 24h before sacrifice.
4. HDACs enzyme activity assays
In order to see whether the 33i compound has inhibitory activity on other HDACs,
an enzyme activity assay was performed. In this context, the affinity of 33i for class I
HDACs (HDAC1, HDAC2 and HDAC3) and class IIb (HDAC6) isoforms was tested as
they have been implicated in AD memory-related dysfunction and are thought to be
critical in the control of multiple memory-related genes (Ding et al., 2008; Guan et al.,
2009; Cuadrado-Tejedor et al., 2017).
HDACs enzyme activities were measured with a specific fluorescence-labelled
substrate (BPS Biosciences, Cat #50037) after its deacetylation by HDACs. The
fluorogenic substrate, containing an acetylated lysine side chain, can be deacetylated
and then sensitized to subsequent treatment with the lysine developer, which produces
a fluorophore that can be measured with a fluorescence plate reader. Human HDAC1
(GenBank Accession No. NM_004964), full length, with C-terminal His-tag and C-
terminal Flag-tag, was obtained from BPS Biosciences (Cat. #50051). Human HDAC2
(GenBank Accession No. NM_001527), full length, with C-terminal His-tag was
obtained from BPS Biosciences (Cat. #50002). Human HDAC3 (GenBank Accession
No. NM_003883), full length, with C-terminal His-tag and human NCOR2, N-terminal
GST-tag was obtained from BPS Biosciences (Cat. #50003). Human HDAC6
(GenBank Accession number No.BC069243), full length with N-terminal GST tag was
obtained from BPS Biosciences (Cat. #50006). 5 µL of vehicle or tested compound 10x
concentrated prepared in assay buffer (BPS Biosciences, Cat #50031) were added in
black 96 well plates (final volume of 100 µL). The final percentage of DMSO was 1%. 5

Experimental design and methods
38
µL of HDAC1 (4 µg/mL) or HDAC2 (15 µg/mL) or HDAC3 (10 µg/mL) or HDAC6 (36
µg/mL) enzyme in assay buffer was added (final HDAC1, HDAC2, HDAC3 and HDAC6
concentration of 0.4 µg/mL, 1.5 µg/mL, 0.1 µg/mL and 3.6 µg/mL respectively) and the
reaction was started by the addition of 40 µL of reaction mixture containing 0.125
mg/mL BSA (final concentration of 0.1 mg/mL) and 12.5 µM of fluorogenic HDACs
substrate (final concentration of 10 µM). The reaction was incubated for 30 min at
37ºC. After incubation, the reaction was stopped with 50 µL of lysine assay developer
(BPS Biosciences, Cat #50030) and the fluorescence of each well was measured at
355 nm excitation and 460 nm emission in a Mithras plate reader (Berthold
Techonologies, Germany). Positive control was obtained in the presence of the vehicle
of the compounds. Negative control was obtained in the absence of HDAC enzyme
activity. A best fit curve was fitted using GraphPad Prism 6 to derive the half maximal
inhibitory concentration (IC50) from this curve.
5. MTT study
The MTT assay is the best-known method for determining mitochondrial
dehydrogenase activities in the living cells as a validated value for cell viability
assessment (Riss et al., 2004). For the MTT assay, the reagent used is (3-(4,5-
dimethylthiazol-2-yl)-2,5-diphenyltetrazolium bromide) tetrazolium. In the method, MTT
is reduced to a purple formazan by NADH. MTT formazan is insoluble in water and
forms purple needle shaped crystals in the cells, which after being solubilized with an
organic solvent, can be detected using a spectrophotometer.
When cells were confluent, the medium was removed and the treatment (200 µL of
33i at different concentrations) was added to each well, in an ascendant concentration
way. DMSO treated cells were used as control so the potential toxicity coming from the
solvent could be detected. After a 24-hour treatment, cell viability was checked using
the MTT study.
For this, after removing the media, 200 µL of the MTT reagent preparation (final
concentration 0.5 mg/mL in DMEM) were addes to each well. After incubating the plate
at 37°C for 2 hours, the MTT reagent was removed using a regular pipette.
Next, 100 µL of DMSO were added to each well and mixed thoroughly with a
pipette in order to lyse the cells and dissolve so that formazan purple crystals. The
intensity of the purple colour is directly proportional to the number of cells alive. The
absorbance was read at 595 nm on an Enzyme Linked InmunoSorbent Assay (ELISA)
plate reader.

Experimental design and methods
39
6. Ames test
The Ames test is a biological test used to evaluate the potential mutagenicity of a
compound. In the Ames test, the bacteria Salmonella typhimurium have an auxotrophic
mutation in one of the genes encoding the histidine amino acid, which is easily
detectable. These bacteria are histidine negative (His-) in such way that they can only
grow in an enriched medium with histidine. In order to determine whether a compound
is mutagenic or not, His- bacteria are exposed to such compound. If the product is
mutagenic, there will be a reversion of the His- mutation and, therefore, the bacteria will
be able to grow in a histidine-lacking medium.
Likewise, biotransformation reactions can produce modifications in the structure of
the testing compound so that the resulting metabolites can be more or less toxic or with
the same toxic potential. Hence, in addition of studying the product, it is necessary to
study the toxicity of its metabolites. As bacteria do not have metabolic machinery it is
necessary to add to the medium the enzymes that catalyse phase I and phase II
biotransformation reactions. These enzymes are present in the S9 fraction of rat liver
homogenate.
Firstly, to correctly perform the Ames test it is necessary to have a bacterial
phenotype control. In this case, specific characteristic of Salmonella typhimurium TA98
strain were evaluated:
- The strain TA98 has the UvrB gene deleted, which is the gene that is responsible
for repairing DNA damage. To determine this deletion, a part of the bacterial grass
was submitted to ultraviolet light for 10 seconds. The ultraviolet light produces
damage in the DNA but as the bacteria are not able to repair it, they could not
replicate. Hence, we did not see any bacterial growth.
- In addition, this stain has the Rfa gene deleted. This gene is responsible for
maintaining optimal porosity of the bacterial wall, repairing any damage that occurs
in it. To confirm this deletion, we added crystal violet, a substance of high
molecular weight that enters through the pores of the wall, causing swelling of the
bacteria, loss of the integrity of the wall and eventually lysis. Therefore, as
expected, there was no growth.
- TA98 Salmonella typhimurium is ampicillin resistant. As expected, it was able to
grow after adding ampicillin antibiotic.

Experimental design and methods
40
- TA98 Salmonella typhimurium is tetracycline sensitive. Therefore, as expected,
they did not grow.
For the present project, in order to evaluate a possible mutagenic effect of the 33i
compound, the TA98 Salmonella typhimurium was used, as it is the most sensitive
strain to mutations. The concentration of bacteria used was 2 x 10⁹ His- bacteria and 5
different concentrations of 33i dissolved in DMSO (0.5, 5, 50, 500 and 5000 μg/plate)
were tested in triplicates with and without S9 fraction. Once plated, bacteria went under
48 hour incubation in a 37ºC stove for correct growth and the number of colonies
observed was counted as an indicator of the possible mutagenicity of the compound
33i (Fig. 10).
Figure 10. Schematic diagram of the protocol followed in the Ames test. In order to assess the potential mutagenicity of 33i, this schematic diagram was followed in duplicate, meaning that firstly the experiment was carried out without the S9 homogenate and after it was carried out adding the S9 fraction.
7. Survival and Proliferation assay
Viability of the SH-SY5Y cells treated with different concentrations of 33i (0.1, 1, 5,
10 and 20 μM) was evaluated using the proliferation assay. SH-SY5Y cells were
seeded in 6-well plates at a concentration of 1x10⁶ cells/mL and once settled and close
to be subconfluent they were treated with 33i compound at different concentrations for
3 hours in an incubator at 37°C and 5% CO2. After exposure, cultures were washed
twice with PBS solution and neutralized with 2 mL of fresh cell culture medium without
treatment.
1/10 1/ 10 1/ 10 1/ 10
X 3 X 3 X 3 X 3 X 3 X 3 X 3
100 mg/mL 10 mg/mL 1 mg/mL 0.1 mg/mL 0.01 mg/mL Phenotype Control +/-
Stock solution
of 33i in DMSO
- 0.5 ml PBS
- 50 µL of 33i/DMSo for phenotype and controls
- 100 µL of bacteria Salmonella Typhimurium TA98
- 2 mL of soft agar

Experimental design and methods
41
Cells were counted before and after the treatment (to check the survival) and after
48 hours (proliferation) in fresh medium using the Neubauer chamber.
The total growth (TG) and the relative growth (RG) of each condition were
calculated as follow:
TG= number of cells at 48 h post-treatment
number of cells before the treatment
RG=TG in exposed cultures
TG in unexposed control cultures× 100
It was considered that the viability was affected when a decrease of more than
30% RG was obtained.
8. Comet assay
The genotoxicity of the 33i compound was evaluated using the alkaline comet
assay (single-cell gel electrophoresis), in combination with the enzyme
formamidopyrimidine DNA-glycosylase (Fpg). This test was performed to evaluate if
the compound 33i produces DNA strand breaks or oxidized bases (Fig. 11).
For the present study, SH-SY5Y cell lines were treated with different
concentrations of 33i (0.1, 1, 5, 10 and 20 μM) for 3 hours. Thirty microliters of the
cellular suspension of each sample were mixed with 140 μL of 1% low melting point
agarose in PBS at 37°C. Immediately, two drops of 70 μL each were placed on a glass
microscope slide (pre-coated with 1% normal melting point agarose in distilled water
and dried) and covered with 20 x 20 mm coverslips. Gels were set on a cold metal
plate for 5 min until the gels were gelified, then, coverslips were removed. Three slides
were prepared per condition: ‘Lysis’, ‘Buffer’ and ‘Fpg’.
Positive and negative assay controls were also included in each electrophoresis
run to assess the correct performance of the assay and the inter-assay reproducibility.
Positive controls were produced by treating SH-SY5Y with 20 µM methylsulfonate
(MMS) for 3 hours to induce oxide bases. Untreated cells were used as negative assay
controls.
After lysing the cells by immersion in lysis solution (2.5 M NaCl, 0.1 M Na2EDTA,
10 mM Trizma® base, pH 10.0, 1% Triton X-100) one hour at 4ºC, slides were washed
three times (5 min each) with the Buffer F (40 mM HEPES, 0.1 M KCl, 0.5 mM
Na2EDTA, 0.2 mg/mL bovine serum albumin, pH 8.0 Buffer F) at 4°C.

Experimental design and methods
42
Then, gels were incubated with Buffer F or Fpg by adding a drop of 45 µL of the
solutions on top of the corresponding ones. Each drop was covered with a 22 x 22 mm
coverslip and the gels were incubated in a humidified chamber at 37°C for 1 hour.
During this time ‘Lysis’ slides were kept immersed in the lysis solution at 4°C.
Alkaline unwinding of all slides was then performed by immersion in an alkaline
buffer (0.3 M NaOH, 1 mM Na2EDTA, pH>13) at 4°C for 40 minutes. After that,
electrophoresis was performed in the same buffer at 1.1 V/cm, 4ºC for 20 minutes.
Then, slides were firstly neutralised with PBS for 10 minutes at 4°C and secondly
washed in distilled water for another 10 minutes at 4°C. Lastly, they were air-dried at
room temperature.
The day after, the DNA in each gel was stained with 1 μg/mL of 4,6-diamidino-2-
phenylindole (DAPI), and comets were visualised under a fluorescence microscope
(NIKON Eclipse 50 i). DNA damage was quantified in 100 randomly selected comets
per slide (50 comets in each gel) by measuring the % tail DNA using the image
analysis software Comet Assay IV (Perceptive Instruments Ltd). For each slide, the
median value of the % tail DNA was calculated. DNA strand breaks and alkali-labile
sites (ALS) are measured in the ‘Lysis’ slide, while Fpg-sensitive sites were calculated
by subtracting the median value of the ‘Buffer F’ slide from the one obtained in the
‘Fpg’ slide.
Figure 11. Schematic diagram of the comet assay. Adapted from Azqueta and Collins, 2011.
Undamaged cell
(intact DNA)
Damaged cell
(strand breaks)
Damaged cell
(damaged bases )
Lysis
Unwinding
Electrophoresis
Lysis
Undigested Digested: FPG
Cells embeded in agarose
DNA strand breaks & ALS Oxidative bases
Neutralisation, staining and visualisation Neutralisation, staining and visualisation

Experimental design and methods
43
9. Behavioural tests
The behavioural tests were performed one per day following an increasing degree
of stress scale in order to minimise stress derived behavioral effects. Concerning the
SAMP8, the behavioural tests were performed in the following order: spontaneous
locomotor activity, marble burying, rotarod and Morris water maze test. In the APP/PS1
study the order was: spontaneous locomotor activity, marble burying, novel object
recognition, light-dark box, novelty-suppressed feeding and forced swimming test.
Spontaneous locomotor activity
The open field test is used to assess spontaneous locomotor activity and anxiety-
like behaviour. Locomotor activity was measured in an open field consisting of 8 black
square arenas (43 x 50 x 45 cm) in a softly illuminated experimental room. One mouse
was placed in each cage and distance travelled (cm) and speed was recorded during a
30 minutes period. The following parameters were recorded and analysed: total
distance travelled, number of entries into a predefined centre region and total time
spent in the centre. This behavioural test was recorded and analysed with Ethovision
XT 11.5; Noldus Information Technology B.V, Wageningen, Netherlands and ANY-
maze video-tracking system (Dublin, Ireland).
Marble burying
Exploratory behaviour usually present in normal mice behaviour was assessed
with this test. For the sporadic AD experiment, 12 marbles (1.5 cm diameter) were
placed uniformly in a cage (45 x 28 x 20 cm) containing a constant amount of sawdust
(3 cm deep). However, for the familial AD experiment, 16 marbles were placed
uniformly in a box (50 x 50 x 45 cm) containing a constant amount of sawdust (3 cm
deep). In both cases, mice were placed in the centre of the cage and left for 30
minutes. The number of marbles buried (2/3 covered with sawdust) after this period
was recorded by two experimenters.
Novel object recognition test (NORT)
The NORT is a test of short-term memory, perceptual discrimination, and novelty
detection. This cognitive task is unique in that does not require food restriction,
punishment, or reward. This task exploits the mouse’s natural tendency to explore
novel objects.
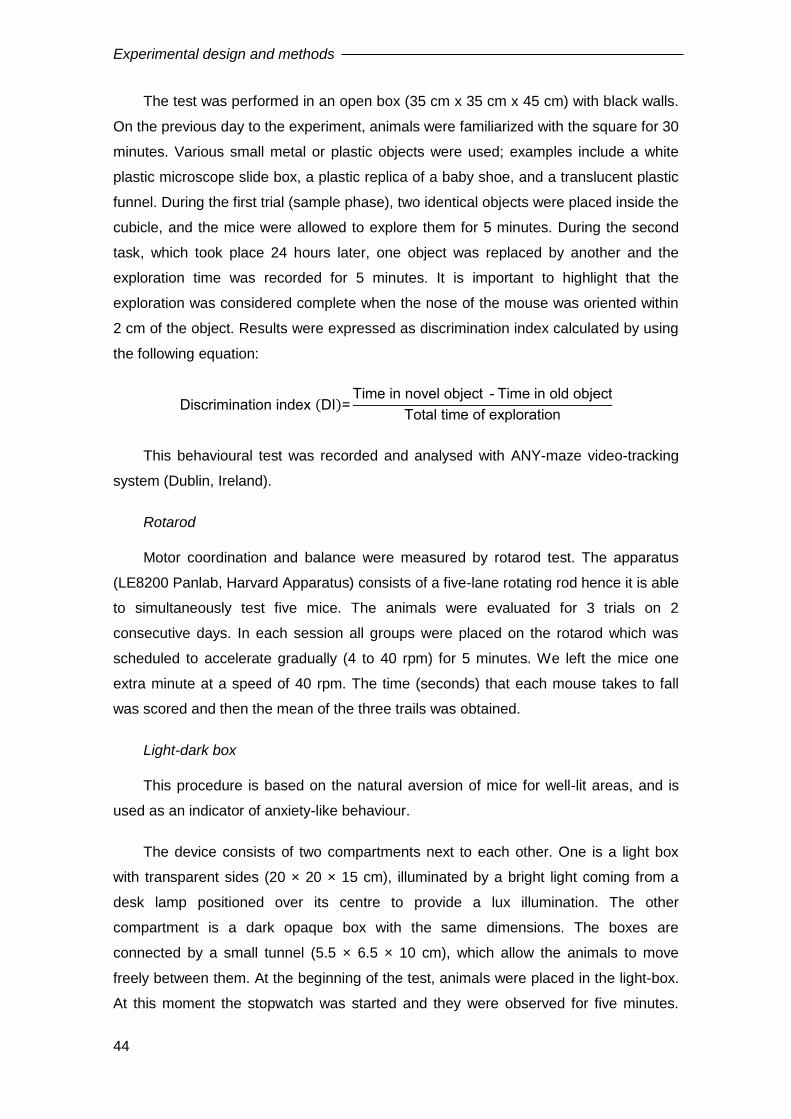
Experimental design and methods
44
The test was performed in an open box (35 cm x 35 cm x 45 cm) with black walls.
On the previous day to the experiment, animals were familiarized with the square for 30
minutes. Various small metal or plastic objects were used; examples include a white
plastic microscope slide box, a plastic replica of a baby shoe, and a translucent plastic
funnel. During the first trial (sample phase), two identical objects were placed inside the
cubicle, and the mice were allowed to explore them for 5 minutes. During the second
task, which took place 24 hours later, one object was replaced by another and the
exploration time was recorded for 5 minutes. It is important to highlight that the
exploration was considered complete when the nose of the mouse was oriented within
2 cm of the object. Results were expressed as discrimination index calculated by using
the following equation:
Discrimination index (DI)=Time in novel object - Time in old object
Total time of exploration
This behavioural test was recorded and analysed with ANY-maze video-tracking
system (Dublin, Ireland).
Rotarod
Motor coordination and balance were measured by rotarod test. The apparatus
(LE8200 Panlab, Harvard Apparatus) consists of a five-lane rotating rod hence it is able
to simultaneously test five mice. The animals were evaluated for 3 trials on 2
consecutive days. In each session all groups were placed on the rotarod which was
scheduled to accelerate gradually (4 to 40 rpm) for 5 minutes. We left the mice one
extra minute at a speed of 40 rpm. The time (seconds) that each mouse takes to fall
was scored and then the mean of the three trails was obtained.
Light-dark box
This procedure is based on the natural aversion of mice for well-lit areas, and is
used as an indicator of anxiety-like behaviour.
The device consists of two compartments next to each other. One is a light box
with transparent sides (20 × 20 × 15 cm), illuminated by a bright light coming from a
desk lamp positioned over its centre to provide a lux illumination. The other
compartment is a dark opaque box with the same dimensions. The boxes are
connected by a small tunnel (5.5 × 6.5 × 10 cm), which allow the animals to move
freely between them. At the beginning of the test, animals were placed in the light-box.
At this moment the stopwatch was started and they were observed for five minutes.
Experimental design and methods
45
The latency to enter the tunnel from the light box, the total time spent in the dark box
and the number of transitions across the tunnel were recorded. Importantly, an entry to
a box was recorded when the animal placed all four paws in the box. This behavioural
test was recorded and analysed with ANY-maze video-tracking system (Dublin,
Ireland).
Novelty-Suppressed Feeding (NSF)
The purpose of the NSF test is to assess anxiety-like behaviour when an animal is
faced with a conflict between two motivations: the drive to feed and the drive to avoid
an open and brightly lit novel environment.
According to the protocol, animals were food-deprived for 24 hours prior to the
test. Mice were weighed before and after food restriction to assess weight loss.
Immediately after the test, they were given food ad libitum again. Testing was
performed in a 50 x 50 x 45 cm box covered with bedding, and illuminated by a 70 watt
lamp. Pellets of food were placed in the centre of the box, on top of a piece of white
filter paper. The mice were tested individually by placing them in the box for a period of
5 minutes. The latency to begin feeding was recorded.
Forced swim test (FST)
The FST is used to test depression-like behaviour. Swim sessions are conducted
by placing mice in individual cylinders (46 cm tall x 32 cm in diameter) containing 30
cm deep water at 23-25°C. An initial 2-minutes pre-test, where the animal becomes
familiar with the testing apparatus, was immediately followed by a 4 minute test session
(total of 6 minutes). Swim sessions were videotaped and hand-scored later.
In order to analyse the mice immobility time during the test, a time-sampling
technique was employed. At the end of each 5 second period, the software scored the
mouse's immobility time. These data were cumulated for individual subjects and
expressed as mean counts per 4-minute period. The scoring system has demonstrated
excellent inter-rater reliability and validity with timed scoring methods.
Morris water maze test (MWM)
The Morris water maze (MWM) test was used to test spatial memory and to
evaluate the working and reference memory functions in response to treatment, as
previously described.

Experimental design and methods
46
The water maze was a circular pool (diameter of 145 cm) filled with water (21-
22°C) and virtually divided into four equal quadrants identified as northeast, northwest,
southeast and southwest. Firstly, mice underwent visible-platform training (habituation
phase) for 6 trials in one day in which a platform was located in the southwest quadrant
raised above the water.
Hidden-platform training (adquisition phase) was conducted with the platform
placed in the northeast quadrant 1 cm below the water surface over 8 consecutive days
(4 trials/day). Several large visual cues were placed in the room to guide the mice to
the hidden platform. Each trial was finished when the mouse reached the platform
(escape latency) or after 60 seconds, whichever came first. Mice failing to reach the
platform were guided onto it. After each trial mice remained on the platform for 15
seconds.
To test memory retention, 3 probe trials were performed at the beginning of the
day 4, day 7 and the last day of the test (day 9). In these probe trials, the platform was
removed from the pool and mice were allowed to swim for 60 seconds. The percent of
time spent in the target quadrant was recorded. All trials were monitored by a video
camera set above the centre of the pool and connected to a video tracking system
(Ethovision XT 11.5; Noldus Information Technology B.V, Wageningen, Netherlands).
10. Western blot
For aim 1, after treated SH-SY5Y had been homogenised with a lysis buffer
containing 10 mM Tris HCl, 1 mM NaF, 0.1 mM VaNO4 in the presence of protease and
phosphatase inhibitors, samples were sonicated and then centrifuged at 13000 rpm for
20 minutes at 4ºC. The supernatant which contained the cytosolic fraction was kept
and protein concentration was calculated by using the Bradford assay (Biorad
Laboratories).
For the electrophoresis, 15 µg of protein where loaded in each lane in a sodium
dodecyl sulphate-polyacrylamide gel (9%) under reducing conditions and it was
transferred into a nitrocellulose membrane.
For Aim 2, western blot analysis was carried out in hippocampal tissues collected
from mice killed 1 hour after the last trial of the MWM. Hippocampus was sonicated in a
cold lysis buffer with protease inhibitors (0.2 M NaCl, 0.1 M HEPES, 10% glycerol, 200
mM NaF, 2 mM Na4P2O7, 5 mM EDTA, 1 mM EGTA, 2 mM DTT, 0.5 mM PMSF, 1 mM
Na3VO4, 1 mM benzamidine, 10 mg/mL leupeptin, 400 U/mL aprotinin). The

Experimental design and methods
47
homogenate was centrifuged at 14000 g at 4ºC for 20 minutes and the supernatant
aliquoted and stored at -80ºC. Total protein concentrations were determined using the
BioRad Bradford assay (BioRad Laboratories, CA, USA).
To determine the APP carboxy-terminal fragments and Aβ oligomers, a sample of
hippocampus was homogenized in a buffer containing 2% SDS, 10 mM Tris-HCl (pH
7.4), protease inhibitors (Complete™ Protease Inhibitor Cocktail, Roche) and
phosphatase inhibitors (0.1 mM Na3VO4, 1 mM NaF). The homogenates were
sonicated for 2 minutes and ultracentrifuged at 100000g for 1 hour at 4ºC. The protein
concentrations were determined by the Bradford method using the Bio-Rad protein
assay (Bio-Rad, Hercules, CA, USA).
For ubiquitinated proteins determination, hippocampal tissues were lysed with NP
buffer (150 nM NaCl, 1% NP-40, 1 mM EDTA, 5% glycerol, 25 mM Tris-Cl pH 7.5) and
protease inhibitor cocktail and left on ice for 20 minutes. After centrifugation at 16000
rpm for 5 minutes, we collected the supernatant containing the NP-soluble fraction (Gal
et al., 2012). Protein concentration in each sample was calculated using the Bradford
assay.
Equal amounts of protein (40 µg) were separated by electrophoresis on a sodium
dodecyl sulphate-polyacrylamide gel (6% or 9%) under reducing conditions and
transferred onto a nitrocellulose membrane (Hybond-ECl; Amersham Bioscience, CA,
USA). The trans blots were blocked with Odyssey ® Blocking Buffer (PBS) (LI-COR®)
in TBS for 1 hour. Membranes were probed overnight at 4ºC with the primary
antibodies (1:1000 dilution) detailed in Table 4. Odyssey® goat anti-rabbit and anti-
mouse secondary antibodies (1:5000; Odyssey, LI-COR®, Lincoln, USA) were used.
Bands were visualized using Odyssey Infrared Imaging System (LI-COR
Biosciences, Lincoln, NE, USA). Depending on the proteins analysed in each
membrane, β-actin or β-Tubulin (1:10000, Sigma-Aldrich, St. Louis, MO, USA) were
used as internal control. Results were expressed as % optical density vs. Control or %
optical density vs. SAMR1 vehicle mice.

Experimental design and methods
48
Table 4. List of primary antibodies used for Western blot studies.
APP processing
To analyse APP fragments, 50 µg of protein were mixed with XT sample buffer™
(Bio-Rad, Hercules, CA) plus XT reducing agent™ (Bio-Rad, Hercules, CA) and
boiled for 5 minutes. The proteins were separated in a Criterion™ X precast Bis-Tris
4–12% (Bio-Rad, Hercules, CA).
The gels were transferred to nitrocellulose membranes. The membranes were
blocked with 5% fat-free milk, 0.05% Tween-20 in TBS followed by overnight incubation
with rabbit polyclonal antiserum raised against the C-terminal of APP (1:2000) (Sigma-
Aldrich, St. Louis, MO, USA). After two washes in PBS or TBS/Tween-20 and one
wash in TBS alone, the proteins were detected with HRP-anti-rabbit antibody (1:5000,
Antibody Host Reference
6E10 Mouse Sig-39320, Covance
Acetylated -Tubulin Mouse T7451, Sigma-Aldrich
AcH4 Rabbit 06-866, Merck Millipore
ARC H-300 Rabbit Sc15325, Santa Cruz Biotechnology
Beclin 1 Rabbit 3738, Cell Signaling Technology
CD11b Rabbit NB 110-89474, Novus biologicas
CREB (48H2) Rabbit 9197L, Cell Signaling Technology
CT19 Rabbit 751-770, Sigma-Aldrich
GFAP Mouse 3670, Cell Signaling Technology
GluA1 Rabbit Ab1504, Merck Millipore
GluN2A Rabbit 07632, Merck Millipore
GluN2B Mouse 05-920, Merck Millipore
Histone 4 Rabbit 07-108, Merck Millipore
Lamin A/C Rabbit 2032, Cell Signaling Technology
LC3-II Rabbit Ab48394, Abcam
Myelin Basic Protein Rabbit 78896S, Cell Signaling Technology
p-CREB Mouse 05-807, Merck Millipore
p-GluA1 Rabbit 04-823, Merck Millipore
p-Tau (AT8) Mouse MN 1020, Thermo Fisher Scientific
Pro-BDnF Rabbit Ab72439, Abcam
PSD95 Rabbit 2507, Cell Signaling Technology
ROCK2 Rabbit 8236, Cell Signaling Technology
SIRT1 Mouse S5196, Sigma-Aldrich
SIRT2 Rabbit S8447, Sigma-Aldrich
Synaptophysin Mouse Ab8049, Abcam
Total Tau Mouse T9450, Sigma-Aldrich
β-Actin Mouse A1978, Sigma-Aldrich
β-Tubulin Rabbit T2200, Sigma-Aldrich
Experimental design and methods
49
Cell signaling), and they were visualized by enhanced chemiluminiscence (ECL, GE
Healthcare Bioscience) and autoradiographic exposure to Hyperfilm ECL (GE
Healthcare Bioscience). Signals were quantified using the Quantity One™ software
v.4.6.3 (Bio-Rad, Hercules, CA).
Aβ oligomers
To analyse Aβ oligomers, 50 µg of protein extracts were boiled for 1 minute. The
proteins were separated in a 15% acrylamide gel.
The gels were transferred to nitrocellulose membranes. The membranes were
blocked with 5% fat-free milk, 0.05% Tween-20 in TBS followed by overnight incubation
with rabbit polyclonal antiserum raised against the 6E10 mouse monoclonal antibody
(amino acids 1-16 of A peptide, 1:1000, Covance, NJ, USA). After two washes in
TBS/Tween-20 and one wash in TBS alone, the proteins were incubated with
Odyssey® goat anti-mouse secondary antibodies (1:5000; Odyssey, LI-COR®, Lincoln,
USA). Bands were visualized using Odyssey Infrared Imaging System (LI-COR
Biosciences, Lincoln, NE, USA). β-actin (1:10000, Sigma-Aldrich, St. Louis, MO, USA)
was used as internal control. Results were expressed as % optical density vs. SAMR1-
vehicle mice.
11. Quantification of Aβ by Enzyme-Linked Immunosorbent Assay
Total Aβ42 and Aβ40 burden was measured in the hippocampus of the animals as
previously described by Orejana et al., (2015). Briefly, each hippocampus was
homogenized in 70% formic acid (15 mg of tissue in 100 μL of 70% formic acid).
Homogenates were then centrifuged at 100000g for 60 minutes. The supernatant was
neutralized with a 20-fold dilution in 1 M Tris base. High-sensitive enzyme linked
immunosorbent assay kits from Wako (cat #292–64501) for Aβ42 and (cat #294-
64701) for Aβ40, Wako Chemicals, Richmond, VA) were used following the
manufacturer’s instructions.
12. RNA Extraction and Real-time Reverse Transcriptase–PCR
Total RNA was isolated separately from each individual frozen hippocampus
sample. Isolation of total RNA was carried out according to manufacturer’s instructions
(NucleoSpin RNA II kit, Macherey-Nagel, Germany). Reverse transcription was
performed using random hexamers as primers and Superscript reverse transcriptase III
(Invitrogen, Cergy Pontoise, France). The eluates were stored at -20ºC.

Experimental design and methods
50
Real-time reverse transcriptase-PCR amplification assays for gene targets were
performed an ABI PRISM 7000 HT Sequence Detection System following the
manufacturer's recommendations (Applied Biosystems, CA, USA). Thermal cycling
conditions were 2 minutes at 50°C and 10 minutes at 95°C, followed by 40 cycles of
denaturation at 95°C for 15 seconds and annealing and extension at 60°C for 1 minute.
Primers for Abca1, Glun2a, Glun2b, Gria1, Il-1β, Il-6 and Tnf-α were used (Applied
Biosystems, CA, USA) (Table 5).
Table 5. List of primers used for q-PCR studies.
Each cDNA prepared was used in triplicate for the real-time PCR procedures for
each gene tested, and the results were calculated as the average of triplicated results.
GAPDH was used as internal control to normalize the amount of RNA used from
different samples.
Samples were analysed by a double delta CT (∆∆CT) method. Delta CT (∆CT)
values represent normalized target genes levels with respect the internal control.
Normalization was based on a single reference housekeeping gene (GAPDH). The
relative quantification of all targets was carried out using the comparative cycle
threshold method, 2-∆∆Ct, where ∆∆Ct= (Ct target gene – Ct endogenous control)
treated / (Ct target gene – Ct endogenous control) untreated. Relative transcription
levels (2 - ∆∆Ct) were expressed as a mean ± standard error of the mean.
13. Quantification of IL-1β in brain lysates
The forebrain was sonicated in a specific lysis buffer (Cell Lysis Buffer 2, R&D
systems, Catalog 895347) at 1:4 dilution, incubated on ice for 30 minutes and
centrifuge 12 minutes at 13000 rpm at 4ºC. 50 μL of the resulting supernatant was
assayed for levels of IL-1β using the Quantikine ELISA kit (R&D systems, Catalog#
MLB00C) following the manufacturer’s instructions. Each sample was analysed in
duplicate.
Gene Reference
Abca1 Mm0042646_m1
Gria1 Mm00433753_m1
Grin2a Mm00433802_m1
Grin2b Mm00433820_m1
Il1-β Mm00434228-m1
Il-6 Mm00446190_m1
Tnf- Mm00443258_m1

Experimental design and methods
51
14. Immunohistochemistry
Astrocyte and microglia immunofluorescence quantification
To confirm the presence of reactive astrocytes and/or microglia in the
hippocampus, the brains of three mice per experimental group were histologically
processed For this purpose, one brain hemisphere was postfixed for 24 hours with
paraformaldehyde 4% after dissection and conserved in sucrose 30% for one week
after. For immunofluorescence, free-floating brain sections were washed (3x10
minutes) with PBS 0.1 M (pH 7.4) and incubated in blocking solution (PBS containing
0.3% Triton X-10, 0.1% BSA, and 2% normal donkey serum) for 2 hours at room
temperature. Primary and secondary antibodies were diluted in the blocking solution.
Sections were incubated with the primary antibody anti-GFAP (1:500) (Cell Signaling,
Danvers, MA, USA) or CD11b (1:500) (Novus biologicals) overnight at 4ºC, washed
with PBS and incubated with the secondary antibody (Alexa Fluor Anti-mouse 546,
Thermo Fisher, Pittsburg, PA, USA) for 2 hours at room temperature, protected from
light. For better visualization of nuclei, Southern Biotech TM Dapi-Fluoromount GTM
clear mounting media (Fisher Scientific, Pittsburg, PA, USA) was used. To ensure
comparable immunostaining, sections were processed together under identical
conditions. Fluorescence signals were detected with Nikon Eclipse E800 (Nikon,
Shinagawa, Tokyo, Japan). Quantification of fluorescent signal in brain sample images
was carried out using a plugin developed for Fiji7ImageJ, an open-source Java-based
image processing software. The plugin was developed by the Imaging Platform of the
Centre for Applied Medical Reseach (CIMA, Pamplona, Spain).
Amyloid plaque immunofluorescence quantification
For the amyloid plaque quantification, mice were deeply anesthetized with
ketamine (100 mg/kg) and transcardially perfused with cold 0.1M PBS in order to clean
organs, followed by cold 4% paraformaldehyde (PFA)/0.1 M PBS. Brains were
postfixed overnight in 4% PFA at 4ºC, then cryoprotected for 4-5 days in 30%
sucrose/0.1 M PBS, and stored at 4ºC. Before freezing the brains, they were covered
with O.C.T embedding medium in a specific plastic container. Serial coronal sections
(100 µM) were cut through the entire brain on a microtome (Microm HM440E). Then,
the sections were collected and stored into in a 12 well plate in 0.1 M PBS with 0.1%
NaN3.
Cuts containing the hippocampus were washed with PBS, 3 times for 10 minutes
each. They were then dehydrated in 50% metanol/PBS at room temperature for 2.5

Experimental design and methods
52
hours followed by a series of 3 washes in 0.2% PBS Tween (PBST) of 10 minutes
each. After blocking in 0.2% PBST, 10% DMSO and 6% normal donkey serum for 2
hours at room temperature, the brain cuts were washed in PBS/0.2% Tween-20 with 10
ug/mL heparin (PTwH) 3 times for 10 minutes each at room temperature. Sections
were then ready to mount and to be viewed in an automated microscope (Zeiss
Axioplan 2ie, Carl Zeiss Microscopy, Jena, Germany). Immunoreactive plaques
quantification was carried out manually using Fiji7ImageJ.
15. Chromatin Immunoprecipitation
Chromatin immunoprecipitation (ChIP) assay was performed to measure the levels
of histone 4 acetylation at various promoter regions. For this, mouse cerebral cortex
was used. The tissue was fixed in a solution of 4% paraformaldehyde overnight. After 3
washes of 12 minutes with glycine buffer in PBS 0.125 M, followed by another 3
washes of 10 minutes at 4ºC with PBS, the samples were homogenized in lysis buffer
[Triton X-100 0.25%, NP-40 0.50%, EDTA 10 mM, EGTA 0.5 mM, Tris-HCl 10 mM (pH
8.0), PMSF 1 mM and protease inhibitors (Complete® Protease Inhibitor Cocktail,
Roche)].
The obtained tissue lysates were centrifuged at 600 g for 5 minutes, collecting the
precipitate which contained the nuclei. The nuclear precipitate was resuspended in 1
mL of resuspension buffer [10 mM EDTA, 1% SDS, 50 mM Tris-HCl (pH 8.0), 1 mM
PMSF and protease inhibitors (Complete® Protease Inhibitor Cocktail, Roche)].
Aliquots of 500 μl were subjected to 12 cycles of 30 minutes sonication (Bandelin
sonicator) (30 seconds pause between pulses) at 4ºC in order to fragment the
chromatin into segments of about 200 base pairs. After sonication, the samples were
subjected to a 15 minutes centrifugation of 19000 g at 4ºC. Next to the centrifugation,
the supernatant, which contained the chromatin, was collected.
The supernatant was diluted 5 times in a buffer containing 1 mM EDTA, 0.01%
SDS, 1.1% Triton X-100, 167 mM NaCl, 16.7 mM Tris-HCl (pH 8.1) and proteases
inhibitors (Complete® Protease Inhibitor Cocktail, Roche). Then, the samples were pre-
cleared with 80 μl protein A/G bound to agarose under gentle agitation for 2 hours at
4°C, in order to eliminate proteins that bind non-specifically to agarose.
Afterwards, the samples were centrifuged for 2 minutes at 100 g and 4°C,
collecting the supernatant. 20 μl of the supernatant was reserved as an input of the
chromatin immunoprecipitation in order to normalize the final results against the
starting material. The rest of the supernatant was incubated with 5 μg of anti-acH4
Experimental design and methods
53
antibody (#06-866, Upstate) or the control antibody (IgG, #10500C, Thermo Fisher)
overnight under gentle stirring at 4ºC.
In order to collect the DNA-AcH4 complexes, 80 μl A/G protein bound to agarose
was added to each sample, incubating the whole in gentle agitation for 2 hours at 4°C.
After this time, the samples were centrifuged at 19000 g for 3 minutes. The complexes
were subjected to successive washes with the following solutions: low salt
concentration [SDS 0.1%, Triton-X100 1%, EDTA 2 mM, Tris-HCl 20 mM (pH 8.1) and
NaCl 150 mM], high saline concentration [SDS 0.1%, Triton-X100 1%, EDTA 2 mM,
Tris-HCl 20 mM (pH 8.1) and NaCl 1.5 mM], LiCl buffer [LiCl 0.25 mM, NP-40 1%,
DOC 1%, EDTA 1 mM and Tris-HCl 10 mM (pH 8.0)] and 2 washes with TE buffer (1
mM EDTA and 10 mM HCl). After the washes, the DNA-AcH4 complex was eluted by
adding 250 μl of elution buffer (1% SDS and 0.1 M NaHCO3) to each sample, vortexing
for 15 minutes at room temperature and subsequent 3 minutes centrifugation at 19000
g, collecting the supernatant. The elution process was repeated 2 times by joining the
supernatant.
At this point, the DNA-protein binding was reversed by adding 2U of RNAase H, 1
μg of proteinase K and NaCl to each sample to a final concentration of 300 mM,
subsequently incubating the assembly for 1 hour at 45ºC and 4hours at 65°C. The
samples were then centrifuged at 14000 rpm for 10 minutes at room temperature
collecting the supernatant. The possible protein residues were then eliminated by the
addition of 1 volume of phenol/chloroform/isoamyl to each sample, collecting the
aqueous phase of the solution to which 3 M NaAc (0.1 volume) and 100% ethanol (2.5
volume) were added to precipitate the DNA at -20ºC overnight. After washing the
precipitate with 70% ethanol, it was resuspended in 50 μl of sterile water, preserving it
at -20°C until its use (Fig. 12). Recovered chromatin fragments were subjected to
semiquantitaive PCR for 32 cycles using primer pairs specific for 150-250 bp segments
corresponding to mouse genes promoter regions:
NR2A TCGGCTTGGACTGATACGTG
AGGATAGACTGCCCCTGCAC
NR2B CCTTAGGAAGGGGACGCTTT
GGCAATTAAGGGTTGGGTTC
GAPDH GGATGCAGGGATGATGTTC
TGCACCACCAACTGCTTA

Experimental design and methods
54
Figure 12. Schematic diagram of the protocol followed in the chromatin immunoprecipitation.
Real-time PCR
In order to detect the amplicons produced, SYBR™ Green fluorophore (Sigma)
was used, which when intercalated with the double strand of DNA produces a
fluorescent signal proportional to the number of synthesized DNA strands.
All samples were analysed in triplicate in a 96-well plate using the ABI Prism 7300
thermal cycler (Applied Biosystems). The reaction volume of each well was 10 μl,
composed of: 4 μl of cDNA obtained from the retrotranscription (1.25 ng/μl), 0.5 μl of 10
μM forward primer, 0.5 μl of 10 μM reverse primer and 5.0 μl of Power SYBR™ Green
PCR Master Mix (Applied Biosystems).
16. Aβ plaque fluorescent labelling with methoxy-X04 injection
Methoxy-X04 was used to fluorescently label the Aβ plaques in the AP/PS1 mouse
brains. 10 mg of methoxy-X04 were dissolved in 4.5 mL of propyleneglycol, 4.5 mL of
PBS 1X and 1 mL of DMSO. The final dose administered was 10 mg/kg and the
Paraformaldehide fixation
DNA fragmentation by sonication
Input Immunoprecipitation with the antibody againts AcH4
Capture by adhesion to A/G protein bound to agarose
Reversion of the DNA/protein binding by treatment with proteinase K
DNA purification and real time PCR in real time
A/G protein
AcH4 antibody
Histone
Experimental design and methods
55
volume injected was 300 µL per mouse. Methoxy-X04 was injected once, 24 hours
before sacrifice.
17. Statistical analysis
For the in vitro pharmacological studies of 33i, data was exhibited using bar
graphs, with the bars representing the mean ± standard error of the mean (SEM)
values of three independent experiments. In order to test statistical significance
(p<0.05), one-way ANOVA was conducted followed by the use of Dunnett’s post hoc
test as a multiple comparison among groups. Data analyses were performed using
GraphPad Prism 6 (GraphPad Software, Inc. La Joya, CA, USA).
In the preliminary toxicological evaluation of the 33i, results were expressed as
mean ± SEM of two independent experiments. Survival and proliferation assays were
analysed using One-Way ANOVA followed by Dunnett’s post hoc test. To determine
whether the 33i compound was genotoxic the non-parametric U-Mann-Whitney test
was performed to compare the % of tail of the different 33i concentration treatments on
SH-SHY5Y cells. Differences were considered statistically significant at p<0.05. For all,
two independent experiments were carried out. Data analyses were performed using
GraphPad Prism 6 (GraphPad Software, Inc. La Joya, CA, USA).
In the behaviour studies, results were expressed as mean ± SEM. In the
acquisition phase of the MWM, treatment effects were analysed by 2-way analysis of
variance (ANOVA) followed by Tukey post hoc test. The rest of the behavioural tests
and neurochemical data, after checking for normality, were analysed using 2-way
ANOVA (strain*treatment) followed by Tukey post hoc test. Post hoc test was applied
only if F on interaction was significant. In results, the F values represent the F of
interaction followed by the p-value of the corresponding post hoc test. In those cases
where the F of interaction was not statistically significant the F value shown represents
the main effect observed strain or treatment. Differences were considered statistically
significant at p<0.05. Data analyses were performed using GraphPad Prism 6
(GraphPad Software, Inc. La Joya, CA, USA).


RESULTS


Results
59
1. In vitro pharmacological and toxicological studies with the compound 33i
1.1. HDACs enzyme activity assays
The HDAC enzyme activity assay indicated that the 33i compound had an IC50 >
20 µM for HDAC1, HDAC2, HDAC3 and HDAC6. In all cases the IC50 > 20 µM.
Therefore, the results suggest that the 33i compound does not inhibit these HDAC
isoforms.
1.2. Cytotoxic activity of 33i
As an indirect measurement of 33i cytotoxicity, cell viability was determined with
the MTT assay in cells treated with different concentrations of 33i for 24 hours. As seen
in Fig. 13, cell toxicity caused by 33i compound was significant at 20, 50 and 100 μM
(F(8,83) = 30.99, p<0.05).
Figure 13. MTT study of 33i on SH-SY5Y cells. 33i (0.1, 0.5, 1, 5, 10, 20, 50 and 100 µM) was incubated for 24 hours on SH-SY5Y cells to evaluate cell viability. Cell toxicity due to 33i was seen at 20, 50 and 100 μM. Results are shown as mean ± SEM. *p<0.05 One-way analysis of variance (ANOVA) followed by Dunnett's multiple comparisons test. Three independent experiments were performed.
1.3. Inhibitory activity of 33i towards SIRT2
Firstly, the presence of SIRT2 protein was checked in the SH-SY5Y cell line
model. As seen in Fig. 14, SIRT2 protein is expressed in SH-SY5Y cell line and no
significant changes were observed after 24 hour with 33i treatment.
MTT M T T
C o n c e n tra tio n (M )
% C
ell
Via
bil
ity
C tr l 0 .1 0 .5 1 5 1 0 2 0 5 0 1 0 0
0
5 0
1 0 0
1 5 0
2 0 0 **
*

Results
60
Figure 14. SIRT2 expression in SH-SY5Y cells. Effect of 24-hour 33i treatment (0.1, 1 and 5 µM) after 24 hours on SIRT2 protein expression. Results are shown as mean ± SEM (n=3).
In order to confirm the inhibitory effect of 33i on SIRT2 activity, two well-known
SIRT2 substrates were analysed. It is described that SIRT2 resides mostly in the
cytoplasm where it deacetylates α-tubulin (North et al., 2003; Jin et al., 2008).
Moreover, in the nucleus it specifically deacetylated histone 4 (Vaquero et al., 2006).
Consequently, the effect of 33i treatment in SH-SY5Y cells was measured by checking
these two markers by western blot. Firstly, we evaluated the effect of 33i on the nuclear
target of SIRT2, the histone 4. As shown in Fig. 15A, after 3 hours of 33i treatment,
there was a significant increase on the expression of acetylated histone 4 (AcH4) at 0.1
μM concentration compared to the control (F(3,16) = 3.866, p<0.05). This increase was
also significant 6 hours after 33i treatment (F(3,16) = 2.537, p<0.05) (Fig. 15B).
Next, we assessed the effect of 33i on the levels of acetylated α-tubulin. As
observed in Fig. 15C, after a 3 hour treatment, the expression of acetylated α-tubulin
was increased at 1µM (F(3,16) = 6.361, p<0.05). However, no significant changes were
observed after 6 hours treatment (Fig. 15D).
S IR T 2
C o n c e n tra tio n (M )
O.D
. (%
vs
. C
on
tro
l)
C tr l 0 .1 1 5
0
5 0
1 0 0
1 5 0
2 0 0
SIRT2
β-Actin
Control 0.1µM 1µM 5µM

Results
61
Figure 15. SIRT2 inhibition increases the expression of AcH4 and Acetylated α-Tubulin. (A) Effect of the 33i treatment (0.1, 1 and 5 µM) after 3 hours, 6 hours (B) on acetylated histone 4 protein expression. (C) Effect of the 33i treatment (0.1, 1 and 5 µM) after 3 hours, 6 hours (B) on acetylated α-Tubulin protein expression. Results are shown as mean ± SEM (n=3). *p<0.05 One-way analysis of variance (ANOVA) followed by Dunnett's multiple comparisons test.
Control 0.1µM 1µM 5µM
AcH4
β-Actin
AcH4
β-Actin
Control 0.1µM 1µM 5µM
A
3 h
C o n c e n tra tio n (M )
O.D
. (%
vs
. C
on
tro
l)
C tr l 0 .1 1 5
0
1 0 0
2 0 0
3 0 0
4 0 0
*
B
6 h
C o n c e n tra tio n (M )
O.D
. (%
vs
. C
on
tro
l)
C tr l 0 .1 1 5
0
1 0 0
2 0 0
3 0 0
4 0 0
*
Ac α-Tub
Control 0.1µM 1µM 5µM
β-Actin
3 h
C o n c e n tra tio n (M )
O.D
. (%
vs
. C
on
tro
l)
C tr l 0 .1 1 5
0
1 0 0
2 0 0
3 0 0
*
C
Control 0.1µM 1µM 5µM
Ac α-Tub
β-Actin
6 h
C o n c e n tra tio n (M )
O.D
. (%
vs
. C
on
tro
l)
C tr l 0 .1 1 5
0
1 0 0
2 0 0
3 0 0
D

Results
62
1.4. Toxicological evaluation of the compound 33i
Regarding the potential usefulness of SIRT2 inhibitors as pharmacological
treatments against cognitive decline, the implication of HDACs in gene expression and
the associated potential for DNA toxicity upon their inhibition present a major concern.
Therefore, once demonstrated the effectiveness of the compound 33i, the next aim
includes a preliminary toxicity evaluation of 33i in vitro, essential for translational
proposals.
1.4.1. Evaluation of the potential mutagenicity of 33i compound
The results obtained revealed no mutagenicity caused by the 33i or any of its
metabolites (S9 fraction). As shown in Fig. 16, there was not a dose dependent
increase of Salmonella typhimurium TA98 revertant colonies in PBS or S9 plaques.
Noteworthy, the number of revertant colonies in the positive controls with and without
metabolic activations showed the expected results (PBS: 1794.7 ± 16.2 and S9: 2633.3
± 21.5), supporting the validity of the obtained results. Additionally, the mutagenicity of
33i at the concentration of 5000 µg/plaque could not be assessed as the 33i compound
precipitated.
Figure 16. The 33i compound or its metabolites causes no mutagenicity. No dose dependent increase of Salmonella typhimurium TA98 revertant colonies were observed in PBS or S9 plaques. The results obtained from the Ames test revealed no mutagenicity caused by the 33i or any of it metabolites. Noteworthy, the number of revertant colonies in the positive controls with and without metabolic activations showed the expected results (PBS: 1794.7 ± 16.2 and S9: 2633.3 ± 21.5), supporting the validity of the obtained results. Two independent experiments were carried out. Results are presented as number of revertant colonies and expressed as mean ± SEM.
A m e s te s t
C o n c e n tra tio n (g /p la q u e )
Nu
mb
er
of
rev
ert
an
t c
olo
nie
s
C o n tro l - 0 .5 5 5 0 5 0 0
0
1 0
2 0
3 0
P B S
S 9
Ames test

Results
63
1.4.2. Effect of 33i on the viability of SH-SY5Y cells
As shown in Fig. 17, low concentrations of 33i (0.1, 1, 5 and 10 μM) did not show
changes in the rate of survival (Fig. 17A) or proliferation (Fig. 17B) in SH-SY5Y cells.
At these concentrations, the RG were above 80%. Moreover, a normal cell appearance
was observed by microscopy after the treatment and after the incubation period.
However, at the highest concentration used (20 μM) a significant decrease in the rate
of survival as well as proliferation was observed (survival assay: F(6,7) = 16.01, p<0.05;
proliferation assay: F(6,7) = 17.01, p<0.05). Noteworthy, the positive control showed the
expected results in all the experiments, supporting the validity of the obtained results.
Figure 17. Effect of the 33i compound on the survival and proliferation of SH-SY5Y cells. (A) Effect of the different 33i concentrations on the survival of SH-SY5Y cells after a 3 hour treatment. (B) Effect of the different concentrations of 33i on the proliferation of SH-SY5Y cells 48 hours after a 3 hour treatment. Results are presented as survival after treatment (%) and relative growth (%) and expressed as mean ± SEM. *p<0.05 One-way analysis of variance (ANOVA) followed by Dunnett's multiple comparisons test. Three independent experiments were performed.
1.4.3. Evaluation of the potential genotoxicity of 33i compound
As seen in Fig. 18, no effect was observed in the % of tail DNA in the cells that
underwent lysis, suggesting that the 33i, at the used concentrations (0.1, 1, 5, 10 and
20 µM), did not produce strand breaks or alkali-labile sites. In all cases % tail DNA
was lower that 5%. Moreover, 33i did not induce an increase in Fpg-sensitive sites
after the 3-hour treatment. This result indicated that the different concentrations of 33i
used, do not produce DNA oxidation or methylation in the 8-oxoguanine bases of
A
Survival assay (3 hours)
B
Proliferation assay (48 hours)
S u rv iva l a ssa y (3 h )
C o n c e n tra tio n (M )
Su
rviv
al
aft
er
tre
atm
en
t (%
)
C tr l ( - ) C tr l (+ ) 0 .1 1 5 1 0 2 0
0
5 0
1 0 0
1 5 0
*
P ro le fe ra tio n a s s a y (4 8 h )
C o n c e n tra tio n (M )
Re
lati
ve
gro
wth
(%
)
C tr l ( - ) C tr l (+ ) 0 .1 1 5 1 0 2 0
0
5 0
1 0 0
1 5 0
*

Results
64
DNA. Noteworthy, the positive control showed the expected results with an %Tail
DNA above 25% in all the experiments, supporting the validity of the obtained results.
Figure 18. Genotoxic evaluation of the compound 33i on SH-SY5Y cells. Representative images (A) and quantitative measurement (B) of the effect of the different concentrations of 33i on DNA strand breaks and net Fpg-sensitive sites in SH-SY5Y. Cells were treated with 0.1, 1, 5, 10 and 20 µM of 33i for 3 hours. The % of tail DNA was measured using the alkaline comet assay in combination with the Fpg. Cells treated with 20 µM MMS were used as positive control for Fpg-sensitive sites. Results are presented as % tail DNA and expressed as mean ± SEM. Two independent experiments were performed.
A
B Comet assay
C o m e t a s s a y
C o n c e n tra tio n (M )
% T
ail
D
NA
C tr l (+ ) C tr l ( - ) 0 .1 1 5 1 0 2 0
0
1 0
2 0
3 0
4 0
L y s is
F P G
C o m e t a s s a y
C o n c e n tra tio n (M )
% T
ail
D
NA
C tr l (+ ) C tr l ( - ) 0 .1 1 5 1 0 2 0
0
1 0
2 0
3 0
4 0
D N A s tra n d b re a k s + A L S
F p g -s e n s itiv e s ite s
Ctrl (+) Ctrl (-) 0.1 μM 1 μM 5 μM 10 μM 20 μM
DNA
strand
breaks
+ ALS
Fpg-
sensitive
sites

Results
65
S IR T 2
OD
(%
vs
. 2
mo
nth
SA
MR
1)
S A M R 1 S A M P 8
0
1 0 0
2 0 0
3 0 0
**
2 m 9 m 2 m 9 m
SAMR1 SAMP8
43
42
37
kDa
Sirtuin 2
β-Actin
S IR T 2 E X P R E S S IO N
S AM R 1 S AM P 8
0
5 0
1 0 0
1 5 0
2 m o th s
9 m o n th s
2. Behavioural and molecular consequences of SIRT2 inhibition on a sporadic AD mouse model
2.1. SIRT2 is increased in 9-month-old SAMR1 and SAMP8 mice
Anti-Sirt2 antibody recognizes two bands (37/43 kDa) representing the two Sirt2
isoforms that exist as the result of alternative splicing. For SIRT2 quantification, both
bands were quantified. A significant increase in hippocampal SIRT2 levels was
observed in 9-month-old SAMR1 and SAMP8 mice compared to 2 month-old mice (F =
6.568; p<0.05, main effect of age) (Fig. 19).
Figure 19. SIRT2 increases with age. SIRT2 expression of 2-month-old and 9-month-old SAMR1 and SAMP8 mice. β-actin was used as an equal loading control. Results are shown as mean ± SEM (n=7). *p<0.05 Two-way analysis of variance (ANOVA).
2.2. Effect of 33i on SIRT2 activity
The inhibitory effect of 33i on SIRT2 activity was verified by measuring in the
hippocampus the mRNA levels of ATP-binding cassette transporter Abca1 (a known
transporter of cholesterol) (Fig. 20A). Two-way analysis ANOVA revealed an increase
in hippocampal Abca1 mRNA levels in 33i-treated SAMP8 and SAMR1 mice (F =
7.974, p<0.05, main effect of treatment).
The efficacy of 33i was further confirmed with an increase of acetylated histone 4
levels (F = 6.189, p<0.05, main effect of treatment) (Fig. 20B).

Results
66
Figure 20. 33i inhibits SIRT2 activity. Effect of 33i treatment on Abca1 mRNA (A) and AcH4 expression (B). Lamin A/C was used as an equal nuclear control. Results are shown as mean ± SEM (n=6). *p<0.05 Two-way analysis of variance (ANOVA).
2.3. Early treatment: Effect of SIRT2 inhibition in 5-month-old SAMP8 mice
2.3.1. Effect of SIRT2 inhibition on behavioural tests
Spontaneous motor activity test
As it is seen in Fig. 21A there is a significant difference between SAMR1 and
SAMP8 mice concerning distance travelled and speed during the 30 minutes
behavioural test. This is reflected in a strain main effect (F = 8.633, p<0.05). The
administration of 33i did not cause any changes in the spontaneous motor activity.
Rotarod
The time that mice remained on the accelerating rotary cylinder was the parameter
used to evaluate their performance on the Rotarod.
The results revealed that the duration of SAMP8 mice was significantly shorter
than SAMR1 mice (Day 1: F = 36.80, p<0.05, main effect of strain; Day 2: F = 26.55,
p<0.05, main effect of strain). This effect was not reversed with the 33i treatment
(Figure 21B).
vehicle 33i vehicle 33i
SAMR1 SAMP8
10
KDa
28
AcH4
Lamin A/C
B
A c H 4
O.D
. (%
vs
. S
AM
R1
ve
hic
le)
S A M R 1 S A M P 8
0
1 0 0
2 0 0
3 0 0
v e h ic le
3 3 i
* *
S w im m in g s p e e d
Sp
ee
d (
cm
/s)
S A M R 1 S A M P 8
0
1 0
2 0
3 0
v e h ic le
3 3 i
A b c a 1
Re
lati
ve
ex
pre
ss
ion
(2
-
Ct)
S A M R 1 S A M P 8
0
1
2
3
4
v e h ic le
3 3 i**
A
Abca1
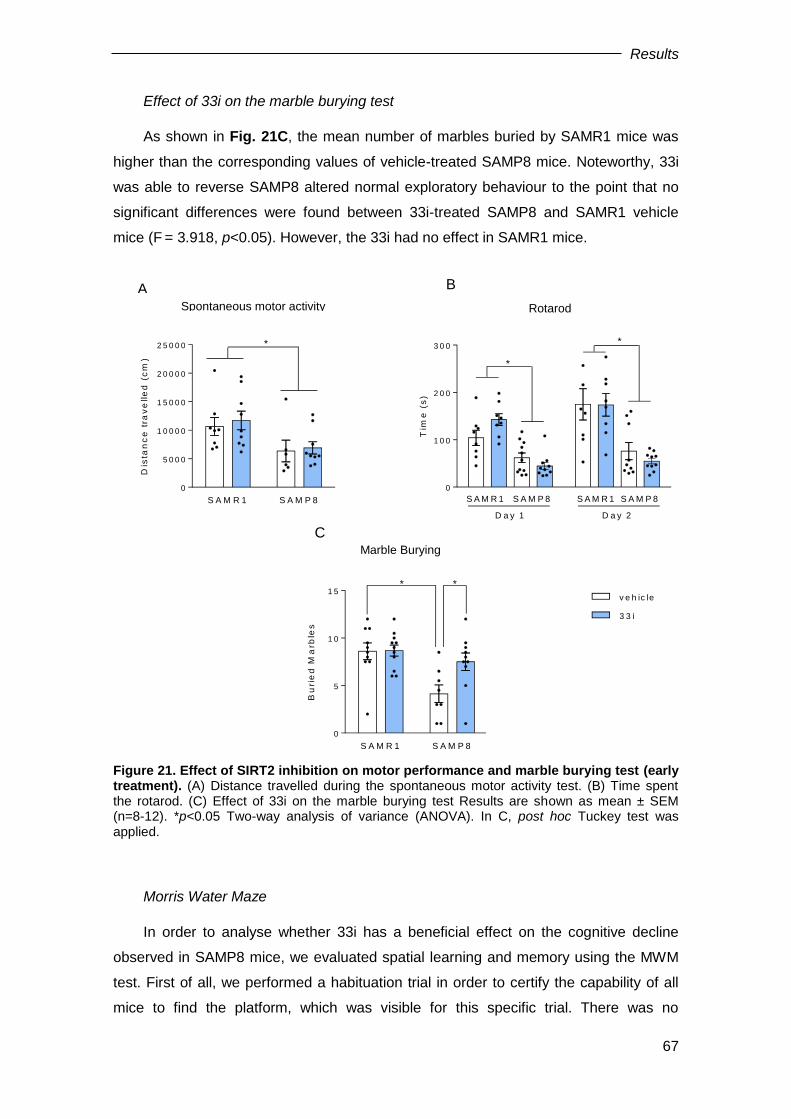
Results
67
Effect of 33i on the marble burying test
As shown in Fig. 21C, the mean number of marbles buried by SAMR1 mice was
higher than the corresponding values of vehicle-treated SAMP8 mice. Noteworthy, 33i
was able to reverse SAMP8 altered normal exploratory behaviour to the point that no
significant differences were found between 33i-treated SAMP8 and SAMR1 vehicle
mice (F = 3.918, p<0.05). However, the 33i had no effect in SAMR1 mice.
Figure 21. Effect of SIRT2 inhibition on motor performance and marble burying test (early treatment). (A) Distance travelled during the spontaneous motor activity test. (B) Time spent the rotarod. (C) Effect of 33i on the marble burying test Results are shown as mean ± SEM (n=8-12). *p<0.05 Two-way analysis of variance (ANOVA). In C, post hoc Tuckey test was applied.
Morris Water Maze
In order to analyse whether 33i has a beneficial effect on the cognitive decline
observed in SAMP8 mice, we evaluated spatial learning and memory using the MWM
test. First of all, we performed a habituation trial in order to certify the capability of all
mice to find the platform, which was visible for this specific trial. There was no
R o ta ro d
Tim
e (
s)
D a y 1 D a y 2
0
1 0 0
2 0 0
3 0 0
v e h ic le
3 3 i
S A M R 1 S A M R 1 S A M P 8S A M P 8
*
*
B
Rotarod S p o n ta n e o u s m o to r a c t iv ity
Dis
tan
ce
tra
ve
lle
d (
cm
)
S A M R 1 S A M P 8
0
5 0 0 0
1 0 0 0 0
1 5 0 0 0
2 0 0 0 0
2 5 0 0 0
v e h ic le
3 3 i
*
A Spontaneous motor activity
M a rb le B u ry in g
Bu
rie
d M
arb
les
S A M R 1 S A M P 8
0
5
1 0
1 5
v e h ic le
3 3 i
* *
C Marble Burying S w im m in g s p e e d
Sp
ee
d (
cm
/s)
S A M R 1 S A M P 8
0
1 0
2 0
3 0
v e h ic le
3 3 i

Results
68
difference in swimming speed or sensorimotor function among the 4 groups (Fig. 22)
which enabled us to exclude the effect of motivational and sensorimotor factors on
animal learning and memory performance.
Figure 22. SIRT2 inhibition did not affect the swimming speed. Average swim speed of the animals on the first trial of the habituation phase of the Morris Water Maze before subjects from any group knew the location of the platform. There was no difference in swimming speed. Results are shown as mean ± SEM (n=8-12).Two-way analysis of variance (ANOVA).
To evaluate the spatial learning and memory of mice, the escape latency of the
hidden platform was used. As shown in Figure 23A, the escape latencies of SAMR1
were lower than the ones of SAMP8, indicating the existence of learning deficits in
these mice. The compound 33i was found to have an effect on SAMP8 mice. 33i-
treated SAMP8 mice showed a marked improvement in their behavioural performance,
as their escape latencies were significantly shorter than SAMP8 mice treated with
vehicle from the first day of acquisition until the last day. On the other hand, no
significant differences were found between vehicle and 33i-treated SAMR1 mice.
At the beginning of the fourth, seventh and ninth day all mice were subjected to a
probe trial in which they swam in the pool where the platform had been removed as a
putative measurement of memory retention (Fig. 23B). On days 4 and 7 a significant
interaction between strain and treatment was observed (F = 9.138, p<0.05; F= 11.92,
p<0.05 respectively). Further analysis revealed that SAMP8 spent significantly less
time in the target quadrant than SAMR1 mice. Further, comparisons indicated that
SAMP8 mice treated with 33i spent more time in the target quadrant than saline
S w im m in g s p e e d
Sp
ee
d (
cm
/s)
S A M R 1 S A M P 8
0
1 0
2 0
3 0
v e h ic le
3 3 i
S w im m in g s p e e dS
pe
ed
(c
m/s
)
S A M R 1 S A M P 8
0
1 0
2 0
3 0
v e h ic le
3 3 i
Swimming speed

Results
69
SAMP8 mice, whereas no differences were observed between saline or 33i-treated
SAMR1 mice. On day 9 only a main effect of genotype was found (F = 7.507, p<0.05)
Figure 23. SIRT2 inhibition ameliorated the cognitive decline of 7-month-old SAMP8 mice. (A) Escape latency in the hidden platform phase. SAMP8 mice had significant higher escape latency than SAMR1 mice which was reversed by 33i. (B) In the probe trial data are presented as percentage of time spent in the target quadrant. Note that on the fourth and seventh day of the test 33i administration in SAMP8 mice increased the time in the target quadrant. Results are shown as mean ± SEM (n=8-12). (A) *p<0.05 vs SAMR1 vehicle; #p<0.05 vs SAMP8 vehicle, (B) *p<0.05 Two-way analysis of variance (ANOVA) followed by Tukey test.
Retention
Adquisition
B
S w im m in g s p e e d
Sp
ee
d (
cm
/s)
S A M R 1 S A M P 8
0
1 0
2 0
3 0
v e h ic le
3 3 i
R e te n tio n
% T
ime
in
ta
rge
t q
ua
dra
nt
D a y 4 D a y 7 D a y 9
0
2 0
4 0
6 0
8 0
1 0 0
v e h ic le
3 3 i
S A M R 1 S A M P 8
*
S A M R 1 S A M P 8 S A M R 1 S A M P 8
** * *
% T
ime in
targ
et quadra
nt
A
Days1 2 3 4 5 6 7 80
20
40
60
80
* *
#
*
#
*
#
*
#
*
#
*
#
*
#
#
Escape la
tency
time (
s)
SAMR1- vehicle
SAMR1-33i
SAMP8- vehicle
SAMP8-33i

Results
70
2.3.2. Effect of 33i on SIRT1 protein levels
Several studies have observed that enhanced expression and/or activity of SIRT1
has a neuroprotective effect in AD by preventing neuronal death and reducing
hippocampal degeneration (Kim et al., 2007a; Michan and Sinclair, 2007; Pfister et al.,
2008). Since, among all sirtuins, SIRT1 and SIRT2 show the highest expression in the
brain (Jayasena et al., 2016) and given their opposing roles in neurodegenerative
diseases, we checked whether an increase of SIRT1 protein expression could be the
cause of the cognitive improvement observed in 7-month-old SAMP8 treated with 33i.
Two-way ANOVA revealed a significant main effect of strain (F = 5.975, p<0.05).
As shown in Fig. 24, SAMP8 mice had significantly lower levels of SIRT1 than SAMR1.
However, no differences were observed between both vehicle and 33i-treated animals.
Figure 24. Effect of early 33i treatment on Sirtuin 1. Representative western blot and quantitative measurement of SIRT1 normalized to β-Actin in the hippocampus of SAMR1 and
SAMP8 treated with vehicle or 33i. Results are shown as mean ± SEM (n=6-8). *p<0.05. Two-way analysis of variance (ANOVA).
2.3.3. Effect of 33i on AD neuropathological hallmarks
To elucidate the mechanisms underlying the learning and memory improvement in
33i treated SAMP8 mice, we next tested whether 33i reversed Tau pathology in
SAMP8 mice, as previous studies have shown hyperphosphorylation of Tau in SAMP8
at the age of 6 months (Canudas et al., 2005; Orejana et al., 2012). For this we used a
Sirtuin 1
β-Actin
vehicle 33i vehicle 33i
SAMR1 SAMP8
100
KDa
42
S irtu in 1
O.D
. (%
vs
. S
AM
R1
ve
hic
le)
S A M R 1 S A M P 8
0
5 0
1 0 0
1 5 0
v e h ic le
3 3 i
*
S w im m in g s p e e d
Sp
ee
d (
cm
/s)
S A M R 1 S A M P 8
0
1 0
2 0
3 0
v e h ic le
3 3 i

Results
71
phospho-specific antibody, AT8, which recognizes aberrantly phosphorylated epitopes
on Ser202/Thr205.
As shown in Fig. 25, western blot analysis revealed that phosphorylated Tau
levels normalized to total Tau (detected by T46 antibody) were significantly increased
in SAMP8 mice compared with SAMR1 mice (F = 4.882, p<0.05, main effect of strain).
No differences were observed between saline and 33i-treated animals.
Figure 25. Early 33i treatment has no effect on Tau phosphorilation. Representative western blot and quantitative measurement of hippocampal p- Tau (AT8/Total Tau). β-Actin was used as an equal loading control. Results are shown as mean ± SEM (n=6-8). *p<0.05, Two-way analysis of variance (ANOVA).
Since a previous study suggested that SIRT2 inhibition may affect the AβPP
metabolism (Biella et al., 2016), we next quantified hippocampal Aβ40 and Aβ42 levels,
Aβ oligomers and APP processing (Fig. 26). However, at the age of 7 months, no
significant differences were observed across all four groups in these determinations.
AT8
Total Tau
v ehicle 33i v ehicle 33i
SAMR1 SAMP8
β- Actin
50
kDa
50
42A T 8 /T o ta l T a u
O.D
. (%
vs
. S
AM
R1
ve
hic
le)
S A M R 1 S A M P 8
0
5 0
1 0 0
1 5 0
v e h ic le
3 3 i
*S w im m in g s p e e d
Sp
ee
d (
cm
/s)
S A M R 1 S A M P 8
0
1 0
2 0
3 0
v e h ic le
3 3 i

Results
72
Figure 26. Early 33i treatment has no effect on Alzheimer disease’s neuropathological hallmarks. No significant differences were observed in Aβ40 (A) and Aβ42 (B) levels in the hippocampus of 7-month-old SAMR1 and SAMP8 mice. Representative western blot and quantitative measurement of Aβ oligomers (C) and full length APP and C99/C83 fragments ratio (D). β-Actin or β-Tubulin were used as an equal loading control. Results are shown as mean ± SEM (n=6-8). *p<0.05, Two-way analysis of variance (ANOVA).
2.3.4. Effect of 33i on autophagy and ubiquitin-proteasome system
Recent studies have demonstrated that SIRT2 plays a key role in autophagy (Gal
et al., 2012). Therefore, we next examined whether an improvement on autophagy
signalling could explain the beneficial effects observed in the behaviour of 33i-treated
SAMP8 mice.
33i
S w im m in g s p e e d
Sp
ee
d (
cm
/s)
S A M R 1 S A M P 8
0
1 0
2 0
3 0
v e h ic le
3 3 i
S w im m in g s p e e d
Sp
ee
d (
cm
/s)
S A M R 1 S A M P 8
0
1 0
2 0
3 0
v e h ic le
3 3 ivehicle
O lig o m e rs
O.D
. (%
vs
. S
AM
R1
ve
hic
le)
1 6 2 4 3 6 5 6
0
1 0 0
2 0 0
3 0 0
4 0 0
v e h ic le
3 3 i
S A M R 1 S A M P 8 S A M R 1 S A M P 8 S A M R 1 S A M P 8 S A M R 1 S A M P 8
KDa
C
5636
24
16
55
v ehicle 33i v ehicle 33i
SAMP8SAMR1
β- Tubulin
kDa
Olig
om
ers
B A ß -4 0
pm
ol/
g t
iss
ue
S A M R 1 S A M P 8
0
5
1 0
1 5
2 0
v e h ic le
3 3 i
Aβ-40 A ß -4 2
pm
ol/
g t
iss
ue
S A M R 1 S A M P 8
0
2
4
6
8
v e h ic le
3 3 i
Aβ-42
D
100
108
vehicle 33i vehicle 33i
SAMP8SAMR1
42
KDa
APP
C99
C83
β-Actin
100
108
vehicle 33i vehicle 33i
SAMP8SAMR1
42
KDa
APP
C99
C83
β-Actin
A P P
OD
(%
vs
. S
AM
R1
ve
hic
le)
S A M R 1 S A M P 8
0
1 0 0
2 0 0
3 0 0
C 9 9 /C 8 3
OD
(%
vs
. S
AM
R1
ve
hic
le)
S A M R 1 S A M P 8
0
1 0 0
2 0 0
3 0 0
APP C99/C83
A

Results
73
Beclin 1 and ROCK2 are known as markers of autophagy activity. However, when
both proteins were analysed, no differences were detected by western-blot between all
four groups (Fig. 27A-B).
We next evaluated the expression levels of another autophagy-related protein,
LC3-II. Interestingly, the increased protein levels of LC3-II in SAMP8 mice were
decreased by the 33i treatment (F = 10.61, p<0.05) (Fig. 27C).
Figure 27. Effect of SIRT2 inhibition on autophagy. No differences were found concerning hippocampal protein levels of expression of Belin 1 (A) and ROCK2 (B). SAMP8 show higher levels of LC3-II which were decreased with the 33i (C). β-Actin was used as an equal loading control. Results are shown as mean ± SEM (n=6-8). *p<0.05. Two-way analysis of variance (ANOVA) followed by Tukey test.
We then assessed the levels of ubiquitinated proteins in the hippocampus of the animals. As shown in Fig. 28, SAMP8 vehicle mice presented significantly more accumulation of ubiquitinated proteins than SAMR1 (F = 6.454, p<0.05, main effect of strain), which was not reverted by 33i treatment.
33i
S w im m in g s p e e d
Sp
ee
d (
cm
/s)
S A M R 1 S A M P 8
0
1 0
2 0
3 0
v e h ic le
3 3 i
S w im m in g s p e e d
Sp
ee
d (
cm
/s)
S A M R 1 S A M P 8
0
1 0
2 0
3 0
v e h ic le
3 3 ivehicle
C
L c 3 I I
O.D
. (%
vs
. S
AM
R1
ve
hic
le)
S A M R 1 S A M P 8
0
5 0
1 0 0
1 5 0
2 0 0
2 5 0
v e h ic le
3 3 i
* *
SAMR1 SAMP8
KDa
LC3-I
β-Actin
vehicle 33i vehicle 33i
17
42
14LC3-II
B
R o c k 2
O.D
. (%
vs
. S
AM
R1
ve
hic
le)
S A M R 1 S A M P 8
0
5 0
1 0 0
1 5 0
v e h ic le
3 3 i
vehicle 33i vehicle 33i
SAMR1 SAMP8
ROCK2
β-Actin
170
KDa
42B e c lin 1
O.D
. (%
vs
. S
AM
R1
ve
hic
le)
S A M R 1 S A M P 8
0
5 0
1 0 0
1 5 0
2 0 0
v e h ic le
3 3 i
A SAMR1 SAMP8
vehicle 33i vehicle 33i
Beclin 1
β-Actin
52
KDa
42
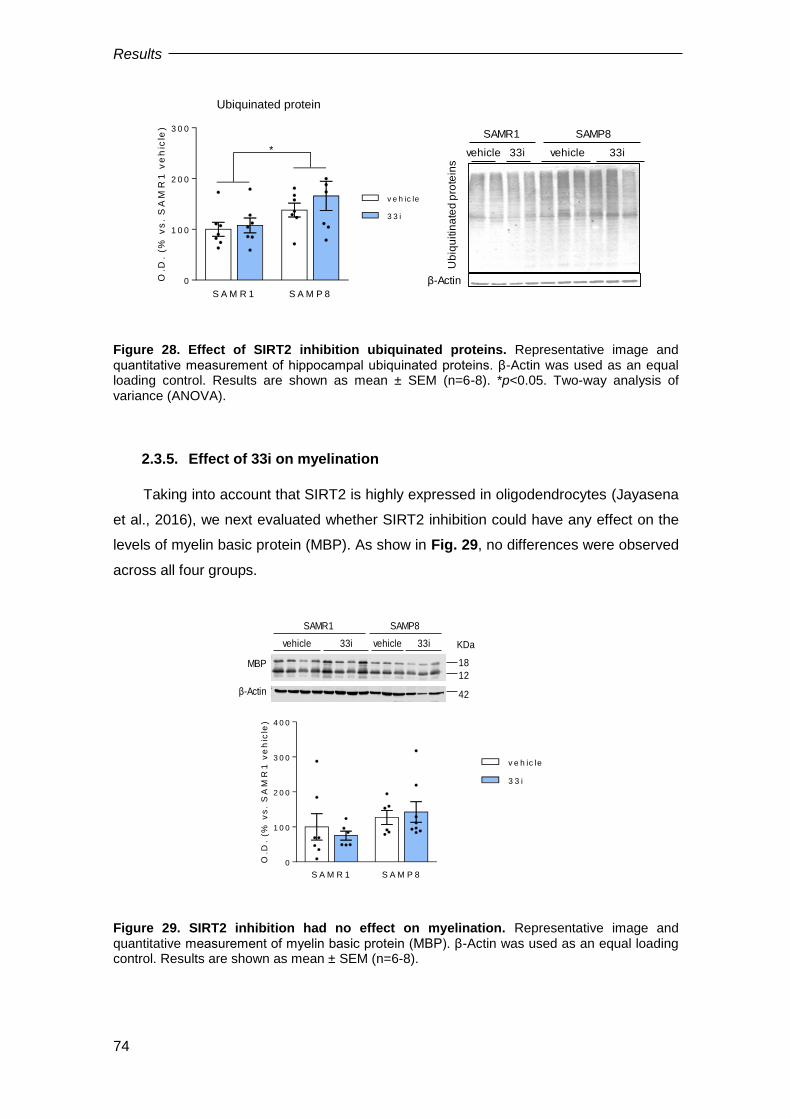
Results
74
Figure 28. Effect of SIRT2 inhibition ubiquinated proteins. Representative image and quantitative measurement of hippocampal ubiquinated proteins. β-Actin was used as an equal loading control. Results are shown as mean ± SEM (n=6-8). *p<0.05. Two-way analysis of variance (ANOVA).
2.3.5. Effect of 33i on myelination
Taking into account that SIRT2 is highly expressed in oligodendrocytes (Jayasena
et al., 2016), we next evaluated whether SIRT2 inhibition could have any effect on the
levels of myelin basic protein (MBP). As show in Fig. 29, no differences were observed
across all four groups.
Figure 29. SIRT2 inhibition had no effect on myelination. Representative image and quantitative measurement of myelin basic protein (MBP). β-Actin was used as an equal loading control. Results are shown as mean ± SEM (n=6-8).
S w im m in g s p e e d
Sp
ee
d (
cm
/s)
S A M R 1 S A M P 8
0
1 0
2 0
3 0
v e h ic le
3 3 i
M y e lin B a s ic P ro te in
O.D
. (%
vs
. S
AM
R1
ve
hic
le)
S A M R 1 S A M P 8
0
1 0 0
2 0 0
3 0 0
4 0 0
v e h ic le
3 3 i
vehicle 33i vehicle 33i
SAMP8SAMR1
42
MBP
β-Actin
18
12
KDa
S w im m in g s p e e dS
pe
ed
(c
m/s
)
S A M R 1 S A M P 8
0
1 0
2 0
3 0
v e h ic le
3 3 i
Ub
iqu
itin
ate
dp
rote
ins
vehicle 33i vehicle 33i
SAMR1 SAMP8
β-Actin
U b iq u in a te d P ro te in
O.D
. (%
vs
. S
AM
R1
ve
hic
le)
S A M R 1 S A M P 8
0
1 0 0
2 0 0
3 0 0
v e h ic le
3 3 i*
Ubiquinated protein

Results
75
2.3.6. Effect of SIRT2 inhibition on learning and memory-related proteins
We next hypothesized that the inhibition of SIRT2 activity could lead to an
increase in the transcription of several genes involved in learning. Among all different
learning and memory-related proteins analysed, no differences were observed in the
hippocampal expression of pro-BDNF, PSD95, Synaptophysin, ARC, p-CREB or CREB
within all four groups (Fig. 30).
Figure 30. Effect of SIRT2 inhibition on synaptic plasticity markers. No differences were observed in the hippocampal expression levels of pro-BDNF (A), PSD95 (B), synaptophysin (C), ARC (D) and p-CREB/CREB (E), across all four groups. β-Actin was used as an equal loading control. Results are shown as mean ± SEM (n=6-8).
A
P ro -B d n f
O.D
. (%
vs
. S
AM
R1
ve
hic
le)
S A M R 1 S A M P 8
0
5 0
1 0 0
1 5 0
2 0 0
2 5 0
v e h ic le
3 3 i
B
P S D 9 5
O.D
. (%
vs
. S
AM
R1
ve
hic
le)
S A M R 1 S A M P 8
0
5 0
1 0 0
1 5 0
2 0 0
v e h ic le
3 3 i
C
S y n a p to p h ys in
O.D
. (%
vs
. S
AM
R1
ve
hic
le)
S A M R 1 S A M P 8
0
5 0
1 0 0
1 5 0
2 0 0
2 5 0
v e h ic le
3 3 i
D
A rc
O.D
. (%
vs
. S
AM
R1
ve
hic
le)
S A M R 1 S A M P 8
0
5 0
1 0 0
1 5 0
2 0 0
v e h ic le
3 3 i
E
P -C re b /C re b
O.D
. (%
vs
. S
AM
R1
ve
hic
le)
S A M R 1 S A M P 8
0
5 0
1 0 0
1 5 0
2 0 0
v e h ic le
3 3 i
33i
S w im m in g s p e e d
Sp
ee
d (
cm
/s)
S A M R 1 S A M P 8
0
1 0
2 0
3 0
v e h ic le
3 3 i
S w im m in g s p e e d
Sp
ee
d (
cm
/s)
S A M R 1 S A M P 8
0
1 0
2 0
3 0
v e h ic le
3 3 ivehicle
Pro-BDNF
β-Actin
vehicle 33i vehicle 33i
SAMR1 SAMP8
32
42
KDa
Syn
β-Actin
vehicle 33i vehicle 33i
SAMR1 SAMP8
38
42
KDa
p-CREB
CREB
vehicle 33i vehicle 33i
SAMR1 SAMP8
43
42
KDa
ARC
β-Actin
vehicle 33i vehicle 33i
SAMR1 SAMP8
45
42
KDa
PSD95
β-Actin
vehicle 33i vehicle 33i
SAMR1 SAMP8
105
42
KDa

Results
76
However, the expression of some post-synaptic receptors was affected by the 33i
administration. Specifically, GluN2A, GluN2B and GluA1 protein expression levels
increased in both SAMR1 and SAMP8 mice treated with 33i compared to control
vehicle mice (F = 8.724, p<0.05; F = 6.487, p<0.05; F = 30.40, p<0.05, main effect of
treatment, respectively) (Fig. 31A-C). In addition to this, a significant increase was
observed in hippocampal mRNA levels of Glun2a and Glun2b (F = 6.436, p<0.05;
F = 6.496, p<0.05, main effect of treatment) (Fig. 31D-E). However, no differences
were observed in mRNA levels of Glua1 (Fig. 31 F).
Figure 31. SIRT2 inhibition upregulates GluN2A, GluN2B and GluA1 expression in 7-month-old SAMR1 and SAMP8 mice. Effect of 33i on hippocampal GluN2A (A), GluN2B (B) and GluA1 (C) expression levels. β-Tubulin was used as an equal loading control. Results show that 33i treatment increases mRNA levels of Glun2a (D) and Glun2b (E) but not Glua1 (F). Results are shown as mean ± SEM (n=6-8). *p<0.05, Two-way analysis of variance (ANOVA).
A B
vehicle 33i vehicle 33i
SAMR1 SAMP8
GluN2A
β-Tubulin
170
KDa
55G lu N 2 a
O.D
. (%
vs
. S
AM
R1
ve
hic
le)
S A M R 1 S A M P 8
0
1 0 0
2 0 0
3 0 0
4 0 0
v e h ic le
3 3 i*
*
B
GluN2B
β-Tubulin
vehicle 33i vehicle 33i
SAMR1 SAMP8
170
KDa
55G lu N 2 b
O.D
. (%
vs
. S
AM
R1
ve
hic
le)
S A M R 1 S A M P 8
0
1 0 0
2 0 0
3 0 0
4 0 0
v e h ic le
3 3 i*
*
C
GluA1
β-Tubulin
vehicle 33i vehicle 33i
SAMR1 SAMP8
100
KDa
55G lu A 1
O.D
. (%
vs
. S
AM
R1
ve
hic
le)
S A M R 1 S A M P 8
0
1 0 0
2 0 0
3 0 0
v e h ic le
3 3 i
*
*
G lu N 2 a
Re
lati
ve
ex
pre
ss
ion
(2
-
Ct)
S A M R 1 S A M P 8
0
1
2
3
4
v e h ic le
3 3 i
*
*
D
G lu N 2 b
Re
lati
ve
ex
pre
ss
ion
(2
-
Ct)
S A M R 1 S A M P 8
0
1
2
3
4
v e h ic le
3 3 i
*
*
E
G lu A 1
Re
lati
ve
ex
pre
ss
ion
(2
-
Ct)
S A M R 1 S A M P 8
0
1
2
3
4
v e h ic le
3 3 i
F
33i
S w im m in g s p e e d
Sp
ee
d (
cm
/s)
S A M R 1 S A M P 8
0
1 0
2 0
3 0
v e h ic le
3 3 i
S w im m in g s p e e d
Sp
ee
d (
cm
/s)
S A M R 1 S A M P 8
0
1 0
2 0
3 0
v e h ic le
3 3 ivehicle
GluN2A GluN2B GluA1

Results
77
To provide evidence for a possible direct relationship between changes in histone
4 acetylation and the increase in GluN2A and GluN2B, we tested the effect of 33i on
histone 4 acetylation at the promoter region of these subunits of the glutamate receptor
using ChIP assay. We performed ChIP assays with antibody against acetylated
Histone 4 and quantified the amount of DNA associated using semi quantitative real-
time PCR 5 days after 33i-treatment. However, no differences were observed between
vehicle and 33i-treated mice suggesting that the increased levels of mRNA found in
these proteins are independent of AcH4 (Fig. 32).
Figure 32. The increase of GluN2A and GluN2B seen in SAMR1 and SAMP8 mice after 33i treatment, is AcH4 independent. (A) Representative image showing the fragmented 200 base pairs chromatin after sonication. (B) Fragmented chromatin was immunoprecipitated with antibody recognizing AcH4. Semi-quantitative PCR from ChIP of samples showed no changes in specific gene promoter regions of GluN2A and GluN2B in brains of vehicle and 33i treated mice (n=4).
2.3.7. Early 33i treatment reduces the neuroinflammation in 7-month-old
SAMP8 mice
We next explored the potential role of SIRT2 inhibition on neuroinflammation.
Astrocyte activation is often accompanied by an increase in the expression of GFAP, a
major intermediate filament protein specific to astrocytes (Furman et al., 2012). Our
data showed a significant increase in hippocampal GFAP immunoreactivity in SAMP8
mice compared to SAMR1 mice (Fig. 33). This increase was significantly reverted by
33i treatment in SAMP8 mice both by western-blot (F = 34.87, p<0.05) and
immunofluorescence (F = 15.80, p<0.05). However, no differences were observed
between vehicle or 33i treated SAMR1 mice.
A B

Results
78
Figure 33. Early 33i treatment reduces astrogliosis in 7-month-old SAMP8 mice. (A) Representative image and quantitative measurement of hippocampal GFAP protein levels. Note that SAMP8 show increased levels of GFAP which are reversed by 33i treatment. β-Actin was used as an equal loading control (6-8). This effect is also seen in the quantification of the immunofluorescence images (B) (n=3 mice per group). Results are shown as mean ± SEM. *p<0.05. Two-way analysis of variance (ANOVA) followed by Tukey test.
We next analysed by western-blot and immunofluorescence hippocampal CD11b
levels, as it is a marker of microglial activation. In this case, no significant differences
were observed among all four groups (Fig. 34).
33i
S w im m in g s p e e dS
pe
ed
(c
m/s
)
S A M R 1 S A M P 8
0
1 0
2 0
3 0
v e h ic le
3 3 i
S w im m in g s p e e d
Sp
ee
d (
cm
/s)
S A M R 1 S A M P 8
0
1 0
2 0
3 0
v e h ic le
3 3 ivehicle
vehicle 33i vehicle 33i
SAMR1 SAMP8
GFAP
β-Actin
55
KDa
42
G F A P
O.D
. (%
vs
. S
AM
R1
ve
hic
le)
S A M R 1 S A M P 8
0
1 0 0
2 0 0
3 0 0
4 0 0
5 0 0
v e h ic le
3 3 i
* *
A
SAMR1-veh SAMR1-33i
SAMP8-veh SAMP8-33i
G F A P
% f
luo
res
ce
nc
e i
nte
ns
ity
S A M R 1 S A M P 8
0
5 0
1 0 0
1 5 0
2 0 0
v e h ic le
3 3 i
* *
B
GFAP

Results
79
Figure 34. Effect of 33i on microglial activation. (A) Representative western bot and quantitative measurement of hippocampal CD11b. No differences were observed across all four groups when microglia activation was analysed by western blot. β-Actin was used as an equal loading control (n=6-8). Same results were observed in the quantification of the immunofluorescence images (B) (n=3 mice per group). Results are shown as mean ± SEM.
To further investigate the effects of 33i on neuroinflammation we also determined
in the hippocampus the expression of the pro-inflammatory cytokines interleukin 1β (Il-
1β), interleukin 6 (Il-6) and tumor necrosis factor α (Tnf-α).
33i
S w im m in g s p e e dS
pe
ed
(c
m/s
)
S A M R 1 S A M P 8
0
1 0
2 0
3 0
v e h ic le
3 3 i
S w im m in g s p e e d
Sp
ee
d (
cm
/s)
S A M R 1 S A M P 8
0
1 0
2 0
3 0
v e h ic le
3 3 ivehicle
vehicle 33i vehicle 33i
SAMR1 SAMP8
CD11b
β-Actin
KDa
42
170
A
C D 1 1 b
O.D
. (%
vs
. S
AM
R1
ve
hic
le)
S A M R 1 S A M P 8
0
5 0
1 0 0
1 5 0
2 0 0
v e h ic le
3 3 i
B
SAMR1-veh SAMR1-33i
SAMP8-veh SAMP8-33i
C D 1 1 b
% f
luo
res
ce
nc
e i
nte
ns
ity
S A M R 1 S A M P 8
0
5 0
1 0 0
1 5 0
v e h ic le
3 3 i
CD11b

Results
80
When Il-1β protein was measured (Fig. 35A) a significant interaction between
strain and treatment was found (F = 11.90, p<0.05). The expression of Il-1β was
increased in vehicle-SAMP8 compared to SAMR1. This increase was reverted when
SAMP8 were treated with 33i. These results were corroborated when mRNA levels of
Il-1β were analysed (F = 16.61, p<0.05) (Fig. 35B).
Concerning Il-6 and Tnf-α, there was a significant interaction between strain and
treatment (F = 14.29, p<0.05; F = 19.26, p<0.05 respectively). In fact, a significant
increase of Il-6 and Tnf-α in vehicle SAMP8 compared to vehicle SAMR1 was seen
which was reversed by 33i treatment. However, when 33i was administered to SAMR1
there was a significant increase in both pro-inflammatory markers (Fig. 35C-D).
Figure 35. Early 33i treatment reduces proinflammatory cytokines in 7-month-old SAMP8 mice. (A) Il-1β protein levels measured by ELISA. (B) mRNA levels of Il-1β, (C) Il-6 mRNA levels and (D) Tnf-α mRNA levels. GAPDH was used as an internal control. Note that 33i treatment reversed the increased levels of these proinflammatory cytokines shown by SAMP8 mice. Results are shown as mean ± SEM (n=6-7). *p<0.05. Two-way analysis of variance (ANOVA) followed by Tukey test.
33i
S w im m in g s p e e d
Sp
ee
d (
cm
/s)
S A M R 1 S A M P 8
0
1 0
2 0
3 0
v e h ic le
3 3 i
S w im m in g s p e e d
Sp
ee
d (
cm
/s)
S A M R 1 S A M P 8
0
1 0
2 0
3 0
v e h ic le
3 3 ivehicle
I l-1 ß
pg
/g t
iss
ue
S A M R 1 S A M P 8
0
1 0 0
2 0 0
3 0 0
4 0 0
5 0 0
v e h ic le
3 3 i
* *
A Il-1β
I l-1 ß
Re
lati
ve
ex
pre
ss
ion
(2
-
Ct)
S A M R 1 S A M P 8
0
2
4
6
8
v e h ic le
3 3 i
* *
B Il-1β
C D
I l-6
Re
lati
ve
ex
pre
ss
ion
(2
-
Ct)
S A M R 1 S A M P 8
0
2
4
6
8
v e h ic le
3 3 i
*
*
T n f-
Re
lati
ve
ex
pre
ss
ion
(2
-
Ct)
S A M R 1 S A M P 8
0
2
4
6
8
v e h ic le
3 3 i
*
* *
Il-6 Tnf-α

Results
81
2.4. Therapeutic treatment: Effect of SIRT2 inhibition in 8-month-old SAMP8 mice
The results obtained with the early treatment led us to consider whether the
chronic administration of 33i for 8 weeks to 8-month-old SAMP8 mice would be able to
reverse the already established cognitive deterioration.
2.4.1. Effect of SIRT2 inhibition on behavioural tests
Spontaneous motor activity test, Rotarod and Marble burying test
No differences were observed in the spontaneous motor activity performance
between 10-month-old SAMR1 and SAMP8 mice. Moreover, 33i did not improve the
performance of 10-month-old SAMP8 mice in the rotarod (Day 1: F = 49.12, p<0.05,
main effect of strain; Day 2: F = 35.62, p<0.05, main effect of strain). However, 33i
significantly reversed SAMP8 altered normal exploratory behaviour in the Marble
burying test (F = 11.29, p<0.05) (Fig. 36).
Figure 36. Effect of SIRT2 inhibition on motor performance and marble burying in 10-month-old SAMR1 and SAMP8 mice. (A) Spontaneous motor activity test. (B) Time spent on the accelerating rotary cylinder of the rotarod. (C) Effect of 33i on the marble burying test. Results are shown as mean ± SEM (n=6-10). *p<0.05. Two-way analysis of variance (ANOVA) followed by Tukey test.
R o ta ro d
Tim
e (
s)
D a y 1 D a y 2
0
1 0 0
2 0 0
3 0 0
4 0 0
v e h ic le
3 3 i
S A M R 1 S A M R 1 S A M P 8S A M P 8
**
M a rb le B u ry in g
Bu
rie
d M
arb
les
S A M R 1 S A M P 8
0
5
1 0
1 5
v e h ic le
3 3 i
* *
33i
S w im m in g s p e e d
Sp
ee
d (
cm
/s)
S A M R 1 S A M P 8
0
1 0
2 0
3 0
v e h ic le
3 3 i
vehicle
C
B Rotarod A S p o n ta n e o u s m o to r a c t iv ity
Dis
tan
ce
tra
ve
lle
d (
cm
)
S A M R 1 S A M P 8
0
5 0 0 0
1 0 0 0 0
1 5 0 0 0v e h ic le
3 3 i
Spontaneous motor activity
M a rb le B u ry in g
Bu
rie
d M
arb
les
S A M R 1 S A M P 8
0
5
1 0
1 5
v e h ic le
3 3 i
* *
Marble Burying

Results
82
Morris Water Maze
In the habituation phase of the MWM test a main effect of mouse strain factor was
found in the analysis of the swimming speed. The swimming speed of SAMP8 mice
was significantly lower than that of the SAMR1 (F = 7.630, p<0.05, main effect of
strain) (Fig. 37). However, since no treatment effect was found, we used the escape
latency for the evaluation of spatial learning and memory of the mice.
Figure 37. Effect of 33i on the swimming speed of 10-month-old SAMP8 and SAMR1. Average swim speed of the animals on the first trial of the habituation phase of the Morris Water Maze before subjects from any group knew the location of the platform. Results are shown as mean ± SEM (n=6-10). *p<0.05. Two-way analysis of variance (ANOVA).
In the adquisition phase of the MWM, the learning curve of 33i-treated SAMP8
showed no improvement when compared with vehicle-SAMP8 showing that neither of
the two groups learned the location of the platform (Fig. 38A). When testing memory
retention, two-way ANOVA analysis revealed a strain effect on days 6 and 8 (F =
5.253, p<0.05, main effect of strain; F = 16.46, p<0.05, main effect of strain) while no
significant differences were found between vehicle and 33i-treated animals (Fig. 38B).
S w im m in g s p e e d
Sp
ee
d (
cm
/s)
S A M R 1 S A M P 8
0
1 0
2 0
3 0
v e h ic le
3 3 i
*
Swimming speed
S w im m in g s p e e d
Sp
ee
d (
cm
/s)
S A M R 1 S A M P 8
0
1 0
2 0
3 0
v e h ic le
3 3 i
*
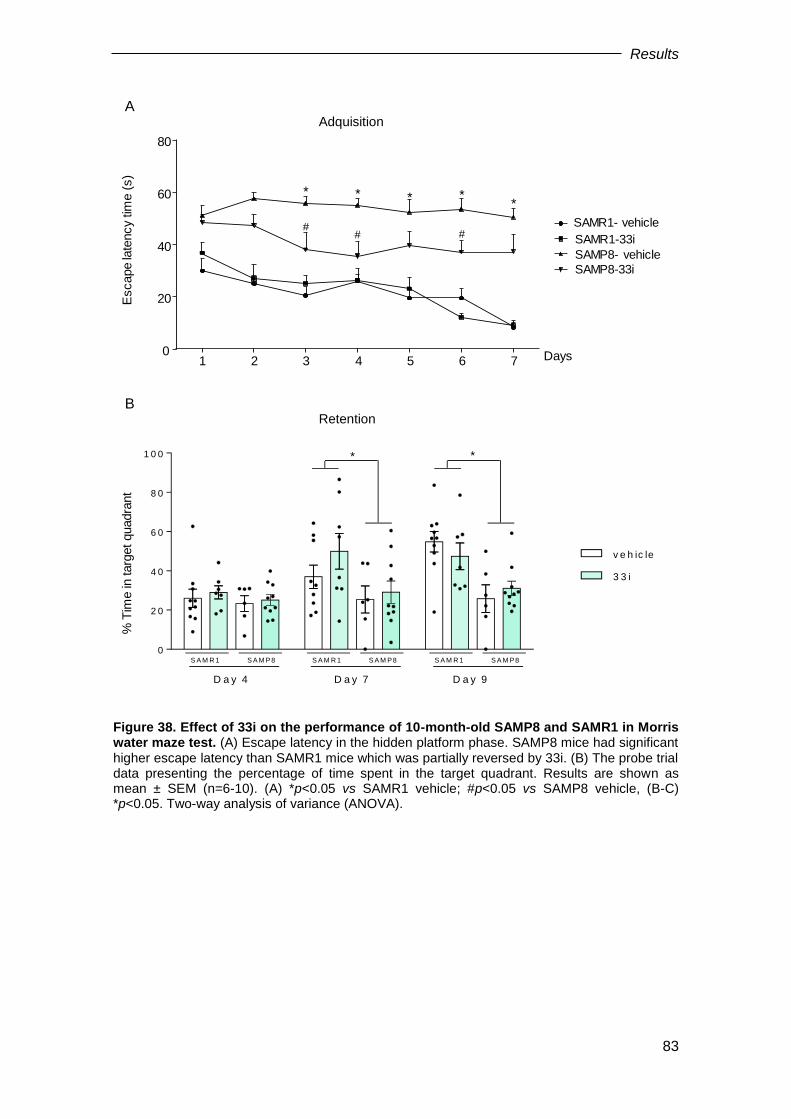
Results
83
Figure 38. Effect of 33i on the performance of 10-month-old SAMP8 and SAMR1 in Morris water maze test. (A) Escape latency in the hidden platform phase. SAMP8 mice had significant higher escape latency than SAMR1 mice which was partially reversed by 33i. (B) The probe trial data presenting the percentage of time spent in the target quadrant. Results are shown as mean ± SEM (n=6-10). (A) *p<0.05 vs SAMR1 vehicle; #p<0.05 vs SAMP8 vehicle, (B-C) *p<0.05. Two-way analysis of variance (ANOVA).
B Retention
S w im m in g s p e e d
Sp
ee
d (
cm
/s)
S A M R 1 S A M P 8
0
1 0
2 0
3 0
v e h ic le
3 3 i
*
% T
ime in
targ
et quadra
nt
R e n te n tio n
% T
ime
in
ta
rge
t q
ua
dra
nt
D a y 4 D a y 7 D a y 9
0
2 0
4 0
6 0
8 0
1 0 0
v e h ic le
3 3 i
S A M R 1 S A M P8 S A M R 1 S A M P8 S A M R 1 S A M P8
* *
A Adquisition
Escape la
tency
time (
s)
1 2 3 4 5 6 70
20
40
60
80
* * * *
#
*
#
Days
# SAMR1- vehicle
SAMR1-33i
SAMP8- vehicle
SAMP8-33i

Results
84
2.4.2. Effect of 33i on SIRT2 and SIRT1 protein levels in 8-month-old SAMP8
As shown in Fig. 39A, hippocampal levels of SIRT2 mice were no significant
different between 10-month-old SAMR1 and SAMP8. Moreover, the protein levels
remained unchanged by the 33i treatment. On the other hand, SIRT1 protein levels in
SAMP8 mice were significantly lower than those in SAMR1 (F = 8.450, p<0.05, main
effect of strain) (Fig. 39B).
Figure 39. Effect of therapeutic 33i treatment on Sirtuin 2 and Sirtuin 1. Representative western blot and quantitative measurement of SIRT2 (A) and SIRT1 expression (B). β-Tubulin was used as an equal loading control. Results are shown as mean ± SEM. *p<0.05 Two-way analysis of variance (ANOVA).
2.4.3. Effect of therapeutic treatment with 33i on AD neuropathological
hallmarks
Concerning the AD neuropathological hallmarks, 10-month-old SAMP8 mice
showed increased levels of p-Tau (F = 40.56, p<0.05, main effect of strain) which were
not altered by 33i (Fig. 40).
S irtu in 2
O.D
.(%
vs
. S
AM
R1
ve
hic
le)
S A M R 1 S A M P 8
0
5 0
1 0 0
1 5 0
2 0 0
v e h ic le
3 3 i
A
S irtu in 1
O.D
.(%
vs
. S
AM
R1
ve
hic
le)
S A M R 1 S A M P 8
0
5 0
1 0 0
1 5 0
2 0 0
v e h ic le
3 3 i
*
B
vehicle vehicle33i 33i
SAMR1 SAMP8
kDa
Sirtuin 1
β-Tubulin
105
55
Sirtuin 2
β-Tubulin 55
37
43
vehicle vehicle33i 33i
SAMR1 SAMP8
kDa
S w im m in g s p e e dS
pe
ed
(c
m/s
)
S A M R 1 S A M P 8
0
1 0
2 0
3 0
v e h ic le
3 3 i
*

Results
85
Figure 40. Therapeutic 33i treatment has no effect on Tau pathology. Representative western blot and quantitative measurement of hippocampal p-Tau (AT8/Total Tau). 33i did not reverse the higher levels of Tau phosphorylation that SAMP8 mice have compared to SAMR1 mice. β-Actin was used as an equal loading control. Results are shown as mean ± SEM (n=6-8). *p<0.05, Two-way analysis of variance (ANOVA).
Regarding amyloid pathology, 10-month-old SAMP8 evidenced increased levels of
Aβ40 (F = 31.17, p<0.05, main effect of strain) (Fig. 41A) and Aβ42 (F = 7.861,
p<0.05, main effect of strain) (Fig. 41B) and decreased levels of full length APP
(F = 4.796, p<0.05) (Fig. 41C) which were not affected by 33i treatment. Moreover, 33i
did not modify the Aβ oligomerization (Fig. 41D).
A T 8 /T a u
O.D
.(%
vs
. S
AM
R1
ve
hic
le)
S A M R 1 S A M P 8
0
1 0 0
2 0 0
3 0 0
v e h ic le
3 3 i
*
S w im m in g s p e e d
Sp
ee
d (
cm
/s)
S A M R 1 S A M P 8
0
1 0
2 0
3 0
v e h ic le
3 3 i
*

Results
86
Figure 41. Therapeutic 33i treatment has no effect on Alzheimer disease’s neuropathological hallmarks. SAMP8 presented higher levels of Aβ40 (A) and Aβ42 (B) levels in the hippocampus of 10-month-old SAMR1 and SAMP8 mice. (C) Representative western blot and quantitative measurement of Aβ oligomers. (D) Representative western blot and quantitative measurement of full length APP and C99/C83 fragments ratio. β-Actin was used as an equal loading control. Results are shown as mean ± SEM (n=6-7). *p<0.05, Two-way analysis of variance (ANOVA).
O lig o m e rs
O.D
.(%
vs
. S
AM
R1
ve
hic
le)
2 4 5 6
0
5 0
1 0 0
1 5 0
2 0 0
v e h ic le
3 3 i
S A M R 1 S A M P 8 S A M R 1 S A M P 8
KDa
A ß -4 0
pm
ol/
g t
iss
ue
S A M R 1 S A M P 8
0
5
1 0
1 5
*
A
A ß -4 2
pm
ol/
g t
iss
ue
S A M R 1 S A M P 8
0
1
2
3
4
5*
D
A P P
OD
(%
vs
. S
AM
R1
ve
hic
le)
S A M R 1 S A M P 8
0
5 0
1 0 0
1 5 0
2 0 0 *
C 9 9 /C 8 3O
D (
% v
s.
SA
MR
1 v
eh
icle
)
S A M R 1 S A M P 8
0
5 0
1 0 0
1 5 0
2 0 0
M a rb le B u ry in g
Bu
rie
d M
arb
les
S A M R 1 S A M P 8
0
5
1 0
1 5
v e h ic le
3 3 i
* *
33i
S w im m in g s p e e d
Sp
ee
d (
cm
/s)
S A M R 1 S A M P 8
0
1 0
2 0
3 0
v e h ic le
3 3 i
vehicle
5642
24
vehicle 33i vehicle 33i
SAMP8SAMR1
KDa
β-Actin100
42
APP
β-Actin
C99C83
108
vehicle 33i vehicle 33i
SAMP8SAMR1
KDa
C
Aβ-40 Aβ-42
APP C99/C89
B
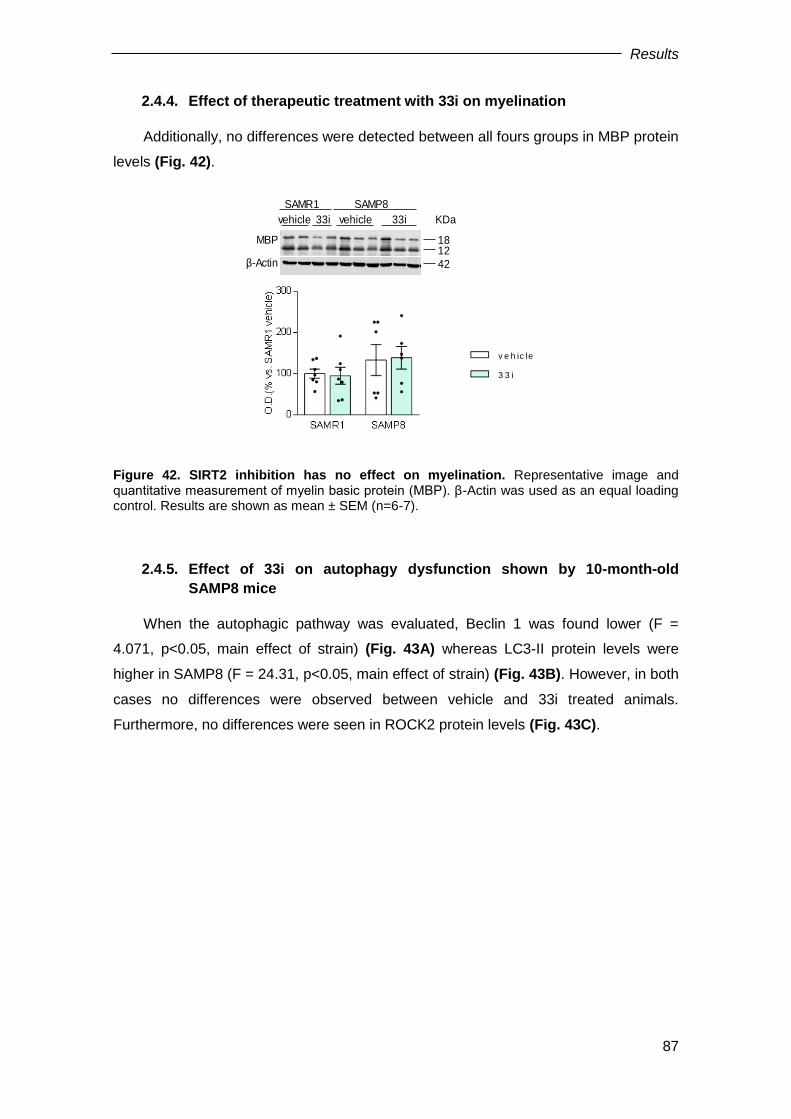
Results
87
2.4.4. Effect of therapeutic treatment with 33i on myelination
Additionally, no differences were detected between all fours groups in MBP protein
levels (Fig. 42).
Figure 42. SIRT2 inhibition has no effect on myelination. Representative image and quantitative measurement of myelin basic protein (MBP). β-Actin was used as an equal loading control. Results are shown as mean ± SEM (n=6-7).
2.4.5. Effect of 33i on autophagy dysfunction shown by 10-month-old
SAMP8 mice
When the autophagic pathway was evaluated, Beclin 1 was found lower (F =
4.071, p<0.05, main effect of strain) (Fig. 43A) whereas LC3-II protein levels were
higher in SAMP8 (F = 24.31, p<0.05, main effect of strain) (Fig. 43B). However, in both
cases no differences were observed between vehicle and 33i treated animals.
Furthermore, no differences were seen in ROCK2 protein levels (Fig. 43C).
S w im m in g s p e e d
Sp
ee
d (
cm
/s)
S A M R 1 S A M P 8
0
1 0
2 0
3 0
v e h ic le
3 3 i
*
42
MBP
β-Actin
18 12
vehicle 33i vehicle 33i
SAMP8SAMR1
KDa
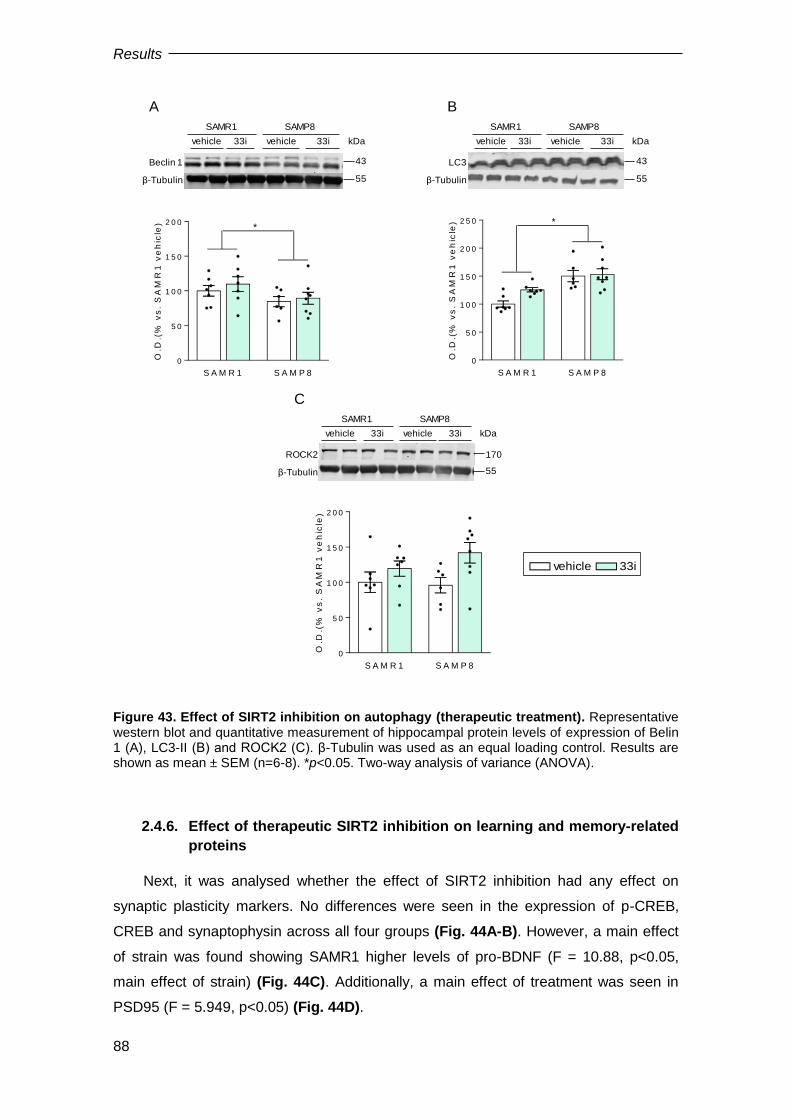
Results
88
Figure 43. Effect of SIRT2 inhibition on autophagy (therapeutic treatment). Representative western blot and quantitative measurement of hippocampal protein levels of expression of Belin 1 (A), LC3-II (B) and ROCK2 (C). β-Tubulin was used as an equal loading control. Results are shown as mean ± SEM (n=6-8). *p<0.05. Two-way analysis of variance (ANOVA).
2.4.6. Effect of therapeutic SIRT2 inhibition on learning and memory-related
proteins
Next, it was analysed whether the effect of SIRT2 inhibition had any effect on
synaptic plasticity markers. No differences were seen in the expression of p-CREB,
CREB and synaptophysin across all four groups (Fig. 44A-B). However, a main effect
of strain was found showing SAMR1 higher levels of pro-BDNF (F = 10.88, p<0.05,
main effect of strain) (Fig. 44C). Additionally, a main effect of treatment was seen in
PSD95 (F = 5.949, p<0.05) (Fig. 44D).
M a rb le B u ry in g
Bu
rie
d M
arb
les
S A M R 1 S A M P 8
0
5
1 0
1 5
v e h ic le
3 3 i
* *
33i
S w im m in g s p e e d
Sp
ee
d (
cm
/s)
S A M R 1 S A M P 8
0
1 0
2 0
3 0
v e h ic le
3 3 i
vehicle
A
B e c lin 1
O.D
.(%
vs
. S
AM
R1
ve
hic
le)
S A M R 1 S A M P 8
0
5 0
1 0 0
1 5 0
2 0 0
v e h ic le
3 3 i
*
vehicle vehicle33i 33i
SAMR1 SAMP8
kDa
Beclin 1
β-Tubulin 55
43
C
R o c k 2
O.D
.(%
vs
. S
AM
R1
ve
hic
le)
S A M R 1 S A M P 8
0
5 0
1 0 0
1 5 0
2 0 0
v e h ic le
3 3 i
vehicle vehicle33i 33i
SAMR1 SAMP8
kDa
55
170ROCK2
β-Tubulin
B
L c 3 II w 2
O.D
.(%
vs
. S
AM
R1
ve
hic
le)
S A M R 1 S A M P 8
0
5 0
1 0 0
1 5 0
2 0 0
2 5 0
v e h ic le
3 3 i
*
vehicle vehicle33i 33i
SAMR1 SAMP8
kDa
55
43LC3
β-Tubulin

Results
89
Figure 44. Effect of SIRT2 inhibition on learning and memory related proteins (therapeutic treatment). Representative western blot and quantitative measurement of hippocampal levels of p-CREB/CREB (A), synaptophysin (B), pro-BDNF (C) and PSD95 (D). β-Tubulin was used as an equal loading control. Results are shown as mean ± SEM (n=6-8). *p<0.05, Two-way analysis of variance (ANOVA) followed by Tukey test.
A B
M a rb le B u ry in g
Bu
rie
d M
arb
les
S A M R 1 S A M P 8
0
5
1 0
1 5
v e h ic le
3 3 i
* *
33i
S w im m in g s p e e d
Sp
ee
d (
cm
/s)
S A M R 1 S A M P 8
0
1 0
2 0
3 0
v e h ic le
3 3 i
vehicle
p ro -B D N F
O.D
.(%
vs
. S
AM
R1
ve
hic
le)
S A M R 1 S A M P 8
0
5 0
1 0 0
1 5 0 *
C
vehicle 33i vehicle 33i
SAMR1 SAMP8
kDa
β-Tubulin
Pro-BDNF 32
55 P S D 9 5
O.D
.(%
vs
. S
AM
R1
ve
hic
le)
S A M R 1 S A M P 8
0
5 0
1 0 0
1 5 0
2 0 0
2 5 0 * *
D
Psd95
β-Tubulin
vehicle 33i vehicle 33i
SAMR1 SAMP8
kDa
95
55
p -C re b /C re b
O.D
.(%
vs
. S
AM
R1
ve
hic
le)
S A M R 1 S A M P 8
0
5 0
1 0 0
1 5 0
2 0 0
v e h ic le
3 3 i
S y n a p to p h ys in
O.D
.(%
vs
. S
AM
R1
ve
hic
le)
S A M R 1 S A M P 8
0
5 0
1 0 0
1 5 0
2 0 0
vehicle 33i vehicle 33i
SAMR1 SAMP8
50
55
kDa
β-Tubulin
Creb
50Creb
vehicle 33i vehicle 33i
SAMR1 SAMP8
kDa
38
55β-Tubulin
Synaptophysinp-
PSD95

Results
90
Moreover, GluN2A, GluN2B and GluA1 protein expression level increased in both
SAMR1 and SAMP8 mice treated with 33i compared to control vehicle mice (F = 4.518,
p<0.05, main effect of treatment; F = 7.019, p<0.05, main effect of treatment; F =
4.652, p<0.05, main effect of treatment, respectively) (Fig. 45).
Figure 45. SIRT2 inhibition upregulates GluN2A, GluN2B and GluA1 expression in 10-month-old SAMR1 and SAMP8 mice. Representative western blot and quantitative measurement of hippocampal GluN2A (A), GluN2B (B) and GluA1 (C) expression levels. β-Tubulin was used as an equal loading control. Results are shown as mean ± SEM (n=6-8). *p<0.05, Two-way analysis of variance (ANOVA) followed by Tukey test.
2.4.7. Effect of 33i treatment on neuroinflammation in 10-month-old SAMP8
mice
When different markers of neuroinflammation were evaluated, it was observed that
once neuroinflammation was established, 33i treatment was not able to reverse it. In
10-month-old SAMP8 mice, SIRT2 inhibition did not reduce the increased levels of
GFAP analysed by western-blot or immunofluorescence (F = 16.06, p<0.05, main
effect of strain; F = 5.809, p<0.05, main effect of strain) (Fig. 46), nor Il-1β protein
levels (F = 24.70, p<0.05, main effect of strain) or mRNA (F = 5.492, p<0.05, main
effect of strain) (Fig. 47A-B), neither Il-6 mRNA levels (F = 16.77, p<0.05, main effect
of strain) (Fig. 47C). On the other hand, no significant differences were observed
across all four groups in Tnf-α levels (Fig. 47D) or when microglial reactivity (Fig. 47E-
F) were analysed.
vehicle 33i vehicle 33i
SAMR1 SAMP8
GluN2A
Tubulin
170
KDa
55β-
A
GluN2B
Tubulin
vehicle 33i vehicle 33i
SAMR1 SAMP8
180
KDa
55β-
B
GluA1
β-Actin
vehicle 33i vehicle 33i
SAMR1 SAMP8
100
KDa
42
C
G lu N 2 a
O.D
.(%
vs
. S
AM
R1
ve
hic
le)
S A M R 1 S A M P 8
0
5 0
1 0 0
1 5 0
2 0 0
v e h ic le
3 3 i
*
*
G lu N 2 b
O.D
.(%
vs
. S
AM
R1
ve
hic
le)
S A M R 1 S A M P 8
0
1 0 0
2 0 0
3 0 0
4 0 0
v e h ic le
3 3 i*
*
G lu A 1
O.D
.(%
vs
. S
AM
R1
ve
hic
le)
S A M R 1 S A M P 8
0
1 0 0
2 0 0
3 0 0
v e h ic le
3 3 i
*
*
M a rb le B u ry in g
Bu
rie
d M
arb
les
S A M R 1 S A M P 8
0
5
1 0
1 5
v e h ic le
3 3 i
* *
33i
S w im m in g s p e e d
Sp
ee
d (
cm
/s)
S A M R 1 S A M P 8
0
1 0
2 0
3 0
v e h ic le
3 3 i
vehicle

Results
91
Figure 46. Effect of 33i treatment on astrogliosis in 10-month-old SAMR1 and SAMP8 mice. 33i treatment does not reverse the neuroinflammation in 10-month-old SAMP8 mice. Representative images and quantitative measurement of hippocampal GFAP protein levels measured by western blot (n=7) (A) and immunofluorescence (n=3) (B). Results are shown as mean ± SEM *p<0.05. Two-way analysis of variance (ANOVA).
B
M a rb le B u ry in g
Bu
rie
d M
arb
les
S A M R 1 S A M P 8
0
5
1 0
1 5
v e h ic le
3 3 i
* *
33i
S w im m in g s p e e dS
pe
ed
(c
m/s
)
S A M R 1 S A M P 8
0
1 0
2 0
3 0
v e h ic le
3 3 i
vehicle
vehicle 33i vehicle 33i
SAMR1 SAMP8
GFAP
β-Actin
55
KDa
42G F A P
O.D
.(%
vs
. S
AM
R1
ve
hic
le)
S A M R 1 S A M P 8
0
1 0 0
2 0 0
3 0 0
4 0 0
5 0 0 *
A
SAMR1-veh SAMR1-33i
SAMP8-veh SAMP8-33i
G F A P
% f
luo
res
ce
nc
e i
nte
ns
ity
S A M R 1 S A M P 8
0
5 0
1 0 0
1 5 0
v e h ic le
3 3 i
*
GFAP
B

Results
92
Figure 47. Effect of 33i treatment on inflammatory markers in 10-month-old SAMR1 and SAMP8 mice. (A) Il-1β protein levels measured by ELISA (n=6). Effect of 33i on mRNA levels of Il-1β (B), Il-6 (C), Tnf-α (D) and CD11b (E-F) (n=3) in the hippocampus of 10-month-old SAMP8 and SAMR1 mice. Note that 33i treatment di not reversed the increased levels of these proinflamatory cytokines shown by SAMP8 mice. Results are shown as mean ± SEM (n=6-7). *p<0.05. Two-way analysis of variance (ANOVA).
D
M a rb le B u ry in g
Bu
rie
d M
arb
les
S A M R 1 S A M P 8
0
5
1 0
1 5
v e h ic le
3 3 i
* *
33i
S w im m in g s p e e d
Sp
ee
d (
cm
/s)
S A M R 1 S A M P 8
0
1 0
2 0
3 0
v e h ic le
3 3 i
vehicleIl-6
vehicle 33i vehicle 33i
SAMR1 SAMP8
CD11b
β-Actin
KDa
42
170
C D 1 1 b
O.D
.(%
vs
. S
AM
R1
ve
hic
le)
S A M R 1 S A M P 8
0
5 0
1 0 0
1 5 0
2 0 0
2 5 0
SAMR1-veh SAMR1-33i
SAMP8-veh SAMP8-33i
C D 1 1 b
% f
luo
res
ce
nc
e i
nte
ns
ity
S A M R 1 S A M P 8
0
5 0
1 0 0
1 5 0
E F
I l-1 ß
Re
lati
ve
ex
pre
ss
ion
(2
-
Ct)
S A M R 1 S A M P 8
0
1
2
3 *
I l-1 ßp
g/g
tis
su
e
S A M R 1 S A M P 8
0
1 0 0
2 0 0
3 0 0
4 0 0
5 0 0*
I l-6
Re
lati
ve
ex
pre
ss
ion
(2
-
Ct)
S A M R 1 S A M P 8
0
1
2
3*
T n f-
Re
lati
ve
ex
pre
ss
ion
(2
-
Ct)
S A M R 1 S A M P 8
0 .0
0 .5
1 .0
1 .5
2 .0
2 .5
A B
C
Il-1β Il-1β
Tnf-α
CD11b

Results
93
3. Behavioural and molecular consequences of SIRT2 inhibition on a familiar AD mouse model
3.1. Effect of 33i treatment on behavioural alterations in the APP/PS1 mouse model
3.1.1. Effect of SIRT2 inhibition on the anxiety-like behaviour shown by the
APP/PS1 model
Firstly, the open field test was carried out. In the spontaneous locomotor activity
there were no differences among all 4 groups. However a main effect of genotype was
observed when the time spent in the centre zone was analysed (F = 10.31, p<0.05,
main effect genotype). APP/PS1 spent significantly less time in the centre zone than
the WT mice, an effect that was not reverted by 33i treatment (Fig.48A-B).
Figure 48. Effect of SIRT2 inhibition on anxiety tests. (A) Distance travelled during the open field test. (B) Time spent in the centre zone in the open field test. (C) Latency to begin feeding in novelty suppressed feeding test. (D) Effect of 33i on the marble burying test. (E) Time spent in the lit-box. Results are shown as mean ± SEM (n=6-13). *p<0.05 Two-way analysis of variance (ANOVA).
W T A P P /P S 1
0
5
1 0
1 5
2 0
2 5
Dis
tan
ce
tra
ve
lle
d (
cm
)
O p e n F ie ld
v e h ic le
3 3 i
W T A P P /P S 1
0
2 0
4 0
6 0
Tim
e i
n C
en
ter
(s)
C e n te r in O p e n F ie ld
v e h ic le
3 3 i
*
W T A P P /P S 1
0
2 0 0
4 0 0
6 0 0
La
ten
cy
(s
)
N o v e lty s u p p re s s e d fe e d in g
v e h ic le
3 3 i
*
W T A P P /P S 1
0
5
1 0
1 5
2 0
Nu
mb
er
of
bu
rie
d m
arb
les
M a rb le B u ry in g
v e h ic le
3 3 i
W T A P P /P S 1
0
2 0
4 0
6 0
8 0
1 0 0
% T
ime
in
lig
ht
bo
x
L ig h t-D a rk b o x te s t
v e h ic le
3 3 i
W T A P P /P S 1
0
2 0 0
4 0 0
6 0 0
La
ten
cy
(s
)
N o v e lty s u p p re s s e d fe e d in g
v e h ic le
3 3 i
*
Open Field Centre in Open Field Novelty suppressed feeding
Marble Burying Light-Dark box test
A B C
D E

Results
94
Similarly, in the novelty suppressed feeding test, both vehicle and 33i treated
APP/PS1 had higher latencies to go to the pellet, which was strategically placed in the
centre of the arena (F = 4.874, p<0.05, main effect of genotype) (Fig. 48C). These
results suggest that the APP/PS1 model has higher baseline anxiety behaviour than its
control. However, in the marble burying test or in the light-dark box test, where no
differences were observed between all four groups (Fig. 48D-E).
3.1.2. Effect of 33i treatment to APP/PS1 model in the forced swimming test
As it is seen in Fig. 49, no significant differences were observed the immobility
time in the forced swimming test between mouse genotypes, suggesting that, in this
test, APP/PS1 mice do not present a depressive-like behaviour. No differences were
observed neither between vehicle or 33i treated animals.
Figure 49. Effect of 33i on the performance of 9-month-old APP/PS1 mice in the Forced swimming test. There was no differences in the immobility time across the four groups Results are shown as mean ± SEM (n=6-13).
3.1.3. Effect of SIRT2 inhibition in the cognitive decline shown by APP/PS1
mice
In order to analyse whether 33i had any beneficial effect on the cognitive decline,
the main behavioural characteristic of this model, we evaluated memory using the
novel object recognition test. As shown in Fig. 50, 33i treatment was able to
significantly increase the discrimination index in both WT and APP/PS1 mice (F =
4.718, p<0.05, main effect of treatment).
W T A P P /P S 1
0
2 0
4 0
6 0
8 0
Imm
ob
ilit
y t
ime
(s
)
F o rc e d s w im m in g te s t
v e h ic le
3 3 i
W T A P P /P S 1
0
2 0 0
4 0 0
6 0 0
La
ten
cy
(s
)
N o v e lty s u p p re s s e d fe e d in g
v e h ic le
3 3 i
*
Forced swimming test

Results
95
Figure 50. SIRT2 inhibition ameliorated the cognitive decline of APP/PS1 mice. Results are expressed as discrimination index. Note that the 33i treatment increases the discrimination index. Results are shown as mean ± SEM (n=6-13). *p<0.05. Two-way analysis of variance (ANOVA) followed by Tukey test.
3.2. Effect of 33i treatment on β-amyloid burden
The main neuropathological hallmark of the APP/PS1 model is the development of
amyloid plaques. Therefore, in order to investigate the possible beneficial effects of
SIRT2 inhibition on amyloid pathology, amyloid plaques were counted. As shown in
Fig. 51, while the brains of WT mice did not show any signal, an increase in the
immunofluorescence signal showing amyloid plaques was evident in the brains of all
APP/PS1 mice. These plaques were mostly located in the brain cortex and the
hippocampus. Interestingly, 33i treatment was able to significantly decrease the total
number of them (F = 6.648, p<0.05).
Figure 51. 33i treatment reduces the number of amyloid plaques in 9-month-old APP/PS1 mice. Representative images and quantitative measurement of immunoreactive amyloid plaques (3 slides per mice, n=4 mice per group). Results are shown as mean ± SEM *p<0.05. Two-way analysis of variance (ANOVA) followed by Tukey test.
NORT
W T A P P /P S 1
-1 .0
-0 .5
0 .0
0 .5
1 .0
Dis
cri
min
ati
on
in
de
x
N O R T
v e h ic le
3 3 i
* *
W T A P P /P S 1
0
2 0 0
4 0 0
6 0 0
La
ten
cy
(s
)
N o v e lty s u p p re s s e d fe e d in g
v e h ic le
3 3 i
*
A m y lo id p la q u e c o u n t
Nu
mb
er
of
am
ylo
id p
laq
ue
s
W T A P P /P S 1
0
2 0 0
4 0 0
6 0 0
8 0 0
1 0 0 0
1 2 0 0
v e h ic le
3 3 i
* *
Amyloid plaque count


DISCUSSION


Discussion
99
Epigenetic changes are currently recognized as part of the aging process and
have been implicated in many age-related diseases including AD (Jakovcevski and
Akbarian., 2012; Akbarian et al., 2013; López-Otín et al., 2013). In this context, sirtuins
belonging to the NAD+ dependent histone deacetylase (HDAC) III class of enzymes
have emerged as master regulators of metabolism and longevity. However, their role in
the prevention of organismal aging and cellular senescence still remains controversial.
Previous studies have shown that pharmacologic inhibition of SIRT2 exerts
neuroprotective effects in diverse models of neurodegenerative disease, including PD
and HD (Outeiro et al., 2007; Luthi-Carter et al., 2010; Taylor et al., 2011; Chopra et
al., 2012; Chen et al., 2015). Moreover, although less is known about the role of SIRT2
in AD, mainly in the genetic field (Polito et al., 2013; Wei et al., 2014), several studies
have demonstrated in different in vitro and in vivo transgenic mouse models that
inhibition of SIRT2 is a safe and promising neuroprotective agent in both Tau-
associated frontotemporal dementia and AD (Spires-Jones et al., 2012; Scuderi et al.,
2014; Biella et al., 2016; Silva et al., 2017; Esteves et al., 2018). On the basis of these
considerations, we have explored the effects of SIRT2 inhibition in the SAMP8 and
APP/PS1 mouse model.
1. In vitro pharmacological and toxicological studies
The compound 33i is a 3'-phenethyloxy-2-anilinobenzamide analogue
representing a new class of SIRT2-selective inhibitors (Suzuki et al., 2012). HDAC
enzyme activity assay revealed that 33i does not inhibit HDAC1, HDAC2, HDAC3 and
HDAC6, all of them enzymes that have been implicated in AD memory-related
dysfunction (Ding et al., 2008; Guan et al., 2009; McQuown and Wood., 2011; Bahari-
Javan et al., 2012; Gräff et al., 2012; Govindarajan et al., 2013). This result rules out
the possibility that any beneficial effect observed could be due to the possible inhibition
of these enzymes. Moreover, enzyme assays using human recombinant SIRT1 and
SIRT2 showed that 33i is a potent and selective SIRT2 inhibitor, showing more than
35-fold greater SIRT2-selectivity compared to AGK2 (Suzuki et al., 2012), a previously
reported SIRT2-selective inhibitor (Outeiro et al., 2007).
Firstly, a cytotoxic study was performed with the objective of determining the
optimum concentrations that should be used to approach adequately the in vitro
studies with the 33i compound. After interpreting the MTT studies, we concluded that
concentrations above 20 μM were cytotoxic for the SH-SY5Y cell line. Therefore, in
order to carry out the confirmation of the inhibitory activity of 33i towards SIRT2, the
concentrations 0.1, 1 and 5 μM were selected.

Discussion
100
The SH-SY5Y cell line was chosen for the in vitro inhibitory activity confirmation of
the 33i as it constitutively expresses SIRT2 protein. Although SIRT2 mainly resides in
the cytoplasm, previous in vitro studies have demonstrated the ability of SIRT2 to
deacetylate different substrates such as histone 4 and α-tubulin located in the nucleus
and cytoplasm respectively (Vaquero et al., 2006; Di Filippo et al., 2008). Our results
are in accordance with these findings as an increase of acetylated H4 and acetylated
α-tubulin was found after SIRT2 inhibition by 33i. Concerning the nuclear target of
SIRT2, acetylated histone 4 levels were increased at the concentration of 0.1 μM after
a 3 and 6 hour-treatments with 33i. Additionally, an increase of acetylated α-tubulin
was observed at 1 μM after 3 hours treatment. The fact that the significant increase
was shown in both markers at 0.1 and 1 μM concentrations and not at 5 μM, could be
due to the experimental design. In this sense, given that the 33i molecule is a very
specific and potent SIRT2 inhibitor and acetylations are very rapid post-translational
modifications, which are regulated and compensated by several enzymes (i.e. HATs
and α-tubulin acetylases), shorter treatment should have been performed to detect this
increase at higher concentrations. Furthermore, 33i effectiveness could undergo a bell-
shaped dose response activity making it pharmacologically effective only at certain
concentrations.
All together, these in vitro results confirm that 33i deacetylates two well-known
nuclear and cytoplasmic SIRT2 cellular substrates. Moreover, our study demonstrates
that SH-SY5Y cells are an interesting in vitro model that could help understand in depth
the cellular functions of SIRT2, hence could be used as a good model for
pharmacological screening of potential new SIRT2 inhibitors.
Despite the promising results that have been recently published regarding the use
of SIRT2 inhibitors as a pharmacological strategy to address different
neurodegenerative diseases (Outeiro et al., 2007; Luthi-Carter et al., 2010; Chopra et
al., 2012; Spires-Jones et al., 2012; Scuderi et al., 2014; Chen et al., 2015; Biella et al.,
2016; de Oliveira et al., 2017; Silva et al., 2017; Esteves et al., 2018) some remain
sceptical about their future use in humans.
HDAC inhibitors, in general, present a major concern because of their unspecific
pharmacological cell target, their associated side effects and their potential implication
in mutagenic or genotoxic processes. In fact, HDAC inhibitors have been described as
potential cytotoxic and genotoxic molecules although the underlying mechanisms
remain unknown (Olaharski et al., 2006; Bose et al., 2014). In this sense, HDACs
appear to be essential regulators of neuronal response to DNA damage. Hence, their
Discussion
101
inhibition could lead to cell cycle arrest, apoptosis and differentiation (Salminen et al.,
1998). In this line, results of several independent studies have described that various
HDAC inhibitors tested positive in standard genotoxicity assays (Gomez-Vargas and
Vig., 2002; Yoo and Lee., 2005; Olaharski et al., 2006; Johnson and Walmsley., 2013).
Additionally, some studies have shown that some HDAC inhibitors can be neurotoxic in
neuronal cultures (Salminen et al., 1998; Kim et al., 2004). Furthermore, several side
effects have been reported when HDAC inhibitors were used in humans as adjuncts for
cancer treatments such as thrombocytopenia, fatigue, confusion and abnormal heart
rhythms (Subramanian et al., 2010; Wagner et al., 2010).
For this reason, we carried out a preliminary toxicological study using the Ames
test and the Comet assay. The Ames test was used to discard possible mutations
caused by 33i or any of its metabolites. Additionally, the comet assay was carried out
to discard DNA strand breaks and alkali-labile sites as well as possible DNA oxidation
and methylation resulting from the 33i administration.
The results obtained from the Ames test discard that the 33i or any of its
metabolites are mutagenic as there was no dose dependent increase of revertant
colonies in the PBS plaques or S9 plaques. However, further mutagenic studies should
be carried out in other Salmonella typhimurium strains to confirm this data.
Concerning the genotoxicity of 33i, no genotoxic effect was observed in SH-SH5Y
at the concentrations used. Interestingly, even though cell death was observed at 20
µM in MTT, we can conclude that the decrease in cell survival was not due to DNA
damage caused by 33i.
Taken together the results from the in vitro studies, we next studied the effects of
SIRT2 inhibition by means of the compound 33i in vivo. Subsequently, we performed in
vivo pharmacological studies directed to evaluate the effect of SIRT2 inhibition in two
different models of AD, the SAMP8 and the APP/PS1 mouse model.
2. SAMP8 model
Since an increase in SIRT2 levels has been suggested to be associated with aging
in the central nervous system (Maxwell et al., 2011), we firstly measured hippocampal
SIRT2 expression in 2-month-old and 9-month-old SAMR1 and SAMP8 mice. The
SAMP8 mouse model, based on aging rather than on mutations, resembles the
symptoms of late-onset and age-related sporadic AD patients (Pallàs et al., 2008). It
has even been suggested that SAMP8 mice may more closely represent the

Discussion
102
complexity of the disease than other transgenic mouse lines because of the
multifactorial nature of AD (Morley et al., 2012). In agreement with Maxwell et al.,
(2011), our study shows that 9-month-old SAMR1 and SAMP8 have higher
hippocampal levels of SIRT2 when compared with 2 month-old mice. No significant
differences were found between both strains, supporting a recent study that has shown
increased SIRT2 plasma levels in AD subjects and aged-matched healthy controls
compared to healthy young controls (Wongchitrat., 2019) but no differences between
AD and aged-matched controls. These results suggest that SIRT2 might be a good
biomarker of the aging process, highlighting its potentiality not only in AD but also in
other pathologies associated with age or age-related cognitive decline.
Subsequently, the efficacy of 33i and its capability to correctly reach the brain and
inhibit SIRT2’s enzymatic activity was confirmed by measuring hippocampal Abca1
mRNA levels, a well-known transporter of cholesterol whose transcription is inhibited
by SIRT2 (Taylor et al., 2011; Spires-Jones et al., 2012) and acetylation levels of
histone 4 which were both significantly higher in 33i treated SAMR1 and SAMP8 mice.
In this context, we next established two different ages (5 months and 8 months) to
evaluate the efficacy of an early or a therapeutic treatment with 33i in SAMP8 mice.
Concerning the spontaneous motor activity and rotarod performance of 7-month-
old mice, there was a clear strain effect making SAMR1 have better performances in
both tests in agreement with previous studies (Miyamoto, 1994). However, neither
SAMR1 nor SAMP8 mice performance in both tests was affected by the 33i treatment
indicating that the possible beneficial effects caused by the early treatment with 33i on
other tests are independent of any effect on motor activity. Regarding the marble
burying test, consistent with previously reported by Moreno et al., (2017), the mean
number of marbles buried by 7-month-old SAMR1 mice were significantly higher than
the corresponding values of vehicle-treated SAMP8 mice. Interestingly, 33i was able to
reverse at the age of 7 months SAMP8’s basal altered exploratory behaviour to the
point that no significant differences were found between 33i-treated SAMP8 and
SAMR1 vehicle mice.
The effect of 33i on the cognitive decline observed in SAMP8 mice was evaluated
using the MWM test, a hippocampal dependent task used to test spatial memory and to
evaluate the working and reference memory functions in response to treatments.
In the habituation phase, there were no differences in swimming speed across the
4 groups at the age of 7 months, which enabled us to exclude the effect of motivational

Discussion
103
and sensorimotor factors on animal learning and memory performance. This is why the
escape latency of the hidden platform parameter was used for the evaluation of spatial
learning and memory of the mice.
Consistent with previous reports (Orejana et al., 2012, 2013, 2015), 7-month-old
SAMP8 mice presented learning and memory impairments in the MWM when
compared with age matched SAMR1 mice. Noteworthy, this effect was markedly
ameliorated by 33i early treatment. These findings support a recent study by Yoo et al.,
(2015) that demonstrates how sodium butyrate, a histone deacetylase inhibitor,
ameliorates SIRT2-induced memory impairment in the novel object recognition test
(NORT) (Yoo et al., 2015). In addition our results are in agreement with a recent study
where SIRT2 inhibition using higher doses of another SIRT2 inhibitor, AK-7, (20 mg/kg)
reversed the long-term memory impairment in both 3xTg-AD and APP23 animal model
in the NORT (Biella et al., 2016). However, to our knowledge, this is the first study
demonstrating the beneficial effects of SIRT2 specific inhibition in learning and memory
impairments shown in the MWM.
Similarly to the early treatment, therapeutic treatment with 33i improved the natural
marble burying behavior of 10-month-old SAMP8 mice. However, when memory was
assessed, the therapeutic treatment did not reverse the cognitive deficits shown by
these animals in the MWM. These results suggest that 33i could slow and prevent the
progression of the cognitive deterioration, however, once the cognitive decline is
marked and well-stablished SIRT2 inhibition is not able to reverse it.
In order to fully figure out the mechanisms underlying the beneficial effects
observed after early SIRT2 inhibition, different hypothesis were evaluated.
SIRT1 expression
While increase on the expression of SIRT2 has been associated with aging
processes and related to higher incidence of neurodegenerative diseases (Outeiro et
al., 2007), enhanced expression and/or activity of SIRT1 is thought to prevent neuronal
death in amyotrophic lateral sclerosis, polyglutamine toxicity and reduce hippocampal
degeneration in different cell and mouse models of AD (Kim et al., 2007; Li et al., 2007;
Michan and Sinclair, 2007; Pfister et al., 2008).
Hence, we evaluated the possibility that the inactivation of SIRT2 could lead to a
compensatory activation of SIRT1 (Theendakara et al., 2013), which has been reported
to reverse memory impairments in the SAMP8 mice (Cristòfol et al., 2012; Porquet et

Discussion
104
al., 2013). In agreement with what was previously described by Cosin-Tomas., (2014),
our results show a decrease of SIRT1 in 7-month-old and 10-month-old SAMP8 saline
mice when compared to age matched SAMR1 mice but we did not find any differences
in SIRT1 expression in hippocampus of 33i treated mice (Cosín-Tomás et al., 2014).
Therefore, our results suggest that the beneficial effects induced by 33i are
independent of any changes in SIRT1 levels.
AD neuropathological hallmarks
We next focused our study on the possible effects of SIRT2 inhibition on the main
neuropathological hallmarks of AD.
First, we analysed the effect of SIRT2 inhibition on Tau pathology since Tau
hyperphosphorylation has been described to be evident on 5-month-old SAMP8 mice
and has been implicated in the neurodegeneration and accelerated aging process in
this senescence mouse model (Canudas et al., 2005; Sureda et al., 2006; Orejana et
al., 2012). Consistent with those studies, 7 and 10-month-old SAMP8 mice showed an
increase in phosphorylation of Tau at Ser202/Ser205 (AT8 epitope). In agreement with
previously reported results in other animal model (Spires-Jones et al., 2012), early and
therapeutic SIRT2 inhibition in vivo did not affect Tau hyperphosphorylation. However,
two recent studies (Silva et al., 2017; Esteves et al., 2018) have shown in different AD
cellular models that SIRT2 inhibition reduces in vitro Tau phosphorylation at Ser396
improving microtubule assembly and stabilization. These studies highlight the
importance of further investigate the role of SIRT2 on different Tau phosphorylations
and different animal models including Tau transgenic mice.
Following the hypothesis that SIRT2 may affect APP metabolism (Biella et al.,
2016) or Aβ aggregation (Silva et al., 2017), we also quantified hippocampal Aβ40 and
Aβ42 levels, Aβ oligomerization and APP processing. At 7 months of age, no
significant differences were observed across all four groups, suggesting that in the
SAMP8 mouse model, it is too early to test this hypothesis. It is true that regarding
Aβ40 levels in the SAMP8 mice seem to be increased and they could have been
reversed with the 33i. However, this effect is not statistically significant probably due to
the high variability found in the SAMP8 group and methodological limitations. This
observation and the fact that other authors have described a role of SIRT2 in
modulating APP processing (Biella et al., 2016) encouraged us to further investigate
the potential role of SIRT2 on amyloid pathology in other mouse model.

Discussion
105
In the therapeutic treatment, 10-month-old SAMP8 presented a well stablished
amyloid pathology. In this sense, even though increased levels of Aβ40 and Aβ42 were
visible in SAMP8 mice compared to SAMR1 mice, the 33i had no significant effect.
These results suggest that the administration of this treatment (dose, age,
duration) is not able to reverse the established Tau and amyloid pathology; however,
they raise the question of whether a prolonged early treatment until 10 months of age
would had prevented their development.
Autophagy and ubiquitin–proteasome system
Autophagy is a lysosome-mediated degradation process for non-essential or
damaged cellular constituents. In the context of neurodegenerative disorders, an
emerging consensus supports that the induction of autophagy is a neuroprotective
response. Therefore, an inadequate or defective autophagy, promotes neuronal cell
death in most of these disorders, suggesting that regulation of autophagy may be a
valuable therapeutic strategy for their treatment (Wong and Cuervo, 2010).
In this sense, SIRT2 was recently reported to interfere with stress-induced
autophagy, autophagy-mediated degradation of protein aggregates under proteasome
inhibition and basal autophagy (Zhao et al., 2010; Gal et al., 2012; Inoue et al., 2014).
Moreover, regarding SAMP8, a previous study had demonstrated that along with
accelerated senescence, autophagy activity decreased significantly in 12 month old
SAMP8 mice (Ma et al., 2011). Thus, we next investigated whether autophagy
modulation by SIRT2 inhibition could be one of the mechanisms underlying 33i
afforded beneficial effects. For this, the expression of three autophagy related proteins
was analysed: Beclin 1, Rock2 and LC3-II.
Beclin 1 and ROCK 2 are considered to be markers of the autophagic activity. In
this sense. concerning Beclin 1, some researchers proved that it was reduced in the
brain of old individuals (Shibata et al., 2006), mild cognitive impairment and AD
patients (Pickford et al., 2008; Silva et al., 2017), correlating its levels with the
autophagic level. Additionally Ma and co-workers (2011) detected a transient increase
of Beclin 1 in 7-month-old SAMP8 and then a decrease in 12 month old animals.
Regarding ROCK2, a recent study has shown that ROCK hippocampal expression is
increased significantly in 8-month SAMP8 mice (Chen et al., 2014). Although we found
no differences in Beclin 1 and ROCK2 proteins in 7-month-old SAMP8 mice, in
agreement with Ma et al., (2011) lower levels of Beclin 1 were observed in 10 month-

Discussion
106
old SAMP8 mice compared with aged-matched SAMR1. In all cases, no significant
effect was observed after 33i treatment.
Microtubule-associated-protein-light-chain-3 (LC3)-II, the lipidated form of LC3, is
the most widely used marker for autophagy as it is the only protein associated with
autophagosomes specifically (Kabeya et al., 2000). Concerning the early treatment, 7-
month-old vehicle SAMP8 mice had increased expression of LC3-II, implying impaired
clearance of autophagic vacuoles in these mice, in agreement with previous described
results (Ma et al., 2011). Interestingly, this increase was partially reverted in 33i treated
SAMP8 mice. However, regarding the effects of the therapeutic treatment, in
accordance with Ma and co-workers (2011), 10-month-old SAMP8 had higher levels of
LC3-II than SAMR1, which remained unchanged with the 33i treatment.
Besides the autophagy-lysosome pathway, there is another well-known
mechanism for the removal of protein aggregates: the ubiquitin-proteasome system
(UPS). Interestingly, it has been recently described the presence of increased levels of
ubiquitinated proteins in post-mortem brain tissues of patients with mild cognitive
impairments and AD (Silva et al., 2017). Moreover, it has been reported that SIRT2
increases of ubiquitinated aggregates in vitro (Gal et al., 2012). In accordance with
those observations and with data previously shown by Ma et al., 2011, SAMP8 mice
exhibited more ubiquitin-positive proteins than control SAMR1 mice. However, due to
the high variability observed in 33i SAMP8 group, no significant differences were
obtained between vehicle and 33i treated animals.
Taking into account two recent studies that have demonstrated positive effects on
autophagy pathway after SIRT2 inhibition in vitro (Silva et al., 2017; Esteves et al.,
2018) and the reduction in LC3II observed in 7-month old 33i treated SAMP8, further
experiments (higher doses of 33i or longer treatments) are necessary to validate or
discard SIRT2 inhibition as a therapeutic strategy to tackle neurodegenerative diseases
by regulating autophagic flux.
SIRT2 and oligodendrocytes
Since SIRT2 is highly expressed in oligodendrocytes (Jayasena et al., 2016), a
possible oligodendrocyte-mediated effect after SIRT2 inhibition was also considered. A
relevant in vitro study has previously demonstrated that over-expression of SIRT2
enhances the expression of the myelin marker, MBP (Ji et al., 2011). On the other
hand it has been described that SAMP8 at 10 months old showed a decrease in MBP-
immunoreactivity in the hippocampal CA1 subfield, compared with SAMR1 (Tanaka et

Discussion
107
al., 2005). Yet, in the early treatment with 33i, neither SAMP8 mice nor treatment with
33i affected hippocampal MBP levels. These apparently contradictory results could be
explained in terms of technical sensitivity. It is important to note that Tanaka and co-
workers (2005) only observed significant differences in the hippocampal CA1 subfield
but not in the cerebral cortex and the optic tract. Therefore, by analysing the entire
hippocampus by western blot, we could have missed some differences in specific brain
areas. Moreover, cell type-specific differences in the SIRT2 expression pattern could
explain the lack of effect of SIRT2 inhibition on this myelin marker. We hypothesize that
SIRT2 inhibition by 33i could have greater consequences on gene expression in
neurons given that their expression is lower than in oligodendrocytes and therefore
may be able to inhibit a higher percentage of total SIRT2 enzymes. Another possible
explanation could be found in the different predominant isoforms in each cell type being
in oligodendrocytes SIRT2.2 (Zhu et al., 2012; Thangaraj et al., 2017) whereas in
neurons is SIRT2.1 (Luthi-Carter et al., 2010) which may result in selective sensitivity
to its inhibition by the compound 33i.
Learning and memory related proteins synthesis
Since long-term memories require gene expression, epigenetic mechanisms that
modulate transcription have a critical role in memory acquisition and maintenance.
Interestingly, memory acquisition leads to an increase in histone acetylation by
increasing histone acetyl transferase (HAT) activity and decreasing HDAC activity,
resulting in a particular pattern of gene expression (McQuown and Wood, 2011).
Hence, inhibitors of HDAC activity enhance histone acetylation, synaptic plasticity,
learning and memory (Guan et al., 2009; Fischer et al., 2010; McQuown and Wood,
2011; Gräff and Tsai, 2013). Following this hypothesis, the expression of different
learning and memory related-proteins was analysed in the hippocampus of the mice.
One of the most studied pathways that link synaptic plasticity with gene expression
depends on the activation of cAMP-response element binding protein (CREB). CREB
phosphorylation plays a key role in synaptic function and memory (Tully et al., 2003;
Miyashita et al., 2012). The activation of CREB leads to the expression of several
genes, generally denominated by immediate-early genes, which include Arc among
others (Alberini and Kandel, 2014). Moreover, CREB is a transcription factor binding to
the promoter regions of genes, including BDNF, which is associated with memory and
synaptic plasticity (Bimonte-Nelson et al., 2003; Gómez-Pinilla et al., 2007). In contrast
to previously described by Lin et al., (2014), we failed to observe any significant
difference between 7-month-old SAMR1 and SAMP8 mice when p-CREB, CREB,

Discussion
108
BDNF and Arc were analysed by Western blot. What is more, no differences were
found between vehicle or 33i-treated animals. When these proteins were analysed in
10-month-old mice, SAMP8 showed lower levels of hippocampal BDNF protein
expression, although no differences were observed after 33i treatment.
NMDA and AMPA glutamate receptors modulate long-term potentiation (LTP) in
hippocampus, considered the basis for spatial learning and memory (Frey and Morris,
1997; Traynelis et al., 2010). In fact, in parallel with the age-related decline in LTP,
diminished surface expression of glutamate receptors has been reported in several
brain regions in aged rodents (Kim et al., 2005; Gocel and Larson, 2013; Ménard et al.,
2015) and humans (Ikonomovic et al., 2000). NMDA-selective glutamate receptors are
tetrameric complexes composed of two glycine-binding GluN1 subunits and two
glutamate-binding GluN2 (GluN2A-D) subunits (Yuan et al., 2015). Previous studies
have shown that among the NMDA receptor subunits, it is the GluN2B subunit the one
that is most affected by the aging process (Magnusson et al., 2000, 2002). Accordingly,
enhancing GluN2B expression in old mice improves spatial long-term memory (Brim et
al., 2013).
Interestingly, a recent study in our laboratory has demonstrated an increase in
GluN2A and GluN2B subunits when 33i was administered to C57BL/6 mice (Erburu et
al., 2017). In agreement with that study, early treatment with 33i increased in GluN2A,
GluN2B and GluA1 expression in the hippocampus, providing a plausible explanation
for the improvement observed in the cognitive deficits shown by SAMP8 mice.
Similarly, increased expression of GluN2A, GluN2B and GluA1 subunits were also
observed in 10-month-old SAMP8 and SAMR1 mice treated with 33i.
Noteworthy, our results demonstrate that SIRT2 inhibition causes an increase of
hippocampal mRNA levels of Glun2a and Glun2b and, hence, an increase in their
synthesis. In line with these studies, we have also shown that SIRT2 inhibition
increases the expression of other genes involved in synaptic plasticity in SH-SY5Y
cells (Muñoz-Cobo et al., 2018). Although SIRT2 is mostly known as a cytosolic
deacetylase (Jayasena et al., 2016), our results also support its role in the nucleus
influencing gene expression. In order to unravel whether SIRT2 inhibition had a direct
effect on the increase if GluN2B and GluN2A subunits, a chromatin
immunoprecipitation (ChIP) was performed. In this regard, preliminary experiments
obtained with the antibody against AcH4 suggest that the increased levels of mRNA
found in these proteins is independent of AcH4. Thus, we acknowledge that further

Discussion
109
studies should elucidate the mechanisms underlying the increase in the expression of
these NMDA receptor subunits mediated by SIRT2 inhibition.
Regarding the AMPA receptor, it has been published that stabilizing GluA1 surface
expression, in the hippocampus of aged rats, attenuated age-related impairments of
LTP (Luo et al., 2015). Noteworthy, no significant differences were observed in Glua1
mRNA levels, which suggest that SIRT2 is not affecting the synthesis but its
degradation. Noteworthy, SIRT2 acts as GluA1 deacetylase regulating AMPA receptor
proteostasis (Wang et al., 2017). Hence, SIRT2 inhibition by 33i could increase GluA1
acetylation reducing AMPA degradation, confirming its potential regulatory role in
synaptic plasticity and brain function.
Neuroinflammation
The importance of neuroinflammatory processes in AD has been emphasized
during the past decade proposing astrogliosis as a promising therapeutic target
(Baune, 2015). Taking into account the existing controversy regarding the role of
SIRT2 on inflammation, we next examined whether 33i had an effect on different
neuroinflammatory markers.
Astrocyte activation is followed by an increase in the expression of GFAP, a major
intermediate filament protein specific to astrocytes (Furman et al., 2012). In accordance
with a previous report (Wu et al., 2005; Orejana et al., 2015; Moreno et al., 2017), we
observed in the hippocampus of 7-month-old SAMP8 mice increased GFAP levels
compared to age-matched SAMR1 mice. Noteworthy, this effect was significantly
reversed by early 33i administration. Our data supports a previous study that showed
the efficacy of SIRT2 inhibition to prevent the activation of astrocytes in rat primary
cultures that had been previously exposed to Aβ42 (Scuderi et al., 2014).
Due to the on-going discussion and controversy surrounding the role of SIRT2 in
neuroinflammation, it was imperative to assess the effect of SIRT2 inhibition on other
well-established markers of neuroinflammation: Il-1, Il-6 and Tnf-α (Tanaka et al., 2013;
Liu et al., 2014; Giridharan et al., 2015).
Similarly to other studies that agree that SIRT2 inhibition has anti-inflammatory
effects (Lee et al., 2014; Chen et al., 2015; Wang et al., 2016), mRNA levels of Il-1, Il-6
and Tnf-α of 7 month-old SAMP8 mice treated with 33i for 8 weeks were significantly
reduced compared to those observed in vehicle SAMP8 suggesting that, early SIRT2
inhibition is able to prevent or slow the development of neuroinflammation. However,

Discussion
110
the therapeutic treatment was not able to reverse the increased levels of
neuroinflammatory markers in 10-month-old SAMP8, suggesting the efficacy of SIRT2
inhibition in preventing neuroinflammation but not in reversing it at advanced stages of
the disease.
On the other hand, 33i significantly increased mRNA levels of Il-6 and Tnf-α in
SAMR1 mice, in agreement with other studies that suggest that SIRT2 inhibition can
lead to an increase on inflammation (Pais et al., 2013; Yuan et al., 2016).
The apparently contradictory effects of the 33i, could be explained by the fact that
multiple studies have suggested that SIRT2 could play complex and contrasting roles,
depending on the conditions, in cell death (Li et al., 2011; He et al., 2012), oxidative
stress (Lynn et al., 2008; Pais et al., 2013; Lee et al., 2014) and neuroinflammation
(Pais et al., 2013; Scuderi et al., 2014; Chen et al., 2015; Yuan et al., 2016).
The next question that these results aroused us was the lack of correlation
between neuroinflammation and cognitive status in 33i-treated SAMR1 group. In this
sense, since no increase in GFAP or Il-1 protein levels was found in the brain of these
animals, we hypothesize that, despite the increase in mRNA, there might be no
differences in the final secreted protein, since a “healthy” control brain would be able to
counteract the increase in proinflammatory cytokines. In addition, other
neuropathological hallmarks are observed in 7 month-old SAMP8 mice which are not
present in aged-matched SAMR1 brains (oxidative stress, Tau hyperphosphorilation)
which undoubtedly are contributing to the neurological decline.
It is also important to point out the limitations of the model used for the present
study. Because SAMP8 and SAMR1 strains were bred independently based on
phenotypical traits, after consecutive breeding through many generations, there is
always a question as to whether the SAMR1 is the appropriate control for the SAMP8.
In addition, several pathologic phenotypes have been described in the SAMR1 strain
like immunoblastic lymphoma or histiocytic sarcoma (Takeda et al., 1997) which could
be altering the immune response. Therefore, it is necessary to further investigate the
mechanisms underlying the complex roles of SIRT2 in neuroinflammation in different
animal models.
In conclusion, 33i treatment was effective, through the modulation of glutamate
receptors and neuroinflammation, when SIRT2 was inhibited in animals that presented
an early pathology. From this perspective, this pharmacological strategy could be an
ideal novel target to prevent age-related cognitive decline and neurodegeneration.

Discussion
111
Unfortunately, an early treatment requires an early diagnosis that is not always
possible. This limited time-window of effective treatment highlights the importance of
further investigate whether a longer treatment, a higher dose, or, even, a combined
therapeutic strategy at advanced stages of the disease would be able to reverse the
neuroinflammation, amyloid pathology and cognitive impairment already established.
3. APP/PS1 model
It should be noted that, although the SAMP8 mice present Aβ-immunoreactive
granules that may be pathologically related to the to the Aβ deposits observed in
humans (Takemura et al., 1993; del Valle et al., 2010, 2011; Manich et al., 2011), they
do not present APP mutations. As a result, the SAMP8 model does not show a severe
amyloid pathology. Consequently, it might not be the best animal model to investigate
the effects of SIRT2 inhibition on APP processing. Hence, in parallel, we carried out a
preliminary study where we administrated 33i to 8-month-old APP/PS1 mice, a
transgenic AD mouse model (Jankowsky et al., 2001) to elucidate whether the 33i had
any effect on the amyloid plaques. The APP/PS1 mouse presents small amounts of Aβ
depositions in hippocampus at 6 months (Végh et al., 2014) and senile plaques in
hippocampus at 8 months (Krauthausen et al., 2015). Most importantly, APP/PS1 mice
show apparent learning and memory dysfunction at 6-8 months (D’Amelio et al., 2011;
Végh et al., 2014). For this reason, it is a more adequate mouse model to investigate
the role of SIRT2 and its inhibition on the amyloid pathology.
Regardless of the lack of effect the compound 33i had on depressive and anxiety-
like behaviour on APP/PS1, the SIRT2 inhibitor was able to significantly increase the
discrimination index in the novel object test (NORT), resulting in a memory
improvement. Moreover, it significantly decreased the total number of amyloid plaques,
in accordance with Biella and co-workers (2016) who described in another AD
transgenic mouse model (3xTg-AD) a reduction of soluble APPβ and an improvement
of cognitive performance in the NORT caused by SIRT2 inhibition (Biella et al., 2016).
Further experiments should be performed to clarify the mechanisms underlying this
effect.
In summary, given its efficacy and safety, the 33i compound seams a good
pharmacological strategy to treat AD (Fig. 52). Firstly, 33i has proved to be effective
since it has improved the cognitive deficit in two different AD mouse models, increased
different glutamate subunit receptors, prevented the neuroinflammation when
administered at early stages of the disease in the SAMP8 model and reduced the

Discussion
112
amyloid pathology in the APP/PS1 model. In addition, the lack of mutagenicity or
genotoxicity observed in vitro after 33i treatment makes this molecule a promising safe
epigenetic pharmacological drug.
Figure 52. Beneficial effects of SIRT2 inhibition in different mechanisms which are relevant in AD. The present study and other authors have proposed that SIRT2 inhibition: (A) Modulates APP processing and decreases amyloid plaques (Biella et al., 2016; present thesis in the APP/PS1 model), (B) prevents neuroinflammation processes (Scuderi et al., 2014; present thesis in the early treatment in the SAMP8 model), (C) increases the expression of memory-related proteins (Erburu et al., 2017; Muñoz-Cobo et al., 2018; present thesis in the SAMP8 model), (D) reduces the degradation of AMPA receptor subunits (Wang et al., 2017; present thesis in the SAMP8 model), (E) increases the stability of microtubules favouring the autophagic flux (Silva et al., 2017; Esteves et al., 2018).
SIRT2
SIRT2
SIRT2
Histone acetylation
Gene transcription
SIRT2
Acetylated α-tubulin Microtubule stabilizationAutophagic flux
Modulates APP processing
Amyloid plaques
Prevents Neuroinflammation
processes
SIRT2
Deacetylation Ubiquinitation
AMPA receptor stabilization
A
B
C
D
E

CONCLUSIONS


Conclusions
115
The results obtained in this work have led to the following conclusions:
1. In vitro results confirm the inhibitory activity of 33i towards SIRT2 as it
increases the acetylation of the nuclear histone 4 and the cytoplasmic α-tubulin,
two well-known SIRT2 cellular substrates. Moreover, it lacks of inhibitory
activity towards other histone deacetylases that have been previously related to
Alzheimer’s disease.
2. The results obtained from the preliminary in vitro toxicological study of the
33i compound discard that the 33i or any of its metabolites are mutagenic.
Moreover, the compound 33i does not show genotoxicity at the concentrations
used in SH-SY5Y cell line.
3. The inhibitory activity of 33i towards SIRT2 was confirmed in vivo by the
increase of the SIRT2 cellular substrates acH4 and Abca1 in the hippocampus.
4. The early treatment with 33i improves the memory and learning deficits
shown by 7-month-old SAMP8 in the Morris Water Maze. This cognitive
improvement was evidenced in both acquisition and retention phase.
5. The mechanisms underlying the beneficial effects of early 33i-treatment in
the SAMP8 model could be due to an increase of the glutamate subunit
receptors and decrease in neuroinflammation.
6. The therapeutic treatment with 33i does not reverse the memory and
learning deficits nor the neuroinflammation, the Tau or amyloid pathology
shown by 10-month-old SAMP8.
7. 33i was able to ameliorate the cognitive decline of the familial Alzheimer’s
disease mouse model, the APP/PS1, in the novel object test. The memory
amelioration could be due to a decrease of amyloid plaques.
In summary, given its efficacy and safety, the 33i compound seams a good
pharmacological strategy for AD. Its proven efficacy in two AD mouse models, summed
up to its lack of in vitro mutagenicity or genotoxicity makes this molecule a promising
safe epigenetic pharmacological drug.


REFERENCES


References
119
Ahuja, N., Schwer, B., Carobbio, S., Waltregny, D., North, B.J., Castronovo, V., et al.
(2007). Regulation of Insulin Secretion by SIRT4, a Mitochondrial ADP-
ribosyltransferase. J. Biol. Chem. 282: 33583–33592.
Akbarian, S., Beeri, M.S., and Haroutunian, V. (2013). Epigenetic determinants of
healthy and diseased brain aging and cognition. JAMA Neurol. 70: 711–8.
Alberini, C.M., and Kandel, E.R. (2014). The regulation of transcription in memory
consolidation. Cold Spring Harb. Perspect. Biol. 7: a021741.
Alvarez-García, O., Vega-Naredo, I., Sierra, V., Caballero, B., Tomás-Zapico, C.,
Camins, A., et al. (2006). Elevated oxidative stress in the brain of senescence-
accelerated mice at 5 months of age. Biogerontology 7: 43–52.
Alzheimer’s Association (2015). 2015 Alzheimer’s disease facts and figures. Alzheimers
and Dement. 11: 332–84.
Bahari-Javan, S., Maddalena, A., Kerimoglu, C., Wittnam, J., Held, T., Bähr, M., et al.
(2012). HDAC1 regulates fear extinction in mice. J. Neurosci. 32: 5062–73.
Bannister, A.J., and Kouzarides, T. (2011). Regulation of chromatin by histone
modifications. Cell Res. 21: 381–395.
Baune, B.T. (2015). Inflammation and neurodegenerative disorders. Curr. Opin.
Psychiatry 28: 1.
Bayram, B., Ozcelik, B., Grimm, S., Roeder, T., Schrader, C., Ernst, I.M.A., et al. (2012).
A diet rich in olive oil phenolics reduces oxidative stress in the heart of SAMP8 mice by
induction of Nrf2-dependent gene expression. Rejuvenation Res. 15: 71–81.
Berger, S.L. (2007). The complex language of chromatin regulation during transcription.
Nature 447: 407–412.
Berger, S.L., Kouzarides, T., Shiekhattar, R., and Shilatifard, A. (2009). An operational
definition of epigenetics. Genes Dev. 23: 781–783.
Bero, A.W., Bauer, A.Q., Stewart, F.R., White, B.R., Cirrito, J.R., Raichle, M.E., et al.
(2012). Bidirectional Relationship between Functional Connectivity and Amyloid-
Deposition in Mouse Brain. J. Neurosci. 32: 4334–4340.

References
120
Bertram, L., Lill, C.M., and Tanzi, R.E. (2010). The genetics of Alzheimer disease: back
to the future. Neuron 68: 270–81.
Bertram, L., McQueen, M.B., Mullin, K., Blacker, D., and Tanzi, R.E. (2007). Systematic
meta-analyses of Alzheimer disease genetic association studies: the AlzGene
database. Nat. Genet. 39: 17–23.
Biedler, J.L., Helson, L., and Spengler, B.A. (1973). Morphology and growth,
tumorigenicity, and cytogenetics of human neuroblastoma cells in continuous culture.
Cancer Res. 33: 2643–52.
Biedler, J.L., Roffler-Tarlov, S., Schachner, M., and Freedman, L.S. (1978). Multiple
neurotransmitter synthesis by human neuroblastoma cell lines and clones. Cancer Res.
38: 3751–7.
Biella, G., Fusco, F., Nardo, E., Bernocchi, O., Colombo, A., Lichtenthaler, S.F., et al.
(2016). Sirtuin 2 Inhibition Improves Cognitive Performance and Acts on Amyloid-β
Protein Precursor Processing in Two Alzheimer’s Disease Mouse Models. Journal of
Alzheimers Disease. 53: 1193–207.
Bimonte-Nelson, H.A., Hunter, C.L., Nelson, M.E., and Granholm, A.-C.E. (2003). Frontal
cortex BDNF levels correlate with working memory in an animal model of Down
syndrome. Behav. Brain Res. 139: 47–57.
Blander, G., and Guarente, L. (2004). The Sir2 Family of Protein Deacetylases. Annu.
Rev. Biochem. 73: 417–435.
Block, M.L., and Hong, J.-S. (2005). Microglia and inflammation-mediated
neurodegeneration: multiple triggers with a common mechanism. Prog. Neurobiol. 76:
77–98.
Bose, P., Dai, Y., and Grant, S. (2014). Histone deacetylase inhibitor (HDACI)
mechanisms of action: Emerging insights. Pharmacol. Ther. 143: 323–336.
Braidy, N., Poljak, A., Grant, R., Jayasena, T., Mansour, H., Chan-Ling, T., et al. (2015).
Differential expression of sirtuins in the aging rat brain. Front. Cell. Neurosci. 9: 167.
Brim, B.L., Haskell, R., Awedikian, R., Ellinwood, N.M., Jin, L., Kumar, A., et al. (2013).
Memory in aged mice is rescued by enhanced expression of the GluN2B subunit of the
NMDA receptor. Behav. Brain Res. 238: 211–26.

References
121
Busciglio, J., Pelsman, A., Wong, C., Pigino, G., Yuan, M., Mori, H., et al. (2002). Altered
metabolism of the amyloid beta precursor protein is associated with mitochondrial
dysfunction in Down’s syndrome. Neuron 33: 677–88.
Cacabelos, R. (2017). Parkinson’s Disease: From Pathogenesis to Pharmacogenomics.
Int. J. Mol. Sci. 18 (3): 551-579.
Cacabelos, R., and Torrellas, C. (2014). Epigenetic drug discovery for Alzheimer’s
disease. Expert Opin. Drug Discov. 9: 1059–1086.
Cacabelos, R., Torrellas, C., Teijido, O., and Carril, J.C. (2016). Pharmacogenetic
considerations in the treatment of Alzheimer’s disease. Pharmacogenomics 17: 1041–
1074.
Campos, E.I., and Reinberg, D. (2009). Histones: Annotating Chromatin. Annu. Rev.
Genet. 43: 559–599.
Canudas, A.M., Gutierrez-Cuesta, J., Rodríguez, M.I., Acuña-Castroviejo, D., Sureda,
F.X., Camins, A., et al. (2005). Hyperphosphorylation of microtubule-associated protein
tau in senescence-accelerated mouse (SAM). Mech. Ageing Dev. 126: 1300–1304.
Caricasole, A., Copani, A., Caruso, A., Caraci, F., Iacovelli, L., Sortino, M.A., et al.
(2003). The Wnt pathway, cell-cycle activation and beta-amyloid: novel therapeutic
strategies in Alzheimer’s disease? Trends Pharmacol. Sci. 24: 233–8.
Carretero, M., Escames, G., López, L.C., Venegas, C., Dayoub, J.C., García, L., et al.
(2009). Long-term melatonin administration protects brain mitochondria from aging. J.
Pineal Res. 47: 192–200.
Chen, H., Wu, D., Ding, X., and Ying, W. (2015). SIRT2 is required for
lipopolysaccharide-induced activation of BV2 microglia. Neuroreport 26: 88–93.
Chen, W., Wu, W., Li, X., Zhao, L., and Chen, W. (2011). HDAC6 and SIRT2 promote
bladder cancer cell migration and invasion by targeting cortactin. Oncol. Rep. 27: 819–
24.
Chen, Y., Wei, G., Nie, H., Lin, Y., Tian, H., Liu, Y., et al. (2014). β-Asarone prevents
autophagy and synaptic loss by reducing ROCK expression in asenescence-
accelerated prone 8 mice. Brain Res. 1552: 41–54.

References
122
Cheon, M.G., Kim, W., Choi, M., and Kim, J.-E. (2015). AK-1, a specific SIRT2 inhibitor,
induces cell cycle arrest by downregulating Snail in HCT116 human colon carcinoma
cells. Cancer Lett. 356: 637–645.
Chopra, V., Quinti, L., Kim, J., Vollor, L., Narayanan, K.L., Edgerly, C., et al. (2012). The
Sirtuin 2 Inhibitor AK-7 Is Neuroprotective in Huntington’s Disease Mouse Models. Cell
Rep. 2: 1492–1497.
Choudhry, F., Howlett, D.R., Richardson, J.C., Francis, P.T., and Williams, R.J. (2012).
Pro-oxidant diet enhances β/γ secretase-mediated APP processing in APP/PS1
transgenic mice. Neurobiol. Aging 33: 960–968.
Cosín-Tomás, M., Alvarez-López, M.J., Sanchez-Roige, S., Lalanza, J.F., Bayod, S.,
Sanfeliu, C., et al. (2014). Epigenetic alterations in hippocampus of SAMP8 senescent
mice and modulation by voluntary physical exercise. Front. Aging Neurosci. 6: 51.
Craft, S. (2006). Insulin resistance syndrome and Alzheimer disease: pathophysiologic
mechanisms and therapeutic implications. Alzheimer Dis. Assoc. Disord. 20: 298–301.
Craig-Schapiro, R., Fagan, A.M., and Holtzman, D.M. (2009). Biomarkers of Alzheimer’s
disease. Neurobiol. Dis. 35: 128–40.
Crean, S., Ward, A., Mercaldi, C.J., Collins, J.M., Cook, M.N., Baker, N.L., et al. (2011).
Apolipoprotein E ε4 Prevalence in Alzheimer’s Disease Patients Varies across Global
Populations: A Systematic Literature Review and Meta-Analysis. Dement. Geriatr.
Cogn. Disord. 31: 20–30.
Cristòfol, R., Porquet, D., Corpas, R., Coto-Montes, A., Serret, J., Camins, A., et al.
(2012). Neurons from senescence-accelerated SAMP8 mice are protected against
frailty by the sirtuin 1 promoting agents melatonin and resveratrol. J. Pineal Res. 52:
271–81.
Cuadrado-Tejedor, M., Garcia-Barroso, C., Sánchez-Arias, J.A., Rabal, O., Pérez-
González, M., Mederos, S., et al. (2017). A First-in-Class Small-Molecule that Acts as a
Dual Inhibitor of HDAC and PDE5 and that Rescues Hippocampal Synaptic Impairment
in Alzheimer’s Disease Mice. Neuropsychopharmacology 42: 524–539.
Cuadrado-Tejedor, M., Oyarzabal, J., Lucas, M.P., Franco, R., and García-Osta, A.
(2013). Epigenetic drugs in Alzheimer’s disease. Biomol. Concepts 4: 433–45.

References
123
Cuesta, S., Kireev, R., Forman, K., García, C., Escames, G., Ariznavarreta, C., et al.
(2010). Melatonin improves inflammation processes in liver of senescence-accelerated
prone male mice (SAMP8). Exp. Gerontol. 45: 950–6.
D’Amelio, M., Cavallucci, V., Middei, S., Marchetti, C., Pacioni, S., Ferri, A., et al. (2011).
Caspase-3 triggers early synaptic dysfunction in a mouse model of Alzheimer’s
disease. Nat. Neurosci. 14: 69–76.
Di Fruscia, P., Zacharioudakis, E., Liu, C., Moniot, S., Laohasinnarong, S., Khongkow,
M., et al. (2015). The Discovery of a Highly Selective 5,6,7,8-
Tetrahydrobenzo[4,5]thieno[2,3- d ]pyrimidin-4(3 H )-one SIRT2 Inhibitor that is
Neuroprotective in an in vitro Parkinson’s Disease Model. ChemMedChem 10: 69–82.
Ding, H., Dolan, P.J., and Johnson, G.V.W. (2008). Histone deacetylase 6 interacts with
the microtubule-associated protein tau. J. Neurochem. 106: 2119–2130.
Dobarro, M., Orejana, L., Aguirre, N., and Ramírez, M.J. (2013). Propranolol restores
cognitive deficits and improves amyloid and Tau pathologies in a senescence-
accelerated mouse model. Neuropharmacology 64: 137–44.
Erburu, M., Muñoz-Cobo, I., Diaz-Perdigon, T., Mellini, P., Suzuki, T., Puerta, E., et al.
(2017). SIRT2 inhibition modulate glutamate and serotonin systems in the prefrontal
cortex and induces antidepressant-like action. Neuropharmacology 117: 195–208.
Eskandarian, H.A., Impens, F., Nahori, M.-A., Soubigou, G., Coppee, J.-Y., Cossart, P.,
et al. (2013). A Role for SIRT2-Dependent Histone H3K18 Deacetylation in Bacterial
Infection. Science 341: 12388581-11.
Esteves, A.R., Palma, A.M., Gomes, R., Santos, D., Silva, D.F., and Cardoso, S.M.
(2018). Acetylation as a major determinant to microtubule-dependent autophagy:
Relevance to Alzheimer’s and Parkinson disease pathology. Biochim. Biophys. Acta -
Mol. Basis Dis 18: 30475-7.
Filippo, M. Di, Sarchielli, P., Picconi, B., and Calabresi, P. (2008). Neuroinflammation
and synaptic plasticity: theoretical basis for a novel, immune-centred, therapeutic
approach to neurological disorders. Trends Pharmacol. Sci. 29: 402–412.
Fischer, A., Sananbenesi, F., Mungenast, A., and Tsai, L.-H. (2010). Targeting the
correct HDAC(s) to treat cognitive disorders. Trends Pharmacol. Sci. 31: 605–617.
References
124
Flood, J.F., Farr, S.A., Kaiser, F.E., and Morley, J.E. (1995). Age-related impairment in
learning but not memory in SAMP8 female mice. Pharmacol. Biochem. Behav. 50:
661–4.
Fonseca, R. (2016). The aging memory: Modulating epigenetic modifications to improve
cognitive function. Neurobiol. Learn. Mem. 133: 182–184.
Fontán-Lozano, Á., Romero-Granados, R., Troncoso, J., Múnera, A., Delgado-García,
J.M., and Carrión, Á.M. (2008). Histone deacetylase inhibitors improve learning
consolidation in young and in KA-induced-neurodegeneration and SAMP-8-mutant
mice. Mol. Cell. Neurosci. 39: 193–201.
Fourcade, S., Morató, L., Parameswaran, J., Ruiz, M., Ruiz-Cortés, T., Jové, M., et al.
(2017). Loss of SIRT2 leads to axonal degeneration and locomotor disability
associated with redox and energy imbalance. Aging Cell 16: 1404–1413.
Frey, U., and Morris, R.G.M. (1997). Synaptic tagging and long-term potentiation. Nature
385: 533–536.
Furman, J.L., Sama, D.M., Gant, J.C., Beckett, T.L., Murphy, M.P., Bachstetter, A.D., et
al. (2012). Targeting astrocytes ameliorates neurologic changes in a mouse model of
Alzheimer’s disease. J. Neurosci. 32: 16129–40.
Fuster-Matanzo, A., Llorens-Martín, M., Hernández, F., and Avila, J. (2013). Role of
neuroinflammation in adult neurogenesis and Alzheimer disease: therapeutic
approaches. Mediators Inflamm. 2013: 260925.
Gal, J., Bang, Y., and Choi, H.J. (2012). SIRT2 interferes with autophagy-mediated
degradation of protein aggregates in neuronal cells under proteasome inhibition.
Neurochem. Int. 61: 992–1000.
Gan, L., and Mucke, L. (2008). Paths of Convergence: Sirtuins in Aging and
Neurodegeneration. Neuron 58: 10–14.
Giridharan, V.V., Thandavarayan, R.A., and Konishi, T. (2015). Antioxidant Formulae,
Shengmai San, and LingGuiZhuGanTang, Prevent MPTP Induced Brain Dysfunction
and Oxidative Damage in Mice. Evid. Based. Complement. Alternat. Med. 2015:
584018.

References
125
Gocel, J., and Larson, J. (2013). Evidence for loss of synaptic AMPA receptors in
anterior piriform cortex of aged mice. Front. Aging Neurosci. 5: 39.
Gomes, P., Fleming Outeiro, T., and Cavadas, C. (2015). Emerging Role of Sirtuin 2 in
the Regulation of Mammalian Metabolism. Trends Pharmacol. Sci. 36: 756–768.
Gómez-Pinilla, F., Huie, J.R., Ying, Z., Ferguson, A.R., Crown, E.D., Baumbauer, K.M.,
et al. (2007). BDNF and learning: Evidence that instrumental training promotes learning
within the spinal cord by up-regulating BDNF expression. Neuroscience 148: 893–906.
Gomez-Vargas, P., and Vig, B.K. (2002). Differential induction of numerical chromosome
changes by sodium butyrate in two transformed cell lines. Cancer Genet. Cytogenet.
138: 56–63.
Gong, B., Vitolo, O. V, Trinchese, F., Liu, S., Shelanski, M., and Arancio, O. (2004).
Persistent improvement in synaptic and cognitive functions in an Alzheimer mouse
model after rolipram treatment. J. Clin. Invest. 114: 1624–34.
Gong, Y., Liu, L., Xie, B., Liao, Y., Yang, E., and Sun, Z. (2008). Ameliorative effects of
lotus seedpod proanthocyanidins on cognitive deficits and oxidative damage in
senescence-accelerated mice. Behav. Brain Res. 194: 100–7.
Govindarajan, N., Rao, P., Burkhardt, S., Sananbenesi, F., Schlüter, O.M., Bradke, F., et
al. (2013). Reducing HDAC6 ameliorates cognitive deficits in a mouse model for
Alzheimer’s disease. EMBO Mol. Med. 5: 52–63.
Gräff, J., Rei, D., Guan, J.-S., Wang, W.-Y., Seo, J., Hennig, K.M., et al. (2012). An
epigenetic blockade of cognitive functions in the neurodegenerating brain. Nature 483:
222–6.
Gräff, J., and Tsai, L.-H. (2013). The Potential of HDAC Inhibitors as Cognitive
Enhancers. Annu. Rev. Pharmacol. Toxicol. 53: 311–330.
Grozinger, C.M., Chao, E.D., Blackwell, H.E., Moazed, D., and Schreiber, S.L. (2001).
Identification of a class of small molecule inhibitors of the sirtuin family of NAD-
dependent deacetylases by phenotypic screening. J. Biol. Chem. 276: 38837–43.
Guan, J.-S., Haggarty, S.J., Giacometti, E., Dannenberg, J.-H., Joseph, N., Gao, J., et al.
(2009). HDAC2 negatively regulates memory formation and synaptic plasticity. Nature
459: 55–60.

References
126
Guarente, L. (2000). Sir2 links chromatin silencing, metabolism, and aging. Genes Dev.
14: 1021–6.
Haass, C., and Selkoe, D.J. (2007). Soluble protein oligomers in neurodegeneration:
lessons from the Alzheimer’s amyloid beta-peptide. Nat. Rev. Mol. Cell Biol. 8: 101–12.
Hake, S.B., and Allis, C.D. (2006). Histone H3 variants and their potential role in indexing
mammalian genomes: the "H3 barcode hypothesis"; Proc. Natl. Acad. Sci. 103: 6428–
6435.
Hamilton, A., and Holscher, C. (2012). The effect of ageing on neurogenesis and
oxidative stress in the APPswe/PS1deltaE9 mouse model of Alzheimer’s disease.
Brain Res. 1449: 83–93.
Harrison, I.F., and Dexter, D.T. (2013). Epigenetic targeting of histone deacetylase:
Therapeutic potential in Parkinson’s disease? Pharmacol. Ther. 140: 34–52.
He, X., Nie, H., Hong, Y., Sheng, C., Xia, W., and Ying, W. (2012). SIRT2 activity is
required for the survival of C6 glioma cells. Biochem. Biophys. Res. Commun. 417:
468–72.
Hebert, L.E., Scherr, P.A., Bienias, J.L., Bennett, D.A., and Evans, D.A. (2003).
Alzheimer Disease in the US Population. Arch. Neurol. 60: 1119.
Heltweg, B., Gatbonton, T., Schuler, A.D., Posakony, J., Li, H., Goehle, S., et al. (2006).
Antitumor Activity of a Small-Molecule Inhibitor of Human Silent Information Regulator
2 Enzymes. Cancer Res. 66: 4368–4377.
Hisahara, S., Chiba, S., Matsumoto, H., Tanno, M., Yagi, H., Shimohama, S., et al.
(2008). Histone deacetylase SIRT1 modulates neuronal differentiation by its nuclear
translocation. Proc. Natl. Acad. Sci. U. S. A. 105: 15599–604.
Hoffmann, G., Breitenbücher, F., Schuler, M., and Ehrenhofer-Murray, A.E. (2014). A
novel sirtuin 2 (SIRT2) inhibitor with p53-dependent pro-apoptotic activity in non-small
cell lung cancer. J. Biol. Chem. 289: 5208–16.
Huang, S., Song, C., Wang, X., Zhang, G., Wang, Y., Jiang, X., et al. (2017). Discovery
of New SIRT2 Inhibitors by Utilizing a Consensus Docking/Scoring Strategy and
Structure–Activity Relationship Analysis. J. Chem. Inf. Model. 57: 669–679.

References
127
Huntley, J.D., and Howard, R.J. (2010). Working memory in early Alzheimer’s disease: a
neuropsychological review. Int. J. Geriatr. Psychiatry 25: 121–132.
Ikonomovic, M.D., Nocera, R., Mizukami, K., and Armstrong, D.M. (2000). Age-Related
Loss of the AMPA Receptor Subunits GluR2/3 in the Human Nucleus Basalis of
Meynert. Exp. Neurol. 166: 363–375.
Inoue, T., Nakayama, Y., Li, Y., Matsumori, H., Takahashi, H., Kojima, H., et al. (2014).
SIRT2 knockdown increases basal autophagy and prevents postslippage death by
abnormally prolonging the mitotic arrest that is induced by microtubule inhibitors. FEBS
J. 281: 2623–37.
Jakovcevski, M., and Akbarian, S. (2012). Epigenetic mechanisms in neurological
disease. Nat. Med. 18: 1194–1204.
Jankowsky, J.L., Slunt, H.H., Gonzales, V., Jenkins, N.A., Copeland, N.G., and Borchelt,
D.R. (2004). APP processing and amyloid deposition in mice haplo-insufficient for
presenilin 1. Neurobiol. Aging 25: 885–892.
Jankowsky, J.L., Slunt, H.H., Ratovitski, T., Jenkins, N.A., Copeland, N.G., and Borchelt,
D.R. (2001). Co-expression of multiple transgenes in mouse CNS: a comparison of
strategies. Biomol. Eng. 17: 157–65.
Jardanhazi-Kurutz, D., Kummer, M.P., Terwel, D., Vogel, K., Thiele, A., and Heneka,
M.T. (2011). Distinct adrenergic system changes and neuroinflammation in response to
induced locus ceruleus degeneration in APP/PS1 transgenic mice. Neuroscience 176:
396–407.
Jayasena, T., Poljak, A., Braidy, N., Zhong, L., Rowlands, B., Muenchhoff, J., et al.
(2016). Application of Targeted Mass Spectrometry for the Quantification of Sirtuins in
the Central Nervous System. Sci. Rep. 6: 35391.
Jęśko, H., Wencel, P., Strosznajder, R.P., and Strosznajder, J.B. (2017). Sirtuins and
Their Roles in Brain Aging and Neurodegenerative Disorders. Neurochem. Res. 42:
876–890.
Ji, S., Doucette, J.R., and Nazarali, A.J. (2011). Sirt2 is a novel in vivo downstream
target of Nkx2.2 and enhances oligodendroglial cell differentiation. J. Mol. Cell Biol. 3:
351–359.

References
128
Jin, Y.-H., Kim, Y.-J., Kim, D.-W., Baek, K.-H., Kang, B.Y., Yeo, C.-Y., et al. (2008). Sirt2
interacts with 14-3-3 beta/gamma and down-regulates the activity of p53. Biochem.
Biophys. Res. Commun. 368: 690–5.
Jing, H., Hu, J., He, B., Negrón Abril, Y.L., Stupinski, J., Weiser, K., et al. (2016). A
SIRT2-Selective Inhibitor Promotes c-Myc Oncoprotein Degradation and Exhibits
Broad Anticancer Activity. Cancer Cell 29: 297–310.
Jing, H., and Lin, H. (2015). Sirtuins in Epigenetic Regulation. Chem. Rev. 115: 2350–
2375.
Johnson, D., and Walmsley, R. (2013). Histone-deacetylase inhibitors produce positive
results in the GADD45a-GFP GreenScreen HC assay. Mutat. Res. 751: 96–100.
Joshi, P., Greco, T.M., Guise, A.J., Luo, Y., Yu, F., Nesvizhskii, A.I., et al. (2013). The
functional interactome landscape of the human histone deacetylase family. Mol. Syst.
Biol. 9: 672.
Kabeya, Y., Mizushima, N., Ueno, T., Yamamoto, A., Kirisako, T., Noda, T., et al. (2000).
LC3, a mammalian homologue of yeast Apg8p, is localized in autophagosome
membranes after processing. EMBO J. 19: 5720–5728.
Kawamata, T., Akiguchi, I., Yagi, H., Irino, M., Sugiyama, H., Akiyama, H., et al.
Neuropathological studies on strains of senescence-accelerated mice (SAM) with age-
related deficits in learning and memory. Exp. Gerontol. 32: 161–9.
Kayed, R., Head, E., Thompson, J.L., McIntire, T.M., Milton, S.C., Cotman, C.W., et al.
(2003). Common Structure of Soluble Amyloid Oligomers Implies Common Mechanism
of Pathogenesis. Science 300: 486–489.
Kennedy, B.K., Austriaco, N.R., Zhang, J., and Guarente, L. (1995). Mutation in the
silencing gene SIR4 can delay aging in S. cerevisiae. Cell 80: 485–96.
Kilgore, M., Miller, C.A., Fass, D.M., Hennig, K.M., Haggarty, S.J., Sweatt, J.D., et al.
(2010). Inhibitors of class 1 histone deacetylases reverse contextual memory deficits in
a mouse model of Alzheimer’s disease. Neuropsychopharmacology 35: 870–80.
Kim, D., Nguyen, M.D., Dobbin, M.M., Fischer, A., Sananbenesi, F., Rodgers, J.T., et al.
(2007a). SIRT1 deacetylase protects against neurodegeneration in models for
Alzheimer’s disease and amyotrophic lateral sclerosis. EMBO J. 26: 3169–79.
References
129
Kim, E.-J., Kho, J.-H., Kang, M.-R., and Um, S.-J. (2007b). Active regulator of SIRT1
cooperates with SIRT1 and facilitates suppression of p53 activity. Mol. Cell 28: 277–90.
Kim, H.-S., Vassilopoulos, A., Wang, R.-H., Lahusen, T., Xiao, Z., Xu, X., et al. (2011).
SIRT2 maintains genome integrity and suppresses tumorigenesis through regulating
APC/C activity. Cancer Cell 20: 487–99.
Kim, P.M., Aizawa, H., Kim, P.S., Huang, A.S., Wickramasinghe, S.R., Kashani, A.H., et
al. (2005). Serine racemase: Activation by glutamate neurotransmission via glutamate
receptor interacting protein and mediation of neuronal migration. Proc. Natl. Acad. Sci.
102: 2105–2110.
Kim, S.H., Ahn, S., Han, J.-W., Lee, H.-W., Lee, H.Y., Lee, Y.-W., et al. (2004). Apicidin
is a histone deacetylase inhibitor with anti-invasive and anti-angiogenic potentials.
Biochem. Biophys. Res. Commun. 315: 964–970.
Klein, W.L., Krafft, G.A., and Finch, C.E. (2001). Targeting small Abeta oligomers: the
solution to an Alzheimer’s disease conundrum? Trends Neurosci. 24: 219–24.
Kornberg, R.D. (1974). Chromatin structure: a repeating unit of histones and DNA.
Science 184: 868–71.
Krauthausen, M., Kummer, M.P., Zimmermann, J., Reyes-Irisarri, E., Terwel, D., Bulic,
B., et al. (2015). CXCR3 promotes plaque formation and behavioral deficits in an
Alzheimer’s disease model. J. Clin. Invest. 125: 365–78.
Krey, L., Lühder, F., Kusch, K., Czech-Zechmeister, B., Könnecke, B., Fleming Outeiro,
T., et al. (2015). Knockout of silent information regulator 2 (SIRT2) preserves
neurological function after experimental stroke in mice. J. Cereb. Blood Flow Metab.
35: 2080–8.
Krishna, K., Behnisch, T., and Sajikumar, S. (2016). Inhibition of Histone Deacetylase 3
Restores Amyloid-β Oligomer-Induced Plasticity Deficit in Hippocampal CA1 Pyramidal
Neurons. J. Alzheimer’s Dis. 51: 783–791.
Krishnan, J., Danzer, C., Simka, T., Ukropec, J., Walter, K.M., Kumpf, S., et al. (2012).
Dietary obesity-associated Hif1 activation in adipocytes restricts fatty acid oxidation
and energy expenditure via suppression of the Sirt2-NAD+ system. Genes Dev. 26:
259–270.

References
130
Kurdistani, S.K., and Grunstein, M. (2003). Histone acetylation and deacetylation in
yeast. Nat. Rev. Mol. Cell Biol. 4: 276–284.
Kurt, M.., Davies, D.., Kidd, M., Duff, K., and Howlett, D.. (2003). Hyperphosphorylated
tau and paired helical filament-like structures in the brains of mice carrying mutant
amyloid precursor protein and mutant presenilin-1 transgenes. Neurobiol. Dis. 14: 89–
97.
Kurt, M.A., Davies, D.C., Kidd, M., Duff, K., Rolph, S.C., Jennings, K.H., et al. (2001).
Neurodegenerative Changes Associated with β-Amyloid Deposition in the Brains of
Mice Carrying Mutant Amyloid Precursor Protein and Mutant Presenilin-1 Transgenes.
Exp. Neurol. 171: 59–71.
Lagadec, S., Rotureau, L., Hémar, A., Macrez, N., Delcasso, S., Jeantet, Y., et al.
(2012). Early temporal short-term memory deficits in double transgenic APP/PS1 mice.
Neurobiol. Aging 33: 203.e1–11.
Lazo-Gómez, R., Ramírez-Jarquín, U.N., Tovar-y-Romo, L.B., and Tapia, R. (2013).
Histone deacetylases and their role in motor neuron degeneration. Front. Cell.
Neurosci. 7: 243.
Lee, A.S., Jung, Y.J., Kim, D., Nguyen-Thanh, T., Kang, K.P., Lee, S., et al. (2014).
SIRT2 ameliorates lipopolysaccharide-induced inflammation in macrophages.
Biochem. Biophys. Res. Commun. 450: 1363–9.
Lee, D.Y., Hayes, J.J., Pruss, D., and Wolffe, A.P. (1993). A positive role for histone
acetylation in transcription factor access to nucleosomal DNA. Cell 72: 73–84.
Li, W., Zhang, B., Tang, J., Cao, Q., Wu, Y., Wu, C., et al. (2007a). Sirtuin 2, a
mammalian homolog of yeast silent information regulator-2 longevity regulator, is an
oligodendroglial protein that decelerates cell differentiation through deacetylating
alpha-tubulin. J. Neurosci. 27: 2606–16.
Li, Y., Matsumori, H., Nakayama, Y., Osaki, M., Kojima, H., Kurimasa, A., et al. (2011).
SIRT2 down-regulation in HeLa can induce p53 accumulation via p38 MAPK activation-
dependent p300 decrease, eventually leading to apoptosis. Genes Cells 16: 34–45.
Li, Y., Yokota, T., Gama, V., Yoshida, T., Gomez, J.A., Ishikawa, K., et al. (2007b). Bax-
inhibiting peptide protects cells from polyglutamine toxicity caused by Ku70 acetylation.
Cell Death Differ. 14: 2058–2067.

References
131
Lin, N., Pan, X.-D., Chen, A.-Q., Zhu, Y.-G., Wu, M., Zhang, J., et al. (2014).
Tripchlorolide improves age-associated cognitive deficits by reversing hippocampal
synaptic plasticity impairment and NMDA receptor dysfunction in SAMP8 mice. Behav.
Brain Res. 258: 8–18.
Liszt, G., Ford, E., Kurtev, M., and Guarente, L. (2005). Mouse Sir2 homolog SIRT6 is a
nuclear ADP-ribosyltransferase. J. Biol. Chem. 280: 21313–20.
Liu, C., Cui, G., Zhu, M., Kang, X., and Guo, H. (2014). Neuroinflammation in
Alzheimer’s disease: chemokines produced by astrocytes and chemokine receptors.
Int. J. Clin. Exp. Pathol. 7: 8342–55.
López-Otín, C., Blasco, M.A., Partridge, L., Serrano, M., and Kroemer, G. (2013). The
Hallmarks of Aging. Cell 153: 1194–1217.
López-Ramos, J.C., Jurado-Parras, M.T., Sanfeliu, C., Acuña-Castroviejo, D., and
Delgado-García, J.M. (2012). Learning capabilities and CA1-prefrontal synaptic
plasticity in a mice model of accelerated senescence. Neurobiol. Aging 33: 627.e13-
627.e26.
Luger, K., Mäder, A.W., Richmond, R.K., Sargent, D.F., and Richmond, T.J. (1997).
Crystal structure of the nucleosome core particle at 2.8 Å resolution. Nature 389: 251–
260.
Luo, Y., Zhou, J., Li, M.-X., Wu, P.-F., Hu, Z.-L., Ni, L., et al. (2015). Reversal of aging-
related emotional memory deficits by norepinephrine via regulating the stability of
surface AMPA receptors. Aging Cell 14: 170–9.
Luthi-Carter, R., Taylor, D.M., Pallos, J., Lambert, E., Amore, A., Parker, A., et al. (2010).
SIRT2 inhibition achieves neuroprotection by decreasing sterol biosynthesis. Proc.
Natl. Acad. Sci. U. S. A. 107: 7927–32.
Lynn, E.G., McLeod, C.J., Gordon, J.P., Bao, J., and Sack, M.N. (2008). SIRT2 is a
negative regulator of anoxia-reoxygenation tolerance via regulation of 14-3-3 zeta and
BAD in H9c2 cells. FEBS Lett. 582: 2857–62.
Ma, Q., Qiang, J., Gu, P., Wang, Y., Geng, Y., and Wang, M. (2011). Age-related
autophagy alterations in the brain of senescence accelerated mouse prone 8 (SAMP8)
mice. Exp. Gerontol. 46: 533–541.
References
132
Magnusson, K.R., Nelson, S.E., and Young, A.B. (2002). Age-related changes in the
protein expression of subunits of the NMDA receptor. Brain Res. Mol. Brain Res. 99:
40–5.
Magnusson, K.R., Scanga, C., Wagner, A.E., and Dunlop, C. (2000). Changes in
anesthetic sensitivity and glutamate receptors in the aging canine brain. Journals of
Gerontology Series A: Biological Sciences and Medical Sciences. 55: B448-54.
Malm, T.M., Iivonen, H., Goldsteins, G., Keksa-Goldsteine, V., Ahtoniemi, T., Kanninen,
K., et al. (2007). Pyrrolidine dithiocarbamate activates Akt and improves spatial
learning in APP/PS1 mice without affecting beta-amyloid burden. J. Neurosci. 27:
3712–21.
Manich, G., Mercader, C., Valle, J. del, Duran-Vilaregut, J., Camins, A., Pallàs, M., et al.
(2011). Characterization of Amyloid-β Granules in the Hippocampus of SAMP8 Mice. J.
Alzheimer’s Dis. 25: 535–546.
Martín-Subero, J.I. (2011). How epigenomics brings phenotype into being. Pediatr.
Endocrinol. Rev. 9 Suppl 1: 506–10.
Mastroeni, D., Grover, A., Delvaux, E., Whiteside, C., Coleman, P.D., and Rogers, J.
(2011). Epigenetic mechanisms in Alzheimer’s disease. Neurobiol. Aging 32: 1161–
1180.
Matsushima, S., and Sadoshima, J. (2015). The role of sirtuins in cardiac disease. Am. J.
Physiol. Circ. Physiol. 309: H1375–H1389.
Mattson, M.P., and Magnus, T. (2006). Ageing and neuronal vulnerability. Nat. Rev.
Neurosci. 7: 278–294.
Maxwell, M.M., Tomkinson, E.M., Nobles, J., Wizeman, J.W., Amore, A.M., Quinti, L., et
al. (2011). The Sirtuin 2 microtubule deacetylase is an abundant neuronal protein that
accumulates in the aging CNS. Hum. Mol. Genet. 20: 3986–96.
McClean, P.L., Jalewa, J., and Hölscher, C. (2015). Prophylactic liraglutide treatment
prevents amyloid plaque deposition, chronic inflammation and memory impairment in
APP/PS1 mice. Behav. Brain Res. 293: 96–106.
McQuown, S.C., and Wood, M.A. (2011). HDAC3 and the molecular brake pad
hypothesis. Neurobiol. Learn. Mem. 96: 27–34.

References
133
Meda L and Baron P, S.G. (2001). Glial activation in Alzheimer’s disease: the role of
Abeta and its associated proteins. Neurobiol Aging. 22: 885–893.
Ménard, C., Quirion, R., Vigneault, E., Bouchard, S., Ferland, G., Mestikawy, S. El, et al.
(2015). Glutamate presynaptic vesicular transporter and postsynaptic receptor levels
correlate with spatial memory status in aging rat models. Neurobiol. Aging 36: 1471–
1482.
Michan, S., and Sinclair, D. (2007). Sirtuins in mammals: insights into their biological
function. Biochem. J. 404: 1–13.
Michishita, E., Park, J.Y., Burneskis, J.M., Barrett, J.C., and Horikawa, I. (2005).
Evolutionarily conserved and nonconserved cellular localizations and functions of
human SIRT proteins. Mol. Biol. Cell 16: 4623–35.
Milne, J.C., and Denu, J.M. (2008). The Sirtuin family: therapeutic targets to treat
diseases of aging. Curr. Opin. Chem. Biol. 12: 11–17.
Miyamoto, M. Characteristics of age-related behavioral changes in senescence-
accelerated mouse SAMP8 and SAMP10. Exp. Gerontol. 32: 139–48.
Miyamoto, M. (1994). [Experimental techniques for developing new drugs acting on
dementia (8)--Characteristics of behavioral disorders in senescence-accelerated
mouse (SAMP8): possible animal model for dementia]. Nihon Shinkei Seishin
Yakurigaku Zasshi 14: 323–35.
Miyashita, T., Oda, Y., Horiuchi, J., Yin, J.C.P., Morimoto, T., and Saitoe, M. (2012).
Mg2+ Block of Drosophila NMDA Receptors Is Required for Long-Term Memory
Formation and CREB-Dependent Gene Expression. Neuron 74: 887–898.
Moreno, L.C.G. e I., Puerta, E., Suárez-Santiago, J.E., Santos-Magalhães, N.S.,
Ramirez, M.J., and Irache, J.M. (2017). Effect of the oral administration of
nanoencapsulated quercetin on a mouse model of Alzheimer’s disease. Int. J. Pharm.
517: 50–57.
Morley, J.E., Armbrecht, H.J., Farr, S.A., and Kumar, V.B. (2012). The senescence
accelerated mouse (SAMP8) as a model for oxidative stress and Alzheimer’s disease.
Biochim. Biophys. Acta - Mol. Basis Dis. 1822: 650–656.
References
134
Morley, J.E., Kumar, V.B., Bernardo, A.E., Farr, S.A., Uezu, K., Tumosa, N., et al.
(2000). Beta-amyloid precursor polypeptide in SAMP8 mice affects learning and
memory. Peptides 21: 1761–7.
Morris, R.L., and Hollenbeck, P.J. (1995). Axonal transport of mitochondria along
microtubules and F-actin in living vertebrate neurons. J. Cell Biol. 131: 1315–26.
Mrak RE1, G.W. (2001). The role of activated astrocytes and of the neurotrophic cytokine
S100B in the pathogenesis of Alzheimer’s disease. - PubMed - NCBI. Neurobiol Aging
22: 915–922.
Muñoz-Cobo, I., Erburu, M.M., Zwergel, C., Cirilli, R., Mai, A., Valente, S., et al. (2018).
Nucleocytoplasmic export of HDAC5 and SIRT2 downregulation: two epigenetic
mechanisms by which antidepressants enhance synaptic plasticity markers.
Psychopharmacology (Berl). 235: 2831–2846.
Nakagawa, T., and Guarente, L. (2011). Sirtuins at a glance. J. Cell Sci. 124: 833–838.
North, B.J., Marshall, B.L., Borra, M.T., Denu, J.M., and Verdin, E. (2003). The Human
Sir2 Ortholog, SIRT2, Is an NAD+-Dependent Tubulin Deacetylase. Mol. Cell 11: 437–
444.
Ohta, A., Akiguchi, I., Seriu, N., Ohnishi, K., Yagi, H., Higuchi, K., et al. Deterioration in
learning and memory of fear conditioning in response to context in aged SAMP8 mice.
Neurobiol. Aging 22: 479–84.
Olaharski, A.J., Ji, Z., Woo, J.-Y., Lim, S., Hubbard, A.E., Zhang, L., et al. (2006). The
Histone Deacetylase Inhibitor Trichostatin A Has Genotoxic Effects in Human
Lymphoblasts In Vitro. Toxicol. Sci. 93: 341–347.
Oliveira, R.M. de, Vicente Miranda, H., Francelle, L., Pinho, R., Szegö, É.M., Martinho,
R., et al. (2017). The mechanism of sirtuin 2–mediated exacerbation of alpha-synuclein
toxicity in models of Parkinson disease. PLOS Biol. 15: e2000374.
Orejana, L., Barros-Miñones, L., Aguirre, N., and Puerta, E. (2013). Implication of JNK
pathway on tau pathology and cognitive decline in a senescence-accelerated mouse
model. Exp. Gerontol. 48: 565–71.
References
135
Orejana, L., Barros-Miñones, L., Jordan, J., Cedazo-Minguez, A., Tordera, R.M., Aguirre,
N., et al. (2015). Sildenafil Decreases BACE1 and Cathepsin B Levels and Reduces
APP Amyloidogenic Processing in the SAMP8 Mouse. Journals of Gerontology Series
A: Biological Sciences and Medical Sciences. 70: 675–685.
Orejana, L., Barros-Miñones, L., Jordán, J., Puerta, E., and Aguirre, N. (2012). Sildenafil
ameliorates cognitive deficits and tau pathology in a senescence-accelerated mouse
model. Neurobiol. Aging 33: 625.e11–20.
Outeiro, T.F., Kontopoulos, E., Altmann, S.M., Kufareva, I., Strathearn, K.E., Amore,
A.M., et al. (2007a). Sirtuin 2 Inhibitors Rescue -Synuclein-Mediated Toxicity in Models
of Parkinson’s Disease. Science 317: 516–519.
Outeiro, T.F., Kontopoulos, E., Altmann, S.M., Kufareva, I., Strathearn, K.E., Amore,
A.M., et al. (2007b). Sirtuin 2 inhibitors rescue alpha-synuclein-mediated toxicity in
models of Parkinson’s disease. Science 317: 516–9.
Outeiro, T.F., Marques, O., and Kazantsev, A. (2008). Therapeutic role of sirtuins in
neurodegenerative disease. Biochim. Biophys. Acta - Mol. Basis Dis. 1782: 363–369.
Pais, T.F., Szegő, É.M., Marques, O., Miller-Fleming, L., Antas, P., Guerreiro, P., et al.
(2013). The NAD-dependent deacetylase sirtuin 2 is a suppressor of microglial
activation and brain inflammation. EMBO J. 32: 2603–16.
Pallàs, M. (2012). Senescence-Accelerated Mice P8: A Tool to Study Brain Aging and
Alzheimer’s Disease in a Mouse Model. Cell Biol. 2012: 1–12.
Pallas, M., Camins, A., Smith, M.A., Perry, G., Lee, H., and Casadesus, G. (2008). From
aging to Alzheimer’s disease: unveiling "the switch" with the senescence-
accelerated mouse model (SAMP8). Journal of Alzheimer's Disease 15: 615–24.
Pandithage, R., Lilischkis, R., Harting, K., Wolf, A., Jedamzik, B., Lüscher-Firzlaff, J., et
al. (2008). The regulation of SIRT2 function by cyclin-dependent kinases affects cell
motility. J. Cell Biol. 180: 915–29.
Park, S.-H., Zhu, Y., Ozden, O., Kim, H.-S., Jiang, H., Deng, C.-X., et al. (2012). SIRT2
is a tumor suppressor that connects aging, acetylome, cell cycle signaling, and
carcinogenesis. Transl. Cancer Res. 1: 15–21.

References
136
Peck, B., Chen, C.-Y., Ho, K.-K., Fruscia, P. Di, Myatt, S.S., Coombes, R.C., et al.
(2010). SIRT Inhibitors Induce Cell Death and p53 Acetylation through Targeting Both
SIRT1 and SIRT2. Mol. Cancer Ther. 9: 844–855.
Pelegrí, C., Canudas, A.M., Valle, J. del, Casadesus, G., Smith, M.A., Camins, A., et al.
(2007). Increased permeability of blood–brain barrier on the hippocampus of a murine
model of senescence. Mech. Ageing Dev. 128: 522–528.
Perche, P.-Y., Robert-Nicoud, M., Khochbin, S., and Vourc’h, C. (2003). Différenciation
du nucléosome : le rôle des variants de l’histone H2A. Médecine/Sciences 19: 1137–
1145.
Petursdottir, A.L., Farr, S.A., Morley, J.E., Banks, W.A., and Skuladottir, G.V. (2007).
Lipid peroxidation in brain during aging in the senescence-accelerated mouse (SAM).
Neurobiol. Aging 28: 1170–1178.
Pfister, J.A., Ma, C., Morrison, B.E., and D’Mello, S.R. (2008). Opposing Effects of
Sirtuins on Neuronal Survival: SIRT1-Mediated Neuroprotection Is Independent of Its
Deacetylase Activity. PLoS One 3: e4090.
Phillips, D.M., and Johns, E.W. (1965). A fractionation of the histones of group f2a from
calf thymus. Biochem. J. 94: 127–30.
Pickford, F., Masliah, E., Britschgi, M., Lucin, K., Narasimhan, R., Jaeger, P.A., et al.
(2008). The autophagy-related protein beclin 1 shows reduced expression in early
Alzheimer disease and regulates amyloid β accumulation in mice. J. Clin. Invest. 118:
2190–9.
Polito, L., Kehoe, P.G., Davin, A., Benussi, L., Ghidoni, R., Binetti, G., et al. (2013). The
SIRT2 polymorphism rs10410544 and risk of Alzheimer’s disease in two Caucasian
case-control cohorts. Alzheimers and Dementia 9: 392–9.
Porquet, D., Casadesús, G., Bayod, S., Vicente, A., Canudas, A.M., Vilaplana, J., et al.
(2013). Dietary resveratrol prevents Alzheimer’s markers and increases life span in
SAMP8. Age (Dordr). 35: 1851–65.
Pugh, P.L., Richardson, J.C., Bate, S.T., Upton, N., and Sunter, D. (2007). Non-cognitive
behaviours in an APP/PS1 transgenic model of Alzheimer’s disease. Behav. Brain Res.
178: 18–28.

References
137
Querfurth, H.W., and LaFerla, F.M. (2010). Alzheimer’s Disease. N. Engl. J. Med. 362:
329–344.
Radde, R., Bolmont, T., Kaeser, S.A., Coomaraswamy, J., Lindau, D., Stoltze, L., et al.
(2006). Aβ42-driven cerebral amyloidosis in transgenic mice reveals early and robust
pathology. EMBO Rep. 7: 940–946.
Redon, C., Pilch, D., Rogakou, E., Sedelnikova, O., Newrock, K., and Bonner, W. (2002).
Histone H2A variants H2AX and H2AZ. Curr. Opin. Genet. Dev. 12: 162–9.
Riss, T.L., Moravec, R.A., Niles, A.L., Duellman, S., Benink, H.A., Worzella, T.J., et al.
(2004). Cell Viability Assays (Eli Lilly & Company and the National Center for
Advancing Translational Sciences).
Ruijter, A.J.M. de, Gennip, A.H. van, Caron, H.N., Kemp, S., and Kuilenburg, A.B.P. van
(2003). Histone deacetylases (HDACs): characterization of the classical HDAC family.
Biochem. J. 370: 737–49.
Salminen, A., Tapiola, T., Korhonen, P., and Suuronen, T. (1998). Neuronal apoptosis
induced by histone deacetylase inhibitors. Brain Res. Mol. Brain Res. 61: 203–6.
Sasso, G. Lo, Menzies, K.J., Mottis, A., Piersigilli, A., Perino, A., Yamamoto, H., et al.
(2014). SIRT2 deficiency modulates macrophage polarization and susceptibility to
experimental colitis. PLoS One 9: e103573.
Saunders, L.R., and Verdin, E. (2007). Sirtuins: critical regulators at the crossroads
between cancer and aging. Oncogene 26: 5489–504.
Scuderi, C., Esposito, G., Blasio, A., Valenza, M., Arietti, P., Steardo Jr, L., et al. (2011).
Palmitoylethanolamide counteracts reactive astrogliosis induced by β-amyloid peptide.
J. Cell. Mol. Med. 15: 2664–2674.
Scuderi, C., Stecca, C., Bronzuoli, M.R., Rotili, D., Valente, S., Mai, A., et al. (2014).
Sirtuin modulators control reactive gliosis in an in vitro model of Alzheimer’s disease.
Front. Pharmacol. 5: 89.
Scuderi, C., Stecca, C., Iacomino, A., and Steardo, L. (2013). Role of astrocytes in major
neurological disorders: The evidence and implications. International Union of
Biochemistry and Molecular Biology 65: 957–961.
Selkoe, D.J. (2012). Preventing Alzheimer’s disease. Science 337: 1488–92.

References
138
Sharma, M., Shivarama Shetty, M., Arumugam, T.V., and Sajikumar, S. (2015). Histone
deacetylase 3 inhibition re-establishes synaptic tagging and capture in aging through
the activation of nuclear factor kappa B. Sci. Rep. 5: 16616.
Shibata, M., Lu, T., Furuya, T., Degterev, A., Mizushima, N., Yoshimori, T., et al. (2006).
Regulation of Intracellular Accumulation of Mutant Huntingtin by Beclin 1. J. Biol.
Chem. 281: 14474–14485.
Silva, D.F., Esteves, A.R., Oliveira, C.R., and Cardoso, S.M. (2017a). Mitochondrial
Metabolism Power SIRT2-Dependent Deficient Traffic Causing Alzheimer’s-Disease
Related Pathology. Mol. Neurobiol. 54: 4021–4040.
Silva, D.F., Esteves, A.R., Oliveira, C.R., and Cardoso, S.M. (2017b). Mitochondrial
Metabolism Power SIRT2-Dependent Deficient Traffic Causing Alzheimer’s-Disease
Related Pathology. Mol. Neurobiol. 54: 4021–4040.
Singh, P., Hanson, P.S., and Morris, C.M. (2017). Sirtuin-2 Protects Neural Cells from
Oxidative Stress and Is Elevated in Neurodegeneration. Parkinsons. Dis. 2017:
2643587.
Southwood, C.M., Peppi, M., Dryden, S., Tainsky, M.A., and Gow, A. (2007). Microtubule
deacetylases, SirT2 and HDAC6, in the nervous system. Neurochem. Res. 32: 187–95.
Spires-Jones, T.L., Fox, L.M., Rozkalne, A., Pitstick, R., Carlson, G.A., and Kazantsev,
A.G. (2012). Inhibition of Sirtuin 2 with Sulfobenzoic Acid Derivative AK1 is Non-Toxic
and Potentially Neuroprotective in a Mouse Model of Frontotemporal Dementia. Front.
Pharmacol. 3: 42.
Strahl, B.D., and Allis, C.D. (2000). The language of covalent histone modifications.
Nature 403: 41–45.
Subramanian, S., Bates, S.E., Wright, J.J., Espinoza-Delgado, I., and Piekarz, R.L.
(2010). Clinical Toxicities of Histone Deacetylase Inhibitors. Pharmaceuticals (Basel).
3: 2751–2767.
Sundriyal, S., Moniot, S., Mahmud, Z., Yao, S., Fruscia, P. Di, Reynolds, C.R., et al.
(2017). Thienopyrimidinone Based Sirtuin-2 (SIRT2)-Selective Inhibitors Bind in the
Ligand Induced Selectivity Pocket. J. Med. Chem. 60: 1928–1945.

References
139
Sureda, F.X., Gutierrez-Cuesta, J., Romeu, M., Mulero, M., Canudas, A.M., Camins, A.,
et al. (2006). Changes in oxidative stress parameters and neurodegeneration markers
in the brain of the senescence-accelerated mice SAMP-8. Exp. Gerontol. 41: 360–7.
Suzuki, T., Khan, M.N.A., Sawada, H., Imai, E., Itoh, Y., Yamatsuta, K., et al. (2012).
Design, Synthesis, and Biological Activity of a Novel Series of Human Sirtuin-2-
Selective Inhibitors. J. Med. Chem. 55: 5760–5773.
Takeda T, Hosokawa M, Takeshita S, Irino M, Higuchi K, Matsushita T, et al. A new
murine model of accelerated senescence. Mech Ageing Dev. 1981 Oct;17(2):183–94.
Takeda, T. (1999). Senescence-accelerated mouse (SAM): a biogerontological resource
in aging research. Neurobiol. Aging 20: 105–10.
Takeda, T., Matsushita, T., Kurozumi, M., Takemura, K., Higuchi, K., and Hosokawa,
M.(1997). Pathobiology of the senescence-accelerated mouse (SAM). Exp. Gerontol.
32: 117–27.
Takemura, M., Nakamura, S., Akiguchi, I., Ueno, M., Oka, N., Ishikawa, S., et al. (1993).
Beta/A4 proteinlike immunoreactive granular structures in the brain of senescence-
accelerated mouse. Am. J. Pathol. 142: 1887–97.
Tanaka, J., Okuma, Y., Tomobe, K., and Nomura, Y. (2005). The age-related
degeneration of oligodendrocytes in the hippocampus of the senescence-accelerated
mouse (SAM) P8: a quantitative immunohistochemical study. Biol. Pharm. Bull. 28:
615–8.
Tanaka, S., Ishii, A., Ohtaki, H., Shioda, S., Yoshida, T., and Numazawa, S. (2013).
Activation of microglia induces symptoms of Parkinson’s disease in wild-type, but not in
IL-1 knockout mice. J. Neuroinflammation 10: 143.
Tang, B., Dean, B., and Thomas, E.A. (2011). Disease- and age-related changes in
histone acetylation at gene promoters in psychiatric disorders. Transl. Psychiatry 1:
e64–e64.
Tanno, M., Sakamoto, J., Miura, T., Shimamoto, K., and Horio, Y. (2007).
Nucleocytoplasmic shuttling of the NAD+-dependent histone deacetylase SIRT1. J.
Biol. Chem. 282: 6823–32.

References
140
Taylor, D.M., Balabadra, U., Xiang, Z., Woodman, B., Meade, S., Amore, A., et al.
(2011). A Brain-Permeable Small Molecule Reduces Neuronal Cholesterol by Inhibiting
Activity of Sirtuin 2 Deacetylase. ACS Chem. Biol. 6: 540–546.
Tha, K.K., Okuma, Y., Miyazaki, H., Murayama, T., Uehara, T., Hatakeyama, R., et al.
(2000). Changes in expressions of proinflammatory cytokines IL-1beta, TNF-alpha and
IL-6 in the brain of senescence accelerated mouse (SAM) P8. Brain Res. 885: 25–31.
Thangaraj, M.P., Furber, K.L., Gan, J.K., Ji, S., Sobchishin, L., Doucette, J.R., et al.
(2017). RNA-binding Protein Quaking Stabilizes Sirt2 mRNA during Oligodendroglial
Differentiation. J. Biol. Chem. 292: 5166–5182.
Theendakara, V., Patent, A., Peters Libeu, C.A., Philpot, B., Flores, S., Descamps, O., et
al. (2013). Neuroprotective Sirtuin ratio reversed by ApoE4. Proc. Natl. Acad. Sci. U. S.
A. 110: 18303–8.
Thiele, B.J., Berger, M., Thiele, H., Huth, A., and Reimann, I. (1999). Features of
mammalian lipoxygenases. Adv. Exp. Med. Biol. 469: 61–6.
Tomobe, K., and Nomura, Y. (2009). Neurochemistry, neuropathology, and heredity in
SAMP8: a mouse model of senescence. Neurochem. Res. 34: 660–9.
Torres, M., Jimenez, S., Sanchez-Varo, R., Navarro, V., Trujillo-Estrada, L., Sanchez-
Mejias, E., et al. (2012). Defective lysosomal proteolysis and axonal transport are early
pathogenic events that worsen with age leading to increased APP metabolism and
synaptic Abeta in transgenic APP/PS1 hippocampus. Mol. Neurodegener. 7: 59.
Traynelis, S.F., Wollmuth, L.P., McBain, C.J., Menniti, F.S., Vance, K.M., Ogden, K.K., et
al. (2010). Glutamate Receptor Ion Channels: Structure, Regulation, and Function.
Pharmacol. Rev. 62: 405–496.
Trushina, E., Nemutlu, E., Zhang, S., Christensen, T., Camp, J., Mesa, J., et al. (2012).
Defects in mitochondrial dynamics and metabolomic signatures of evolving energetic
stress in mouse models of familial Alzheimer’s disease. PLoS One 7: e32737.
Tully, T., Bourtchouladze, R., Scott, R., and Tallman, J. (2003). Targeting the CREB
pathway for memory enhancers. Nat. Rev. Drug Discov. 2: 267–277.
Tuppo, E.E., and Arias, H.R. (2005). The role of inflammation in Alzheimer’s disease. Int.
J. Biochem. Cell Biol. 37: 289–305.

References
141
Valle, J. Del, Duran-Vilaregut, J., Manich, G., Camins, A., Pallàs, M., Vilaplana, J., et al.
(2009). Time-course of blood-brain barrier disruption in senescence-accelerated mouse
prone 8 (SAMP8) mice. Int. J. Dev. Neurosci. 27: 47–52.
Valle, J. del, Duran-Vilaregut, J., Manich, G., Casadesús, G., Smith, M.A., Camins, A., et
al. (2010). Early Amyloid Accumulation in the Hippocampus of SAMP8 Mice. J.
Alzheimer’s Dis. 19: 1303–1315.
Valle, J. del, Duran-Vilaregut, J., Manich, G., Pallàs, M., Camins, A., Vilaplana, J., et al.
(2011). Cerebral amyloid angiopathy, blood-brain barrier disruption and amyloid
accumulation in SAMP8 mice. Neurodegener. Dis. 8: 421–9.
Vaquero, A., Scher, M.B., Dong, H.L., Sutton, A., Cheng, H.L., Alt, F.W., et al. (2006).
SirT2 is a histone deacetylase with preference for histone H4 Lys 16 during mitosis.
Genes Dev. 20: 1256–1261.
Végh, M.J., Heldring, C.M., Kamphuis, W., Hijazi, S., Timmerman, A.J., Li, K.W., et al.
(2014). Reducing hippocampal extracellular matrix reverses early memory deficits in a
mouse model of Alzheimer’s disease. Acta Neuropathol. Commun. 2: 76.
Verdin, E., Dequiedt, F., and Kasler, H.G. (2003). Class II histone deacetylases: versatile
regulators. Trends Genet. 19: 286–293.
Volmar, C.H., and Wahlestedt, C.R. (2015). Histone deacetylases (HDACs) and brain
function. Neuroepigenetics 1: 20–27.
Waddington, C.H. (1968). Towards a theoretical biology. Nature 218: 525–7.
Waddington, C.H. (1942). Canalization of development and the inheritance of acquired
characters. Nature 150: 563–565.
Wagner, J.M., Hackanson, B., Lübbert, M., and Jung, M. (2010). Histone deacetylase
(HDAC) inhibitors in recent clinical trials for cancer therapy. Clin. Epigenetics 1: 117–
136.
Wang, B., Zhang, Y., Cao, W., Wei, X., Chen, J., and Ying, W. (2016). SIRT2 Plays
Significant Roles in Lipopolysaccharides-Induced Neuroinflammation and Brain Injury
in Mice. Neurochem. Res. 41: 2490–500.
Wang, F., Nguyen, M., Qin, F.X.-F., and Tong, Q. (2007). SIRT2 deacetylates FOXO3a
in response to oxidative stress and caloric restriction. Aging Cell 6: 505–514.

References
142
Wang, F., and Tong, Q. (2009). SIRT2 Suppresses Adipocyte Differentiation by
Deacetylating FOXO1 and Enhancing FOXO1’s Repressive Interaction with PPARγ.
Mol. Biol. Cell 20: 801–808.
Wang, G., Li, S., Gilbert, J., Gritton, H.J., Wang, Z., Li, Z., et al. (2017). Crucial roles for
SIRT2 and AMPA receptor acetylation in synaptic plasticity and memory. Cell Rep. 20:
1335–1347.
Wątroba, M., Dudek, I., Skoda, M., Stangret, A., Rzodkiewicz, P., and Szukiewicz, D.
(2017). Sirtuins, epigenetics and longevity. Ageing Res. Rev. 40: 11–19.
Wei, W., Xu, X., Li, H., Zhang, Y., Han, D., Wang, Y., et al. (2014). The SIRT2
polymorphism rs10410544 and risk of Alzheimer’s disease: a meta-analysis.
Neuromolecular Med. 16: 448–56.
Werner, H.B., Kuhlmann, K., Shen, S., Uecker, M., Schardt, A., Dimova, K., et al. (2007).
Proteolipid Protein Is Required for Transport of Sirtuin 2 into CNS Myelin. J. Neurosci.
27: 7717–7730.
Wong, E., and Cuervo, A.M. (2010). Autophagy gone awry in neurodegenerative
diseases. Nat. Neurosci. 13: 805–811.
Wongchitrat, P., Pakpian, N., Kitidee, K., Phopin, K., Dharmasaroja, P.A., and
Govitrapong, P. (2018). Alterations in the Expression of Amyloid Precursor Protein
Cleaving Enzymes mRNA in Alzheimer Peripheral Blood. Curr. Alzheimer Res. 16: 29–
38.
Woodruff-Pak, D.S. (2008). Animal models of Alzheimer’s disease: therapeutic
implications. Journal of Alzheimer's Disease 15: 507–21.
Wu, C.-T., and Morris, J.R. (2001). Genes, Genetics, and Epigenetics: A
Correspondence. Science 293:1103-5
Wu, Y., Zhang, A.-Q., and Yew, D.T. (2005). Age related changes of various markers of
astrocytes in senescence-accelerated mice hippocampus. Neurochem. Int. 46: 565–74.
Xia, M., Yu, J.-T., Miao, D., Lu, R.-C., Zheng, X.-P., and Tan, L. (2014). SIRT2
polymorphism rs10410544 is associated with Alzheimer’s disease in a Han Chinese
population. J. Neurol. Sci. 336: 48–51.

References
143
Xie, R., Nguyen, S., McKeehan, W.L., and Liu, L. (2010). Acetylated microtubules are
required for fusion of autophagosomes with lysosomes. BMC Cell Biol. 11: 89.
Yan, P., Bero, A.W., Cirrito, J.R., Xiao, Q., Hu, X., Wang, Y., et al. (2009). Characterizing
the Appearance and Growth of Amyloid Plaques in APP/PS1 Mice. J. Neurosci. 29:
10706–10714.
Yang, X.-J., and Seto, E. (2008). Lysine acetylation: codified crosstalk with other
posttranslational modifications. Mol. Cell 31: 449–61.
Yoo, D.Y., Kim, D.W., Kim, M.J., Choi, J.H., Jung, H.Y., Nam, S.M., et al. (2015). Sodium
butyrate, a histone deacetylase Inhibitor, ameliorates SIRT2-induced memory
impairment, reduction of cell proliferation, and neuroblast differentiation in the dentate
gyrus. Neurol. Res. 37: 69–76.
Yoo, E.J., and Lee, B.M. (2005). Comparative mutagenicity of apicidin and apicidin
derivatives (SD-0203 and SD-2007), histone deacetylase inhibitors. J. Toxicol. Environ.
Health. A 68: 2097–109.
Yuan, F., Xu, Z.-M., Lu, L.-Y., Nie, H., Ding, J., Ying, W.-H., et al. (2016). SIRT2
inhibition exacerbates neuroinflammation and blood-brain barrier disruption in
experimental traumatic brain injury by enhancing NF-κB p65 acetylation and activation.
J. Neurochem. 136: 581–593.
Yuan, H., Low, C.-M., Moody, O.A., Jenkins, A., and Traynelis, S.F. (2015). Ionotropic
GABA and Glutamate Receptor Mutations and Human Neurologic Diseases. Mol.
Pharmacol. 88: 203–217.
Zakhary, S.M., Ayubcha, D., Dileo, J.N., Jose, R., Leheste, J.R., Horowitz, J.M., et al.
(2010). Distribution analysis of deacetylase SIRT1 in rodent and human nervous
systems. Anat. Rec. (Hoboken). 293: 1024–32.
Zhao, T., Alam, H.B., Liu, B., Bronson, R.T., Nikolian, V.C., Wu, E., et al. (2015).
Selective Inhibition of SIRT2 Improves Outcomes in a Lethal Septic Model. Curr. Mol.
Med. 15: 634–41.
Zhao, Y., Yang, J., Liao, W., Liu, X., Zhang, H., Wang, S., et al. (2010). Cytosolic FoxO1
is essential for the induction of autophagy and tumour suppressor activity. Nat. Cell
Biol. 12: 665–75.

References
144
Zhou, Z., Ma, T., Zhu, Q., Xu, Y., and Zha, X. (2018). Recent advances in inhibitors of
sirtuin1/2: an update and perspective. Future Med. Chem. 10: 907–934.
Zhu, H., Zhao, L., Wang, E., Dimova, N., Liu, G., Feng, Y., et al. (2012). The QKI-PLP
pathway controls SIRT2 abundance in CNS myelin. Glia 60: 69–82.


![The regulation of SIRT2 function by cyclin-dependent kinases ......916JCB • VOLUME 180 • NUMBER 5 • 2008 with recombinant baculoviral cyclin E – Cdk2 and -[ 32 P]ATP ( Fig.](https://static.fdocuments.us/doc/165x107/60d8933f6f7c6259ee7c52cd/the-regulation-of-sirt2-function-by-cyclin-dependent-kinases-916jcb-a.jpg)