The Complexities of Physician Supply and Demand€¦ · · 2011-01-14The Complexities of...
94
Center for Workforce Studies Association of American Medical Colleges The Complexities of Physician Supply and Demand: Projections Through 2025 Learn Serve Lead
Transcript of The Complexities of Physician Supply and Demand€¦ · · 2011-01-14The Complexities of...

Center for Workforce Studies
Association ofAmerican Medical Colleges
The Complexities of Physician Supplyand Demand: Projections Through 2025
Learn
Serve
Lead
Association of American Medical Colleges
Acknowledgements: Substantial contributions were made by Timothy Dall, Vice President at The Lewin Group, Atul Grover, MD, Director of Government Relations at AAMC, and Clese Erikson, Director for Workforce Research at AAMC’s Center for Workforce Studies.

The Complexities of Physician Supply and Demand: Projections Through 2025
Michael J. Dill and Edward S. Salsberg Center for Workforce Studies
November 2008
Association of American Medical Colleges

The Complexities of Physician Supply and Demand: Projections Through 2025
THIS PAGE INTENTIONALLY LEFT BLANK.
© 2008 AAMC. May not be reproduced without permission. 1

The Complexities of Physician Supply and Demand: Projections Through 2025
Table of Contents Executive Summary .................................................................................................................................... 5
Key Findings................................................................................................................................... 6
Other Considerations and Implications........................................................................................... 7
Introduction................................................................................................................................................. 9
AAMC Workforce Recommendations ......................................................................................... 10
Background............................................................................................................................................... 11
Baseline Projections.................................................................................................................................. 15
Supply ........................................................................................................................................... 16
Demand ......................................................................................................................................... 19
Comparing Supply & Demand...................................................................................................... 24
Analysis......................................................................................................................................... 28
Limitations of the model............................................................................................................... 29
Changing Demographics........................................................................................................................... 31
Gender........................................................................................................................................... 31
Race and Ethnicity ........................................................................................................................ 36
Geographic Location..................................................................................................................... 41
Age................................................................................................................................................ 42
Health Insurance Coverage ....................................................................................................................... 48
The Economy............................................................................................................................................ 50
Retirement................................................................................................................................................. 53
Work Hours and Productivity ................................................................................................................... 57
Hours Worked............................................................................................................................... 58
Productivity................................................................................................................................... 60
GME Capacity .......................................................................................................................................... 62
Physician Assistants & Nurse Practitioners.............................................................................................. 65
Combined Scenarios ................................................................................................................................. 68
Discussion................................................................................................................................................. 73
Appendix: Methodology ........................................................................................................................... 77
© 2008 AAMC. May not be reproduced without permission. 2

The Complexities of Physician Supply and Demand: Projections Through 2025
List of Figures Figure 1. Baseline Physician FTE Supply and Demand Projections, 2006 - 2025..................................... 5
Figure 2. Projected FTE Physicians, Most Plausible Scenario, 2006-2025................................................ 6
Figure 3. Medical School Graduates, U.S., 1961-62 to 2005-06.............................................................. 12
Figure 4. Baseline Projections of Active and FTE Physicians ................................................................. 17
Figure 5. Baseline Projections of Active Physicians (excluding residents).............................................. 18
Figure 6. Baseline Projections of FTE Physicians by Specialty Group.................................................... 19
Figure 7. Baseline Projections of Demand for Physicians........................................................................ 20
Figure 8. Projections of Demand Attributable to Population Growth and Aging .................................... 21
Figure 9. Cumulative Percent Growth in Demand by Specialty Group ................................................... 22
Figure 10. Cumulative Percent Growth in Demand by Setting ................................................................ 23
Figure 11. Baseline Supply and Demand Projections............................................................................... 24
Figure 12. Contribution of Population Aging to Projected Shortfall........................................................ 25
Figure 13. Projected FTE Physicians per 100,000 Population ................................................................. 26
Figure 14. Projected General Primary Care FTE Physicians.................................................................... 27
Figure15. Projected Shortage or Surplus in 2025, by Specialty Group .................................................... 28
Figure 16. Use of FTE Patient Care Physicians (excluding residents) per 100,000 Population, by Age and Sex.............................................................................................................................................. 32
Figure 17. Women’s and Men’s Use of FTE Patient Care Physicians (excluding residents) per 100,000 Population, by Specialty ................................................................................................................... 33
Figure 18. Women and Men 75+ Years, Use of FTE Patient Care Physicians (excluding residents) per 100,000 Population, by Specialty ..................................................................................................... 33
Figure 19. US Medical School Graduates Percent Female....................................................................... 34
Figure 20. Practice Factors Cited as “Very Important” by Physicians Under 50 ..................................... 35
Figure 21. Percent of Physicians Under 50 Reporting Children, Part Time Work, Leave, and Spouse/Partner Working Full Time .................................................................................................. 35
Figure 22. Cumulative Percent Growth in Population, by Race-Ethnicity (relative to 2006) .................. 36
Figure 23. Race/Ethnicity Group Use of FTE Patient Care Physicians (excluding residents) per 100,000 Population, by Setting....................................................................................................................... 37
Figure 24. Race/Ethnicity Group Use of FTE Patient Care Physicians (excluding residents) per 100,000 Population, by Specialty ................................................................................................................... 37
Figure 25. US Physicians by Race and Ethnicity, 2004 ........................................................................... 40
Figure 26. US Physicians* by Race and Ethnicity, 2006 ......................................................................... 41
Figure 27. US Medical School Graduates by Race and Ethnicity, 1980-2004......................................... 38
© 2008 AAMC. May not be reproduced without permission. 3

The Complexities of Physician Supply and Demand: Projections Through 2025
Figure 28. US Medical School Graduates and Population by Race and Ethnicity, 2004......................... 39
Figure 29. Cumulative Percent Growth in Population, by Age Group (relative to 2006) ........................ 43
Figure 30. Crude and Age-Adjusted Death Rates, US, 1980-2005 .......................................................... 44
Figure 31. Use of FTE Patient Care Physicians (excluding residents) per 100,000 Population............... 44
Figure 32. Use of FTE Patient Care Physicians (excluding residents) per 100,000 Population............... 45
Figure 33. Average Physician Visits by Age, 1990 to 2005..................................................................... 46
Figure 34. Demand Scenario: Increasing Utilization in Population 45+ Years........................................ 46
Figure 35. Active Physicians by Age Group, 2006 .................................................................................. 47
Figure 36. Demand Scenario: Universal Health Coverage....................................................................... 49
Figure 37. Demand Scenario: Economic Growth ..................................................................................... 52
Figure 38. Age Distribution of Current Physician Workforce.................................................................. 53
Figure 39. Retirement Patterns for Male and Female Physicians............................................................. 54
Figure 40. Probability Still Active in Medicine........................................................................................ 54
Figure 41. Supply Scenarios: Physicians Retire Two Years Earlier or Later........................................... 56
Figure 42. Mean Number of Patient Visits per Week, 1989-2001 ........................................................... 57
Figure 43. Average Patient Care Hours Worked per Week...................................................................... 59
Figure 44. Supply Scenario: Shift in Physician Work Hours .................................................................. 60
Figure 45. Demand Scenario: Increased Productivity ............................................................................. 61
Figure 46. Projections of Total New First-year Residents........................................................................ 62
Figure 47. Supply Scenarios: Moderate and Robust GME Growth......................................................... 63
Figure 48. Projected National Supply & Shortfall of Physicians with GME Expansion ......................... 64
Figure 49. Supply Scenarios: Beyond Baseline Growth and Increased Primary Care Provision for PAs and NPs ............................................................................................................................................. 66
Figure 50. Projected FTE Physicians, Worst Case Scenario, 2006-2025................................................. 69
Figure 51. Projected FTE Physicians, Best Case Scenario, 2006-2025.................................................... 70
Figure 52. Projected FTE Physicians, Most Plausible Scenario, 2006-2025............................................ 71
Figure 53. Primary Data Sources .............................................................................................................. 82
Figure 54. Estimated Active Physician Supply, 2006............................................................................... 83
Figure 55. Comparison of Self-reported Activity Status to Status Recorded in the AMA Masterfile for Male Physicians Age 50 and Older................................................................................................... 85
Figure 56. Comparison of Self-reported Activity Status to Status Recorded in the AMA Masterfile for Female Physicians Age 50 and Older ............................................................................................... 85
Figure 57. FTE Percentage Rates for General and Family Practitioners.................................................. 88
© 2008 AAMC. May not be reproduced without permission. 4
The Complexities of Physician Supply and Demand: Projections Through 2025
Executive Summary Under any set of plausible assumptions, the United States is likely to face a growing shortage of physicians. Due to population growth, aging and other factors, demand will outpace supply through at least 2025. Simply educating and training more physicians will not be enough to address these shortages. Complex changes such as improving efficiency, reconfiguring the way some services are delivered and making better use of our physicians will also be needed.
In June 2006, the Association of American Medical Colleges (AAMC) recommended a 30% increase in U.S. medical school enrollment and an expansion of Graduate Medical Education (GME) positions to accommodate this growth.1 These recommendations were based on recent studies pointing toward an impending shortage of physicians.2,3 They were also based on a recognition of factors likely to influence future physician supply and demand, such as the aging of the U.S. population and the physician workforce. The AAMC monitors the physician workforce on a regular basis to assess and update workforce projections in order to inform the medical community and policy recommendations. This is the first such report since the association’s June 2006 recommendations of a 30 percent increase in enrollment. It presents physician supply and demand projections under a variety of scenarios for the US through 2025.
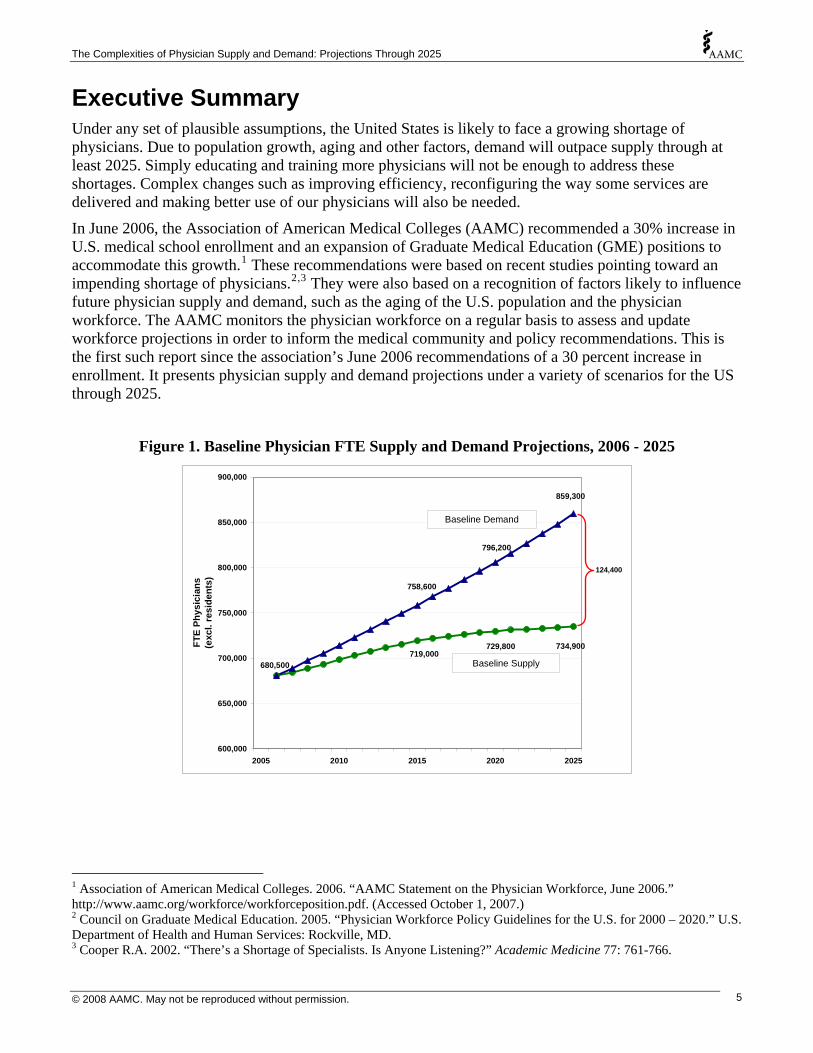
Figure 1. Baseline Physician FTE Supply and Demand Projections, 2006 - 2025
719,000729,800 734,900
859,300
796,200
758,600
680,500
600,000
650,000
700,000
750,000
800,000
850,000
900,000
2005 2010 2015 2020 2025
FTE
Phys
icia
ns(e
xcl.
resi
dent
s)
Baseline Supply
Baseline Demand
124,400
1 Association of American Medical Colleges. 2006. “AAMC Statement on the Physician Workforce, June 2006.” http://www.aamc.org/workforce/workforceposition.pdf. (Accessed October 1, 2007.) 2 Council on Graduate Medical Education. 2005. “Physician Workforce Policy Guidelines for the U.S. for 2000 – 2020.” U.S. Department of Health and Human Services: Rockville, MD. 3 Cooper R.A. 2002. “There’s a Shortage of Specialists. Is Anyone Listening?” Academic Medicine 77: 761-766.
© 2008 AAMC. May not be reproduced without permission. 5

The Complexities of Physician Supply and Demand: Projections Through 2025
Under our baseline scenario,4 which assumes a continuation of current supply, use and demand patterns, the supply of physicians will not be able to keep pace with the projected increase in demand (Figure 1). By 2025, a shortage of 124,000 physicians5 is projected.
However, practice and utilization patterns in the future are very unlikely to be the same as today. Therefore, the report presents projections of possible alternative scenarios. One alternative scenario makes a plausible set of assumptions about trends affecting future physician supply and demand including a continued increase in utilization rates, changes in work schedules with older physicians continuing to work more hours and younger physicians working fewer, a moderate expansion of GME capacity, and productivity improvements. Under this scenario there would be a projected shortage of 159,300 FTE physicians by 2025, or 35,000 more than the baseline shortage (Figure 2).
Figure 2. Projected FTE Physicians, Most Plausible Scenario, 2006-2025
Baseline Demand
Baseline Supply
Most Plausible Demand
Most Plausible Supply
700,000
750,000
800,000
850,000
900,000
950,000
FTE
Phys
icia
ns (e
xcl r
esid
ents
)
600,000
650,000
2005 2010 2015 2020 2025
159,300
Given these projections, assuring access to health care will require more than the expected enrollment increase in U.S. medical schools and an expansion in GME. Increasing the number of U.S. doctors is necessary, but it will not be sufficient. In the coming years, the nation will need to transform the way health care is delivered, financed, and used. Key Findings
• The nation is likely to experience a shortage of physicians which will grow over time.
• Though the supply of physicians is projected to increase modestly between now and 2025, the demand for physicians is projected to increase even more sharply.
4 Projections presented throughout this report are for total, active physicians, excluding residents and fellows. 5 FTEs, or Full Time Equivalents, represent the number of physicians if every physician worked as many hours as the average physician worked in the baseline year of 2006.
© 2008 AAMC. May not be reproduced without permission. 6
The Complexities of Physician Supply and Demand: Projections Through 2025
• Aging of the population may drive demand sharply upward for specialties that predominantly serve the elderly (e.g., oncologists).
• The US Census Bureau projects that the US population will grow by more than 50 million (to 350 million) between 2006 and 2025. This alone will likely lead to a considerable increase in the demand for physician services.
• Growth in future demand could double if visit rates by age continue to increase at the same pace they have in recent years – with the greatest growth in utilization among those 75+ years of age.
• Universal health care coverage could add 4 percent to overall demand for physicians; this would increase the projected physician shortfall by 31,000 physicians (25 percent).
• Even a modest increase in physician productivity could do more to alleviate the projected gap between supply and demand than any other supply-side change but productivity improvements in health care have been hard to achieve as care has become more complex.
• Future demand for physicians would be significantly reduced if physician assistants and nurse practitioners play a larger role in patient care.
• Even a robust expansion of GME capacity (from 25,000 new entrants per year to 32,000) would only reduce the projected shortage in 2025 by 54,000 physicians (43 percent).
Other Considerations and Implications
• Shortages are likely to be manifested in a number of ways, some subtle and some not. This includes longer waiting times for appointments, increased travel distances to get care, shorter visit times with physicians, expanded use of non-physicians for care and higher prices. If shortages are extensive, in some cases it will lead to a loss of access altogether.
• Any future shortages are likely to have an uneven effect, with some geographic areas, specialties and subpopulations hit harder than others, resulting in hardships for both poor urban and rural communities, where access to care continues to be problematic.
• Only under the most optimistic assumptions can future physician supply and demand be expected to approach equilibrium. The confluence of developments needed to avoid a future shortage appears very unlikely.
• A 30 percent expansion in medical school enrollment and an increase in GME positions will not eliminate the projected shortage, only moderate it. Growth in the physician supply needs to be accompanied by other actions, such as a shift in how physician services are delivered, in order to overcome the projected shortage.
• There is mounting evidence of place- and specialty-specific shortages across the U.S.,6 and physician workforce planning needs to rise to the challenge of better understanding the confluence of regional and specialty variations in supply and demand.
• Concerns with the supply of primary care physicians that many already believe to be insufficient are likely to intensify as demand outpaces supply faster for primary care than any of the specialty groups.
6 Center for Workforce Studies. 2007. "Recent Studies and Reports on Physician Shortages in the U.S." Association of American Medical Colleges: Washington, DC.
© 2008 AAMC. May not be reproduced without permission. 7

The Complexities of Physician Supply and Demand: Projections Through 2025
• If US MDs continue to select other specialties, the future of primary care practice is likely to rely increasingly on foreign medical school graduates, osteopaths and non-physician clinicians.
• The demand projections are likely a conservative estimate. All signs suggest that Baby Boomers—and most following generations—will be aggressive about seeking care that will allow them to remain active, and that they will be more likely to seek medical care than previous generations. 7
• Over the next several years, there are several factors that could worsen the shortage significantly. For example, if the nation does not implement significant delivery system reforms and/or improve efficiency and effectiveness, or if the nation moves rapidly towards universal health coverage, or if the flow of IMGs slows significantly, then any shortages that develop may be even more severe than those described in this report.
• Given the evidence that minority physicians are more likely to provide care for poor and underserved communities,8 increasing the diversity of the physician workforce should continue to be a priority of the medical education community.
If there is one theme that emerges from this work, it is complexity. Demographics, the need for work-life balance, trends in retirement, the national debate on the uninsured, the role of primary care in the health care delivery system, training capacity at all stages of an increasingly international pipeline, and the role of non-physicians: all of these have direct bearing on the future supply and demand for physicians and their services. And this is only the beginning. Women in the workforce, medical advances, geographic imbalance, payment systems, tiered access also matter.
This report was designed to inform physician workforce planning. There is much work to be done to better understand the dynamics of the physician workforce—in order to better inform physician workforce planning. To that end, future efforts should:
• Continue to promote carefully considered changes in medical school capacity and the availability of GME positions as part of a broader strategy to address physician shortages;
• Promote efforts to make more effective use of the limited physician supply, such as through the use of non-physician clinicians and other health professionals, and to improve productivity;
• Recognize and respond to physician life-style concerns, i.e. promote flexible scheduling including part time work. Given the large number of physicians over age 55, their decisions as to when to retire will have an enormous impact on the supply of physicians
• Improve data collection and workforce studies and expand collaboration among health professions organizations on data and workforce policies.
A key aspect of the complexity inherent in the labor market for physicians lies in the length of time involved in the training and ‘production’ of physicians, which often requires individuals to make career decisions at least a decade prior to active participation. The average physician must complete four years of baccalaureate study, four years of medical (or osteopathic) school, and three to eight years of post-graduate training (residency and fellowship). For educators and policy makers, as well as potential physicians, the decision to change physician workforce policy in 2020 needs to begin today.
7 National Center for Health Statistics. 2007. “Ambulatory Medical Care Utilization Estimates for 2005”. Advanced Data from Vital and Health Statistics. 388: June 29, 2007. http://www.cdc.gov/nchs/data/ad/ad388.pdf. (Accessed Oct 1, 2007.) 8 Saha, S. & S. Shipman. 2006. "The Rationale for Diversity in the Health Professions: A Review of the Evidence." United States Department of Health and Human Services, Health Resources and Services Administration: Rockville, MD.
© 2008 AAMC. May not be reproduced without permission. 8
The Complexities of Physician Supply and Demand: Projections Through 2025
Introduction
In 2006, the Association of American Medical Colleges (AAMC) adopted a new workforce position based upon research suggesting a future shortage of physicians in the United States. The new position included two recommendations designed to increase the supply of physicians:
• Expansion of first year U.S. medical school enrollment by 30% over 2002-03 levels by the year 2015; and
• An increase in Graduate Medical Education (GME) positions, which determine the number of new physicians available to care for patients, to accommodate the increase in USMD graduates.
The AAMC position statement also included a number of recommendations aimed at improving the distribution of health care providers and strengthening the US medical education community’s role in global health (see full list of recommendations on following page).9
The AAMC’s Center for Workforce Studies concurrently began an effort to improve the evidence available to policy makers, workforce planners, and educators to inform decisions related to medical education and training infrastructure in the U.S. In so doing, AAMC sought to bring an ongoing, systematic approach to otherwise sporadic and infrequent physician workforce research efforts in the U.S.
This work builds upon previous studies conducted for the Council on Graduate Medical Education (COGME)10 and those performed by the U.S. Department of Health and Human Services’ (DHHS) Bureau of Health Professions within the Health Resources and Services Administration (HRSA).11 The most recent major effort to project physician workforce requirements in the U.S. was based upon data collected in 2000, though this research was not publicly released by HRSA until the middle of 2006.
The current report represents the first in a planned series of periodic AAMC Center efforts to update physician workforce projections for the U.S. It relies on public and proprietary data collected by the AAMC, the American Medical Association (AMA), and government agencies and is meant to provide medical educators, the public, and policymakers with the most recent, evidence-based projections of physician supply and demand over the next two decades. The purpose of this report is to document the adequacy of the future national supply of physicians, and to provide a summary of the implications of major trends and policies that shape physician supply and demand in the U.S.
9 Association of American Medical Colleges. 2006. "AAMC Statement on the Physician Workforce." <http://www.aamc.org/workforce/workforceposition.pdf> (Accessed: 14-April-2008.) 10 COGME Sixteenth Report: Physician Workforce Policy Guidelines for the United States. Accessed June 19, 2007 at http://www.cogme.gov/report16.htm. 11 Health Resources and Services Administration. Physician Supply and Demand: Projections to 2020. Accessed June 19, 2007 at http://bhpr.hrsa.gov/healthworkforce/reports/physiciansupplydemand/default.htm.
© 2008 AAMC. May not be reproduced without permission. 9

The Complexities of Physician Supply and Demand: Projections Through 2025
AAMC Workforce Recommendations12
1. Enrollment in LCME-accredited medical schools should be increased by 30% from the 2002 level over the next decade. This expansion should be accomplished by increased enrollment in existing schools as well as by establishing new medical schools. 2. The aggregate number of graduate medical education (GME) positions should be expanded to accommodate the additional graduates from accredited medical schools. 3. The AAMC should assist medical schools with expanding enrollment in a cost effective manner; assuring appropriate medical education for traditional and non-traditional students; and increasing the number and preparedness of applicants. 4. The AAMC should continue to advocate for and promote efforts to increase enrollment and graduation of racial and ethnic minorities from medical school; and promote the education and training of leaders in medical education and health care from racial and ethnic minorities. 5. The AAMC should examine options for development of: (1) a formal, voluntary process for assessing medical schools outside the U.S.; and (2) a mechanism for overseeing the clinical training experiences in the U.S. of medical students enrolled in foreign medical education programs. 6. AAMC should take a more active role in supporting and assisting associations of medical schools in other countries, especially in less developed parts of the world. AAMC should work with its members to expand collaboration between medical schools and teaching hospitals in the U.S. with those in less developed countries. 7. The J-1 visa is the most appropriate visa for non-U.S. citizen graduates of foreign medical schools entering graduate medical education programs in the U.S. and should be encouraged. 8. The AAMC should undertake a study of the geographic distribution of physicians and develop recommendations to address mal-distribution in the U.S. 9. National Health Service Corps (NHSC) awards should be increased by at least 1,500 per year to help meet the need for physicians caring for under-served populations and to help address rising medical student indebtedness. 10. Studies of the relationship between physician preparation (i.e., medical education and residency training) and the quality and outcomes of care should be conducted and supported by public and private funding. 11. Ongoing and stable funding should be provided to track the physician workforce, including monitoring the supply of, and the demand for, and the contributions made by FMGs. 12. Individual medical students and physicians should be free to determine for themselves which area of medicine they wish to pursue and GME programs and teaching hospitals should be free to offer training in specialties they wish to offer if accredited by the ACGME. The AAMC should provide students, physicians, programs and hospitals with the best available and timely data on physician workforce needs in order to support informed decisions. The AAMC should support efforts to promote a healthcare delivery and financing system that can better align marketplace demand for physicians with health care needs of the population.
12 Association of American Medical Colleges. 2006. "AAMC Statement on the Physician Workforce." <http://www.aamc.org/workforce/workforceposition.pdf> (Accessed: 14-April-2008.)
© 2008 AAMC. May not be reproduced without permission. 10

The Complexities of Physician Supply and Demand: Projections Through 2025
Background A brief history of physician workforce trends in the United States
The size and composition of the physician workforce in the U.S. is shaped by a complex blend of public and private policies, of individual and institutional decisions. The education and training policies of medical schools, osteopathic schools, and graduate training programs – all of which respond to explicit and implicit public policy as well as societal needs and demands at the local and national level – are among the key factors influencing physician workforce numbers.
Released in 1910, the Flexner Report on medical education led to major changes in the physician workforce. The number of schools was reduced by 80% and, in the next three decades, the per capita supply of physicians fell from 175 to 125 per 100,000 persons.13 The Flexner Report reinforced the perception that the U.S. had too many physicians in the early 1900’s. Two decades later, these findings were echoed in the 1932 report by the AAMC’s Commission on Medical Education, which suggested that the nation was facing a surplus of physicians based upon an assessment of population needs.14
Despite the Commission’s recommendation that medical school intake be cut, the supply of physicians relative to the size of the population continued to increase. This growth was concurrent with a post-war increase in the nation’s medical knowledge and skill base and accompanied by a growth of subspecialties in subsequent decades.15 No significant, national studies of the physician workforce were reported until a generation later, when the Surgeon General’s office issued the Bayne-Jones (1958)16 and Bane (1959)17 reports. Both predicted a shortage of physicians. These reports called for the construction of new medical schools and the expansion of enrollment.
Four years later, the Health Professions Education Assistance Act of 1963 provided funds for new medical school construction to stimulate growth in physician supply. The legislation was quickly reinforced by several national reports, including the Coggeshall report to the AAMC in 1965 which concluded that “more physicians must be trained as quickly as possible.”18 The President’s National Advisory Committee on Health Manpower (1967) also called for rapid growth in medical education and, by 1968, both the AAMC and the AMA had committed to the goal of medical school expansion. By 1982, the number of medical schools had grown to 127, from 89 in 1972, and the number of graduates had doubled (Figure 3 ).19
13 Grover Atul. 2006. “Critical Care Workforce: A Policy Perspective.” Critical Care Medicine. 34:S7-11. 14 Rappleye WC. 1932. “Medical Education: Final Report of the Commission on Medical Education.” New York: Association of American Medical Colleges. (p. 386) 15 Donini-Lenhoff F.G., and H.L. Hedrick. 2000. “Growth of Specialization in Graduate Medical Education. Journal of the American Medical Association. 284:1284-1289. 16 United States, Department of Health, Education, and Welfare, Office of the Secretary. “The Advancement of Medical Research and Education Through the Department of Health, Education, and Welfare. 1958. Final Report of the Secretary's Consultants of Medical Research and Education” (Stanhope Bayne-Jones Report). Washington , D.C. : Government Printing Office, 27 June 1958. 17 Bane, F. 1959. “Physicians for a Growing America: Report of the Surgeon’s General’s Consultant Group on Medical Education”. U.S. Public Health Service, Publication No. 709. 18 Coggeshall, L.T. 1965. Planning for Medical Progress through Education: A Report Submitted to the Executive Council of the Association of American Medical Colleges. Association of American Medical Colleges: Evanston, IL. 19 Association of American Medical Colleges. 2007. “Table 25: Total Graduates by U.S. Medical School and Sex, 2002-2007”. < http://aamc.org/data/facts/2007/schoolgrads0207.htm>. (Accessed: 2008-April-14.)
© 2008 AAMC. May not be reproduced without permission. 11

The Complexities of Physician Supply and Demand: Projections Through 2025
Figure 3. Medical School Graduates, U.S., 1961-62 to 2005-06
0
2,000
4,000
6,000
8,000
10,000
12,000
14,000
16,000
18,000
1961-62 1965-66 1969-70 1973-74 1977-78 1981-82 1985-86 1989-90 1993-94 1997-98 2001-02 2005-06
1965 Coggeshall (shortage)
1967 President’s National Advisory Committee (shortage)
1980 GMENAC (surplus)
1994 COGME (surplus)
1995 Pew Commission (surplus)
1996 IOM (surplus)
Source: AAMC Data Warehouse: Student section; Student Records System(SRS); Journal of Medical Education.
The rapid expansion in medical education was halted twenty years after it started as researchers, policymakers, and the educational community reassessed the need for further growth. This change recognized that the doubling of medical school graduates would lead to a growing supply for at least 35 years. In 1980, the Graduate Medical Education National Advisory Committee (GMENAC) reported (based upon the number of physicians needed to provide “necessary and appropriate” services) that a surplus of 70,000 physicians would be likely by the year 2000.20 With the promotion of tightly controlled managed care in the early 1990s, many groups reaffirmed the belief that the nation was facing a surplus. The national Council on Graduate Medical Education (COGME),21 the National Academy of Science’s Institute of Medicine (IOM), the Pew Health Professions Commission,22 the AAMC,23 the AMA24 and other national physician associations expressed concerns about an impending potential surplus of physicians.
In its 1994 report to both Congress and the Secretary of Health and Human Services, COGME noted, “in a managed care dominated health system, the Bureau of Health Professions projects a year 2000
20 U.S. Graduate Medical Education National Advisory Committee. 1980. Summary report of the Graduate Medical Education National Advisory Committee : to the Secretary, Department of Health and Human Services / Volume 1. U.S. Dept. of Health and Human Services, Public Health Service, Health Resources Administration, Office of Graduate Medical Education ; Washington, D.C. 21 Council on Graduate Medical Education (U.S.). 1992. Improving access to health care through physician workforce reform : Directions for the 21st century : third report. Rockville, Md. : United States Department of Health and Human Services, Public Health Service, Health Resources and Services Administration, Bureau of Health Professions, Division of Medicine. 22 Pew Health Professions Commission. 1995. Critical challenges: revitalizing the health professions for the twenty-first century. San Francisco: UCSF Center for the Health Professions. 23 Association of American Medical Colleges. 1993. AAMC policy on the generalist physician. Academic Medicine 68(1): 1-6. 24 Cohen J. & J. Todd. 1994. Association of American Medical Colleges and American Medical Association joint statement on physician workforce planning and graduate medical education reform policies. Journal of the American Medical Association. 272(9):712.
© 2008 AAMC. May not be reproduced without permission. 12

The Complexities of Physician Supply and Demand: Projections Through 2025
shortage of 35,000 generalist physicians and a surplus of 115,000 specialist physicians” and recommended that the nation “produce 25% fewer physicians annually.”25 In 1995, the Pew Commission recommended medical schools “by 2005 reduce the size of the entering medical school class in the U.S. by 20-25%,” arguing further that this reduction should come from the closure of existing medical schools.26 In 1996, an IOM committee recommended, “no new schools of allopathic or osteopathic medicine be opened, that class sizes in existing schools not be increased, and that public funds not be made available to open new schools or expand class size.”27 The same year, the AAMC and five other major medical associations urged policymakers to follow IOM recommendations (but also to create a national physician workforce advisory body to monitor and periodically assess the adequacy of the size and specialty composition of the physician workforce).28
The medical education and training community responded to these recommendations. The number of graduates from U.S. medical schools remained virtually unchanged between 1980 and 2005. Despite this stagnation in medical school enrollment, the doubling of medical school enrollment during the 1960s and 1970s led to a steady stream of new physicians entering the workforce at a rate greater than those leaving the field. Consequently, the ratio of physicians to population increased steadily from 1980 onward. However, few health policy experts in the year 2000 would have argued that this constituted a surplus of physicians, even though this number grew from 202 per 100,000 in 1980 to 276 per 100,000 in 2000. 29 Bureau of Health Professions projections had estimated that physician demand - not a defined need - would increase over time. In fact, per capita utilization of medical services did rise as they had suggested it would.30 Other analyses had assumed major cost and utilization controls in health care.31
Currently, despite the increase in aggregate and per capita physician supply, no significant economic evidence of physician surpluses has emerged. There is even a growing body of evidence indicating shortages, at least in some areas and for certain specialties.32 Moreover, an accelerated increase in the utilization of health services is likely occurring as the population ages and new advancements are made in available treatments. By 2030, more than 71 million Americans will be over the age of 65, roughly double the number there were in the year 2000; and the 65+ population uses twice as many physician services as those under 65.
25 Council on Graduate Medical Education. 1994. Fourth Report: Recommendation to Improve Access to Health Care Through Physician Workforce Reform. U.S. Health Resources and Services Administration: Rockville, MD. 26 Pew Health Professions Commission. 1995. Critical Challenges: Revitalizing the Health Professions for the Twenty-First Century. The Third Report of the Pew Health Professions Commission. U.C.S.F. Center for the Health Professions: San Francisco. 27 Lohr, Kathleen N.: Vanselow, Neal A.; and Don E. Detmer, eds. 1996. The Nation's Physician Workforce: Options for Balancing Supply and Requirements. Institute of Medicine Committee on the U.S. Physician Supply. National Academy Press: Washington, DC. 28 American Association of Colleges of Osteopathic Medicine, American Medical Association, American Osteopathic Association, Association of Academic Health Centers, Association of American Medical Colleges, and the National Medical Association. 1997. “Consensus statement on the physician workforce”. 29 Blumenthal D. 2004. “New steam from an old cauldron--the physician-supply debate.” New England Journal of Medicine. 350:1780-1787. 30 See section on Changing Demographics for more detail on this trend. 31 Institute of Medicine (U.S.). Division of Health Sciences Policy. 1983. “Medical education and societal needs : a planning report for the health professions : report of a study”. National Academy Press: Washington, D. C. 32 For example, see: Salsberg, Edward & Atul Grover. 2006. “Physician Workforce Shortages: Implications and Issues for Academic Health Centers and Policymakers.” Academic Medicine. 81(9): 782-787.
© 2008 AAMC. May not be reproduced without permission. 13

The Complexities of Physician Supply and Demand: Projections Through 2025
Demand versus need in workforce research
Differentiating between demand and need for physician services is difficult and increases the complexity of making generally accepted projections. Previous projections have been based upon the “need” for physician services as determined by panels of experts (e.g., GMENAC). Others (BHPr) have defined “demand” as equal to utilization at the current point in time. Setting demand as equal to current utilization has a potential drawback: it assumes that supply and demand are in equilibrium at the current time. It thus fails to account for unmet demand or need (including that of the uninsured), which may lead to underestimates of future requirements for physician services; and it also neglects any overuse of services (or use of marginally beneficial services), potentially overestimating future physician workforce needs.
Projections based on need, or “the medically modifiable morbidity (illness) burden of a defined population,”33 may account for services required for all segments of the population (regardless of current ability to access medical care) and may even help avoid planning for unnecessary variations in medical care, including those that may be related to “supply induced demand”.34 Yet these need-based approaches do have considerable drawbacks, the greatest of which is the subjective nature of defining need and determining which services are unnecessary for entire populations. They also base projections on a subjectively defined/desired system of care which currently does not exist in the U.S. Even if a more efficient or effective system can be defined or identified, policies aimed at transforming the current system to meet an ‘ideal type’ may have unintended consequences, such as the limits on physician training capacity that resulted from assumption of the shift to a managed-care based system that never manifested as anticipated. And of course, even if it can be calculated, “need” it is not a measure of “demand” for health professionals.35 Demand is “the request of the patient (or the physician or the patient’s family) for medical care services.”36
Certainly, confounding this entire issue is health insurance. Covering the cost of both expected and unexpected occurrences, the U.S. health insurance market often insulates consumers and providers from the true costs of care. Despite the use of co-payments and deductibles, patients are generally isolated from the costs of the decisions which they make in regard to their own health care. As a result, health insurance may artificially increase purchasing power and thereby increase demand for health care services.
Health utilization can be considered a function of need and demand. While it may be possible to reduce both the need and the demand for health care in the future, any changes that address need by ameliorating existing disparities in access to care may actually drive utilization upward. This includes, but is not limited to, attempts to amend the geographic maldistribution of physicians that currently plagues the nation. For the purposes of this report, baseline projections simply assume that current utilization patterns will continue into the foreseeable future in order to demonstrate and foster discussion of the possible effects of changes to the current system.
33 Fries, J.F.; Koop, C.E.; Sokolov, J.; Beadle, C.E.; and D. Wright. 1998. “Beyond health promotion: Reducing need and demand for medical care”. Health Affairs. 17:70-84. 34 Mullan F. 2004. “Wrestling with variation: An interview with Jack Wennberg.” Health Affairs. 7-October-2004. Web only. VAR 73-80. < http://content.healthaffairs.org/cgi/reprint/hlthaff.var.73v1.pdf> (Accessed 26-February-2008.) 35 Baker T.D. 1966. “Dynamics of health manpower planning”. Medical Care. 4:205-211. 36 Fries, J.F.; Koop, C.E.; Sokolov, J.; Beadle, C.E.; and D. Wright. 1998. “Beyond health promotion: Reducing need and demand for medical care”. Health Affairs. 17:70-84.
© 2008 AAMC. May not be reproduced without permission. 14

The Complexities of Physician Supply and Demand: Projections Through 2025
Baseline Projections
The keystone to this report is a set of baseline projections of physician supply and demand in the U.S. The purpose of these projections is to highlight critical issues for consideration when discussing and making decisions that affect the nation’s future physician workforce. These projections should not be construed as predictions. Indeed, these baseline projections start with two simple assumptions: that supply and demand are currently equal; and that only those changes which are relatively easy to anticipate will occur, such as shifts in population demographics. This is not realistic, nor is it intended to be. Rather, this approach tries to demonstrate what will happen if little or nothing changes, in order to emphasize that some changes are needed. Further sections will delve into the possibility of departures from baseline assumptions, as well as their significance in planning for future physician workforce needs. These include shifts in retirement and work patterns, growth in GME, changes in the role of non-physician clinicians, expansion of health care coverage, and an examination of the relationship between the economy and the demand for physician services.
Patterns of utilizing and providing physician services are based on countless decisions made by more than 300 million people in the US; by approximately 800,000 physicians; by hundreds of thousands of employers and payers who determine the generosity and comprehensiveness of medical insurance offered; and by the federal, state, and local programs that provide or subsidize care to vulnerable populations. The Physician Supply and Demand Model (PSDM) is designed solely to be a simple representation of a complex system, attempting to capture or demonstrate trends in the major determinants of healthcare utilization and service delivery in order to inform discussion and decision-making.
Projection or Prediction?
Throughout this report, projections of physician supply and demand are presented and discussed.
Projections are developed by asking what would happen if an assumed set of conditions persists. This is an intellectual exercise intended to develop insights into what the future may hold, given the way things are now.
In contrast, a prediction is a statement of how things will be. No predictions are made in this report.
The present analysis, based on the PSDM, projects a growing shortage of physicians in the US. If current trends continue, in terms of population demographics, utilization, the composition and practice patterns of the physician workforce, and the flow of new entrants into the profession, then – all else remaining the same – a physician shortage is highly probable. Below are the assumptions underlying this projection, as well as a detailing of its potential progress and magnitude.
© 2008 AAMC. May not be reproduced without permission. 15

The Complexities of Physician Supply and Demand: Projections Through 2025
Supply
Active supply - the number of physicians engaged in providing professional medical services. FTE supply - the active supply of physicians, adjusted for changes (relative to the base year) in average patient care hours worked. FTE supply is the focus of this report.
The supply component of the PSDM is an inventory model that starts with the number of active physicians37 in the base year (2006) categorized by age, gender, specialty, and education - graduates of U.S. schools of allopathic medicine (USMDs), graduates of U.S. schools of osteopathic medicine (DOs), and international medical graduates (IMGs). For each projection year, estimates of the number of physicians entering graduate medical education (GME) are added to supply, while estimates of physicians leaving the workforce through retirement or death are subtracted from supply. The projected number of physicians remaining at the end of one projection year becomes the starting point for the next year’s projection. Key supply determinants are the number of physicians completing GME, hours worked patterns, and retirement patterns.
By definition, in the base year (2006) the number of active physicians excluding residents and fellows equals the number of full-time equivalent (FTE)38 physicians. The FTE measure is designed to model the change over time in physician hours worked if physician demographic trends and lifestyle choices change average hours worked per year. An FTE is defined relative to the average patient care hours worked in 2006 for physicians in a given medical specialty. Patient care hours, rather than total hours in professional activities, is used to define an FTE because a shift in hours from non-patient care activities (e.g., research) to patient care activities, in effect, increases the supply of physician services. FTE supply is used for comparison to demand for physician services.
The PSDM also models supply and demand for four major specialty categories:39
• Primary Care;
• Medical Specialties;
• Surgery; and
• Other Patient Care.
Estimates of active supply for the base year (2006) are derived from the American Medical Association (AMA) Masterfile, with modifications based on an assumption of retirement by age 75,40 original analysis of a comprehensive AAMC-AMA Survey of Physicians Over Age 50, and a more inclusive definition of ‘active’ for physicians over 50 years of age than is used in the Masterfile.
37 Several definitions of supply are used, depending on the context of the discussion: Active supply is the total number of physicians engaged in providing professional medical services. Full time equivalent (FTE) supply is calculated by multiplying total active physicians by the ratio of average patient care hours worked in each future year to average patient care hours worked in 2006. Patient care supply, active or FTE, is the number of physicians primarily engaged in patient care activities. 38 FTE is defined as the average number of physician hours worked per week in 2006, with the number of physicians and FTE physicians in 2006 thus being – by definition – equal. 39 Physicians are categorized solely by their self-identified primary specialty. 40 Estimates of active physicians age 75 and older in the Masterfile include approximately 1,000 reported residents and fellows, 27,000 physicians in direct patient care, and 6,000 in other professional activities (teaching, administration, research, and other non-patient care).
© 2008 AAMC. May not be reproduced without permission. 16
The Complexities of Physician Supply and Demand: Projections Through 2025
The PSDM is used to model a baseline supply scenario that assumes current trends in key supply determinants. Alternate supply scenarios are modeled that assume different trends in the number of physicians completing GME, retirement patterns, and average patient care hours worked.
Total physicians
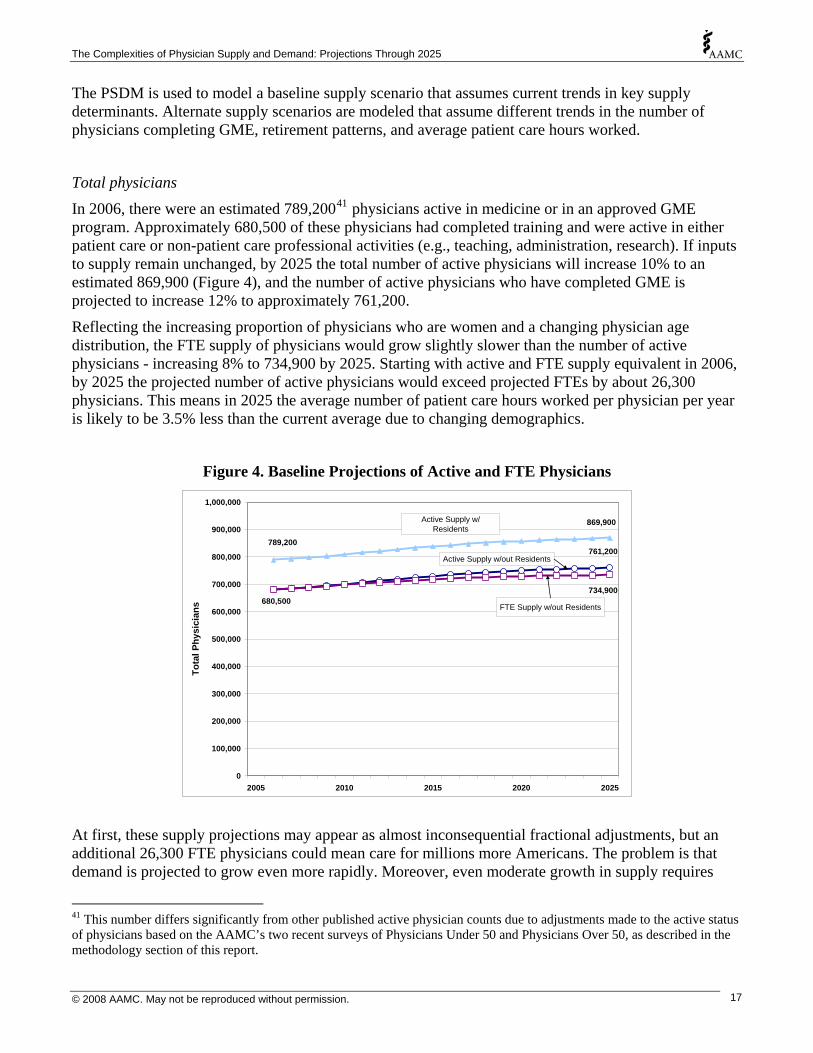
In 2006, there were an estimated 789,20041 physicians active in medicine or in an approved GME program. Approximately 680,500 of these physicians had completed training and were active in either patient care or non-patient care professional activities (e.g., teaching, administration, research). If inputs to supply remain unchanged, by 2025 the total number of active physicians will increase 10% to an estimated 869,900 (Figure 4), and the number of active physicians who have completed GME is projected to increase 12% to approximately 761,200.
Reflecting the increasing proportion of physicians who are women and a changing physician age distribution, the FTE supply of physicians would grow slightly slower than the number of active physicians - increasing 8% to 734,900 by 2025. Starting with active and FTE supply equivalent in 2006, by 2025 the projected number of active physicians would exceed projected FTEs by about 26,300 physicians. This means in 2025 the average number of patient care hours worked per physician per year is likely to be 3.5% less than the current average due to changing demographics.
Figure 4. Baseline Projections of Active and FTE Physicians
761,200789,200
869,900900,000
1,000,000
734,900680,500
0
100,000
200,000
300,000
400,000
500,000
600,000
700,000
800,000
2005 2010 2015 2020 2025
Tota
l Phy
sici
ans
Active Supply w/ Residents
Active Supply w/out Residents
FTE Supply w/out Residents
At first, these supply projections may appear as almost inconsequential fractional adjustments, but an additional 26,300 FTE physicians could mean care for millions more Americans. The problem is that demand is projected to grow even more rapidly. Moreover, even moderate growth in supply requires
41 This number differs significantly from other published active physician counts due to adjustments made to the active status of physicians based on the AAMC’s two recent surveys of Physicians Under 50 and Physicians Over 50, as described in the methodology section of this report.
© 2008 AAMC. May not be reproduced without permission. 17

The Complexities of Physician Supply and Demand: Projections Through 2025
substantial inflow to replace the substantial number of currently practicing physicians who will be leaving the workforce over the next twenty years.
Supply projections under the baseline scenario assume the status quo regarding number of new medical school graduates, number of GME slots, as well as physician hours worked and retirement patterns. This scenario also assumes the status quo in number of physicians entering residency programs: 15,500 USMDs, 2,900 DOs, and 6,600 IMGs (for 25,000 total new residents per year). Thus the components of the projected 12% net growth in total number of active physicians from 2006 to 2025 includes an additional 28,900 USMDs (6% growth), 32,900 DOs (79% growth), and 18,900 IMGs (12% growth) (Figure 5). There will be almost five times as many new USMDs as DOs over this time, but so many more USMDs will be leaving active practice that the net growth will be greater for DOs.
Projected growth in FTEs varies by specialty. If specialty choice patterns remain unchanged, growth in total FTEs appears to be largest for specialties in the “medical specialties” categories and declining in surgery (Figure 6), though these are projected to remain the two smallest specialty groups.42 Primary care remains the largest, though it is also projected to begin a decline prior to 2025.
Figure 5. Baseline Projections of Active Physicians (excluding residents)
479,800508,700
41,90074,800
158,800177,700
-
100,000
200,000
300,000
400,000
500,000
600,000
2005 2010 2015 2020 2025
Act
ive
Phys
icia
ns (e
xcl.
resi
dent
s)
680,500
761,200
700,000
800,000Total
MDs
IMGs
DOs
42 The specialty groups (with individual PSDM specialties in parentheses) are general primary care (general and family practice, general internal medicine, and general pediatrics); medical specialties (cardiovascular disease, gastroenterology, internal medicine subspecialties, nephrology, pulmonology, and other medical specialties); surgery (general surgery, obstetrics and gynecology, ophthalmology, orthopedic surgery, otolaryngology, thoracic surgery, urology, and other surgical specialties); and other patient care (anesthesiology, emergency medicine, neurology, pathology, psychiatry, radiology, and other specialties).
© 2008 AAMC. May not be reproduced without permission. 18

The Complexities of Physician Supply and Demand: Projections Through 2025
Specialties
Figure 6. Baseline Projections of FTE Physicians by Specialty Group
272,700256,500
117,600
90,900
138,800142,400
205,700190,800
0
50,000
100,000
150,000
200,000
250,000
300,000
2005 2010 2015 2020 2025
FTE
Phys
icia
ns (e
xcl.
resi
dent
s)
General Primary Care
Other Patient Care
Surgery
Medical Specialties
Demand
Demand for healthcare services is determined by a multitude of factors that include: epidemiological considerations; the decisions of individual patients regarding whether, when, and where to seek care; the decisions of physicians concerning scope of services required to treat their patients; and the ability to substitute between healthcare providers - between physicians in different specialties and between physicians and non-physician clinicians (particularly physician assistants and nurse practitioners).
The key dynamic affecting the future demand for physician services (and thus the future demand for physicians) modeled in the baseline projections is the changing demographic composition of the U.S. population. Health care use is translated into the demand for physician services, and then into demand for physicians. The PSDM thus uses a utilization-based approach to model demand, first estimating and then applying detailed physician-to-population ratios to Census Bureau projections of the future US population. This method extrapolates current healthcare utilization and service delivery patterns into the future. Inefficiencies in the current healthcare system are assumed to persist ad infinitum, and this scenario assumes that growth in the supply of PAs and NPs will be sufficient to allow them to continue providing their current proportion of services.
The ideal utilization-based model requires data on both the patients who receive care and the physicians who provide care to quantify the relationship between use of physician services and demand determinants. Such an ideal data set would include: patient demographics, socioeconomic characteristics, and type of services received; physician specialty and time spent providing care; and information on the role of other clinicians in providing care physician-related care. Unfortunately, such an ideal data set is unavailable, although elements of the necessary information are available through various national surveys and claims databases.
© 2008 AAMC. May not be reproduced without permission. 19

The Complexities of Physician Supply and Demand: Projections Through 2025
Data sources analyzed to determine usage patterns for physician services include:
• 2005 National Ambulatory Medical Care Survey (NAMCS) to estimate utilization of services provided in office visits;
• 2005 National Hospital Ambulatory Medical Care Survey (NHAMCS) to estimate utilization of services provided through hospital emergency and outpatient visits; and
• 2005 Nationwide Inpatient Sample (NIS) to estimate utilization of physician services in hospital inpatient settings.
Total physicians
Under the aforementioned assumptions, demand for physicians is projected to grow 26.3% between 2006 and 2025, from 680,500 to 859,300 FTEs (Figure 7). Most of this projected demand increase is attributable to the projected growth and aging of the population, especially the former (Figure 8). In fact, only about one-third of the projected rise in demand will be attributable to the aging of the population. Most of the increase in demand from the older population will come from the increase in their sheer numbers, rather than the shift in the age structure of the population – at least between now and 2025.43
Figure 7. Baseline Projections of Demand for Physicians
680,500
758,600
796,200 859,300
0
100,000
200,000
300,000
400,000
500,000
600,000
700,000
800,000
900,000
2005 2010 2015 2020 2025
FTE
Phys
icia
ns(e
xcl.
resi
dent
s)
Baseline Demand
43 This is based on modeling demand while holding the age distribution of the population constant, then calculating the difference between that level of projected demand and the baseline. That difference is then attributed to the aging of the population, with demand based on holding the age distribution constant attributed to population growth.
© 2008 AAMC. May not be reproduced without permission. 20

The Complexities of Physician Supply and Demand: Projections Through 2025
Figure 8. Projections of Demand Attributable to Population Growth and Aging
Impact of Population Growth
Impact of Aging
680,000
700,000
720,000
740,000
760,000
780,000
800,000
820,000
840,000
860,000
880,000
2005 2010 2015 2020 2025
Tota
l FTE
Phy
sici
ans
(exc
l res
iden
ts)
© 2008 AAMC. May not be reproduced without permission. 21

The Complexities of Physician Supply and Demand: Projections Through 2025
Specialties
In addition, projected growth in demand varies substantially by specialty group.44 The percent growth in demand is highest for specialties that predominantly serve the elderly. Overall, the rate of growth is largest for medical specialties, followed by surgery, primary care, and the “other patient care” category (Figure 9).
Figure 9. Cumulative Percent Growth in Demand by Specialty Group
0%
10%
20%
30%
40%
50%
60%
2005 2010 2015 2020 2025 2030
Cum
ulat
ive
% In
crea
se in
Dem
and
(rel
ativ
e to
200
6)
General Primary Care Medical Specialties
Surgery Other Patient Care
These specialty-specific projections model only the implications of changing demographics. The assumption is made that in the base year (2006) supply and demand are in equilibrium. Consequently, any shortfall (or surplus) in 2006 is carried forward to future years. Many parts of the U.S. are already underserved. For example, it would require an estimated 8,000 additional primary care physicians to eliminate existing federally designated underserved areas.45
Settings
Projected demand growth also varies across health care delivery settings,46 although the cumulative percentage increase is expected to exceed 25% for all settings. If current patterns continue, the hospital inpatient setting is projected to experience the single greatest rise in demand (36.6%). All the other settings are projected to face increases that, while still substantial, are notably less than the growth in
44 General Primary Care includes General Practice, Family Practice, General Internal Medicine, and Pediatrics. Medical Specialties includes Cardiovascular Disease Specialties, Gastroenterology, Internal Medicine Subspecialties, Nephrology, Pulmonology, and Other Medical Specialties. Surgery includes General Surgery, Ob/Gyn, Ophthalmology, Orthopedic Surgery, Otolaryngology, Thoracic Surgery, Urology, and Other Surgical Specialties. Other Patient Care includes Anesthesiology, Emergency Medicine, Neurology, Pathology, Psychiatry, Radiology, and Other Specialties. 45 Ricketts, Thomas C. 2008. “Toward a New Measure of Medical Underservice: Background and Concepts”. Cecil G. Sheps Center. 46 Settings were defined by the data. See Appendix for details.
© 2008 AAMC. May not be reproduced without permission. 22

The Complexities of Physician Supply and Demand: Projections Through 2025
demand for physicians in inpatient settings. Indeed, surgery is the only other setting with projected cumulative growth in demand that exceeds 25% by 2025. Nonetheless, the projected increase exceeds 20% for every setting.
Figure 10. Cumulative Percent Growth in Demand by Setting
0%
5%
10%
15%
20%
25%
30%
35%
40%
2005 2010 2015 2020 2025
Cum
ulat
ive
% In
crea
se in
Dem
and
(rel
ativ
e to
200
6)
Office
Emergency/Outpatient
Inpatient
Surgery
Other
© 2008 AAMC. May not be reproduced without permission. 23

The Complexities of Physician Supply and Demand: Projections Through 2025
Comparing Supply & Demand
Total physicians
Under the baseline assumptions outlined above, particularly the growth and aging of the population, demand for physician services is projected to grow substantially faster than supply. The result is an anticipated deficit of 124,000 FTE physicians by 2025 (Figure 11).
Figure 11. Baseline Supply and Demand Projections
734,900729,800719,000680,500
758,600
796,200859,300
0
100,000
200,000
300,000
400,000
500,000
600,000
700,000
800,000
900,000
2005 2010 2015 2020 2025
FTE
Phys
icia
ns(e
xcl.
resi
dent
s)
Baseline Supply
Baseline Demand
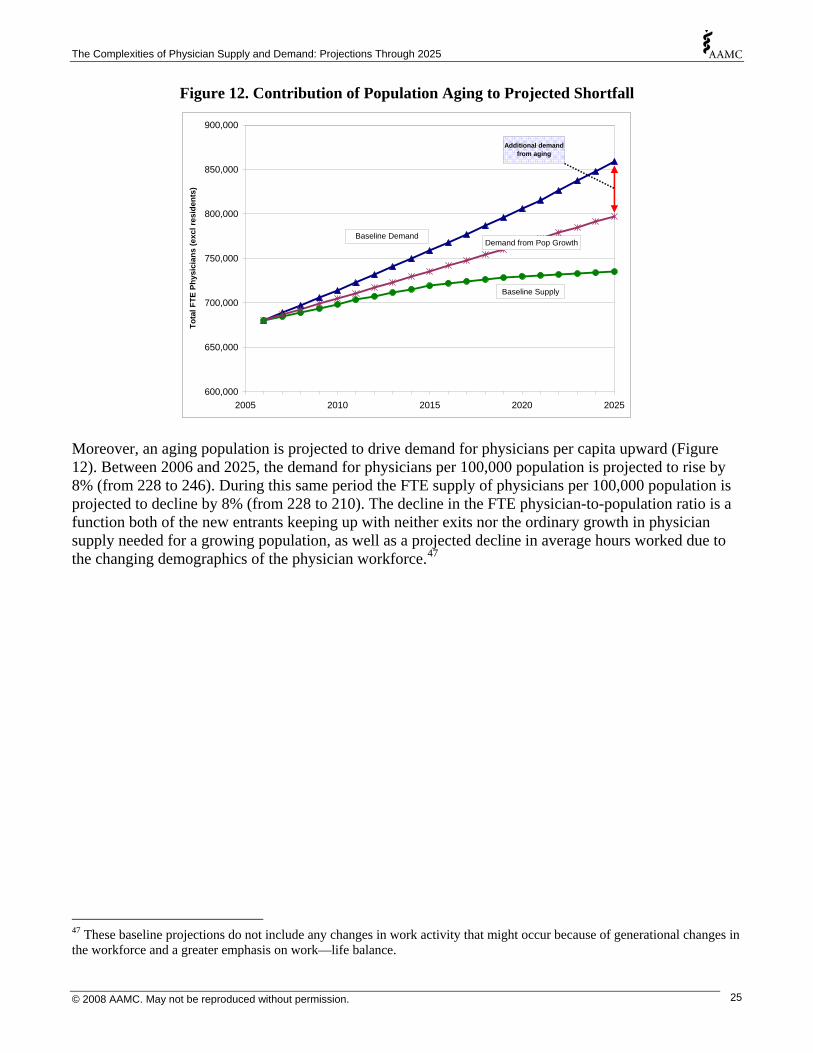
Population growth alone accounts for half of the projected shortfall, but this means that the aging of the population also accounts for half of that gap between projected supply and demand. Consequently, a disproportionate share of any shortage burden may well fall on the older population and the physicians who serve them.
© 2008 AAMC. May not be reproduced without permission. 24
The Complexities of Physician Supply and Demand: Projections Through 2025
Figure 12. Contribution of Population Aging to Projected Shortfall
600,000
650,000
700,000
750,000
800,000
850,000
900,000
2005 2010 2015 2020 2025
Tota
l FTE
Phy
sici
ans
(exc
l res
iden
ts)
Baseline DemandDemand from Pop Growth
Baseline Supply
Additional demand from aging
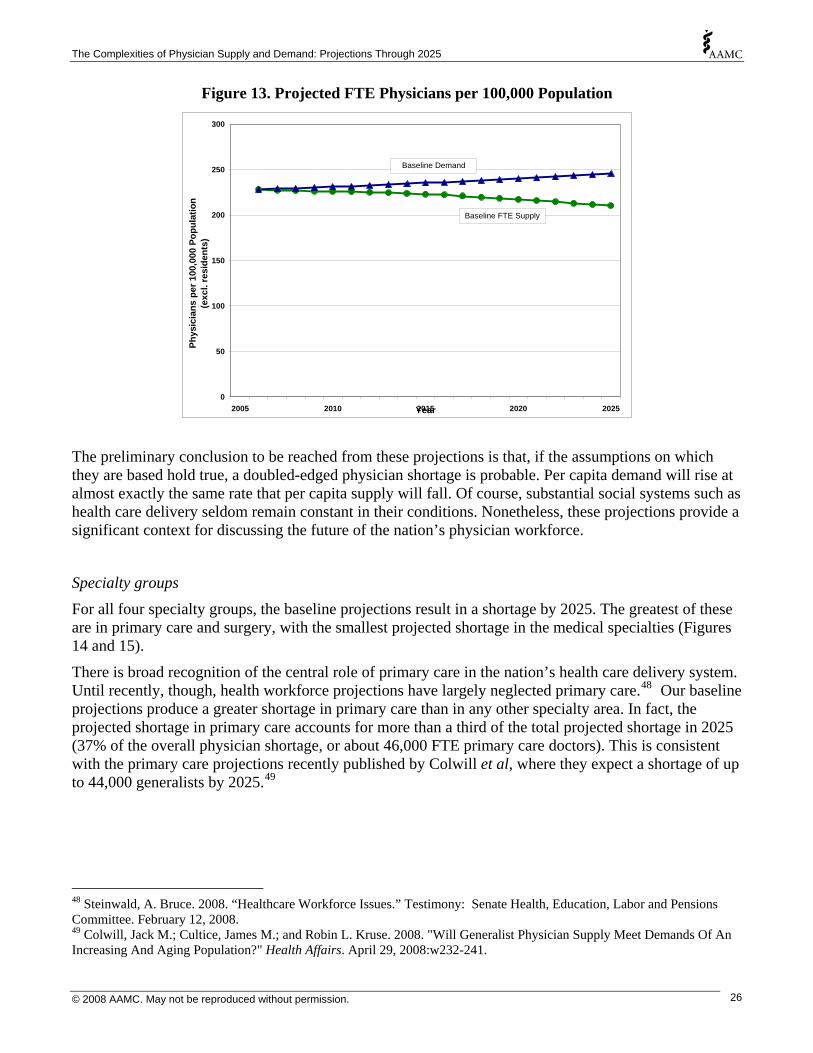
Moreover, an aging population is projected to drive demand for physicians per capita upward (Figure 12). Between 2006 and 2025, the demand for physicians per 100,000 population is projected to rise by 8% (from 228 to 246). During this same period the FTE supply of physicians per 100,000 population is projected to decline by 8% (from 228 to 210). The decline in the FTE physician-to-population ratio is a function both of the new entrants keeping up with neither exits nor the ordinary growth in physician supply needed for a growing population, as well as a projected decline in average hours worked due to the changing demographics of the physician workforce.47
47 These baseline projections do not include any changes in work activity that might occur because of generational changes in the workforce and a greater emphasis on work—life balance.
© 2008 AAMC. May not be reproduced without permission. 25
The Complexities of Physician Supply and Demand: Projections Through 2025
Figure 13. Projected FTE Physicians per 100,000 Population
0
50
100
150
200
250
300
2005 2010 2015 2020 2025Year
Phys
icia
ns p
er 1
00,0
00 P
opul
atio
n(e
xcl.
resi
dent
s)Baseline FTE Supply
Baseline Demand
The preliminary conclusion to be reached from these projections is that, if the assumptions on which they are based hold true, a doubled-edged physician shortage is probable. Per capita demand will rise at almost exactly the same rate that per capita supply will fall. Of course, substantial social systems such as health care delivery seldom remain constant in their conditions. Nonetheless, these projections provide a significant context for discussing the future of the nation’s physician workforce.
Specialty groups
For all four specialty groups, the baseline projections result in a shortage by 2025. The greatest of these are in primary care and surgery, with the smallest projected shortage in the medical specialties (Figures 14 and 15).
There is broad recognition of the central role of primary care in the nation’s health care delivery system. Until recently, though, health workforce projections have largely neglected primary care.48 Our baseline projections produce a greater shortage in primary care than in any other specialty area. In fact, the projected shortage in primary care accounts for more than a third of the total projected shortage in 2025 (37% of the overall physician shortage, or about 46,000 FTE primary care doctors). This is consistent with the primary care projections recently published by Colwill et al, where they expect a shortage of up to 44,000 generalists by 2025.49
48 Steinwald, A. Bruce. 2008. “Healthcare Workforce Issues.” Testimony: Senate Health, Education, Labor and Pensions Committee. February 12, 2008. 49 Colwill, Jack M.; Cultice, James M.; and Robin L. Kruse. 2008. "Will Generalist Physician Supply Meet Demands Of An Increasing And Aging Population?" Health Affairs. April 29, 2008:w232-241.
© 2008 AAMC. May not be reproduced without permission. 26

The Complexities of Physician Supply and Demand: Projections Through 2025
Integral to discussions of primary care is specialty choice. Fewer USMDs are choosing primary care, many because they are opting for specialties that they perceive as offering ‘controllable lifestyles’.50 Accordingly, the composition of primary care residents has shifted. The move away from primary care residencies among USMDs has been offset by IMGs and DOs. From 2002 to 2006, the number of USMDs in primary care residencies dropped by 2,342, while the number of IMGs and DOs in primary care residencies rose 3,116 and 301, respectively.
A reinvigorated emphasis on primary care could have positive effects in all quarters, from patient outcomes to overall physician demand; but how medical students choose their specialty, what drives them into or away from primary care, is all too inadequately understood. Of course, which physicians constitute the primary care workforce is also inadequately understood. Many specialists provide services that could be called primary care, and some general practitioners have areas of specialization.51 Substantial indications of a need to develop better means for integrating primary and specialty care also abound.52 Barriers to such system integrations need to be deconstructed, and an improved understanding of the relationship – at the person level – between the integrated application of basic and specialized knowledge bases developed. Any effort to shed light on specialty choice, the actual scope of the primary care workforce, and integrative arrangements would go far toward improving the delivery of physician services in the U.S., especially since the greatest projected shortage is, in fact, for primary care.
Figure 14. Projected General Primary Care FTE Physicians
0
50,000
100,000
150,000
200,000
250,000
300,000
350,000
2006 2007 2008 2009 2010 2011 2012 2013 2014 2015 2016 2017 2018 2019 2020 2021 2022 2023 2024 2025
FTE
Phys
icia
ns (e
xcl r
esid
ents
)
Demand
Supply
46,000
50 Dorsey, E.R.; Jarjoura, D.; & G.W. Rutecki. 2003. “Influence of Controllable Lifestyle on Recent Trends in Specialty Choice by US Medical Students.” Journal of the American Medical Association. 290: 1173-1178. See also: Ivery, Steve. 2008. “WFU School of Medicine Grads Shun Primary Care.” The Business Journal. May 26, 2008. 51 Colwill, Jack M.; Cultice, James M.; and Robin L. Kruse. 2008. "Will Generalist Physician Supply Meet Demands Of An Increasing And Aging Population?" Health Affairs. April 29, 2008:w232-241. 52 Salsberg, Edward. 2005. "The Need For Real Evidence In Physician Workforce Decision Making." Health Affairs March 15, 2005:w5 115-118.
© 2008 AAMC. May not be reproduced without permission. 27
The Complexities of Physician Supply and Demand: Projections Through 2025
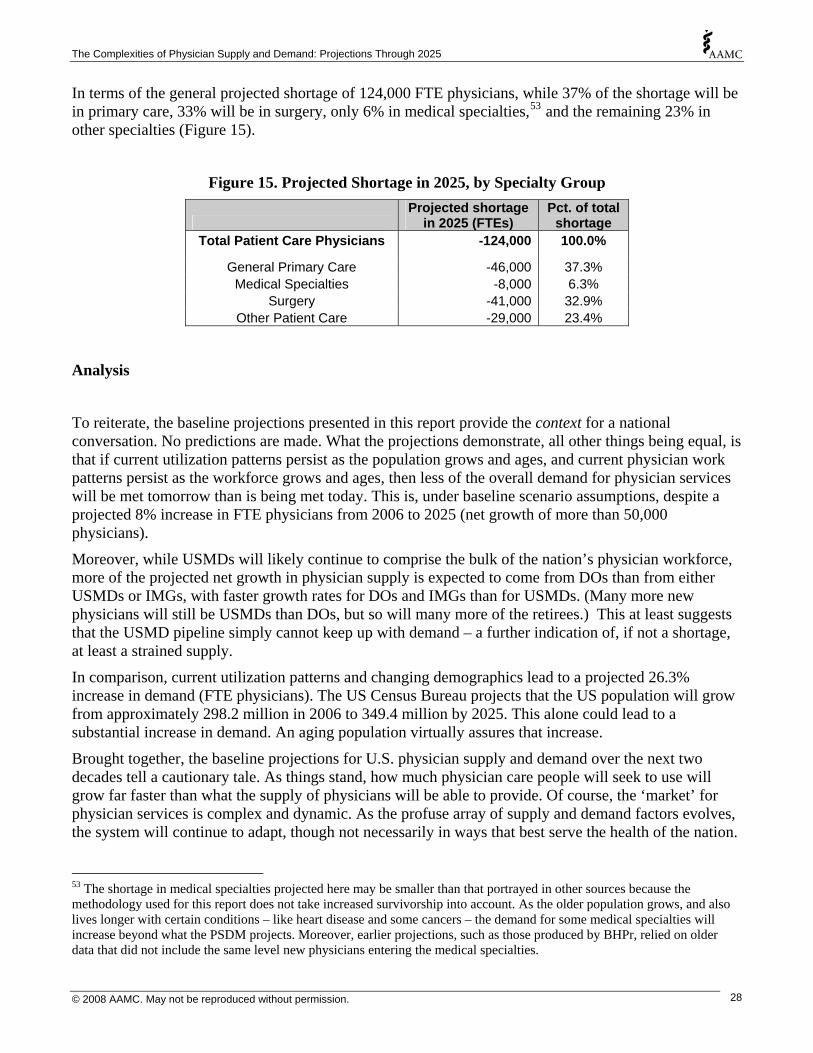
In terms of the general projected shortage of 124,000 FTE physicians, while 37% of the shortage will be in primary care, 33% will be in surgery, only 6% in medical specialties,53 and the remaining 23% in other specialties (Figure 15).
Figure 15. Projected Shortage in 2025, by Specialty Group
Projected shortage
in 2025 (FTEs) Pct. of total
shortage Total Patient Care Physicians -124,000 100.0%
General Primary Care -46,000 37.3% Medical Specialties -8,000 6.3%
Surgery -41,000 32.9% Other Patient Care -29,000 23.4%
Analysis
To reiterate, the baseline projections presented in this report provide the context for a national conversation. No predictions are made. What the projections demonstrate, all other things being equal, is that if current utilization patterns persist as the population grows and ages, and current physician work patterns persist as the workforce grows and ages, then less of the overall demand for physician services will be met tomorrow than is being met today. This is, under baseline scenario assumptions, despite a projected 8% increase in FTE physicians from 2006 to 2025 (net growth of more than 50,000 physicians).
Moreover, while USMDs will likely continue to comprise the bulk of the nation’s physician workforce, more of the projected net growth in physician supply is expected to come from DOs than from either USMDs or IMGs, with faster growth rates for DOs and IMGs than for USMDs. (Many more new physicians will still be USMDs than DOs, but so will many more of the retirees.) This at least suggests that the USMD pipeline simply cannot keep up with demand – a further indication of, if not a shortage, at least a strained supply.
In comparison, current utilization patterns and changing demographics lead to a projected 26.3% increase in demand (FTE physicians). The US Census Bureau projects that the US population will grow from approximately 298.2 million in 2006 to 349.4 million by 2025. This alone could lead to a substantial increase in demand. An aging population virtually assures that increase.
Brought together, the baseline projections for U.S. physician supply and demand over the next two decades tell a cautionary tale. As things stand, how much physician care people will seek to use will grow far faster than what the supply of physicians will be able to provide. Of course, the ‘market’ for physician services is complex and dynamic. As the profuse array of supply and demand factors evolves, the system will continue to adapt, though not necessarily in ways that best serve the health of the nation.
53 The shortage in medical specialties projected here may be smaller than that portrayed in other sources because the methodology used for this report does not take increased survivorship into account. As the older population grows, and also lives longer with certain conditions – like heart disease and some cancers – the demand for some medical specialties will increase beyond what the PSDM projects. Moreover, earlier projections, such as those produced by BHPr, relied on older data that did not include the same level new physicians entering the medical specialties.
© 2008 AAMC. May not be reproduced without permission. 28

The Complexities of Physician Supply and Demand: Projections Through 2025
This complexity argues eloquently against any claims that the solution is simply to produce more physicians. More may be needed, but other changes are needed as well. To be sure, there are some key factors affecting physician supply and demand that need to be explored in greater detail. These include: changing demographics; physician retirement; the structure of physicians’ work; GME growth; the role of PAs and NPs; health insurance coverage; and the economy. Each of these has the potential to shift when, where and under what circumstances the supply and demand for physician services are in agreement – or to what extent they are not.
Limitations of the model
Historically, prospective physician workforce research has assumed the current supply is in balance with demand, and then projected both forward. This assumption is made at the aggregate level and for all individual specialties, though much work – some of it quite recent54 - argues against this for reasons of geographic and specialty-driven diversities in market conditions.
In part, this assumption of equilibrium is a reflection of the complexity of the current health care system and the imperfection of the market for health services. The factors that might be used to adjust away from this assumption are difficult to measure or dubious in their validity or reliability. For instance, physician income may not reflect surplus or shortage because of the influence of third-party payers, particularly Medicare, in setting reimbursement rates. In addition, the many physicians are not ‘employed’ and may alter their work hours or productivity at will, thus creating a labor market where the same ‘supply’ can meet a range of levels of demand.
Assessments of the job market for new physicians are sometimes used to assess demand, but these studies are usually limited to specific geographic regions and, though potentially helpful in defining local conditions, they, too, are impacted by current financing arrangements. Patient or consumer data such as waiting times for appointments have also been used to assess physician supply but are confounded by financial barriers to access. As a result, shortages—or surpluses—may be poorly defined and are often identified by anecdotal evidence rather than a rigorous standard. Moreover, absolute body counts of physicians may not be particularly helpful in areas where physicians are engaged in non-clinical activities.
Nonetheless, the baseline projections – despite their limitations – seem consistent with a growing body of evidence. At least fifteen states have identified geographic areas of relative shortage or expect demand for physician services to outstrip supply in the coming years.55 Some specialties, including cardiology, dermatology, and critical care, have suggested that providers are in short supply at the national level. These studies have usually reflected difficulty in practices or employers recruiting new physicians or significant delays for patients seeking appointments.
It is likely that the nation already has an aggregate shortage of physicians insofar as: (1) no areas or specialties are reporting a current surplus; and (2) at least 30 million Americans live in geographically designated shortage areas. However, the baseline method assumes that nation is in equilibrium at the present time and current physician shortages are not factored into the models.
54 Association of American Medical Colleges. 2007. Recent Studies and Reports on Physician Shortages in the U.S. Center for Workforce Studies. <http://www.aamc.org/workforce/recentworkforcestudies2007.pdf> (Accessed: 2008-April-14.) 55 Association of American Medical Colleges. 2007. Recent Studies and Reports on Physician Shortages in the U.S. Center for Workforce Studies. <http://www.aamc.org/workforce/recentworkforcestudies2007.pdf> (Accessed: 2008-April-14.)
© 2008 AAMC. May not be reproduced without permission. 29

The Complexities of Physician Supply and Demand: Projections Through 2025
In addition, physicians are categorized solely by their self-identified primary specialty. Yet many physicians have secondary specialties where they spend a portion of their time, and the scope of practice overlaps for many specialties. These considerations should be taken into account when assessing the adequacy of supply for individual specialties. Although projections are reported for some specialty groups, the focus of this report is on the adequacy of the overall future physician supply and the policy implications of supply imbalances.
© 2008 AAMC. May not be reproduced without permission. 30

The Complexities of Physician Supply and Demand: Projections Through 2025
Changing Demographics
At the core of all of the issues discussed in this report, and in all of the projections presented, are the changing demographics of the nation. Growth in the representation of women among physicians has been extraordinary, with significant implications for physician supply. In terms of access to care and representation within the medical profession, issues related to race and ethnicity and to geographic location are ongoing and at times seemingly intractable. And the demographic juggernaut that is the aging of the population will likely reshape the supply and demand for everything. Demography may not be destiny, but the two are inextricably linked.
To acknowledge this link, the baseline projections model the key components of demographic change across the U.S. The demand model extrapolates current healthcare utilization and service delivery patterns into the future, based on projected changes in the gender, race and ethnicity, and age composition of the population. Efficiencies and inefficiencies in the current healthcare system are assumed to persist into the future.
The use of detailed physician-to-population ratios for demand, applied to Census Bureau population projections, provides a more accurate adjustment for population demographics than would simply projecting physician-to-population ratios into the future. In 2006 there were an estimated 228 active physicians (excluding residents and fellows) in practice per 100,000 population, which if extrapolated to the projected future US population equates to a 17% growth in demand (or total demand for 797,000 physicians) by 2025, a figure substantially lower than our baseline projection (26% growth in demand).
Supply projections take into account the changing gender and age composition of the physician workforce. Consequently, the FTE supply of physicians is projected to grow slightly more slowly than the actual count of active physicians. By 2025, then, the average number of patient care hours worked per physician per year is likely to be 3.5% less than the current average.
Gender
While the overall population ratio of women to men in the U.S. is not likely to change dramatically over the coming years,56 the gender composition of the older population – and even more so the physician workforce – is likely to have a more than noteworthy effect on both supply and demand in the marketplace for physician services.
Women use physician services differently from men. In all but the earliest years of life, female use of physician services exceeds that for males. This differential is particular noteworthy from 18 to 44 years, but it persists throughout the older age groups too (Figure 16).
56 Bureau of the Census. 2004. “Table 2a. Projected Population of the United States, by Age and Sex: 2000 to 2050.” <http://www.census.gov/ipc/www/usinterimproj/natprojtab02a.pdf> (Accessed: 2008-Mar-4.)
© 2008 AAMC. May not be reproduced without permission. 31

The Complexities of Physician Supply and Demand: Projections Through 2025
Figure 16. Use of FTE Patient Care Physicians (excluding residents) per 100,000 Population, by Age and Sex
0
100
200
300
400
500
600
700
0 to 5 6 to 17 18 to 20 21 to 44 45 to 64 65 to 74 75+
Age
FTE
Phys
icia
n D
eman
d pe
r 100
,000
pop
.
Male Female
Source: Analysis of data from the National Ambulatory Medical Care Survey, National Hospital Ambulatory Medical Care Survey & the Nationwide Inpatient Sample.
Women’s demand for specialties is also different from men’s. In particular, their demand for physicians in the surgery and other patient care specialties (includes emergency medicine, neurology, pathology, and radiology – among others) far exceeds that for men (Figure 17). It may thus be that the projected shortage in surgery would disproportionately affect women. Demand for primary care and medical specialties is much more similar for men and women. The distribution of demand across settings (office, hospital emergency room, etc.) is also quite similar for women and men, albeit higher for women regardless of setting.
Women comprise a larger percentage of the older population than they do of the total, and as the population ages this will have an effect on the entirety of the health care delivery system, most likely including the demand for different types of physician services. For example, amongst those 75 years of age and older, demand for surgery and other patient care physicians is similar for men and women, but women’s demand for primary care is greater – and demand for medical specialties is higher among men (Figure 18).
© 2008 AAMC. May not be reproduced without permission. 32
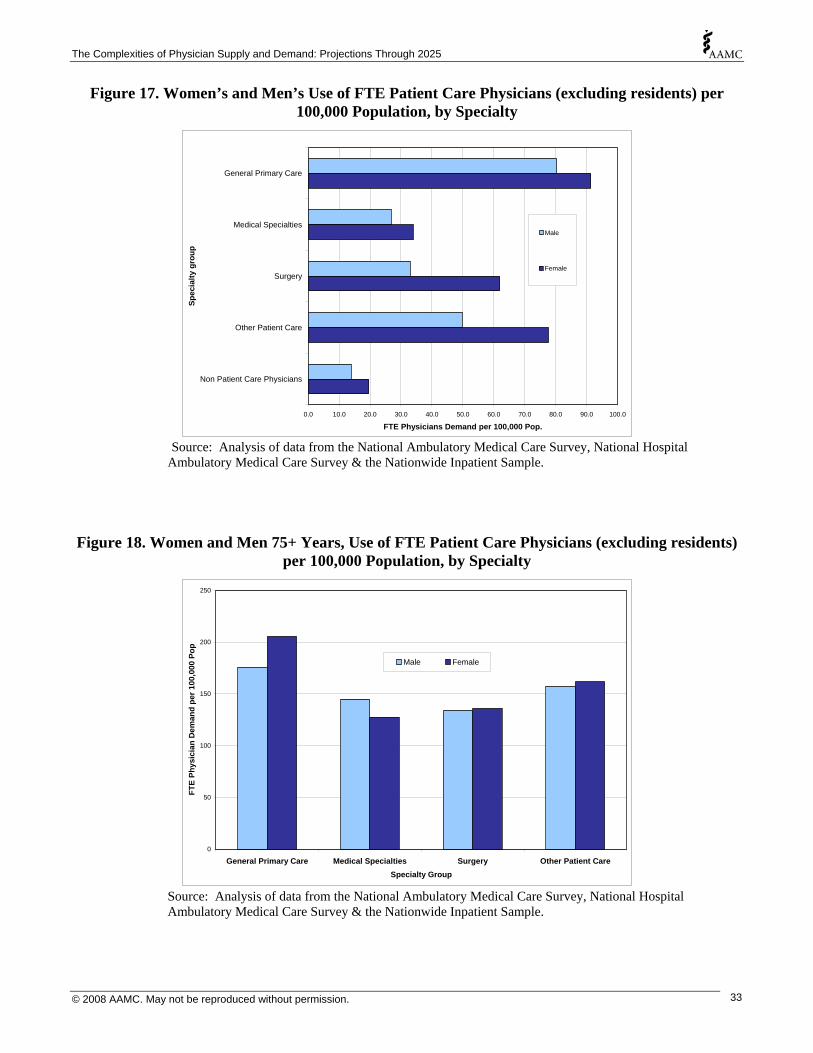
The Complexities of Physician Supply and Demand: Projections Through 2025
Figure 17. Women’s and Men’s Use of FTE Patient Care Physicians (excluding residents) per 100,000 Population, by Specialty
0.0 10.0 20.0 30.0 40.0 50.0 60.0 70.0 80.0 90.0 100.0
General Primary Care
Medical Specialties
Surgery
Other Patient Care
Non Patient Care Physicians
Spec
ialty
gro
up
FTE Physicians Demand per 100,000 Pop.
Male
Female
Source: Analysis of data from the National Ambulatory Medical Care Survey, National Hospital Ambulatory Medical Care Survey & the Nationwide Inpatient Sample.
Figure 18. Women and Men 75+ Years, Use of FTE Patient Care Physicians (excluding residents) per 100,000 Population, by Specialty
0
50
100
150
200
250
General Primary Care Medical Specialties Surgery Other Patient CareSpecialty Group
FTE
Phys
icia
n D
eman
d pe
r 100
,000
Pop
Male Female
Source: Analysis of data from the National Ambulatory Medical Care Survey, National Hospital Ambulatory Medical Care Survey & the Nationwide Inpatient Sample.
© 2008 AAMC. May not be reproduced without permission. 33
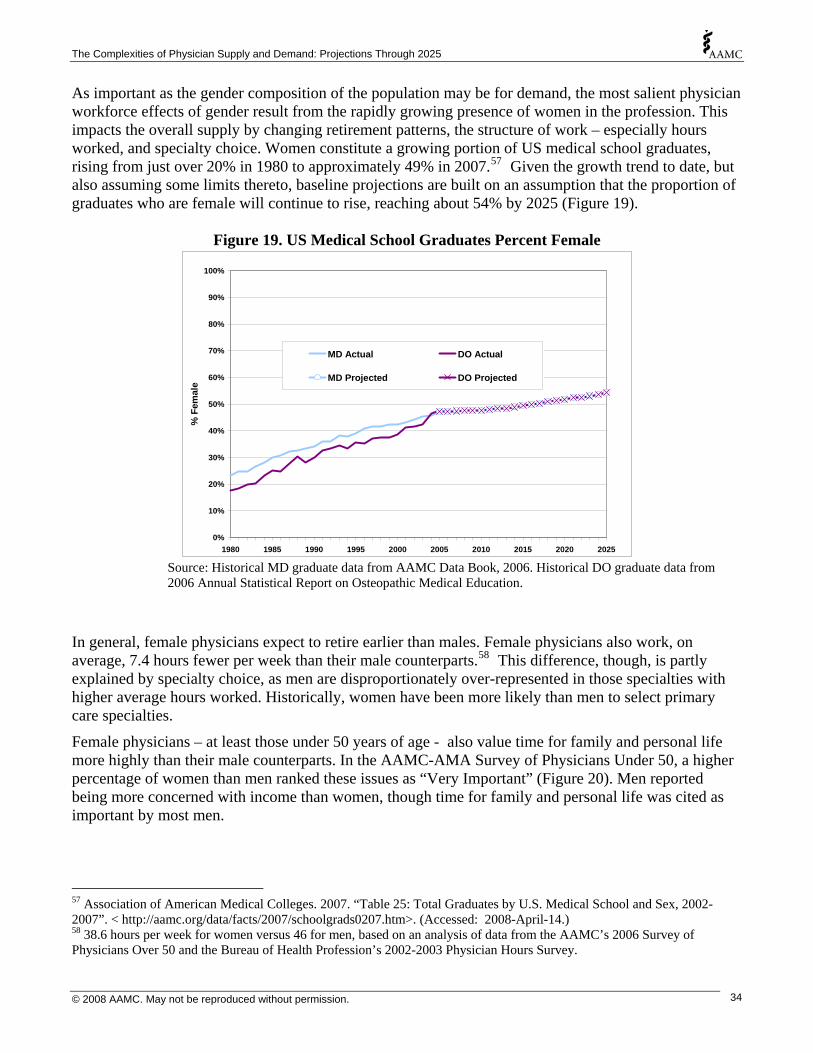
The Complexities of Physician Supply and Demand: Projections Through 2025
As important as the gender composition of the population may be for demand, the most salient physician workforce effects of gender result from the rapidly growing presence of women in the profession. This impacts the overall supply by changing retirement patterns, the structure of work – especially hours worked, and specialty choice. Women constitute a growing portion of US medical school graduates, rising from just over 20% in 1980 to approximately 49% in 2007.57 Given the growth trend to date, but also assuming some limits thereto, baseline projections are built on an assumption that the proportion of graduates who are female will continue to rise, reaching about 54% by 2025 (Figure 19).
Figure 19. US Medical School Graduates Percent Female
0%
10%
20%
30%
40%
50%
60%
70%
80%
90%
100%
1980 1985 1990 1995 2000 2005 2010 2015 2020 2025
% F
emal
e
MD Actual DO Actual
MD Projected DO Projected
Source: Historical MD graduate data from AAMC Data Book, 2006. Historical DO graduate data from 2006 Annual Statistical Report on Osteopathic Medical Education.
In general, female physicians expect to retire earlier than males. Female physicians also work, on average, 7.4 hours fewer per week than their male counterparts.58 This difference, though, is partly explained by specialty choice, as men are disproportionately over-represented in those specialties with higher average hours worked. Historically, women have been more likely than men to select primary care specialties.
Female physicians – at least those under 50 years of age - also value time for family and personal life more highly than their male counterparts. In the AAMC-AMA Survey of Physicians Under 50, a higher percentage of women than men ranked these issues as “Very Important” (Figure 20). Men reported being more concerned with income than women, though time for family and personal life was cited as important by most men.
57 Association of American Medical Colleges. 2007. “Table 25: Total Graduates by U.S. Medical School and Sex, 2002-2007”. < http://aamc.org/data/facts/2007/schoolgrads0207.htm>. (Accessed: 2008-April-14.) 58 38.6 hours per week for women versus 46 for men, based on an analysis of data from the AAMC’s 2006 Survey of Physicians Over 50 and the Bureau of Health Profession’s 2002-2003 Physician Hours Survey.
© 2008 AAMC. May not be reproduced without permission. 34

The Complexities of Physician Supply and Demand: Projections Through 2025
Figure 20. Practice Factors Cited as “Very Important” by Physicians Under 50
Percent "Very Important" Balance Male Female Time for family/personal life 66 82 Flexible scheduling 26 54 No / limited on call 25 44
Minimal practice management
responsibilities 10 18 Career/Income Practice income 43 33 Long term income potential 45 36
Opportunity to advance
professionally 29 27
Source: Analysis of AAMC-AMA Survey of Physicians Under 50. Female physicians are also far more likely to work part-time and to take extended leave. Put together, as women become an increasing presence in the physician workforce, a downward movement in effective supply, given any actual number of physicians, seems likely.
Figure 21. Percent of Physicians Under 50 Reporting Children, Part Time Work, Leave, and Spouse/Partner Working Full Time
0%
10%
20%
30%
40%
50%
60%
70%
80%
Have children Work part time Took 3+ months leave Spouse/Partner works fulltime
Male Female
Source: Analysis of AAMC-AMA Survey of Physicians Under 50.
© 2008 AAMC. May not be reproduced without permission. 35

The Complexities of Physician Supply and Demand: Projections Through 2025
Race and Ethnicity The Census Bureau projects that minority populations will grow at higher rates than the non-Hispanic, white population (Figure 22). Between 2006 and 2025, the non-Hispanic white population is projected to grow by 5% (8.8 million). In contrast, the non-Hispanic black population is projected to grow by 24% (9.3 million); the non-Hispanic other59 population is projected to grow by 59% (12.2 million); and the Hispanic population is projected to grow by 54% (20.9 million).
Figure 22. Cumulative Percent Growth in Population, by Race-Ethnicity (relative to 2006)
0%
10%
20%
30%
40%
50%
60%
2005 2010 2015 2020 2025
Cum
ulat
ive
% In
crea
se
NH Other
Hispanic
NH Black
All
NH White
Source: Analysis of US Census Bureau Population Projections. Note: Data for race and ethnicity groups were aggregated to be consistent with categories available in the utilization data.
Even after controlling for age and gender differences, patterns of physician use differ by race-ethnicity (Figures 23 and 24). Part of this variation can be explained by differences in medical insurance coverage and socioeconomic status; part could be due to community characteristics, care-seeking behaviors and supply-side barriers to services; and part could be due to lack of preventive care or differences in epidemiological needs.60 While demand for office-based care surpasses all other settings across race and ethnicity groups, the demand among non-Hispanic whites for physicians in offices far exceeds that for the other race/ethnicity groups, whereas demand for clinic- and emergency department-based care is highest among non-Hispanic blacks. Demand for different specialties varies little across racial and ethnic groups, with non-Hispanic whites generally using the most and Hispanics using the least. More detail on race and ethnicity, such as is generally available from Census data for Asians, Native Hawaiians and other Pacific
59 See note for Figure 22. 60 Hargraves, J.L. & Jack Hadley. 2003. “The Contribution of Insurance Coverage and Community Resources to Reducing Racial/Ethnic Disparities in Access of Care.” HSR: Health Services Research. 38(3): 809-829.
© 2008 AAMC. May not be reproduced without permission. 36
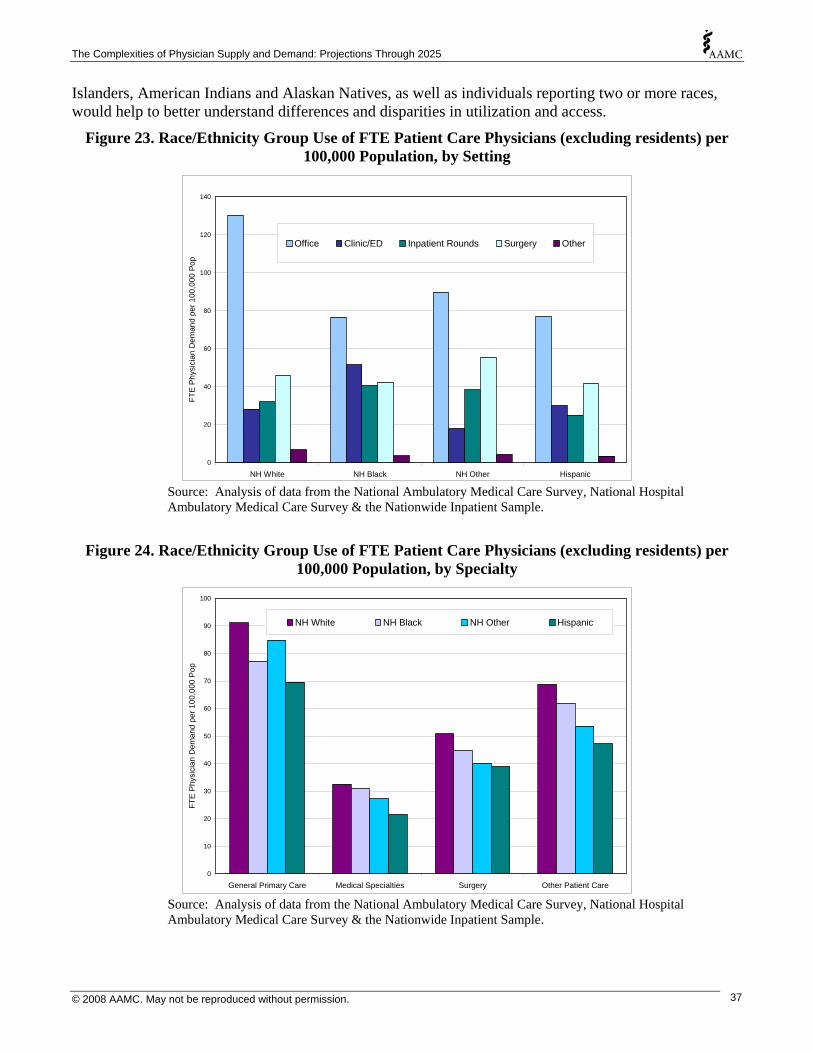
The Complexities of Physician Supply and Demand: Projections Through 2025
Islanders, American Indians and Alaskan Natives, as well as individuals reporting two or more races, would help to better understand differences and disparities in utilization and access.
Figure 23. Race/Ethnicity Group Use of FTE Patient Care Physicians (excluding residents) per 100,000 Population, by Setting
0
20
40
60
80
100
120
140
NH White NH Black NH Other Hispanic
FTE
Phy
sici
an D
eman
d pe
r 100
,000
Pop
Office Clinic/ED Inpatient Rounds Surgery Other
Source: Analysis of data from the National Ambulatory Medical Care Survey, National Hospital Ambulatory Medical Care Survey & the Nationwide Inpatient Sample.
Figure 24. Race/Ethnicity Group Use of FTE Patient Care Physicians (excluding residents) per 100,000 Population, by Specialty
0
10
20
30
40
50
60
70
80
90
100
General Primary Care Medical Specialties Surgery Other Patient Care
FTE
Phy
sici
an D
eman
d pe
r 100
,000
Pop
NH White NH Black NH Other Hispanic
Source: Analysis of data from the National Ambulatory Medical Care Survey, National Hospital Ambulatory Medical Care Survey & the Nationwide Inpatient Sample.
© 2008 AAMC. May not be reproduced without permission. 37

The Complexities of Physician Supply and Demand: Projections Through 2025
Of course, the relationship between the supply and demand for physicians and disparities in utilization and access is complex. As the Hispanic and non-Hispanic Black populations are growing more rapidly than the non-Hispanic white population, and they use fewer services, a lower rate of growth in demand might be expected as larger portions of overall demand come from Hispanics and non-Hispanic Blacks. Ironically, attempts to address disparities could drive utilization-based demand upward, exacerbating existing shortages, even as more need-based demand is being met. Another way to look at this is that disparities in access and use are not adequately handled by a utilization-based projections model that assumes equilibrium as its starting point. As noted earlier, to the extent that shortages already exist, such as where access and utilization are lower than they perhaps ought to be for some racial and ethnic groups, then the shortages projected in this report are conservative: existing shortages would need to be added to projected shortages to paint a more complete picture. So disparities in access and utilization are exerting a dampening effect on projected demand. Thus, to the extent that the resources are devoted to reducing disparities, even more physicians are likely to be needed than is projected in this report.
Figure 27. US Medical School Graduates by Race and Ethnicity, 1980-2004
0
2,000
4,000
6,000
8,000
10,000
12,000
14,000
White Asian Black Hispanic Native American*
1980 2004
Source: Association of American Medical Colleges.61
Note: * For 2004, includes Native American/Alaska Native and Native Hawaiian. For 1980, includes only Native American and Alaska Native.
61 Association of American Medical Colleges. Minorities in Medical Education: Facts & Figures 2005. Association of American Medical Colleges: Washington, DC.
© 2008 AAMC. May not be reproduced without permission. 38
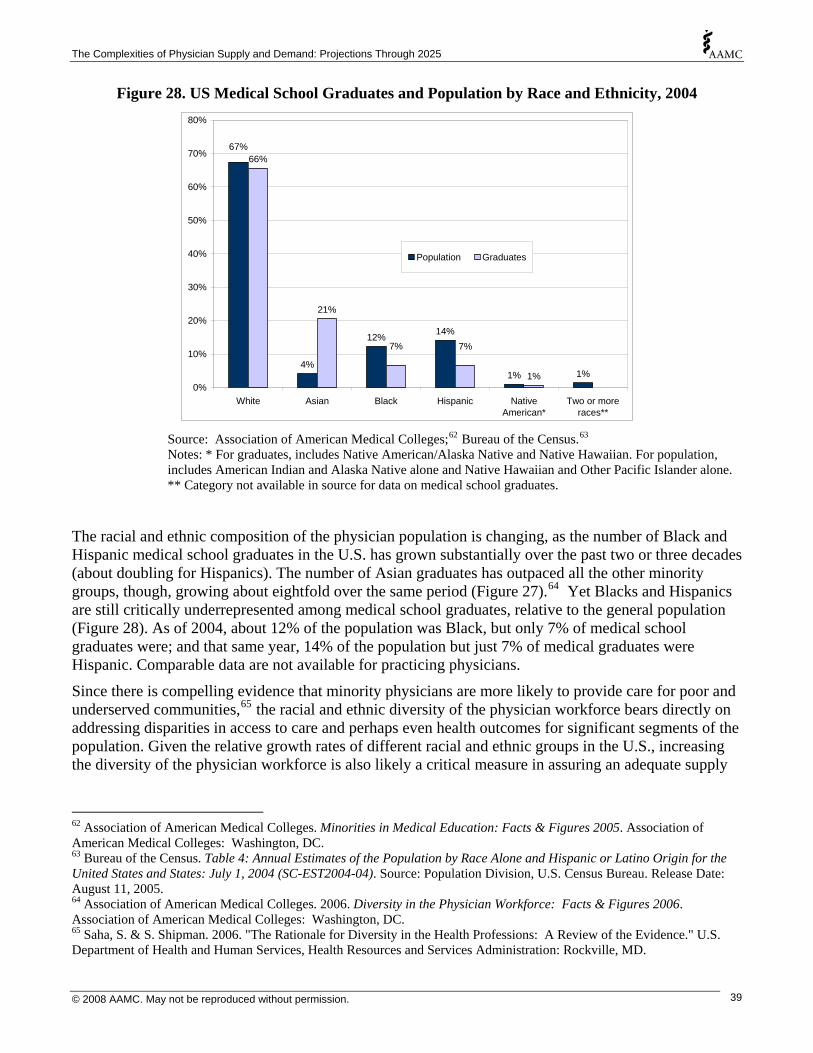
The Complexities of Physician Supply and Demand: Projections Through 2025
Figure 28. US Medical School Graduates and Population by Race and Ethnicity, 2004
4%
12% 14%
1% 1%
66%
21%
1%
67%
7%7%
0%
10%
20%
30%
40%
50%
60%
70%
80%
White Asian Black Hispanic NativeAmerican*
Two or moreraces**
Population Graduates
Source: Association of American Medical Colleges;62 Bureau of the Census.63
Notes: * For graduates, includes Native American/Alaska Native and Native Hawaiian. For population, includes American Indian and Alaska Native alone and Native Hawaiian and Other Pacific Islander alone. ** Category not available in source for data on medical school graduates.
The racial and ethnic composition of the physician population is changing, as the number of Black and Hispanic medical school graduates in the U.S. has grown substantially over the past two or three decades (about doubling for Hispanics). The number of Asian graduates has outpaced all the other minority groups, though, growing about eightfold over the same period (Figure 27).64 Yet Blacks and Hispanics are still critically underrepresented among medical school graduates, relative to the general population (Figure 28). As of 2004, about 12% of the population was Black, but only 7% of medical school graduates were; and that same year, 14% of the population but just 7% of medical graduates were Hispanic. Comparable data are not available for practicing physicians.
Since there is compelling evidence that minority physicians are more likely to provide care for poor and underserved communities,65 the racial and ethnic diversity of the physician workforce bears directly on addressing disparities in access to care and perhaps even health outcomes for significant segments of the population. Given the relative growth rates of different racial and ethnic groups in the U.S., increasing the diversity of the physician workforce is also likely a critical measure in assuring an adequate supply
62 Association of American Medical Colleges. Minorities in Medical Education: Facts & Figures 2005. Association of American Medical Colleges: Washington, DC. 63 Bureau of the Census. Table 4: Annual Estimates of the Population by Race Alone and Hispanic or Latino Origin for the United States and States: July 1, 2004 (SC-EST2004-04). Source: Population Division, U.S. Census Bureau. Release Date: August 11, 2005. 64 Association of American Medical Colleges. 2006. Diversity in the Physician Workforce: Facts & Figures 2006. Association of American Medical Colleges: Washington, DC. 65 Saha, S. & S. Shipman. 2006. "The Rationale for Diversity in the Health Professions: A Review of the Evidence." U.S. Department of Health and Human Services, Health Resources and Services Administration: Rockville, MD.
© 2008 AAMC. May not be reproduced without permission. 39
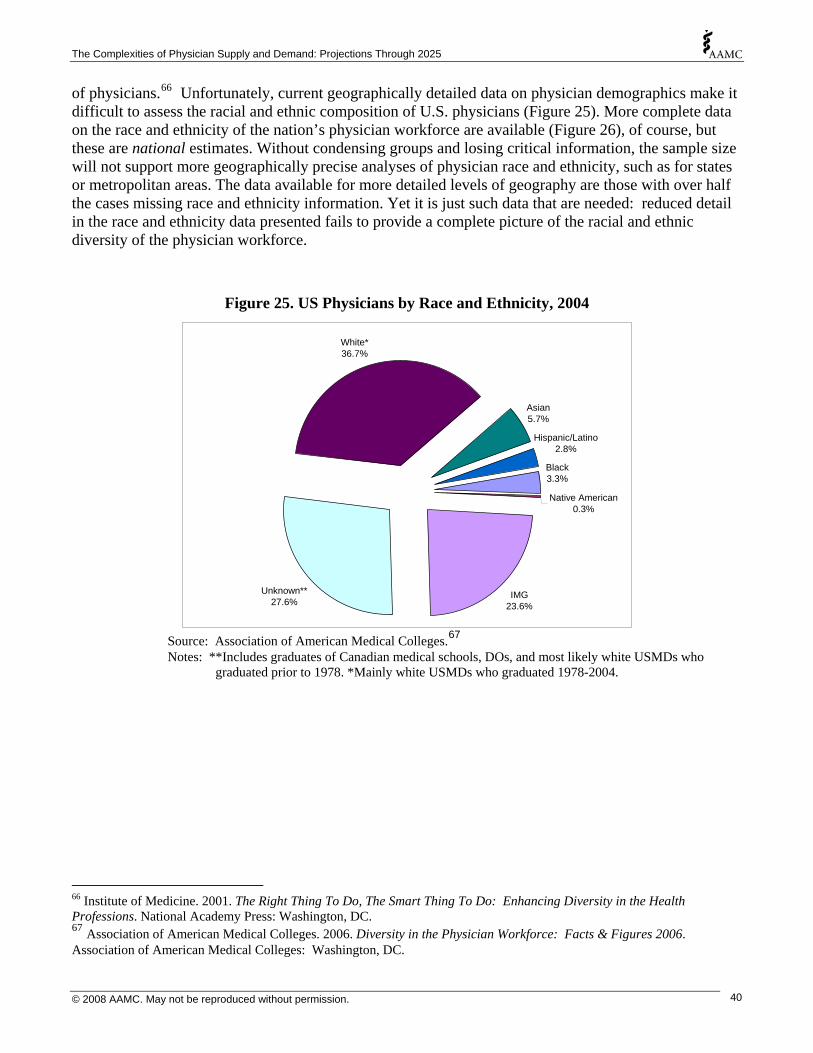
The Complexities of Physician Supply and Demand: Projections Through 2025
of physicians.66 Unfortunately, current geographically detailed data on physician demographics make it difficult to assess the racial and ethnic composition of U.S. physicians (Figure 25). More complete data on the race and ethnicity of the nation’s physician workforce are available (Figure 26), of course, but these are national estimates. Without condensing groups and losing critical information, the sample size will not support more geographically precise analyses of physician race and ethnicity, such as for states or metropolitan areas. The data available for more detailed levels of geography are those with over half the cases missing race and ethnicity information. Yet it is just such data that are needed: reduced detail in the race and ethnicity data presented fails to provide a complete picture of the racial and ethnic diversity of the physician workforce.
Figure 25. US Physicians by Race and Ethnicity, 2004
IMG23.6%
Unknown**27.6%
White*36.7%
Asian5.7%
Hispanic/Latino2.8%
Black3.3%
Native American0.3%
Source: Association of American Medical Colleges.67
Notes: **Includes graduates of Canadian medical schools, DOs, and most likely white USMDs who graduated prior to 1978. *Mainly white USMDs who graduated 1978-2004.
66 Institute of Medicine. 2001. The Right Thing To Do, The Smart Thing To Do: Enhancing Diversity in the Health Professions. National Academy Press: Washington, DC. 67 Association of American Medical Colleges. 2006. Diversity in the Physician Workforce: Facts & Figures 2006. Association of American Medical Colleges: Washington, DC.
© 2008 AAMC. May not be reproduced without permission. 40
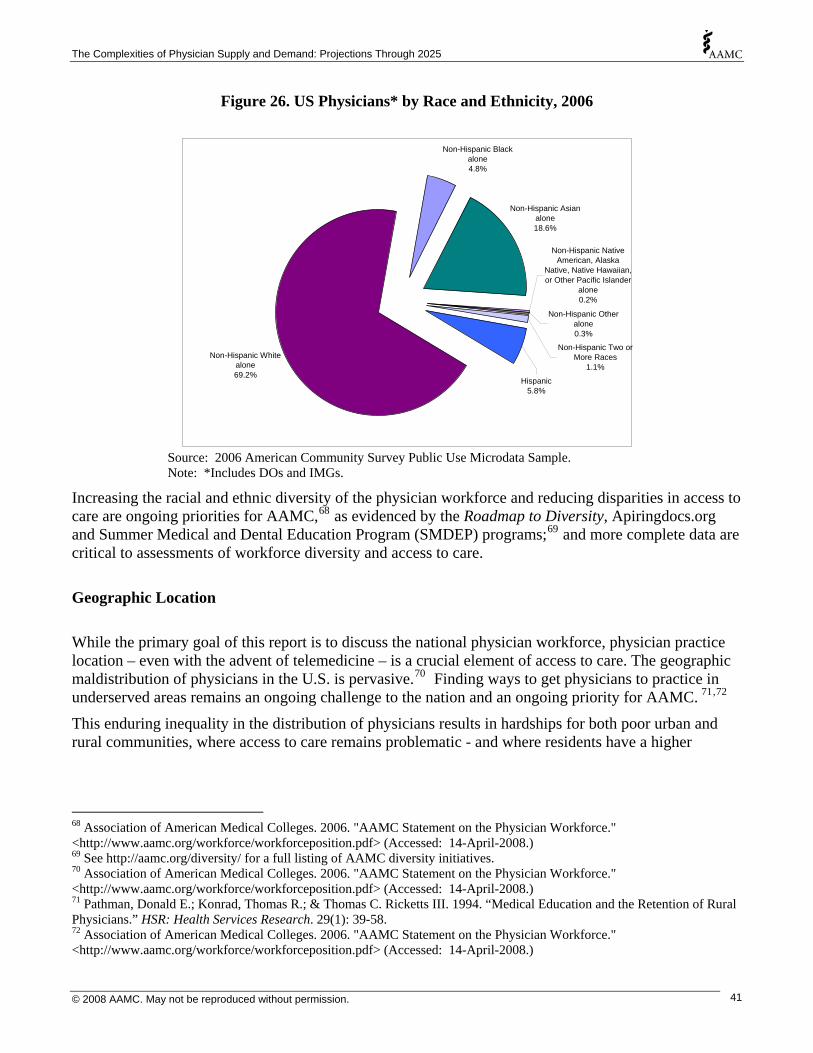
The Complexities of Physician Supply and Demand: Projections Through 2025
Figure 26. US Physicians* by Race and Ethnicity, 2006
Non-Hispanic White alone69.2%
Non-Hispanic Black alone4.8%
Non-Hispanic Asian alone18.6%
Hispanic5.8%
Non-Hispanic Other alone0.3%
Non-Hispanic Two or More Races
1.1%
Non-Hispanic Native American, Alaska
Native, Native Hawaiian, or Other Pacific Islander
alone0.2%
Source: 2006 American Community Survey Public Use Microdata Sample. Note: *Includes DOs and IMGs.
Increasing the racial and ethnic diversity of the physician workforce and reducing disparities in access to care are ongoing priorities for AAMC,68 as evidenced by the Roadmap to Diversity, Apiringdocs.org and Summer Medical and Dental Education Program (SMDEP) programs;69 and more complete data are critical to assessments of workforce diversity and access to care.
Geographic Location
While the primary goal of this report is to discuss the national physician workforce, physician practice location – even with the advent of telemedicine – is a crucial element of access to care. The geographic maldistribution of physicians in the U.S. is pervasive.70 Finding ways to get physicians to practice in underserved areas remains an ongoing challenge to the nation and an ongoing priority for AAMC. 71,72
This enduring inequality in the distribution of physicians results in hardships for both poor urban and rural communities, where access to care remains problematic - and where residents have a higher
68 Association of American Medical Colleges. 2006. "AAMC Statement on the Physician Workforce." <http://www.aamc.org/workforce/workforceposition.pdf> (Accessed: 14-April-2008.) 69 See http://aamc.org/diversity/ for a full listing of AAMC diversity initiatives. 70 Association of American Medical Colleges. 2006. "AAMC Statement on the Physician Workforce." <http://www.aamc.org/workforce/workforceposition.pdf> (Accessed: 14-April-2008.) 71 Pathman, Donald E.; Konrad, Thomas R.; & Thomas C. Ricketts III. 1994. “Medical Education and the Retention of Rural Physicians.” HSR: Health Services Research. 29(1): 39-58. 72 Association of American Medical Colleges. 2006. "AAMC Statement on the Physician Workforce." <http://www.aamc.org/workforce/workforceposition.pdf> (Accessed: 14-April-2008.)
© 2008 AAMC. May not be reproduced without permission. 41

The Complexities of Physician Supply and Demand: Projections Through 2025
incidence of illness and disability.73 For instance, most rural areas are underserved, and most physician shortages are in rural areas. One fifth of the nation’s population resides outside metropolitan areas, but only about one tenth of the nation’s physicians are to be found there.
To make matters worse, recent growth in the physician supply has been decidedly metro-biased.74 This trend shows no signs of changing. As of 2007, 2.9% medical students planned to practice in a small town or rural area.75 Indeed, the shortage of physicians in rural areas persists, even though rural residents generally need more care.76 Primary care doctors, for instance, are less concentrated in rural areas, with only 55 per 100,000 population in 2005 (versus 93 per 100,000 population in urban areas).77 While an equal ratio of physicians to population is not necessarily the ideal, ensuring access to care is - and the dearth of doctors in rural areas renders this problematic. Moreover, in the absence of strong incentives programs, addressing disparities in the distribution of physicians will require increasing the supply of physicians.
Age Just as it is difficult to overstate the significance of population aging, it is difficult to know what its effects will be. As they age, Americans – and Boomers in particular – continually redefine what aging means. Nonetheless, it is already clear from our baseline projections that an aging population will impact both the supply and demand for physicians, and the magnitude of those effects appears substantial. In percentage terms, the elderly population is growing significantly faster than the non-elderly population. Between 2006 and 2025, the overall US population will rise by approximately 51.2 million, with the population under age 65 accounting for only about half of that growth (24.9 million). The fastest growing segment is the oldest, with the population age 75 and older projected to grow 52% (Figure 29).
73 Weil, Thomas P. 1998. “Why Has the US Experienced Such Difficulty? Medical Staffing in Underserved Areas Persists.” Physician Executive. Nov-Dec. 1998. <http://findarticles.com/p/articles/mi_m0843/is_6_24/ai_102273656> (Accessed 2008-Mar-4). 74 Federal Office of Rural Health Policy. 2008. "Facts about... Rural Physicians." <http://www.shepscenter.unc.edu/research_programs/rural_program/phy.html>. (Accessed 2008-Mar-03). 75 Association of American Medical Colleges. 2007. “Association of American Medical Colleges Matriculating Student Questionnaire (MSQ): 2007 All Schools.” < http://www.aamc.org/data/msq/allschoolsreports/msq2007.pdf>. (Accessed 2008-Mar-03). 76 Rabinowitz, Howard K.; Diamond, James J.; Markham, Fred W.; & Jeremy R. Wortman. 2008. “Medical School Programs to Increase the Rural Physician Supply: A Systematic Review and Projected Impact of Widespread Replication.” Academic Medicine. 83(3): 235-239. 77 Steinwald, A. Bruce. 2008. “Healthcare Workforce Issues.” Testimony: Senate Health, Education, Labor and Pensions Committee. February 12, 2008.
© 2008 AAMC. May not be reproduced without permission. 42
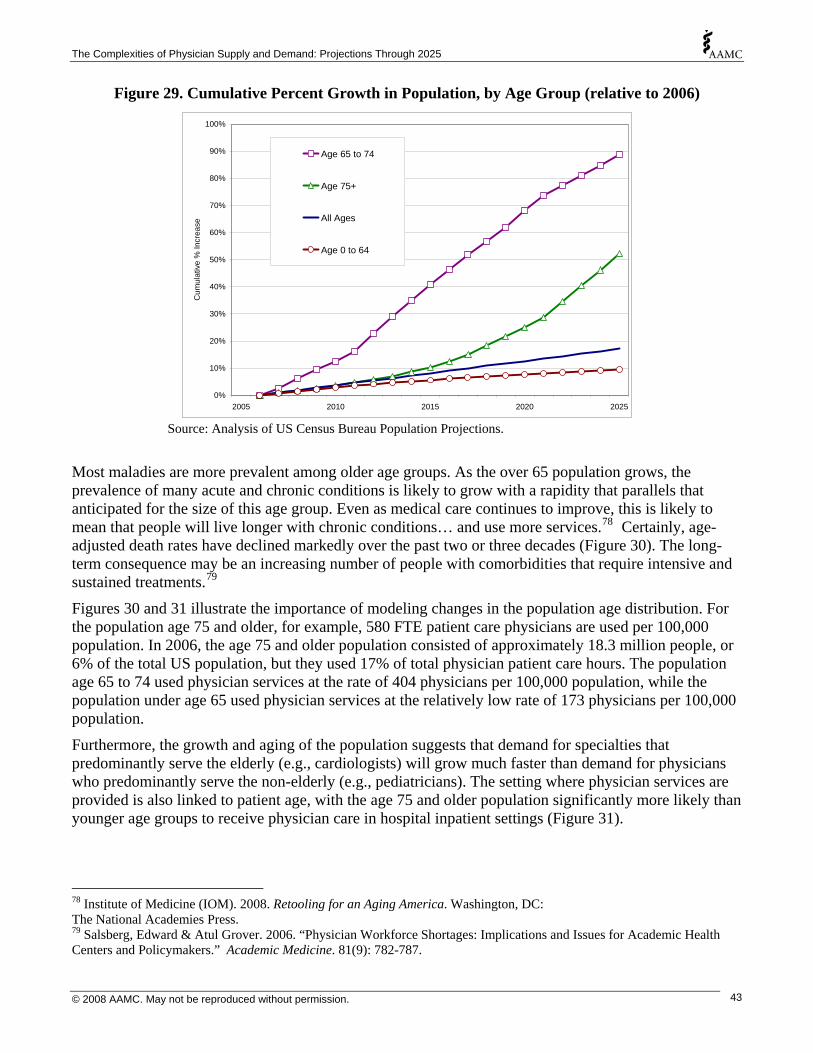
The Complexities of Physician Supply and Demand: Projections Through 2025
Figure 29. Cumulative Percent Growth in Population, by Age Group (relative to 2006)
0%2005 2010 2015 2020 2025
10%
20%
30%
40%
50%
60%
70%
80%
90%
100%
Cum
ulat
ive
% In
crea
se
Age 65 to 74
Age 75+
All Ages
Age 0 to 64
Source: Analysis of US Census Bureau Population Projections.
Most maladies are more prevalent among older age groups. As the over 65 population grows, the prevalence of many acute and chronic conditions is likely to grow with a rapidity that parallels that anticipated for the size of this age group. Even as medical care continues to improve, this is likely to mean that people will live longer with chronic conditions… and use more services.78 Certainly, age-adjusted death rates have declined markedly over the past two or three decades (Figure 30). The long-term consequence may be an increasing number of people with comorbidities that require intensive and sustained treatments.79
Figures 30 and 31 illustrate the importance of modeling changes in the population age distribution. For the population age 75 and older, for example, 580 FTE patient care physicians are used per 100,000 population. In 2006, the age 75 and older population consisted of approximately 18.3 million people, or 6% of the total US population, but they used 17% of total physician patient care hours. The population age 65 to 74 used physician services at the rate of 404 physicians per 100,000 population, while the population under age 65 used physician services at the relatively low rate of 173 physicians per 100,000 population.
Furthermore, the growth and aging of the population suggests that demand for specialties that predominantly serve the elderly (e.g., cardiologists) will grow much faster than demand for physicians who predominantly serve the non-elderly (e.g., pediatricians). The setting where physician services are provided is also linked to patient age, with the age 75 and older population significantly more likely than younger age groups to receive physician care in hospital inpatient settings (Figure 31).
78 Institute of Medicine (IOM). 2008. Retooling for an Aging America. Washington, DC: The National Academies Press. 79 Salsberg, Edward & Atul Grover. 2006. “Physician Workforce Shortages: Implications and Issues for Academic Health Centers and Policymakers.” Academic Medicine. 81(9): 782-787.
© 2008 AAMC. May not be reproduced without permission. 43
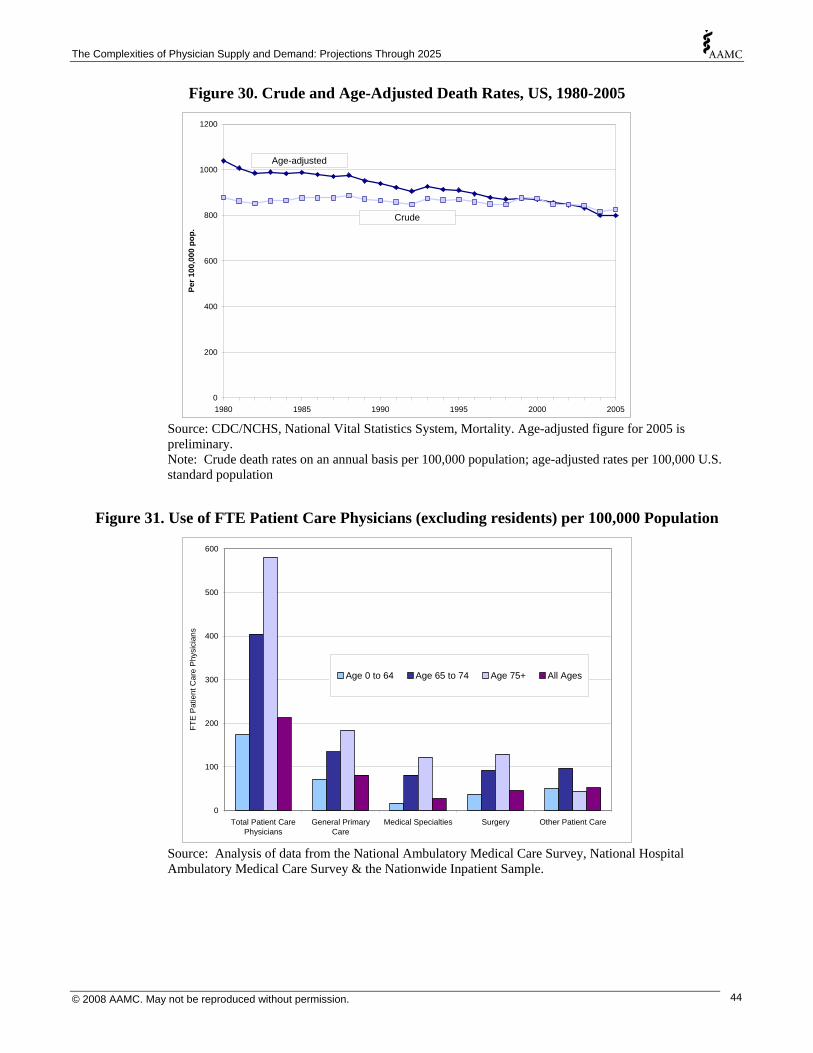
The Complexities of Physician Supply and Demand: Projections Through 2025
Figure 30. Crude and Age-Adjusted Death Rates, US, 1980-2005
0
200
400
600
800
1000
1200
Per 1
00,0
00 p
op.
1980 1985 1990 1995 2000 2005
Age-adjusted
Crude
Source: CDC/NCHS, National Vital Statistics System, Mortality. Age-adjusted figure for 2005 is preliminary. Note: Crude death rates on an annual basis per 100,000 population; age-adjusted rates per 100,000 U.S. standard population
Figure 31. Use of FTE Patient Care Physicians (excluding residents) per 100,000 Population
0
100
200
300
400
500
600
Total Patient Care General Primary Medical Specialties Surgery Other Patient Care
FTE
Pat
ient
Car
e P
hysi
cian
s
Physicians Care
Age 0 to 64 Age 65 to 74 Age 75+ All Ages
Source: Analysis of data from the National Ambulatory Medical Care Survey, National Hospital Ambulatory Medical Care Survey & the Nationwide Inpatient Sample.
© 2008 AAMC. May not be reproduced without permission. 44
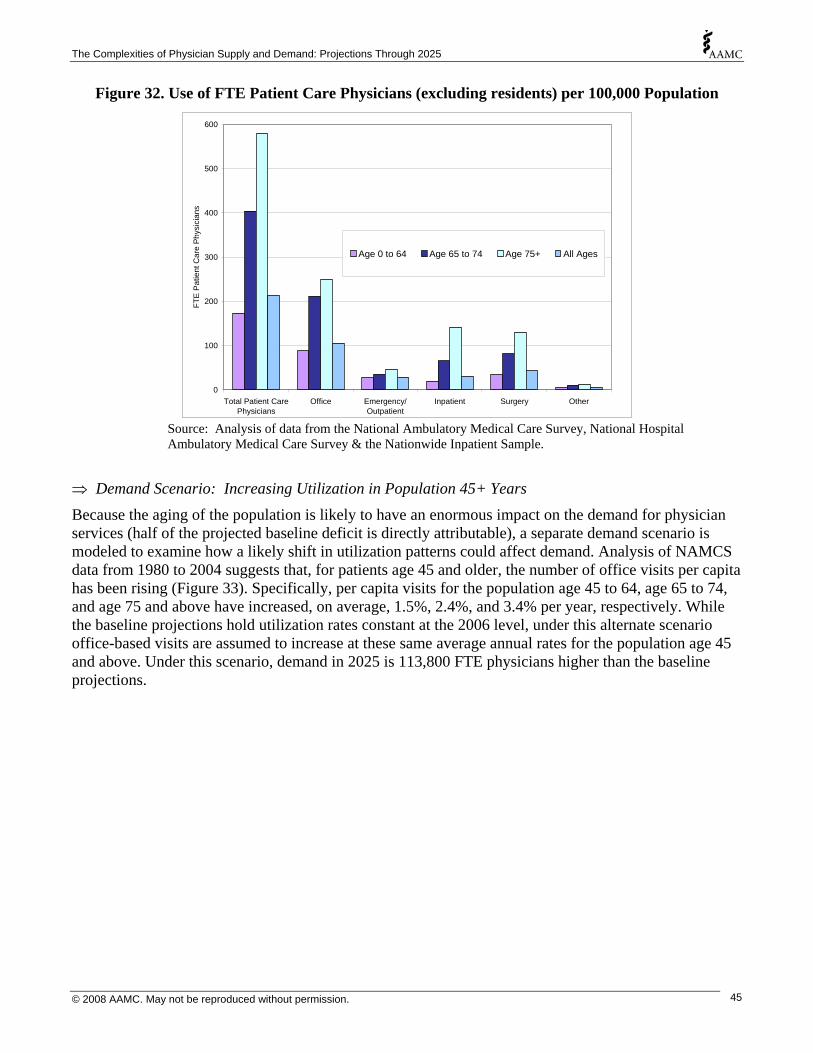
The Complexities of Physician Supply and Demand: Projections Through 2025
Figure 32. Use of FTE Patient Care Physicians (excluding residents) per 100,000 Population
0
100
200
300
400
500
600
FTE
Pat
ient
Car
e P
hysi
cian
s
Total Patient CarePhysicians
Office Emergency/Outpatient
Inpatient Surgery Other
Age 0 to 64 Age 65 to 74 Age 75+ All Ages
Source: Analysis of data from the National Ambulatory Medical Care Survey, National Hospital Ambulatory Medical Care Survey & the Nationwide Inpatient Sample.
⇒ Demand Scenario: Increasing Utilization in Population 45+ Years Because the aging of the population is likely to have an enormous impact on the demand for physician services (half of the projected baseline deficit is directly attributable), a separate demand scenario is modeled to examine how a likely shift in utilization patterns could affect demand. Analysis of NAMCS data from 1980 to 2004 suggests that, for patients age 45 and older, the number of office visits per capita has been rising (Figure 33). Specifically, per capita visits for the population age 45 to 64, age 65 to 74, and age 75 and above have increased, on average, 1.5%, 2.4%, and 3.4% per year, respectively. While the baseline projections hold utilization rates constant at the 2006 level, under this alternate scenario office-based visits are assumed to increase at these same average annual rates for the population age 45 and above. Under this scenario, demand in 2025 is 113,800 FTE physicians higher than the baseline projections.
© 2008 AAMC. May not be reproduced without permission. 45
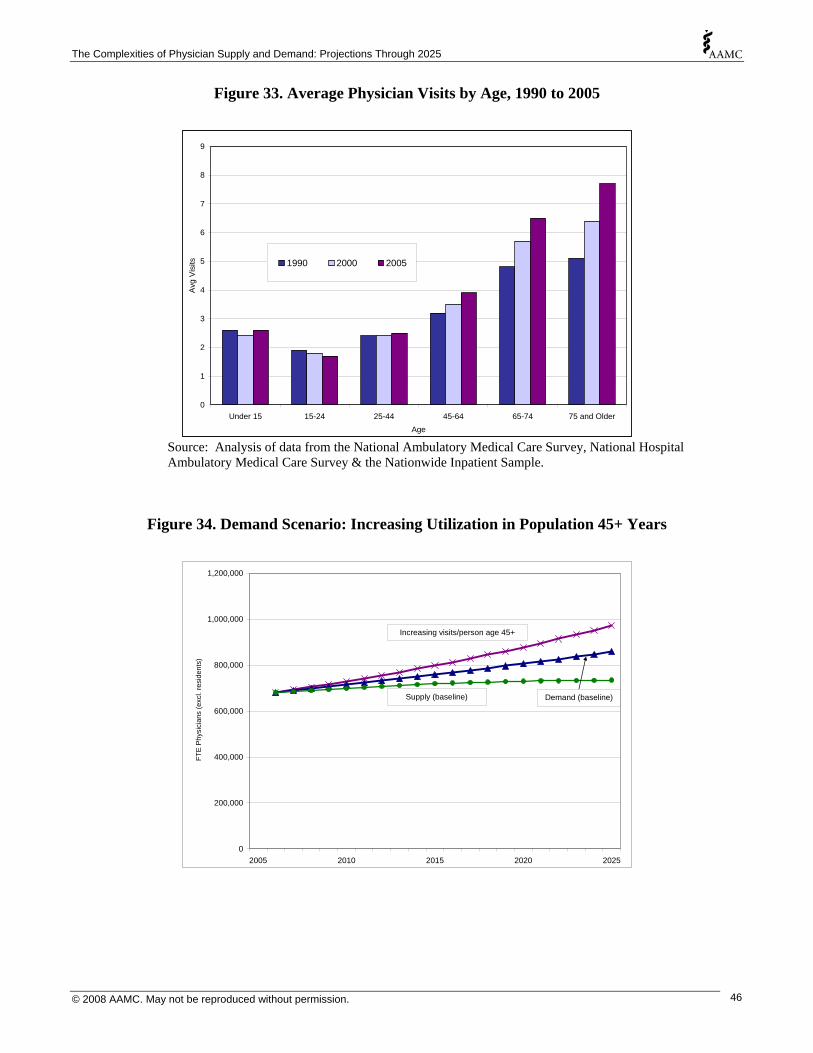
The Complexities of Physician Supply and Demand: Projections Through 2025
Figure 33. Average Physician Visits by Age, 1990 to 2005
0
1
2
3
4
5
6
7
8
9
Under 15 15-24 25-44 45-64 65-74 75 and OlderAge
Avg
Vis
its 1990 2000 2005
Source: Analysis of data from the National Ambulatory Medical Care Survey, National Hospital Ambulatory Medical Care Survey & the Nationwide Inpatient Sample.
Figure 34. Demand Scenario: Increasing Utilization in Population 45+ Years
0
200,000
400,000
600,000
800,000
1,000,000
1,200,000
2005 2010 2015 2020 2025
FTE
Phy
sici
ans
(exc
l. re
side
nts)
Increasing visits/person age 45+
Demand (baseline)Supply (baseline)
© 2008 AAMC. May not be reproduced without permission. 46
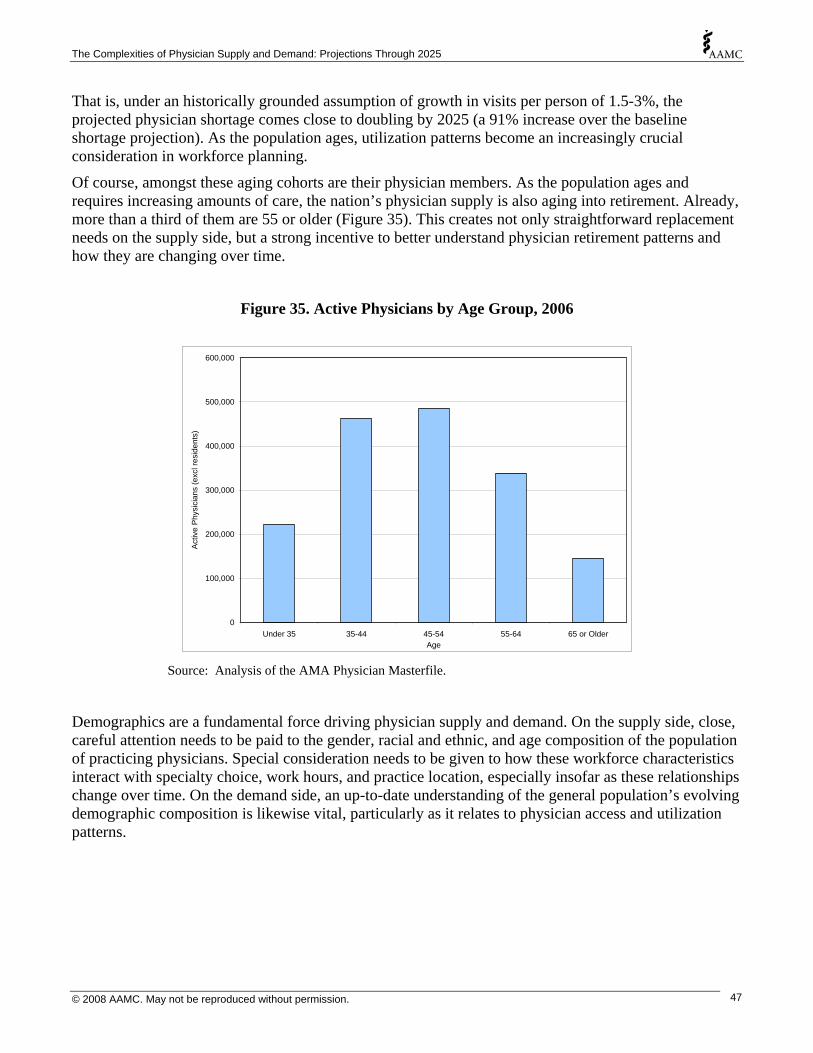
The Complexities of Physician Supply and Demand: Projections Through 2025
That is, under an historically grounded assumption of growth in visits per person of 1.5-3%, the projected physician shortage comes close to doubling by 2025 (a 91% increase over the baseline shortage projection). As the population ages, utilization patterns become an increasingly crucial consideration in workforce planning.
Of course, amongst these aging cohorts are their physician members. As the population ages and requires increasing amounts of care, the nation’s physician supply is also aging into retirement. Already, more than a third of them are 55 or older (Figure 35). This creates not only straightforward replacement needs on the supply side, but a strong incentive to better understand physician retirement patterns and how they are changing over time.
Figure 35. Active Physicians by Age Group, 2006
0
100,000
200,000
300,000
400,000
500,000
600,000
Under 35 35-44 45-54 55-64 65 or OlderAge
Act
ive
Phy
sici
ans
(exc
l res
iden
ts)
Source: Analysis of the AMA Physician Masterfile.
Demographics are a fundamental force driving physician supply and demand. On the supply side, close, careful attention needs to be paid to the gender, racial and ethnic, and age composition of the population of practicing physicians. Special consideration needs to be given to how these workforce characteristics interact with specialty choice, work hours, and practice location, especially insofar as these relationships change over time. On the demand side, an up-to-date understanding of the general population’s evolving demographic composition is likewise vital, particularly as it relates to physician access and utilization patterns.
© 2008 AAMC. May not be reproduced without permission. 47
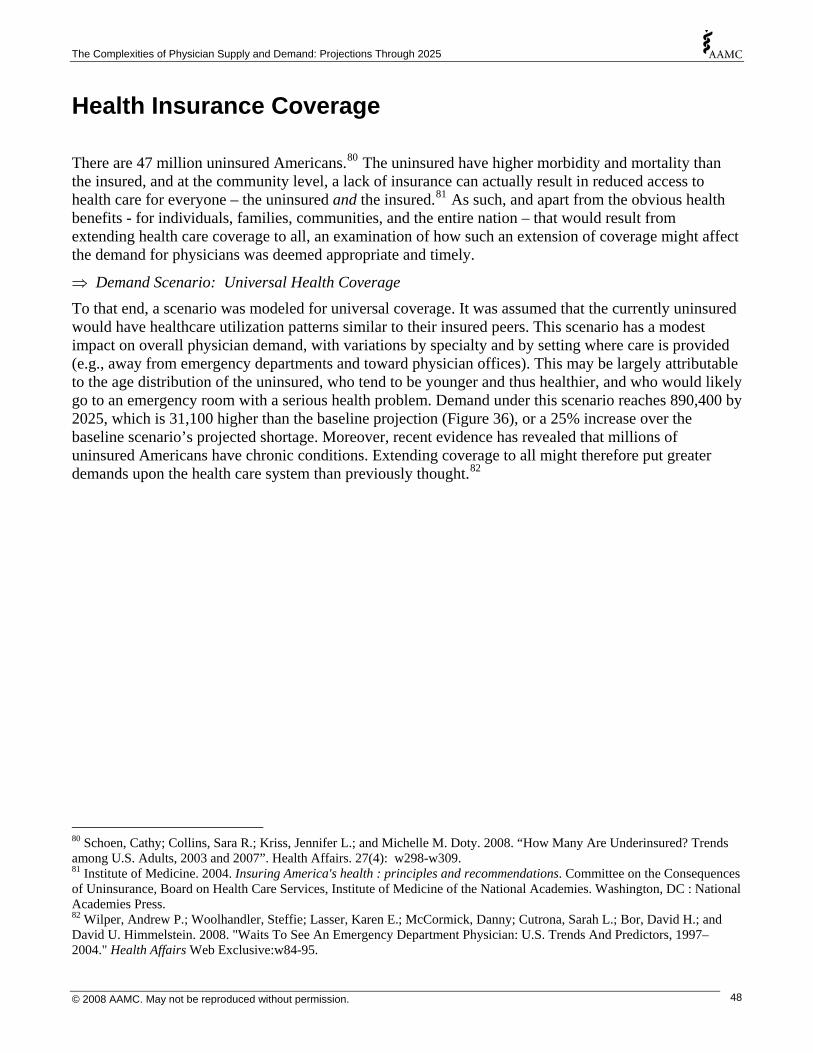
The Complexities of Physician Supply and Demand: Projections Through 2025
Health Insurance Coverage
There are 47 million uninsured Americans.80 The uninsured have higher morbidity and mortality than the insured, and at the community level, a lack of insurance can actually result in reduced access to health care for everyone – the uninsured and the insured.81 As such, and apart from the obvious health benefits - for individuals, families, communities, and the entire nation – that would result from extending health care coverage to all, an examination of how such an extension of coverage might affect the demand for physicians was deemed appropriate and timely.
⇒ Demand Scenario: Universal Health Coverage To that end, a scenario was modeled for universal coverage. It was assumed that the currently uninsured would have healthcare utilization patterns similar to their insured peers. This scenario has a modest impact on overall physician demand, with variations by specialty and by setting where care is provided (e.g., away from emergency departments and toward physician offices). This may be largely attributable to the age distribution of the uninsured, who tend to be younger and thus healthier, and who would likely go to an emergency room with a serious health problem. Demand under this scenario reaches 890,400 by 2025, which is 31,100 higher than the baseline projection (Figure 36), or a 25% increase over the baseline scenario’s projected shortage. Moreover, recent evidence has revealed that millions of uninsured Americans have chronic conditions. Extending coverage to all might therefore put greater demands upon the health care system than previously thought.82
80 Schoen, Cathy; Collins, Sara R.; Kriss, Jennifer L.; and Michelle M. Doty. 2008. “How Many Are Underinsured? Trends among U.S. Adults, 2003 and 2007”. Health Affairs. 27(4): w298-w309. 81 Institute of Medicine. 2004. Insuring America's health : principles and recommendations. Committee on the Consequences of Uninsurance, Board on Health Care Services, Institute of Medicine of the National Academies. Washington, DC : National Academies Press. 82 Wilper, Andrew P.; Woolhandler, Steffie; Lasser, Karen E.; McCormick, Danny; Cutrona, Sarah L.; Bor, David H.; and David U. Himmelstein. 2008. "Waits To See An Emergency Department Physician: U.S. Trends And Predictors, 1997–2004." Health Affairs Web Exclusive:w84-95.
© 2008 AAMC. May not be reproduced without permission. 48

The Complexities of Physician Supply and Demand: Projections Through 2025
Figure 36. Demand Scenario: Universal Health Coverage
0
100,000
200,000
300,000
400,000
500,000
600,000
700,000
800,000
900,000
1,000,000
2005 2010 2015 2020 2025
FTE
Phy
sici
ans
(exc
l. re
side
nts)
Universal coverage
Supply (baseline)Demand (baseline)
There are also an estimated 25 million underinsured Americans.83 Without data on how the underinsured use health care services, incorporating them into the projections was beyond the scope of this report. Nonetheless, this rapidly growing segment of the population virtually guarantees that any changes in the nation’s insurance coverage structures will have even more far-reaching effects than those shown here.
Any emerging shortage of physicians will be exacerbated by an expansion of health insurance coverage. As the nation considers policies to expand coverage, it will also be necessary to address the need for additional physicians if the goal of increased access is to be reached. In Massachusetts, where health insurance coverage has recently been expanded, some of that state’s low income residents have reported increasing difficulty finding a physician or getting an appointment.84
The effects of expanded health insurance coverage, especially to universal coverage, could even have supply side effects as physicians who might have postponed retirement due to insurance concerns would no longer need to consider that factor in setting their retirement timelines. In continuing to track physician demand and supply, also tracking health insurance coverage would be well advised.
83 DeNavas-Walt, Carmen; Proctor, Bernadette D.; & Jessica Smith. 2007. "Income, Poverty, and Health Insurance Coverage in the United States: 2006." US Department of Commerce, Economics and Statistics Administration, Bureau of the Census, Washington, DC. 84 Steinbrook, Robert. 2008. “Health Care Reform in Massachusetts - Expanding Coverage, Escalating Costs”. The New England Journal of Medicine. 358(26): 2757-2760.
© 2008 AAMC. May not be reproduced without permission. 49
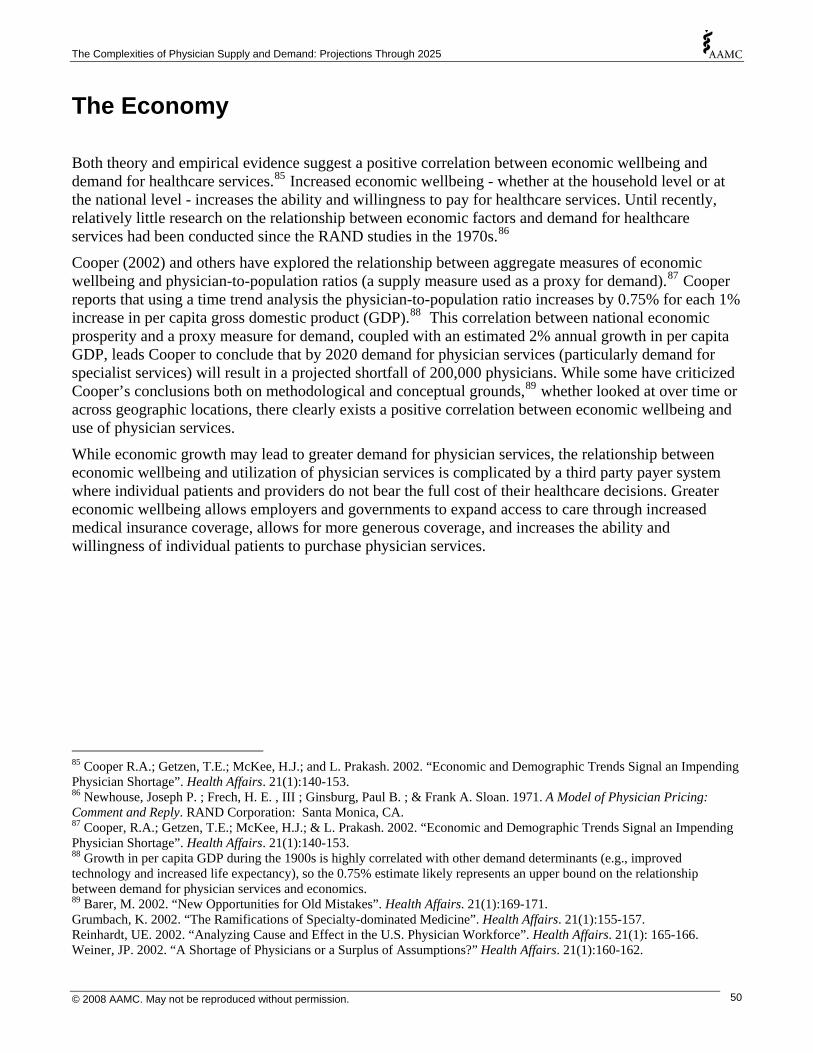
The Complexities of Physician Supply and Demand: Projections Through 2025
The Economy
Both theory and empirical evidence suggest a positive correlation between economic wellbeing and demand for healthcare services.85 Increased economic wellbeing - whether at the household level or at the national level - increases the ability and willingness to pay for healthcare services. Until recently, relatively little research on the relationship between economic factors and demand for healthcare services had been conducted since the RAND studies in the 1970s.86
Cooper (2002) and others have explored the relationship between aggregate measures of economic wellbeing and physician-to-population ratios (a supply measure used as a proxy for demand).87 Cooper reports that using a time trend analysis the physician-to-population ratio increases by 0.75% for each 1% increase in per capita gross domestic product (GDP).88 This correlation between national economic prosperity and a proxy measure for demand, coupled with an estimated 2% annual growth in per capita GDP, leads Cooper to conclude that by 2020 demand for physician services (particularly demand for specialist services) will result in a projected shortfall of 200,000 physicians. While some have criticized Cooper’s conclusions both on methodological and conceptual grounds,89 whether looked at over time or across geographic locations, there clearly exists a positive correlation between economic wellbeing and use of physician services.
While economic growth may lead to greater demand for physician services, the relationship between economic wellbeing and utilization of physician services is complicated by a third party payer system where individual patients and providers do not bear the full cost of their healthcare decisions. Greater economic wellbeing allows employers and governments to expand access to care through increased medical insurance coverage, allows for more generous coverage, and increases the ability and willingness of individual patients to purchase physician services.
85 Cooper R.A.; Getzen, T.E.; McKee, H.J.; and L. Prakash. 2002. “Economic and Demographic Trends Signal an Impending Physician Shortage”. Health Affairs. 21(1):140-153. 86 Newhouse, Joseph P. ; Frech, H. E. , III ; Ginsburg, Paul B. ; & Frank A. Sloan. 1971. A Model of Physician Pricing: Comment and Reply. RAND Corporation: Santa Monica, CA. 87 Cooper, R.A.; Getzen, T.E.; McKee, H.J.; & L. Prakash. 2002. “Economic and Demographic Trends Signal an Impending Physician Shortage”. Health Affairs. 21(1):140-153. 88 Growth in per capita GDP during the 1900s is highly correlated with other demand determinants (e.g., improved technology and increased life expectancy), so the 0.75% estimate likely represents an upper bound on the relationship between demand for physician services and economics. 89 Barer, M. 2002. “New Opportunities for Old Mistakes”. Health Affairs. 21(1):169-171. Grumbach, K. 2002. “The Ramifications of Specialty-dominated Medicine”. Health Affairs. 21(1):155-157. Reinhardt, UE. 2002. “Analyzing Cause and Effect in the U.S. Physician Workforce”. Health Affairs. 21(1): 165-166. Weiner, JP. 2002. “A Shortage of Physicians or a Surplus of Assumptions?” Health Affairs. 21(1):160-162.
© 2008 AAMC. May not be reproduced without permission. 50

The Complexities of Physician Supply and Demand: Projections Through 2025
⇒ Demand Scenario: Economic Growth A scenario was developed to illustrate the potential impact of economic trends under an assumption that per capita GDP, a measure of the nation’s economic wellbeing, will grow by 2% annually.90 Furthermore, physician specialties are placed into one of four categories with respect to how sensitive to economic factors use of their services is expected to be:91
o Each 1% increase in GDP increases physician demand by 1% (elasticity=1.0) - plastic surgery;
o Each 1% increase in GDP increases physician demand by 0.75% (elasticity=0.75) - ophthalmology, orthopedic surgery, “other” surgical specialties, psychiatry, thoracic surgery;
o Each 1% increase in GDP increases physician demand by 0.50% (elasticity=0.5) - anesthesiology, cardiovascular disease, gastroenterology, general surgery, nephrology, neurology, “other” IM subspecialties, “other” medical specialties, “other” specialties, otolaryngology, pathology, pulmonology, radiology, urology; and
o Each 1% increase in GDP increased physician demand by 0.25% (elasticity=0.25) - emergency medicine, general and family practice, general internal medicine, general pediatrics, obstetrics and gynecology.
Economic growth is fueled by increases in national productivity, and this model illustrates the potential impact of economic growth in the absence of increased physician productivity that would help offset the impact of growth in demand for services. This scenario produces the largest growth in demand, reaching 1,024,400 physicians by 2025 (Figure 37).
Compared to the baseline supply projections, this would produce a shortfall of close to 290,000 physicians (well over twice the shortage projected in the baseline scenario). Hence while the confounding and ameliorating factors involved in the economy-physician demand relationships are undoubtedly numerous - continuing to track the proximity of trends in the two would be prudent, given the potential implications for demand. Further work in examining this relationship for specialties could also prove fruitful.
90 The Congressional Budget Office (CBO) projects that between 2007 and 2017 the national’s GDP will increase on average by 2.7% annually (fluctuating between 2.1% and 3.2). Available at http://www.cbo.gov/budget/data/econproj.xls, last accessed October 18, 2007. Taking into US population growth, this translates into an average growth in GDP pre capita of approximately 2% per year. 91 Some specialties are likely more sensitive to economic well being than are other specialties, with specialties providing significant amounts of elective care (e.g., plastic surgeons) more sensitive to economic fluctuations than are specialties providing less elective care (e.g., emergency physicians).
© 2008 AAMC. May not be reproduced without permission. 51
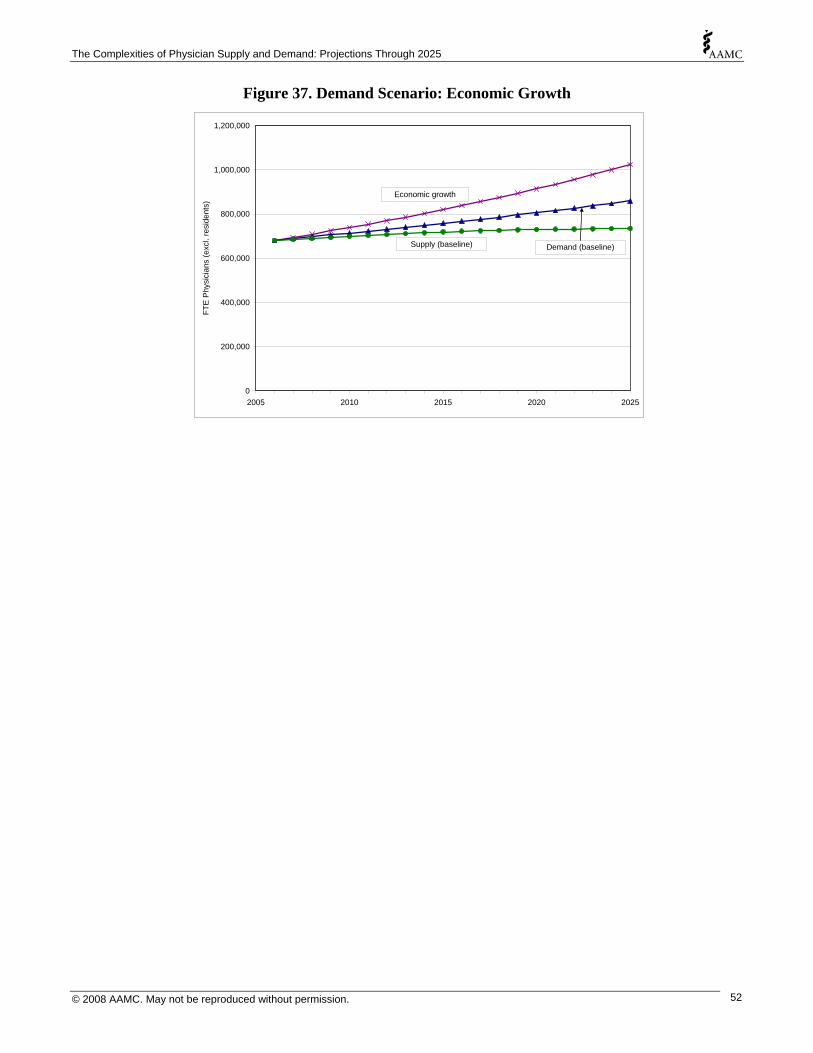
The Complexities of Physician Supply and Demand: Projections Through 2025
Figure 37. Demand Scenario: Economic Growth
0
200,000
400,000
600,000
800,000
1,000,000
1,200,000
2005 2010 2015 2020 2025
FTE
Phy
sici
ans
(exc
l. re
side
nts)
Economic growth
Supply (baseline) Demand (baseline)
© 2008 AAMC. May not be reproduced without permission. 52
The Complexities of Physician Supply and Demand: Projections Through 2025
Retirement
Despite its importance in modeling physician supply, physician retirement patterns have received relatively little attention. As the population ages, and so does the nation’s supply of physicians, physician retirement becomes a paramount concern. Physician age and gender are correlated with probability of leaving the workforce and with average hours worked.92 The age and gender composition of the current workforce, therefore, is considerable in its consequences for future supply.
In 2006 there were an estimated 561,300 male and 227,900 female active physicians. Reflecting the rising percentage of new medical school graduates who are women, the age distribution of female physicians is considerably younger than the age distribution of males (Figure 38). Thus the large majority of active physicians nearing retirement are men.
Figure 38. Age Distribution of Current Physician Workforce
0
5,000
10,000
15,000
20,000
25,000
30,000
25 32 39 46 53 60 67 74Age
Act
ive
Phy
sici
ans
Male
Female
Source: Analysis of the AMA Physician Masterfile.
Analysis of AAMC survey data finds that although female physicians expect to retire earlier than their male colleagues, male and female physicians have similar historical retirement patterns (Figure 39). Women have lower mortality rates than men, so overall attrition rates based on intention to retire are similar for men and women but overall attrition rates based on historical retirement patterns are lower for women than for men.
92 Analysis of data from the AAMC’s surveys of Physicians Under 50 and Physicians Over 50, and the Bureau of Health Professions’ Physician Hours Survey.
© 2008 AAMC. May not be reproduced without permission. 53
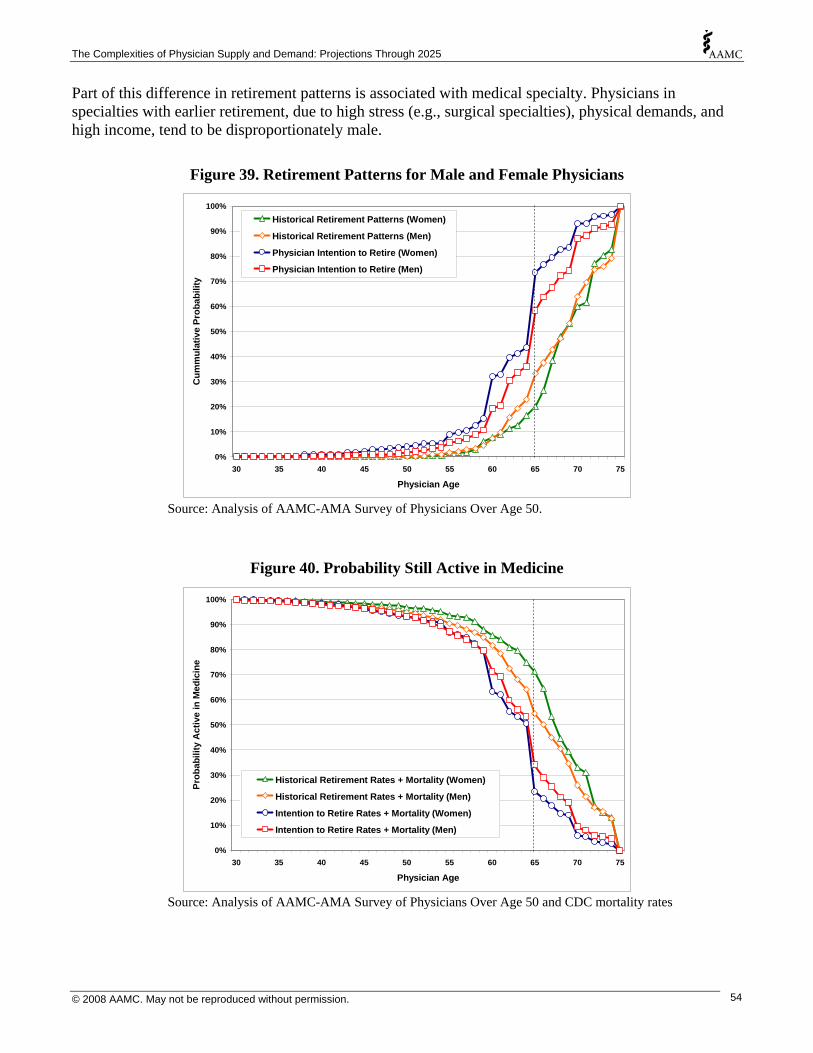
The Complexities of Physician Supply and Demand: Projections Through 2025
Part of this difference in retirement patterns is associated with medical specialty. Physicians in specialties with earlier retirement, due to high stress (e.g., surgical specialties), physical demands, and high income, tend to be disproportionately male.
Figure 39. Retirement Patterns for Male and Female Physicians
0%
10%
20%
30 35 40 45 50 55 60 65 70 75
Cum
mul
ativ
e Pr
obab
ility
30%
40%
50%
60%
70%
80%
90%
100%
Physician Age
Historical Retirement Patterns (Women)
Historical Retirement Patterns (Men)
Physician Intention to Retire (Women)
Physician Intention to Retire (Men)
Source: Analysis of AAMC-AMA Survey of Physicians Over Age 50.
Figure 40. Probability Still Active in Medicine
0%
10%
20%
30%
40%
50%
60%
70%
80%
90%
100%
30 35 40 45 50 55 60 65 70 75
Physician Age
Prob
abili
ty A
ctiv
e in
Med
icin
e
Historical Retirement Rates + Mortality (Women)
Historical Retirement Rates + Mortality (Men)
Intention to Retire Rates + Mortality (Women)
Intention to Retire Rates + Mortality (Men)
Source: Analysis of AAMC-AMA Survey of Physicians Over Age 50 and CDC mortality rates
© 2008 AAMC. May not be reproduced without permission. 54

The Complexities of Physician Supply and Demand: Projections Through 2025
Based on historical retirement rates combined with mortality risk, by age 65 approximately 70% of female physicians and 55% of male physicians are still active (Figure 40). The percent active declines precipitously between age 65 and 70. Using intention to retire ages derived from the AAMC-AMA Survey of Physicians Over Age 50, combined with mortality risk, approximately 34% of males and 23% of females will still be active at age 65. This suggests that current physicians may retire earlier than historical precedent would otherwise suggest.
The baseline supply projection uses historical retirement patterns. If newer cohorts of physicians value time with family and a more even work-life balance, then they may retire earlier. Time with family and wanting to do other things are prime drivers, beyond financial considerations, in making the retirement decision. Since recent AAMC data on intention to retire may indicate such a shift in actual retirement patterns, an alternate retirement scenario based on earlier exits from the workforce was modeled.
⇒ Supply Scenario: Physicians Retire Two Years Earlier This scenario uses the same GME assumptions as the baseline, but with physicians retiring two years earlier than suggested by historical patterns. It produces overall attrition patterns that are similar to attrition patterns based on physician intention to retire as reported in the AAMC-AMA Survey of Physicians Over Age 50. Instead of half of all physicians retiring by age 66, half of all physicians retire by age 64, demonstrating the impact on physician supply projections if physicians retire early. Under this scenario the total FTE supply of physicians grows to 701,300 by 2025 (33,600 below baseline) (Figure 41).
⇒ Supply Scenario: Physicians Retire Two Years Later Some evidence indicates that successive generations will work longer, especially the well-educated.93 As a matter of fact, Boomers are generally expected to work longer than their labor force predecessors.94 So an alternate scenario in which physicians retire later than historical precedent would suggest was also modeled.
This second alternate retirement scenario assumes that physicians retire two years later than suggested by historical patterns. Under this scenario half of all physicians retire by age 68. This scenario shows how supply projections could change if in the future physicians work more years than historical patterns - e.g., if increased longevity or rising age thresholds for government retirement programs delay physician retirement decisions compared to historical patterns. Under this scenario the total FTE supply of physicians grows to 764,300 by 2025 (29,400 above baseline) (Figure 41).
93 National Institute on Aging. 2007. Growing Older in America: The Health and Retirement Study. National Institute on Aging, National Institutes of Health, U.S. Department of Health and Human Services: Bethesda, MD. 94 National Institute on Aging. 2007. Growing Older in America: The Health and Retirement Study. National Institute on Aging, National Institutes of Health, U.S. Department of Health and Human Services: Bethesda, MD.
© 2008 AAMC. May not be reproduced without permission. 55

The Complexities of Physician Supply and Demand: Projections Through 2025
Figure 41. Supply Scenarios: Physicians Retire Two Years Earlier or Later
0
100,000
200,000
300,000
400,000
500,000
600,000
700,000
800,000
900,000
1,000,000
2005 2010 2015 2020 2025
FTE
Phy
sici
ans
(exc
l. re
side
nts)
Demand (baseline)
Supply (retire 2 years later)
Supply (baseline)
Supply (retire 2 years earlier)
At first, it may seem that a shift in retirement patterns would make little difference in the nation’s supply of physicians. Indeed, under either of the scenarios presented here, the change – by as far out as 2025 – is less than 5%. However, in each case the projected difference in supply is large relative to the projected shortage. If physicians retire two years earlier, the projected shortage is 27% greater than the baseline. If they retire later, the projected shortage drops by 24%. Moreover, if physicians begin retiring later, in response to economic pressures or for other reasons, this could delay the appearance of any latent shortages - potentially by several years. The lesson is that physician retirement patterns matter, and bear watching. Given the large cohort of physicians approaching retirement age, tracking retirement patterns is vital. In addition, a better understanding of the details of retirement patterns, by geography and specialty, for instance, seems warranted – as rural doctors may retire later or specialties that treat a disproportionate share of the older population may retire early.
© 2008 AAMC. May not be reproduced without permission. 56
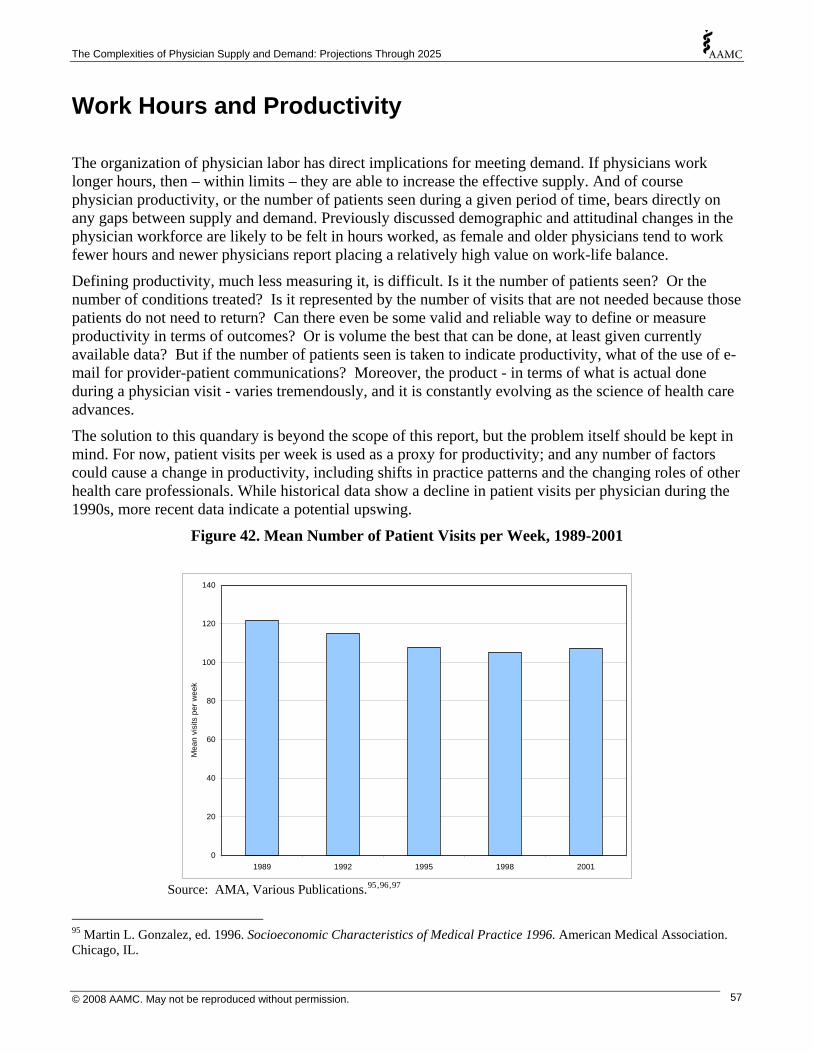
The Complexities of Physician Supply and Demand: Projections Through 2025
Work Hours and Productivity
The organization of physician labor has direct implications for meeting demand. If physicians work longer hours, then – within limits – they are able to increase the effective supply. And of course physician productivity, or the number of patients seen during a given period of time, bears directly on any gaps between supply and demand. Previously discussed demographic and attitudinal changes in the physician workforce are likely to be felt in hours worked, as female and older physicians tend to work fewer hours and newer physicians report placing a relatively high value on work-life balance.
Defining productivity, much less measuring it, is difficult. Is it the number of patients seen? Or the number of conditions treated? Is it represented by the number of visits that are not needed because those patients do not need to return? Can there even be some valid and reliable way to define or measure productivity in terms of outcomes? Or is volume the best that can be done, at least given currently available data? But if the number of patients seen is taken to indicate productivity, what of the use of e-mail for provider-patient communications? Moreover, the product - in terms of what is actual done during a physician visit - varies tremendously, and it is constantly evolving as the science of health care advances.
The solution to this quandary is beyond the scope of this report, but the problem itself should be kept in mind. For now, patient visits per week is used as a proxy for productivity; and any number of factors could cause a change in productivity, including shifts in practice patterns and the changing roles of other health care professionals. While historical data show a decline in patient visits per physician during the 1990s, more recent data indicate a potential upswing.
Figure 42. Mean Number of Patient Visits per Week, 1989-2001
0
20
40
60
80
100
1989 1992 1995 1998 2001
Mea
n vi
sits
per
wee
k
120
140
Source: AMA, Various Publications.95,96,97
95 Martin L. Gonzalez, ed. 1996. Socioeconomic Characteristics of Medical Practice 1996. American Medical Association. Chicago, IL.
© 2008 AAMC. May not be reproduced without permission. 57
The Complexities of Physician Supply and Demand: Projections Through 2025
Hours Worked
The supply of physician services is determined by both the number of physicians and the average amount of time physicians spend per year in professional activities. Holding physician productivity per hour constant, each 1% increase in hours worked is equivalent to a 1% increase in FTE physician supply. Changes in total annual hours worked, therefore, give the healthcare system some short-term flexibility to respond to temporary fluctuations in demand for physician services (provided the healthcare system is not already strained to capacity).
The number of hours worked per week varies with physician gender and age, so changing demographics and work-life balance expectations could contribute to changes over time in average hours worked per physician per year. Consequently, the supply of physician hours (as measured by FTE supply) could grow at a different rate than the number of active physicians.
To capture trends in hours worked associated with changing demographics of the physician workforce, data from the 2006 AAMC-AMA Survey of Physicians Over Age 50, and a survey sponsored by the Bureau of Health Professions during 2002 and 2003 that collected information on patient care hours worked, were analyzed. For the nine specialties where the AAMC oversampled physicians,98 these data were used for physicians over age 50. For all other specialties, and for physicians under age 50, data from the Bureau of Health Professions survey were used.
Male physicians providing patient care report that they work approximately 46 hours per week in patient care activities, which is approximately 19% more than the 38.6 patient care hours per week reported by female physicians. (This gender difference in hours worked narrows when controlling for specialty, as specialties where average hours worked is higher have a disproportionate number of male physicians.)
Both average professional hours worked per week and average patient care hours worked per week vary by physician age. At least historically, average patient care hours worked has increased slightly with physician age, peaking in the 50 to 54 age group, and then declining as physicians near retirement or become semi-retired (Figure 43 ).99
96 Puling Zhang, Sara L. Thran, eds. 2000. Physician Socioeconomic Statistics, 1999-2000 Edition. American Medical Association. Chicago, IL. 97 John D. Wassenaar, Sara L. Thran, eds. 2003. Physician Socioeconomic Statistics, 2003 Edition. American Medical Association. Chicago, IL. 98 These specialties were: Internal Medicine; Family Medicine; Ob/Gyn; Pathology; Cardiology; Plastic Surgery; Pediatrics; Orthopaedic Surgery; and Anesthesiology. 99 For some specialties in the PSDM the number of female survey respondents over age 65 was insufficient to obtain reliable estimates of average hours worked, so average hours worked was computed combining data on men and women.
© 2008 AAMC. May not be reproduced without permission. 58

The Complexities of Physician Supply and Demand: Projections Through 2025
Figure 43. Average Patient Care Hours Worked per Week
0
10
20
30
40
50
60
50 to 54 55 to 59 60 to 64 65 to 69 70+Physician Age
Ave
rage
Pro
fess
iona
l Hou
rs p
er W
eek
All Male Female
Source: Analysis of AAMC-AMA Survey of Physicians Over Age 50 and BHPr Physician Hours Survey.
⇒ Supply Scenario: Shift in Physician Work Hours However, recent work by Watson et al. found that while younger physicians were not working as many hours as young physicians a decade prior, older physicians were working more hours than their predecessors.100 In effect, each cohort appeared to be maintaining their work hours over time, resulting in a “convergence in work hours across age groups”.101 So the PSDM was used to project a future FTE supply under a scenario based on this trend, where patient care hours worked is assumed never to increase as physicians age, such that physician cohorts continue to work their current patient care hours per week over the course of their careers, although older physicians are still assumed to cut back on patient care hours as they approach retirement.
This models the possibility that the desire on the part of younger generations of physicians for a work-life balance will lead to fewer work hours than physician cohorts in the past. It also models the trend that Watson et al. found for older physicians not cutting their work hours as their careers advance, as preceding generations of physicians had. Under this scenario, the total FTE supply of physicians grows to 725,100 by 2025 (9,800 below the baseline) (Figure 44). (It should be recalled here that the baseline scenario already incorporates the increasing number of women in younger cohorts and the reduction in physician hours that will likely result.)
100 Watson, Diane E.; Slade, Steve; Buske, Lynda; and Joshua Tepper. 2006. "Intergenerational Differences In Workloads Among Primary Care Physicians: A Ten-Year, Population-Based Study." Health Affairs 25(6):1620-1628. 101 Watson et al., 2006, p. 1624.
© 2008 AAMC. May not be reproduced without permission. 59
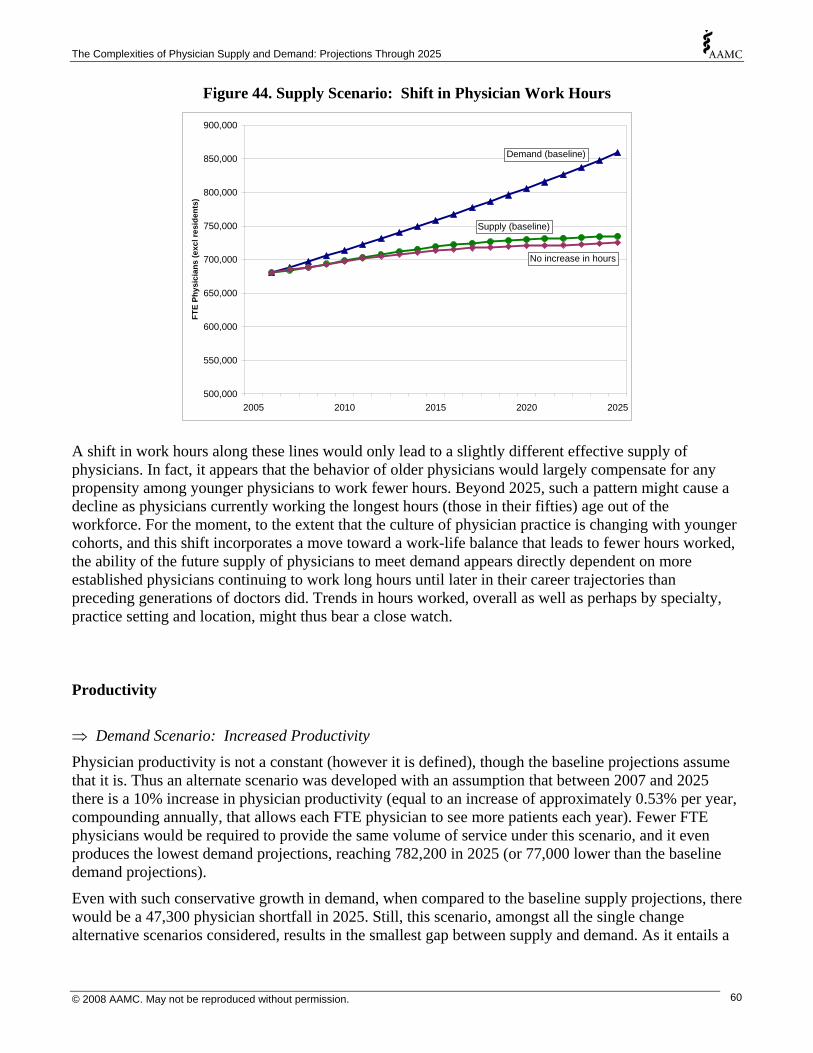
The Complexities of Physician Supply and Demand: Projections Through 2025
Figure 44. Supply Scenario: Shift in Physician Work Hours
500,000
550,000
600,000
650,000
700,000
750,000
800,000
850,000
900,000
2005 2010 2015 2020 2025
FTE
Phys
icia
ns (e
xcl r
esid
ents
)
Demand (baseline)
Supply (baseline)
No increase in hours
A shift in work hours along these lines would only lead to a slightly different effective supply of physicians. In fact, it appears that the behavior of older physicians would largely compensate for any propensity among younger physicians to work fewer hours. Beyond 2025, such a pattern might cause a decline as physicians currently working the longest hours (those in their fifties) age out of the workforce. For the moment, to the extent that the culture of physician practice is changing with younger cohorts, and this shift incorporates a move toward a work-life balance that leads to fewer hours worked, the ability of the future supply of physicians to meet demand appears directly dependent on more established physicians continuing to work long hours until later in their career trajectories than preceding generations of doctors did. Trends in hours worked, overall as well as perhaps by specialty, practice setting and location, might thus bear a close watch. Productivity
⇒ Demand Scenario: Increased Productivity
Physician productivity is not a constant (however it is defined), though the baseline projections assume that it is. Thus an alternate scenario was developed with an assumption that between 2007 and 2025 there is a 10% increase in physician productivity (equal to an increase of approximately 0.53% per year, compounding annually, that allows each FTE physician to see more patients each year). Fewer FTE physicians would be required to provide the same volume of service under this scenario, and it even produces the lowest demand projections, reaching 782,200 in 2025 (or 77,000 lower than the baseline demand projections).
Even with such conservative growth in demand, when compared to the baseline supply projections, there would be a 47,300 physician shortfall in 2025. Still, this scenario, amongst all the single change alternative scenarios considered, results in the smallest gap between supply and demand. As it entails a
© 2008 AAMC. May not be reproduced without permission. 60

The Complexities of Physician Supply and Demand: Projections Through 2025
relatively modest 0.53% productivity increase per year, an ongoing effort to track physician productivity - and the key influences thereupon – seems in order.
Figure 45. Demand Scenario: Increased Productivity
0
100,000
200,000
300,000
400,000
500,000
600,000
700,000
800,000
900,000
1,000,000
2005 2010 2015 2020 2025
FTE
Phy
sici
ans
(exc
l. re
side
nts)
Productivity increase
Supply (baseline)
Demand (baseline)
© 2008 AAMC. May not be reproduced without permission. 61

The Complexities of Physician Supply and Demand: Projections Through 2025
GME Capacity
Medical residents are the future physician supply. Because the incoming supply of new physicians is comprised of allopathic and osteopathic medical school graduates, as well as IMGs, it is the number of residents that influences supply more that MD graduates alone. Moreover, growth in future physician supply is constrained by the number of available residency positions. Thus growth in the number of residents, or a lack thereof, is a crucial consideration in discussions of the future supply of physicians in the U.S. In 2006, approximately 25,000 new physicians entered their first year of residency - including approximately 15,500 graduates from US schools of medicine (USMDs), 2,900 graduates from US schools of osteopathic medicine (DOs), and 6,600 international medical graduates (IMGs).
Over the past decade, the number of physicians entering residency programs has remained relatively constant at around 25,000, due largely to the cap on GME Medicare funds put in place by the Balanced Budget Act of 1997; although in recent years there has been limited growth - driven primarily by IMGs and graduates from schools of osteopathic medicine. A zero change scenario was used for the baseline projection. Here, using the PSDM, projections are presented for future supply under two alternate scenarios regarding the number of individuals entering their first year of residency (Figure 46).
Figure 46. Projections of Total New First-year Residents
0
5,000
10,000
15,000
20,000
25,000
30,000
35,000
2005 2010 2015 2020 2025
1st Y
ear R
esid
ents
Robust GME growth: 32,000
Moderate GME growth: 27,600
Supply (baseline): 25,000
⇒ Supply Scenario: Moderate GME Growth The moderate GME growth scenario assumes some expansion of GME slots to accommodate, by 2016, 19,000 new USMDs and 4,500 new DOs. This scenario more closely resembles the modest growth in GME seen during recent years. Such an increase in graduates from U.S. medical schools would likely be partially offset by a decline of IMGs to 4,100 per year. Total first-year residents thus increases from 25,000 to 27,600 by 2016. Under this scenario the total FTE supply of physicians grows to 760,700 by 2025 (25,800 above baseline) (Figure 47).
© 2008 AAMC. May not be reproduced without permission. 62
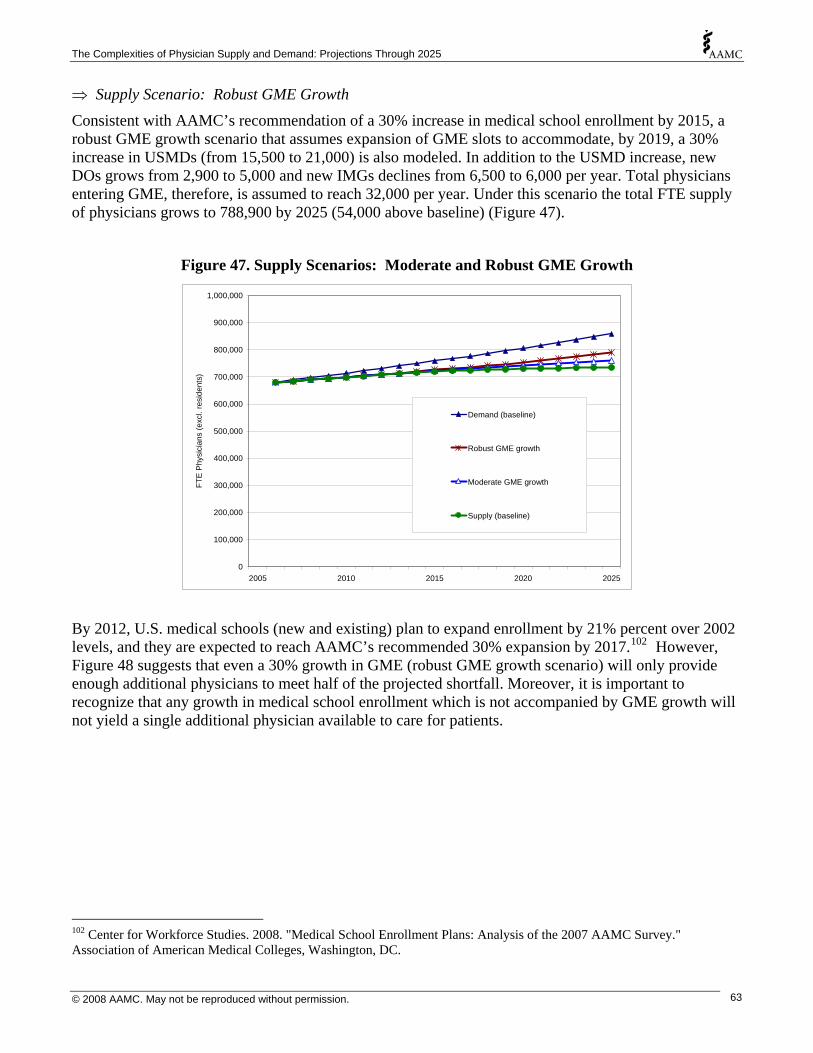
The Complexities of Physician Supply and Demand: Projections Through 2025
⇒ Supply Scenario: Robust GME Growth Consistent with AAMC’s recommendation of a 30% increase in medical school enrollment by 2015, a robust GME growth scenario that assumes expansion of GME slots to accommodate, by 2019, a 30% increase in USMDs (from 15,500 to 21,000) is also modeled. In addition to the USMD increase, new DOs grows from 2,900 to 5,000 and new IMGs declines from 6,500 to 6,000 per year. Total physicians entering GME, therefore, is assumed to reach 32,000 per year. Under this scenario the total FTE supply of physicians grows to 788,900 by 2025 (54,000 above baseline) (Figure 47).
Figure 47. Supply Scenarios: Moderate and Robust GME Growth
0
100,000
200,000
300,000
400,000
500,000
600,000
700,000
800,000
900,000
1,000,000
2005 2010 2015 2020 2025
FTE
Phy
sici
ans
(exc
l. re
side
nts)
Demand (baseline)
Robust GME growth
Moderate GME growth
Supply (baseline)
By 2012, U.S. medical schools (new and existing) plan to expand enrollment by 21% percent over 2002 levels, and they are expected to reach AAMC’s recommended 30% expansion by 2017.102 However, Figure 48 suggests that even a 30% growth in GME (robust GME growth scenario) will only provide enough additional physicians to meet half of the projected shortfall. Moreover, it is important to recognize that any growth in medical school enrollment which is not accompanied by GME growth will not yield a single additional physician available to care for patients.
102 Center for Workforce Studies. 2008. "Medical School Enrollment Plans: Analysis of the 2007 AAMC Survey." Association of American Medical Colleges, Washington, DC.
© 2008 AAMC. May not be reproduced without permission. 63

The Complexities of Physician Supply and Demand: Projections Through 2025
Figure 48. Projected National Supply & Shortfall of Physicians with GME Expansion
650,000
700,000
750,000
800,000
850,000
900,000
2005 2010 2015 2020 2025Year
FTE
Phys
icia
ns (e
xcl.
resi
dent
s)
Baseline Supply
ShortfallAdditional
Supply fromRobust GME Expansion
It appears, then, that growth in medical school output, to the extent that it is accompanied by an expansion in GME capacity, may help alleviate any future shortages. But it is by no means the entire solution. Given the impact of GME on total supply and distribution by specialty and location, monitoring trends in GME is important to understanding the likely future supply of physicians..
© 2008 AAMC. May not be reproduced without permission. 64
The Complexities of Physician Supply and Demand: Projections Through 2025
Physician Assistants & Nurse Practitioners
Physicians work alongside PAs, NPs and other health professionals who increase the productivity of physicians both by assisting with patient care (e.g., taking patient histories) and providing patient care (e.g., providing comprehensive assessment for a primary care visit) under the direction of a physician. While a wide array of health professionals and other workers will impact on the need for more doctors, of particular importance are clinicians who can provide some of the services usually provided by physicians. These non-physician clinicians (NPCs) include PAs, NPs and others. Over the past two decades the supply of PAs and NPs has grown at a faster rate than physicians, with the estimated combined supply of NPs and PAs exceeding 200,000 in 2006. 103,104,105,106,107 Two hypothetical scenarios were modeled in order to gauge the impact on physician demand if PAs and NPs provide a greater proportion of healthcare services, or if they increase physician productivity.
⇒ Supply Scenario: Beyond Baseline Growth in PA and NP Supply Since the number of PAs and NPs directly affects the demand for physicians, an increase in the utilization of these professionals would be expected to lead to a decrease in the demand for physicians, albeit not on a one-to-one basis. The baseline demand scenario assumes that PA and NP supply will grow by at least 26% (with PAs and NPs maintaining their proportion of services provided). So the alternate PA and NP supply expansion scenario models the implications on physician demand if PA and NP supply grew beyond that needed to maintain the status quo in terms of healthcare delivery patterns. This scenario projects future demand for physicians if PA and NP supply grows annually by 2% between 2006 and 2025, increasing 46% by 2025. Under the assumption that each additional two PAs or NPs reduces physician demand by one,108 this scenario projects physician demand to grow to 843,800 by 2025 (or 15,500 fewer FTE physicians than predicted under the baseline scenario) (Figure 49).
103 Pearson, Linda J. 2007. "The Pearson Report." The American Journal for Nurse Practitioners 11(2):10-99. 104 Morgan, Perri & Roderick S. Hooker. 2008. “Specialty Trends among Physician Assistants: United States.” Presentation at the AAMC Physician Workforce Conference 2008. May 1, 2008. Arlington, VA. 105 McCann, J.L.; Phillips, R.S.; O'Neil, E.H.; Ruddy, G.R.; et al. 2005. “Physician Assistant and Nurse Practitioner Workforce Trends.” American Family Physician. Oct. 2005. 72(7): 1176. 106 American Academy of Physician Assistants. 2008. "Projected Number of People in Clinical Practice as PAs as of January 1, 2008". <http://www.aapa.org/research/InformationUpdates07/IU2007NumClinPract.pdf>. (Accessed: 2008-02-28.) American Academy of Nurse Practitioners. 2007. “Why Choose a Nurse Practitioner as Your Healthcare Provider?” < http://aanp.org/About+AANP/What+is+an+NP%3f++FAQs+about+Nurse+Practitioners.htm > (Accessed: 2008-02-28.) 107 The projections used a more conservative number of 160,000 as the baseline supply of NPs and PAs in 2006, which can be derived from the NP estimate of 97,000 in Kleinpell & Goolsby (“2004 American Academy of Nurse Practitioners National Nurse Practitioner Sample Survey: Focus on acute care”, Journal of the American Academy of Nurse Practitioners, 18: 393-394) and the estimated PA supply in 2006 of 64,000 (based on AAPA data). 108 Some research suggests that each PA may perform as many as three-quarters the number of outpatient visits as physicians, with NPs only slightly lower – though NPs are more likely to work part time. (e.g., Larson et al. 2003. “The Contribution of Nurse Practitioners and Physician Assistants to Generalist Care in Washington State.” Health Services research. 38(4): 1033-1050.)
© 2008 AAMC. May not be reproduced without permission. 65

The Complexities of Physician Supply and Demand: Projections Through 2025
⇒ Supply Scenario: Increased Provision of Primary Care by PAs and NPs One possibility for meeting future demand for physician services is expanding the role of PAs and NPs where the physician shortage is expected to be greatest, i.e., in primary care. So even though there is an increasing amount of specialization within the PA and NP workforce,109 for demonstration purposes a second alternate scenario models the implications on physician demand if PA and NP supply growth were sufficient to expand the proportion of primary care services currently provided by them (e.g., to free up physician time for handling more complex cases or severely ill patients).
Under this scenario, between 2006 and 2025 there is a gradual shift towards greater PA and NP roles in providing primary care services, so by 2025 the nation requires 25% fewer primary care physicians than are projected in the baseline scenario’s absence of an expanded role for PAs and NPs in primary care (Figure 49). Under this scenario, total demand rises to 784,200 in 2025 (or 75,100 fewer FTE physicians than predicted under the baseline scenario). Such a scenario would require a substantial increase in the number of PAs and NPs with primary care training. In addition to the tens of thousands of extra PAs and NPs necessary to meet the projected baseline growth in demand for healthcare services, another 150,000 would be required to reduce demand for primary care physicians by 75,000.
Figure 49. Supply Scenarios: Beyond Baseline Growth and Increased Primary Care Provision for PAs and NPs
0
100,000
200,000
300,000
400,000
500,000
600,000
700,000
800,000
900,000
1,000,000
2005 2010 2015 2020 2025
FTE
Phy
sici
ans
(exc
l. re
side
nts)
Demand (baseline)
Demand with NP/PA Expansion Beyond Baseline
Demand with NPs/PAs providing 25% of primary care currentlyprovided by physicians
Supply (baseline)
While these two scenarios project future demand under what may be attractive policy goals, current infrastructure might be insufficient to produce between 2006 and 2025 the virtual doubling of PA and NP supply that would result from the additional 150,000 to 200,000 NPs and PAs these hypothetical
109 For example, see: Jones, P. Eugene. 2007. "Physician Assistant Education in the United States." Academic Medicine 82(9):882-887.
© 2008 AAMC. May not be reproduced without permission. 66
The Complexities of Physician Supply and Demand: Projections Through 2025
scenarios would require.110 The production of new PAs and NPs may even decline in the coming years.111 It is more likely that they will continue to serve an important role in the provision of care, but that their numbers will not be sufficient to eliminate the physician shortage likely to come.
Nonetheless, it appears evident that an increased role in the provision of care is part of the solution to the projected shortage. It also argues for keeping close tabs on the current and future numbers of PAs and NPs in conjunction with their roles. Since the projection which most reduces physician demand is based on an increased role for PAs and NPs in primary care, and PAs, at least, are increasingly moving into non-primary care specialties,112,113 trends in PA and NP specialty choice may also require as close a watch as those for physicians. Given that PAs and NPs may play a larger role in rural than urban areas,114 their location should be noted, as well.
110 Cooper, Richard A. 2007. “New Directions for Nurse Practitioners and Physician Assistants in the Era of Physician Shortages.” Academic Medicine. 82(9): 827-828. 111 McCann, J.L.; Phillips, R.S.; O'Neil, E.H.; Ruddy, G.R.; et al. 2005. “Physician Assistant and Nurse Practitioner Workforce Trends.” American Family Physician. Oct. 2005. 72(7): 1176. 112 Larson, Eric H. & L. Gary Hart. 2007. “Growth and Change in the Physician Assistant Workforce in the United States, 1967-2000”. Journal of Allied Health. 36(3): 121-130. 113 Jones, P. Eugene. 2007. “Physician Assistant Education in the United States.” Academic Medicine. 82(9): 882-887. 114 Larson, Eric H.; Palazzo, Lorella ; Berkowitz, Bobbi ; Pirani, Michael J.; & L. Gary Hart. 2003. “The Contribution of Nurse Practitioners and Physician Assistants to Generalist Care in Washington State.” Health Services Research. 38(4): 1033-1050.
© 2008 AAMC. May not be reproduced without permission. 67
The Complexities of Physician Supply and Demand: Projections Through 2025
Combined Scenarios The projected supply and demand scenarios thus far presented in this report represent single factor projections. Presenting a projection based on change in a single influence on physician supply and demand, with all other considerations held constant, represents an important analytical tool but an unlikely course of events. None of the factors affecting physician supply and demand operate in a vacuum. From the changing composition of the population and physician workforce to the ongoing transformation of utilization patterns, the influences discussed in individual projection scenarios are bound to occur in concert, rather than in isolation. To address this issue, three combination scenarios were also modeled:115
• a worst case scenario, which combines the individually modeled elements that most exacerbate the projected shortfall;
• a best case scenario, which incorporates those factors that drive supply upward and demand downward; and
• a most plausible scenario, which brings together those physician supply and demand influences considered most likely to occur (a ‘best guess’ scenario).
115 In this context, ‘worst’ and ‘best’ indicate the worst and best case scenarios insofar as the gap between physician supply and demand is concerned. They imply no normative judgment about the value of any of the scenario components.
© 2008 AAMC. May not be reproduced without permission. 68

The Complexities of Physician Supply and Demand: Projections Through 2025
1. Worst case scenario
This scenario assumes:
• the documented increase in the utilization of physician services will continue; • expansion of health insurance coverage to the entire population; • physicians begin to retire earlier; • a cohort-based shift in work schedules is occurring among physicians such that they 'never
increase hours' beyond their current work schedules; and • no GME growth (baseline of 25,000 new first-year residents per year continues).
Figure 50. Projected FTE Physicians, Worst Case Scenario, 2006-2025
Baseline Demand
Baseline Supply
Worst Case Demand
Worst Case Supply
600,000
650,000
700,000
750,000
800,000
850,000
900,000
950,000
1,000,000
1,050,000
2005 2010 2015 2020 2025
FTE
Phys
icia
ns (e
xcl r
esid
ents
)
Clearly, under conditions of ‘everything that can go wrong does’, the projected shortage grows dramatically, to 312,000 FTE physicians, or two and one-half times the deficit projected in the baseline scenario. While improbable, the potential exists for a shortage so extreme that the nation has only two-thirds of the doctors it needs. The task of tracking utilization, physician work patterns, and GME capacity takes on added significance when seen in this light.
© 2008 AAMC. May not be reproduced without permission. 69

The Complexities of Physician Supply and Demand: Projections Through 2025
2. Best case scenario
This scenario assumes:
• physicians begin to retire later; • robust GME growth (from 25,000 to 32,000 new first-year residents per year); and • an increased role for PAs and NPs in the provision of primary care services.116
Figure 51. Projected FTE Physicians, Best Case Scenario, 2006-2025
Baseline Demand
Baseline Supply
Best Case Demand
Best Case Supply
600,000
650,000
700,000
750,000
800,000
850,000
900,000
2005 2010 2015 2020 2025
FTE
Phys
icia
ns (e
xcl r
esid
ents
)
At the other extreme, the potential for a surplus - also improbable – exists. If physicians retire later, and if GME capacity grows from 25,000 to 32,000 new first-year residents per year, and if there is an increased primary care role for PAs and NPs, then a surplus of 49,000 FTE physicians is projected. The lesson, interestingly, is identical to that learned from the worst case scenario, i.e., that the tracking of utilization, physician work patterns, and GME capacity is imperative.
116 This scenario is based on the supply of PAs and NPs assuming 25% of the demand that would have been placed on primary care physicians, while still growing fast enough to keep up with baseline demand increases. It also automatically assumes that the supply of NPCs will grow enough to meet the increased demand for their services that would attend such an expansion in their role.
© 2008 AAMC. May not be reproduced without permission. 70

The Complexities of Physician Supply and Demand: Projections Through 2025
3. Most plausible scenario
This scenario assumes:
• the documented increase in the utilization of physician services will continue; • a cohort-based shift in work schedules is occurring among physicians such that they 'never
increase hours' beyond their current work schedules; • moderate growth in GME (from 25,000 to 27,600 new first-year residents per year); and • an increase in productivity such that each FTE physician results in more patients seen per year.
Figure 52. Projected FTE Physicians, Most Plausible Scenario, 2006-2025
Baseline Demand
Baseline Supply
Most Plausible Demand
Most Plausible Supply
600,000
650,000
700,000
750,000
800,000
850,000
900,000
950,000
2005 2010 2015 2020 2025
FTE
Phys
icia
ns (e
xcl r
esid
ents
)
Under this more probable set of conditions, a shortage even greater than that produced by the baseline projection emerges. The baseline demand projection assumed constant levels of utilization, but historical growth in the utilization of physician services will likely continue. Population growth and aging will compound the effects of this trend. Emerging evidence suggests a cohort-based shift in work patterns among physicians that could result in reduced capacity, though the expected level of growth in GME (from 25,000 to 27,600 new first-year residents per year) and an anticipated increase in productivity will have greater effects on effective supply, placing projected supply above that anticipated by the baseline scenario. In other words, the baseline supply projection may be a tad too pessimistic, but the baseline demand projection seems clearly too optimistic. In all likelihood, the physician shortage will be even worse than the baseline scenario anticipates.
These projections, all told, paint a picture of the need for systemic thinking in physician workforce planning. If more physicians are trained, GME is expanded to make sure those trained may one day practice, a concerted effort is put into expanding the role of other health care professionals in the provision of (especially primary) care, and ways are found to increase physician productivity, then a national shortage may still materialize, but it will be nowhere as severe as it might otherwise have been.
© 2008 AAMC. May not be reproduced without permission. 71

The Complexities of Physician Supply and Demand: Projections Through 2025
On the other hand, if the observed drift in utilization among older American continues as the population ages, newer physicians decide to work fewer hours and retire earlier, and the nation’s GME capacity fails to grow as needed, then any future shortage will be worse than it needs to be.
Planning that occurs with the system in mind will be better planning. Without farsighted, concerted actions that are monitored and revised in a conscientious and timely manner, the worst case scenario becomes more likely; and as the burden of any shortages are not going to be distributed equitably, a lack of planning will hurt most those whose needs are greatest.
© 2008 AAMC. May not be reproduced without permission. 72
The Complexities of Physician Supply and Demand: Projections Through 2025
Discussion “A trend is not necessarily fate. Images of the future are usually only caricatures of the present.”
- Paul Starr117
Summary
The projections in this report are generally consistent with projections made by the United States Department of Labor. The Bureau of Labor Statistics projects total employment of ‘physicians and surgeons’ (their occupational title) to increase 14.2% between 2006 and 2016.118 Their model assumes that supply will adjust to meet this need. The AAMC’s baseline demand projection is for a 12.8% increase over the same period.
As it stands, the combined baseline supply and demand projections developed for this report show a shortage in 2025 of 124,000 FTE physicians. This is not a prediction. What this projection indicates is that if current physician utilization and work patterns continue, a physician shortage is imminent – if it is not already here. Since complex systems seldom remain in stasis, alternate projections were developed to incorporate likely shifts or hypothesized relationships with direct bearing on the future of the physician workforce. These models demonstrate that:
• Aging of the population may drive demand sharply upward for specialties that predominantly serve the elderly (e.g., oncologists);
• Growth in future demand could double if visit rates by age continue to increase at the same pace they have in recent years—with the greatest growth in utilization among those 75+ years of age;
• Universal health care coverage could add 4 percent to overall demand for physicians; this would increase the projected physician shortfall by 31,000 physicians (25 percent);
• If the relationship between economic growth and physician demand that Cooper posits holds true, then the greatest increase in demand among all our projections models is the result – a demand for physicians that is likely beyond what supply could possibly meet;
• Movement in the retirement patterns of physicians will have long-term consequences for the workforce – by either exacerbating or ameliorating shortages;
• If younger physicians continue working fewer hours than their predecessors, which seems probable, then any and all shortages will be amplified, with older physicians taking up a substantial proportion of the extra demand by maintaining long work hours later into their careers;
• Even a modest increase in physician productivity could do more to alleviate the projected gap between supply and demand than any other supply-side change but productivity improvements in health care have been hard to achieve as care has become more complex;
117 As quoted in Pham, Hoangmai H. & Paul B. Ginsburg. 2007. “Unhealthy Trends: the Future of Physician Services.” Health Affairs. 26(6): 1586-1598. 118 U.S. Dept. of Labor, Bureau of Labor Statistics. 2007. “National Employment Matrix, employment by industry, occupation, and percent distribution, 2006 and projected 2016”. <ftp://ftp.bls.gov/pub/special.requests/ep/ind-occ.matrix/occ_xls/occ_29-1060.zip>. (Last modified 2007-Dec-14).
© 2008 AAMC. May not be reproduced without permission. 73
The Complexities of Physician Supply and Demand: Projections Through 2025
• Growth in physician supply is critical – albeit insufficient - to meeting physician shortages, and GME growth, in turn, is critical to growth in physician supply;
• Even a robust expansion of GME capacity (from 25,000 new entrants per year to 32,000) would only reduce the projected shortage in 2025 by 54,000 physicians (43 percent);
• Future demand for physicians would be significantly reduced if physician assistants and nurse practitioners play a larger role in patient care; and
• The most probable combination of individual scenarios will likely lead to an even greater shortage than that presented by the baseline scenario.
Complexity
The U.S. health care system is far from completely efficient and there are wide variations in how resources are used and deployed. While it is tempting to suggest that current utilization patterns are flawed and should not be used to estimate future requirements for physicians, a warning made 40 years ago should be taken to heart: “A most important concept in health [workforce] planning is ‘start where you are’. It will do no good to propose grandiose and visionary schemes to correct the nation’s health [workforce] plans by completely redesigning the system…there is great time-lag in the process of changing a country’s health [workforce] status.”119
The labor market in health care is complex, in part because of the length of time involved in the training and ‘production’ of physicians, which often requires individuals to make career decisions at least a decade prior to active participation. The average physician must complete four years of baccalaureate study, four years of medical (or osteopathic) school, and three to eight years of post-graduate training (residency and fellowship). For educators and policy makers, as well as potential physicians, the decision to change physician workforce policy in 2020 begins today.
The projections presented in this report suggest that planning should begin with a renewed commitment to supplying the nation with enough doctors. No claims are made that the projections presented here represent what the future will look like, but rather a window into what the future may hold. Costs will eventually catch up with all of the participants in our health care system.120 Consumer expectations will evolve in response to costs, especially as those costs get shifted directly into their pockets – as seems increasingly probable. Out-of-pocket expenses continue to rise with age, even after reaching Medicare eligibility.121 Utilization patterns will change, and extant disparities in utilization and access may grow. Indeed, the likelihood of tiered access is rising.122
Shortages
One way or another, or more likely in a variety of ways, the system will adjust as any physician shortage escalates. When per capita ratios peak, increased ‘productivity’ may be forced upon providers. That is, the amount of time that physicians can spend with patients may drop, a situation that may be confused with increased productivity. Physician shortages are also likely to mean longer delays for necessary and 119 Baker T.D. 1966. “Dynamics of health manpower planning”. Medical Care. 4:205-211. 120 Vladeck, Bruce. 2004. “Perspective: Everything New Is Old Again.” Health Affairs. 1 Oct 2004. Web only: VAR 108-111. 121 National Institute on Aging. 2007. Growing Older in America: The Health and Retirement Study. National Institute on Aging, National Institutes of Health, U.S. Department of Health and Human Services: Bethesda, MD. 122 Pham, Hoangmai H. & Paul B. Ginsburg. 2007. “Unhealthy Trends: the Future of Physician Services.” Health Affairs. 26(6): 1586-1598.
© 2008 AAMC. May not be reproduced without permission. 74

The Complexities of Physician Supply and Demand: Projections Through 2025
appropriate care and, potentially, may lead to lower quality care as the physician supply is stretched thin. Shortages may even manifest through the diversion of patients to other sources of care, including self-care.
Accordingly, the likely shortfall in available physician services must be addressed using a variety of approaches, only one of which is expansion of medical education and training. Concurrently, the nation will have to improve the efficiency of the delivery system and make full use of available health care providers for longer periods of time; improving the productivity of existing physicians a few percent is likely to have a greater impact than one or two years worth of medical school graduates.123,124
Toward a Better Understanding
If there is one theme that emerges from this work, it is complexity. Demographics, the need for work-life balance, trends in retirement, the national debate on the uninsured, the role of primary care in the health care delivery system, training capacity at all stages of an increasingly international pipeline, and the role of non-physicians: all of these have direct bearing on the future supply and demand for physicians and their services. And this is only the beginning. Women in the workforce, medical advances, geographic imbalance, tiered access also matter, as do payment system changes. And all this is without even beginning to address quality of care, much less make any direct links to health outcomes.125
This report was designed to inform physician workforce planning. There is much work to be done to better understand the dynamics of the physician workforce—in order to better inform physician workforce planning. To that end, future efforts should:
• Continue to promote carefully considered changes in medical school capacity and the availability of GME positions as part of a broader strategy to address physician shortages;
• Promote efforts to make more effective use of the limited physician supply, such as through the use of non-physician clinicians and other health professionals, and to improve productivity;
• Recognize and respond to physician life-style concerns, i.e. promote flexible scheduling including part time work. Given the large number of physicians over age 55, their decisions as to when to retire will have an enormous impact on the supply of physicians.
• Improve data collection and workforce studies and expand collaboration among health professions organizations on data and workforce policies.
Specifically with regard to data collection, more needs to be known about:
• How physician characteristics such as gender, age and race/ethnicity affect specialty choice, work hours, and practice location;
• How different types of health insurance coverage impact the demand for different types of physician services;
123 Reinhardt, U. 1972. “A production function for physician services”. The Review of Economics and Statistics. 54:55-66. 124 Salsberg, Edward. & Atul Grover. 2006. “Physician Workforce Shortages: Implications and Issues for Academic Health Centers and Policymakers.” Academic Medicine. 81(9): 782-787. 125 Kirch, Darrell G. & David J. Vernon. 2008. "Confronting the Complexity of the Physician Workforce Equation." Journal of the American Medical Association. 299(22):2680-2682.
© 2008 AAMC. May not be reproduced without permission. 75

The Complexities of Physician Supply and Demand: Projections Through 2025
• What constitute the best indicators of health care need and demand, including what population characteristics differentiate levels and types of need and demand, and how to monitor them over time;
• How demand for the specialties that will feel the greatest effects of an aging population is likely to develop, especially insofar as changes in survivorship and comorbidity rates may cause demand for some specialties to grow faster than projections based on current utilization rates can anticipate;
• The limits and confounding factors for the relationship between growth in the economy and physician demand;
• How physician retirement patterns are likely to change, including where and when;
• In what ways, and to what extent, newer cohorts of physicians are going to alter their effective supply to accommodate their attitudes toward the work-life balance;
• Physician productivity, what it means, how it changes over time, and what most strongly influences it;
• What effects information technologies do and do not have on productivity;
• What effects are resulting from the changing role of the consumer in health care provision;
• How medical students choose their specialty, including what drives their opinion of the primary care practice option;
• Where and how GME links to place and influences specialty decisions;
• A deeper grasp of the connection between PA and NP supply and access to care, including the relationship to physician productivity;
• How continued efforts to address disparities in access and outcomes and the supply and demand for physicians interact;
And needed are:
• Better data on the demographic characteristics of physicians, especially more detailed race/ethnicity and related data;
• Better data on the future supply and demand of individual specialties;
• Better data on where physicians practice, and the decisions that drive location choice;
• Better data on shortages, where they occur and how they manifest; and
• Better data on the relationship between physician supply and quality of care.
Projecting a physician shortage after many shortages have already been identified may draw criticism as being too conservative an approach to physician workforce planning. However, this document is intended to move beyond the idea of a simple shortage to portray the complexities of assessing the physician workforce, and the need to perform such assessments more than three or four times each century. With better information, better decisions will be made – and everyone will be better served.
© 2008 AAMC. May not be reproduced without permission. 76

The Complexities of Physician Supply and Demand: Projections Through 2025
Appendix: Methodology
The projections presented in this report were produced by the Physician Supply and Demand Model (PSDM) developed to project future supply and demand based on the latest trends in key supply and demand determinants and under existing and alternate policy and market scenarios.
Projecting Supply The supply component of the PSDM is an inventory model that starts with the number of active physicians in the base year (2006) categorized by age, gender, specialty, and education—graduates of U.S. schools of allopathic medicine (USMDs), graduates of U.S. schools of osteopathic medicine (DOs), and international medical graduates (IMGs). For each projection year, estimates of the number of physicians entering graduate medical education (GME) are added to supply, while estimates of physicians leaving the workforce through retirement or death are subtracted from supply. The projected number of physicians remaining at the end of one projection year becomes the starting point for the next year’s projection. Key supply determinants are the number of physicians completing GME and specialty choice, hours worked patterns, and retirement patterns.
Supply Definitions Active supply is the total number of physicians engaged in providing professional medical services. Full time equivalent (FTE) supply is calculated by multiplying total active physicians by the ratio of average patient care hours worked in each future year to average patient care hours worked in 2006. Patient care supply, active or FTE, is the number of physicians primarily engaged in patient care activities.
The PSDM produces three supply measures:
1) active physicians including residents and fellows,
2) active physicians excluding residents and fellows, and
3) full time equivalent (FTE) physicians in practice (which excludes residents and fellows and takes into consideration pattern changes in hours worked).
Further distinctions are sometimes made between physicians engaged primarily in patient care activities and physicians engaged primarily in non-patient-care activities (e.g., research, teaching, administration).
By definition, in the base year (2006) the number of active physicians excluding residents and fellows equals the number of FTE physicians. The FTE measure is designed to model the change over time in physician hours worked if physician demographic trends and lifestyle choices change average hours worked per year. An FTE is defined relative to the average patient care hours worked in 2006 for physicians in a given medical specialty. For example, if average patient care hours worked in a particular specialty falls from 50 hours per week in 2006 to 45 hours per week in 2020, then on average each physician in 2020 is equivalent to 0.9 FTE physicians in 2006 (i.e., physicians in 2020 are working 90% as many patient care hours, on average, as physicians in 2006). Patient care hours, rather than total hours in professional activities, is used to define an FTE because a shift in hours from non-patient care activities (e.g., attending professional conferences) to patient care activities, in effect, increases the supply of physician services. FTE supply is used for comparison to demand for physician services.
© 2008 AAMC. May not be reproduced without permission. 77

The Complexities of Physician Supply and Demand: Projections Through 2025
Mathematically, active and FTE supply in each specialty (S) and year (Y) is described:
( )YSYS
YSYS
YSYSYSYS
,2006,
,,
,,,1,
Supply ActiveHours CarePatient Ave
Hours CarePatient AveSupply FTE
AttritionEntrants NewSupply ActiveSupply Active
×=
−+=
=
+
The PSDM models supply (as well as demand) in four major specialty categories:
• Primary Care: general and family practice, general internal medicine, and general pediatrics;
• Medical Specialties: cardiovascular disease, gastroenterology, internal medicine subspecialties, nephrology, pulmonology, and other medical specialties;
• Surgery: general surgery, obstetrics and gynecology, ophthalmology, orthopedic surgery, otolaryngology, thoracic surgery, urology, and other surgical specialties; and
• Other Patient Care: anesthesiology, emergency medicine, neurology, pathology, psychiatry, radiology, and other specialties.
Physicians are categorized solely by their self-identified primary specialty. However, many physicians have secondary specialties where they spend a portion of their time, and the scope of practice overlaps for many specialties. These considerations should be taken into account when assessing the adequacy of supply for individual specialties. Although projections are reported for the specialty groups above, the focus of this report is on the adequacy of the overall future physician supply and the policy implications of supply imbalances.
Estimates of active supply for the base year (2006) differ from totals available from the American Medical Association (AMA) Masterfile for three reasons:
1) Supply estimates in this report include only physicians under age 75. The AMA Masterfile lists as active approximately 34,000 physicians age 75 and older who, if they indeed are active, would represent approximately 4% of total active physicians.126 Concerns that the AMA Masterfile inaccurately records as active many of these older physicians influenced the decision to “retire” all physicians at age 75 for supply projection purposes.
2) Original analysis of the AAMC-AMA Survey of Physicians Over Age 50 suggests that the activity status in the Masterfile for some older physicians is incorrect. The 2006 supply numbers presented here were estimated after applying an algorithm to the Masterfile that predicts the probability that each physician over age 50 is active as a function of the activity status listed in the Masterfile and physician age, gender, and specialty.
3) For physicians over age 50, a different definition of active is used here than in the Masterfile. The Masterfile identifies a physician as active if he or she reports working 20 or more hours per week in professional activities. Some older physicians choose to work fewer than 20 hours per week, and for this report they are counted as active (although for FTE supply physicians working part time are weighted as a fraction of an FTE representing the degree to which their reported patient care hours are below the specialty average).
126 Estimates of active physicians age 75 and older in the Masterfile include approximately 1,000 reported residents and fellows, 27,000 physicians in direct patient care, and 6,000 in other professional activities (teaching, administration, research, and other non-patient care).
© 2008 AAMC. May not be reproduced without permission. 78
The Complexities of Physician Supply and Demand: Projections Through 2025
The specialty choice of new entrants to the physician workforce is modeled using recent data on the number and specialty distribution of graduates from Accreditation Council for Graduate Medical Education (ACGME) programs.127 In addition to the approximately 22,200 who completed GME in 2006 (not counting residents and fellows completing preliminary years or residencies that are feeders into more specialized fields), there are an estimated 1,200 DO graduates per year from non-ACGME programs. For modeling supply the specialty choice distribution for DOs graduating from non-ACGME programs is assumed to be similar to the specialty distribution of DO graduates from ACGME programs.
Whereas the overall number of physicians completing GME has remained relatively stable over the past 20 years, the number entering individual specialties has varied - in many cases experiencing substantial fluctuation - based on the changing actual or perceived needs of the nation. To the extent that the number of physicians in 2006 entering a particular specialty represents a peak (or a trough) in terms of historical patterns entering a specialty, extrapolating the specialty distribution for 2006 to future years could result in over (or under) estimates of future supply for that specialty.
Projecting Demand
The physician demand estimates are based on recent healthcare utilization and healthcare delivery patterns, with current patterns extrapolated to future populations. Using current patterns of healthcare utilization and service delivery means that current inefficiencies in the healthcare system are extrapolated into the future. In essence, a utilization-based demand model assumes that current national levels of physician services provided are adequate, although not necessarily optimal.
Whereas there is general consensus among researchers on the key components of physician supply and the methods for projecting future supply, the same cannot be said for modeling physician demand. In a healthcare system where the price of services is distorted by a three-party system (providers, payers, patients) and where neither patients nor providers bear the full cost of healthcare utilization decisions, there is concern that some services provided are unnecessary and some necessary services are not provided. In addition to lack of consensus regarding how to define and measure current demand, there is no agreement on the key determinants of future demand, trends in these determinants, and their impact on future demand.
For this study, demand is defined as the number of physicians the U.S. is able and willing to pay for given the population’s epidemiological needs. Current patterns of utilizing physician services serve as a proxy for the level of services for which the U.S. is able and willing to pay. The starting point for making future demand projections is simply the demand associated with the existing health care system, despite its imperfections.
The PSDM projects future demand under alternate scenarios as a function of trends in one or more of the following three major determinants:
1) Changing demographics. High use of physician services by a rapidly growing elderly population suggests that demand for physicians will grow at a faster rate than the overall population. Likewise, healthcare utilization patterns differ by race and ethnicity, and the Census Bureau projects that minority populations will grow at a faster rate than the overall U.S. population. The impact of changing demographics on physician demand is modeled by estimating physician-to-population ratios based on current patterns of healthcare utilization and delivery. For each
127 Brotherton, S.E. & S.I Etzel. “Graduate Medical Education, 2006-2007”. Journal of the American Medical Association. 298(9): 1081-1096.
© 2008 AAMC. May not be reproduced without permission. 79

The Complexities of Physician Supply and Demand: Projections Through 2025
medical specialty, FTE physician-to-population ratios were estimated for each of five physician patient care activities (office visits, clinic/emergency visits, hospital rounds, surgery, and other visits) and for each of 112 subsets of the population defined by age, gender, race/ethnicity, and whether insured.
2) Availability of non-physician services. The use of nurse practitioners (NPs), physician assistants (PAs), and other clinicians affects the number of physicians needed to care for a given population.
3) Economic factors. Economic wellbeing affects the coverage and comprehensiveness of medical insurance, as well as the ability and willingness to purchase certain healthcare services.
While there certainly are other important demand determinants such as changing technology, public expectations, and global outsourcing, their impact will vary by medical specialty and how they will affect future demand is uncertain. Alternate demand projections are reported that use different assumptions regarding trends in health care utilization and health care delivery patterns. These include the impact of a shift toward more reliance on primary care visits over specialist visits, significant productivity gains among physicians, and the introduction of universal health insurance coverage.
Information on the average proportion of time physicians spent providing care through office visits, hospital emergency visits, outpatient visits, hospital rounds, surgery and other visits (e.g., nursing homes and home health) comes from AMA’s 2003 Physician Socioeconomic Statistics and select specialty studies. The latest AMA data on proportion of time physicians in each specialty spend in each delivery setting are from 2001. The amount of time physicians spend providing care in hospitals can change over time, however, with the increased use of hospitalists and technological advances such as minimally invasive surgery reducing the amount of time physicians in some specialties spend making hospital rounds.
This information is used to estimate the number of FTE physicians providing care by setting for each of two dozen specialty categories. For example, the approximately 91,000 active general internists report spending 60% of their aggregate time providing care in an office setting, which equates to 54,600 FTE physicians providing office-based care; and they report spending 22% of their time providing hospital inpatient care which is equivalent to 12,300 FTEs providing inpatient care. The remaining time of general internists is spent providing hospital outpatient care, emergency consults, assisting with surgery, and providing care in other settings (which activities together equates to approximately 24,100 FTEs).
Then, using healthcare utilization information to estimate the proportion of physician care provided to different population groups, physician-to-population ratios were constructed for 112 subsets of the population defined by age (0 to 5, 6 to 17, 18 to 20, 21 to 44, 45 to 64, 65 to 74, 75 and older), gender, race/ethnicity (non-Hispanic white, non-Hispanic black, non-Hispanic other, Hispanic), and whether insured. These physician-to-population ratios were developed using FTE physician counts in 2006 that exclude physicians currently in GME programs. Consequently, to assess the future adequacy of supply the demand projections should be compared to FTE patient care supply excluding residents and fellows. These detailed physician-to-population ratios reflect current national patterns of healthcare utilization and delivery.
Data sources analyzed to determine the distribution of services provided to each population group include:
• 2005 National Ambulatory Medical Care Survey (NAMCS) to estimate utilization of services provided in office visits;
© 2008 AAMC. May not be reproduced without permission. 80

The Complexities of Physician Supply and Demand: Projections Through 2025
• 2005 National Hospital Ambulatory Medical Care Survey (NHAMCS) to estimate utilization of services provided through hospital emergency and outpatient visits; and
• 2005 Nationwide Inpatient Sample (NIS) to estimate utilization of physician services in hospital inpatient settings.
While the NAMCS contains an identifier for physician specialty, an analysis of diagnosis codes in the other surveys was used to identify the likely specialty of the physician seen to estimate the proportion of physician services provided to each demographic group. If, for example, a specific demographic group (e.g., males age 21 to 44) is responsible for 10% of the office-based visits for a particular specialty, then 10% of the FTE office-based physicians for that specialty is divided by the size of the population in the demographic group to calculate physician-to-population ratios for that demographic group for office-based care for that specialty.
The “other visits” category for which AMA has historically collected data through its survey is not well defined, but could include visits in the home, nursing homes, and workplace. This category of visits accounts for a relatively small proportion of physician time, and for modeling purposes physician-to-population ratios are calculated for care received in these other settings under the assumption that the demographic distribution of patients served is similar to the demographic distribution of patients served in physician offices.
© 2008 AAMC. May not be reproduced without permission. 81
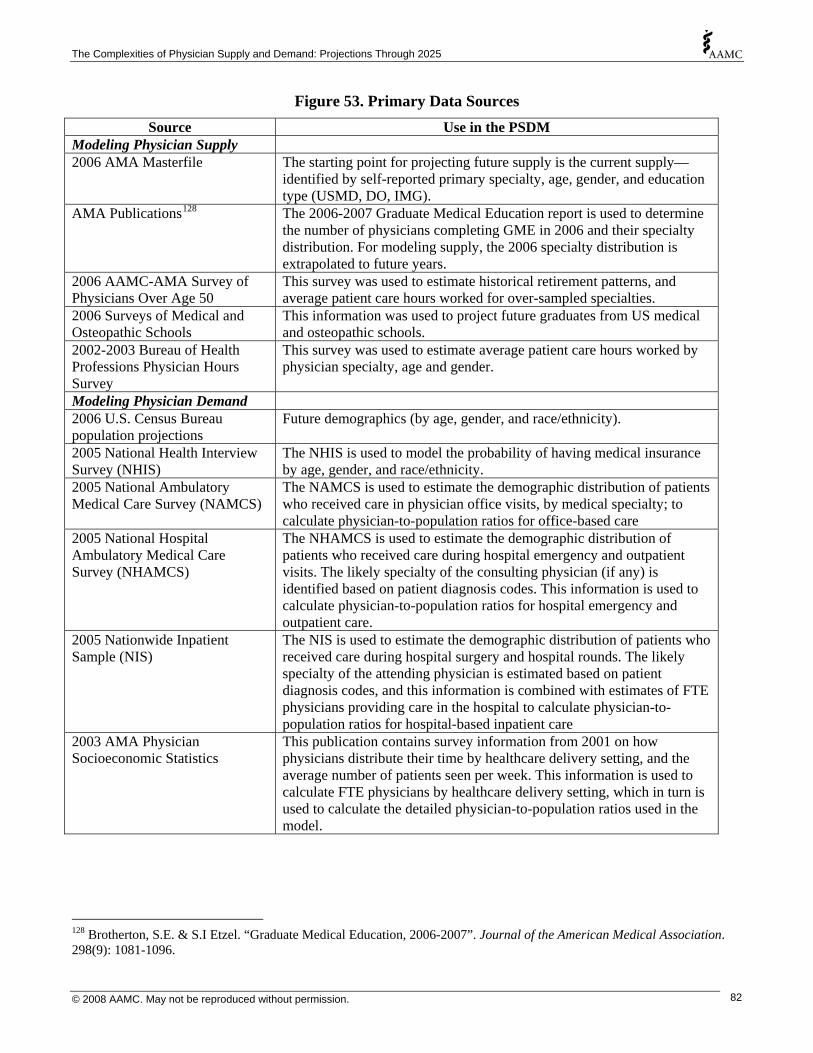
The Complexities of Physician Supply and Demand: Projections Through 2025
Figure 53. Primary Data Sources Source Use in the PSDM
Modeling Physician Supply 2006 AMA Masterfile The starting point for projecting future supply is the current supply—
identified by self-reported primary specialty, age, gender, and education type (USMD, DO, IMG).
AMA Publications128 The 2006-2007 Graduate Medical Education report is used to determine the number of physicians completing GME in 2006 and their specialty distribution. For modeling supply, the 2006 specialty distribution is extrapolated to future years.
2006 AAMC-AMA Survey of Physicians Over Age 50
This survey was used to estimate historical retirement patterns, and average patient care hours worked for over-sampled specialties.
2006 Surveys of Medical and Osteopathic Schools
This information was used to project future graduates from US medical and osteopathic schools.
2002-2003 Bureau of Health Professions Physician Hours Survey
This survey was used to estimate average patient care hours worked by physician specialty, age and gender.
Modeling Physician Demand 2006 U.S. Census Bureau population projections
Future demographics (by age, gender, and race/ethnicity).
2005 National Health Interview Survey (NHIS)
The NHIS is used to model the probability of having medical insurance by age, gender, and race/ethnicity.
2005 National Ambulatory Medical Care Survey (NAMCS)
The NAMCS is used to estimate the demographic distribution of patients who received care in physician office visits, by medical specialty; to calculate physician-to-population ratios for office-based care
2005 National Hospital Ambulatory Medical Care Survey (NHAMCS)
The NHAMCS is used to estimate the demographic distribution of patients who received care during hospital emergency and outpatient visits. The likely specialty of the consulting physician (if any) is identified based on patient diagnosis codes. This information is used to calculate physician-to-population ratios for hospital emergency and outpatient care.
2005 Nationwide Inpatient Sample (NIS)
The NIS is used to estimate the demographic distribution of patients who received care during hospital surgery and hospital rounds. The likely specialty of the attending physician is estimated based on patient diagnosis codes, and this information is combined with estimates of FTE physicians providing care in the hospital to calculate physician-to-population ratios for hospital-based inpatient care
2003 AMA Physician Socioeconomic Statistics
This publication contains survey information from 2001 on how physicians distribute their time by healthcare delivery setting, and the average number of patients seen per week. This information is used to calculate FTE physicians by healthcare delivery setting, which in turn is used to calculate the detailed physician-to-population ratios used in the model.
128 Brotherton, S.E. & S.I Etzel. “Graduate Medical Education, 2006-2007”. Journal of the American Medical Association. 298(9): 1081-1096.
© 2008 AAMC. May not be reproduced without permission. 82

The Complexities of Physician Supply and Demand: Projections Through 2025
Current Supply
The current supply is the starting point for projecting the future supply of physicians. The size, demographics, and specialty mix of the physician workforce in each future year is determined largely by the supply in the preceding year. The AMA Masterfile is the most complete source of information on current supply. The Masterfile contains self-reported primary specialty, birth year, gender, primary activity (e.g., direct patient care, non-patient care, resident), and other information. After applying an algorithm (described later) to the Masterfile to adjust for the probability that each physician is active in professional activities, there were an estimated 789,200 active physicians in 2006. This includes 108,600 (14%) who were completing their residency or fellowships, and 680,500 (86%) in practice (Figure 54). The large majority of active physicians were in direct patient care. The primary work activity is unknown for approximately 9% of physicians, and these physicians were distributed across the direct patient care and non-patient care categories using each category’s prorated share.
Figure 54. Estimated Active Physician Supply, 2006
Non-patient care 34,300
4%
Medical Research
12,300 2%
Residents/Fellows 108,600
14%
Direct Patient Care 573,100
73%
Other 2,800 <1%
Administration 10,600
1%
MedicalTeaching
8,600 1%
Unclassified 73,200
9%
Source: AMA Masterfile adjusted for AAMC estimated algorithm of probability active.
One limitation of the AMA Masterfile for estimating current physician supply is the time lag between when a physician’s work status changes and when the information is updated in the database. The AMA attempts to contact approximately one third of physicians each year to update their information in the Masterfile. So if, for example, a physician retires, there can be up to a 3-year lag before their status is changed from active to inactive.129 Some physicians choose not to respond to AMA’s request for information, and this non-response contributes to the uncertainty of whether an individual physician is active or retired. These issues in updating physicians’ activity status create the possibility that the Masterfile overestimates the supply of active physicians—especially for older physicians.
To collect additional information on physicians, AAMC, in collaboration with the AMA and nine specialty associations, conducted a survey of 18,000 physicians age 50 and older. The questionnaire was used to collect information on whether the physician was working part time, full time, or retired.
129 AMA also analyzes sources other than the physician survey to maintain and update the Masterfile.
© 2008 AAMC. May not be reproduced without permission. 83

The Complexities of Physician Supply and Demand: Projections Through 2025
Physicians also reported hours worked in various activities. Some physicians listed as active130 in the Masterfile reported through the AAMC-AMA survey that they had retired, with this phenomenon more common among older physicians. A portion of physicians listed as retired or inactive in the Masterfile reported through the AAMC-AMA survey they are still working (often these were physicians working part time).
Comparing self-reported activity status from the AAMC-AMA survey (assumed to represent the correct activity status at the time of the survey) with the activity status in the Masterfile, logistic regression analysis was used to develop an algorithm that predicts the probability a physician is working at least one hour per week in medicine as a function of their activity status listed in the Masterfile, age, gender, and specialty. The predicted probability of working was then applied to each physician in the Masterfile to estimate total active physicians. For modeling, all physicians are assumed to retire by age 75.131
After adjusting for workforce activity probability, there were an estimated 782,200 active physicians under age 75 in 2006 (approximately 29,000 fewer than were listed as active in the Masterfile despite using a broader definition of active for older physicians). The activity probability adjustment applied to the Masterfile varies by physician age, gender, specialty, and AMA Masterfile activity status. The regression findings for physicians with an AMA Masterfile activity status of Direct Patient Care, Retired, and Semi-retired is provided in Figures 55 and 56.
130 AMA defines an active physician as one working 20 or more hours per week in medical activities. For purposes of modeling, an active physician is defined as one who works at least one hour per week in medical activities. Part of the active workforce works fewer than 20 hours per week in medical activities, and thus would be counted as active for this analysis but is inactive using the AMA definition. When using the AAMC Survey of Physicians Over Age 50 to compute average hours worked by physician age, gender and specialty, all physicians working at least one hour per week were included. 131 The AMA Masterfile lists as active approximately 34,000 physicians age 75 and above, which if they are active would represent approximately 4% of total active physicians. Our analysis to compare physician activity status from the AAMC over age 50 survey with the activity status in the Masterfile did not include the 75 and older population because of small sample size in the survey. It is likely that a large portion of these older physicians has retired and that the activity status in the Masterfile is incorrect, and that for those still active in medicine their work hours are reduced. Thus, this population likely represents less than 4% of FTE physician supply.
© 2008 AAMC. May not be reproduced without permission. 84
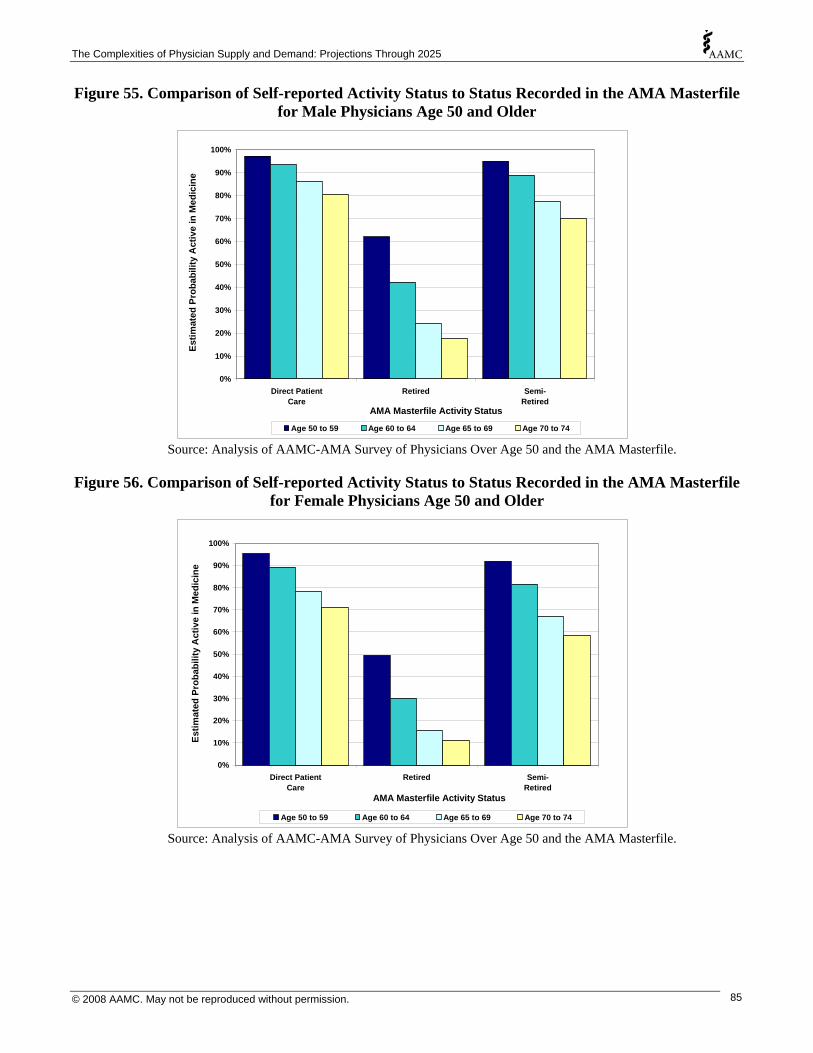
The Complexities of Physician Supply and Demand: Projections Through 2025
Figure 55. Comparison of Self-reported Activity Status to Status Recorded in the AMA Masterfile for Male Physicians Age 50 and Older
0%
10%
20%
30%
40%
50%
60%
70%
80%
90%
100%
Direct PatientCare
Retired Semi-Retired
AMA Masterfile Activity Status
Estim
ated
Pro
babi
lity
Act
ive
in M
edic
ine
Age 50 to 59 Age 60 to 64 Age 65 to 69 Age 70 to 74 Source: Analysis of AAMC-AMA Survey of Physicians Over Age 50 and the AMA Masterfile.
Figure 56. Comparison of Self-reported Activity Status to Status Recorded in the AMA Masterfile for Female Physicians Age 50 and Older
0%
10%
20%
30%
40%
50%
60%
70%
80%
90%
100%
Direct PatientCare
Retired Semi-Retired
AMA Masterfile Activity Status
Estim
ated
Pro
babi
lity
Act
ive
in M
edic
ine
Age 50 to 59 Age 60 to 64 Age 65 to 69 Age 70 to 74 Source: Analysis of AAMC-AMA Survey of Physicians Over Age 50 and the AMA Masterfile.
© 2008 AAMC. May not be reproduced without permission. 85

The Complexities of Physician Supply and Demand: Projections Through 2025
Retirement
The federal Bureau of Health Professions (BHPr) has conducted analyses of physician retirement rates for use in BHPr’s Physician Supply Model.132 The approach used to estimate physician retirement patterns for the BHPr model was to look at a point-in-time snapshot of the AMA Masterfile to determine the percentage of physicians who are active by age, gender, and specialty.
There are two challenges with estimating retirement rates directly from the Masterfile data. As discussed previously, the time lag between when physicians retire and when their Masterfile profile is updated will bias retirement rates downward (i.e., suggesting that physicians retire later than is actually the case). The retirement rates estimated using the AAMC-AMA survey of older physicians have physicians retiring earlier than suggested by the retirement rates in BHPr’s model.
The second challenge is that physicians who die are eventually removed from the Masterfile, again biasing the total attrition from the workforce. This challenge can be overcome by factoring mortality into the overall attrition rates using, for example, mortality data from the Centers for Disease Control and Prevention (CDC).
The AAMC-AMA Survey of Physicians Over Age 50 collected information on retirement—including actual age at retirement if already retired, and age when the physician expects to retire if still active. Retirement rates were thus developed as follows:
• Historical retirement patterns were calculated using the reported age at retirement based on survey responses for physicians age 70 and older. For physicians age 70 and older who were still active, their expected age of retirement was used. A problem with using historical retirement patterns is that they might not capture differences across age cohorts in lifestyle decisions that include age of retirement, and trends over time in economic and other factors (e.g., dissatisfaction with the health operating environment, changes in Medicare eligibility age, stock market performance, changes in tax rates). Despite these limitations, historical retirement patterns are assumed to be the best predictors of future retirement patterns.
• AAMC-AMA survey on age intending to retire were analyzed for comparison. These data find that a significant number of physicians expect to retire at milestone and eligibility ages—e.g., age 60 (milestone), age 62 (early eligibility for Social Security), age 65 (Medicare eligibility and eligibility for full Social Security benefits), and age 70 (milestone). There are numerous factors that go into retirement decisions, with some decisions not completely within the physician’s control (e.g., poor health, stock market surge/crash, selling of medical practice). Active physicians who are nearing retirement likely can more accurately predict their age at retirement than can physicians who are still years away from retirement (e.g., physicians in their 50s).
• Mortality rates are based on CDC estimates for men and women. To adjust for the lower mortality occupational risk for physicians, their greater access to quality healthcare services, and their generally better health associated with affluence, the mortality rates were adjusted to 80% of the national average for each age group. This adjustment is based on work by Johnson et al. (1999) who find that mortality rates among people age 25 to 64 are lower for physicians and other professional and technical occupations compared to mortality rates in most non-professional occupations.133 For white males, age-adjusted mortality rates for professional and
132 Health Resources and Services Administration. “Physician Supply and Demand: Projections to 2020”. <http://bhpr.hrsa.gov/healthworkforce/reports/physiciansupplydemand/default.htm>. (Accessed: 2007-June-19.) 133 Johnson, N.J.; Sorlie, P.D.; & E. Backlund. 1999. “The Impact of Specific Occupation on Mortality in the U.S. National Longitudinal Mortality Study”. Demography, 36(3): 355-367.
© 2008 AAMC. May not be reproduced without permission. 86
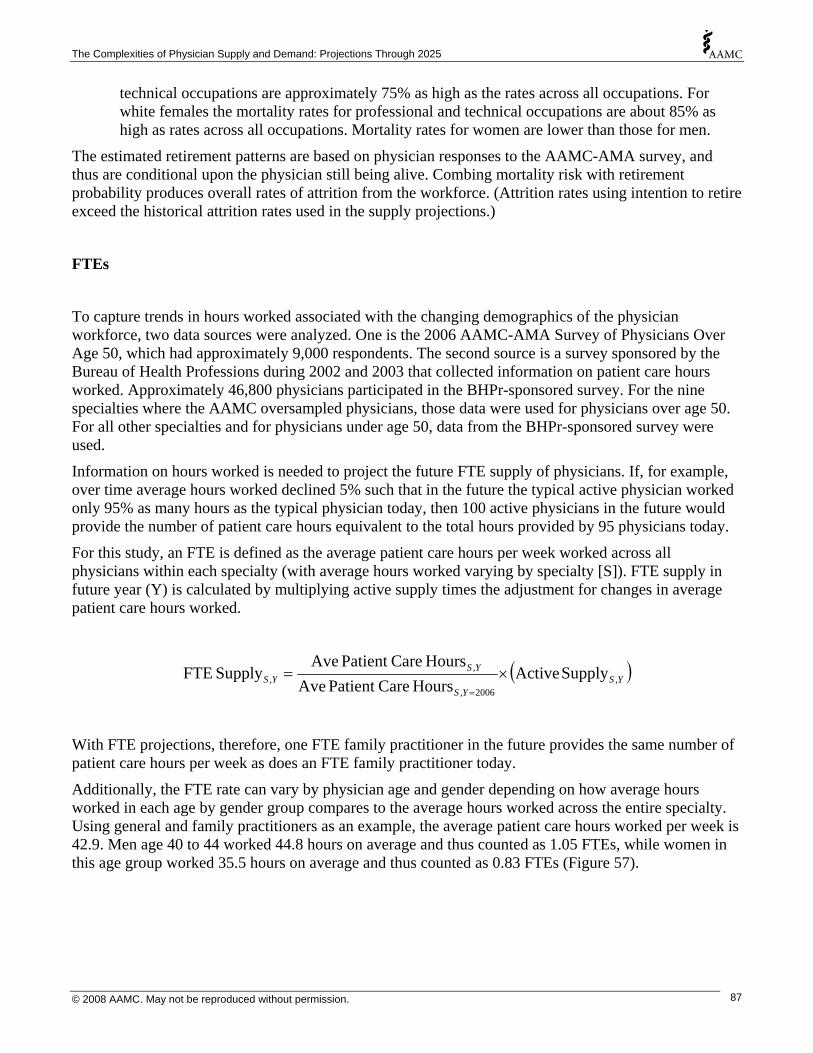
The Complexities of Physician Supply and Demand: Projections Through 2025
technical occupations are approximately 75% as high as the rates across all occupations. For white females the mortality rates for professional and technical occupations are about 85% as high as rates across all occupations. Mortality rates for women are lower than those for men.
The estimated retirement patterns are based on physician responses to the AAMC-AMA survey, and thus are conditional upon the physician still being alive. Combing mortality risk with retirement probability produces overall rates of attrition from the workforce. (Attrition rates using intention to retire exceed the historical attrition rates used in the supply projections.)
FTEs
To capture trends in hours worked associated with the changing demographics of the physician workforce, two data sources were analyzed. One is the 2006 AAMC-AMA Survey of Physicians Over Age 50, which had approximately 9,000 respondents. The second source is a survey sponsored by the Bureau of Health Professions during 2002 and 2003 that collected information on patient care hours worked. Approximately 46,800 physicians participated in the BHPr-sponsored survey. For the nine specialties where the AAMC oversampled physicians, those data were used for physicians over age 50. For all other specialties and for physicians under age 50, data from the BHPr-sponsored survey were used.
Information on hours worked is needed to project the future FTE supply of physicians. If, for example, over time average hours worked declined 5% such that in the future the typical active physician worked only 95% as many hours as the typical physician today, then 100 active physicians in the future would provide the number of patient care hours equivalent to the total hours provided by 95 physicians today.
For this study, an FTE is defined as the average patient care hours per week worked across all physicians within each specialty (with average hours worked varying by specialty [S]). FTE supply in future year (Y) is calculated by multiplying active supply times the adjustment for changes in average patient care hours worked.
( )YSYS
YSYS ,
2006,
,, Supply Active
Hours CarePatient AveHours CarePatient Ave
Supply FTE ×==
With FTE projections, therefore, one FTE family practitioner in the future provides the same number of patient care hours per week as does an FTE family practitioner today.
Additionally, the FTE rate can vary by physician age and gender depending on how average hours worked in each age by gender group compares to the average hours worked across the entire specialty. Using general and family practitioners as an example, the average patient care hours worked per week is 42.9. Men age 40 to 44 worked 44.8 hours on average and thus counted as 1.05 FTEs, while women in this age group worked 35.5 hours on average and thus counted as 0.83 FTEs (Figure 57).
© 2008 AAMC. May not be reproduced without permission. 87
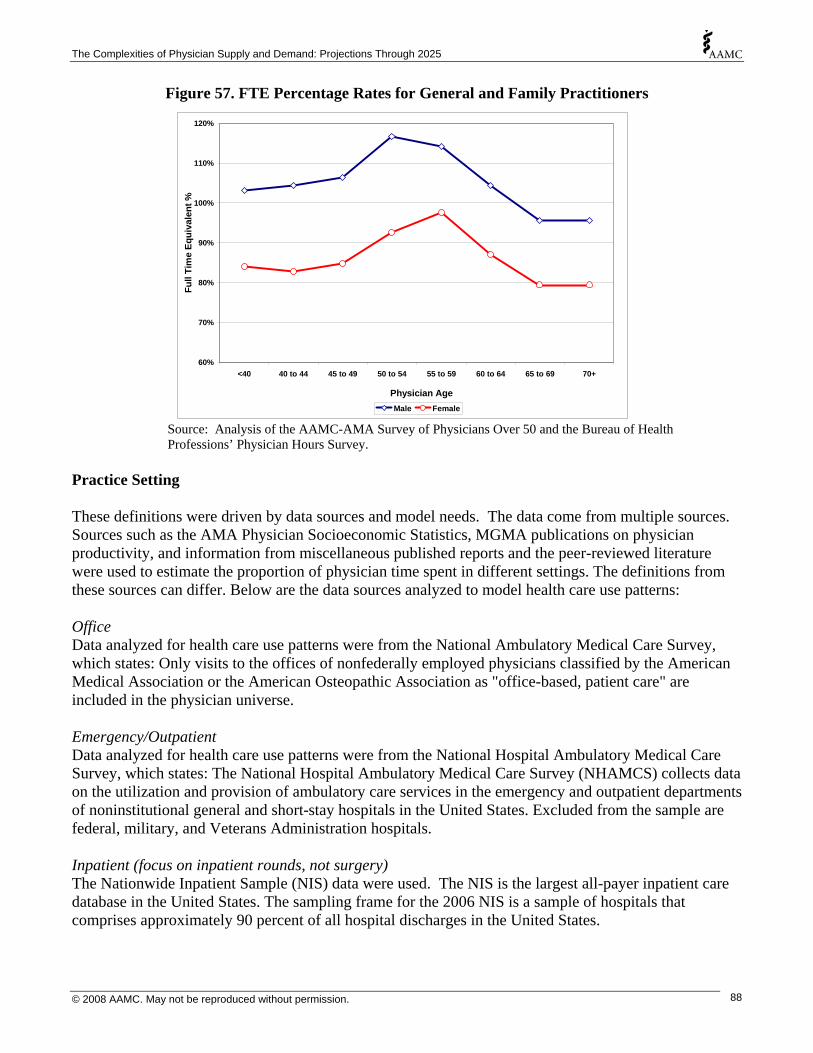
The Complexities of Physician Supply and Demand: Projections Through 2025
Figure 57. FTE Percentage Rates for General and Family Practitioners
60%
70%
80%
90%
100%
110%
120%
<40 40 to 44 45 to 49 50 to 54 55 to 59 60 to 64 65 to 69 70+
Physician Age
Full
Tim
e Eq
uiva
lent
%
Male Female Source: Analysis of the AAMC-AMA Survey of Physicians Over 50 and the Bureau of Health Professions’ Physician Hours Survey.
Practice Setting These definitions were driven by data sources and model needs. The data come from multiple sources. Sources such as the AMA Physician Socioeconomic Statistics, MGMA publications on physician productivity, and information from miscellaneous published reports and the peer-reviewed literature were used to estimate the proportion of physician time spent in different settings. The definitions from these sources can differ. Below are the data sources analyzed to model health care use patterns: Office Data analyzed for health care use patterns were from the National Ambulatory Medical Care Survey, which states: Only visits to the offices of nonfederally employed physicians classified by the American Medical Association or the American Osteopathic Association as "office-based, patient care" are included in the physician universe. Emergency/Outpatient Data analyzed for health care use patterns were from the National Hospital Ambulatory Medical Care Survey, which states: The National Hospital Ambulatory Medical Care Survey (NHAMCS) collects data on the utilization and provision of ambulatory care services in the emergency and outpatient departments of noninstitutional general and short-stay hospitals in the United States. Excluded from the sample are federal, military, and Veterans Administration hospitals. Inpatient (focus on inpatient rounds, not surgery) The Nationwide Inpatient Sample (NIS) data were used. The NIS is the largest all-payer inpatient care database in the United States. The sampling frame for the 2006 NIS is a sample of hospitals that comprises approximately 90 percent of all hospital discharges in the United States.
© 2008 AAMC. May not be reproduced without permission. 88

The Complexities of Physician Supply and Demand: Projections Through 2025
Surgery For inpatient-based surgery, the NIS data were used. Also analyzed were data from the the the National Survey of Ambulatory Surgery (NSAS). The NSAS is the only national study of ambulatory surgical care in hospital-based and freestanding ambulatory surgery centers. Other This setting includes occupational health settings, nursing homes, home health, and anything else not included in the above settings. The proportion of physician time spent providing care in this setting is very small. Originally, to model this setting physician services provided in a home health setting were analyzed as a proxy. Later, this setting was mapped to mimic the office setting.
© 2008 AAMC. May not be reproduced without permission. 89

The Complexities of Physician Supply and Demand: Projections Through 2025
This full report is available at http://www.aamc.org/workforce.
© 2008 AAMC. May not be reproduced without permission. 90

Association ofAmerican Medical Colleges2450 N Street, N.W., Washington, D.C. 20037-1127T 202 828 0400 F 202 828 1125www.aamc.org