The Competitiveness of Global Port-Cities - Uniorbilu.uni.lu/bitstream/10993/5356/1/OECD Hamburg...
49
she'd be free for lunch from 12:45pm-2:30pm or anytime between 4pm-6pm. httt The Competitiveness of Global Port-Cities: The Case of Hamburg - Germany Please cite this paper as: Olaf Merk and Markus Hesse JEL classification: R41, R11, R12, R15, L91, D57 Merk, O., Hesse. M. (2012), “The Competitiveness of Global Port-Cities: the Case of Hamburg”, OECD Regional Development Working Papers, 2012/06, OECD Publishing http://dx.doi.org/10.1787/5k97g3hm1gvk-en OECD Regional Development Working Papers, 2012/06
-
Upload
nguyenkhuong -
Category
Documents
-
view
213 -
download
0
Transcript of The Competitiveness of Global Port-Cities - Uniorbilu.uni.lu/bitstream/10993/5356/1/OECD Hamburg...

she'd be free for lunch from 12:45pm-2:30pm or anytime between 4pm-6pm.
httt
The Competitiveness of Global Port-Cities:
The Case of Hamburg - Germany
Please cite this paper as:
Olaf Merk and Markus Hesse
JEL classification: R41, R11, R12, R15, L91,
D57
Merk, O., Hesse. M. (2012), “The Competitiveness of
Global Port-Cities: the Case of Hamburg”, OECD Regional
Development Working Papers, 2012/06, OECD Publishing
http://dx.doi.org/10.1787/5k97g3hm1gvk-en
OECD Regional Development Working
Papers, 2012/06

1
OECD REGIONAL DEVELOPMENT WORKING PAPERS
This series is designed to make selected OECD studies on regional development issues available to a wider
readership. Authorship is usually collective, but principal authors are named. The papers are generally
available in their original language, either English or French, with a summary in the other if provided.
This work is published on the sole responsibility of the author(s). The opinions expressed and arguments
employed herein do not necessarily reflect the official views of the OECD or of the governments of its
member countries.
Comment on the series is welcome, and should be sent to [email protected] or the Public Governance
and Territorial Development Directorate, 2, rue André Pascal, 75775 PARIS CEDEX 16, France.
---------------------------------------------------------------------------
OECD Regional Development Working Papers are published on
www.oecd.org/gov/regional/workingpapers
---------------------------------------------------------------------------
Applications for permission to reproduce or translate all or part of this material should be made to: OECD
Publishing, [email protected] or by fax +33 1 45 24 99 30.
© OECD 2012
Photo credits: © Hamburg Port Authority

2
ABSTRACT
This working paper offers an evaluation of the performance of the Port of Hamburg, as well as an
analysis of the port‟s impact on its territory and an assessment of relevant policies and governance. It
examines port performance in the last decade and identifies the principal factors that have contributed to it.
In addition, the report studies the potential for synergies between the Hamburg and Bremerhaven ports.
The study also considers the effect of these ports on economic and environmental questions. The value
added of the port cluster of Hamburg is calculated, and its linkages with other economic sectors and
regions in Germany are delineated. Specifically, the paper outlines the impact of the port‟s operations, and
shows how its activities spill over into other regions. The report also assesses major policies governing the
port, as well as transport and economic development, the environment and spatial planning. These policies
include measures instituted by the port authority and local, regional and national governments. Governance
mechanisms at these different levels are described and analysed. Based on the report‟s findings, proposed
recommendations aim to improve port performance and increase the positive effects of the port on its
territory.
JEL classification: R41, R11, R12, R15, L91, D57
Keywords: ports, regional development, regional growth, urban growth, inter-regional trade,
transportation, input-output

3
FOREWORD
This working paper is one in a series of OECD Working Papers on Regional Development published
by the OECD Public Governance and Territorial Development Directorate. It is the second case study of
the OECD Port Cities Programme, elaborated with the support and co-operation of the Free and Hanseatic
City of Hamburg. The OECD Secretariat would especially like to thank Wibke Mellwig, Hannah Rehders
and Martin von Ivernois for their support during the different stages of the study process. This paper was
written by Olaf Merk, (Administrator, OECD Regional Development Policy Division) and Markus Hesse
(University of Luxembourg). It was directed by Olaf Merk, under the responsibility of Joaquim Oliveira
Martins (Head of the Regional Development Policy Division). It draws on the work of a number of other
contributors, including Walter Manshanden (TNO Inro Netherlands), César Ducruet (CNRS), Géraldine
Planque (Grand Port Maritime de Marseille) and Mathieu Bordes. The publication was edited by Caitlin
Connelly.
The paper can be downloaded on the OECD website: www.oecd.org/regional/portcities
Further enquiries about this work in this area should be addressed to:
Olaf Merk ([email protected]), OECD Public Governance and Territorial Development Directorate.

4
TABLE OF CONTENTS
FOREWORD ................................................................................................................................................... 3
ACRONYMS AND ABBREVIATIONS ........................................................................................................ 5
ZUSAMMENFASSUNG ................................................................................................................................ 6
POLITISCHE HANDLUNGSEMPFEHLUNGEN ........................................................................................ 7
EXECUTIVE SUMMARY ............................................................................................................................. 8
POLICY RECOMMENDATIONS ................................................................................................................. 9
1. PERFORMANCE...................................................................................................................................... 10
1.1 Performance of the Port of Hamburg ................................................................................................... 10 1.2 Synergies at a regional scale ................................................................................................................ 22
2. IMPACT .................................................................................................................................................... 26
2.1 Economic impact ................................................................................................................................. 26 2.2 Environmental impact .......................................................................................................................... 32
3. POLICIES AND GOVERNANCE ........................................................................................................... 35
3.1 Port-city development .......................................................................................................................... 35 3.2 Land use, transportation and metropolitan governance ....................................................................... 39
BIBLIOGRAPHY ......................................................................................................................................... 43
NOTES .......................................................................................................................................................... 48

5
ACRONYMS AND ABBREVIATIONS
AAPA American Association of Port Authorities
ABB Asea Brown Boveri
AIS Antwerp Intermodal Solutions
BMVBS Bundesministerium für Verkehr, Bau und Stadtentwicklung
EU European Union
GEFEK Commercial Land Development Plan (Gewerbeflächenentwicklungskonzept)
GRT gross revenue tonnage
HHLA Hamburger Hafen und Logistik AG
HPA Hamburg Port Authority
IBA International Building Exhibition
IGS International Gardening Exhibition
I-O input-output
MKRO The joint Conference of Ministers for Regional Planning of States and Federal
Government (Ministerkonferenz für Raumordnung)
MSC Mediterranean Shipping Company
OECD Organisation for Economic Co-operation and Development
TEU Twenty-foot Equivalent Unit

6
ZUSAMMENFASSUNG
Der Hamburger Hafen hat sich in den vergangenen Jahrzehnten als sehr erfolgreich und
leistungsstark erwiesen. Die Weltwirtschaftskrise hat jedoch auch Schwachstellen offenbart. Seit den
1980er Jahren ist der Marktanteil Hamburgs unter den nordwesteuropäischen Häfen stark angestiegen,
insbesondere im Containerverkehr (von 13 % im Jahr 1980 auf 26 % im Jahr 2005). Hamburg ist heute der
zweitgrößte Containerhafen Europas.1 Gleichwohl war infolge der Weltwirtschaftskrise ein stärkerer
Wachstumsrückgang für den Hamburger Hafen zu verzeichnen als bei den anderen nordwesteuropäischen
Häfen. Der Marktanteil des Hamburger Hafens beläuft sich heute auf 23,7 % bei Containern und 14,9 %
bei Frachtgut insgesamt.2 Das jährliche Wachstum betrug 2001–2011 2,9 % und blieb somit hinter dem der
größten Konkurrenten, Rotterdam (3,7 %) und Antwerpen (4,4 %), zurück.
Der Hamburger Hafen hat eine wichtige wirtschaftliche Bedeutung. Der Hafen und die dortigen
Aktivitäten machen einen erheblichen Anteil an der Beschäftigung (je nach Definition 5–10 %) und an der
Wertschöpfung in der Metropolregion Hamburg aus. Dieser Bericht identifiziert darüber hinaus wichtige
indirekte wirtschaftliche Effekte: jeder zusätzliche Euro Nachfrage im Hamburger Hafen führt zu
0,71 EUR zusätzlichen Ausgaben in anderen Sektoren (d. h., der Multiplikator des Hafens beträgt 1,71 und
ist damit höher als der von Häfen wie Rotterdam oder Antwerpen). Diese indirekten Effekte sind besonders
hoch in den Bereichen Fahrzeugbau, Nahrungsmittel, Petrochemie und Transport, jedoch auch in anderen
Sektoren.
Die meisten positiven Effekte sind außerhalb Hamburgs spürbar und entfallen auf das übrige
Gebiet der Bundesrepublik sowie weite Teile Mitteleuropas. Insgesamt wirken sich nur 13 % der
Multiplikatoreffekte auf Hamburg und die benachbarten Bundesländer aus, jedoch fast ein Drittel auf die
zwei großen süddeutschen Bundesländer (Bayern und Baden-Württemberg) und mehr als die Hälfte auf
das restliche Deutschland. Auch im Import und Export von Gütern spielt der Hamburger Hafen eine
zentrale Rolle für große Teile Deutschlands sowie Mitteleuropas (z. B. ist Hamburg der wichtigste Hafen
für Ungarn und die Tschechische Republik). Außerdem ist Hamburg der zentrale Hafen für Transhipment
und Short Sea Shipping in den Ostseeraum, wo der Hamburger Hafen über eine stärkere Position als
Transhipment-Hub verfügt als zum Beispiel Rotterdam oder Bremerhaven. Die Bundesregierung sollte die
zentrale Rolle, die der Hamburger Hafen für das gesamte Bundesgebiet einnimmt, stärker anerkennen und
diese auch zukünftig durch die Bereitstellung von Investitionsmitteln für Infrastrukturprojekte, die für die
Zukunft des Hamburger Hafens von größter Wichtigkeit sind, nachhaltig sicherstellen. Hierzu zählen z.B.
die Fahrrinnenanpassung der Unter- und Außenelbe und die Sanierung der Schleusen des Nord-Ostsee-
Kanals.
Sowohl die Stadt als auch der Hafen haben Wachstumsambitionen, die durch die begrenzte
Verfügbarkeit an Flächenreserven eingeschränkt werden. Dies führt zu anhaltenden
Raumplanungsdiskussionen in Hamburg. Ehemalige, für einen zeitgemäßen Hafenbetrieb nicht mehr
nutzbare Hafengebiete, wurden in den Bau des größten Hafenentwicklungsprojekts in Europa, der
HafenCity, mit einbezogen. Die Hamburg Port Authority bestätigt den Bedarf an koordinierter
Raumplanung und zieht es daher in Betracht, Wirtschaftstätigkeiten einzubringen, die die regionale
Entwicklung der Hafengebiete bereichern. Gleichzeitig werden in einem Prozess der
„Hafenregionalisierung“ viele logistische Bereiche in Vororte ausgelagert. Dies könnte den Bedarf an
neuen Steuerungsmechanismen entstehen lassen, die die regionale Koordinierung stärken. Dieser Bericht
identifiziert Komplementaritäten zwischen den Häfen von Hamburg und Bremerhaven und zeigt
potenzielle Synergien auf, die einen Wettbewerbsvorteil gegenüber anderen Hafenregionen in der Welt
bieten könnten. Wie diese Synergien erschlossen werden können und welche Arrangements dafür nötig
sind, muss allerdings erst noch bestimmt werden.

7
POLITISCHE HANDLUNGSEMPFEHLUNGEN
Für die Hamburg Port Authority:
- Ausrichtung eines zukünftigen Hafenentwicklungsplans und der Restrukturierung des
Hafengebiets (z. B. Central Terminal Steinwerder) mit Hinblick auf Diversifizierung und
Aktivitäten, die die regionale Entwicklung bereichern.
- Einführung von „Co-opetition“ (Balance aus Kooperation und Wettbewerb) zwischen Häfen in
dazu geeigneten Tätigkeitsbereichen. Die Häfen von Hamburg und Bremerhaven ergänzen sich auf
eine Art und Weise, die für beide ein Wettbewerbsvorteil sein könnte. Sie könnten gemeinsam
internationale Marketing- und Werbeaktionen entwickeln und in diesem Sinne noch weitere
Bereiche der Zusammenarbeit erschließen. In diesen Ansatz könnten auch weitere nationale,
regionale und benachbarte Häfen miteinbezogen werden.
- Erleichterung der Entwicklung von Extended Gates des Hamburger Hafens in anderen Teilen
Deutschlands, v. a. südlichen Bundesländern wie Bayern und Baden-Württemberg.
- Weitere und größere Öffnung des Hafens für ein breiteres Publikum, zur nachhaltigen
Sicherstellung und weiteren Förderung der öffentlichen Akzeptanz und Identifikation des Hafens
durch die ortsansässige Bevölkerung.
Für die Freie und Hansestadt Hamburg:
- Entwicklung einer regionalen Logistikstrategie wie der „Logistik-Initiative Hamburg“ zusammen
mit den Landkreisen der Metropolregion Hamburg und anderen Akteuren, die Orientierung
darüber verschaffen kann, wo Logistikaktivitäten entwickelt und wo Lagerstätten und
Distributionszentren platziert werden können. Diese Strategie könnte zu einer koordinierten
Entwicklung von Siedlungen, Flächennutzung und Baurichtlinien führen und der institutionell
bedingten Fragmentierung in diesem Bereich entgegenwirken.
Für die Bundesregierung:
- Stärkere Anerkennung der zentralen Rolle des Hamburger Hafens für Industrie und Verbraucher in
Deutschland.
- Schaffung von Investitionsanreizen zur Stärkung der Position des Hamburger Hafens,
einschließlich des Anschlusses an andere Regionen in Deutschland. Neben der
Fahrrinnenanpassung der Unter- und Außenelbe sowie der Sanierung der Schleusen des Nord-
Ostsee-Kanals wird die Entwicklung der Infrastruktur von Schiene und Straße im Hinterland (z. B.
die „Y-Trasse“) von entscheidender Bedeutung sein.
- Erleichterung der Entwicklung gemeinsamer Strategien der norddeutschen Bundesländer
(Hamburg, Niedersachsen, Schleswig-Holstein) bezüglich dieser Themen.
- Entwicklung der Binnenschifffahrt von Hamburg in andere Regionen Deutschlands.
Für die Europäische Union:
- Förderung der Entwicklung der landseitigen Stromversorgung für Kreuzfahrt-Terminals in der
Europäischen Union und Erleichterung koordinierter Ansätze.

8
EXECUTIVE SUMMARY
Hamburg‟s port performance has been very successful over the last decades, but its decline after
the global crisis has shown its vulnerability. Since the 1980s, the market share of Hamburg among north-
west European ports has increased significantly, particularly in container traffic (from 13% in 1980 to 26%
in 2005), and Hamburg is now the second-busiest container port in Europe.3 However, the global crisis has
had a strong negative impact on Hamburg‟s growth figures, more than for other northwestern European
ports. As a result, market shares dropped and are now 23.7% for containers and 14.9% for total cargo.4
Annual growth figures over 2001-10 were 2.9%, falling behind main competitors Rotterdam (3.7%) and
Antwerp (4.4%).
The Port of Hamburg has important positive economic impacts. The port and port-related activities
represent a considerable share of metropolitan employment (5-10% depending on definitions) and value
added. Moreover, this report shows that there are important indirect economic effects: an additional euro of
demand in the Port of Hamburg leads to 71 euro cents of additional spending in other sectors (i.e. the
multiplier for the port is 1.71, which is higher than multipliers found for Rotterdam and Antwerp). These
indirect effects are particularly high in the transport equipment sector, food, petro-chemical, transportation,
but have effects on other sectors as well.
Most of these positive impacts are felt outside Hamburg, in the rest of Germany and central Europe.
Overall, only 13% of the multiplier effects have an impact on Hamburg and its neighbouring states, but
almost a third of the multiplier effects spill over to the two large southern states of Germany (Bavaria and
Baden-Württemberg) and more than half to the rest of Germany. Hamburg also has a key role for the
imports and exports of goods for large parts of Germany and for central Europe (e.g. Hamburg is the first
port for Hungary and the Czech Republic). In addition, Hamburg is the prime port for transhipment and
short sea shipping in the Baltic Sea, where it has a stronger position than Rotterdam, Bremerhaven or any
other port. The federal German government – responsible for investments that are crucial for the future of
the Port of Hamburg, such as the dredging of the Elbe River and the replacements of the locks in the Kiel
Canal – should acknowledge this key role of Hamburg for the country.
Both the city and the port have growth ambitions that are constrained by scarcity of land. Hamburg
thus witnesses ongoing discussions on land use. Former port areas have been used for the largest
waterfront development currently in progress in Europe, the HafenCity project. The Hamburg Port
Authority acknowledges the need for co-ordinated land-use planning and is considering introducing
industrial activity that adds regional value to the port areas. Simultaneously, many logistic functions are
sub-urbanising through a process of “port regionalisation”. This might require new governance
mechanisms to strengthen regional co-ordination. This reports finds complementarities between the ports
of Hamburg and Bremerhaven, revealing the potential for synergies that might create be a competitive
advantage vis-à-vis other port regions in the world. How to capitalise on these synergies and the
arrangements necessary to do this still need to be explored.

9
POLICY RECOMMENDATIONS
For the Hamburg Port Authority:
Orient a future port development plan and port land restructuring (such as the Central
Terminal Steinwerder) towards diversification and activities generating regional value added.
Introduce “co-opetition” as a balance of co-operation and competition between ports on
appropriate fields of action. The Hamburg and Bremerhaven ports complement each other in
ways that could be mutually advantageous. They could take joint action on international
marketing and promotion and explore additional areas for co-opetition. Other national,
regional and neighbouring ports should also be included in these approaches.
Facilitate the development of extended gates of the Port of Hamburg in other parts of
Germany, especially in southern states like Bavaria and Baden-Württemberg.
Continue and enhance the opening up of the port towards the broader public, in order to
foster public acceptance and ownership of the port by the local population.
For the city-state of Hamburg:
Develop, together with municipalities in the metropolitan region of Hamburg and other
players, such as the “Logistics Initiative”, a regional logistics strategy that could provide
guidance on where to develop logistics activities and create space for warehouses and
distribution centres. This strategy could lead to co-ordinated development of settlements, land
use, infrastructure and building codes and solve the institutional fragmentation in this domain.
For federal government:
Recognise the key role of the port of Hamburg for German industry and consumers.
Stimulate investments that strengthen Hamburg‟s position, including opportunities to increase
the hinterland connectivity to other areas in Germany. Apart from the deepening of the Elbe
River and the modernisation of the locks in the Kiel Canal the development of the railway and
motorway infrastructure in the hinterland (e.g. “Y-Trasse”) will be crucial.
Facilitate common strategies on these issues between northern German states (Hamburg,
Niedersachsen, Schleswig-Holstein).
Develop inland water transportation from Hamburg to other parts of Germany.
For the European Union:
Stimulate the development of on-shore power supply at cruise ship terminals in the European
Union and facilitate co-ordinated approaches.
10
1. PERFORMANCE
1.1 Performance of the Port of Hamburg
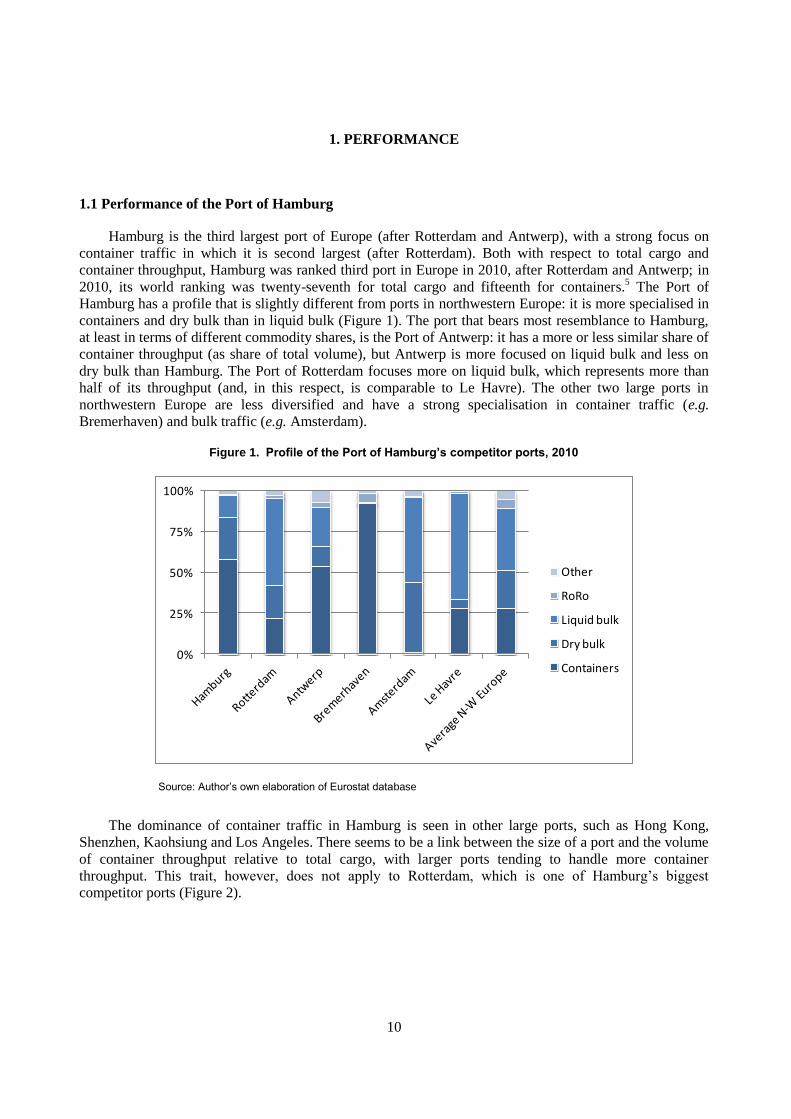
Hamburg is the third largest port of Europe (after Rotterdam and Antwerp), with a strong focus on
container traffic in which it is second largest (after Rotterdam). Both with respect to total cargo and
container throughput, Hamburg was ranked third port in Europe in 2010, after Rotterdam and Antwerp; in
2010, its world ranking was twenty-seventh for total cargo and fifteenth for containers.5 The Port of
Hamburg has a profile that is slightly different from ports in northwestern Europe: it is more specialised in
containers and dry bulk than in liquid bulk (Figure 1). The port that bears most resemblance to Hamburg,
at least in terms of different commodity shares, is the Port of Antwerp: it has a more or less similar share of
container throughput (as share of total volume), but Antwerp is more focused on liquid bulk and less on
dry bulk than Hamburg. The Port of Rotterdam focuses more on liquid bulk, which represents more than
half of its throughput (and, in this respect, is comparable to Le Havre). The other two large ports in
northwestern Europe are less diversified and have a strong specialisation in container traffic (e.g.
Bremerhaven) and bulk traffic (e.g. Amsterdam).
Figure 1. Profile of the Port of Hamburg’s competitor ports, 2010
0%
25%
50%
75%
100%
Other
RoRo
Liquid bulk
Dry bulk
Containers
Source: Author’s own elaboration of Eurostat database
The dominance of container traffic in Hamburg is seen in other large ports, such as Hong Kong,
Shenzhen, Kaohsiung and Los Angeles. There seems to be a link between the size of a port and the volume
of container throughput relative to total cargo, with larger ports tending to handle more container
throughput. This trait, however, does not apply to Rotterdam, which is one of Hamburg‟s biggest
competitor ports (Figure 2).

11
Figure 2. Link between total cargo and container throughput of largest world ports
Source: Author’s own elaboration based on top 125 world port rankings of American Association of Port Authorities (AAPA) Note: TEU stands for twenty-foot equivalent unit, a standard measure for containers
Since 2004, the cruise ship industry has been developing in the Port of Hamburg. Analyses reveals
that the German market for cruise tourism is still underdeveloped (only 2% of the German population has
been on a cruise before, compared to 4% in other countries like USA or GBR), and shows great potential
for Hamburg to compete against the Port of Kiel, Germany‟s leading cruise ship port, in this area. There
are currently two cruise terminals that operate in Hamburg: one in Altona and the other in the HafenCity
(which is among the shareholders of the Hamburg Cruise Center); a third terminal is under consideration.
Growth rates per cargo category
Despite impressive growth rates between 2001-07, Hamburg has experienced slower growth over the
last decade than in competing ports.,. The total cargo throughput for this period grew at an average rate of
7.1% per year – slightly below Antwerp, but much higher than Rotterdam, Amsterdam and Le Havre. This
successful performance was mostly driven by growth rates in the container sector: on average 14% growth
per year. The average annual growth rate of total throughput over 2001-10 was considerably lower (2.9%),
well below the growth rates of its main competitors Rotterdam (3.7%) and Antwerp (4.4%). Other large
northwestern European ports showed even more impressive growth rates over this period: 5.7% in
Amsterdam and 8.1% in Bremerhaven. Only the French port of Le Havre had a substantially lower growth
rate (0.1%). Annual growth rates were higher in the container sector (6.0%), although not as high as other
large ports, including Antwerp, which grew more than twice as fast during this period. Dry bulk remained
stagnant in Hamburg, but did not fall as it did in Rotterdam or Antwerp. Finally, the growth rates in liquid
bulk were more moderate than in Rotterdam, Antwerp and Amsterdam (Table 1).

12
Table 1. Annual percentage growth rates of main ports in Hamburg-Le Havre range, 2001-10)
Total cargo Containers Dry bulk Liquid bulk
20012010
2001-2007
2007 2010
2001-2010
2001-2007
2007-2010
2001-2010
2001-2007
2007-2010
2001-2010
2001-2007
2007-2010
Hamburg 2.9 7.1 -3.9 6.0 14.0 -5.5 0.0 0.7 -1.3 0.4 1.1 -0.8
Rotterdam 3.7 4.4 1.9 8.5 11.3 1.7 -0.2 1.3 -2.8 4.7 4.2 4.6
Antwerp 4.4 7.4 -1.1 14.9 18.9 3.2 -2.2 0.0 -6.6 2.2 2.7 1.1
Bremerhaven 8.1 10.8 1.8 8.9 11.0 2.9
Amsterdam 5.7 5.0 5.4 0.9 1.4 -0.1 15.1 9.9 16.0
Le Havre 0.1 2.2 -3.7 4.0 9.4 -4.4 -2.4 2.1 -10.2 -1.0 -0.3 -2.5
Source: Author’s own calculations based on Eurostat database Note: Due to marginal volumes of Amsterdam in containers and of Bremerhaven in liquid and dry bulk, the growth rates in these commodities are not indicated for these ports
This relatively modest overall performance of Hamburg began in 2007-09 – years marked by dramatic
growth. In the first half of the decade the growth performance of Hamburg was very satisfactory, with
growth over 2001-06 surpassing both Rotterdam‟s and Antwerp‟s growth rates. However, growth came at
a standstill in 2007, and 2008 saw a decline in throughput that was steepest among the main ports in
northwestern Europe. Growth rates have recovered in 2010 at a pace similar to the other large ports (with
the exception of Le Havre).
Figure 3. Growth development of main Hamburg-Le Havre range ports, 2001-10
90
100
110
120
130
140
150
160
170
180
190
2001 2002 2003 2004 2005 2006 2007 2008 2009 2010
Bremerhaven
Antwerpen
Rotterdam
Hamburg
Le Havre
Source: Author’s own elaboration based on Eurostat database Note: Total throughput volume in 2001 is 100 (index).

13
Consequently, Hamburg lost market share within the Hamburg-Le Havre range in northwestern
Europe - the most important area in Europe for port activities, representing around 30% of total European
port throughput - over the last five years (from 15.7% in 2006 to 13.3% in 2010). When looked at within
the context of a longer timeframe, the port has been successful, increasing its market share from 10.5% in
1989 to 13.3% in 2010 (Figure 4). This growth was mostly at the expense of Rotterdam‟s market share,
which witnessed a decline of eight percentage points (from 52.5% to 44.2%) between 1989 and 2006.
Rotterdam‟s market share bounced back by 2006 to 47.1% in 2010. The fluctuation in market shares within
the Hamburg-Le Havre range is even more striking when looking at container traffic in the main western
European ports. In this category, Hamburg‟s market share increased from 13.2% in 1980 to 25.8% in 2005,
falling back to 20.0% in 2010 (Figure 5).
Figure 4. Market share trend by total volume, Hamburg-Le Havre range, 1980-2010
0%
10%
20%
30%
40%
50%
60%
19
80
19
82
19
84
19
86
19
88
19
90
19
92
19
94
19
96
19
98
20
00
20
02
20
04
20
06
20
08
20
10
Rotterdam
Antwerpen
Hamburg
Le Havre
Bremen
Source: Author’s own calculations based on data of different port authorities

14
Figure 5. Market share trends for container throughput, Hamburg-Le Havre range,1980-2010
0%
5%
10%
15%
20%
25%
30%
35%
40%
45%
50%1
98
0
19
82
19
84
19
86
19
88
19
90
19
92
19
94
19
96
19
98
20
00
20
02
20
04
20
06
20
08
20
10
Rotterdam
Antwerpen
Hamburg
Bremen
Le Havre
Source: Author’s own calculations based on data of different port authorities
Short sea shipping
Hamburg is an important port for European transhipment and short sea shipping, and the prime port
for the same in the Baltic Sea. Short sea shipping is maritime shipping within one continent, over relatively
short distances, and generally in smaller vessels. Hamburg scores high on these indicators, compared to
other northwestern European ports. It has a relatively large share of smaller vessels calling at its port: 22%
with a capacity of less than 2000 TEUs (twenty-foot equivalent units) and 17% with less than 1000 TEUs.
This last share is more than three times larger than in Antwerp (Figure 6). More than half (57%) of the
container traffic of the Port of Hamburg is short-range traffic (traffic over distances shorter than 500 km).
Short-range traffic is much less dominant in other northwestern European ports, ranging from 35% in
Felixstowe to 50% in Rotterdam. Hamburg has also witnessed a large increase in the share of this type of
traffic: 13 percentage points between 1996 and 2006, larger than other northwestern European ports
(Figure 7). Within these numbers, it is difficult to distinguish between short sea shipping and feeder traffic,
which consists of the smaller ships that take care of shipping cargo coming from large container vessels to
their final destination). However, when using a different methodology (analysing the main short sea
shipping connections on the basis of the short sea container liner schedules), Hamburg‟s strong position
alongside Rotterdam is confirmed: six to eight (depending on methodology) of the most important short
sea connections in Europe involve the Port of Hamburg, compared to seven for the Port of Rotterdam.
Hamburg‟s short sea shipping is concentrated in the Baltic Sea, where it is the prime short sea shipping
port as measured by the number of connections with other ports (Table 2).

15
Figure 6. Percentage share of smaller vessel traffic at Hamburg-Le Havre rangeports, 2006
0%
5%
10%
15%
20%
25%
< 2000 TEUs
< 1000 TEUs
Source: Author’s elaborations based on data from Ducruet and Merk (forthcoming)
Figure 7. Proportion of short-range traffic at northwestern European ports
0%
10%
20%
30%
40%
50%
60%
Hamburg Rotterdam Le Havre Antwerp Felixstowe
2006
1996
Source: Author’s own elaborations based on data from Ducruet and Merk (forthcoming)

16
Table 2. European ports with most important Baltic Sea short sea connections, 2011
Total short sea connections (weighted)
Short sea connections in Baltic Sea (weighted)
Hamburg 302 131
Rotterdam 390 128
Bremerhaven 199 125
Aarhus 104 57
Gothenburg 82 44
St. Petersburg 96 37
Antwerp 192 27 Source: Author’s own calculations based on schedules on websites of 34 main short sea shipping lines in Europe Notes: The columns of this table contain the number of times that Hamburg (and its competitors) appears in weekly short sea container liner services of the 34 main short sea shipping lines in Europe. As such, they can be considered connections between the Port of Hamburg and other ports; these connections are weighted: connections made more frequently than once per week are counted proportionally higher.
The strong maritime connectivity of Hamburg is not limited to short sea shipping; this is just one of
the important determinants for its overall competitive position. The Port of Hamburg not only has a very
broad network of connections with ports all over the world, but also is one of the dominant ports in the
network (i.e. the port that is the most important port for other flows in terms of cargo flows). An overview
of only the dominant port links illustrates that Hamburg was – with regard to containerised goods – the
dominant European port for a large number of ports, only second to Rotterdam in 2011 (Figure 8).
Hamburg‟s strong position in the Baltic Sea is also evident in non-containerised goods as illustrated by
Hamburg‟s network of dominant links, primarily with states in the Baltic Sea, in the solid bulk flows in
2011 (Figure 9).

17
Figure 8. Hamburg’s position in main containerised goods flows (2011)
Source: Author’s own elaboration based on data from Lloyd’s Marine Intelligence Unit Note: Only the dominant connections (links that represents the most important goods flow for each port) are indicated.

18
Figure 9. Hamburg’s network for solid bulk flows
Source: Author’s own elaboration based on data from Lloyd’s Marine Intelligence Unit Note: Only the dominant connections (links that represents the most important goods flow for each port) are indicated.
Impact of the crisis and volatility
The global financial and economic crisis had a large impact on port traffic in Hamburg, especially in
container traffic. As previously mentioned, growth rates and market shares have declined since 2008.
Container traffic was hit hard and rather suddenly by the global crisis and the resulting reduction of global
trade. The impact on dry bulk, however, is only noticeable during one quarter and is followed by recovery
in the next quarter, while the decline of liquid bulk due to the crisis is hardly distinguishable from regular
quarterly fluctuations (Figure 10). According to Pallis and De Langen (2010), chemicals and intermediary
goods, representing 15-25% of the containerised cargo in northwestern Europe, were hit especially hard by
the crisis; in contrast, the crisis had a relatively mild impact on food and consumer goods.
Hamburg‟s experience seems to confirm this finding: detailed specifications of goods in containers
handled at the Hamburg port show that 30-35% of containerised imports and 45-50% of containerised
exports contain chemicals and intermediary goods. These percentages are considerably above average for
ports in northwestern Europe. Despite Hamburg‟s decline during the crisis, the Port of Hamburg is the least
volatile port of large European ports. Analysis of quarterly fluctuations over 2000-10 shows that Hamburg
had, on average, the smallest quarterly deviations from its growth trend. Another indicator is the extent of
the largest positive and negative growth rate from one quarter to another; based on this indicator, only
Rotterdam shows less volatility than Hamburg (Figure 11).

19
Figure 10. Volatility of different cargo categories in Hamburg, 2000-11
0
50
100
150
200
250
Containers Dry bulk Liquid bulk
Source: Author’s own elaborations based on Eurostat database Note: Throughput volume in first quarter of 2000 is 100 (index). Quarterly data until first quarter 2011 is presented.
Figure 11. Volatility throughput of largest European ports, 2000-10
-40%
-20%
0%
20%
40%
60%
Source: Author’s own calculations based on Eurostat data Note: The triangle indicates the average absolute difference between quarterly growth in port throughput and the average quarterly growth for that port (i.e. trend growth for that port). The vertical lines indicate the largest positive and negative growth rates from one quarter to another found for that port over 2000-10.

20
Competition for hinterland
Hamburg is the predominant port for most of Germany and services most of the country, with the
exception of some of the large states in western and southern Germany (such as North Rhine-Westphalia
and Baden-Württemberg) that predominantly use the ports of Rotterdam and Antwerp (Figure 12). As
such, the German market is Hamburg‟s most important hinterland. After the fall of communism in eastern
and central Europe, the Port of Hamburg extended its hinterland there, especially with respect to container
traffic, and the port continues to grow its sphere of influence in this area and beyond. Hamburg is
considered the first port for Hungary and the Czech Republic in terms of tonnes of goods shipped to and
from these countries (Figure 13).
Figure 12. Main ports for German states
0%
10%
20%
30%
40%
50%
60%
70%
80%
90%
100%
Amsterdam
Antwerp
Rotterdam
Bremen/Bremerhaven
Hamburg
Source: Author’s own calculations based on data in Bundesamt für Güterverkehr (2007) Note: Shares refer to the situation in 2006. For reasons of comparability only hinterland traffic by rail and barge are included in this figure.
Most of these hinterlands, however, are contested by competing ports, including from Poland and
Slovenia. Some of the countries bordering Germany, such as Switzerland, predominantly use the ports of
Rotterdam and Antwerp. Hamburg is also facing competition from ports outside of northwestern Europe.
The port of Szczecin/Swinoujscie, for example, is not only one of the main ports for Poland, but also an
important port for the Slovak Republic (Figure 13). It competes with Hamburg and Bremen for parts of the
German hinterland (e.g. in Brandenburg).6 The Port of Koper (Slovenia) is a serious competitor to
Hamburg for hinterlands in Hungary and the Slovak Republic. In Austria, it is the first port for Austrian
imports and exports in 2010 (Figure 14). From the main Black Sea, the Port of Constantza (Romania) is the
next main competitior for central European markets. In contrast, competition for Hamburg‟s hinterlands
from Ligurian ports (Genoa, La Spezia, Savona) and Marseille is very limited, according to studies from
Ferrari et al. (2011) and Guerrero (2010). Port investment and extensions have recently taken place in
many of the new competitor ports, resulting in more potential handling capacity – an interesting

21
opportunity for certain global shipping lines (e.g. the recent decision of Maersk to launch a direct regular
shipping service from Shanghai to Gdansk).
Figure 13. Market share of main import ports for central Europe, 2006-07
0% 20% 40% 60% 80% 100%
Czech Republic
Hungary
Slovak Republic
Austria
Switzerland
Poland
Hamburg
Rotterdam
Antwerp
Bremen
Szczecin/Swinoujscie
Gdansk/Gdynia
Koper
Trieste
Source: Author’s own compilation of data from different port authorities, Eurostat and Bündesamt für Güterverkehr (2007)
Figure 14. Main five ports for Austrian imports and exports, 2001-10
0%
10%
20%
30%
40%
50%
60%
70%
80%
90%
100%
2001 2002 2003 2004 2005 2006 2008 2009 2010
Bremen
Antwerp
Hamburg
Rotterdam
Koper
Source: Author’s own elaboration based on data from Österreichische Seehafenbilanz (2010, 2011). Note: These are market shares of the main five ports for Austria. Other ports that are used for Austrian foreign trade have much lower goods flows with Austria (Rijeka, Constantza). Data on Trieste, the sixth largest port for Austria, are incomplete, which makes comparison of market shares over time difficult.

22
1.2 Synergies at a regional scale
The Port of Hamburg is located close to the Port of Bremen/Bremerhaven – the second German port
(both based on total cargo and container throughput) – as well as other ports, such as Wilhelmshaven,
which is currently constructing a new deep-sea container terminal. The sections above have identified
some of the similarities between these different ports in terms of specialisations, hinterlands and growth
rates. The geographical proximity of the ports of Hamburg and Bremerhaven might give rise to
competitive or complementary dynamics between them. This section will assess this relationship by
focusing on the extent to which the maritime forelands of the two ports overlap, giving an indication of the
complementarity and possible synergies between the two ports.
Overlapping forelands
The ports of Hamburg and Bremerhaven are complementary with respect to routes of global shipping
lines. Their place in the intercontinental routes of the largest global shipping lines between northwestern
Europe and both North America and the Far East illustrates this complementarity. The Port of Hamburg‟s
intercontinental routes focus on shipments with Asia; Hamburg is included in 51 out of 57 Europe-Asia
routes, making it the second most important European port for intercontinental routes with Asia, just after
Rotterdam. Meanwhile, Bremerhaven is the European port with most inclusions in the routes with North
America (in 19 out of 26 routes), just before Rotterdam and Antwerp (Figure 15). The complementarity is
further illustrated by the overlaps within the individual 83 routes, that is the number of times that Hamburg
appears with other ports in the same route. Hamburg and Rotterdam are often paired on routes to Asia, and
Hamburg and Antwerp on routes to North America. Hamburg‟s overlap with Bremerhaven is marginal for
the Asian routes and non-existent for the North American routes (Figure 16). However, North American
traffic with Hamburg is reported to have grown somewhat in recent months (Preuss, 2011).
Figure 15. Inclusion of Hamburg in intercontinental routes of global shipping lines
0
10
20
30
40
50
60
Asia North America
Source: Author’s elaboration based on data from major global shipping lines (March 2011). Note: The intercontinental routes of nine of the ten largest global shipping lines are included, with the exception of Mediterranean Shipping Company (MSC).

23
Figure 16. Overlap of Hamburg with other ports in intercontinental routes of global shipping lines
0%
10%
20%
30%
40%
50%
60%
70%
80%
90%
100%
Asia
North America
Source: OECD Author’s elaboration based on data from major global shipping lines (March 2011). Note: The intercontinental routes of nine of the ten largest global shipping lines are included, with the exception of MSC.
Hamburg and Bremerhaven are also complementary with respect to their maritime forelands and
hinterlands. Analysis of vessel movements, based on data from Lloyd‟s Marine Intelligence Unit, indicates
this complementarity. Through this analysis, ports can be identified and weighted according to the cargo
transported between them. Comparing Hamburg‟s weighted port links to Bremerhaven‟s port connections
shows relatively moderate overlaps between these two ports; the maritime networks of Hamburg and
Bremerhaven have a correlation of 0.40. This analysis of the links to the Port of Hamburg confirms that
Hamburg is the main hub for the Baltic Sea and one of the gateways to Europe for Asian countries. Ports
that are more important to Hamburg than to Bremerhaven are Hong Kong, St Petersburg, Helsinki, Kotka,
Port Klang and Copenhagen. The ports of Felixstowe, Charleston and New York are more important to
Bremerhaven than to Hamburg (Figure 17).

24
Figure 17. Ports connected to Hamburg and Bremerhaven, 2006
Antwerp
Charleston
Copenhagen
Felixstowe
Helsinki
Hong Kong
KotkaNew York
Port Klang
Rotterdam
St Petersburg
R² = 0.3988
0
10,000,000
20,000,000
30,000,000
40,000,000
0 20,000,000 40,000,000 60,000,000
Po
rts
con
ne
cte
d t
o B
rem
erh
ave
n (
20
06
)
Ports connected to Hamburg (2006)
Source: Author’s own elaborations on the basis of data from Lloyd’s Marine Intelligence Unit Note: The unit of the axis is the totalised gross revenue tonnage (GRT) capacity of all vessels calling one port coming from another port. For example, the totalised GRT capacity of all vessels from Hong Kong calling Hamburg was almost 60 million, whereas the GRT capacity of all vessels from Hong Kong to Bremerhaven was about 21 million.
This constellation of two large nearby ports with moderate overlaps is unique in international
perspective. Analysis of overlaps of port pairs in the main multi-port gateway regions in the world clarifies
this uniqueness. These regions all have one or more of the world‟s top 30 container ports. Hamburg and
Bremerhaven (as well as the port of Wilhelmshaven) form part of the Helgoland Bay, which is considered
to be the eighth largest multi-port region in the world. An analysis similar to the one shown in Figure 17
has been conducted for the two main ports in each multi-port region. The results indicate that the overlap
found for Hamburg and Bremerhaven is the lowest among these regions. Seven out of the nine regions
have a high correlation (higher than 0.70), indicating that the different ports compete with each other to a
large extent and, in some cases (e.g. Shanghai-Ningbo), could almost be considered perfect substitutes. The
inverse is the case for Hamburg and Bremerhaven: because their overlaps are limited, they can
complement each other and together provide a larger set of services. This could be a competitive
advantage.

25
Table 3. Multi-port gateway regions and their port overlaps
Region Main ports Container throughput
(1000 TEUs, 2009) Overlap main ports
Pearl River Delta Hong Kong Shenzhen Guangzhou
50 423 0.60
Malacca Straits Singapore Port Klang Tanjung Pelepas
39 175 0.89
Yangtze River Delta Shanghai Ningbo
35 504 0.93
Bohai Bay Qingdao Tianjin Dalian
23 512 0.83
Rhine-Scheldt Delta
Rotterdam Antwerp Zeebrugge Amsterdam
19 583 0.75
Korean Twin Hub Busan Gwangyang
13 764 0.79
San Pedro Bay Los Angeles Long Beach
11 815 0.84
Helgoland Bay Hamburg Bremerhaven Wilhelmshaven
11 585 0.40
Tokyo Bay Tokyo Yokohama Shimizu
6365 0.74
Source: Author’s own calculations based on data from the Marine Intelligence Unit Lloyd’s List and AAPA ranking top 125 world ports (2009)

26
2. IMPACT
2.1 Economic impact
Employment and value added
A considerable share of the employment and production value in Hamburg is port-related. According
to a study by Planco Consulting (2011), direct port and port-related employment in the Hamburg
metropolitan region (including the City of Hamburg) provided almost 79 000 jobs in 2010. This represents
5.4% of total metropolitan employment. This study also calculated indirect port-related employment – that
is employment in sectors that are connected to the Port of Hamburg via backward linkages, calculated via
input-output analysis (Planco, 2005) – to be 76 842 in the Hamburg metropolitan region (62 000 of which
was in the City of Hamburg). The sum of direct and indirect port-related employment would represent
10.6% of total metropolitan employment (and 16.3% of city employment). Most of the port-related
employment (about 90%) is located in the City of Hamburg, with the rest in the suburbs of Hamburg
metropolitan region. Results using this methodology are not available over time, so it is difficult to assess
the development of port-related employment in Hamburg. Production value of port and port-related
activities is 8.3 billion EUR in 2010, 7.6 billion EUR of which is in the City of Hamburg (Table 5).
Table 4. Direct port and port-related employment in Hamburg, 2010
City of Hamburg Hamburg
metropolitan region
Port employment 57 140 62 830
Port-related employment 14 321 16 072
Total direct port and port-related employment 71 461 78 902
Total employment 820 220 1 466 039 Source: Planco (2011), IKM Statistik Nord, Metropolregion Hamburg/Statistikportal Note: Directly port-related employment includes stevedores, shipping lines, forwarders and ship insurance/finance. Indirectly port-related employment includes jobs generated by backward linkages, such as demand for capital goods and services, investments, and consumption related to income generated by the port.
Table 5. Port-related production in Hamburg city and metropolitan region in million Euros, 2010
City of Hamburg Hamburg
metropolitan area
Port production value 5 802 6 300
Port-related production value 1 824 1 991
Total direct port and port-related production value 7 626 8 291 Source: Planco Consulting (2011)
These data are difficult to relate to data for other port regions in Europe. There are no comparable
data on port and port-related employment in Europe or northwestern Europe. Regular studies and updates
on port employment are made for Dutch and Belgian ports, whereas the data for French ports are more
irregular. Even so, because the methodologies and definitions in these studies are not similar, it is difficult

27
to compare data of different ports. This means that it is difficult to assess whether the employment impact
of a port is large or small compared to ports in other countries. Port-related employment tends to be
defined according to which sectors are port-related in the particular national or local context, but not
necessarily in other countries. Moreover, in order to make a comparison over time, countries will likely
stick to their methodologies, so efforts to harmonise the analytical approach will be constrained by lack of
data.
In order to improve international comparability, another approach builds on a proposal of Musso et al.
(2000) and defines port-related employment according to the extent to which it is overrepresented in
regions with large ports in comparison to regions without large ports (instead of making assumptions about
which industries are port-related).7 This approach has been followed for ten European Union (EU)
countries with ports in the American Association of Port Authorities (AAPA) ranking of the world‟s
largest 125 ports. Among the 112 OECD Territorial Level 2 (TL2)-regions in these countries, 48 regions
were identified as port regions (i.e. they had one or more ports with port throughput above a defined
threshold).8 This approach makes it possible not only to identify main port-related economic specialisations
of the City of Hamburg, but also to understand the extent to which these specialisations fit within a larger
trend of European port regions‟ specialisations and to what extent the economic specialisation of Hamburg
is unique.
In comparison with other port-regions in Europe, Hamburg is very highly specialised in support
activities for transport, manufacture of other transport equipment, water transport and out-of-store retail
sale. In all of these sectors, Hamburg is among the three port regions (out of 44) with the highest
specialisation index and with a considerable number of jobs. In some other sectors (e.g. coke, refined
petroleum, nuclear fuel and chemicals manufacturing; machinery and equipment rental; other wholesale),
Hamburg has an equally high specialisation but fewer jobs. In contrast to many other port regions in
Europe, Hamburg does not specialise in construction, manufacturing of food products and maintenance and
repair of motor vehicles (Table 6).

28
Table 6. Port-related economic specialisations, City of Hamburg
Frequent specialisations of European port-regions
Less frequent specialisations of European port-regions
Sector Location Quotient
Sector Location Quotient
Very high specialisation in Hamburg
Water transport 35.70 Other wholesale 2.59
Manufacture of coke, refined petroleum products and nuclear fuel
8.76
Manufacture of other transport equipment 6.80
Retail sale not in stores 3.38
Supporting and auxiliary transport activities; travel agencies
2.99
Renting of machinery and equipment without operator
2.84
Specialisation in Hamburg
Wholesale of food, beverages and tobacco 1.75 Wholesale of agricultural raw materials and live animals
1.27
Repair of personal and household goods 1.55 Publishing, printing and reproduction of recorded media
1.15
Wholesale of non-agricultural intermediate products, waste
1.29
Sale, maintenance and repair of motorcycles and related parts
1.18
Hotels and restaurants 1.11
Other retail sale of new goods in specialised stores
1.11
Real estate activities 1.07
No specialisation in Hamburg
Maintenance and repair of motor vehicles 0.98 Retail sale of second-hand goods in stores
0.98
Retail sale of food, beverages and tobacco in specialised stores
0.92 Wholesale on a fee or contract basis 0.36
Retail sale of automotive fuel 0.91 Mining and quarrying 0.36
Retail sale in non-specialised stores 0.81 Manufacture of furniture; manufacturing n.e.c.
0.25
Manufacture of food products, beverages and tobacco
0.51 Manufacture of other non-metallic mineral products
0.17
Construction 0.22 Air transport 0.14
Manufacture of wood and wood products 0.08 Manufacture of wearing apparel; dressing; dyeing of fur
0.02
Recycling 0.00 Manufacture of leather and leather products
0.00
Collection, purification and distribution of water
0.00
Source: Author’s own calculation and elaboration based on structural business statistics-database of Eurostat

29
Indirect economic effects
The Port of Hamburg has significant indirect effects on the German economy, more so than the ports
of Rotterdam, Antwerp and Le Havre/Rouen have on their national economies. An input-output (I-O)
analysis conducted for this case study (integrating the Port of Hamburg and allowing for the calculation of
a multiplier) identifies the indirect effects of changes in demand in the Port of Hamburg via backward
linkages. This analysis is based on national I-O tables that indicate which sector outputs are used as
intermediate inputs for other sectors, showing linkages between different sectors in an economy. For this
case study, the national I-O tables for Germany were disaggregated for certain regions in Germany, as well
as for the port cluster of Hamburg, in order to identify backward linkages related to the Port of Hamburg.
The Port of Hamburg multiplier was calculated at 1.71, meaning that one euro of additional demand in the
Port of Hamburg leads to 0.71 euro of additional supply in the sectors that provide input to the port. This
figure is large compared to multipliers calculated for other main ports in northwestern Europe using similar
analysis, the same methodology and comparable definitions of the port clusters (Merk et al. 2011 and Merk
et al. forthcoming). The multipliers found for Rotterdam and Antwerp were considerably smaller, and the
one for Le Havre/Rouen was slightly smaller. This could indicate that the Port of Hamburg is strongly
interlinked with German industries, whereas the ports of Rotterdam and Antwerp might have more
industrial linkages that surpass national boundaries.
Table 7. Multipliers for main northwestern European ports
Multiplier
Hamburg 1.71
Rotterdam 1.13
Antwerp 1.18
Le Havre/Rouen 1.57 Source: Author’s own calculations based on Eurostat database
The greatest indirect economic effects of the Hamburg port are on the transport equipment, food
sector and petro-chemical sectors. The multiplier effects are the highest for these sectors, with multipliers
greater than two, meaning that every euro of additional demand in these sectors in the Port of Hamburg
leads to additional supply of more than one euro in other sectors. Table 8 presents the port‟s impact on
other sectors, as well: other manufacturing, transport storage and communication, financial intermediation,
wholesale and retail trade and non-market services. Table 9 compares the multiplier effects of the main
ports in northwestern Europe on these and other sectors. Two important elements distinguish the Hamburg
case. First, the multipliers in Hamburg are the highest for all the sectors affected by the Port of Hamburg
(the multipliers for the port of Le Havre come close in some sectors, but not for Rotterdam and Antwerp).
Second, the number of economic sectors impacted by the Port of Hamburg is more limited than sectors
affected by Rotterdam and Antwerp. This might be explained by the more diversified and industrial base of
Rotterdam and Antwerp ports compared to Hamburg.

30
Table 8. Multipliers for main economic sectors in the Port of Hamburg
Multiplier
Transport equipment 2.47
Food, beverages and tobacco 2.22
Coke, refined petroleum, nuclear fuel and chemicals etc. 2.15
Other manufacturing 1.90
Transport, storage and communication 1.79
Financial intermediation 1.64
Wholesale and trade 1.31
Non-market services 1.31 Source: Author’s own calculations based on Eurostat database
Table 9. Multipliers for main economic sectors in northwestern European ports
Hamburg Rotterdam Antwerp
Le Havre-Rouen
Transport equipment 2.47 1.04 1.18 2.07
Food, beverages and tobacco 2.22 1.07 1.05
Coke, refined petroleum, nuclear fuel, chemicals 2.15 1.24 1.20 1.60
Other manufacturing 1.90 n.a. n.a 1.53
Transport, storage and communication 1.79 1.25 1.39 1.38
Financial intermediation 1.64 n.a. n.a. 1.56
Wholesale and trade 1.31 1.03 1.09 1.39
Non-market services 1.31 n.a. n.a. 1.13
Chemical, rubber and plastics products n.a 1.34 1.36 n.a.
Manufacturing of basic metals and metal products n.a 1.06 1.07 n.a.
Electricity, gas and water supply n.a 1.17 1.13 n.a.
Electrical and optical instruments n.a n.a. 1.03 n.a.
Source: Author’s own calculations based on Eurostat database
Most of the indirect effects of the Port of Hamburg have impacts outside the Hamburg region. This
becomes clear when the multipliers for Hamburg are differentiated by region affected by the port. For this
report, a multi-regional I-O table for Germany showing the Port of Hamburg has been created to conduct
this analysis. As was mentioned above, one euro spent in the port of Hamburg leads to 71 euro cents of
additional spending in other sectors. Of these 71 euro cents, one cent of additional spending takes place in
the port itself, two cents in the rest of Hamburg, six cents in the state of Niedersachsen (Lower Saxony),
and two cents in Schleswig-Holstein. Yet, most of the impacts can be identified outside these regions: 12

31
cents in Bayern (Bavaria), 10 in Baden-Wurttemberg and 39 in the rest of Germany (Table 10). In all of the
sectors affected by the Port of Hamburg, the impact in the two southern states of Bayern and Baden-
Wurttemberg is larger than in Hamburg, Niedersachsen and Schleswig-Holstein together. Although the
port is, to some extent, embedded in the regional economy, its linkages with the wider German economy
are more important. In this respect, the case of Hamburg is different from both the Le Havre/Rouen case
(where the port cluster lacked regional embedding) and the cases of Rotterdam and Antwerp, where a
larger share of the multipliers is affecting their own regions and even their own port area (indicating larger
inter-sectoral linkages within the port itself). This might be related to the high share of containerised cargo
in Hamburg.
Table 10. Multipliers by sector and region for the Port of Hamburg
Port of Hamburg
Rest of Hamburg Niedersachsen
Schleswig-Holstein Bayern
Baden-Württemberg
Rest of Germany Total
Transport equipment 1.00 0.03 0.12 0.04 0.26 0.25 0.77 2.47
Food, beverages and tobacco
1.00 0.03 0.11 0.04 0.22 0.18 0.64 2.22
Coke, refined petroleum, nuclear fuel and chemicals etc.
1.00 0.03 0.09 0.03 0.19 0.17 0.64 2.15
Other manufacturing 1.02 0.02 0.07 0.02 0.15 0.14 0.48 1.90
Transport, storage and communication
1.00 0.02 0.07 0.02 0.13 0.11 0.44 1.79
Financial intermediation
1.00 0.02 0.05 0.02 0.10 0.08 0.37 1.64
Wholesale and trade 1.01 0.01 0.03 0.01 0.05 0.04 0.18 1.31
Non-market services 1.01 0.01 0.03 0.01 0.05 0.04 0.18 1.31
Overall 1.01 0.02 0.06 0.02 0.12 0.10 0.39 1.71
Source: Author’s own calculations based on Eurostat database Note: The Port of Hamburg is defined as a port cluster in which the direct port-related employment is included and used as a reference to calculate the port cluster value added. The rest of Hamburg refers to the remainder of the economy in the city-state of Hamburg.

32
2.2 Environmental impact
Large direct environmental impacts of port activities are related to the modal split of goods entering
or leaving the port. Although some important inherent conditions (such as a network of rivers connecting a
port with its hinterland) may favour some ports in terms of environmental impact, strategic measures
favouring rail and inland navigation (such as new infrastructure, close collaboration with operators and
lobbying for reforms) can enhance a port‟s environmental performance and competitive position
(Haezendonck, 2001; Dooms and Haezendonck, 2004).
Hamburg exhibits a relatively favourable environmental record compared to other ports in
northwestern Europe, mainly due to a high share of hinterland traffic by rail to and from the port. Rail
represented 37% of the total hinterland traffic of containerised goods in 2010, which is high compared to
most other ports (Figure 18). This share is even larger if local commodities, for which railway is not a
feasible transport option, are excluded. Of the goods being moved over a distance of 150 kilometres or
more, rail accounts for 55-60%, whereas road drops to 40-45% (with barge traffic at 2% for both overall
and long-distance transport). However, the share of overall road transportation (62%) in Hamburg is not
very low compared to other ports (including Rotterdam, Antwerp, Amsterdam and Rouen) that make up for
low railway shares by large shares of barge traffic. Hamburg has managed to significantly reduce the
percentage of hinterland traffic by road from 71% in 2000 to 62% in 2010, mainly by increasing the share
of freight by rail (Figure 19). This decrease is impressive compared to other large ports, where no
reduction took place (Le Havre) or where the reduction over the last decade was not more than three
percentage points (Rotterdam and Antwerp) (Figure 20).
Figure 18. Modal split of hinterland traffic for containerised goods at main Hamburg-Le Havre range ports, 2010
0%
10%
20%
30%
40%
50%
60%
70%
80%
90%
100%
Road
Inland waterways
Rail
Source: Author’s elaborations based on data from port authorities and Schiffahrt Hafen Bahn und Technik Note: These are modal splits for containerised traffic. Data for Bremerhaven cover the Eurogate terminal exclusively. Data for Bremerhaven, Bremen are from 2009; Rouen from 2008; Amsterdam and Zeebrugge from 2007 and Dunkirk from 2006.

33
Figure 19. Trend of modal split of hinterland traffic for containerised goods, Port of Hamburg, all distances, 2000-10
0%
10%
20%
30%
40%
50%
60%
70%
80%
90%
100%
Inland waterway
Rail
Road
Source: Author’s elaborations based on data from Schiffahrt Hafen Bahn und Technik
Figure 20. Trends truck hinterland traffic (as % of modal split) in main northwestern European ports
50%
55%
60%
65%
70%
75%
80%
85%
90%
2002 2003 2004 2005 2006 2007 2008 2009 2010
Le Havre
Hamburg
Antwerpen
Rotterdam
Source: Author’s elaborations based on data from port authorities and Schiffahrt Hafen Bahn und Technik
The Port of Hamburg could reduce the external costs of this hinterland traffic by decreasing the share
of truck traffic. According to our updated calculations of a study by Haezendonck et al. (2006), the share

34
of truck traffic in 2010 would have been 57% instead of 62% (and inland water traffic 7% instead of 2%);
external costs in 2010 would have been 8.8 million euro lower. These external costs include congestion,
accidents, air pollution and noise. Even if these calculations are dependent on the data quality and
underlying assumptions, there is a growing academic literature underpinning such results (Maibach et al.,
2008). There are of course limits to the reductions of external costs that could be achieved with a modal
split change, as the largest part of local traffic will continue to be transported by truck.
The environmental impact of port shipments could also be affected by routing from Asia via northern
ports, such as Hamburg, instead of southern European ports. Although some port authorities claim that
carbon dioxide emissions are lower if traffic to southern Germany is routed through Adriatic ports, such as
the Port of Venice, other calculations seem to suggest that the dominance of northwestern European ports
is relatively less environmentally harmful. This is primarily due to better environmental performance of the
largest vessels that call on the northwestern European ports (NEA, 2011).

35
3. POLICIES AND GOVERNANCE
3.1 Port-city development
The Port of Hamburg has growth ambitions, but focuses increasingly on potential links with regional
industries. The economic and financial crisis have led transhipment volumes to be highly volatile, causing
a standstill of many of the activities in the Port of Hamburg. While container handling is the main driver
for growth in the Port of Hamburg, the port also seeks to strengthen the usage of its area for industrial
production as a potential way to decrease dependency on transhipment volumes. Illustrating this strategic
re-assessment, the Hamburg Port Authority (HPA) is currently engaging in the preliminary activities for
preparing a possible new port area under the Central Terminal Steinwerder project. The redevelopment of
the site would offer an area of about 125 hectares of land for cargo handling and maritime purposes. HPA
decided to undertake a market consultation process and to seek innovative ideas for the most efficient use
of the area. The return of certain types of manufacturing to core port areas, along with cargo handling,
supports the port‟s earlier commitments to industrial activities and thus could be a promising trajectory for
developing a combined production and distribution approach.
The city-state of Hamburg acknowledges the importance of the port, but has its own growth ambitions
and tries to combine these objectives in its urban strategy. In 2002, in response to the changing economic
geography of Europe after the fall of the Iron Curtain, city governors and urban planners of Hamburg
developed the leitbild “Wachsende Stadt” (growing city). This leitbild, or mission statement, expresses the
goal to foster new opportunities for economic growth and to ensure a certain quality of life within the city.
In 2007, Räumliches Leitbild, another guiding principle concerning spatial development in the entire
Hamburg metro region, was presented. Among other aspects, this leitbild, including 46 key urban
development projects along 18 corridors for action, aimed to maintain basic principles of urban planning
such as providing housing, increasing urban density and securing open space, while mobilising potential
for further economic and employment growth. The port is also subject to strategic framework concepts,
such as the “Innovation Alliance”, jointly developed by Hamburg‟s Department of Economics and
Department of Science and Research, corporations, and intermediaries, such as the Chamber of Commerce.
The simultaneous growth ambitions of the Port and City of Hamburg are constrained by geography
and scarcity of land. The port is situated along an estuary about 120 kilometres away from the North Sea
coast, but located close to the city centre. This proximity of the port to the core city makes it a focus of
public awareness and a highly accessible destination for visitors. However, the close proximity also leads
to negative impacts such as congestion, land consumption, land use and neighbourhood conflicts, which
are differently perceived among port neighbours, the port community (port operators, port users, port
customers, and intermediaries), various departments of the city administration, and the broader public. The
presence of the port close to the city centre also poses a barrier for urban development, as well as port
extension. The boundaries of the port area are determined by port development law
(Hafenentwicklungsgesetz as of 25 January 1982), and the only land reserves defined for potential
expansion of the port exist in Altenwerder and Moorburg in the southwestern port area. Otherwise, the port
is considered to be spatially fixed. In terms of land use, any parcel of land that is located within the
boundary is subject to a certain range of allocations that differ from the rest of the city. This special
position also applies to land-use planning procedures, which in the port are carried out under the auspices
of the HPA and not by city or district planning departments.
The complexity of the port-city interface in Hamburg is well illustrated by the dynamically growing
cruise shipping sector. This sector grew by 94% in 2009 to 104 cruise ship calls and 246 000 passengers in
Hamburg in 2010. With 315 000 passengers in 2011, this impressive growth continues. Fostering cruise

36
tourism is expected to have positive effects on the port and the city, in part by valuing the site where the
ships anchor. The arrival of world-renowned cruise ships (e.g. the Queen Mary 2) for festivities like the
port‟s anniversary in May each year and the biennial Hamburg Cruise Days in August are huge events for
both port and city, attracting millions of visitors. In addition, certain arrangements under consideration
would attract cruise customers to visit Hamburg before embarkation or after disembarkation from cruise
liner ships, so they spend an additional day or two in the city. Thus, the cruise shipping value chain could
become more extensively exploited. Moreover, an extended stay would lead to higher revenues in the city
tourism sector. However, noise levels associated with the cruise ships anchored at the two terminals, one of
which is centrally located in the HafenCity, may be disruptive to local residents in new nearby apartment
buildings. These ships could especially affect the quality of living at night for new residents of apartments
near the waterfront. Air pollution prevention in the harbour area has also become a major concern in recent
years. River barges are already partially provided with on-shore electric power within the harbour area.
However, similar measures for cruise ships are much more challenging. Given the increasing commitment
of the port and maritime community to achieve a “green port” standard (Port of Hamburg, 2010), solutions
concerning on-shore electric power – as operational in Gothenburg (Box 1) – or alternative ways to supply
energy for the cruise liners are being discussed. Whether payment for this upgrade would need to come
from public budgets, as the business community is claiming, is a point of controversy.
Box 1. On-shore power supply in the port of Gothenburg
Since the beginning of the 2000s, the Port of Gothenburg (Sweden) has put in place an innovative policy of using on-shore power supply. Vessels that are at the quay typically use their diesel engines to meet energy needs for certain functions such as lighting, heating and air conditioning. This use of the diesel engine is a source of considerable local air pollution and greenhouse gas emissions. The Port of Gothenburg was the first in the world to propose that vessels be connected to the local energy network, which made it possible for these vessels to shut off their engines during their stay in the port (called “cold ironing”).
Since 1989, the Port of Gothenburg has provided electricity to ships calling at the port, but only through several low-voltage cables that did not cover all energy needs. Following the initiative of a large paper manufacturing company, Stora Enso, which sought to improve the carbon footprint of transporting its products, the port began designing a more efficient system in partnership with several navigation companies and Asea Brown Boveri (ABB), a company specializing in electrical products. Operational since 2000, this newer system uses a single high-voltage cable providing 6.6 to 10KW 50Hz, which can power an entire ship from these platforms on the docks. The vessels are therefore able to stop their engines, resulting in a significant reduction in both noise and carbon emissions. The Port of Gothenburg estimated that a vessel not connected to on-shore power grid emits about 25 tonness of carbon dioxide, 520 kg of nitrogen oxides and 22 kg of particulate matter during its stop. This innovation thus benefits both the environment in terms of climate change, and quality of life and work of the populations on or near the port (residents, dockworkers and ships' crews). To ensure that the electricity supplied to ships is produced with limited air pollution, two wind turbines are used to generate power for ships. Today, one in three ships calling at the Port of Gothenburg uses the connection for shore-side electricity, but this proportion is likely to increase. Roll-on/roll-off ships and ferries are the most frequent users of the new system because the links they provide are back and forth, but all categories of ships may benefit from this new technology. While connecting to the grid requires vessels to invest in technology to use the new system, costs for retrofitting vessels can be offset by the likely savings in fuel.
Through this programme, the Port of Gothenburg has acquired a first-mover technology advantage in connecting the vessels to shore-side electricity. This system is also present in other ports, such as Antwerp, Zeebrugge and Lübeck. However, a significant barrier to technology diffusion is the non-harmonisation of international electricity standards, with some parts of the world using 50 Hz systems and others using 60 Hz systems. This problem hinders retrofitting vessels, although attempts are underway to harmonise. Because of its pioneering role in this technology, the Port of Gothenburg was chosen as the leader of the Working Group on on-shore power supply created by the World Port Climate Initiative.
This delicate port-city interface requires close co-ordination between port and urban development, and
increased land productivity on port sites. However, attractive sites in core port areas are sometimes also

37
occupied by firms that are not (or are no longer) among the port customers. As a more general pattern, this
can lead to a decreasing efficiency of land use in the ports. Ownership or lease-and-rent contracts may
delimit opportunities to better adjust demand for high-value port areas and supply of the port. A strategy
for land use will thus be developed in the forthcoming Port Development Plan, in which the Senate
publishes its future plans for the port (Box 2). The land scarcity issue has also given rise to decentralisation
of logistics activity (further discussed in section 3.3). The port not only is a very prominent and central
area, main employer and tourist sight for Hamburg, but also has important secondary effects on the local
economy and city planning and development. According to a study by Planco Consulting (2011), the port
was at the source of EUR 750 million of tax revenues in 2010, representing more than one-twelfth of total
tax income of the Free and Hanseatic City of Hamburg. It therefore lays the groundwork for all major
development projects in the city and provides the financial means for seminal investments in two main
urban development projects: the HafenCity Project and the Leap across the Elbe Project (discussed below).
Box 2. The Port Development Plans of the Senate of the Free and Hanseatic City of Hamburg
The Port Development Plans are published by the Senate about once every five years and contain components that inform the development of the main short- and mid-term policy measures for the Port of Hamburg. The plans are highly sensitive policy papers, that include strategic goals and benchmarks as well as more general policy avenues and corridors that may be taken in the future. The present Port Development Plan was published in 2005, and its successor is currently in the making. It will be the first plan that also serves as part of the corporate strategy for the Hamburg Port Authority, a newly founded government agency. In addition to making business goals concrete (e.g. for container transhipments) and addressing future infrastructure policy measures (e.g. accessibility, hinterland
connectivity, river dredging), certain parts of the report include activities at the interface of urban development and port business. The plan also includes future tasks for the port and city to jointly address the problems and demands of the port’s periphery. In this capacity, the port can be promoted to as both a place of materials handling and movement, but also an accessible and enjoyable part of the city.
HafenCity: A showcase of waterfront development
A new chapter of port-city relationships in Hamburg was opened up with the HafenCity project,
which brings major parts of the inner city back to the waterfront. The HafenCity, stretching about a gross
area of 157 hectares, will provide 2.3 million square metres of gross floor space on a land surface of 126
hectares, hosting about 45 000 work places and about 5 800 apartments. The project is expected to trigger
private investments of about EUR 7 billion, based on public investments of about EUR 2 billion, according
to the HafenCity organisation.
The project represents one of the biggest and most ambitious urban redevelopments currently
underway in Europe. Iconic in the context of “urban renaissance” (the period of inner city regeneration
and renovation), the project has already attracted extraordinary attention from experts and the public. This
interest is fuelled by both powerful public relations and the project‟s uniqueness. The spatial extent of the
project and its ambitious urban design, urban ecology, social mix and urban planning goals makes the
HafenCity project an unusual example of transformation of an old port, warehouse and industrial area into
a new chic urban quarter.
The establishment of modern urban quarters with office- and housing-oriented land use close to the
waterfront adds about 40% more space to the existing area of Hamburg‟s inner city. However, the
provision of this surplus of urban space is often associated with, or made possible by, a spatial shift of
commercial and industrial land uses towards other urban or even non-urban areas situated in the
metropolitan periphery or – as is the case in the HafenCity – in port neighbourhoods; this has to be taken
into account when assessing the net gain of these redevelopments (e.g. in terms of land recycling). A
flagship project to build the music hall Elbphilharmonie was added to the HafenCity project. This hall is

38
currently under construction based on design provided by the Swiss architects Jacques Herzog and Pierre
de Meuron. Certain portions of the HafenCity‟s eastern area are also dedicated to hosting the new buildings
of HafenCity University. In addition, a subway line (already under construction) addresses priorities for
increasing the city‟s accessibility. Corporate headquarters such as the Unilever building aim to profit from
the HafenCity‟s centrality and attractiveness; its location and urban setting are projected to offer a benefit
for companies seeking highly qualified staff.
The establishment of the HafenCity close to core port areas has raised the demand for reducing related
impacts, particularly concerning noise emissions. At least in the immediately adjacent areas of the
HafenCity, a differentiated scheme of noise control measures have been introduced, in order to reach a
noise cap at night time (22:00 and 06:00) in three different levels, between 55 decibles (dBA)/square metre
and 63 dBA/square metre, depending on the intensity of the land use. In addition, sound-proofed windows
and specific noise-accommodating alignment of buildings are expected to limit noise emission. These
public regulations are complemented by a tolerance clause in property purchase agreements to avoid
complaints or legal issues coming from residents after their move into the HafenCity (Bruns-Berentelg,
2009).
Despite major revisions to planning regulations and contractual requirements to avoid potential legal
battles, the evidence to support building of upscale residential quarters in proximity and busy port areas is
inconclusive. The higher the demand for upscale waterfront developments the bigger the associated
planning challenges.
Leap across the Elbe
In addition to HafenCity, a second major port-city development project is ongoing: the Leap across
the Elbe” project. This development trend stems from the International Building Exhibition (IBA) event
held in Hamburg, aiming to trigger innovative urban development that might not be achieved by routine
action in urban planning. It takes up a tradition of urban building exhibitions that started in Germany in the
early 20th century. The focal point of IBA-Hamburg is to improve urban development conditions in
disadvantaged southern areas of the city. As emphasised in the programme‟s title “Leap across the Elbe”,
the project focuses specifically on upgrading the Wilhelmsburg area. The results of the IBA will be
presented in 2013, alongside the parallel International Gardening Exhibition (IGS) event. If port businesses
make way for urban development, a potential result of the project, the port community could claim
compensation for allowing port development in other areas of the city.
The high number and relatively broad variety of projects pursued in this context, ranging from
architecture to urban planning and community measures, will help to reconcile the many conflicts that are
considered to be a challenge for sustainable development in Hamburg. Common topical threads running
through the IBA are (i) socio-cultural and community issues, (ii) improvement of the “inner peripheries”,
and (iii) the key theme of cities and climate change. These overall goals are pursued through rather
informal and creative activities, including laboratories and workshops, various forms of citizen
involvement (with immigrants representing an important target group), building and architecture-related
processes (such as competitions or exhibitions), and searches for innovative solutions for building, housing
and other related problems. Practical measures include a new alignment of the major trunk road
Wilhelmsburger Reichsstraße and the establishment of a big inner-city park for sports and leisure purposes.
The benefit of projects like IBA is that they are open for innovative approaches and emphasise
involvement of both external experts and the interested public; in contrast, routine policy practices
typically can not achieve these benefits to such an extent. As a possible disadvantage, however, these
projects are often considered a playing field for “soft” policy making and kept rather distant from the
“hard” fields of politics (e.g. infrastructure policy, large-scale project approvals). The core question is how

39
the regular setting of policy making can be influenced by innovative, temporary, selective policy
programmes such as the IBA. In terms of sustainability, even these innovative urban development policies
seem to be confronted by the contradictions that dominate the urban policy setting. In Hamburg, the
conflict is the search for strong growth and high levels of wealth on the one hand, and the sustaining
existence of related constraints and socio-economic and environmental challenges on the other hand.
3.2 Land use, transportation and metropolitan governance
Transportation
The management of transport flows into and out of the port is an increasing challenge. As previously
mentioned, Hamburg has the relative advantage of being Europe‟s largest hub for hinterland container
transport by railway, with about a 37% modal share of rail at all port traffic. However, existing
infrastructure, particularly in terms of road and rail, tends to be at its limit, and existing features, such as
the Köhlbrand Bridge, spanning over the port require certain investments for maintenance. The same
applies to the Kiel Canal, which connects the North Sea and the Baltic Sea and is key to maintaining the
Hamburg‟s role as an interface between Asia and eastern Europe/Russia. While Hamburg is a prime freight
railway hub, inland barge shipping is underdeveloped.
In order to combat congestion and to improve the connectivity of the port, diverse master plans have
been set in place recently by HPA and city departments jointly with transport operators. Examples of these
plans include the rail transport master plan (as of 2008, jointly developed by HPA and Deutsche Bahn AG
with port and transport firms, the Ministry of Urban Development and the Environment and the
Association of Corporations in the Port of Hamburg), the waterways master plan (as of May 2009) and the
road transport master plan (as of September 2010). Even more than in other areas of public policy,
infrastructure provision concerning trunk roads, canals, motorways and railways affects at least state and
federal budgets and appears rather complex in governance terms.
The central government has a critical role to play in infrastructure planning. In Germany, the federal
government is responsible for large-scale infrastructure financing, particularly in the context of the
Bundesverkehrswegeplan (The Federal Transport Infrastructure Plan). This programme includes all major
transport modes and the provision of hinterland connections from and into major seaports, such as
Hamburg and Bremen, yet tends to be under-financed. Besides formal responsibilities and action, the
federal government is also increasingly engaged in promoting the national maritime services and
industries. For instance, the government organises the annual National Maritime Conference (of which the
seventh took place in 2011 in Wilhelmshaven) and developed a national framework concept for seaports
and inland ports (BMVBS, 2009). This national framework focuses on the German seaports, and, in
particular, to the Port of Hamburg. However, as this concept tends to be rather informal (the same applies
to the so-called “Maritime Co-ordination” taken over by the federal government), such activities may assist
in providing a beneficiary business climate, yet might not determine the “hard” agendas of policy making.9
Land use and sub-urbanisation of logistics activities
Spatial shifts have been a constant feature of the historical trajectory of the Port of Hamburg. These
shifts arose as a consequence of its proximity to the urban core, and also in response to port industrial
specialisations and specific cycles of port-related businesses (Nuhn and Ossenbrügge, 1984). The attraction
of heavy industries (e.g. refineries and the Aurubis copper mill) along the lower Elbe River was significant
in the 1970s and 1980s. The same applies to containerisation and the south-western extension of the port to
Altenwerder in the 1990s and early 2000s (Hesse, 2006).

40
Hamburg is now undergoing a process called “port regionalisation”, which is a spatial shift of
terminals, distribution centres and port-related developments towards the southern hinterland of the main
port (Flämig and Hesse, 2011). Focussing on the locational advantage of these relatively cheap, accessible
locations, concepts like “dry ports” (inland ports) are becoming increasingly relevant here (Leitner and
Harrison 2001, Roso et al., 2009). Since land resources are scarce yet essential for hosting port and
logistics businesses, economic development in Hamburg is seeking increased land productivity and new
locations to ensure the efficiency of maritime transport chains, and thus strengthened competitiveness of
the port.
Investigations by the city planning administration of Hamburg has revealed that the demand for
commercial space for logistics purposes is considerable in the city. In recent years, the average annual
demand for land generated by logistics firms was estimated at about 20 hectares, of which only 10 hectares
were realised (Hamburg Port Authority, 2005, 36). Between 2005-15, the demand is projected to reach
about 19 hectares per year in the port, 17 hectares per year within other parts of the City of Hamburg and
an additional four hectares per year in the suburbs. This projection highlights the increasing relevance of
outer parts of the metro region. To reach future potential, it is very important to achieve a more efficient
use of land in the port, both by raising productivities and by re-arranging land uses.
The amount of commercial space provided for logistics purposes across the entire metropolitan region
was estimated for 2007 at about 150 hectares (CIMA, 2008). Regional representatives of economic
development engaged in the suburban areas assumed that the rising demand would exceed the given supply
by far. As a consequence, the Gewerbeflächenentwicklungskonzept (GEFEK, Commercial Land
Development Plan) was commissioned in order to provide related expertise on where to go and how to
prepare practical implementation (CIMA, 2010). This plan aimed at identifying concurring land uses and
related economic conflicts. The GEFEK comprised all commercial areas larger than five hectares (or larger
than one hectare if in the City of Hamburg). The survey revealed that a land surface of about 4 700
hectares was used for logistics, of which about 1 490 hectares were located in the state of Schleswig-
Holstein in the northern suburbs of Hamburg, 170 hectares in the City of Hamburg (including the port
area) and about 3 060 hectares in the state of Lower Saxony in the southern suburbs of Hamburg. Only in
the district of Harburg were there about 251 hectares of commercial space available for development. The
study confirms that as the supply of commercial space increases, the more remote from Hamburg the place
is located; however, the availability of commercial space there might not necessarily correspond to current
demand.
The district of Harburg, situated in the south of the metro region, was and still is considered most
powerful in terms of placing new developments. The district of Harburg not only is characterised by the
strongest growth rates of employment and related future expectations within the metropolitan area, but also
represents the district with the highest amount of commercial space available in close vicinity to the City of
Hamburg and thus to the port. Due to the lack of detailed knowledge and data, the so-called KOPLAS
study was jointly commissioned by the eight southern counties of the metro region with the state of Lower
Saxony.10
The study was devoted to preparing the dataset for future development policies and concluded
that the existing stock of land did not change significantly in recent years. In the case of the district of
Harburg, the related numbers developed from 622 hectares in 2003 to 624 hectares in 2009. The study
predicted that by 2015 a corridor between 640 and 700 hectares would be required for development
purposes (SCI Verkehr, 2010, 68). The demand for land triggered by the logistics sector is already
considered to be relatively high. The more land claimed for logistics purposes, the more intense the related
planning conflicts and material problems in the near future.
According to the KOPLAS study, a total of 635 hectares of commercial and industrial land were
developed in the the district of Harburg (SCI Verkehr, 2010). Of this, 488 hectares are suitable for logistics
activities, and today about 200 hectares are already available. As of 2008, the demand for land was

41
estimated to comprise about 143 hectares, with an additional demand reaching about 36 hectares before
2015. Given that transport infrastructure is provided quite extensively by the motorways A1, A7, A250 and
A261, the connectivity of the district with other core urban areas of Hamburg is considered excellent. As a
consequence, the South has become the target of major corporate relocation strategies, and a majority of
newly attracted investments in the logistics business in the metro region have materialised in the district of
Harburg. Notably, eight existing major commercial areas and four planned developments focussing on
logistics are currently reported, comprising a gross area of more than 120 hectares of land to be available
soon (Flämig and Hesse, 2011). Co-operation with the private sector concerning spatial development and
land use is actively pursued via the Logistics Initiative Hamburg and the Growth Initiative Süderelbe (Box
3).
Box 3. Logistics initiative Hamburg and Süderelbe
The Logistics Initiative Hamburg, created in 2006, assists in the formation of a network within the business, academic and political communities ranging from the exchange of information to long-term co-operation. As such, it acts as a channel for companies’ ideas, demands and interests in order to identify and remove obstacles to growth. This includes the qualification and brokerage of personnel; the preparation and provision of commercial property and sites for development; and a transport infrastructure that meets logistics requirements. Development management services for companies considering location in the region are supplied from one source. A particular focus lies on the promotion of innovation and new technologies with the aim of supporting the region and creating new jobs. To this end, workshops, research groups and conferences are regularly organised to systematically improve the region’s knowledge regarding developments relevant to the sector.
Another relevant player concerning business and land development is represented by Süderelbe corporation (Süderelbe AG), founded in late 2004, emerging from the Growth Initiative Süderelbe. This corporation is a joint activity pursued by the states of Lower Saxony and Hamburg, in collaboration with the districts of Stade, Harburg, Lüneburg and others. Among the current members are firms, business associations (such as chambers of commerce), and the districts in the southern leg of the metro region. Süderelbe AG aims at regional co-operation and business promotion, and focuses on real estate consultancy as a one-stop agency. It also focuses on cluster development, currently with four clusters: two focused on economic policy and locational improvements, and two others concerned with logistics and port issues and the maritime economy (Glaser and Läpple, 2004). In the field of logistics, Süderelbe AG aims to complement port functions and compensate for disadvantages of agglomeration in the centre of the City of Hamburg. It is expected that added value based on logistics is thus being newly generated or at least kept within the region, particularly by cluster development and further economic promotion measures. In governance terms, Süderelbe AG appears as a hybrid of semi-public institution that is supported by both public and private (entrepreneurial) actors.
Metropolitan governance
Sub-national governments are essential for port-city relationships, as in many cases they have
important responsibilities for land use, infrastructure and the built environment. Co-ordination of these
issues is streamlined in Hamburg because it governs as a city-state. Further, city districts in Hamburg have
policy making authority over land-use planning, which enables them to make binding decisions
autonomously. However, the relatively small size of the city-state requires pursuit of concerted action with
its neighbour states: Schleswig-Holstein and Lower Saxony. Since 2006, Hamburg has become a
designated metropolitan region based on formal acknowledgement by the MKRO (The Joint Conference of
Ministers for Regional Planning of States and Federal Government). The Hamburg metropolitan region
consists of 12 districts, in addition to the city-state of Hamburg; an enlargement of the metropolitan
region‟s territory is anticipated for 1 May 2012. The northern parts of the metropolitan region belong to the
State of Schleswig-Holstein, while the southern parts belong to the State of Lower Saxony. The property of
Hamburg as a city-state surrounded by these two neighbouring states also gives an indication of the
complexity of governance patterns for this location, likely even more so than in the typical case of core city
and suburbs.

42
Governance in the Hamburg metropolitan region is marked by some regional co-ordination, but most
binding planning decisions are made at the local level. A joint planning framework of Hamburg and the
neighbouring states of Schleswig-Holstein (North) and Lower Saxony (South) has existed since 1950 and
was renewed in 2005. Now a certain emphasis is placed on a co-ordinated development of settlements,
land use, green space and infrastructure, particularly in the Hamburg metro region‟s major suburban areas.
The fringes are situated in the vicinity of the metropolitan region, yet formally belong to the territory of the
neighbour states. However, the most binding decisions concerning land use and building codes are still
being made at the local level, and, in most cases, are driven by the desire of municipalities to attract
corporate investments.
Logistics has not been the focus of the majority of towns and municipalities for long, particularly due
to the negative externalities associated with large commercial sites and frequent lorry traffic (Hesse, 2004).
As a consequence of ever-rising transport volumes, the increasing demand for commercial space, and a
renewed interest of local officials in developing their commune towards a “logistics region”, there is both
rising development interest and an upcoming claim in co-ordinating the scattered developments through
planning and governance. This seems to be even more important now, as the modern seaport is no longer
based on fixed local assets and thus no longer spatially embedded, but increasingly subject to policies of
flows and an enhanced locational mobility (Kreukels, 2003; Klink and Berg, 1998).
Port regionalisation is pushing responsibility towards the fragmented landscape of suburban
communities, creating new challenges. In the metropolitan periphery the related governance patterns,
routines and experiences are by far not as developed as they appear in the core city with its traditional
setting of port milieu, business communities and public officials. Moreover, in the context of port
regionalisation, it may be reasonable to extend the spatial reach of port policy and infrastructure, according
to the increasing network character of modern logistics. Concepts such as the “extended gateways” known
from Antwerp (Box 4), as well as Rotterdam/Moerdijk, or the joint inland port network by the port
terminal operator HHLA (Hamburger Hafen und Logistik AG) and Eurogate, could lead the way for main
ports to interfere between competitive pressures on the one hand and the search for spatial flexibility and
potential land on the other.
Box 4. Extended gateways of the port of Antwerp
The Flemish Institute of Logistics (financed by the Flemish government) has developed the concept of the “extended gateway”. This seeks to define corridors into the port hinterland, equipped with multimodal capacities and inland terminals. These corridors must also have sufficient space to develop logistics parks. The parks will provide facilities to multinational firms and their logistics suppliers to build distribution centres. Creation of these corridors serves (i) to reduce logistics costs by improving links between the port and appropriate sites in the hinterland, and (ii) to maximise value added and employment through the creation of parks.
From 2007-09, the Port of Antwerp took part in several of these studies co-ordinated by the Flemish Logistics Institute, in order to promote extended gateways. In each province, dominant logistics clusters were identified and strategies prepared for grouping and expanding flows to and from Belgian seaports. For each “hotspot”, the type and positioning of logistics and distribution activities were defined and an action plan established in order to achieve growth objectives. Project managers were then recruited in the provinces adjacent to the Port of Antwerp, charged with implementing the action plans flowing from the studies on the extended gateways. These plans are being applied in collaboration with the other stakeholders (i.e. the operators and local and regional development agencies responsible for the logistics zones).
The Port of Antwerp then took action in three directions: (i) take equity stakes in inland platforms (long-term perspective); (ii) engage in active business prospecting with respect to inland platforms, for example by hiring the services of firms that have close links to platform operators (short-term perspective); and (iii) sponsor networks to improve co-ordination of transport links to the hinterland and to strengthen logistic chains, e.g. the framework plan for waterway navigation at Antwerp and Antwerp Intermodal Solutions (AIS).

43
BIBLIOGRAPHY
Brooks, M. (2004), “The Governance Structure of Ports”, Review of Network Economics, Vol. 3, No. 2, pp.
169-184.
Bruns-Berentelg, J. (2009), “Revitalisation through Planning”, Ports and Harbors, January, pp. 26-28.
Bundesamt für Güterverkehr (2007), Marktbeobachtung Güterverkehr; Sonderbericht zur Entwicklung des
Seehafen-Hinterlandverkehrs (Market assessment on freight traffic; special issue on the development
of port hinterland traffic), Berlin
BMVBS (Bundesministerium für Verkehr, Bau und Stadtentwicklung) (2009), “Nationales Hafenkonzept
für die See- und Binnenhäfen” (National Port Concept for Sea and Inland Ports), BMVBS, Berlin,
17 June.
CIMA (2008), “Veranstaltungsdokumentation zum Fachgespräch zur Gewerbeflächenentwicklung in der
Metropolregion Hamburg” (Documentation the expert discussion on the development of commercial
space in the metropolitan region of Hamburg), CIMA Projekt + Entwicklung GmbH, 31 January,
www.cima.de/freedocs/home/01_dok_fg_gewerbeenentw.pdf.
CIMA (2010), “Gewerbeflächenkonzeption für die Metropolregion Hamburg (GEFEK) Kurzfassung ”
(Industrial estate concepts for the Hamburg metropolitan region), CIMA Projekt + Entwicklung
GmbH, 11 October, http://metropolregion.hamburg.de/contentblob/2575848/data/gefek-
gutachten.pdf.
De Langen, P. and A. Chouly (2004), “Hinterland Access Regimes in Seaports”, European Journal of
Transport and Infrastructure Research, Vol. 4, No. 4, pp. 361-380.
De Ligt, T. and E. Wever (1998), “European Distribution Centres: Location Patterns”, Tijdschrift voor
Economische en Sociale Geografie, Vol. 89, No. 2, pp. 217-223.
Deecke, H. (1995), “Schiffsgerechte Flüsse oder flußgerechte Schiffahrt”, In Schutzgemeinschaft
Deutsche Nordseeküste e.V. Wilhelmshaven (eds.), Fahrwasservertiefungen und ihre Auswirkungen
auf die Umwelt, Schutzgemeinschaft Deutsche Nordseeküste e.V., pp. 21-51.
Deecke, H. and D. Läpple (1996), “German Seaports in a Period of Restructuring”, Tijdschrift voor
Economische en Sociale Geografie, Vol. 87, No. 4, pp. 332-341.
Desfor, G., et al. (eds.) (2010), Transforming Urban Waterfronts: fixity and flows, Routledge, London and
New York.
Dooms, M. and E. Haezendonck (2004), “An Extension of „Green Port Portgolio Analysis‟ to Inland Ports:
An Analysis of a Range of Eight Inland Ports in Western Europe”, proceedings of the annual
Conference of the International Association of Maritime Economists (IAME), Izmir, Turkey, July,
pp. 1324-1341.

44
Ducruet, C. and O. Merk (2012), “The Distribution of Short Sea Shipping routes”, Papeles de Economía
Espanola.
Everett, S. (2005), “Policy Making and Planning for the Port Sector: Paradigms in Conflict”, Maritime
Policy and Management, Vol. 32, No. 4, pp. 347-362.
Ferrari, C., F. Parola and E. Gattorna (2011), “Measuring the Quality of Port Hinterland Accessibility: The
Ligurian Case”, Transport Policy, Vol. 18, pp. 382-391.
Flämig, H. and M. Hesse (2011), “Placing Dryports: Port Regionalization as a Planning Challenge: The
Case of Hamburg, Germany and the Süderelbe”, Research in Transportation Economics, DOI:
10.1016/j.retrec.2011.08.005.
Glaser, J. and D. Läpple (2004), “Wachstumsinitiative Süderelbe – Eckpunkte einer Clusterstrategie”
(Growth initiative South Elbe – cornerstones for a cluster strategy), Neues Archiv für Niedersachsen,
February, pp. 49-54.
Guerrero, D. (2010), « Les Aires d‟Influence des Ports de la France : Entre Réseau et Gravitation »,
Doctoral Thesis, Université Paris Diderot, Paris.
Haezendonck, E. (2001), “Essays on Strategy Analysis for Seaports”, Garant, Leuven.
Haezendonck, E., M. Dooms and C. Coeck (2006), “Environmental Strategy for Ports”, in T. Notteboom
(ed.), Ports Are More than Piers, De Lloyd Publisher, Antwerp, pp. 147-173.
Hall, P. (2007), “Seaports, Urban Sustainability, and Paradigm Shift”, Journal of Urban Technology, Vol.
14, No. 2, pp. 87-101.
Hamburg Port Authority (2005), “Port Development Plan, Hamburg”, http://www.hamburg-port-
authority.de/ausbildungs-und-stellenangebote/stellenangebote/cat_view/42-
hafenentwicklungsplan.html, accessed on 1 December 2010.
Hamburg Port Authority (2010), Hamburg Port Authority website, www.hamburg-port-
authority.de/presse-und-aktuelles/zahlen-daten-und-fakten.html, accessed on 11 September 2011.
Healey, P. (1997), Collaborative Planning - Shaping places in fragmented societies, MacMillan Press,
Houndmills and London.
Hesse, M. (2004), “Land for Logistics: Locational Dynamics, Real Estate Markets and Political Regulation
of Regional Distribution Complexes”, Tijdschrift voor Sociale en Economische Geografie (Journal
of Social and Economic Geography), Vol. 95, No. 2, pp. 162-173.
Hesse, M. (2006), “Global Chain, Local Pain: The Regional Implications of Global Production and
Distribution Networks in the German North Range”, Growth and Change, Vol. 32, No. 4, pp. 570-
596.
Hesse, M. (2007), “The System of Flows and the Re-Structuring of Space: Elements of a Geography of
Distribution”, Erdkunde - wiss. Archiv für Geographie, Vol. 61, No. 1, pp. 1-12.
Hesse, M. (2010), “Main Port und Hinterland unter Druck. Wettbewerbsdynamik und Hafen-
Regionalisierung – das Beispiel Antwerpen/Belgien” (Main Port and Hinterland Under Pressure.

45
Competitive Dynamics and Port Regionalization - The Example of Antwerp / Belgium), Zeitschrift
für Wirtschaftsgeographie, Vol. 54, No. 3-4, pp. 166-179.
Hesse, M. and J-P Rodrigue (2004), “The Transport Geography of Logistics and Freight Distribution”,
Journal of Transport Geography, Vol. 12, No. 3, pp. 171-184.
Hoyle, B. and D. Pinder (1992), European Port Cities in Transition, Bellhaven Press, London.
HVB-Group/Drewry Shipping Consultants (2005), Port Congestion – No Quick Fix, HVB-Group,
Hamburg.
IBA Hamburg und Technische Universität Hamburg-Harburg (2008), IBA-Labor Hafen-Logistik-Stadt.
Internationale Erfahrungen für Hamburg Nutzbar Machen. Symposium Report, IBA, Hamburg, 23-
24 November 2007.
Innovationsallianz Hamburg (n.d.), “Strategische Leitlinien”, Hamburg, pp. 47.
Klink, H. van and G. van den Berg (1998), “Gateways and Intermodalism”, Journal of Transport
Geography, Vol. 6, No. 1, pp. 11-19.
Kooiman, J. (2003), Governing as governance, Sage, London.
Kreukels, A. (2003), “Wie Verankern Sich Häfen im Raum? Drei Fragen an Anton Kreukels, Professor am
Department für Stadt- und Regionaplanung der Universität Utrecht”, DISP, Vol.154, pp. 26-27.
Läpple, D. (2004), “Entwicklungsperspektiven von Stadtregionen und Ihrer Lokalen Ökonomien”, in
Hanesch, W. (eds.), Lokale Beschäftigung und Ökonomie: Herausforderung für die „Soziale Stadt“,
VS-Verlag, Wiesbaden, pp. 95-117.
Leitner, S. and R. Harrison (2001), “The Identification and Classification of Inland Ports”, Research
Report Number 0-4083-1, Center for Transportation Research, The University of Texas at Austin.
Logistikinitiative Hamburg (2010), www.hamburg-logistik.net/fileadmin/user_upload/PDF/LIHH-
NEWS/Veranstaltungen/090910_Vortrag_Lobenberg.pdf, accessed on 1 December 2010.
Loyen, R., E. Buyst and G. Devos (eds.) (2003), Struggling for Leadership: Antwerp-Rotterdam Port
Competition between 1870 and 2000, Physica, Heidelberg and New York.
Machule, D. (2004), “Wachsende Umlandgemeinden im Süden der Hamburger Metropolregion -
Anmerkungen zu einem Experimentierfeld”, in U. Altrock and D. Schubert (eds.), Wachsende Stadt:
Leitbild, Utopie, Vision? VS-Verlag, Wiesbaden, pp. 309-320.
Maibach, M. et al. (2008), Handbook on Estimation of External Costs in the Transport Sector, CE Delft.
McKinnon, A. (2009), “The Present and Future Land Requirements of Logistical Activities”, Land Use
Policy, Vol. 26, pp. 293-301.
Merk, O. et al. (2011), “The Competitiveness of Global Port-Cities: The Case of the Seine Axis (Le Havre,
Rouen, Paris, Caen) – France”, OECD Regional Development Working Papers, 2011/07, OECD
Publishing.

46
Merk, O. et al. (forthcoming), “The Competitiveness of Global Port-Cities: The Case of
Rotterdam/Amsterdam – Netherlands”, OECD Regional Development Working Papers.
Metropolregion Hamburg (2011), http://metropolregion.hamburg.de/nofl/615580/statistikportal-der-
metropolregion-hamburg.html, accessed on 22 September 2011.
Monge, F. (2004), “Port Cities: Book Review Essay”, International Journal of Urban and Regional
Researc, Vol. 28, No. 1, pp. 229-233.
Musso, E., M. Becacchio, C. Ferrari (2000), “Ports and Employment in Port Cities”, International Journal
of Maritime Economics, 2(4), pp. 283-311
NEA (2011), The Balance of Container Traffic amongst European Ports, NEA, Zoetermeer.
Notteboom, T. (2004), “Container Shipping and Ports: An Overview”, Review of Network Economics, Vol.
3, No. 2, pp. 86-106.
Notteboom, T. and J-P Rodrigue (2005), “Port Regionalization: Towards a New Phase in Port
Development”, Maritime Policy and Management, Vol. 32, No. 3, pp. 297-313.
Nuhn, H. and J. Ossenbrügge (1984), “Räumliche Konflikte im Hamburger Hafenerweiterungsgebiet.
Sozioökonomische und ökologische Auswirkungen einer wachstumsorientierten Regionalpolitik”, in
L. Schätzl (ed.), Regionalpolitik zwischen Ökonomie und Ökologie,. Geographische Gesellschaft zu
Hannover, Hannover, pp. 129-162.
Nuhn, H., J. Ossenbrügge and E. Söker (eds.) (1983), Expansion des Hamburger Hafens und Konsequenzen
für den Süderelberaum. Durchführung der Umsiedlung Altenwerders und Reaktion der Betroffenen
(Arbeitsberichte und Ergebnisse zur Wirtschafts- und Sozialgeographischen Regionalforschung),
Universität Hamburg, Hamburg.
Österreichische Seehafenbilanz (2011), “Österreichs Außenhandel zog es 2010 in den sonnigen Süden”,
Verkehr, 10 June 2011, no. 23
Österreichische Seehafenbilanz (2010), “Österreichs verladende Wirtschaft setzt im Überseehandel auf die
Nordhäfen”, Verkehr, 11 June 2010, no. 23
Pallis, A. and P. De Langen (2010), “Seaports and the Structural Implications of the Economic Crisis”,
Research in Transport Economics, Vol. 27, pp. 10-18.
Planco Consulting (2005), Fortschreibung der Berechnungen zur “Regional- und gesamtwirtschaftlichen
Bedeutung des Hamburger Hafens im Jahr 2001” (Regional Economic and Overall Impact of the
Port of Hamburg in 2001), Updated for 2004, Planco, Essen.
Planco Consulting (2011), Fortschreibung der Berechnungen zur “Regional- und Gesamtwirtschaftlichen
Bedeutung des Hamburger Hafens im Jahr 2001” (Regional Economic and Overall Impact of the
Port of Hamburg in 2001), Planco, Essen.
Port of Hamburg (2010), Green Port Special, Hamburg Hafen-Marketing e.V., Hamburg.
Robinson, R. (2002), “Ports as Elements in Value-Driven Chain Systems: the New Paradigm”, Maritime
Policy and Management, Vol. 29, No. 3, pp. 241-255.

47
Rodrigue, J-P and T. Notteboom (2010), “Foreland-based Regionalization: Integrating Intermediate Hubs
with Port Hinterlands”, Research in Transportation Economics, Vol. 27, pp. 19-29.
Roe, M. (2007), “Shipping, Policy and Multi-Level Governance”, Maritime Economics and Logistics, Vol.
9, pp. 84-103.
Roso, V., J. Woxenius and K. Lumsden (2009), “The Dry Port Concept: Connecting Container Seaports
with the Hinterland”, Journal of Transport Geography, Vol. 17, No. 5, pp. 338-345.
SCI Verkehr GmbH (ed.) (2010), “Kooperative Planung in der südlichen Metropolregion Hamburg,
Empfehlungen für die Regional- und Bauleitplanungsträger zur raumverträglichen Entwicklung von
Gewerbestandorten für die Logistik-Branche (KOPLAS) ” (Co-operative planning in the southern
metropolitan region of Hamburg - Recommendations for the regional and zoning support for spatial
development of commercial facilities for the logistics industry), Abschlussbericht Langfassung. SCI
Verkehr GmbH.
Sevecke, T. (2008), ”Flächenmanagement in Hamburg – Logistikflächen”, in IBA_Hamburg/TUHH (eds.),
IBA-Labor Hafen-Logistik-Stadt, IBA_Hamburg/TUHH, pp. 130-131.
Sheppard, E. (2002), “The Spaces and Times of Globalization: Place, Scale, Networks, and Positionality”,
Economic Geography, Vol. 78, No. 3, pp. 307-330.
Slack, B. (1993), “Pawns in the Game: Ports in a Global Transportation System”, Growth and Change,
Vol. 24, pp. 579-588.
Stoker, G. (1998), “Governance as Theory: Five Propositions”, International Social Science Journal, Vol.
155, pp. 17-28."
Stolpe, H. and U. Obel (1999), “Ökologische Probleme des Containertransports”, Berichte zur Deutschen
Landeskunde, Vol. 73, No. 2-3, pp. 151-164.
Süderelbe AG (2011), “Logistik und Hafen”, Süderelbe website, www.suederelbe.info/content.php?id=82,
accessed on 22 February 2011.
Süderelbe (2010), Süderelbe website, www.suederelbe.info/content.php?id=82, accessed on 1 December
2010.
Wagner, T. (2009), “Verkehrswirkungen von Logistikansiedlungen – Abschätzung und regionalplanerische
Bewertung”, in Flämig, H. and C. Gertz (eds.), Schriftenreihe des Instituts für Verkehrsplanung und
Logistik - Harburger Berichte zur Verkehrsplanung und Logistik 4, Technical University of
Hamburg-Harburg, Hamburg.
Warsewa, G. (2010), Lokale Kultur und die Neuerfindung der Hafenstadt. Raumforschung und
Raumordnung, Vol. 68, pp. 373-387.
Weisbrod, R. (2004), “Ports of the Twenty-First Century: The Age of Aquarius”, in R. Hanley (ed.),
Moving People, Goods, and Information in the 21st Century: The Cutting Edge Infrastructures of
Networked Cities, Routledge, New York, pp. 47-61.

48
NOTES
1 Gemäß den ersten drei Quartalen des Jahres 2011.
2 Gemäß Zahlen der Hafen Hamburg Marketing für 01–09/2011 auf der Basis von Berechnungen für die fünf Häfen von
Hamburg, Bremen, Rotterdam, Antwerpen und Zeebrügge.
3 Based on the first three quarters of 2011.
4 According to figures by Hafen Hamburg Marketing for 01-09/11, basis of calculation are the five ports of Hamburg,
Bremen, Rotterdam, Antwerp, Zeebrugge.
5 World ranking numbers from 2009.
6 A counter-example to these numbers: Regarding containerised goods, Hamburg holds a share of 86 percent
for Poland (import & export), according to the Hamburg Port Authority.
7 The approach follows different logical steps, which can be summarised as follows. First, two different
groups of regions are defined: port regions and non-port regions. This is followed by identification of the
different industries in which each type of region is specialised. For the industries in which port regions as a
whole are specialised, the specialisation index of each individual port region is identified in order to assess
how many port regions are specialised in these industries.
8 The analysis used structural business statistics data of the European Union, which contained in total 56
different economic sectors for 2007. This is a limited number of economic sectors (the original analysis of
Musso et al. [2000] used 874 sectors), but data at more detailed sectoral level do not exist for EU-regions.
9 Since Germany is a federal state, the federal government and the Länder have competences in port and
infrastructure development. This leads to an increased amount of co-ordination required among the parties.
10 “Kooperative Planung in der südlichen Metropolregion Hamburg - Empfehlungen für die Regional- und
Bauleitplanungsträger zur raumverträglichen Entwicklung von Gewerbestandorten für die Logistik-
Branche (KOPLAS)” which stands for “Co-operative planning in the southern metropolitan region of
Hamburg - Recommendations for the regional and zoning support for spatial development of commercial
facilities for the logistics industry”