“The competitiveness of CEE in a global ... - Bank Austria€¦ · The NMS increasingly produce...
21
“The competitiveness of CEE in a global context“ Marianne Kager, BA-CA Chief Economist Julia Wörz, WIIW 29 March 2006
Transcript of “The competitiveness of CEE in a global ... - Bank Austria€¦ · The NMS increasingly produce...

“The competitiveness of CEEin a global context“
Marianne Kager, BA-CA Chief EconomistJulia Wörz, WIIW
29 March 2006

2
Fast growth in productivity
Over the past decade, the new EU member states from Central Eastern Europe (NMS) increased productivity by an average 4% per year (measured as GDP per capita) compared with only 2% for the EU-15 and 3% for the Asian tiger economies1.
The increase was faster only in China (8%).
The NMS move away from cheap selling.
1 Tiger 1 countries = Hong Kong, Korea, SingaporeTiger 2 countries = Indonesia, Malaysia, Philippines, Thailand

3
The NMS gain market share and price setting power in …
Tiger 2advancedOECD
EU 15
Tiger 1
India
ChinaMexico
Turkey
NMS
Candidates
-0.4
-0.3-0.2-0.1
0
0.10.20.30.4
0.50.6
-6 -4 -2 0 2 4 6
Change in market share
Cha
nge
in im
port
pric
ere
lativ
e to
EU
-15
aver
age
… manufacturing

4
The NMS gain markets and price setting powerfaster then anyone else in …
… medium-high tech industries
Tiger 2
advancedOECD
EU 15
Tiger 1
IndiaChina
Mexico
Turkey
NMS
Candidates
-0.05
0
0.05
0.1
0.15
0.2
0.25
-4 -3 -2 -1 0 1 2 3 4
Change in market share
Cha
nge
in im
port
pric
ere
lativ
e to
EU
-15
aver
age

5
More high-tech, more quality, a hub for the automotive industry
The NMS increasingly produce more high-tech and higher value added products.
They increasingly compete on quality.
The main advantages of the CEE countries are in engineering, including the automotive industry and machinery.

6
From relatively low tech to ...
0
0.5
1
1.5
2
2.5
3
3.5
EU15 Adv OECD NMS Cand Tur, Mex Tigers 1 Tigers 2 China India
low medium-low medium-high highRelative market shares in EU15 by industry groupings, 1995-1997

7
... significantly more high-tech
Relative market shares in EU15 by industry groupings, 2002-2004
0
0.5
1
1.5
2
2.5
3
EU15 Adv OECD NMS Cand Tur, Mex Tigers 1 Tigers 2 China India
low medium-low medium-high high

8
CEE – a strong European industry basis
Western Europe will retain its advantage in business services.
Moving towards more sophistication and quality will further strengthen the position of CEE as a basis for industrial activities.

9
FDI play a major role in the integration and catching-up process
0
10
20
30
40
50
60
EU 15 AdvancedOECD
NMS 8 Candidates Turkey Mexico 1st Tigers 2nd Tigers China India
FDI i
nwar
d st
ock
in %
of G
DP
2000 2004

10
Diminishing goods trade deficit despite currency appreciationand weak demand in major trading partners
-20
-15
-10
-5
0
5
10
15
20
EU15 advanced OECD
NMS Candi-dates
Turkey Mexico Tiger 1 Tiger 2 China India
in %
of G
DP
1999 2004Goods Balance

11
Decreasing services surplus reflects integration into European production networks
-5-4-3-2-10123456
EU15 advanced OECD
NMS Candi-dates
Turkey Mexico Tiger 1 Tiger 2 China India
in %
of G
DP
1999 2004Services Balance
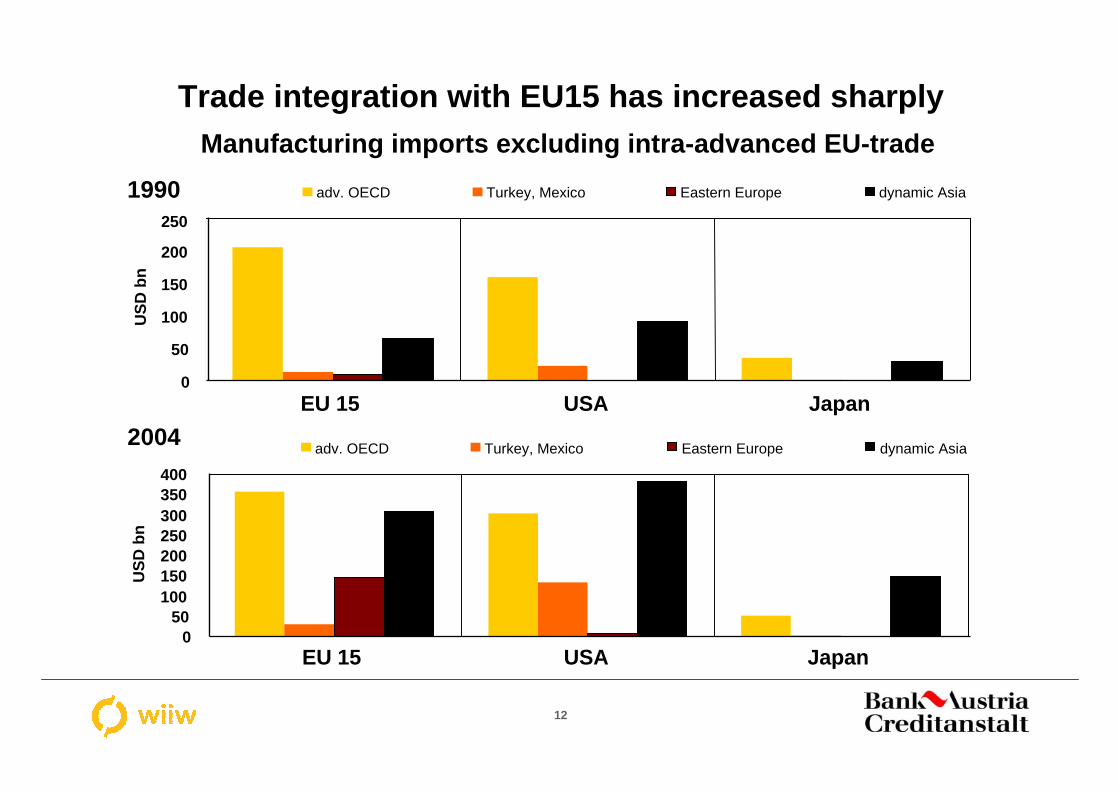
12
Trade integration with EU15 has increased sharply
0
50
100
150
200
250
EU 15 USA Japan
USD
bn
adv. OECD Turkey, Mexico Eastern Europe dynamic Asia1990
050
100150200250300350400
EU 15 USA Japan
USD
bn
adv. OECD Turkey, Mexico Eastern Europe dynamic Asia2004
Manufacturing imports excluding intra-advanced EU-trade

13
Manufacturing
-5
-4
-3
-2
-1
0
1
2
3
4
EU11 AdvancedOECD
IRL Cohesion NMS 8 Candidates Turkey Tigers 1 Tigers 2 China India
1995-2004
Increasing presence on the EU15 market
Change in market shares in %pts

14
Market share gains less dynamic since 2000
Manufacturing
-5
-4
-3
-2
-1
0
1
2
EU11 AdvancedOECD
IRL Cohesion NMS 8 Candidates Turkey Tigers 1 Tigers 2 China India
1995-2000 2000-2004
Change in market shares in %pts

15
Low tech industries
-5
-4
-3
-2
-1
0
1
2
3
EU 11 AdvancedOECD
Ireland Cohesion NMS 8 Candi-dates
Turkey Tigers 1 Tigers 2 China India
1995-2000 2000-2004
... especially in low tech industries
Change in market shares in %pts

18
High tech industries
-8
-6
-4
-2
0
2
4
6
EU 11 AdvancedOECD
Ireland Cohesion NMS 8 Candi-dates
Turkey Tigers 1 Tigers 2 China India
1995-2000 2000-2004
Strong gains in high tech industries
Change in market shares in %pts

19
The NMS rank high on infrastructure indicators
Rank Infrastructure Ease of doing business
Economic freedom,
institutions, corruption
1 Advanced OECD Advanced OECD Advanced OECD2 EU 15 1st Tigers 1st Tigers3 1st Tigers EU 15 EU 154 NMS 8 NMS 8 Mexico5 CC-3 Turkey NMS 86 Turkey CC -3 2nd Tigers7 2nd Tigers Mexico CC-38 Mexico China Turkey9 China 2nd Tigers China
10 India India India

20
The gap between the EU-15 and the NMS in the ease of doing business is relatively small ...
0
10
20
30
40
50
60
70
80
EU 15 AdvancedOECD
NMS 8 Candi-dates
Turkey Mexico Tiger 1 Tiger 2 China India
num
ber o
f day
s
0
1
2
345
67
8
Inve
stor
Pro
tect
ion
Inde
x
Start business Time for Export Investor Protection Index

21
... but more needs to be done when it comes to corruption and quality of institutions
0
1
2
3
4
5
6
EU 15 AdvancedOECD
NMS 8 Candi-dates
Turkey Mexico Tiger 1 Tiger 2 China India
Her
itage
Fou
ndat
ion
Inde
x
0
1
2
345
67
8
Cor
rupt
ion
Inde
x
Economic Freedom Trade Freedom Corruption Index

22
The successful and speedy process of structural catching-up in the NMS is testimony that the CEECs have successfully embarked upon a cumulative developmental process and are – so far – successfully facing the competition from other catching-up regions.

“The competitiveness of CEEin a global context“
Marianne Kager, BA-CA Chief EconomistJulia Wörz, WIIW
29 March 2006