THE COMPARISON BETWEEN AD VALOREM AND SPECIFIC …
32
THE COMPARISON BETWEEN AD VALOREM AND SPECIFIC TAXATION UNDER IMPERFECT COMPETITION: EVIDENCE FROM THE EUROPEAN CIGARETTE INDUSTRY Sophia Delipalla and Owen O’Donnell February 1998 Abstract Recent theoretical work has shown that the incidence of ad valorem and specific taxes may differ and each may be over or under-shifted onto consumers in the presence of imperfect competition. Empirical comparison of the price effects of the two taxes is limited. There are no previous estimates of these effects derived from data displaying reasonable variation in both types of taxes. We fill this gap by estimating the impact on prices of specific and ad valorem taxes levied on cigarettes in Europe. The results are consistent with the theory. There is evidence of under and over-shifting and the specific tax has a significantly greater effect on price than the ad valorem. Keywords: Commodity Taxation, Oligopoly, Cigarettes. JEL Classification: H22, L13, L66 Acknowledgements: We are grateful for comments received at seminars at Kent, Sussex and York. Corresponding author: Sophia Delipalla, Department of Economics, Keynes College, University of Kent, Canterbury KENT CT2 7NP, UK. Tel: (++1227) 827924; Fax: (++1227) 827850; email: [email protected]
Transcript of THE COMPARISON BETWEEN AD VALOREM AND SPECIFIC …
THE COMPARISON BETWEEN AD VALOREM AND SPECIFIC TAXATION
UNDER IMPERFECT COMPETITION: EVIDENCE FROM THE EUROPEAN
CIGARETTE INDUSTRY
Sophia Delipalla and Owen O’Donnell
February 1998
AbstractRecent theoretical work has shown that the incidence of ad valorem andspecific taxes may differ and each may be over or under-shifted ontoconsumers in the presence of imperfect competition. Empirical comparisonof the price effects of the two taxes is limited. There are no previousestimates of these effects derived from data displaying reasonable variationin both types of taxes. We fill this gap by estimating the impact on prices ofspecific and ad valorem taxes levied on cigarettes in Europe. The results areconsistent with the theory. There is evidence of under and over-shifting andthe specific tax has a significantly greater effect on price than the advalorem.
Keywords: Commodity Taxation, Oligopoly, Cigarettes.
JEL Classification: H22, L13, L66
Acknowledgements: We are grateful for comments received at seminars at Kent, Sussex andYork.
Corresponding author: Sophia Delipalla, Department of Economics, Keynes College,University of Kent, Canterbury KENT CT2 7NP, UK. Tel: (++1227) 827924; Fax: (++1227)827850; email: [email protected]

1
1. Introduction
Recent theoretical work has shown that the incidence of ad valorem and specific taxes may
differ and each may be over or under-shifted onto consumers in the presence of imperfect
competition (Delipalla and Keen, 1992; Skeath and Trandel, 1994; Myles, 1996). Empirical
comparison of the price effects of the two taxes is limited. There are no previous estimates of
these effects derived from data displaying reasonable variation in both types of taxes. In fact,
empirical work on commodity tax incidence, in general, is sparse (rare examples are Besley
and Rosen, 1994 and Poterba, 1996).
We fill this gap by estimating the impact on prices of specific and ad valorem taxes levied on
cigarettes in Europe. The European cigarette industry, being highly concentrated, provides an
appropriate context in which to test the recent developments in the theory of tax incidence
under oligopoly. The estimates are of interest not only as tests of the predictions of theory and
for drawing implications for the incidence of commodity taxes in general, but also as a source
of information for the long running European debate over the harmonisation of cigarette taxes.
Although all EU countries tax cigarettes heavily, there is a split between those relying more
on specific taxes - roughly, the ‘north’- and those favouring ad valorem taxation - roughly, the
‘south’. These differences over the appropriate structure of taxation have impeded fiscal
harmonisation in this area. Evidence on the relative effects of the two taxes might help to
resolve the debate.
The taxation of cigarettes is motivated, in part, by public health concerns (Commission of the
European Community, 1989). Evaluations of the effectiveness of taxation as an anti-smoking
instrument concentrate on the estimation of price elasticities of demand, adopting the
assumption that taxes are fully shifted onto consumers (c.f. Chaloupka and Wechsler, 1997).

2
Tests of the validity of this assumption are important in assessing the health policy role, and
the distributional effects, of cigarette taxation.
The next section presents the theoretical framework for analysing how ad valorem and
specific taxes affect prices, and summarises the existing evidence. In section 3 we describe the
European cigarette industry. Section 4 describes the data and the empirical specification.
Estimation is considered in section 5 and the results are reported. Section 6 concludes.
2. The relative incidence of ad valorem and specific taxes
2.1 The theory
Tax incidence is concerned with the effect of taxation upon prices and profits. Since perfectly
competitive firms earn zero profits, under perfect competition there is only a price effect.
Consumer prices increase by just the amount of the tax if the long run supply curve is
horizontal, and by less than that if it is upward sloping. Price rising by more than the amount
of the tax is not a possibility.
Under imperfect competition there are both price and profit effects. Since prices are set above
marginal cost, an increase in cost due to a change in taxation need not be reflected in an
identical increase in price. Overshifting occurs when price rises by more than the amount of
the tax and undershifting when it rises by less. The degree of tax shifting depends on the
relative curvature of industry demand and the firm’s cost function. With constant marginal
cost, concavity of industry demand leads to undershifting and sufficient convexity to
overshifting (Seade, 1985; Stern, 1987).
3
The analysis of tax incidence becomes more interesting and complex when we consider the
form of taxation. Although specific and ad valorem taxes have identical effects under the
assumptions of perfect competition and exogenous quality, their equivalence breaks down
when either assumption is relaxed (Keen, 1997). With respect to the introduction of imperfect
competition, Suits and Musgrave (1955) show, for the monopoly case, ad valorem taxation is
consistent with a lower after-tax price, for a given tax revenue. More recent studies have
concentrated on the systematic comparison between specific and ad valorem taxation in
varying circumstances of homogeneous product oligopoly (Delipalla and Keen, 1992; Skeath
and Trandel, 1994; Myles, 1996). Consider the conjectural variations model, as in Delipalla
and Keen (op. cit.), which encompasses market structures ranging from competitive outcomes
to monopoly.
It is assumed the industry consists of n identical firms. The after-tax profit earned by a typical
firm (i) is
� i i itv p X ts x c x� � � �{( ) ( ) } ( ),1 (2.1)
where p is the consumer price, X is the industry output, xi is the firm’s output and ts and tv are
the specific and ad valorem tax rates respectively. There are increasing returns to scale and
c(xi) is the firm’s total cost of producing the given level of output. The strategic interaction
between firms is captured by � : each firm conjectures that, when it changes its output xi,
other firms’ responses will be such that � �dX
dxn
i
� �� 0, . With � � 0, conjectures are
“competitive”; � � 1 corresponds to Cournot conjectures and � � n to tacit collusion.
The first-order condition for profit maximisation is given by

4
� � � �ptv
c tstv
c tsx x��
���
�
�
�
�
���
���
� ��
���
�
�1
1
1
1
1
1 �
� , (2.2)
where �
�n
, � � �dX
dp
p
X, �
�
��
�
�
���
����
1
11, and cx is marginal cost. Here � measures the
degree to which a firm is not a price taker. The marginal effect of each tax on price is given by
dp
dts tv A E�
����
� � � �
�1
1
1
1 10
( )(2.3)
and1
dppdtv tv A E
dp
dts�
����
� � � �
�1 1
1
1
1 1
1
� �( ), (2.4)
where A c tv pxx X� � �/ ( )� 1 and E p X pXX X� � / denotes the elasticity of the slope of the
inverse demand function (single and double subscripts indicate first and second derivatives
respectively).
Though not noted before, from (2.4), we see that the ratio of the marginal effects of the
specific and ad valorem tax is equal to � , the “mark-up” parameter. Under perfect
competition this parameter is equal to one and we have the well known result that the two
taxes have equivalent effects on price in a competitive environment. However, with imperfect
competition (i.e. � � 1), the price effect of the specific tax exceeds that of the ad valorem tax
by a proportion given by the value of the mark-up.
1 To enable comparison with the effect of the specific tax, we present the impact on price of aunit change in tax revenue arising from a change in the ad valorem tax rate (at initial price),

5
There is full shifting of a tax onto the consumer if the producer price, p tv p ts' ( )� � �1 , is
invariant to the level of the tax. The degree of tax shifting is given by
dp
dts
dp
dtstv
'( )� � �1 1 (2.5)
and
dp
pdtv
dp
pdtvtv
'( )� � �1 1 (2.6)
Expressions (2.5) and (2.6) are less than, equal to and greater than zero with undershifting,
full shifting and overshifting respectively. Comparing (2.5) and (2.6) with (2.3) and (2.4), it is
clear that under perfect competition (� � 1, � 0), there must be full shifting of both taxes,
but otherwise (� � 1, � 0 ) there can be undershifting, full shifting or overshifting,
depending upon the value of parameters related to the market structure, cost structure and
demand elasticity of the industry.2 Also, overshifting of the specific tax is necessary but not
sufficient for overshifting of the ad valorem tax.
Prior to the oligopoly model considered above, consideration of the relative price effects of ad
valorem and specific taxes focussed on their impact on quality in competitive markets (Barzel,
1976; Bohanon and Van Cott, 1984, 1991; Kay and Keen, 1983, 1987a, 1987b, 1991).
With vertical product differentiation, since commodities are composed of a set of
characteristics, a tax can induce substitution within the commodity away from the taxed
i.e. pdtv.2 Perfect competition is sufficient but not necessary for full shifting to occur. For example, inthe presence of imperfect competition combined with constant marginal costs (A = 0) andconstant elasticity of demand (E � �1 1 � ), there will be full shifting of the ad valorem tax

6
characteristic into others. When quality is measured in terms of some untaxed characteristic, a
specific tax may lead to an upgrading in quality. Since the increase in quality per se tends to
raise price, the actual price increase may exceed the (specific) tax increase. An ad valorem tax
bears on all commodity characteristics whose value is reflected in consumer price, providing a
disincentive to improve quality. Note that ad valorem taxation has a “multiplier effect”, that
is, to increase producer price by 1, consumer price has to increase by 1
11
��
tv. Thus, when
the ad valorem tax increases, it is likely to lead to a reduction in quality and, consequently, a
price rise lower than the amount of the tax increase.3
Formalising these ideas, Kay and Keen (1991) show, in a model of competitive behaviour,
that the effect of tax structure on quality is determined by the price elasticity of consumers’
marginal willingness to pay for quality, say �. Overshifting of the specific tax and
undershifting of the ad valorem is predicted when � takes a value between 0 and 1. If � = 1,
there is overshifting of the specific and full shifting of the ad valorem tax. When � = 0, the
specific tax is fully shifted and the ad valorem undershifted. It is argued that values outside
the [0,1] range, although theoretically possible, are unlikely.
The ranking of the relative price effects in the quality model (specific effect always greater
than the ad valorem) is consistent with that generated by the oligopoly model of Delipalla and
Keen (1992). An estimate of the ratio of the two price effects is therefore insufficient to
(and overshifting of the specific tax).3 Cremer and Thisse (1994), in a model of vertical product differentiation with two firmswhere each produces a variant of a differentiated commodity, show that an increase in advalorem taxation can actually reduce the consumer price. Their explanation is that ad valoremtaxation reduces the quality of both variants, narrows the quality gap and intensifies pricecompetition.

7
distinguish empirically between the two models. However, while the oligopoly model allows
under or over shifting of both taxes simultaneously, the competitive endogenous quality
model is consistent with this only for, arguably, implausible values of �.
The realism of an assumption of homogeneous products can obviously be questioned.
However, Anderson et al (1997) show the results of Delipalla and Keen (op. cit.) on the
relative incidence of the two taxes carry over to a model with horizontally differentiated
products in Bertrand-Nash oligopoly.4
2.2 The evidence
Cigarettes, for one reason or another, have been a popular commodity for estimating the price
effects of specific and ad valorem taxes. Barzel (1976) did this by exploiting state variation in
these taxes in the US. No state employed both taxes simultaneously and only one state used an
ad valorem tax. A differential effect of the two types of taxes was tested by examining the
significance of an interaction between the level of tax and a dummy indicating whether the tax
was ad valorem. Barzel (ibid.) found overshifting of the specific tax and could not reject full
shifting of the ad valorem. He attributed the different effects of the two types of taxes to
quality responses, the consistency of this result with imperfect competition not yet having
been recognised.
Johnson (1978) generalises Barzel’s specification by allowing state specific effects, as well as
time effects, and finds overshifting of the specific tax and undershifting of the ad valorem.
4 While Anderson et al (1997) relax the homogeneous product assumption, their model ismore restrictive than Delipalla and Keen (1992) in respect of the market structures andconsumer preferences admitted.

8
The result is interpreted as providing further support for the quality model. Sumner and Ward
(1981) question this interpretation on the grounds of implausibility. They ask what is the
nature of the quality change which is made to the product in response to a tax change and
point out that manufacturers do not produce a different product for the one state levying the ad
valorem tax. An alternative explanation is offered for the apparent overshifting - prices may
be raised at the time of tax increases not only in response to the tax but also to compensate for
accumulated minor cost increases. Controlling for this backlogged price effect, Sumner and
Ward (op. cit.) find undershifting of both taxes and no significant difference between the two.
Their suggested explanation for undershifting is interstate competition. Baltagi and Levin
(1986) model cross-border shopping explicitly; they use the lowest price of cigarettes in a
neighbouring state to control for cross-state substitution and find a small but significant
effect.5 A number of studies are motivated to estimate tax-price relationships not because of
an interest in tax incidence but as an indirect means of estimating market power (Sumner,
1981; Bulow and Pfleiderer 1983; Sullivan, 1985; Ashenfelter and Sullivan, 1987).
Baker and Brechling (1992) look at the effect of excise duty changes on prices in the UK.
Their findings suggest that for beer, spirits and petrol, changes in the specific tax are fully
reflected in changes in prices. For tobacco and wine, they find undershifting and overshifting
respectively. Full shifting of the ad valorem tax can never be rejected. However, as the authors
acknowledge, there are only two changes in the ad valorem rate over the data period, making
5 Coats (1995) estimates cross-border effects of state cigarette taxes looking at response ofstate cigarette sales to state cigarette taxes. Barnett et al (1995) compare the effects of federaland state taxes. Simulation results show that an increase in federal tax results in a greaterincrease in price than does the same change in the average state and local tax. A possibleexplanation is cross-border shopping. Another explanation is that manufacturers use federaltax increases as a signalling device to co-ordinate a series of price increases (c.f. Harris,1987).

9
it difficult to have confidence in the robustness of the estimated incidence of this tax and to
compare it with that of the specific tax.
A major limitation of previous attempts to estimate the relative incidence of specific and ad
valorem taxes is a lack of variation in the data, particularly with respect to the ad valorem rate.
We avoid this limitation by using data from the EU, where all member states levy both a VAT
and an excise duty on tobacco, alcohol and petrol. Moreover, although the excise duty on
alcohol and petrol is purely specific, the one on cigarettes has both a specific and an ad
valorem element.
3. The European tobacco industry and the EU
The European tobacco industry is characterised by a high degree of concentration, making it
an appropriate environment for testing the theory of tax incidence under imperfect
competition. There are state monopolies in France, Italy, Spain and Portugal, which have a
significant, but diminishing (except Spain), share of the domestic market (Eurostat, 1997). In
most of the remaining countries, the market is dominated by a group of American and British
multinationals. The exception is Denmark, where one company (Skandinavisk Tobak) enjoys
an almost monopoly position (Eurostat, ibid.).
The EU is divided into two opposing camps, roughly a north-south divide, with respect to the
structure of taxation preferred. In general, the northern European countries prefer specific
taxation and the southern countries ad valorem.6 The theory discussed in section 2, if valid, is
6 The ‘northern’ camp consists of Denmark, Germany, Ireland, the Netherlands and UK. The‘southern’ group is Belgium, France, Greece, Italy, Luxembourg, Portugal and Spain. Formore details see European Bureau for Action on Smoking Prevention (1992).

10
useful in understanding such preferences. According to the theory, specific taxation leads to
higher prices, for a given tax revenue, and so may be preferred in northern Europe where
smoking prevention movements are more firmly established.7 On the other hand, in southern
countries, such as Greece, smoking prevention - although growing - is a politically sensitive
issue because of the cultural and economic importance of tobacco. These countries prefer ad
valorem taxation since, through the multiplier effect, it increases the price advantage to the
local brands, often made from domestically grown tobacco, relative to those of the
multinationals. Theory also predicts specific taxation is more advantageous for profit relative
to ad valorem (Delipalla and Keen, 1992). The multinational companies predominant in the
north of Europe would therefore be expected to lobby for this type of taxation.
These differences led to major difficulties in trying to reach agreement on the harmonisation
of taxes on cigarettes in the EU. The first directive issued in 1972 (Directive 72/464/EEC)
instructed all member states to introduce a mixed tax structure. The specific tax should be not
less than 5% and the ad valorem not higher than 75% of the total excise duty. The directive
was clearly in favour of predominantly ad valorem taxation; at that time the majority of EC
members had an entirely ad valorem tax structure. Shortly afterwards, Denmark, Ireland and
the UK, countries with predominantly specific taxation, joined the Community. A second
directive was approved in 1977 (Directive 77/805/EEC) according to which the specific tax
should be between 5-55% of the total tax burden including the VAT. This second stage was
extended five times until 1985, when it was extended indefinitely. After several years of
disagreement, in 1992, it was agreed that the overall excise duty should be no less than 57%
7 Moreover, Cnossen (1992) argues that specific taxation is a better instrument to internalisethe “external costs” that smoking imposes, since it hits the cause of the costs directly and doesnot tax items that do not contribute to the costs, such as wrappers, or even mitigate the effects
11
of the final retail price of the most popular price category (all taxes included), and the VAT
should be at least 15% of the final retail price (inclusive of excises). These directives implied
a minimum overall tax level on cigarettes of 70% of the retail price. The ratio of specific to
total taxation should be the same as in the 1977 Directive.
4. Empirical specification and data
Our aim is to compare the effects of specific and ad valorem taxes on cigarette prices. We
achieve this by regressing price data from twelve European countries over sixteen years on
corresponding tax data and controls for other determinants of prices. According to equation
(2.2), price is a mark-up on marginal cost and the specific tax, with the mark-up determined
by the ad valorem tax rate, market structure, demand and cost conditions. No data are
available on marginal costs, market structure or demand conditions. Replacing these by
observable (Z) and unobservable (u) determinants gives the following relationship to be
estimated
� �p f ts tv Z uit it it it it it� , , , (4.1)
where i and t are country and time indicators respectively.
Approximating this function by assuming linearity and homogeneity across countries and time
leads to the following empirical specification8
of smoking, such as filters.8 The Davidson and McKinnon (1981) test was not helpful in selecting between log-linear andlevels specifications. Reset tests favoured the latter. The linear specification was tested againstvarious generalisations achieved by allowing quadratics and interaction terms. The restrictedmodel could not be rejected. Our estimation methods allow for country and time effects within

12
p ts tv Z uit it it it it� � � �� � �1 2 (4.2)
From examination of (4.2) along with (2.5) and (2.6), it is clear that although this specification
imposes homogeneity across countries and time in the response of consumer prices to the
specific and ad valorem taxes, this is not true with respect to the response of producer prices
and, therefore, the degree of tax shifting. The latter effects vary with the rate of the ad valorem
tax (and the price in the case of the effect of the ad valorem).9
Define ��
�
��
�� 1
2
p , where ^ indicates an estimate and p is a particular price. Testing whether
�� is significantly different from 1 is a test of whether the price effects of the specific and ad
valorem tax are equivalent.10
Equation (4.2) is estimated from data on cigarette prices and taxes for the twelve members of
the European Union prior to the 1995 expansion. For ten of these countries, the data cover the
period 1982-97; for Spain and Portugal, the period covered is 1986-97. The data are for prices
and taxes in operation at January 1 of each year.11
the error term.9 Besley and Rosen (1994) have to work with producer prices as the dependent variable and soforce the tax shifting parameter to be homogenous across observations. We test andsubsequently (partially) relax the assumption of homogeneity of the parameters �1, �2 and �across countries.10 Wald tests are used. Given Wald tests of restrictions which are non-linear in parameters arenot invariant to (mathematically equivalent) reformulations, we also tested for non-equivalence of the tax effects through a restriction on the difference between the coefficients.However, no inconsistencies were discovered and we present the test results for theformulation given in the text.11 For two years we do not have data specific to January 1. For 1982 we use May 1 data andfor 1995, July 1. This is unlikely to be a significant problem given there is little intra-yearvariation in the tax and price series. For the period 1982-90, we have quarterly data. Estimatesobtained from annual and quarterly data showed little difference.

13
The price data are for 1000 cigarettes in the most popular price category (MPPC). Obviously
the MPPC will vary across countries and, potentially, also across time. Variation across
countries can be dealt with by specifying country effects within the error term. Variation
across time is more difficult to accommodate since this time effect would not be common
across countries. An estimation problem would arise if switches in the MPPC were correlated
with tax changes. Various sources have been checked to identify any changes in the MPPC
over the sample period. There are two cases of large jumps in the price of the MPPC which
appear, at least in part, to arise from a switch of the leading brand - France 1988-89 and
Greece 1993-94. In the former case, the problem has been dealt with by specifying different
group effects for the periods 1982-88 and 1989-97. In the case of Greece, there are insufficient
data points after the switch to allow a separate group effect for this period and so the Greek
series has been truncated at 1993.
The specific tax is the monetary amount levied on 1000 cigarettes and the ad valorem rate is
the sum of the ad valorem excise duty and VAT expressed as a percentage of the tax inclusive
retail price. Sources for all of the data are given in the Appendix.
As a control for cost variation, we include labour costs per worker in the manufacturing sector
of the tobacco industry.12,13 As with all of the control (Z) variables, the data are for the year
12 For France and Luxembourg data specific to the tobacco industry were not available.Labour costs per worker across the whole of manufacturing industry were used instead. Theappropriate data is absent for Ireland before 1985. For this period, data specific to food,tobacco and alcohol manufacturing are used. For many of the countries, labour cost data werenot available for 1996. We used a forecast based upon an assumption of no real change in

14
preceding the January 1 date to which the price and tax data refer. GDP per capita is included
as a determinant of the level and price elasticity of demand. With the exception of GDP per
capita, which is denominated in purchasing power standards, all monetary variables are
converted to ECUs. The ECU exchange rate is included, as an additional control, to avoid
spurious correlation arising from depreciation or appreciation of a currency. All monetary
denominated variables were deflated to 1985 prices using country specific consumer price
indices.
According to theory, market structure is an important determinant of price. A lack of data
makes it difficult to control explicitly for market structure. However, this is not a major
limitation since, as described above, there is relatively little variation in the structure of the
cigarette industry across countries and time. Any variation in market structure which does
exist in the sample is dealt with through appropriate specification of the error term i.e.
allowing country and time effects.
5. Estimation and results
OLS estimates of equation (4.2) are given in the first column of Table 1. All the coefficients
take the anticipated sign and are significant. But these estimates must be treated with caution
given the potential for heterogeneity bias. The next two columns give estimates from the two
labour costs per worker between 1995 and 1996.13 Unit labour costs in tobacco manufacturing were used as an alternative cost control butlabour costs per worker were found superior with respect to significance and diagnostic tests.As a control for capital costs, real long term interest rates were included initially but werefound not to be significant and could be excluded without affecting the remaining coefficients.

15
way error components model estimated by the within groups (WG) and feasible GLS (FGLS)
methods respectively.14 A priori, the fixed effects specification, which motivates the WG
estimator, might be expected to be preferable since, as argued in section 3, unobservable
country specific factors which influence cigarette prices may also be correlated with cigarette
taxes. Hausman (1978) tests do indeed reject exogeneity of the country effects at the 10%
level and of both country and time effects jointly at the 5% level.
The modified Durbin Watson statistic (Bhargava et al, 1982), calculated from the WG
residuals, indicates a problem of autocorrelation. Fixed and random effects estimates obtained
from Cochrane-Orcutt transformed data, denoted by WG-AR(1) and FGLS-AR(1)
respectively, are given in columns 4 and 5 of Table 1. The time effects lose significance and
have been suppressed. Purging the first-order autoregression results in a substantial increase in
the magnitude of the coefficients on the tax variables.
While the within groups method allows for correlation between country fixed effects and the
regressors,15 there remains the potential for misspecification through the tax variables being
causally dependent on prices. Such dependence might arise from the EU rules on the level and
structure of cigarette taxation described in section 3. Countries at, or close to, the lower limit
on total taxes as a percentage of the retail price (70%) must raise taxes in response to a price
increase. Further, being close to the lower (5%) or upper (55%) threshold for the specific tax
14 Given the nature of the data set, the time-series cross-section (TSCS) FGLS method, a laKmenta (1986, pp. 616-625), is an alternative to the error component model employed. Beckand Katz (1995) report Monte Carlo evidence showing the TSCS method gives standard errorswhich are seriously downward biased and there is little improvement in efficiency over OLSunless the number of time periods exceeds the numbers of individual units by a factor muchgreater than three. Baltagi (1986) also provides some support for the error component modelover the TSCS method.

16
as a proportion of total taxes will require a shift in the balance of taxation following certain
price movements. However, a Hausman test, based on comparison between WG and two-
stage within groups (WG-2SLS) estimates in which the tax variables are instrumented,
indicates that the null of exogeneity cannot be rejected (see bottom of column 4, Table 1).16,17
Given one might expect delays in the adjustment of prices to changes in tax rates, costs and
demand conditions, the static models considered so far may be misspecified. A lagged
dependent variable can be included among the regressors to capture a partial adjustment
mechanism (Greene, 1993, pp. 798-9). However, with such a dynamic specification, the
within groups and random effects estimators are biased and consistency depends on the
number of time periods (T) being large (Baltagi, 1996, p.126). Nickell (1981) shows the bias
of the within groups estimator is of O(1/T). Since T = 16 (12 in some cases) in this
application, the bias is relatively small. Further, there is evidence, based on Monte Carlos and
forecasting performance, that the inconsistent fixed and random effects estimators for
dynamic panel data models perform well relative to consistent (for N � � ) IV estimators
(Kiviet, 1995; Harris and Matyas, 1996; Baltagi and Griffin, 1997). These findings are likely
to be particularly true for applications, such as this, with relatively small N and large T. We
therefore restrict our estimation of the dynamic model to the WG and FGLS methods.
15 The null of zero correlation is not rejected for the estimates purged of autocorrelation.16 Given cigarette taxes are set with some regard to the state of the macroeconomy, thefollowing were selected as instruments: real growth rates of private consumption and GDP,the general government deficit/surplus as a percentage of GDP and the unemployment rate.See Appendix for descriptions and sources. A Sargan test could not reject the null of thesebeing a valid set of instruments at the 5% level.17 Since the WG-2SLS estimator is simply 2SLS with a set of dummies for the individualeffects (Baltagi, 1996, pp. 109-113), autocorrelation can be dealt with in the standard way for2SLS (Greene, 1993, pp.748-9).

17
WG and FGLS estimates of the dynamic model are presented in columns 6 and 7 of Table 1.
Time effects are again insignificant and have been suppressed. Exogeneity of the country
effects is rejected, which suggests the WG estimates are superior. As would be expected,
inclusion of the lagged dependent variable greatly reduces the problem of autocorrelation.
However, from the 5% critical values presented in Bhargava et al (1982), the modified
Durbin-Watson statistic appears to be less than the lower bound, indicating some serial
correlation remains in the WG estimates. Purging this serial correlation will not necessarily
improve efficiency since yet another observation will be lost from each group, given the
Cochrane-Orcutt transformation must be used with the WG estimator. We found that
performing the transformation resulted in a substantial deterioration in the Reset statistic and
therefore prefer the estimates obtained from the untransformed data. Again, the exogeneity of
the taxes could not be rejected.
The lagged dependent variable is significant (1%) and, from the WG estimate, suggests an
average lag length of 1.43 years. Consequently, there are large differences between the short
and long run estimates of the tax effects. The long run responses are quite close, particularly
for the ad valorem tax, to those obtained from the static model with correction for first order
autoregression.
The estimates discussed so far were generated under the assumption of parameter
homogeneity across all countries. Chow tests reject this restriction.18 The appropriate response
requires consideration of a trade-off between bias and efficiency. Baltagi and Griffin (1997)
compare the forecast performance of pooled homogeneous parameter models with
18 The F-test statistics for the restriction imposed on the WG estimates of the static and

18
heterogeneous alternatives in the context of a dynamic model. For forecasts any longer than
one year, the fixed and random effects estimators outperform their heterogeneous parameter
counterparts. These results were obtained for a time series roughly double the length of the
present one. Consequently, in this application, it is unlikely that any gains from reduced bias
through allowing full parameter heterogeneity could compensate for the loss of efficiency.
While efficiency concerns rule out allowing full parameter heterogeneity across countries,
there may be gains from allowing partial heterogeneity. Given the large differences in the
level and structure of taxation between the northern and southern countries, one might expect
them to experience different tax-price relationships. Tests consistently rejected imposition of
parameter homogeneity across the northern and southern groups.19 Judging that efficiency
losses from splitting the sample in two might not outweigh gains from relaxing the
misspecification of parameter homogeneity, we present estimates from the two sub-samples in
Table 2.
Hausman tests show a preference for the WG estimator over FGLS for the ‘north’ and the
opposite for the ‘south’. Autocorrelation was always present in the static models and we
present results for estimates purged of first order autoregression. Tests do not reject the null of
both taxes being exogenous.
Comparing the estimates of the static models, the tax coefficients for the southern countries
are consistently greater than those for the northern group, particularly with respect to the
dynamic models respectively are 25.787 (p=0.0000) and 23.976 (p=0.0000).19 Wald tests, robust to inequality between error variances, were conducted for all estimationmethods (Ohtani and Kobayashi, 1986). In addition, F-tests were carried out on the within

19
specific tax. The appropriateness of the dynamic specification differs across the two groups.
The lagged price term is small and insignificant for the north but large and significant for the
south. Apparently, cigarette prices are more flexible in northern than southern Europe. Given
the presence of state monopolies in some of the southern countries, this result is consistent
with theories predicting negative correlation between market concentration and price
flexibility (c.f. Means, 1972). For the ad valorem tax, while the short run price effect is much
smaller in the south, once the difference in lag length is allowed for, the long run effects are
similar across the two camps. The specific tax has a much greater short and long run effect in
the south than in the north.
For the south, the modified Durbin-Watson statistic indicates the presence of autocorrelation
in the dynamic estimates. Purging first order autoregression using Cochrane-Orcutt does not
result in the deterioration of the Reset test statistic which occurred when this procedure was
applied to the dynamic model estimated on the full sample. We therefore present the FGLS
serial correlation corrected results for the south. Purging first order autoregression leads to a
fall in the average lag length which results in a decrease in the long run effect of the specific
tax. Otherwise the estimates are quite robust to this transformation.
In Table 3 we present estimates of the tax shifting parameters and test statistics for the null of
equivalence between the price effects of specific and ad valorem taxation. Estimates are
presented for the whole sample and the two sub-samples, using the specifications indicated by
the diagnostics to be most appropriate in each case. The estimates are calculated at the
respective sample means. First, consider the estimates obtained under the restriction of
groups estimates.

20
parameter homogeneity across the whole sample. In the static model, the tax shifting
parameters are less than, but close to, one. The specific parameter is significantly less than one
at the 5% level, while the undershifting of the ad valorem tax is only significant at the 10%
level. The estimates should be interpreted as indicating that a unit increase in the specific tax
results in an increase in the price paid by consumers of 0.9, while a unit increase in tax
generated by a change in the ad valorem rate raises the consumer price by 0.84. The greater
impact of the specific tax on the consumer price is consistent with the theory considered in
section 2. However, the difference is not statistically significant.20
Turning to the dynamic specification, we find significant undershifting of both taxes in the
short run. In the long run, the shifting parameters are less than and greater than one for the ad
valorem and specific taxes respectively, but neither is significantly different from one,
suggesting that full shifting cannot be rejected in either case. The impact of the specific tax on
price is again greater than that of the ad valorem and the difference is significant at the 10%
level.
Splitting the sample between the northern and southern countries leads to very different
estimates of tax incidence. For the northern group, we consider estimates of the shifting
parameters derived from the static model only, since the dynamic specification did not appear
appropriate in this case. There is evidence of significant undershifting of the ad valorem tax.
A unit increase in tax levied through an increase in the ad valorem rate, generates a 0.65 rise
in the consumer price. In the north, the incidence of the ad valorem taxes levied on cigarettes
is split between consumers and producers, with the former incurring the greater burden. On
20 The same pattern of results is obtained for shifting parameters calculated from the WG-AR1
21
the other hand, the estimate of the shifting parameter for the specific tax is greater than one,
but not significantly so. The price effects of the taxes are significantly different (5%). There is
undershifting of the ad valorem tax and full shifting of the specific tax.21 This finding is
consistent with producers lobbying governments to maintain reliance on specific taxes in these
countries.
The effects of the two taxes are quite different for the countries relying predominantly on ad
valorem taxation - the south. Using the estimates from the static specification, both shifting
parameters are greater than one, but only that for the specific tax is significantly so. The
estimate suggests overshifting of the specific tax to the extent that a unit increase in the tax
results in a 1.66 increase in the consumer price. Turning to results generated from the dynamic
specification, there is significant undershifting of the ad valorem tax in the short run but full
shifting in the long run. For the specific tax, one cannot reject full shifting in the short run, but
in the long run there appears to be a great deal of overshifting - a unit increase in the tax raises
the price paid by consumers by 3. There is a substantial and significant difference between the
taxes in terms of their impact on price.
6. Conclusions
Under the restriction that the response of consumer prices to specific and ad valorem taxation
is the same throughout the EU, there is little evidence from our results against full shifting of
both taxes. However, once this restriction is relaxed, as the data suggest it should be, the
estimates show that among countries which rely more heavily on specific taxation (north),
there is undershifting of ad valorem and full shifting of specific taxes. In the countries where
there is greater reliance on ad valorem taxation (south), the estimates show full shifting of the
estimates.

22
ad valorem and overshifting of the specific. In both cases, the specific tax has a significantly
greater effect on price than the ad valorem.
These results support the theoretical predictions from Delipalla and Keen (1992) that
under/overshifting is possible and that the specific tax always has a bigger impact on price.
According to their imperfect competition model, whether a tax is under- or overshifted
depends on factors related to the gradients of the demand and cost functions; the extent of
shifting depends upon the number of firms and their conjectures. Differences between the
northern and southern countries with respect to these factors may explain why the tax effects
are not the same. Cost and demand characteristics differ - the south produces its own tobacco
and attitudes toward smoking make demand less elastic. The degree of concentration (number
of firms) also differs - state monopolies existed in some southern countries during our sample
period.
As discussed in section 2, different price effects of specific and ad valorem taxes might be
attributed to quality adjustment. For our estimates to be consistent with the quality model
(Kay and Keen, 1991), the marginal willingness to pay for quality must be independent of
price in the north and unit elastic in the south. Therefore, the quality model is supported by the
results only in so far as this set of parameter values is plausible.
We have little reason to suspect our results are reflecting a cross-border shopping effect; there
is only one case of undershifting - ad valorem taxation in the north.
21 The results are very similar using the estimates from the dynamic specification.

23
The implications of these results go beyond the testing of theory. Estimates of the
distributional effects of taxation are typically generated under the assumption that commodity
taxes are fully shifted. Our estimates show that this assumption will not always have empirical
validity.
Under the assumption of full shifting, cigarette taxation has been found to be regressive.
Given the finding on overshifting of the specific tax in the south, concerns, if any, over such
regressivity should be intensified. On the other hand, cigarette taxes might not be as regressive
as is thought in the north, given that there is evidence for undershifting of the ad valorem tax.
In both cases, the empirical findings suggest a more careful analysis of the tax incidence. A
similar warning applies to analysts of cigarette taxation as an instrument of health policy.
Finally, the empirical findings are very interesting with reference to the EU tax harmonisation
debate. Northern countries lobby for specific taxation, which happens to be the tax which
bears the greatest relative burden on the consumer; southern countries lobby for ad valorem
taxation, which bears a lower relative burden on the consumer. This might suggest different
distributional objectives by the “northern” and “southern” governments. It helps to remind
ourselves of the strong presence of the multinationals’ and health lobbies in the north and the
existence of state monopolies for manufacturing and distribution in the south. If what the
northern governments want is high prices, to satisfy the health lobby, and high profits, to
please the multinationals, specific taxation is the preferred one. But, as long as southern
governments have different objectives, the harmonisation debate is not going to be resolved.
24
APPENDIX - DATA SOURCES
The price and tax data are taken from the Summary of Tax Structures on Cigarettes in E.C.
Member States obtained from the European Commission (D.G. XXI) Excise Duty Tables and
the Confederation of European Community Cigarette Manufacturers.
Total labour costs and employment in the tobacco (manufacturing) industry were supplied by
Eurostat from their DEBA database.
GDP at market prices in current prices and current Purchasing Power Standards per capita
were obtained from various Eurostat sources (1982-84 - Eurostat National Accounts ESA:
aggregates 1970-91, 1985-94 - Eurostat Yearbook 1996, 1995-97 - Eurostat NEWCRONOS
Database). The series was converted to 1985 prices using the Consumer Price Index (CPI).
National CPIs were obtained from Eurostat’s NEWCRONOS database. Price and specific tax
data were deflated using the CPI specific to January each year. Other variables were deflated
using the CPI for the appropriate year. In 1997 Eurostat changed from using National CPIs to
its new Harmonised Indices of Consumer Prices (still country specific but calculated using a
common methodology). Price and tax data for January 1 1997 were deflated using this new
CPI series.
ECU exchange rates were obtained from Eurostat’s NEWCRONOS database.

25
REFERENCES
Anderson, S.P., A. de Palma and B. Kreider, 1997, Tax incidence in differentiated productoligopoly, mimeo, University of Virginia.
Ashenfelter, O. and D. Sullivan, 1987, Nonparametric tests of market structure: Anapplication to the cigarette industry, The Journal of Industrial Economics 35, 4, 483-498.
Baker, P. and V. Brechling, 1992, The impact of excise duty changes on retail prices in theUK, Fiscal Studies 13, 2, 48-65.
Baltagi, B.H., 1986, Pooling under misspecification: Some Monte Carlo evidence on theKmenta and the error components techniques, Econometric Theory 2, 429-40.
Baltagi, B.H., 1996, Econometric Analysis of Panel Data, Wiley, Chichester.
Baltagi, B.H. and J.M. Griffin, 1997, Pooled estimators vs. their heterogeneous counterpartsin the context of dynamic demand for gasoline, Journal of Econometrics 77, 303-327.
Baltagi, B.H. and D. Levin, 1986, Estimating dynamic demand for cigarettes using panel data:The effects of bootlegging, taxation and advertising reconsidered, The Review ofEconomics and Statistics 68, 148-155.
Barnett, P.G., T.E. Keeler and T-W Hu, 1995, Oligopoly structure and the incidence ofcigarette excise taxes, Journal of Public Economics 57, 457-470.
Barzel, Y., 1976, An alternative approach to the analysis of taxation, Journal of PoliticalEconomy 84, 6, 1177-97.
Beck, N. and J.N. Katz, 1995, What to do (and what not to do) with time-series cross-sectiondata, American Political Science Review 89, 3, 634-647.
Besley, T.J. and H.S. Rosen, 1994, Sales taxes and prices: An empirical analysis, mimeo,Princeton University.
Bhargava, A., L. Franzini and W. Narendranathan, 1982, Serial correlation and the fixedeffects model, Review of Economic Studies 49, 533-549.
Bohanon, C.E. and T.N. van Cott, 1984, Specific taxes, product quality and rate-revenueanalysis, Public Finance Quarterly 12, 500-511.
Bohanon, C.E. and T.N. van Cott, 1991, Product quality and taxation: A reconciliation, PublicFinance Quarterly 19, 233-237.
Breusch, T.S. and A.R. Pagan, 1979, A simple test for heteroskedasticity and randomcoefficient variation, Econometrica 47, 1287-94.
Bulow, J.I. and P. Pfleiderer, 1983, A note on the effect of cost changes on prices, Journal ofPolitical Economy 91, 1, 182-185.

26
Chaloupka, F.G. and H. Wechsler, 1997, Price, tobacco control policies and smoking amongyoung adults, Journal of Health Economics, 16, 3, 359-373.
Cnossen, S., 1992, Intrigues around the tobacco excise in the European Community,International Tax Review 2, 127-137.
Coats, R.M., 1995, A note on estimating cross-border effects of state cigarette taxes, NationalTax Journal, XLVIII, 4, 573-584.
Commission of the European Communities, 1989, Amended proposals for a council directiveon the approximation of taxes on cigarettes, Brussels.
Cremer, H. and J-F Thisse, 1994, Commodity taxation in a differentiated oligopoly,International Economic Review 35, 613-633.
Davidson, J. and R. McKinnon, 1981, Several tests for model specification in the presence ofalternative hypothesis, Econometrica 49, 781-793.
Delipalla, S. and M.J. Keen, 1992, The comparison between ad valorem and specific taxationunder imperfect competition, Journal of Public Economics 49, 351-167.
European Bureau for Action on Smoking Prevention, 1992, Taxes on tobacco products - Ahealth issue, Brussels.
Eurostat, 1997, Panorama of the EU Industry, vol.1, EC DXIII, Luxembourg.
Greene, W.H., 1993, Econometric Analysis, Prentice Hall, New Jersey.
Harris, J.E., 1987, The 1983 increase in the federal cigarette excise tax, Tax Policy and theEconomy 1, 87-111.
Harris, M.N. and L. Matyas, 1996, A comparative analysis of different estimators for dynamicpanel data models, mimeo, Department of Economics, Monash University.
Hausman, J.A., 1978, Specification tests in econometrics, Econometrica 46, 1251-71.
Johnson, T.R., 1978, Additional evidence on the effects of alternative taxes on cigaretteprices, Journal of Political Economy 86, 2, 325-328.
Kay, J.A. and M.J. Keen, 1983, How should commodities be taxed?, European EconomicReview 23, 339-358.
Kay, J.A. and M.J. Keen, 1987a, Commodity taxation for maximum revenue, Public FinanceQuarterly 15, 371-385.
Kay, J.A. and M.J. Keen, 1987b, Alcohol and tobacco excises: Criteria for harmonisation, in SCnossen, eds., Tax coordination in the European Community (Kluwer Law andTaxation, Deventer).
Kay, J.A. and M.J. Keen, 1991, Product quality under specific and ad valorem taxation, PublicFinance Quarterly 19, 238-247.

27
Keen, M.J., 1998, Specific versus ad valorem taxation, Fiscal Studies, forthcoming.
Kiviet, J.F., 1995, On bias, inconsistency and the efficiency of some estimators in dynamicpanel data models, Journal of Econometrics 68, 53-78.
Kmenta, J., 1986, Elements of Econometrics, 2nd Edition, New York, Macmillan.
Means, G.C., 1972, The administered-price theories reconfirmed, American Economic Review62, 292-306.
Myles, G., 1996, Imperfect competition and the optimal combination of ad valorem andspecific taxation, International Tax and Public Finance 3, 29-44.
Nickell, S., 1981, Bias in dynamic models with fixed effects, Econometrica 49, 1417-1426.
Ohtani, O. and M. Kobayashi, 1986, A bounds test for equality between sets of coefficients intwo linear regression models under heteroscedasticity, Econometric Theory 2, 220-230.
Poterba, J.M., 1996, Retail price reactions to changes in state and local sales taxes, NationalTax Journal 39, 165-176.
Seade, J., 1985, Profitable cost increases and the shifting of taxation: Equilibrium responsesof markets in oligopoly, University of Warwick Discussion Paper no. 260.
Skeath, S. E. and G. E. Trandel, 1994, A Pareto comparison of ad valorem and specifictaxation in noncompetitive environments, Journal of Public Economics 53, 53-71.
Stern, N.H., 1987, The Effects of taxation, price control and government contracts inoligopoly and monopolistic competition, Journal of Public Economics 32. 133-158.
Suits, D.A. and R.A. Musgrave, 1955, Ad valorem and unit taxes compared, QuarterlyJournal of Economics 67, 598-604.
Sullivan, D., 1985, Testing hypothesis about firm behaviour in the cigarette industry, Journalof Political Economy 93, 3, 586-598.
Sumner, D.A., 1981, Measurement of monopoly behaviour: An application to the cigaretteindustry, Journal of Political Economy 89, 6, 1010-1019.
Sumner, M.T. and R. Ward, 1981, Tax changes and cigarette prices, Journal of PoliticalEconomy 89, 6, 1262-1265.

TABLE 1: ESTIMATES OF CIGARETTE PRICE EQUATION - ALL COUNTRIES
Dependent Variable: Price per 1000 Cigarettes
ESTIMATION METHODSTATIC DYNAMIC
VARIABLE OLS WG FGLS WG-AR(1) FGLS-AR(1) WG-LDV FGLS-LDVAd Valorem Tax
- Long Run
Specific Tax
- Long Run
Labour Cost per Worker
GDP per capita
ECU Exchange Rate
Constant
Lagged Price
90.913(6.256)
1.9256(34.329)
1.1596(5.828)1.1568(3.987)0.0039(3.472)-52.201(-5.336)
46.737(3.760)
1.0495(7.496)
0.7235(3.063)1.9822(6.003)-0.0051(-1.075)-9.4995(-0.832)
51.526(5.221)
1.3126(11.037)
0.6044(3.161)1.8107(5.582)-0.0061(-1.392)-13.850(-1.709)
135.67(9.074)
1.9043(18.352)
0.6807(4.562)0.9652(2.348)-0.0103(-3.934)
131.86(9.704)
1.9284(19.367)
0.7103(4.043)1.1230(2.725)-0.0087(-1.676)-64.292(-5.666)
56.753(5.599)137.66(5.359)0.9983(7.311)2.4214(3.820)0.0656(0.404)0.7898(3.551)-0.0042(-2.150)
0.5877(7.695)
49.196(6.305)142.59(7.840)0.8063(9.207)2.3369(5.529)0.2228(1.714)0.5677(2.330)-0.0010(-0485)-27.283(-5.062)0.6550
(14.987)Adjusted R2 0.9251 0.9817 0.8599 0.9215 0.8160 0.9895 0.9775RESET [~F(3,N-3)] 21.872 [0.0000] 1.5250 [0.2106] 2.1794 [0.0929] 3.5840 [0.0154]AUTOCORRELATION:Durbin-WatsonCorrelation coefficient (�)
0.38940.8053
0.43330.6069 0.5707 -0.0269 -0.0018
1.41760.1611 0.0540
HOMOSKEDASTICITY:Breusch-Pagan [~�2(k+m+T)]Bartlett [~�2(m-1)]
79.41 [0.0000]87.56 [0.0000]
130.47 [0.0000]52.85 [0.0000]
79.73 [0.0000]35.58 [0.0004]
65.15 [0.0000]42.80 [0.0000]
SIGNIFICANCE OF:Country Effects [~F(m-1,N-k-m+1)]Time Effects [~F(T-1,N-k-m-T+1)]
38.867 [0.0000]2.487 [0.0027]
13.614 [0.0000]1.459 [0.1351]
8.523 [0.0000]1.396 [0.1634]
EXOGENEITY:Country Effects [~�2(k)]Country & Time Effects [~�2(k)]Ad Valorem & Specific Taxes [~F(2,N-k)]
9.36 [0.0954]19.36 [0.0016]
1.5732 [0.2108]
5.80 [0.3257]
1.4403 [0.2402]
26.46 [0.0002]

TABLE 2: ESTIMATES OF CIGARETTE PRICE EQUATION - ‘NORTHERN’ AND ‘SOUTHERN’ COUNTRIES
Dependent Variable: Price per 1000 Cigarettes
NORTH SOUTHSTATIC DYNAMIC STATIC DYNAMIC
VARIABLE WG-AR(1) WG WG-AR(1) FGLS-AR(1) WG FGLS FGLS-AR(1)Ad Valorem Tax
- Long Run
Specific Tax
- Long Run
Labour Cost per Worker
GDP per capita
ECU Exchange Rate
Constant
Lagged Price
113.08(12.824)
1.684(24.764)
0.2412(2.220)0.6080(2.630)-15.389(-9.338)
109.90(14.406)112.72
(23.076)1.678
(25.015)1.721
(14.725)0.2005(2.138)0.5387(2.608)-15.504
(-11.758)
0.0250(0.596)
157.24(5.615)
4.745(5.489)
0.6625(2.409)0.6378(1.348)-0.0104(-3.207)
157.57(6.075)
4.800(6.221)
0.6645(2.231)0.7791(1.337)-0.0088(-1.613)-88.424(-4.244)
29.816(4.797)117.63(3.331)2.591
(4.315)10.222(3.060)-0.2900(-1.202)0.6288(2.324)-0.0048(-2.160)
0.7465(9.894)
29.514(3.471)138.61(3.387)2.164
(3.683)10.163(3.106)-0.1895(-0.750)0.5546(1.890)-0.0025(-1.020)-15.062(-2.347)0.7871
(12.611)
36.803(2.984)139.38(3.704)2.324
(3.593)8.800(3.35)
-0.0809(-0.282)0.5303(1.535)-0.0023(-0.831)-16.664(-2.185)0.7359
(10.398)Adjusted R2 0.9910 0.9940 0.8792 0.6216 0.9839 0.9639 0.9593RESET [~F(3,N-3)] 0.4282 [0.7335] 1.9327 [0.1335] 4.0008 [0.0106] 2.9793 [0.0367]AUTOCORRELATION:Durbin-WatsonCorrelation coefficient (�) -0.0915
1.72120.0524 -0.0330 -0.0388
1.53110.1506 0.1159 -0.0793
HOMOSKEDASTICITY:Breusch-Pagan [~�2(k+m)]Bartlett [~�2(m-1)]
21.78 [0.0096]8.91 [0.0616]
25.78 [0.0041]9.61 [0.0476]
39.02 [0.0001]18.62 [0.0095]
45.55 [0.0000]20.32 [0.0049]
SIGNIFICANCE OF:Country Effects [~F(m-1,N-m-k+1)] 32.851 [0.0000] 31.201 [0.0000] 14.418 [0.0000] 5.891 [0.0000]EXOGENEITY:Country Effects [~�2(k)]Ad Valorem & Specific Taxes [~F(2,N-k)]
53.81 [0.0000]1.4304 [0.2468]
70.79 [0.0000]1.5009 [0.2308] 1.9311 [0.1519]
3.28 [0.6570]0.8385 [0.4362]
5.02 [0.5412] 6.52 [0.3677]

Notes to Table 1 and Table 2:1. N - sample size; k - number of regressors; m - number of country groups; T - number of
time periods.2. Figures in parentheses below coefficients are White corrected t-ratios. Those for FGLS not
White corrected.3. Figures in brackets beside diagnostics are p-values.4. For the WG estimates, Durbin-Watson is that of Bhargava et al (1982).5. Breusch-Pagan (1979) and Bartlett (Kmenta, 1986, 297-98) are tests for homoskedasticity
against the alternatives of observation and group specific variances respectively.
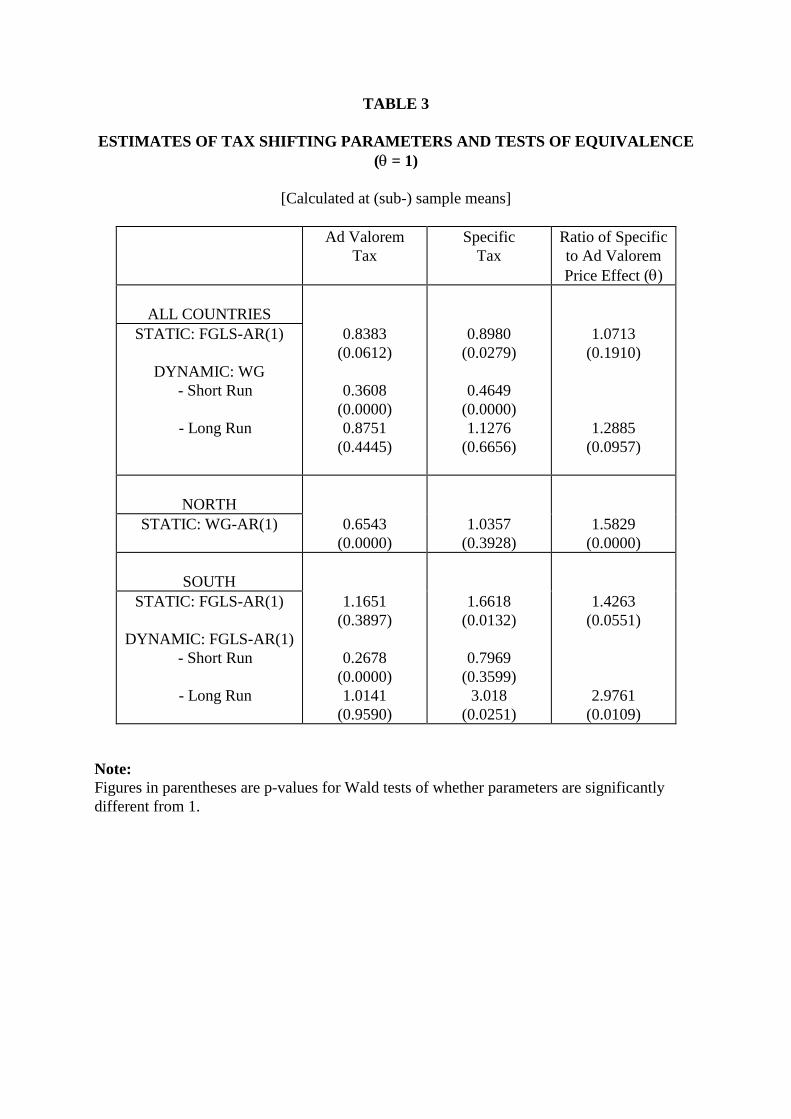
TABLE 3
ESTIMATES OF TAX SHIFTING PARAMETERS AND TESTS OF EQUIVALENCE(� = 1)
[Calculated at (sub-) sample means]
Ad ValoremTax
SpecificTax
Ratio of Specificto Ad ValoremPrice Effect (�)
ALL COUNTRIESSTATIC: FGLS-AR(1)
DYNAMIC: WG - Short Run
- Long Run
0.8383(0.0612)
0.3608(0.0000)0.8751
(0.4445)
0.8980(0.0279)
0.4649(0.0000)1.1276
(0.6656)
1.0713(0.1910)
1.2885(0.0957)
NORTHSTATIC: WG-AR(1) 0.6543
(0.0000)1.0357
(0.3928)1.5829
(0.0000)
SOUTHSTATIC: FGLS-AR(1)
DYNAMIC: FGLS-AR(1) - Short Run
- Long Run
1.1651(0.3897)
0.2678(0.0000)1.0141
(0.9590)
1.6618(0.0132)
0.7969(0.3599)
3.018(0.0251)
1.4263(0.0551)
2.9761(0.0109)
Note:Figures in parentheses are p-values for Wald tests of whether parameters are significantlydifferent from 1.