The Company Announcements Platform Australian Securities ... · Mobile: 0412 259 158 _____ This...
113
29 th September 2010 The Company Announcements Platform Australian Securities Exchange Austbrokers Annual Report 2010 Please find attached the Austbrokers Annual Report 2010 including the Financial Report for the year ended 30 th June 2010. Yours sincerely, S.S. Rouvray Company Secretary Austbrokers Holdings Limited For further information, contact Steve Rouvray Tel: (02) 9935 2201 Mobile: 0412 259 158 ______________________________________________________________________________________________________________ This announcement may contain forward looking statements relating to future matters, which are subject to known and unknown risks, uncertainties and other important factors which could cause the actual results, performance or achievements of Austbrokers and the Austbrokers Group to be materially different from those expressed in this announcement. Except as required by law and only to the extent so required, neither Austbrokers nor any other person warrants that these forward looking statements relating to future matters will occur. For personal use only
Transcript of The Company Announcements Platform Australian Securities ... · Mobile: 0412 259 158 _____ This...

29
th September 2010
The Company Announcements Platform
Australian Securities Exchange
Austbrokers Annual Report 2010
Please find attached the Austbrokers Annual Report 2010 including the Financial Report for the year
ended 30th June 2010.
Yours sincerely,
S.S. Rouvray
Company Secretary Austbrokers Holdings Limited
For further information, contact Steve Rouvray Tel: (02) 9935 2201
Mobile: 0412 259 158
______________________________________________________________________________________________________________
This announcement may contain forward looking statements relating to future matters, which are subject to known and unknown risks,
uncertainties and other important factors which could cause the actual results, performance or achievements of Austbrokers and the
Austbrokers Group to be materially different from those expressed in this announcement. Except as required by law and only to the extent so
required, neither Austbrokers nor any other person warrants that these forward looking statements relating to future matters will occur.
For
per
sona
l use
onl
y

austb
rokers an
nu
al repo
rt 2010
annual report 2010
For
per
sona
l use
onl
y

Austbrokers is a leading network of insurance broking firms focused on servicing more than 200,000 clients across Australia, with a particular focus on small to medium sized businesses. The Austbrokers equity partnership business model allows member firms to benefit from the strength and scale of a national company, while still retaining the personalised service, specialisation and local knowledge that the brokers foster. Austbrokers also offers underwriting agency services to brokers through its Austagencies subsidiary, and is continually developing and expanding the company’s presence in other financial services sectors such as life insurance and superannuation.
statement of purpose
Leonard Francis Earl14.10.1946 – 12.7.2010
In memory of
Frank Earl served as a Director of Austbrokers from April 2005 and made a substantial contribution to the company through its initial
public offering and to its success over the subsequent five years. Frank was highly respected across the industry for his knowledge of and
experience in insurance broking, both in Australia and overseas.
Frank will be sorely missed as a colleague, friend and mentor by all at Austbrokers particularly his good humour and the positive and
open manner in which he approached business and life in general.
For
per
sona
l use
onl
y

Vision and mission 3 Highlights 4Chairman’s letter 5Managing director’s report 6Chief financial officer’s report 8Insurance Broking Operations 10Broking firm presence 12Operational report – Austagencies 32Operational report – Austbrokers Business Centre 34Operational report – A & I Member Services 36Operational report – Austbrokers Group services and support 38Board of directors 40Financial report 42 Directors’ report 44Auditor’s independence declaration 53Corporate governance statement 54Income statement 56Statement of comprehensive income 57Statement of financial position 58Statement of cash flows 59Statement of changes in equity 60Notes to the financial statements 62Directors’ declaration 103Independent auditor’s report 104ASX additional information 105AGM reminder information 106Corporate directory 107
contents
For
per
sona
l use
onl
y

national strength linked with individual commitment
For
per
sona
l use
onl
y

Austbrokers’ mission is to create a leading national insurance broking and
financial services network, providing members of that network with all the
back-office and marketing support they require to allow them to focus on more important things like customer service,
innovation and growth. In doing so, Austbrokers is building a unique
network of independently operated businesses with every member of
that network committed to meeting each client’s needs. By partnering
with business operators all over the country, Austbrokers delivers value to
customers, shareholders, employees and the proprietors themselves.
vision & mission
3F
or p
erso
nal u
se o
nly

highlights
4 12.1% increase in adjusted net profit after tax (adjusted npat) to $20.2 million for the year ended 30 june 2010 full year fully franked dividend of 22.5 cents per share shareholders who acquired shares at the time of listing on the ASX in 2005 have enjoyed a annualised total shareholder return of 39.7% targeted acquisition activity including the addition of a 50% interest in austral insurance brokers and tasman underwriting austagencies underwriting agency business continues to increase revenue
Net profit after tax (millions)
$15.7m 2008 $20.2m
2010
$18.0m 2009
Dividends per share (cents)
18.0¢ 2008
22.5¢ 2010
20.5¢ 2009
Earnings per share (cents)
35.3¢ 2010
28.6¢ 2008
31.7¢ 2009
For
per
sona
l use
onl
y

Richard LongesChairman
Dear Shareholder,
As we reach our fifth year as a company listed on the Australian Stock Exchange, I am pleased to report on behalf of the Board that Austbrokers has achieved another strong financial performance. The result can be attributed to an ongoing focus on strategic growth from the continued expansion and development of the brokerage network and underwriting agencies as well as acquisitions.
For the year ending 30 June 2010, we are delighted to present a 12.1% increase in net profit after tax before profits on sale of equity interests and amortisation (Adjusted NPAT) to $20.2 million. In line with this positive result, the Directors have declared a final franked dividend of 15 cents per share, payable in October. This, together with the interim dividend of 7.5 cents, is a full year dividend of 22.5 cents and represents a 9.8% per cent increase on last year’s dividend. Shareholders who acquired shares at the time of listing on the ASX in 2005 have enjoyed a annualised total shareholder return of 39.7%.
These solid results have been assisted by targeted acquisition activity including the addition of a 50% interest in Austral Insurance Brokers and Tasman Underwriting. In addition many of our existing members have made their own bolt-on acquisitions further expanding the brokerage network and increasing the member base. As acquisition activity in the broader market improves and as demographics in the industry force succession solutions, the attractiveness of Austbrokers owner driver model is expected to drive further bolt on growth opportunities for the business.
The Austagencies underwriting agency business continues to increase revenue by expanding its product range through the development of the new products and the reinvigoration of existing ones. For the full year, Austagencies profit contribution was up 21.7%.
Benefits continued to flow from the joint venture with IBNA, AIMS, that provides services to both networks across common areas in product development, terms and conditions as well as other services such as education and training.
The continuing promotion and development of our other joint venture with Pacific Premium Funding has also contributed significantly to developing the broking network’s offer to its clients as well as benefiting income.
I am happy to say that many of our major shareholders took the opportunity to reinvest their interim dividend in the Austbrokers business under our reinvestment plan this year. This represented 39.12% of shares on issue and shows significant confidence on behalf of investors.
It is with deep sadness and regret that we saw the passing of our friend and colleague Frank Earl just after the end of the financial year. Frank will be greatly missed by the Board and the whole Austbrokers family. Frank joined the Board prior to the initial public offering and must be acknowledged for the immense contribution he has made to Austbrokers and to the general insurance broking industry, where he has been prominently involved for over 40 years.
We have been conscious of the need to provide for succession for directors as they retire and were in the process of identifying and appointing an additional director later this year. We are continuing with this process and anticipate that an additional director will be appointed to the Board before the Annual General Meeting.
The Board would like to acknowledge the efforts of Austbrokers management and employees as well as the contribution of our partners in the brokerage network and their employees. It is because of their expertise and dedication that, despite a year that began with uncertain economic conditions, the company achieved substantial gains.
Austbrokers is also fortunate to have a highly skilled management team driving the business forward. I would like to take the opportunity to acknowledge the leadership of Austbrokers’ CEO Lachlan McKeough. The Board was pleased to announce the extension of his contract for an additional 2 years to November 2012, ensuring continuity of the leadership of the Austbrokers business.
We are confident that under his continued leadership and guidance, the management team will build upon Austbrokers’ position as Australia’s leading independent broker network.
chairman’s letter
austbrokers annual report 2010 5
For
per
sona
l use
onl
y

managing director’s report
6
For
per
sona
l use
onl
y

The growth experienced by our company is a remarkable achievement given the tough economic conditions experienced throughout much of the year. – Lachlan McKeough
austbrokers annual report 2010 7
2010 was another successful year for Austbrokers in which our positive full year results reflect the strength of our existing business strategy. The growth experienced by our company is a remarkable achievement given the tough economic conditions experienced throughout much of the year.
The increases in premium predicted by insurers have not emerged to any great extent and although increases were achieved these did not have a significant impact on results.
The depressed economy brought with it decreased opportunities for expansion via acquisitions as brokers deferred retirement decisions.
Despite these challenges, Austbrokers was able to improve its position as the leading independent insurance broking network in Australia and deliver growth to the business and strong returns to shareholders.
The solid performance and profit increase in what was an uncertain economic environment is a testament to the owner driver business model and its ability to retain focus on operating results and performance. The commitment of our partners in the broking network has ensured Austbrokers’ continued success and growth.
The AIMS joint venture between AHL and IBNA also saw considerable benefits flow through to Austbrokers shareholders. Throughout the year AIMS was responsible for the positioning of our products and negotiating and refreshing policies.
As a business we are committed to ensuring we have the right people steering the company to even greater success. We have strengthened the management team with a new appointment and a re-arrangement of responsibilities of the existing team.
Craig Patterson has joined as General Manager of Austagencies, bringing with him a wealth of insurance industry experience. Other changes were internal moves where we have transferred Glenn Lambert from General Manager Austbrokers Sydney to General Manager Operations & Strategic Development. Glenn will have overall responsibility for IT and a key early focus will be the development of software to improve broker workflows and improved interface between our brokers and key underwriters.
Jeff Howells transferred from AIMS to takeover Glenn’s role at Austbrokers Sydney, one of our larger broking operations. Martin McAvenna has transferred from Austagencies and taken over as General Manager of AIMS. Both Martin and Jeff have extensive insurance broking experience.
On a personal note, I was delighted to have my contract extended in November by the Board for a further two years. I look forward to leading Austbrokers into 2011 and beyond and have every confidence that we will continue to experience growth and success as we enter our sixth year as a listed company on the Australian Stock Exchange.F
or p
erso
nal u
se o
nly
chief financial officer’s report
8
For
per
sona
l use
onl
y

austbrokers annual report 2010 9
I am pleased to report to Shareholders that net profit after tax (NPAT) for the year ended 30 June 2010 was 18.2 million representing an increase of 14.4% compared to 2009 financial year. NPAT excluding profits realised on the sale of equity interests and amortisation of intangibles (Adjusted NPAT) (a measure which better reflects the performance of the underlying business) increased by 12.1% compared to the previous year. Earnings per share (EPS) of 34.2 cents represented an increase of 11% over the prior corresponding period (this increase was 9.2% based on Adjusted NPAT). This is the fifth year in succession since the company was listed on the Australian Securities Exchange in 2005 that it has delivered strong growth in NPAT and EPS for shareholders.
2010 2009 2008 2007% % % %
Growth in Earning Per Share* 9.2 14.5 18.4 15.1
Growth in NPAT* 12.1 14.7 18.5 15.3
* on an Adjusted NPAT basis
Operating ResultsRevenue for the year was $105.6 million, up 8.8% on 2009. While the year saw some hardening of rates across most commercial classes of insurance business, premium rate increases were limited and generally only moderate during the year. Nonetheless, as has traditionally been the case, the second half of the year was strong, with the June renewal season again contributing significantly to the 2010 result.
The network growth in base commission and fee income was around 5% (excluding acquisitions). Total commission and fee income increased by 6.6% and total income was up 6.4% over the prior period (excluding direct acquisitions). Premium funding income was up 11.2% due to ongoing successful development of the alliance with Pacific Premium Funding. Direct acquisitions made in the 2010 financial year contributed 3.1% to the growth in Adjusted NPAT. This contribution reflects the subdued acquisition activity in the second half of the year. Growth from the existing broker network, contributed 10.8% to profit growth reflecting bolt on acquisitions and business development initiatives undertaken by individual brokers.
Lower interest earnings in the broker network, largely in the first half of the year which was partially reversed in the second half, reduced growth in profit by around 2.3% from what it would otherwise have been. Expenses in the broker network increased by 6% (excluding direct acquisitions). This reflected some increase as a result of acquisitions within the network and direct expenses related to income growth, as well as some inflationary increase in costs.
Underwriting agency profits were up by 21.7% on 2009. Income increased by 8.8%, which increased to 15.5% with the Tasman Underwriting acquisition included.
Corporate expenses held to a 4.5% increase over the prior year. This reduced profit growth by 1.4%. Corporate interest earned decreased due to lower interest rates and reduced amounts on loans (to the extent that loans are made to the broker network the benefit of which is included in the brokers’ contribution), largely in the first half of the year. This reduction had the effect of reducing growth by 2%.
Balance SheetThe loan facility of $44.3 million provided by St. George Bank which extends to August 2013 was drawn down to $33.2 million at as 30 June 2010. After allowing for estimated future earn-out payments on completed acquisitions a further $10 million will be available from the facility to fund future acquisitions.
DividendA final dividend of 15 cents per share [fully franked] (up 11.1% on the 2009, final dividend) has been declared by the board of directors and is payable on 22nd October 2010 to shareholders registered in the company’s register of members at 5pm on 6th October 2010.
The total dividend for the year of 22.5 cents per share represents an increase of 9.8% on 2009, marginally in excess of earnings per share growth of 9.2%.
The company’s dividend reinvestment plan remains (DRP) open to shareholders entitled to participate in the 2010 final dividend. Shares will be issued under the DRP at a discount of 2.5% to the 5-day volume average weighted price. The last day to elect for participation is 5th October 2010.
Steve RouvrayChief Financial Officer
For
per
sona
l use
onl
y

Management team
insurance broking operations
10
Fabian PasquiniRon Broadbent Greg Arms Tony Clark
For
per
sona
l use
onl
y

Insurance broking is Austbrokers’ core business generating 92% of the company’s revenues for the year ending 30 June 2010.
The Austbrokers owner / driver model involves proprietors retaining the day to day management of the business along with a significant ownership stake. Austbrokers supports its member firms with strategic advice, information technology services, marketing assistance and risk management and compliance systems and services. In addition Austbrokers, through its joint venture with IBNA develops products and negotiates remuneration terms with underwriters on a group basis.
The brokers derive the bulk of their revenue from a mixture of commission and fees – split approximately 65% in commissions from underwriters and 35% in fees charged to client.
Austbrokers members, while primarily servicing the SME segment of the market, also place business for significant corporate clients and individuals. A number have significant expertise in specific areas such as mining and construction, heavy motor transport, professional indemnity, trade credit and surety.
Business is placed with all major insurers including QBE, CGU (a subsidiary of IAG), Allianz, Zurich, Suncorp and with Lloyds of London.
Currently there are 41 brokers in the Austbrokers network;
> 3 – wholly owned
> 16 – 50% - 80% owned
> 22 – 50% owned
Opportunities for acquisitions during the year were more limited than in the past but Austbrokers made a number of acquisitions directly and through brokers within the network. The direct acquisition was Austral Insurance Brokers Pty Ltd based in Perth on 30th June 2009.
A number of other significant acquisitions were made within the network as follows;
> North Coast insurance Brokers acquired 80% of Ballina Insurance Brokers
> SGP Insurance Brokers merged with Davies Brookes with a new shareholder being introduced and Austbrokers reducing its interest from 70% to 50%
In addition there were a number of succession transitions in network members with new shareholders being introduced in Insurance Advisernet Australia, Austbrokers Countrywide, Austbrokers Premier and Strathearn.
Financial & Other Services
Part of Austbrokers strategy has been to diversify its service offering into other related areas.
Financial Services
The Broking Network includes a number of businesses which have established subsidiaries which operate life insurance, superannuation and financial planning businesses. These vary in scale and the stage of development but are seen as an important aspect of servicing clients in all their insurance needs.
On a smaller scale some of the businesses have financial planning operations which are able to market to the brokers client base.
Premium Funding
The brokers continue to promote premium funding which is essentially short term financing for commercial insurance premiums, allowing businesses to pay premiums in monthly installments.
Austbrokers joint venture with Pacific Premium Funding (owned by GE) has developed this business significantly since its inception in 2005 and made a substantial contribution to brokers income. The agreement has been renewed on existing terms for a further three years until July 2012.
austbrokers annual report 2010 11
For
per
sona
l use
onl
y
austbrokers annual report 201012
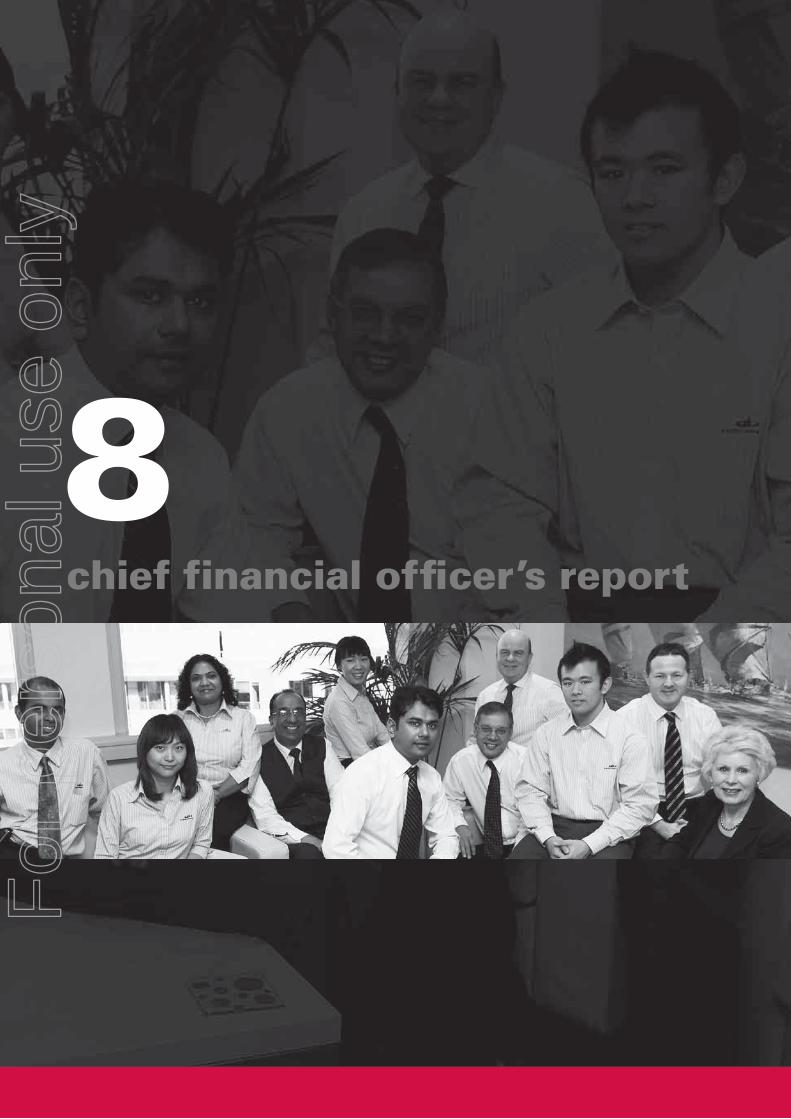
The map shows over 90 locations in which the member firms are represented.
broking firm presence
12For
per
sona
l use
onl
y

austbrokers annual report 2010 13
New South WalesMetropolitanArtarmon Campbelltown Castle Hill Hurstville Hornsby Manly Miranda Mona Vale North Sydney (4) St Leonards (2)
RegionalAlbury Armidale Ballina Batemans Bay Bega Broken Hill Coffs Harbour Dubbo Forster Griffith Kempsey Merimbula Newcastle Nowra Orange Port Macquarie Shellharbour South Lismore Speers Point Tamworth Taree Tuggerah Tumut Tweed Heads Wagga Wagga
South AustraliaMetropolitanDulwich Mile End
RegionalBooleroo Centre Ceduna Clare Cummins Loxton Moonta Mount Gambier Naracoorte Port Lincoln Port Pirie Tumby Bay Wayville
QueenslandMetropolitanBrisbane (2) Toowong Upper Mount Gravatt West End (2) Woolloongabba
RegionalCairns Fortitude Valley Innisfail Mackay Miami Maroochydore Surfers Paradise Toowoomba Roma
Northern TerritoryMetropolitanDarwin
RegionalAlice Springs
VictoriaMetropolitanBox Hill Frankston Hawthorn East Moorabbin Surrey Hills
RegionalBallarat Bendigo Epping Geelong Maryborough Mildura Portland Traralgon Warrnambool Wodonga
Western AustraliaMetropolitanPerth Stirling Wembley West Perth (2)
RegionalBroome Bunbury
ACTFyshwick
austbrokers annual report 2010 13
For
per
sona
l use
onl
y

austbrokers annual report 201014
When Austbrokers clients have the misfortune to suffer losses they are not on their own in the process of recovering their loss. At a time when individuals or businesses can be under significant pressure, particularly with a catastrophic loss their broker is there to assist and manage the claims process through to the payment of the claim.
claims services14F
or p
erso
nal u
se o
nly

austbrokers annual report 2010 15
ABS Aviation
Austbrokers ABS
Austbrokers ABS is one of the largest brokerages in the Austbrokers network. It is a diverse business that provides risk and insurance broking solutions to a wide cross section of the business community.
ABS has built successful partnerships within a number of specialised fields including bloodstock, aviation, professional indemnity and strata along with a focus on affinity groups, commercial and corporate/industrial risks.
With over 85 employees located in North Sydney and Hurstville, ABS has the expertise to cater for all situations and opportunities while still providing a personalised service through dedicated Account Managers.
ABS works with existing and prospective clients to;
– Identify risks
– Create solutions for managing and/or minimising those risks and
– Transfer risk by implementing cost effective coverage providing certainty and peace of mind.
Our market leading products and extensive knowledge of the market place have enabled us to focus on understanding our clients’ businesses and delivering a high level of service.
Our client centric focus, specialist approach and market clout ensures a mutually rewarding partnership for all of our stakeholders.
Austbrokers ABS Aviation
Austbrokers ABS Aviation is a specialist aviation insurance broker. The firm was started just over a year ago and has already grown steadily in that time. The team at Austbrokers ABS Aviation are experienced in obtaining the broadest coverage available at the most competitive price for a wide range of aviation risks.
Austbrokers ABS Aviation has the capability to handle all classes of aviation business. Their insurance expertise covers the full spectrum from general aviation to commercial airlines, from airports to aircraft maintenance and on to repair facilities. Austbrokers ABS Aviation is rapidly becoming one of the leading aviation insurance brokers in the country.
Austbrokers AEI Transport
Austbrokers AEI Transport is a “Heavy Transport Specialist” that has been involved in the transport arena for over 20 years. During this time, Austbrokers AEI Transport has grown to be one of the most respected professional insurance brokers within this niche in Australia.
Austbrokers AEI Transport has a dedicated claims team and also arranges independent assessment, legal, workers compensation and risk management advice.
Its team of staff have a commitment to the industry and attend regional and national workshops to remain abreast of sector concerns and developments and to assist clients arrange appropriate insurance solutions.
Most of the growth has come from a close working relationship with leading transport associations within Australia, for which Austbrokers AEI Transport is the appointed broker.
In March 2010 Austbrokers AEI Transport Pty Limited and Chegwyn Corporate Services Pty Ltd partnered to create a new Company, Austbrokers AEI Pty Ltd.
Whilst Austbrokers AEI Transport will continue to focus on opportunities within their specialty, Austbrokers AEI will provide advice and general insurance solutions for a wide range of customers operating in different industries.
Now branded as Austbrokers AEI Pty Ltd, the business has continued to grow with strong referrals from existing customers and expects that the next 12 months will see a solid increase whilst maintaining the same high standard of service always experienced by their customers.
ABS
For
per
sona
l use
onl
y

austbrokers annual report 201016
Austbrokers Canberra
Austbrokers Canberra Pty Ltd is one of the largest brokerage firms in Canberra. Our team of 20 experienced, dedicated professionals work together with our clients to achieve total peace of mind for them through a customised insurance and risk management program. Our client base reaches right across Australia, with large corporations, SME’s and families all enjoying the benefits of a thorough, agile insurance service.
Austbrokers Canberra has continued to focus on further developing relationships with target industry segments including Building & Construction (via the Master Builders Association – ACT), the Transport Sector and SME and other Corporate clients within the ACT and Regional NSW.
Growth in our business has seen the number of brokers in our team increase to 9. We have an ongoing commitment to the development of our people and we also have a strong focus on the importance of client relationships. The business has benefited greatly by improved partnerships with our clients.
Austbrokers Canberra continues to maintain a positive outlook for the coming 12 months driven by an ongoing commitment to ensuring our people fully understand the needs of our clients, and are equipped with the appropriate technical knowledge and resources to satisfy those needs.
Austbrokers CE McDonald
Austbrokers CE McDonald Pty Ltd (CEM) is a niche broker specialising in the motor dealer business.
As the single largest broker in Queensland for this type of insurance, CEM services a significant number of new and used motor dealerships and is regarded as experts within the industry. The majority of new business comes through referral from existing clients.
CEM prides itself on its superior standards of customer service and having effective support systems which assist clients in situations where claims, particularly from the major risk of hail, can be quickly resolved and paid.
We have in the last 12 months re-invented an old Association we have held for over 19 years. The Association relates to Market Stall Liability Insurance and we expect the growth of this portfolio to treble in the next three years.
Carriers Insurance Brokers Pty Ltd
In March 2007, Carriers joined the Austbrokers network in 2007 under the Austbrokers AEI Transport banner.
Similar to AEI, Carriers Insurance Brokers is a Heavy Transport specialist that has been involved in the Transport Industry for the past 30 Years. Its growth during this period has been purely through referrals from existing clients.
The difference between the two businesses is that Carriers main client base is the local transport operator, where AEI have traditionally operated in the long-haul transport sector. Carriers also have a large following of owner-drivers whereas the bulk of AEI’s income is derived from larger Fleet owners.
The strength of the Carriers brand is the ability to structure schemes to suit specific sectors of the Transport Industry, allowing them to manage large client numbers in an efficient manner.
Carriers have also developed a large following of CTP clientele on the back of their schemes.
Carriers Insurance Brokers have a high rate of staff retention which provides clients with continuity of service from a team of highly skilled specialists.
Carriers
For
per
sona
l use
onl
y

austbrokers annual report 2010 17
Austbrokers Central Coast
Austbrokers Central Coast Pty Ltd (ABCC) was established in 2003 to service the Central Coast area of NSW, a scenic coastal region with good opportunities in a growing business community and population. ABCC provides both general insurance and financial risk (life risk products and financial planning/ wealth creation advice) services.
The strength of the business can be attributed to its dedicated and loyal staff members who continually improve their professional standards through industry and in-house training. The business continues to invest heavily in training and development to ensure the team excels in servicing clients needs while continuing to reflect the business’ high expectations in performance standards.
As an emerging company on the Central Coast, ABCC has aggressively pursued brand awareness and recognition in the community with advertising and sponsorship opportunities in the business and sporting sectors. A key sponsorship in the last twelve months has been the Wyong Roos First Grade Rugby League side who won the Newcastle League’s Grand Final in 2009, gaining very good exposure for ABCC. This sponsorship has undoubtedly created new business growth opportunities while strengthening ties with the business’ existing client base.
ABCC is particularly focused this year on pursuing new sales and marketing initiatives as our key performance strategy for the growth and development of the business, but is also actively exploring further business acquisition opportunities.
Austbrokers City State
Austbrokers City State was established over 25 years ago and specialises in servicing the SME market in the Illawarra and Shoalhaven regions of NSW.
Located in Shellharbour, recognised as one of the fastest growing regions in the Illawarra, the company acquired the portfolio of Austbrokers Nowra in 2009 and remains committed to delivering local services to each region.
There are currently 14 staff spread over the two offices with a major focus on training and education to enhance the service provided to our customers. The company also has two Authorised Representatives who operate independently and offer specialty products such as those needed in the Transport Industry.
Austbrokers City State has increased their profile in the Illawarra area through membership of the Illawarra Business Chamber and in our first year of contesting the annual awards, finished as a Finalist in the Professional & Commercial category. Our aim is to win the award inside 5 years.
The company also supports a number of local sporting teams as well as being a long established supporter of the Kidzwish Foundation, a local charity helping bring love and laughter to sick and disadvantaged children of the Illawarra.
Steady growth in both income and profitability over the past five years through the establishment of a number of referral partners has set the platform for continued growth into the future.
Austbrokers Coast to Coast
Austbrokers Coast to Coast has a loyal client base comprised mainly of SME’s. The firm’s clients are serviced by a group of experienced and dedicated insurance professionals. Austbrokers Coast to Coast has sought out specialised broking staff to deal with growing demand for corporate, franchise, and risk management expertise.
Austbrokers Coast to Coast has achieved considerable success this year with clients operating in difficult and high risk areas such as petroleum. The results are a testament to our strong and diverse team.
Austbrokers Coast to Coast continues to grow it’s business both organically and via acquisitions. Our fully owned subsidiary, Austbrokers Coast to Coast Financial Services Pty Ltd, is geared for good growth over the next few years with the addition of highly experienced specialised staff. Austbrokers Coast to Coast is now one of the largest Broking houses in the Gold Coast/Tweed area.
Central Coast City State
For
per
sona
l use
onl
y

austbrokers annual report 201018
Professional risks is a specialist area where the broker assists businesses to understand its risks and put suitable protection in place. With the experience and skills in the Austbrokers network, solutions are provided in professional risk insurances such as professional indemnity, directors and officers liability, employment practices liability and management liability.
professional risks18
For
per
sona
l use
onl
y

austbrokers annual report 2010 19
Austbrokers Financial Solutions (Syd)
Austbrokers Financial Solutions (Syd) (AFS) was formed by the merging of three existing businesses in 2006. AFS operates as a Corporate Authorised Representative of Millennium3 Financial Services Pty Ltd AFSL 244252 and works closely with our general broking business, Austbrokers ABS. The merged operation provides a full range of advice services across the wealth protection and wealth accumulation disciplines.
AFS has in excess of $100 million in funds under management and over $8 million of in force life insurance premiums for clients.
AFS offers advice ranging from individual personal life insurance protection to the business needs of corporate Australia. They include Corporate Superannuation, Business Succession Planning and Group Insurance Plans through to personal and family protection needs.
AFS has an experienced advising team which is dedicated to developing a career path for younger advisers, growing its business and forming a trusted long term relationship with our clients.
Austbrokers Finsura
Finsura provides general insurance broking, life insurance, financial planning and Workers Compensation services to its clients and endeavours to provide comprehensive financial packages tailored to individual needs.
Finsura provides a broad spectrum of financial services negating the need for the firm’s clients to deal with a range of different providers.
Finsura continues to promote its unique capabilities in specialist areas such as commercial ski lodges, nanny agencies and the pet industry.
In the past financial year Finsura has continued to grow its presence in regional country NSW and the NT through a number of authorised representatives.
Finsura
Austbrokers Countrywide
At its base in Surrey Hills in Victoria, Austbrokers Countrywide has a team of 65 servicing clients across Australia in a diverse range of industries.
Over the last 12 months we have acquired 45% of John Smith Insurance Broking (JSIB) which has added an additional 2000 clients to our portfolio.
The more than 12,000 Austbroker Countrywide clients have access to a range of specialised services, including:
– Construction Insurance
– Risk Management
– Association Insurance Programs
– Superannuation – personal & corporate
– Financial Planning
– Business and retail insurance
– Professional Indemnity
– Directors & Officers Liability
– Workers Compensation
– Risk insurance, including income protection, life insurance and critical illness
– Personal Insurance – motor vehicle, home, landlords and travel insurance
Taking the time to do the job right is fundamental to our philosophy of delivering tailored solutions that best suit our client’s needs.
Technology development has been crucial to our strategy and our implemented workflow program has created greater efficiency and flexibility for our staff, freeing up more time to devote to our core value, client service.
Countrywide
For
per
sona
l use
onl
y

austbrokers annual report 201020
Austbrokers NTIB
Northern Tablelands Insurance Brokers (NTIB) was originally established in 1982 as Hutchison & Harlow Insurance Brokers.
In 2008, and coinciding with the purchase of shareholding by Managing Director Karen Carlon, the business adopted the Austbrokers brand to become Austbrokers NTIB.
Austbrokers NTIB is now the largest general insurance brokerage in the New England region, with a key strength being the number of qualified and experienced staff who are all locals and involved in their community.
The firm is a committed supporter of the ‘Relay for life’ charity. In 2011 Austbrokers NTIB will be the major sponsor, with management, staff and clients all involved in the charitable event.
Austbrokers NTIB enjoys strong brand awareness, and the practice continues to grow throughout the New England area and beyond. The business enjoys a proud reputation based on ethical practice and friendly, responsive service.
NTIB
North Coast Financial Services
North Coast Financial Services (NCFS) was established in Lismore in 1977 and is well placed to service the growing population in the North Coast region of New South Wales.
In March 2010 NCFS further expanded its footprint in the region with the purchase of Ballina Insurance Brokers.
The NCFS focus is on superior client service. This is reflected in a client base that encompasses several generations of North Coast clientele.
NCFS aims to provide its clients with all risk management requirements, offering complete financial services by way of General Insurance, Life/Risk Insurance, Superannuation & Financial Planning Services.
A total of 16 staff now service in excess of 7,500 clients from two locations.
NCFS
Austbrokers HCI
Situated on top of the Great Dividing Range in Toowoomba, Queensland, Austbrokers HCI was established in 1982. Through organic growth and acquisition the business has become a major provider of life and general insurance in the region.
Austbrokers HCI credits its growth and success to the innovative approach its dedicated and experienced staff take in meeting clients needs. Its reputation for customer service excellence has seen the business build a network of clients that spans right across the country.
With the recent addition of financial planning expertise we believe we can add further value to our existing clients without having to outsource.
With a mix of youth and experience Austbrokers HCI are looking toward a rewarding and exciting future.
HCI
For
per
sona
l use
onl
y

austbrokers annual report 2010 21
Austbrokers Premier
Austbrokers Premier is one of Brisbane’s longest serving insurance broking and risk advisory businesses. We have several specialist insurance facilities, catering for particular activities such as the pet industry, shop fitters, farriers and blacksmiths, restaurants, convenience stores and the timber industry just to name a few. In addition to this we have an experienced corporate insurance division servicing the needs of larger commercial and industrial clients.
2009 was a solid year for Austbrokers Premier and 2010 is earmarked for continued growth and success. 2009 saw the retirement of David Harris and the sale of his interest in the business. David was succeeded by Scott Hastings who was appointed Managing Director in December 2009. Scott’s experience is within the corporate insurance sector and he will be looking to increase the involvement of Austbrokers Premier in this area.
New Business is a priority for this coming financial year with the formation of a dedicated new business team and structured pipeline system. In addition to this we will enhance client service standards and business retention.
In summary, our objectives are simple, maintaining client focus, providing a beneficial service, ensuring customer satisfaction and achieving our targets. We have 21 committed staff members working towards all of these goals.
Austbrokers Professional Services Pty Ltd
Established in 2007 and based in North Sydney, Austbrokers Professional Services Pty Ltd (APS) operates as an authorised representative of Austbrokers Sydney. APS is a specialist broker advising businesses and their professionals on professional risk management and insurance solutions covering a variety of specialist areas including:
– Professional Indemnity
– Directors and Officers/ Company Reimbursement
– Employment Practices Liability
– Management Liability
– Statutory Liability
– Technology Liability
– Trustees Liability
– Financial Institutions
– Warranties and Indemnities
– Not for Profit / Associations
– Kidnap & Ransom/Extortion
Austbrokers Phillips
Austbrokers Phillips was established as a founding partner of Austbrokers in 1988 in the Melbourne suburb of Cheltenham.
Phillips is a truly integrated financial services licensee, advising clients in general and life insurance, superannuation, financial planning and workers compensation.
In April 2009 Phillips acquired the remaining 50% of the Austbrokers Compensation Services business from Troy Mansell, the former Managing Director of ACS who has now succeeded Gerry Phillips as CEO of Austbrokers Phillips.
This acquisition as well as the acquisition of Clarks Financial Services, a small Financial Planning business previously based in Frankston, has enabled the business to ride out the softer general insurance market of the last 12 months and gain substantial revenue growth totalling 22% in 2010.
In 2010 we developed and implemented a Customer Relationship Management (CRM) system to manage new business sales and cross sell services across the three business divisions. With the assistance of CRM we are creating new revenue opportunities, especially within our ACS corporate clients who are significant buyers of General Insurance services.
Phillips
For
per
sona
l use
onl
y

austbrokers annual report 201022
Protection from unforeseen events is essential for any business from the corner store through to small medium enterprises and major corporates. The Austbrokers network services customers of all sizes and across all industries to protect the assets and earnings of businesses through insurance of property, potential liabilities and loss of income through business interruption.
business insurance22
For
per
sona
l use
onl
y

austbrokers annual report 2010 23
business insurance
Austbrokers RWA
With offices in Manly and Tamworth, Austbrokers RWA has an annual turnover of approximately $20 million. Close to 75 per cent of the firm’s income is derived from the Manly office where the business was established in 1972.
The Manly office has a wide spread of SME accounts covering a diverse range of occupations and industries, with a particularly strong presence in the insurance of nursing homes.
The Tamworth office with representatives in both Narrabri and Coonamble continues to grow through small acquisitions combined with good seasons.
The establishment of Austbrokers RWA Financial Services Pty Ltd has enabled the firm to make life products available to existing and new clients. Additionally, Austbrokers RWA is actively seeking acquisitions in the rural and metropolitan areas.
The major strength of Austbrokers RWA is its diversity and the spread of business in its Manly and country offices.
Austbrokers Southern
Austbrokers Southern Pty Ltd provides insurance and advice to local clients on the South Coast of NSW, and in the ACT and Victoria.
Since its formation over 25 years ago, the business has developed strong connections within the local insurance community, and continues to provide its clients with nothing less than a personal service based on integrity and honesty.
Austbrokers Southern’s attitude towards clients as a partner has consolidated the business’ position of strength within the communities it serves. With word of mouth referrals, positive responses to marketing, and the creation of new business opportunities with clients, Austbrokers Southern is expanding its markets geographically and also within specific industries.
The business’ strength lies not only in existing relationships but also in key personnel who come from diversified backgrounds such as Underwriting, Business Owners, Professionals from Accounting, IT and Finance Sectors and also locals who understand the importance of the local community.
Austbrokers Southern prides itself on its compliance culture and business ethics along with a strong commitment to the local community.
RWA
Austbrokers RIS Pty Ltd
Austbrokers RIS Pty Ltd transacts all classes of general insurance for its clients and provides additional broking expertise in the areas of workers compensation, superannuation and associated products.
With offices in St Leonard’s, Dubbo & Orange, and employing 26 staff, Austbrokers RIS has developed a robust operation. Strong partnerships and highly experienced staff mean that Austbrokers RIS has the professional expertise required to provide Risk and Insurance services to both the Metropolitan and Regional insurance markets.
The range of resources available to the company allows for continued organic growth, in particular throughout Central West NSW where Austbrokers RIS is a leading provider of Insurance broking services and has a thorough understanding of the needs of the local communities.
Austbrokers RIS continues to provide tailored Insurance solutions in its niche area of the Bus and Coach Industry, utilising the registered trading name of ALIB Businsure. The company also offers specialist Workers Compensation services which complements the Insurance services provided by all 3 offices, while maintaining a stand alone offering through consultancy
The diversity of service offerings ensures Austbrokers RIS is in an enviable position to actively pursue a strategy of growth through marketing and further acquisitions.
RIS
For
per
sona
l use
onl
y

austbrokers annual report 201024
Austbrokers Terrace
Austbrokers Terrace was incepted in September 2005 as a result of the merger of two long time Austbroker entities, AHL Insurance Brokers (SA) Pty Ltd and Terrace Insurance Brokers..
The company has grown both in income and staff, with 22 employees currently providing their skills to the business. While predominantly an SME broker, we have a growing corporate identity due to our involvement within the Rail Industry.
Austbrokers Terrace specialises in a variety of areas, and all have the endorsement of the relevant industry body. An example of this is our Professional Persons Policy and strong relationship with the South Australian Dental Association.
In more recent times we have become shareholders in a Financial Services company, which provides Life Risk and Superannuation expertise to our existing clients and its own portfolio.
Austbrokers Terrace have a diverse staff demographic which enables the business to make a strong contribution to the Austbrokers Group both now and into the future. As a business we recognise the importance of stability and succession planning.
Our business relationships are built with a strong emphasis on accountability and technical expertise, and we believe this culture has been pivotal in the success of Austbrokers Terrace.
Austbrokers Trade Credit
Austbrokers Trade Credit is a specialist credit insurance broker. The company has grown to become a substantial and well respected firm, actively supporting Austbrokers’ clients and achieving 90% of its business through referrals.
Austbrokers Trade Credit clients range from small to medium sized businesses to multinational companies across a range of industries, locally and internationally. The company has a portfolio of both domestic and export policies and is also growing its Surety portfolio.
Austbrokers Trade Credit is committed to assisting its clients in protecting cash flow and trade debtor assets by securing credit insurance cover, allowing prudent growth despite continuing market uncertainty.
Austbrokers SPT
The past year has seen a consolidation under our new corporate identity - Austbrokers SPT. The change has been beneficial in accentuating the strength that being part of Austbrokers brings to our client service offering.
Our specialty product areas have seen significant growth which has offset the continuing soft premium cycle being carried through the insurance market. Those specialties and niche marketing opportunities are expected to continue for the immediate and ongoing years due to our strong market position. The use of IT and web based marketing and ongoing investment in that area is showing real rewards.
Skilled staff have been recruited to assist in meeting our growth objectives. At the same time we have been able to retain existing key personnel sending positive indicators which are important to client retention.
Our international business division, through membership of international broking group UNIBA, continues to grow by providing significant services for both the inbound and outbound insurance business. Austbrokers SPT is a specialist in managing local portfolios forming part of global insurance programs.
We see continued growth and with the potential hardening of the market, which may bring it’s own challenges, continued increases in the profitability of the business.
SPT
For
per
sona
l use
onl
y
austbrokers annual report 2010 25
Austral Risk Services
Established in 1992 Austral Risk Services based in Perth is a general insurance broking and risk management business. Austral became part of the Austbrokers network on 30th June 2009.
Austral works with all types of commercial and industrial enterprises in varying industries. Its professional, skilled team of twenty staff service a client base spanning Australia and Asia. Services include:
– General insurance broking
– Risk profiling and risk mitigation via tailored plans
– Claims advocacy and management
In addition to its normal broking and risk services, the business has also developed tailored schemes for electrical contractors, taxi/charter vehicles, and learner drivers. These schemes are recognised for providing better cover at competitive premiums backed by exceptional claims service.
Since Austbrokers acquired shareholding in June 2009, it has proven to be a positive strategic step for Austral. It was a milestone event for the company and one which it is confident will continue to prove successful for all stakeholders.
Citycover (Aust) Pty Ltd
Citycover has quickly established itself as a major mid-market Insurance Brokerage in Brisbane. Its focus remains unaltered to previous years, servicing largely SME clients with specialist insurance solutions to specific segments, such as transport, plant and machinery, caravan yards, concrete pumpers, restaurants, hairdressers, personal lines and eco tourism. The business has continued to grow its portfolio during the last 12 months, and now employs 26 staff, who remain focused on providing professional advice and the highest service standards possible.
The current strategy is to grow organically, but also to acquire smaller portfolios if they are suitable to the current business mix and office culture. The business is highly respected and holds highly valued relationships with it’s business partners, and often works with them to find that little bit more for clients.
The office is in the Fortitude Valley, but the client base is spread right throughout Queensland and Interstate.
This extremely experienced Brokerage continues to attract new talent to its team, and through its focus on professional service and advice, has a great record of client retention.
Citycover is committed to being a responsible member of the communities it serves and actively supports a number of charities. The team at Citycover do not just donate money to these charities but their time as well, participating in a range of fundraising activities.
Adroit Insurance Group
Adroit Insurance Group operates an extensive branch network spanning key regional growth areas of Victoria, metropolitan Melbourne, and southern New South Wales.
Each Adroit Branch features local partners in the spirit of the Austbrokers “owner driver” model and is proud of the local origins and identities of each of its businesses. Adroit’s focus is on its team of highly skilled and respected insurance professionals, building and developing strong relationships across clearly defined segments, providing security and peace of mind to each of the communities in which it is represented.
The past 12 months has been a particularly successful period for the business. The decision was made to rebrand to Adroit Insurance Group a little over 12 months ago. The rebrand process has not only achieved the desired outcomes of clarity of brand and greater advantage of scale, but also created the platform for a long and sustainable future for all clients, staff and stakeholders.
From an operational point of view, Adroit’s investment in an internal Facilities business that concentrates on the provision of unique products, service delivery and distribution for associations and specific occupations has begun to pay dividends. The same can be said of the Financial Services arm of the business in the provision of life risk and financial planning solutions to its broad customer base.
Adroit’s commitment to community continues with a mandate “to engage in and support where we work and live”, demonstrated by the fact that the business currently has a capital base of nearly $150,000 invested in local community foundations as a result of its policy of contributing a percentage of the company’s profits each year. In addition to this the Adroit Insurance Group Charity Golf Day that is held in Geelong in November each year to raise money for the St John of God Hospital, has now raised nearly $300,000 ($65,000 in November 2009 alone).
For
per
sona
l use
onl
y

austbrokers annual report 201026
Specialist businesses within the Austbroker network provide protection for the human capital in business and for individuals on a personal basis which enables business to overcome potential financial difficulties for those left behind. Life insurance is important for protection of family and dependents in the event of death and serious illness or accident on an individual basis, where as loan protection or key personal insurance is vital in supporting business buy / sell arrangements or succession planning.
financial services26F
or p
erso
nal u
se o
nly
austbrokers annual report 2010 27
financial services
Comsure Insurance Brokers
Comsure Insurance Brokers Pty Ltd (Comsure) commenced trading in 1974 and joined the Austbrokers network in 1995.
Comsure is a broking house with a diverse client base ranging from SME clients to publically listed entities. The experience of the team lies in heavy industrial markets such as mining, commercial marine, underwater construction projects and civil works, as well as areas such as food manufacturing, hospitality, information technology and motor dealerships.
Comsure thrives on the difficult and unusual risks that its clients face and the risk management and insurance placement services that it provides. This sets us apart from competitors and is a testament to the business’ strong client retention and success over the past 36 years.
Comsure has well established relationships with Electrical and Plumbing industry associations and has a division established to serve this growing business sector that has seen challenges such as home insulation audits and solar power in the past 12 months. Comsure has successfully negotiated tailored products to meet this market demand.
In addition, we have identified the Global Trade Credit and Political Risk market as growth sectors over the coming years post GFC, and have employed staff in this area to cater for this market sector.
Comsure in the past 12 months has maintained growth in volatile market conditions and is looking forward to the coming year and beyond.
Fergusons Financial Services
Fergusons Financial Services (Fergusons) was established as a general insurance brokerage in 1974 and is based in the bayside suburb of Frankston, the gateway to the Mornington Peninsula.
Joining forces with Austbrokers in 2002 provided Fergusons with the opportunity to enjoy the benefits of being part of a larger group, while maintaining its independence and local identity.
With almost 4,500 clients across Australia, Fergusons has a clear focus on satisfying the needs of small to medium businesses and residential/commercial strata-titled properties.
Fergusons prides itself on the quality of its customer service and the benefits of building long-term customer relationships. Over 70 of Fergusons largest clients have enjoyed a relationship spanning more than 20 years, a testament to Fergusons commitment to excellence and service.
Fergusons offer a full range of financial services to customers, including income protection, life insurance and superannuation, supported by an enthusiastic and professional team of experienced, knowledgeable and qualified staff.
As keen contributors to a number of community programs, Fergusons and its staff joined forces this year to promote a Variety Club initiative to provide bicycles to disadvantaged children, as well as fund-raising for the annual Royal Children’s Hospital Good Friday Appeal.
Insurance Advisernet Australia
Insurance Advisernet Australia (IAA) was established in 1996 to give local insurance advisers access to a national buying group for products and services. IAA joined the Austbrokers Group in 2006 which further enhanced its range of products and services.
IAA was one of the first general insurance broker to implement the dealer group/authorised representative model in Australia and has since commenced operations in New Zealand to capitalise on opportunities there. IAA has also recently started cross selling a range of financial services and products to its client base.
IAA has achieved compound growth of over 15% in recent years which is testament to the success of its business model.
IAA / IANZ are leading Authorised Representative networks in both Australia and New Zealand. Australia handles $250 million of premiums through 140 Corporate Authorised Representatives with 400 advisers in 70 locations nationally. New Zealand handles $40 million of premiums through 25 brokers with 80 staff in 20 locations.
FergusonsFINANCIAL SERVICES
For
per
sona
l use
onl
y

austbrokers annual report 201028
JMD Ross Insurance Brokers
JMD Ross Insurance Brokers is a prominent Sydney-based insurance broking practice providing quality risk and insurance services in industrial, commercial and personal lines for a wide range of clients.
JMD Ross audits business interruption (consequential loss) and broad-form liability exposures to assist them to obtain the appropriate coverage.
The company has particular capabilities in professional indemnity insurance, providing services to accounting and other professions. JMD Ross gives private companies access to management liability insurance, a valuable product designed to respond to the complex threats of litigation and crime that may expose their bottom lines.
JMD Ross’s joint-venture partner, Griffiths & Armour Professional Risks, has strengthened its services in Australia, providing professional indemnity insurance to engineers and architects. UK-based Griffiths & Armour arranges insurance for more than 3,000 firms of engineers, architects and surveyors.
JMD Ross also provides specialist risk and insurance services to the tourism, jewellery and meat industries. It has now expanded its services to the meat industry across Australia’s eastern seaboard through an alliance with the Australian Meat Industry Council.
During the past financial year, the company’s international account, principally servicing the requirements of overseas-owned companies in Australia, developed further in partnership with Globex International, WING, UnisonBrokers and other international partners.
MGIB
MGIB (McNaughton Gardiner Insurance Brokers Pty Ltd) commenced in 1981 as a two man operation servicing the South West of Western Australia with an office located in Bunbury.
Bunbury is still head office today, but over the last 10 years MGIB has expanded into the Perth metropolitan area with an office in West Perth. MGIB has also kept pace with Western Australia’s booming North West, opening an office in the in Broome, which assists with the service of many local tourism businesses whilst at the same time allowing MGIB access to the mining towns of Port Hedland and Karratha.
MGIB has it’s core operation in the General Insurance market and offers tailored risk management solutions to a diverse client base over a large demographic. A strong financial services division allows MGIB to offer clients a complete risk service.
MGIB is recognised as a leading specialist in the Tourism, Hospitality & Events Industry, where it has developed many strong relationships with the industries peek bodies and in turn developed niche products which are customised to suit the group’s clients & their members.
MGIB now employs 31 staff who service over 10,000 clients state-wide. The variety of services provided, the business size, the strong relationships, staff experience and its stability have ensured that MGIB is a major force in Western Australia.
Markey Group
Markey Group is the largest general insurance provider in the Newcastle and Hunter Valley area. Markey has serviced clients in this region since 1972 and earned a reputation for reliability and professionalism. Over 5,000 clients are serviced from the Newcastle office which now employs 50 staff in the general insurance area, with three additional staff members providing financial services through a related entity.
Last year saw the acquisition of a 75% interest in Sandersons Insurance Brokers and the name changed to Austbrokers Sanderson. With Austbrokers Sanderson taking advantage of the market presence and back office facilities provided by Markey Group, we returned a very strong result for the past financial year.
As from the 1st of July, 2010, Markey Group has an Authorised Representative operating from Brisbane. Although this will start as a small portfolio of existing Markey clients we are expecting to see good growth in this area over the next three years.
Our hard work in the direct marketing area over the past 12 months has paid off with the quantity and quality of prospects improving. Our strike rate on the winning of these new prospects has also increased. We look forward to this activity continuing strongly over the next 12 months and plan to use our model to market on behalf of the Financial Services division.
Our Financial Services division has been fortunate enough to secure the services of a young and experienced representative, and we are sure this addition will boost our activity and sales in this area.
As a responsible member of the local community Markey Group held a charity golf day in April 2010. $31,000 was raised for breast cancer awareness and donated to the Hunter Medical research Institute.
For
per
sona
l use
onl
y

austbrokers annual report 2010 29
Peter L Brown and Associates
Established in 1982, Peter L Brown and Associates Pty Ltd (PLB&A) joined the Austbrokers network in 1987 making it one of the longest serving members of the group.
With a Head Office in Wagga Wagga, the company also operates branches in Griffith and Tumut. PLB&A employs nine qualified brokers and a support staff of 15, and the company boasts a professional ability normally only found in major metropolitan broking houses.
PLB&A is a major regional broking house specialising in professional, commercial and industrial SME accounts and Rural insurance, turning over approximately $22 million in direct and indirect premiums annually. In recent years the company has developed a growing number of larger corporate clients and these, along with other important accounts, have been secured on medium term agreements ensuring continuity.
PLB&A places great emphasis on the provision of quality service, professional advice and market competitive premiums, together with a comprehensive industry knowledge, as the basis of client business relationships.
This year, PLB&A substantially increased bottom line profit on the back of new business renewal strategies and sustainable savings on day to day business expenses. A further transition in planned management succession sees the company well poised to achieve strong results going forward.
Oxley Insurance Brokers
Oxley Insurance Brokers Pty Limited (OIB) was formed in 1976 and is one of the founding members of Austbrokers.
OIB consists of a branch network located at Forster, Taree, Port Macquarie, Kempsey and Coffs Harbour, employing over 55 local staff.
Along with General Insurance, OIB provides the additional services of premium funding, life risk insurance and workers compensation to business clients along the NSW Mid North Coast.
Now in its 34th year, OIB is one of the largest regional insurance brokerages in Australia.
MGA Insurance Brokers
Established in South Australia in 1975, founding Directors John George, Allan Amber and Brian McInerney are today joined by their four sons who operate in various areas of the business. With 20 Branches throughout Australia, MGA has developed a reputation as an insurance broking business of significance in the regional broking arena, and nationally with office representation in four capital cities.
For the past 10 years, MGA has been recognised as one of South Australia’s 100 largest companies. MGA takes its responsibility to the communities it serves seriously, and for several years the group has supported the Australia Cambodia Foundation and the childrens charity, Variety. More recently, MGA has become a major sponsor to the Royal Flying Doctors Service.
Millennium General Insurance (MGA’s underwriting agency business) provides market access and services to MGA. Core products include Farm, Strata, Crop, Household, Landlords, Combined Business/Property, Trades Pack, Professional Indemnity and Personal Accident. Millennium also manages many of MGA’s risk placements and affinity lines into the London markets.
MGA Ezipay was created in 2006 to provide premium funding and retail instalments services to MGA clients. MGA’s compliance and training is handled exclusively through Insurance Broker Solutions Centre.
MGA has developed a tailored technology solution with the exclusive “Smartbroker system”. For the past 8-years, Smartbroker has been evolving as MGA’s in-house tailored broker tool. This is an ongoing initiative that assists personnel in accessing all operational information and also provides access to MGA’s unique processing system. Today, Smartbroker is being marketed to the broader broker industry to help facilitate succession solutions and streamline client portfolio management.
With significant double digit income growth again in FY2010, MGA continues to build on the success of past years which is due to ongoing organic and acquisition strategies across the group. This successful approach will continue during FY2011.
For
per
sona
l use
onl
y

austbrokers annual report 201030
Rivers Insurance Brokers Pty Ltd
Rivers Insurance Brokers Pty Ltd was formed in 1981 and caters for all general insurance needs. Within the organisation there is specialist expertise to handle agriculture, aviation, construction, marine and general business requirements.
The business operates through its branch offices in Brisbane, Cairns and Innisfail, the last two of which trade under the name Far North Insurance Brokers.
The Brisbane office has handled many of the major construction projects in the city and the Gold Coast, from Expo 88, Lang Park and the Gabba redevelopments to the major office and apartment buildings that dominate the CBD skyline. The business also focuses on commercial and manufacturing businesses, in addition to a specialist agricultural division, which has a facility at Lloyds and also places business in the local market. This division is currently developing a special product for the burgeoning carbon credit industry.
The Cairns office has developed an exceptionally large marine portfolio, covering over 300 commercial fishing vessels, as well as many white boats and commercial freighters. This office has also arranged many of the construction risks for significant Cairns landmarks, in addition to many tourism projects and general commercial accounts.
The Innisfail office caters for the local farming community and the varied businesses associated with it, together with a general focus on commercial and domestic accounts.
At an organisational level there is a strong focus on providing a level of service and expertise superior to competitors, which has led to the retention of many of the clients who have been with the business since inception in 1981.
SGP Insurance Brokers
SGP Insurance Brokers (SGP) was founded in 1968 and became a member of the Austbrokers network in 1990.
SGP is located in the Macarthur district of South Western Sydney and is a well established high profile business located in a region which is set to see unprecedented growth in future years.
In late 2009 SGP acquired the portfolio and staff of Davies Brookes Pty Ltd which was also a well established local business. The merging of these two brokerages will deliver scale of economy as well as a dynamic organisation with its sights clearly set on client service, revenue growth and profitability.
SRG Group Pty Ltd T/as SRG Corporate & Bikesure
SRG Corporate is a company with a next generation ethos and a very energetic and vibrant management team.
The business sees significant growth potential in organic and strategic initiatives that include niche schemes and targeted marketing strategies such as:
– The continued growth of its Queensland office on the Gold Coast, opened in 2007, which provides distribution opportunities to fuel the group’s strategic expansion plans.
– Launching of a new product initiative called Bikesure, targeting Cycling enthusiasts and Cycling Retailers with a tailored Bicycle Insurance and Business Insurance solution.
SRG currently employ 17 staff and places around $20m in gross premiums. Client portfolios are managed by specialists in a particular segment ensuring skills and priorities are matched with SRG’s client needs.
For
per
sona
l use
onl
y

austbrokers annual report 2010 31
Strathearn Insurance Brokers
Strathearn is a specialist general insurance broker and corporate risk adviser. Established in Perth in 1993, Strathearn is a partner of choice for corporate and business clients seeking a highly experienced and reputable broker with a record of delivering personal committed service and a tailored insurance solution.
With offices in Perth, Brisbane and Sydney the Strathearn team services national and international clients across a diverse range of industries. Long term trusted relationships with Australian underwriters as well as strategic partnerships with leading specialist firms in the UK, US, Singapore, Hong Kong and Africa provide Strathearn clients with access to both national and international risk and underwriting markets.
Strathearn’s expertise covers a broad range of industries and specialised products including mining and resources, political risk insurance, surety bonds, engineering contractors, construction, industrial manufacturing, directors and officers liability, marine, aviation, contractual risk management and professional indemnity.
Western United Financial Services
Western United Financial Services (Western United), based in Perth provides insurance broking, risk management, claims handling and financial solutions to a range of SME and Commercial/Corporate clients.
Western United advises on the full range of general insurance products and offers financial solutions such as life, income protection, superannuation and business succession planning.
Risk management solutions include workers compensation and injury management design and training, occupational safety and health audits and system development implementation.
Western United is committed to providing clients with a personalised service tailored to their needs. The business strives to achieve consistently high levels of customer service which sets Western United apart from its competitors and creates a healthy stream of referral business.
Western United’s new business division continues to introduce significant new clients and income growth which has exceeded the benchmarks set in previous years.
Western United Transport specialising in the heavy transport industry, continues to grow and remains instrumental in helping the company become one of the most recognised names in transport insurance. Western United Transport is a major sponsor of the Livestock Transport Association and the Civil Contractors Federation.
The company’s growth has required additional resources, and this year Western United has welcomed several new senior staff members to its team. New marketing plans and initiatives will also be implemented so that we can look forward to continued growth in the coming year.
For
per
sona
l use
onl
y

Austagencies
operational report
32For
per
sona
l use
onl
y

brandsAustagencies businesses operate under the following brands:
5 Star Underwriting Agency Motor dealership house accounts
Australian Bus & Coach Bus and coach fleet operators; property and liability for transport depots
Dolphin Underwriting Tourism, accommodation, hospitality programs
Latitude Underwriting Industrial Special Risks, General Liability and Commercial Insurance Package products for the general business sector
Sentinel Special Risks Builders’ warranty, entertainment event cancellation and abandonment, prize indemnity.
Unitas Combined General Liability Personal accident and injury risks
austbrokers annual report 2010 33
IntroductionAustagencies Pty Ltd is an underwriting agency which is a wholly owned subsidiary of Austbrokers Holdings. The role of the underwriting agency is to underwrite, distribute and manage specific insurance products and portfolios on behalf of insurance companies including Lloyds.
The company holds long term underwriting agency contracts with major insurers including Great Lakes Australia, QBE, Allianz, Lumley, Suncorp Metway, Catlin and Lloyd’s.
Gross premium written by Austagencies in the past 12 months was in excess of $70 million.
Business Model Austagencies offers 29 specialised product lines transacted through insurance brokers and tailored to the needs of their clients.
The underwriters within the Austagencies team are all specialists in particular insurance products or industry sectors, enabling them to understand and evaluate the risks presented by brokers and offer tailored and competitive solutions, specific to each client’s risks.
This ‘specialisation strategy’ benefits all stakeholders in the transaction chain – clients, brokers and insurers.
> Insured clients are delivered a policy that responds specifically to their exposures
> Insurance brokers receive strategic input on opportunities for new business and the retention of existing business
> Insurers are able to sidestep the high degree of commoditisation which is evident in the insurance market by using an external agency
Austagencies deals only with the professional insurance broker market and has a history of profitable underwriting on behalf of the insurers. Profit sharing commissions continue to be generated by the major Austagencies product lines.
GrowthAustagencies continues to deliver growth to Austbrokers through the following initiatives:
AcquisitionsIn October 2009 Austagencies acquired a 50% interest in Tasman Underwriting Agency, based in North Sydney. Tasman has built a enviable brand in the professional indemnity market where it is able to provide solutions to many of professions requiring a level of technical and product sophistication. This business is consistent with the high specialisation model which drives the Austagencies brand.
New product lines and updatesAustagencies identified a demand from the broker network for underwriting facilities to respond to complex risks.
Over the past twelve months Austagencies has developed many significant products for the Austbrokers network. Commercial Strata was added to the suite of Latitude products at the start of 2010 and has found favour amongst brokers within this niche portfolio.
Following on from that success, eight new Marine products have been
developed for the Austbrokers network which has been supported by QBE in a strategic initiative. These products are only rolling out now and the benefits of this will flow through over the course of the next financial year. On the back of the long standing and successful Contractors Plant and Equipment portfolio, Austagencies have further developed their engineering capability by adding Equipment Breakdown and Construction Insurance to the stable of products in this specialist field.
Complementing Austagencies product development has been the drive to re brand and re build the Austagencies offering to the Film and TV production sector which is a highly specialised niche market.
Austagencies have been a major insurer in the snowfields sector and it has taken the initiative to revamp its product and branding under Latitude Underwriting to Alpine.
MarketingOver the years Austagencies has developed many products which it branded individually according to the niche market it operated in. To ensure that the insurance brokers with whom Austagencies deal are aware of our total product offering Austagencies are consolidating many existing products under a core group of brands under the Austagencies name as the principal operating entity.
In the later part of 2009 Australian Bus and Coach celebrated 30 years of operation and continues to be the market leader in this sector in Australia thanks to its very dedicated staff.
For
per
sona
l use
onl
y

Austbrokers Business Centre
operational report
34For
per
sona
l use
onl
y

austbrokers annual report 2010 35
The Austbrokers Business Centre (ABC) is a wholly owned subsidiary of Austbrokers Holdings Ltd and has been established as a strategic provider of common back office services to Austbrokers Network Broker Members.
The overarching objective of the ABC was to establish a centre of expertise for the Austbrokers Group in highly skilled areas of financial control and reporting, CBS accounting (which is the broking system software), full human resources process, payroll functionality and treasury support.
With these key but highly specialised and labour intensive processes outsourced, member brokers can direct their full attention to servicing their customer base and developing their business. Members can access some or all of the services depending on their requirements, making the services adaptable to their needs.
The pooling of resources makes greater expertise available to all Austbrokers members, particularly smaller brokers who could not easily justify the cost of having this in house. Using the Austbrokers DataCentre, ABC can be readily connected to all businesses in the Network.
ABC will also provide a back up for members in a risk management sense. The sudden loss of key back office employees can now be covered on a temporary or permanent basis to maintain continuity of business processes and to ensure regulatory requirements continue to be met.
ABC is located in Hurstville outside of the Sydney CBD area. Austbrokers is looking to start smaller satellite operations reporting into Hurstville in a “Hub and spoke” model, with the aim of cost containment through regional rather than metropolitan labour markets.
Currently ABC is providing back office services for fifteen network members.
For
per
sona
l use
onl
y

austbrokers annual report 201036
A & I Member Services
operational report
36For
per
sona
l use
onl
y

austbrokers annual report 2010 37
A & I Member Services Pty Ltd (AIMS) was established in 2007 as a joint venture between Austbrokers Holdings Limited and IBNA Limited. AIMS services are provided for the collective benefit of 120 members, who place $1.8bn premium on behalf of their clients.
AIMS has a corporate team of 5, strategically and practically supported by the Board of Directors and several expert practice committees. These are Professional Indemnity; Annual Convention; Insurance Products Development and a Regional Committee in each state.
Both member networks are equally represented on the Board and Practice Committees.
The strategic purpose of the company is:
> to deliver leading insurance products, industry tools, business intelligence, training & education,
> in a way that drives commercial access between our brokers and insurance partners
> so that we generate measurable growth for brokers and insurers.
> A national training program for Business Pak was implemented and this model shall be continued for the other products as they are launched
> A number of strategic alliances
Leading ProductsThe new AIMS co-branded General Liability policy has been launched to members, complete with a product training DVD. The policy wording has been developed in conjunction with LMI Group, the principal technical partners of AIMS.
Our range of specialised products has been extended to include Management Liability, Corporate Travel, Equipment Breakdown and Heavy Motor Transport.
Business IntelligenceThe AIMS website has been relaunched with a contemporary look and more effective navigation. The new format has doubled the daily number of hits to the site. The website is an information clearing house enabling members to access the AIMS policies, training services, general information and commercial arrangements negotiated with insurers who service the network.
Training & EducationAIMS continues to refine and expand the provision of educational programs dedicated to the business and management skills of members. Residential courses such as the Young Leaders Program provide a blend of technical, regulatory and personnel skills for the next generation of our business leadership as they progress their careers.
Members’ Professional Indemnity Insurance ProgramThis program is a key service, providing an acknowledged market-leading policy and a record of stable security, together with high limits of liability to protect participating broker members. Under the guidance of the PI chairman and committee members, the unit cost of the 2010/2011 program renewal has been contained below general market trends.
Commercial AccessAIMS has made commitments to our principal insurers to provide business generation opportunities. During 2010, a series of broker/insurer market days conducted in a trade show format is being delivered in each mainland capital city. The 5 largest insurers as ranked by member premiums present a competitive pitch on products and services face to face with AIMS business principals and transactional brokers. Reponses from both insurers and brokers have been excellent.
austbrokers annual report 2010 37
The 2010 Annual AIMS Convention attracted in excess of 300 delegate brokers and business partners. It is the high profile forum for networking and promotion of risk and insurance solutions at business principal and senior management level.
Measurable GrowthAIMS executives and the management of our principal insurance partners hold formal quarterly performance reviews. A key performance indicator of these reviews is the comparative growth of business written, both renewals and new clients. The outcome continues to be satisfactory for all parties with the expectation of further development in the year ahead.
For
per
sona
l use
onl
y

austbrokers annual report 201038
operational report38
Group Services and Support
For
per
sona
l use
onl
y

An essential part of Austbrokers group services and support for the Broker Network and Austagencies is its Information Technology, Risk Management and Compliance Services (including Human Resources Policy and advice).
Information TechnologyA team of specialists based at North Sydney manages and monitors the performance of our network brokers common IT systems.
DataCentre
The IT datacentre is located at the Telstra datacentre in Ultimo and houses the network members central data storage requests. Currently there are over 70% of members on the network with the remaining member brokers that will migrate to the datacentre scheduled over the next twelve to eighteen months.
The datacentre will provide the group with immediate disaster recovery back up services through the Austbrokers site at North Sydney.
Data Mining Reporting
Data mining capability provides network members with overnight reporting on all aspects of client policy servicing and marketing. Network members have tailor made reporting to review and analyse current client insurance policies and determine both adequacy of cover and pricing for each client renewal.
Risk Management & ComplianceAustbrokers developed a highly specialised framework to comply with Financial Services Regulations which has been implemented by the brokers. This has been overlayed by a risk management program and audit function to ensure ongoing compliance with requirements.
A select team of compliance officers carry out compliance audits for each broker annually.
These services provide a solid platform for the business operations and ensure the risks involved in both maintaining business systems and compliance with regulatory requirements are minimised and managed.
The risk and compliance framework is an automated process involving every staff member through the network.
A Risk and Compliance Committee comprising of Austbrokers compliance team and a network member representative meet regularly to maintain oversight of this area and report on to the Board Audit Committee.
Best Practice
A Best Practice Committee comprising of Austbrokers compliance team and network members representatives operates to produce consistent documentation and process to the network members. This Committee meets regularly and works in conjunction with the Network Steering Committee.
austbrokers annual report 2010 39
For
per
sona
l use
onl
y

board of directors
40
Over the past year, partnerships and innovation have been important strategic themes for Austbrokers – Richard Longes
Lachlan McKeough David Harricks Steve RouvrayPhillip Shirriff Richard Longes Frank Earl
For
per
sona
l use
onl
y
austbrokers annual report 2010 41
Richard Longes Chairman
Richard was a lawyer with Freehill Hollingdale & Page and a Partner from 1974 to 1988. In 1988, Richard was a founding partner of Wentworth Associates, a boutique corporate advisory firm.
Richard is a non-executive director of Investec Bank Australia Limited and is currently a Director of Boral Limited and Metcash Limited. Richard has been a director of a number of public companies and government bodies including Chairman of MLC Limited as well as the responsible entity of the General Property Trust.
Richard has a Bachelor of Laws and a Bachelor of Arts from The University of Sydney and a Masters of Business Administration from The University of New South Wales.
Age 65
Lachlan McKeoughChief Executive Officer
Lachlan has over 40 years’ experience in the general insurance and insurance broking industries. Lachlan commenced the Austbrokers business in 1985 and has been the CEO since that time.
Prior to establishing Austbrokers, Lachlan was employed in various senior management roles with Mercantile Mutual.
Lachlan is a Qualified Practising Insurance Broker and holds an Advanced Diploma of Financial Services from NIBA. Lachlan is a member of the Australian Institute of Company Directors and a Fellow of the Australian Institute of Management.
Age 60
Frank EarlNon-Executive Director
Frank passed away on 12 July 2010
Frank had over 40 years’ experience in the general insurance industry.
He was Managing Director of Minet Professional Services Limited from 1988 to 1997 and Managing Director of Minet Australia Limited (including the Australian broking operations) from 1994 to 1997.
Frank was Managing Director of Arthur J.Gallagher (Aus) Pty Limited from 1998 to 2004. He was a past President of NIBA and was a Director of NIBA.
Frank held a Diploma of Financial Services (Insurance Broking) and was a Qualified Practising Insurance Broker, and a Fellow of the Australian Institute of Company Directors.
Age 63
Phillip ShirriffNon-Executive Director
Phillip has 44 years’ experience in the financial services industry and was formerly the Chief Executive Officer of ING Financial Services International - Asia/Pacific and a director of ING. From 1985 to 1995, Phillip was Managing Director of the Mercantile Mutual Group (now ING).
Phillip has been on the board of Austbrokers since 1986.
Phillip is currently a director of ING Bank (Australia) Limited (Chairman), and was previously a director of ING Australia Limited and ING NZ (Holdings) Limited.
Phillip has a Bachelor of Arts (Econ/Finance) from Macquarie University and an Associate Diploma Life from the Australian Insurance Institute.He is a Fellow of CPA Australia and Fellow of the Institute of Chartered Secretaries and Administrators.
Age 64
David HarricksNon-Executive Director
David was a Financial Services Partner at PricewaterhouseCoopers for 23 years, specialising in the Insurance Industry. He has been a director of a number of companies including Lumley General Insurance Ltd. He was also a member of three Compliance Committees of the Commonwealth Bank of Australia Group.
Presently David is the Chairman of the Austbrokers Audit and Risk Management Committee.
David has a Bachelor of Arts degree from Macquarie University, a Bachelor of Commerce from The University of New South Wales and is a Fellow of The Institute of Chartered Accountants in Australia.
Age 65
Stephen RouvrayCompany Secretary
Stephen has over 20 years experience in the financial services industry, covering general insurance, life insurance and investment management.
Stephen was General Manager of ING Australia Holdings from 2002 – 2005 and Company Secretary of a number of ING subsidiaries. He has been Company Secretary of Austbrokers since 1986. Stephen joined ING’s predecessor Mercantile Mutual as Company Secretary in 1985.
From 1971 to 1984, Stephen worked in the accountancy profession where he specialised in the financial services sector concentrating on general insurance.
Stephen has a Bachelor of Economics from The University of Sydney and is a Chartered Accountant and a Fellow of the Institute of Chartered Secretaries and Administrators.
Age 60
For
per
sona
l use
onl
y

financial report
42for the year ended 30 june 2010
For
per
sona
l use
onl
y

austbrokers annual report 2010 43austbrokers annual report 2010 43
For
per
sona
l use
onl
y

austbrokers annual report 201044
For the year ended 30 June 2010
directors’ report
Your Directors submit their report for the year ended 30 June 2010.
DirectorsThe names and details of the Company’s Directors in office during the financial year and until the date of this report are as follows. Directors were in office for this entire period unless otherwise stated.
Names, qualifications, experience and special responsibilities
R.A. Longes (BA LLB, MBA)
(Non-executive Chairman)
Richard Longes was a lawyer and partner in Freehill Hollingdale & Page from 1974 – 1988. In 1988 he was a founding Partner of the corporate advisory firm Wentworth Associates and is now a Non-executive Director of Investec Bank Australia Limited.
Presently, he is the Group Chairman and also serves on the Audit and Risk Management, Nomination and Remuneration and Succession Planning Committee of the Group. During the past three years Mr. Longes has also served as a Director of the following other listed companies:
– Boral Limited *
– Metcash Limited *
* denotes current Directorship
He is also a Director of Pain Management Research Institute and National Indigenous Centre for Excellence Limited. Presently he is Chairman of the Nomination and Remuneration and Succession Planning Committee and a member of the Audit Committee.
W.L. McKeough (QPIB, Adv Dip Fin Serv, MAICD, FAIM)
(Director and Chief Executive Officer)
Lachlan McKeough commenced the Austbrokers business in 1985 and has been CEO since that time. Prior to this he was employed in various management roles in general insurance with Mercantile Mutual. He has over 40 years experience in the general insurance industry.
L.F Earl (QPIB, FAICD)
Mr Earl passed away on the 12 July 2010.
Frank Earl had over 40 years experience in the general insurance industry. He was Managing Director of Minet Professional Services from 1988 - 1997 and Managing Director of Minet Australia Limited from 1994 - 1997. He was also Managing Director of Arthur J Gallagher (Aust) Pty Ltd from 1998 - 2004. He was a past President of NIBA and a Director of NIBA and a Non-executive Director of IBL Limited. He was a Member of the Remuneration and Succession Planning and Nomination Committees.
D.J. Harricks (BA, BCom, FCA)
David Harricks has 39 years experience in the insurance industry. Until 2000 he was a Financial Services Partner at PricewaterhouseCoopers for 23 years specialising in the Insurance Industry. He has been a director of a number of companies including Lumley General Insurance Ltd. and was also a member of three Compliance Committees of the Commonwealth Bank of Australia Group. Presently he is the Chairman of the Audit and Risk Management Committee.
P.R. Shirriff (BA, FCPA, FCIS, ANZIIF (Sen) CIP)
Phillip Shirriff has had over 40 years experience in the financial services sector and was formerly Chief Executive Officer for ING Financial Services International – Asia / Pacific and from 1985 – 1995 Managing Director of Mercantile Mutual (now ING). He is currently Chairman of ING Bank (Australia) Limited and has been a director of a number of companies including ING Australia Limited and ING NZ (Holdings) Limited Presently he is a member of the Audit and Risk Management, Nomination and Remuneration and Succession Planning Committees.
Company secretaryS.S. Rouvray (BEc, CA, FCIS)
S.S. Rouvray has been the Company Secretary of Austbrokers Holdings Limited for 24 years. He is also Chief Financial Officer and Manager of Investor Relations. A Chartered Accountant for over 35 years, he was previously Company Secretary of ING Australia Holdings Limited and a number of ING Group companies from 1985 – 2005 and General Manager of ING Australia Holdings Limited 2002 – 2005.
Interests in the shares and options of the company and related bodies corporate
As at the date of this report, the interests of the Directors in the shares and options of Austbrokers Holdings Limited were:
Number of Number of Options Ordinary Shares over Ordinary Shares
R.A. Longes 100,000 -
W.L. McKeough 85,000 1,010,100
D.J. Harricks 27,000 -
P.R. Shirriff 100,000 -
DIVIDENDS Cents $000
Final dividends recommended:
– on ordinary shares 15.0 7,911
Dividends paid in the year:
– on ordinary shares - interim 7.5 3,889
– on ordinary shares - final 13.5 6,809
10,698
Principal activitiesThe principal activities during the year of entities within the consolidated entity were:
– the provision of general insurance broking services and distribution of ancillary products;
– conducting underwriting agency businesses.
There has been no significant change in the nature of these activities during the year.
Operating and financial reviewGroup Overview
The Group invests in general insurance brokers and underwriting agencies. Equity is held in 41 insurance broking operations with a 50% holding in 22, a 100% holding in 3 and a 51% to 85% holding in 16. The Company’s preferred “owner driver” model is for equity to be held by the management of the business on a 50% shareholding basis.
The Group also provides services to its broking network including information technology through a centralized data centre, assistance with compliance with the regulatory requirements and back office assistance where required.
The Group’s underwriting agencies operate in niche markets and include Australian Bus & Coach, Cinesure, Sentinel, Sentinel Special Risks, CPE, Unitas, and 5 Star that specialises in motor dealers. In addition Latitude underwrites business and property risks. The principal activities of the Austbrokers group and its associated entities during the year include;
– Insurance broking
– Financial services
– Underwriting agency operations
For
per
sona
l use
onl
y

austbrokers annual report 2010 45
The Austbrokers Group and its associates employ over 1,300 people and operates in over 90 locations.
Performance Indicators
Management and the Board monitor the Group’s overall performance, from its implementation of the mission statement and strategic plan through to the performance of the Group against operating plans and financial budgets.
The Board, together with management, has identified Key Performance Indicators (KPIs) that are used to monitor performance. Key management monitors KPIs on a regular basis. Directors receive the KPIs for review prior to each Board meeting allowing all Directors to actively monitor the Group’s performance.
Dynamics of the Business
The Group operates in the general insurance market sector. Revenue is largely from commissions and fees earned on arranging insurance policies and is impacted by the volume of premiums placed which in turn is affected by premium rates, sums insured and the general level of economic activity. Moderate increases in commissions and fees have been achieved during the year through increases in premium rates, initiatives undertaken to increase business and acquisitions (net of funding costs) within the broker network.
Operating Results for the Year
The Group’s net profit for the year after income tax attributable to equity holders of the parent is $18,189,000 representing an increase of 14.4% over the previous year. The above figure includes profits from sale of businesses of $572,000 after income tax (2009 $486,000). These profits largely resulted from the reduction of equity interest held in a subsidiary from 70% to 50%.
Net profit from operations excluding non-recurring items and gains on sale of equity interests and before amortisation of intangibles was $20,165,000 (2009 $17,989,000) representing an 12.1% increase over last year. The growth reflects the continued successful execution of the strategies put in place by management.
Net profit from continuing operations is reconciled to net profit attributable to members of the parent as reported as follows:
2010 2009 $’000 $’000 Increase
Net profit from continuing 20,165 17,989 12.1% operations but before amortisation of intangibles and sale of equity interests and controlled entities attributable to equity holders of the parent
Net Profit after tax on sale of equity interests in associates and controlled entities 572 486
Net profit after tax from continuing operations before amortisation of intangibles 20,737 18,475 12.5%
Amortisation of intangibles net of tax (2,548) (2,572)
Net profit attributable to equity holders of the parent as reported 18,189 15,903 14.4%
Direct acquisitions represented 3.1% of the 12.1% growth in net profit before amortisation and profit on sale of interests in associates and controlled entities.
Growth from the existing broker network, including bolt on acquisitions made, contributed 10.8% to the profit growth. Total commission and fee income increased by 6.6% and total income by 6.1% over the prior
period also excluding direct acquisitions. Premium funding income was up 11.2% due to the ongoing successful development of the alliance with Pacific Premium Funding. Interest income was down 13.4% due to lower interest rates prevailing in the first half.
Profit growth of 2.2% was generated through an increase in underwriting agency profits of 21.7% resulting largely through organic growth in agency business but assisted by the acquisition of 50% of Tasman Underwriting.
Expenses in the broker network increased by 6.1% (excluding direct acquisitions). This reflects some increase as a result of acquisitions within the network, direct expenses related to income growth as well as some inflationary increase in costs.
Corporate expenses increased by 4.5% over the corresponding prior period. This reduced profit growth by 1.4%.
Increase in borrowing costs was 4.3% and interest earned decreased by 28% due to repayments of loans by brokers and lower cash held due to additional earnout payments on acquisitions. These reduced growth by 2.3% but to some extent were reflected in higher profit growth from broking.
The effective tax rate was marginally higher which also reduced growth by 0.3%.
Amortisation of intangibles was in line with the corresponding prior period.
Risk Management
The identification and effective management of risk, including calculated risk taking is viewed as an essential part of the Group approach to creating long term shareholder value. A policy for risk management has been established by the Board.
Management, through the Chief Executive, is responsible for designing, implementing and reporting on the adequacy of the Group’s risk management and internal control system. Management reports to the Board Audit and Risk Management Committee on the Group’s key risks and the extent to which it believes these risks are being managed. This is performed on a quarterly basis or more frequently as required by the Board or relevant subcommittee.
The Board is responsible for satisfying itself that management has developed and implemented a sound system of risk management and internal control. Detailed work on this task is delegated to the Board Audit and Risk Management
Committee and reviewed by the full Board. The Board Audit and Risk Management Committee also oversees the adequacy and comprehensiveness of risk reporting from management.
A standardised approach to risk assessment is used across the Group to ensure that risks are consistently assessed and reported to an appropriate level of management, and to the Board as appropriate.
The Group carries out risk specific management activities in four core areas; strategic risk, operational risk, reporting risk and compliance in accordance with Australian / New Zealand Standard for Risk Management (AS / NZS 4360 Risk Management) and the Committee of Sponsoring Organisations of the Treadway Commission (COSO) risk framework.
The company has identified a series of operational risks which the company believes to be inherent in the industry in which the company operates. These include:
– loss of key employees
– increasing employment costs
– significant consolidation of underwriters
– significant increase in premium rates reducing demand
– acquisition risk
° availability
° performance
– licensing and regulatory compliance breaches
For
per
sona
l use
onl
y

austbrokers annual report 201046
For the year ended 30 June 2010
directors’ report
These risk areas are provided here to assist investors to understand better the nature of the risks faced by the company and the insurance broking industry. They are not necessarily an exhaustive list.
Detailed internal control questionnaires are completed by key finance managers in relation to financial and other risk reporting on a six monthly basis. These are reviewed by our senior finance team as part of our half yearly reporting to the market and to achieve compliance with section 295A of the Corporations Act and Recommendation 7.3 of the ASX Corporate Governance Council’s Corporate Governance Principles and Recommendations.
A detailed compliance program in the insurance broking operations also operates to ensure the Group meets its regulatory obligations. Executive risk management committees also meet regularly to deal with specific areas of risk such as compliance, OH&S and financial risk and report to the Board as to the company’s management of its material business risk.
The Board also receives a written assurance from Chief Executive Officer (CEO) and the Chief Financial Officer (CFO) that to the best of their knowledge and belief, the declaration provided by them in accordance with section 295A of the Corporations Act is founded on a sound system of risk management and internal control and that the system is operating effectively in relation to financial reporting risks. The Board notes that due to its nature, internal control assurance from the CEO and CFO can only be reasonable rather than absolute. This is due to such factors as the need for judgment, the use of testing on a sample basis, the inherent limitations in internal control and because much of the evidence available is persuasive rather than conclusive and therefore is not and cannot be designed to detect all weaknesses in control procedures.
The Group will provide updates on any changes in its circumstances in press releases on the investor section of the company’s website.
Significant changes in the state of affairsThere were no significant changes in the state of affairs of the consolidated entity during the financial year.
Total equity increased to $134,574,000 from $114,253,000. The main reason for the increase was the profit for the year and the increase in issued capital with dividends paid being reinvested as a result of the company’s dividend reinvestment plan being underwritten.
Significant events after the balance dateOn 26 August 2010 the Directors of Austbrokers Holdings Limited declared a final dividend on ordinary shares of 15.0 cents per share in respect of the 2010 financial year. Based on the current number of ordinary shares on issue, the total amount of the dividend is $7,910,548.
Likely developments and expected resultsAustbrokers will continue its strategies to grow its broker network through acquisitions and growth initiatives in its existing insurance broking businesses and particularly working with them to develop their businesses through further bolt on acquisitions.
In addition the Group will continue to develop its underwriting business expanding the products underwritten and extending the owner driver model to these activities.
Organic growth bolstered with bolt on acquisitions should maintain growth in Net Profit after Tax before amortisation of intangibles and profit on sale of equity interests at around 5% to 10%. There are some signs of increased acquisition activity in the market and if these eventuate they will contribute to growth above this level.
In general, the longer term outlook continues to appear favourable with the economy returning to trend growth levels, more acquisition opportunities likely to arise and premium rates more likely to be stable or increase moderately.
Share optionsAll options are granted over shares in the ultimate controlling entity Austbrokers Holdings Limited.
Unissued shares
As at the date of this report, there were 1,929,333 unissued ordinary shares under options (2,012,633 at the reporting date). Refer to note 18 of the financial statements for further details of the options outstanding.
Option holders do not have any right, by virtue of the option, to participate in any share issue of the company or any related body corporate.
The first tranche of options vested fully on 5 October 2008. All options must be exercised no later than 5 October 2012. The exercise price of each option is $2.00. During the year a further 165,850 options were exercised leaving 465,850 unexercised at reporting date. Subsequently a further 45,000 options were exercised leaving 420,850 unexercised at the date of this report.
The second tranche of options vested fully on 25 September 2009. All options must be exercised no later than 25 September 2013. The exercise price for each option was $3.47. During the year 30,200 options were exercised leaving 704,000 unexercised at reporting date. Subsequently a further 38,300 options were exercised leaving 665,700 unexercised at the date of this report.
The earliest vesting date for the third tranche of 663,100 options is 14 September 2010. All options must be exercised no later than September 2014. The exercise price for each option was $4.20. During the year 52,150 lapsed leaving 610,950 remaining.
The earliest vesting date for the fourth tranche of 150,479 options is 29 September 2011. All options must be exercised no later than 29 September 2015. During the year 7,750 options lapsed. The exercise price for each option remaining was $4.22 for 49,942 options and zero for 92,787 options.
The earliest vesting date for the fifth tranche of 89,104 options is 3 November 2012. If options are exercised within two years of the date the options vest the shares cannot be disposed of before the expiry of the two period from the date the options vested, except if employment is terminated. All options must be exercised no later than 3 November 2016. The exercise price for each option was zero for all of the options.
Shares issued as a result of the exercise of optionsDuring the financial year, employees exercised options to acquire 165,850 and 30,200 fully paid shares in Austbrokers Holdings Limited at $2.00 and $3.47 each respectively. Subsequently a further 45,000 and 38,300 options were exercised at $2.00 and $3.47 each respectively. Consequently 196,050 ordinary shares were issued during the financial year and a further 83,300 subsequently.
Indemnification and insurance of directors and officersDuring or since the financial year, the company has paid premiums in respect of a contract insuring all the Directors and officers of Austbrokers Holdings Limited against liabilities, past, present and future.
In accordance with normal commercial practice, the disclosure of the total amount of premiums under and the nature of the liabilities covered by the insurance contract is prohibited by a confidentiality clause in the contract.
Remuneration reportThis remuneration report ending on page 52, which has been subject to audit, outlines the remuneration arrangements in place for Directors and Executives of Austbrokers Holdings Limited (the company).
Remuneration philosophyThe performance of the company depends upon the quality of its Directors and Executives. To prosper, the company must attract, motivate and retain highly skilled Directors and Executives.
For
per
sona
l use
onl
y

austbrokers annual report 2010 47
To this end, the company embodies the following principles in its remuneration framework:
– Provide competitive rewards to attract high caliber executives;
– Link executive rewards to shareholder value;
– Have a significant portion of executive remuneration ‘at risk’, dependent upon meeting pre-determined performance benchmarks; and
– Establish appropriate, demanding performance hurdles for variable executive remuneration.
Remuneration and Succession Planning Committee
The Remuneration and Succession Planning Committee of the Board of Directors of the company is responsible for determining and reviewing compensation arrangements for the Directors, the Chief Executive Officer (CEO) and Senior Management Team.
Remuneration structure
In accordance with the best practice corporate governance, the structure of Non-executive Director and Executive remuneration is separate and distinct.
Non-executive Director remuneration
Objective
The Board seeks to set aggregate remuneration at a level that provides the company with the ability to attract and retain Directors of the highest caliber, whilst incurring a cost that is acceptable to shareholders.
Structure
The Constitution and the ASX Listing Rules specify that the aggregate remuneration of Non-executive Directors shall be determined from time to time by a general meeting. An amount not exceeding the amount determined is then divided between the Directors as agreed. The latest determination was approval by shareholders at the 2009 Annual General Meeting to increase the aggregate remuneration from $400,000 to $500,000 per year to allow for the appointment of an additional director to assist in succession planning.
The amount of aggregate remuneration sought to be approved by shareholders and the manner in which it is apportioned amongst Directors is reviewed annually. The Board considers advice from external consultants as well as the fees paid to Non-executive Directors of comparable companies when undertaking the annual review process. The fees are increased annually on 1 July based on the CPI increase for the previous year.
Each Director receives a fee for being a Director of the company which includes a fee for each Board committee on which a Director sits.
Non-executive Directors have been encouraged by the Board to hold shares in the company. It is considered good governance for Directors to have a stake in the company on whose Boards they sit.
The remuneration of Non-executive Directors for the period ending 30 June 2010 is detailed in Table 1 of this report.
Senior Manager and Executive Director remuneration
Objective
The company aims to reward executives with a level and mix of remuneration commensurate with their position and responsibilities within the company and so as to:
– reward executives for company, business unit and individual performance against targets set by reference to appropriate benchmarks;
– align the interest of executives with those of shareholders;
– link rewards with the strategic goals and performance of the company; and
– ensure total remuneration is competitive by market standards.
Structure
In determining the level and make-up of executive remuneration, the Remuneration Committee engaged an external consultant to provide independent advice in the form of a written report detailing market levels of remuneration for comparable executive roles.
It is the Remuneration Committee’s policy that a fixed term employment contract is entered into only with the Chief Executive Officer and not with any other executives. Details of contracts are provided on page 48.
Remuneration consists of the following key elements:
– Fixed Remuneration
– Variable Remuneration - Short Term Incentive (STI)
– Variable Remuneration - Long Term Incentive (LTI) or Medium Term Incentive (MTI)
Fixed Remuneration
Objective
Fixed remuneration is reviewed annually by the Remuneration Committee. The process consists of a review of company wide, business unit and individual performance, relevant comparative remuneration in the market and internally and, where appropriate, external advice on policies and practices. As noted above, the Committee has access to external advice independent to management.
Structure
Senior managers are given the opportunity to receive their fixed (primary) remuneration in a variety of forms including cash and fringe benefits such as motor vehicles. It is intended that the manner of payment chosen will be optimal for the recipient without creating undue cost for the Group.
The fixed remuneration component of the 5 key management personnel of the Group is detailed in Table 1.
Variable Remuneration – Short Term Incentive (STI)
Objective
The objective of the STI program is to link the achievement of the Group’s operational targets with the remuneration received by the executives charged with meeting those targets. The total potential STI is available at a set level so as to provide sufficient incentive to the senior manager to achieve the operational targets and such that the cost to the Group is reasonable in the circumstances.
On an annual basis, after consideration of performance of the Group against its net profit after tax targets on an a pre profit on sale of equity interests and amortisation of intangibles basis, an overall performance rating for the Group is approved by the Remuneration Committee. Net profit after tax is considered the most appropriate means of gauging company performance as it aligns with shareholder interests. The individual performance of each executive is also rated and taken into account when determining the amount, if any, of the short term incentive pool that is to be allocated to each executive. This process usually occurs within 3 months after the reporting date and was completed in accordance with the established process for the prior year in September 2009.
The aggregate of annual STI payments available for executives across the Group is subject to the approval of the Remuneration Committee. Payments made are delivered as a cash bonus in the following reporting period.
For the 2009 financial year, 94% of the STI cash bonus provided in the financial statements was paid in the 2010 financial year. The Remuneration Committee will consider the STI payments for the 2010 financial year in September 2010. The amount anticipated to be paid for the 2010 financial year is $1,563,000 which has been provided for in the 2010 financial year. This is the estimate of the maximum that can be granted in respect of this financial year, with the minimum being zero if no performance conditions are met.
For
per
sona
l use
onl
y

austbrokers annual report 201048
For the year ended 30 June 2010
directors’ report
Variable Remuneration – Long Term Incentive (LTI) and Medium Term Incentive (MTI)
Objective
The objective of the LTI and MTI plans is to reward senior executives in a manner that aligns this element of remuneration with the creation of shareholder wealth.
As such, LTI grants are only made to executives who are able to influence the generation of shareholder wealth and thus have a direct impact on the Group’s performance against the relevant long term performance hurdle.
The MTI was introduced in the 2009 financial year to recognise that the Chief Executive Officer’s term of employment expired on 16 November 2010 and participation in the LTI scheme would not have met the objectives. A new contract was entered into during the year which extended his term of employment to 16 November 2012.
Structure
LTI grants to executives are delivered in the form of options and the MTI in the form of cash.
The use of Earnings Per Share Growth (EPSG) was selected for the long term incentive and medium term incentive plans. The use of earnings per share growth was selected due to the lack of an appropriate comparator group for such measures as Total Shareholders Return (TSR). It is believed EPSG provides alignment between comparative shareholder return and reward for executives.
Relationship of rewards to performance
In assessing whether the performance hurdles for each grant have been met, the earnings per share (EPS) are adjusted for significant items where appropriate and are calculated on a pre profit on sale of equity interests and amortisation of intangibles basis.
Option Exercise conditions
Exercise conditions:
(a) subject to satisfaction of the performance based conditions referred to in paragraphs (b) and (c) below, the Options will vest 3 years after the date of grant;
(b) if the First Test Compound Earnings Per Share Growth (Compound Growth) is:
(i) greater than or equal to 8.5% per annum, 20% of the Options will become exercisable;
(ii) equal to 10% per annum, 50% of the Options will become exercisable;
(iii) between 10% and 15%, the percentage of Options that are exercisable will be determined on a pro rata basis so that the number of Options that are exercisable will increase from 50% by 1 percentage point for every 0.1% percent additional Compound Growth over 10%;
(iv) 15% per annum or more, 100% of the Options will become exercisable,
in each case on the date on which the Company’s audited financial statements for the third financial year ending after the grant are lodged with the Australian Securities Exchange (the “First Test Date”);
(c) if all of the Options do not become exercisable on the First Test Date and the Second Test Compound Growth is higher than the First Test Compound Growth then on the date on which the Company’s audited financial statements for the fourth financial year ending after the grant are lodged with the Australian Securities Exchange (the “Second Test Date”) an additional number of Options will become exercisable as is equal to the difference between the number of Options which became exercisable under paragraph
(b) and the number of Options which would have become exercisable if paragraph (b) applied on the basis of the Second Test Compound Growth (rather than the First Test Compound Growth);
(d) any Options which have not become exercisable by the Second Test Date lapse and are of no further force or effect.
(e) options granted in the 2010 financial year have further restrictions on their disposal or the disposal of any shares acquired on their exercise for a further two years from vesting of these options.
MTI cash payment
The conditions for the MTI to vest are identical to those for the LTI exercise conditions except that the period for testing the earnings per share growth is two years only. The amount anticipated to be paid for the period to 30 June 2010 financial year is $142,200 which has been provided for in the 2010 financial year.
Company performance and the link to remuneration
Long term and medium term incentives are based on compound average annual growth in earnings per share. The table below sets out the basic earnings per share and the increases achieved over the 5 years since the company was listed on the ASX
Basic earnings Increase % per share - cents
Year to 30 June
2010 35.3 11.4
2009 31.7 11.0
2008 28.6 13.9
2007 25.1 25.5
2006 20.0*
* Excluding abnormal profits on sale of equity interests as part of Initial Public offering
Based on the performance achieved the grants in 2005, 2006 fully vested and 90% of 2007 is expected to vest.
Employment contracts
The CEO, Mr. McKeough is employed under contract. A new employment contract entered into during the year which terminates on 16 November 2012, an extension of two years on the initial contract.
– From 1 July 2010, Mr. McKeough receives fixed remuneration of $500,000 per annum. Since 16 November 2005 Mr. McKeough has also had the right to receive a $50,000 per annum living away from home allowance in certain circumstances. To date he has received no payment nor has he an entitlement to any payment in relation to this allowance.
– Mr. McKeough may resign from his position and thus terminate this contract by giving 6 months written notice. On resignation any options will be forfeited.
– The company may terminate the contract at any time without notice if serious misconduct has occurred. Where termination with cause occurs, the CEO is only entitled to that portion of remuneration that is fixed, and only up to the date of termination. On termination with cause any unvested options will immediately be forfeited.
Other Key Management Personnel (KMP) have letters of offer of employment with no fixed term, and varying periods up to one month for either party to terminate. Details of remuneration are detailed in table 1.
For
per
sona
l use
onl
y

austbrokers annual report 2010 49
Remuneration of Directors and named ExecutivesTable 1: Compensation of Key Management Personnel for the year-ended 30 June 2010 (Consolidated)
Post Share-based Short-term employment Payment
Total Cash short Non monetary Equity performance Salary & fees term incentive benefits Superannuation options Total related
30 June 2010 $ $ $ $ $ $ %
Directors
R.A. Longes 116,213 – – 10,459 – 126,672 – Chairman
W.L. McKeough 374,435 374,534 62,440 49,985 – 861,394 43.48%Chief Executive
L.F. Earl 63,102 – – – – 63,102 – Non-executive Director
D.J. Harricks 13,336 – – 50,000 – 63,336 – Non-executive Director
P.R. Shirriff 58,106 – – 5,230 – 63,336 – Non-executive Director
Executives
S.S. Rouvray 218,118 143,370 41,723 49,996 74,492 527,699 41.29%Chief Financial Officer/ Company Secretary
G Lambert 252,598 96,713 9,061 38,270 49,480 446,122 32.77%General Manager Operations and Strategic Developments
F. Gualtieri 168,594 93,556 40,857 30,726 40,418 374,151 35.81%National Manager Group Services and Support
J. Howells 183,104 85,043 37,991 42,323 45,926 394,387 33.21%General Manager Austbrokers Sydney
G.J. Arms 146,325 130,017 53,910 47,091 43,175 420,518 41.19%General Manager Equity Operations
1,593,931 923,233 245,982 324,080 253,491 3,340,717
For
per
sona
l use
onl
y

austbrokers annual report 201050
Remuneration of Directors and named ExecutivesTable 2: Compensation of Key Management Personnel for the year-ended 30 June 2009 (Consolidated)
Post Share-based Short-term employment Payment
Total Cash short Non monetary Equity performance Salary & fees term incentive benefits Superannuation options Total related
30 June 2009 $ $ $ $ $ $ %
Directors
R.A. Longes 124,800 – – – – 124,800 – Chairman
W.L. McKeough 316,346 462,000 58,672 99,982 - 937,000 49.31%Chief Executive
L.F. Earl* 78,290 – – – – 78,290 – Non-executive Director
D.J. Harricks 62,400 – – – – 62,400 – Non-executive Director
P.R. Shirriff 62,400 – – – – 62,400 – Non-executive Director
Executives
S.S. Rouvray 212,900 184,820 42,259 38,341 77,412 555,732 47.19%Chief Financial Officer Company Secretary
G Lambert 252,568 135,150 765 25,167 51,012 464,662 40.06%General Manger Austbrokers Sydney
F. Gualtieri 165,830 123,844 45,174 16,496 41,669 393,013 42.11%National Manager Group Services and Support
J. Howells* 190,858 43,000 35,758 31,885 47,724 349,225 25.98%General Manager A & I Member Services
G.J. Arms 161,452 147,638 49,425 32,123 44,512 435,150 44.16%National Operations Manager
1,627,844 1,096,452 232,053 243,994 262,329 3,462,672
* Salary and fees include an amount of $15,890 for work carried out at the request of the Board.
For the year ended 30 June 2010
directors’ reportF
or p
erso
nal u
se o
nly
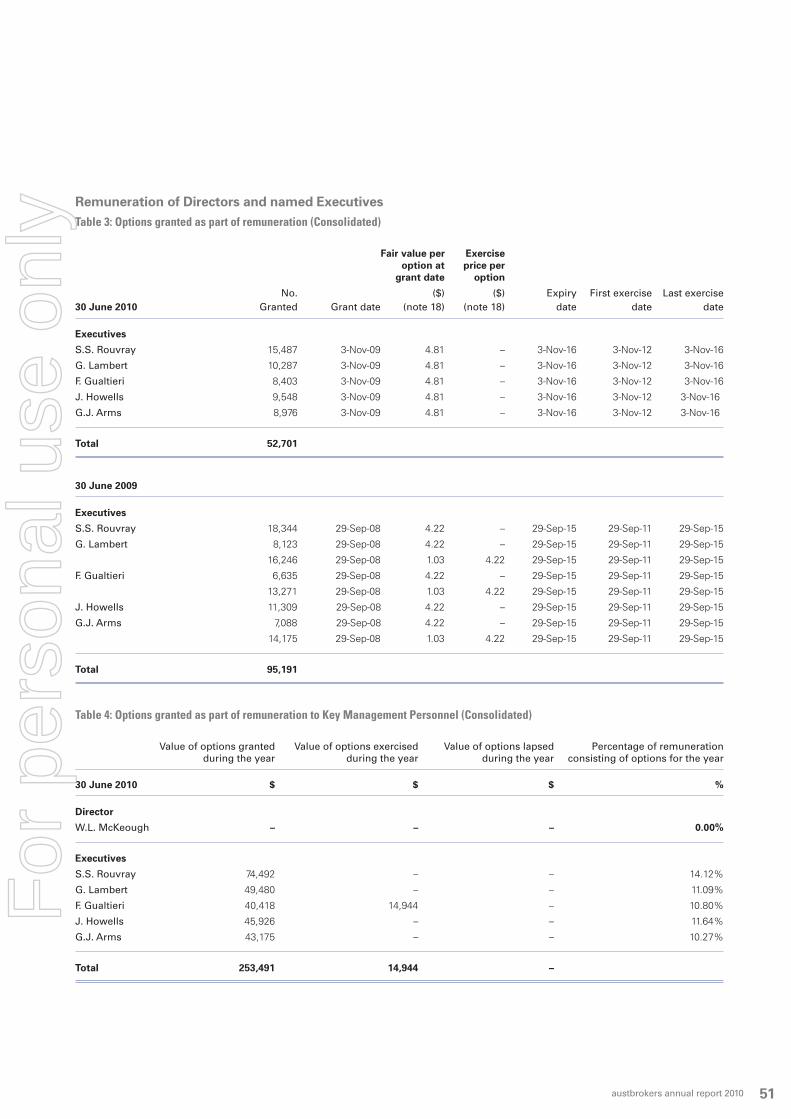
austbrokers annual report 2010 51
Remuneration of Directors and named ExecutivesTable 3: Options granted as part of remuneration (Consolidated)
Fair value per Exercise option at price per grant date option
No. ($) ($) Expiry First exercise Last exercise30 June 2010 Granted Grant date (note 18) (note 18) date date date
Executives
S.S. Rouvray 15,487 3-Nov-09 4.81 – 3-Nov-16 3-Nov-12 3-Nov-16
G. Lambert 10,287 3-Nov-09 4.81 – 3-Nov-16 3-Nov-12 3-Nov-16
F. Gualtieri 8,403 3-Nov-09 4.81 – 3-Nov-16 3-Nov-12 3-Nov-16
J. Howells 9,548 3-Nov-09 4.81 – 3-Nov-16 3-Nov-12 3-Nov-16
G.J. Arms 8,976 3-Nov-09 4.81 – 3-Nov-16 3-Nov-12 3-Nov-16
Total 52,701
30 June 2009
Executives
S.S. Rouvray 18,344 29-Sep-08 4.22 – 29-Sep-15 29-Sep-11 29-Sep-15
G. Lambert 8,123 29-Sep-08 4.22 – 29-Sep-15 29-Sep-11 29-Sep-15
16,246 29-Sep-08 1.03 4.22 29-Sep-15 29-Sep-11 29-Sep-15
F. Gualtieri 6,635 29-Sep-08 4.22 – 29-Sep-15 29-Sep-11 29-Sep-15
13,271 29-Sep-08 1.03 4.22 29-Sep-15 29-Sep-11 29-Sep-15
J. Howells 11,309 29-Sep-08 4.22 – 29-Sep-15 29-Sep-11 29-Sep-15
G.J. Arms 7,088 29-Sep-08 4.22 – 29-Sep-15 29-Sep-11 29-Sep-15
14,175 29-Sep-08 1.03 4.22 29-Sep-15 29-Sep-11 29-Sep-15
Total 95,191
Table 4: Options granted as part of remuneration to Key Management Personnel (Consolidated)
Value of options granted Value of options exercised Value of options lapsed Percentage of remuneration during the year during the year during the year consisting of options for the year
30 June 2010 $ $ $ %
Director
W.L. McKeough – – – 0.00%
Executives
S.S. Rouvray 74,492 – – 14.12%
G. Lambert 49,480 – – 11.09%
F. Gualtieri 40,418 14,944 – 10.80%
J. Howells 45,926 – – 11.64%
G.J. Arms 43,175 – – 10.27%
Total 253,491 14,944 –
For
per
sona
l use
onl
y

austbrokers annual report 201052
Table 4: Options granted as part of remuneration to Key Management Personnel (Consolidated) (continued)
Value of options granted Value of options exercised Value of options lapsed Percentage of remuneration during the year during the year during the year consisting of options for the year
30 June 2009 $ $ $ %
Director
W.L. McKeough – – – 0.00%
Executives
S.S. Rouvray 77,412 34,656 – 13.93%
G. Lambert 51,012 – 10.98%
F. Gualtieri 41,669 – – 10.60%
J. Howells 47,724 – – 13.67%
G.J. Arms 44,512 – – 10.23%
Total 262,329 34,656 –
There have been no alterations to the terms and conditions of options granted as remuneration since their grant date.
Directors’ meetingsThe number of Directors’ meetings (including meetings of committees of Directors) held during the year and the numbers of meetings attended by each Director were as follows: Meetings of Committees
Directors’ Audit & Remuneration & Meetings Risk Management Nomination Succession Planning
No. of meetings held 7 7 2 2
No. of meetings attended
R.A. Longes 7 6 2 2
W.L. McKeough 7 – – –
L.F Earl 5 – 1 1
D.J. Harricks 7 7 – –
P.R. Shirriff 7 7 2 2
All Directors were eligible to attend all meetings held. Mr Earl passed away on 12 July 2010 after succumbing to an illness which prevented him from attending the last two board meetings and the last committee meetings of the year.
Committee membership
As at the date of this report, the company had an Audit and Risk Management Committee, Remuneration and Succession Planning Committee and a Nomination Committee of the Board of Directors. Members acting on the committees of the Board during the year were:
Audit Remuneration Nomination
D.J. Harricks (Chairman) R.A. Longes (Chairman) R.A. Longes (Chairman)R.A. Longes L.F. Earl L.F. EarlP.R. Shirriff P.R. Shirriff P.R. Shirriff
RoundingThe amounts contained in this report and in the financial report have been rounded to the nearest $1,000 (where rounding is applicable) under the option available to the company under ASIC Class Order 98/0100. The company is an entity to which the Class Order applies.
Auditor independence and non-audit servicesThe Directors received an independence declaration from the auditors of Austbrokers Holdings Limited. Refer to page 53 of the directors report.
Non-audit services were provided in relation to taxation matters to the Austbrokers Group by the entity’s auditor, Ernst & Young in the financial year ended 30 June 2010. The directors are satisfied that the provision of non-audit services is compatible with the general standard of independence for auditors imposed by the Corporations Act 2001. The amounts received or due to be received are detailed in Note 25 of the Financial Report.
Signed in accordance with a resolution of the Directors.
W L McKeough Director Sydney, 26 August 2010
For the year ended 30 June 2010
directors’ reportF
or p
erso
nal u
se o
nly

austbrokers annual report 2010 53
to the Directors of Austbrokers Holdings Limited
auditor’s independence declaration
In relation to our audit of the financial report of Austbrokers Holdings Limited for the financial year ended 30 June 2010, to the best of my knowledge and belief, there have been no contraventions of the auditor independence requirements of the Corporations Act 2001 or any applicable code of professional conduct.
Ernst & Young
P HarrisPartnerSydney, 26 August 2010
For
per
sona
l use
onl
y

austbrokers annual report 201054
corporate governance statement
The Board of Directors of Austbrokers Holdings Limited is responsible for the corporate governance of the consolidated entity. The Board guides and monitors the business and affairs of Austbrokers Holdings Limited on behalf of the shareholders by whom they are elected and to whom they are accountable.
Austbrokers Holdings Limited’s Corporate Governance Statement is structured with reference to the Corporate Governance Council’s principles and recommendations, which are as follows;
Principle 1. Lay solid foundations for management and oversight
Principle 2. Structure the Board to add value
Principle 3. Promote ethical and responsible decision making
Principal 4. Safeguard integrity in financial reporting
Principle 5. Make timely and balanced disclosure
Principle 6. Respect the rights of shareholders
Principle 7. Recognise and manage risk
Principle 8. Remunerate fairly and responsibly
Austbrokers Holdings Limited’s corporate governance practices were in place throughout the year ended 30 June 2010 and were fully compliant with the Council’s best practice recommendations.
The responsibilities of the Board of Directors and those functions reserved to the Board together with the responsibilities of the Chief Executive Officer are set out in a Board Charter.
To ensure compliance with the principles the company has established Board Committees and a number of policies and procedures including:
– Code of Conduct
– Whistleblower Policy
– Securities Trading Policy
– Risk Management Policy Summary
– Continuous Disclosure Policy
– Board / Directors’ performance Evaluation
– Communications Policy
For further information on corporate governance policies adopted by Austbrokers Holdings Limited including the Board Charter, Board Committee Terms of Reference and the policies and procedures referred to above, refer to the Corporate Governance Section in the Investor Relations centre on our website:
www.austbrokers.com.au
Structure of the Board
The skills, experience and expertise relevant to the position of Director held by each Director in office at the date of the annual report is included in the Directors’ Report. Directors of Austbrokers Holdings Limited are considered to be independent when they are independent of management and free from any business or other relationship that could materially interfere with – or could reasonably be perceived to materially interfere with – the exercise of their unfettered and independent judgment.
In the context of Director independence, ‘materiality’ is considered from both the company and individual Director perspective. The determination of materiality requires consideration of both quantitative and qualitative elements. An item is presumed to be quantitatively immaterial if it is equal to or less than 5% of the appropriate base amount. It is presumed to be material (unless there is qualitative evidence to the contrary) if it is equal to or greater than 10% of the appropriate base amount. Qualitative factors considered include whether
a relationship is strategically important, the competitive landscape, the nature of the relationship and the contractual or other arrangements governing it and other factors that point to the actual ability of the Director in question to shape the direction of the company’s loyalty.
Structure of the Board continued
In accordance with the definition of independence above, the materiality thresholds set, the following Directors of Austbrokers Holdings Limited constituting a majority of directors are considered to be independent:
Name Position
R.A. Longes Chairman, Non-executive Director
L.F. Earl Non-executive Director (passed away on 12 July 2010)
D.J. Harricks Non-executive Director
P. R. Shirriff Non-executive Director
There are procedures in place, agreed by the Board, to enable Directors in furtherance of their duties to seek independent professional advice at the company’s expense.
The term in office held by each Director in office at the date of this report is as follows:
Name Term in Office
R.A. Longes 5 years
W.L. McKeough 19 years
D.J. Harricks 5 years
P.R. Shirriff 25 years
For additional details regarding Board appointments, please refer to information included in the Directors’ Report and on our website.
Nomination Committee
The Board has established a Nomination Committee, which meets at least annually, to ensure that the Board continues to operate within the established guidelines, including when necessary selecting candidates for the position of Director. The Nomination Committee operates under Terms of Reference approved by the Board and comprises Non-executives Directors. The Nomination Committee comprised of the following:
R.A. Longes (Committee Chairman)
L.F. Earl (until 12 July 2010)
P.R. Shirriff
Audit and Risk Management Committee
The Board has established an Audit and Risk Management Committee, which operates under Terms of Reference approved by the Board. It is the Board’s responsibility to monitor that management ensure that an effective internal control framework exists within the entity. This includes internal controls to deal with both the effectiveness and efficiency of significant business processes, the safeguarding of assets, the maintenance of proper accounting records, and the reliability of financial information as well as non-financial considerations such as the benchmarking of operational key performance indicators. The Board has delegated responsibility for establishing and maintaining a framework of internal control and ethical standards to the Audit and Risk Management Committee.
The Committee also provides the Board with additional assurance regarding the reliability of financial information for inclusion in the financial reports. All members of the Audit and Risk Management Committee are Non-executive Directors.
For
per
sona
l use
onl
y

austbrokers annual report 2010 55
The members of the Audit and Risk Management Committee during the year, who were all considered independent, were:
D.J. Harricks (Committee Chairman)
R.A. Longes
P.R. Shirriff
The Audit Committee is responsible for monitoring the external audit process. The company has established a summary of procedures for ensuring the rotation, independence and competence of the external auditor which can be found on the company’s website.
For details on the number of meetings of the Audit and Risk Management Committee held during the year and the attendees at those meetings, refer to the Directors’ Report.
Remuneration and Succession Planning Committee
It is the company’s objective to provide maximum stakeholder benefit from the retention of a high quality Board and executive team by remunerating Directors and key executives fairly and appropriately with reference to relevant employment market conditions. To assist in achieving this objective, the Remuneration and Succession Committee links the nature and amount of executive Directors’ and officers’ emoluments to the company’s financial and operational performance. The expected outcomes of the remuneration structure are:
– Retention and motivation of key executives;
– Attraction of high quality management to the company; and
– Performance incentives that allow executives to share the success of Austbrokers Holdings Limited; and
– Retention and performance of Directors.
For a full discussion of the company’s remuneration philosophy and framework and the remuneration received by Directors and executives in the current period please refer to the remuneration report, which is contained within the Directors’ Report.
There is no scheme to provide retirement benefits, other than statutory superannuation, to Non-executive Directors.
The Board is responsible for determining and reviewing compensation arrangements for the Directors themselves and the Chief Executive Officer and executive team. The Board has established a Remuneration and Succession Planning Committee through the year, comprising three Non-executive Directors. Members of the Committee, who were all considered independent, throughout the year were:
R.A. Longes (Committee Chairman)
L.F. Earl (until 12 July 2010)
P.R. Shirriff
For details on the number of meetings of the Remuneration and Succession Committee held during the year and the attendees at those meetings, refer to the Directors’ Report.
Performance
The performance of the Board and key executives is reviewed regularly against both measurable and qualitative indicators. During the reporting period, the Nomination Committee conducted performance evaluations as set out in the Performance Evaluation Policy that involved an assessment of each Board member’s and key executive’s performance against specific and measurable qualitative and quantitative performance criteria. The performance criteria against which directors and executives are assessed are aligned with the financial and non-financial objectives of Austbrokers Holdings Limited. Directors whose performance is consistently unsatisfactory may be asked to retire.
For
per
sona
l use
onl
y

austbrokers annual report 201056
Consolidated
Notes 2010 2009
$’000 $’000
Revenue 4 (i) 87,084 78,089
Other income 4 (ii) 3,968 4,566
Share of profit of associates 4 (iii) 14,558 14,393
Other expenses 4 (iv) (76,562) (71,795)
Finance costs 4 (v) (2,451) (2,289)
Profit before tax and sale of interests in controlled entities, associates and broking portfolios
26,597 22,964
Profit from sale of interests in controlled entities, associates and broking portfolios 7 621 486
Profit before income tax 27,218 23,450
Income tax expense 5 5,898 4,932
Net Profit after tax for the period 21,320 18,518
Net profit after tax for the period attributable to:
Equity holders of the parent 18,189 15,903
Non-controlling interests 3,131 2,615
21,320 18,518
Basic earnings per share (cents per share) 6 35.3 31.7
Diluted earnings per share (cents per share) 6 34.9 31.4
For the year ended 30 June 2010
income statementF
or p
erso
nal u
se o
nly
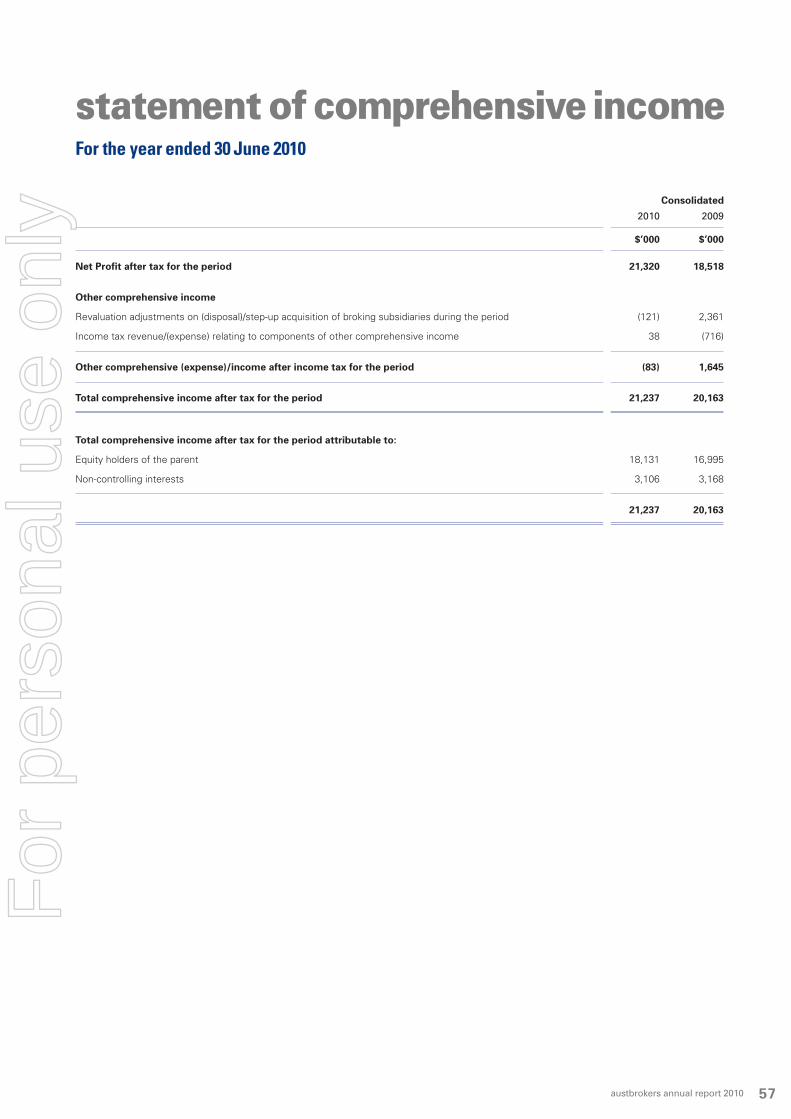
austbrokers annual report 2010 57
Consolidated
2010 2009
$’000 $’000
Net Profit after tax for the period 21,320 18,518
Other comprehensive income
Revaluation adjustments on (disposal)/step-up acquisition of broking subsidiaries during the period (121) 2,361
Income tax revenue/(expense) relating to components of other comprehensive income 38 (716)
Other comprehensive (expense)/income after income tax for the period (83) 1,645
Total comprehensive income after tax for the period 21,237 20,163
Total comprehensive income after tax for the period attributable to:
Equity holders of the parent 18,131 16,995
Non-controlling interests 3,106 3,168
21,237 20,163
For the year ended 30 June 2010
statement of comprehensive incomeF
or p
erso
nal u
se o
nly

austbrokers annual report 201058
As at 30 June 2010
statement of financial position
Consolidated
Notes 2010 2009
$’000 $’000
ASSETS
Current Assets
Cash and cash equivalents 7 23,840 17,047 Cash and cash equivalents - Trust 7 57,147 51,611Trade and other receivables 9 90,350 87,594 Other financial assets 10 1,461 703
Total Current Assets 172,798 156,955
Non-current Assets
Trade and other receivables 11 163 27 Investment in associates 12 72,177 67,561 Other financial assets 13 128 1,037 Property, plant and equipment 15 4,674 5,845 Intangible assets and goodwill 16 72,198 73,649 Deferred income tax asset 5 3,206 2,627
Total Non-current Assets 152,546 150,746
TOTAL ASSETS 325,344 307,701
LIABILITIES
Current Liabilities
Trade and other payables 19 138,196 141,488 Income tax payable 5 3,326 3,216 Provisions 20 7,452 6,822 Interest bearing loans and borrowings 21 481 611
Total Current Liabilities 149,455 152,137
Non-current Liabilities
Trade and other payables 19 – 28 Provisions 20 1,312 1,629 Deferred tax liabilities 5 5,585 6,048 Interest bearing loans and borrowings 21 34,418 33,606
Total Non-current Liabilities 41,315 41,311
TOTAL LIABILITIES 190,770 193,448
NET ASSETS 134,574 114,253
EQUITY
Issued capital 22 60,844 49,959 Retained earnings 56,387 48,301 Share based payments reserve 22 1,833 1,345 Asset revaluation reserve 22 3,234 3,788
Equity attributable to equity holders of the parent 122,298 103,393
Non-controlling interests 12,276 10,860
TOTAL EQUITY 134,574 114,253
For
per
sona
l use
onl
y

austbrokers annual report 2010 59
For the year ended 30 June 2010
statement of cash flows
Consolidated
Notes 2010 2009
$’000 $’000
CASH FLOWS FROM OPERATING ACTIVITIES
Dividends/trust distributions received 11,824 11,621
Interest received 2,799 4,566
Interest paid (2,451) (2,289)
Receipts from customers 84,280 64,409
Payments to suppliers and employees (61,078) (45,279)
Management fees received from associates / related entities 1,445 994
Income tax (paid) (7,035) (5,883)
NET CASH FLOWS FROM OPERATING ACTIVITIES 7 (a) 29,784 28,139
CASH FLOWS FROM INVESTING ACTIVITIES
Payment for new broking portfolios purchased by members of the economic entity 7 (b) (983) (5,323)
Net (payments)/proceeds received for new consolidated entities, net of cash acquired 7 (c),(d),(e),(f) (292) 1,505
Payment for new associates 7,(g),(h),(i) (480) (3,267)
Payment for increase in interests in controlled entity 7 (j),(k) – (600)
Proceeds from sale of consolidated broking portfolios 7 (m) – 403
Proceeds from reduction in interest in associates 7 (n) – 523
Net cash reduction on controlled entity becoming an associate 7 (o) (1,072) –
Proceeds from reduction in interest in controlled entities 7 (p),(q),(r) – 1,550
Payment for deferred settlement on prior year acquisitions (11,973) (14,138)
(Payment)/Proceeds from purchase/sale of other financial assets 166 (5)
Proceeds from sale of plant and equipment 312 360
Payment for plant and equipment (1,068) (2,086)
Advances of mortgages (399) (614)
Proceeds from mortgage repayments 384 2,251
NET CASH FLOWS (USED IN) INVESTING ACTIVITIES (15,405) (19,441)
CASH FLOWS FROM FINANCING ACTIVITIES
Dividends paid to shareholders (7,125) (9,281)
Dividends paid to shareholders of non controlling interests (2,186) (2,514)
Proceeds from issue of share capital 436 217
Net proceeds from dividend reinvestment plan 6,911 –
Net proceeds from borrowings and lease liabilities 906 11,721
Repayments from/(advances to) related entities (992) 1,161
NET CASH FLOWS (USED IN)/FROM FINANCING ACTIVITIES (2,050) 1,304
NET INCREASE IN CASH AND CASH EQUIVALENTS 12,329 10,002
Cash and cash equivalents at beginning of the period 68,658 58,656
CASH AND CASH EQUIVALENTS AT END OF PERIOD 7 (a) 80,987 68,658
For
per
sona
l use
onl
y

austbrokers annual report 201060
For the year ended 30 June 2010
statement of changes in equity
Attributable to equity holders of the parent Total equity
Asset Share based Issued Retained revaluation payment Capital earnings reserve reserve Total
CONSOLIDATED $’000 $’000 $’000 $’000 $’000 $’000 $’000
At 1 July 2008 49,707 41,097 3,278 816 94,898 8,771 103,669
Total comprehensive income for the year – 15,903 1,092 – 16,995 3,168 20,163
Issue of shares to non-controlling interests by subsidiaries and non-controlling interests relating to new acquisitions/sales – – – – – 1,435 1,435
Transfer from asset revaluation reserve for amortisation of broking register on step acquisition of broking subsidiaries – 831 (831) – – – –
Tax effect on transfer from asset revaluation reserve for amortisation of broking register on step acquisition of broking subsidiaries – (249) 249 – – – –
On 30 December 2008 allotted 108,300 shares at an issue price of $2.00 on exercise of options 217 – – – 217 – 217
Transfer from share based payment reserve on 108,300 options exercised at an option cost of 32 cents per share. 35 – – (35) – – –
Cost of share-based payment – – – 564 564 – 564
Equity dividends – (9,281) – – (9,281) (2,514) (11,795)
At 30 June 2009 49,959 48,301 3,788 1,345 103,393 10,860 114,253
Non-controlling interest
For
per
sona
l use
onl
y
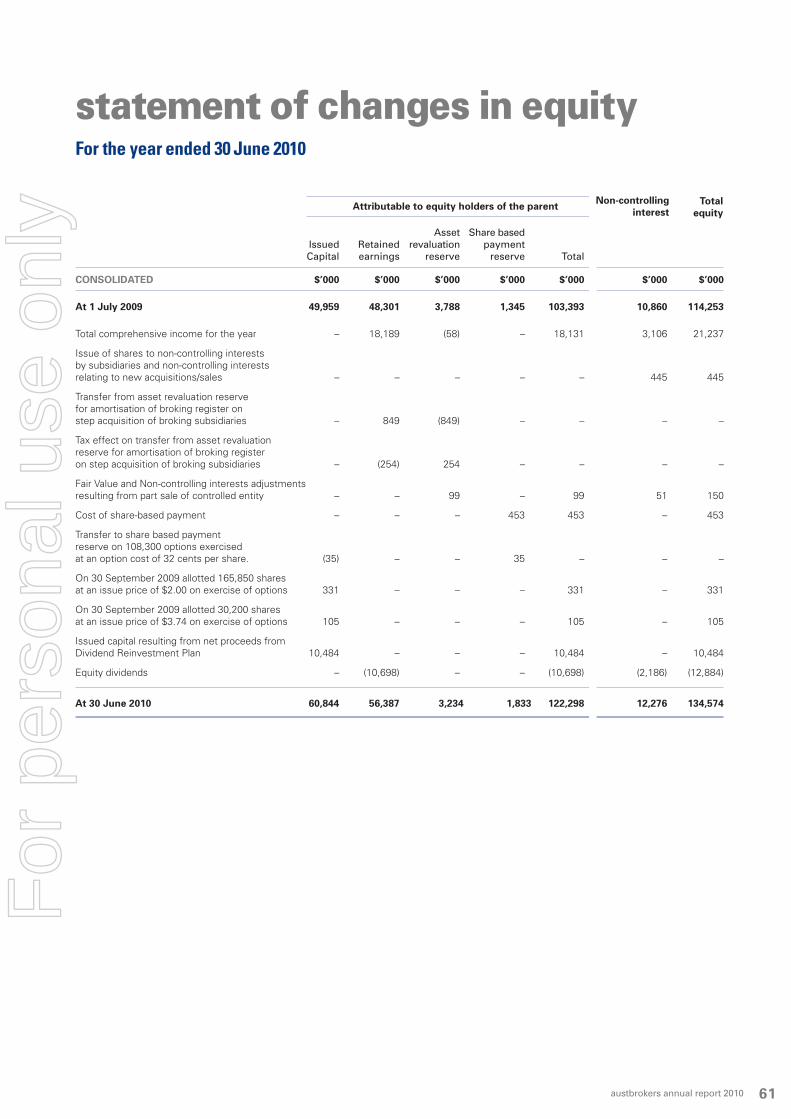
austbrokers annual report 2010 61
For the year ended 30 June 2010
statement of changes in equity
Attributable to equity holders of the parent Total equity
Asset Share based Issued Retained revaluation payment Capital earnings reserve reserve Total
CONSOLIDATED $’000 $’000 $’000 $’000 $’000 $’000 $’000
At 1 July 2009 49,959 48,301 3,788 1,345 103,393 10,860 114,253
Total comprehensive income for the year – 18,189 (58) – 18,131 3,106 21,237
Issue of shares to non-controlling interests by subsidiaries and non-controlling interests relating to new acquisitions/sales – – – – – 445 445
Transfer from asset revaluation reserve for amortisation of broking register on step acquisition of broking subsidiaries – 849 (849) – – – –
Tax effect on transfer from asset revaluation reserve for amortisation of broking register on step acquisition of broking subsidiaries – (254) 254 – – – –
Fair Value and Non-controlling interests adjustments resulting from part sale of controlled entity – – 99 – 99 51 150
Cost of share-based payment – – – 453 453 – 453
Transfer to share based payment reserve on 108,300 options exercised at an option cost of 32 cents per share. (35) – – 35 – – –
On 30 September 2009 allotted 165,850 shares at an issue price of $2.00 on exercise of options 331 – – – 331 – 331
On 30 September 2009 allotted 30,200 shares at an issue price of $3.74 on exercise of options 105 – – – 105 – 105
Issued capital resulting from net proceeds from Dividend Reinvestment Plan 10,484 – – – 10,484 – 10,484
Equity dividends – (10,698) – – (10,698) (2,186) (12,884)
At 30 June 2010 60,844 56,387 3,234 1,833 122,298 12,276 134,574
Non-controlling interest
For
per
sona
l use
onl
y

austbrokers annual report 201062
1. Corporate informationThe financial report of Austbrokers Holdings Limited for the year ended 30 June 2010 was authorised for issue in accordance with a resolution of the directors on 26 August 2010.
Austbrokers Holdings Limited is a company limited by shares incorporated in Australia whose shares are publicly traded on the Australian Securities Exchange.
The principal activities during the year of entities within the consolidated group, were the provision of general insurance broking services, distribution of ancillary products and conducting underwriting agency businesses.
2. Changes in accounting policies and disclosuresAASB 2 Share-based Payment (Revised)
The AASB issued an amendment to AASB 2 which clarifies the definition of vesting conditions and prescribes the treatment of an award that is cancelled. The Group adopted this amendment as of 1 July 2009. It did not have an impact on the financial position or performance of the Group.
AASB 3 Business Combinations (Revised) and AASB 127 Consolidated and Separate Financial Statements (Revised)
The Group adopted the revised standard and change in accounting policy prospectively from 1 July 2009. AASB 3 (Revised) introduced significant changes in the accounting for business combinations occurring after this date. Changes affect the valuation of non-controlling interest, the accounting for transaction costs, the initial recognition and subsequent measurement of a contingent consideration and business combinations achieved in stages. These changes will impact the amount of goodwill recognised, the reported results in the period that an acquisition occurs and future reported results.
AASB 127 (Revised) required that a change in the ownership interest in a subsidiary (without loss of control) is accounted for as a transaction with owners in their capacity as owners. Therefore, such transactions will no longer give rise to goodwill or a gain or loss. Furthermore, the amended standard changes the accounting for losses incurred by the subsidiary as well as the loss of control of a subsidiary. Where there is a change in ownership and the Group loses control, the gain or loss will be recognised in the Income statement. The carrying value of non-controlling interests must be reset to fair value. The changes by AASB 3 (Revised) and AASB 127 (Revised) have affected acquisitions or loss of control of subsidiaries and transactions with non-controlling interests from 1 July 2009.
3.1 Summary of significant accounting policies
(a) Basis of preparation of the financial report
The financial report is a general purpose financial report which has been prepared in accordance with the requirements of the Corporations Act 2001, Australian Accounting Standards and other authoritative pronouncements of the Australian Accounting Standards Board.
The financial report is presented in Australian dollars ($) and all values are rounded to the nearest $1000 (where rounding is applicable) under the option available to the Company under ASIC Class Order 98/0100. The Company is an entity to which the class order applies.
(b) Statement of compliance
The financial report complies with Australian Accounting Standards as issued by the Australian Accounting Standards Board and International Financial Reporting Standards (‘IFRS’) as issued by the International Accounting Standards Board.
(c) Basis of consolidation
The consolidated financial statements are those of the consolidated entity, comprising Austbrokers Holdings Limited (the parent company) and all entities that Austbrokers Holdings Limited controlled from time to time during the year and at the reporting date.
Information from the financial statements of controlled entities is included from the date the parent entity obtains control until such time as control ceases. Where there is a loss of control of a controlled entity, the consolidated financial statements include the results for the part of the reporting period during which the parent entity had control.
The financial information in respect of controlled entities is prepared for the same reporting period as the parent company using consistent accounting policies. Adjustments are made to bring into line dissimilar accounting policies that may exist.
All intercompany balances and transactions including unrealised profits arising from intra-group transactions, have been eliminated in the consolidated accounts. Unrealised losses are eliminated unless costs cannot be recovered.
Non controlling interests represent the portion of profit or loss and net assets in subsidiaries which are not 100% owned by the Austbrokers Group. These are presented separately in the income statement and within equity in the consolidated statement of financial position. When the Group acquires a non controlling interest in a subsidiary, the transaction is accounted for as a transaction between owners in their capacities as owners and the difference between purchase price and recorded value of non controlling interest is accounted for as an equity transaction.
(d) Earnings per share
Basic earnings per share is calculated as net profit attributable to members of the parent, adjusted to exclude any costs of servicing equity (other than dividends) and preference share dividends, divided by the weighted average number of ordinary shares, adjusted for any bonus element.
Diluted earnings per share is calculated as net profit attributable to members of the parent, adjusted for:
– costs of servicing equity (other than dividends) and preference share dividends;
– the after tax effect of dividends and interest associated with dilutive potential ordinary shares that have been recognised as expenses; and
– other non-discretionary changes in revenues or expenses during the period that would result from the dilution of potential ordinary shares;
divided by the weighted average number of ordinary shares and dilutive potential ordinary shares, adjusted for any bonus element.
(e) Significant accounting judgements, estimates and assumptions
The preparation of the financial statements requires management to make judgements, estimates and assumptions that affect the reported amounts in the financial statements. Management continually evaluates its judgements and estimates in relation to assets, liabilities, contingent liabilities, revenue and expenses. Management bases its judgements and estimates on historical experience and on other various factors it believes to be reasonable under the circumstances, the result of which form the basis of the carrying values of assets and liabilities that are not readily apparent from other sources. Actual results may differ from these estimates under different assumptions and conditions.
Management has identified the following critical accounting policies for which significant judgements, estimates and assumptions are made. Actual results may differ from these estimates under different assumptions and conditions and may materially affect financial results or the financial position reported in future periods.
For the year ended 30 June 2010
notes to the financial statementsF
or p
erso
nal u
se o
nly

austbrokers annual report 2010 63
Further details of the nature of these assumptions and conditions may be found in the relevant notes to the financial statements.
(i) Significant accounting judgements
Deferred tax assets are recognised for deductible temporary differences as management considers that it is probable that future tax profits will be available to utilise those temporary differences.
(ii) Significant accounting estimates and assumptions
The carrying amounts of certain assets and liabilities are often determined based on estimates and assumptions of future events. The key estimates and assumptions that have a significant risk of causing a material adjustment to the carrying amounts of certain assets and liabilities within the next annual reporting period are:
Impairment of goodwill
The Group determines whether goodwill is impaired at least on an annual basis. This requires an estimation of the recoverable amount of the cash-generating units to which the goodwill is allocated. The assumptions used in this estimation of recoverable amount and the carrying amount of goodwill is discussed in note 17.
Share-based payment transactions
The Group measures the cost of equity-settled transactions with employees by reference to the fair value of the options at the date at which they are granted. The fair value is determined by an external valuer using a binomial model, using the assumptions detailed in note 18.
Net assets acquired in a business combination
The Group measures the net assets acquired in a business combination at their fair value at the date of acquisition. Fair value is estimated with reference to market transactions for similar assets or Discounted Cash Flow (DCF) analysis.
Estimation of useful lives of assets
The estimation of useful lives of assets has been based on historical experience as well as lease terms for office fitouts. In addition, the condition of the asset is assessed at least once per year and considered against the remaining useful life. Adjustments to useful lives are made when considered necessary.
(f) Revenue recognition
Revenue is recognised to the extent that it is probable that the economic benefits will flow to the entity and the revenue can be reliably measured. The following specific recognition criteria must also be met before revenue is recognised:
Commission, brokerage and fees
Commission, brokerage and fees are recognised when it is probable that the Group will be compensated for services rendered and the amount of consideration for such services can be reliably measured. This is deemed to be the invoice date. An allowance is made for anticipated lapses and cancellations.
Interest
Revenue is recognised as interest accrues using the effective interest method.
Dividends and Distributions from trusts
Revenue is recognised when the shareholder’s right to receive the payment is established.
(g) Cash and cash equivalents
Cash and cash equivalents and cash and cash equivalents - trusts (trust cash) in the statement of financial condition comprise cash at bank, in hand and short-term deposits with an original maturity of three months or less.
Trust cash relates to cash held for insurance premiums received from policyholders which will ultimately be paid to underwriters.
Trust cash cannot be used to meet business obligations/operating expenses other than payments to underwriters and/or refunds to policyholders.
For the purposes of the Statement of Cash Flows, cash and cash equivalents as defined above are shown net of outstanding bank overdrafts.
(h) Leases
The determination of whether an arrangement is or contains a lease is based on the substance of the arrangement. This requires an assessment of whether the fulfilment of the arrangement is dependent on the use of a specific asset or assets and the arrangement conveys a right to use the asset.
Leases where the lessor retains substantially all the risks and benefits of ownership are classified as operating leases.
Finance leases, which transfer to the Group substantially all the risks and benefits incidental to ownership of the leased item, are capitalised at the inception of the lease at the fair value of the leased property or, if lower, at the present value of the minimum lease payments. Lease payments are apportioned between the finance charges and reduction of the lease liability so as to achieve a constant rate of interest on the remaining balance of the liability. Finance charges are recognised as an expense in profit or loss.
Capitalised leased assets are depreciated over the shorter of the estimated useful life of the asset and the lease term if there is no reasonable certainty that the Group will obtain ownership by the end of the lease term.
Operating lease payments are recognised as an expense in the income statement on a straight-line basis over the lease term. Lease incentives are recognised in the income statement as an integral part of the total lease expense.
(i) Trade and other receivables
Trade and other receivables which generally have 30 day credit terms, are recognised and carried at original amount less an allowance for lapses and cancellations. An estimate for doubtful debts is made when collection of the full amount is no longer probable. Bad debts are written-off when identified.
(j) Investment in associates
The Group’s investments in its associates are accounted for under the equity method of accounting in the consolidated financial statements. These are entities in which the Group has significant influence and which are not subsidiaries. The Group deems they have significant influence if they have more than 20% of the voting rights.
The financial statements of the associates are used by the Group to apply the equity method. The reporting dates of the associates and the Austbrokers Group are identical and adjustments are made to bring into line dissimilar accounting policies used by associates.
The investment in associates is carried in the consolidated balance sheet at cost plus post-acquisition changes in the Group’s share of net assets of the associates, less dividends and any impairment in value. The consolidated income statement reflects the Group’s share of the results of operations of the associates.
Where there has been a change recognised directly in the associate’s equity, the Group recognises its share of any changes and discloses this, when applicable, in the statement of comprehensive income.
For
per
sona
l use
onl
y

austbrokers annual report 201064
(k) Interest-bearing loans and borrowings
All loans and borrowings are initially recognised at cost, being the fair value of the consideration received net of issue costs associated with the borrowing process. After initial recognition, interest-bearing loans and borrowings are subsequently measured at amortised cost using the effective interest method. Amortised cost is calculated by taking into account any issue costs, and any discount or premium on settlement.
Gains and losses are recognised in profit or loss when the liabilities are derecognised.
Borrowing costs
Borrowing costs are recognised as an expense when incurred.
(l) Trade and other payables
Liabilities for trade creditors and other amounts are carried at amortised cost which is the fair value of the consideration to be paid in the future for goods and services received, whether or not billed to the entity. Payables to related parties are carried at the principal amount. Interest, when charged, is recognised as an expense on an accrual basis.
Payables are normally settled on 90 day terms.
(m) Business combinations
The acquisition method of accounting is used to account for all business combinations. Cost is measured as the fair value of the assets given, shares issued or liabilities assumed at the date of exchange. All acquisition costs including stamp duty and legal fees are charged against profits as incurred. Prior to 1 July 2009, all acquisition costs were included in the cost of the business combination.
Changes in the ownership interest in a controlled entity (without loss of control) is accounted for as a transaction with owners in their capacity as owners and these transactions will no longer give rise to a gain or loss. Where there is a change in ownership and the Group loses control, the gain or loss will be recognised in the Income Statement. The carrying value of non-controlling interests must be reset to fair value. Prior to 1 July 2009, upon loss of control, the Group accounted for the investment retained at its proportionate share of net asset value at the date control was lost.
In the year a new business is acquired, an estimate must be made of the fair value of the future contingent consideration. Any variation to this amount in future periods (either up or down) will be recognised through the Income Statement. Over accruals are recognized as income in the year the amount is reversed and any under accruals are charged as an expense against profits. Prior to 1 July 2009, subsequent adjustments to contingent considerations were adjusted against goodwill.
All identifiable assets acquired and liabilities and contingent liabilities assumed in the business combination are measured initially at their fair values at the acquisition date, irrespective of the extent of any non controlling interests.
(i) Goodwill
Goodwill on acquisition is initially measured at cost, being the excess of the cost of the business combination over the acquirer’s interest in the fair value of the identifiable net assets acquired at the date of acquisition.
Following initial recognition, goodwill is measured at cost less any accumulated impairment losses and is not amortised.
Goodwill is reviewed for impairment annually, or more frequently if events or changes in circumstances indicate that the carrying value may be impaired.
As at the acquisition date, any goodwill acquired is allocated to each of the cash-generating units expected to benefit from the combination’s synergies. Impairment is determined by assessing the recoverable amount of the cash-generating unit to which
the goodwill relates. Where the recoverable amount of the cash-generating unit is less than the carrying amount, an impairment loss is recognised.
Where goodwill forms part of a cash-generating unit and part of the operation of that unit is disposed, the goodwill associated with the operation disposed of, is included in the carrying amount of the operation when determining the gain or loss on disposal of the operation.
Impairment losses recognised for goodwill cannot be subsequently reversed.
(ii) Intangible assets - Insurance Broking Register
Intangible assets acquired separately or in a business combination are initially measured at cost. The cost of an intangible asset acquired in a business combination is its fair value as at the date of acquisition. Following initial recognition, intangible assets are carried at cost less any accumulated amortisation and any accumulated impairment costs. Internally generated intangible assets are not capitalised and expenditure is charged against profits in the year in which the expenditure is incurred.
The useful lives of these intangible assets are assessed to be finite. Intangible assets with finite lives are amortised over the useful life, currently estimated to be 10 years, and assessed for impairment whenever there is an indication that the intangible asset may be impaired. The amortisation period and the amortisation method for an intangible asset with a finite useful life is reviewed at least at each financial year-end. Changes in the expected useful life or the expected pattern of consumption of future economic benefits embodied in the asset are accounted for by changing the amortisation period or method, as appropriate, which is a change in accounting estimate. The amortisation expense on intangible assets with finite lives is recognised in the expense category of the income statement consistent with the function of the intangible asset.
Gains or losses arising from derecognition of an intangible asset are measured as the difference between the net disposal proceeds and the carrying amount of the asset and are recognised in profit or loss when the asset is derecognised.
Revaluation
From 1 July 2009, when a business combination occurs, the acquiree’s identifiable assets and liabilities are notionally restated to their fair value at the date of the exchange transaction to determine the amount of any goodwill associated with the transaction. Any adjustment to those fair values relating to previously held interests of the acquiree is accounted for as an adjustment to fair value and the movement is reflected in the income statement as either a profit or loss. Prior to 1 July 2009, adjustments to fair value were accounted for as a revaluation. This revaluation which related to broking registers was credited to the asset revaluation reserve and included in the equity section of the statement of financial position.
For revaluations that occurred prior to 1 July 2009, an annual transfer from the asset revaluation reserve to retained earnings is made for the difference between amortisation based on the revalued carrying amounts of the broking register and amortisation based on the broking registers’ original costs.
Upon disposal, any revaluation reserve relating to the particular broking register being sold is transferred to retained earnings.
(n) Investments and other financial assets
Loans and Receivables
Loans and receivables, including mortgages, are non-derivative financial assets with fixed or determinable payments that are not quoted in an active market. Such assets are carried at amortised cost using the effective interest method. Gains and losses are recognised in the income statement when the loans and receivables are derecognised or impaired, as well as through the amortisation process.
For the year ended 30 June 2010
notes to the financial statementsF
or p
erso
nal u
se o
nly

austbrokers annual report 2010 65
(o) Derecognition of financial assets and financial liabilities
(i) Financial assets
A financial asset (or, where applicable, a part of a financial asset or part of a group of similar financial assets) is derecognised when:
– the rights to receive cash flows from the asset have expired;
– the Group retains the right to receive cash flows from the asset, but has assumed an obligation to pay them in full without material delay to a third party under a ‘pass-through’ arrangement; or
– the Group has transferred its rights to receive cash flows from the asset and either (a) has transferred substantially all the risks and rewards of the asset, or (b) has neither transferred nor retained substantially all the risks and rewards of the asset, but has transferred control of the asset.
When the Group has transferred its rights to receive cash flows from an asset and has neither transferred or retained substantially all the risks and rewards of the asset nor transferred control of the asset, the asset is recognised to the extent of the Group’s continuing involvement in the asset. Continuing involvement that takes the form of a guarantee over the transferred asset is measured at the lower of the original carrying amount of the asset and the maximum amount of consideration received that the Group could be required to repay.
When continuing involvement takes the form of a written and/or purchased option on the transferred asset, the extent of the Group’s continuing involvement is the amount of the transferred asset that the Group may repurchase, except that in the case of a written put option on an asset measured at fair value, the extent of the Group’s continuing involvement is limited to the lower of the fair value of the transferred asset and the option exercise price.
(ii) Financial liabilities
A financial liability is derecognised when the obligation under the liability is discharged or cancelled or expires.
When an existing financial liability is replaced by another from the same lender on substantially different terms, or the terms of an existing liability are substantially modified, such an exchange or modification is treated as a derecognition of the original liability and the recognition of a new liability, and the difference in the respective carrying amounts is recognised in profit or loss.
(p) Impairment of financial assets
(i) Financial assets carried at amortised cost
If there is objective evidence that an impairment loss on loans and receivables carried at amortised cost has been incurred, the amount of the loss is measured as the difference between the asset’s carrying amount and the present value of estimated future cash flows (excluding future credit losses that have not been incurred) discounted at the financial asset’s original effective interest rate (i.e. the effective interest rate computed at initial recognition). The carrying amount of the asset is reduced either directly or through use of an allowance account. The amount of the loss is recognised in profit or loss.
The Group first assesses whether objective evidence of impairment exists individually for financial assets that are individually significant, and individually or collectively for financial assets that are not individually significant. If it is determined that no objective evidence of impairment exists for an individually assessed financial asset, whether significant or not, the asset is included in a group of financial assets with similar credit risk characteristics and that group of financial assets is collectively assessed for impairment. Assets that are individually assessed for impairment and for which an impairment loss is or continues to be recognised are not included in a collective assessment of impairment.
If, in a subsequent period, the amount of the impairment loss decreases and the decrease can be related objectively to an event occurring after the impairment was recognised, the previously recognised impairment loss is reversed. Any subsequent reversal of an impairment loss is recognised in profit or loss, to the extent that the carrying value of the asset does not exceed its amortised cost at the reversal date.
(ii) Financial assets carried at cost
If there is objective evidence that an impairment loss has been incurred on an unquoted equity instrument that is not carried at fair value, the amount of the loss is measured as the difference between the asset’s carrying amount and the present value of estimated future cash flows, discounted at the current market rate of return for a similar financial asset.
(q) Impairment of assets
The Group assesses at each reporting date whether there is an indication that an asset may be impaired. If any such indication exists, or when annual impairment testing for an asset is required, the Group makes an estimate of the asset’s recoverable amount. An asset’s recoverable amount is the higher of its fair value less costs to sell and its value in use and is determined for an individual asset, unless the asset does not generate cash inflows that are largely independent of those from other assets or groups of assets and the asset’s value in use cannot be estimated to be close to its fair value. In such cases the asset is tested for impairment as part of the cash-generating unit to which it belongs. When the carrying amount of an asset or cash- generating unit exceeds its recoverable amount, the asset or cash- generating unit is considered impaired and is written down to its recoverable amount.
In assessing value in use, the estimated future cash flows are discounted to their present value using a pre-tax discount rate that reflects current market assessments of the time value of money and the risks specific to the asset. Impairment losses relating to continuing operations are recognised in those expense categories consistent with the function of the impaired asset unless the asset is carried at revalued amount (in which case the impairment loss is treated as a revaluation decrease).
An assessment is also made at each reporting date as to whether there is any indication that previously recognised impairment losses may no longer exist or may have decreased. If such indication exists, the recoverable amount is estimated. A previously recognised impairment loss is reversed only if there has been a change in the estimates used to determine the asset’s recoverable amount since the last impairment loss was recognised. If that is the case the carrying amount of the asset is increased to its recoverable amount. That increased amount cannot exceed the carrying amount that would have been determined, net of depreciation, had no impairment loss been recognised for the asset in prior years. Such reversal is recognised in profit or loss unless the asset is carried at revalued amount, in which case the reversal is treated as a revaluation increase. After such a reversal the depreciation charge is adjusted in future periods to allocate the asset’s revised carrying amount, less any residual value, on a systematic basis over its remaining useful life.
(r) Provisions and employee benefits
Provisions are recognised when the Group has a present obligation (legal or constructive) as a result of a past event and it is probable that an outflow of resources embodying economic benefits will be required to settle the obligation and a reliable estimate can be made of the amount of the obligation.
If the effect of the time value of money is material, provisions are determined by discounting the expected future cash flows at a pre-tax rate that reflects current market assessments of the time value of money and, where appropriate, the risks specific to the liability.
For
per
sona
l use
onl
y

austbrokers annual report 201066
Where discounting is used, the increase in the provision due to the passage of time is recognised as a finance cost.
Employee benefits
Liabilities for employee entitlements to annual leave and other current entitlements are accrued at amounts calculated on the basis of current wage and salary rates, including package costs and on-costs. Liabilities for non accumulating sick leave are recognised when the leave is taken and are measured at the rate paid or payable.
Liabilities for employee entitlements to long service leave, which are not expected to be settled within twelve months after balance date, are accrued at the present value of the future amounts to be made in respect of services provided by employees up to the reporting date using the projected unit credit method. Consideration is given to expected future wage and salary level, experience of employee departures and periods of service. The discount factor applied to all such future payments is determined using interest rates attaching, as at the reporting date, to national government guaranteed securities with terms to maturity that match, as closely as possible, the estimated future cash outflows.
Any contributions made to the accumulation superannuation funds by entities within the Group are charged against profits when due.
(s) Issued capital
Ordinary share capital is recognised at the fair value of the consideration received by the company.
Ordinary shares have the right to receive dividends as declared and, in the event of winding up the company, to participate in the proceeds from the sale of all surplus assets in proportion to the number of and amounts paid up on shares held.
Ordinary shares entitle their holder to one vote, either in person or by proxy, at a meeting of the company.
(t) Share-based payment transactions
The Group provides benefits to employees (including executive directors) of the Group in the form of share-based payments, whereby employees render services in exchange for shares or rights over shares (‘equity-settled transactions’).
A plan is currently in place to provide an Employee Share Options Plan (ESOP), which provides benefits to executive directors and senior executives.
The cost of these equity-settled transactions with employees is measured by reference to the fair value of the equity instruments at the date at which they are granted. The fair value is determined by an external valuer using a binomial model, further details of which are given in note 18.
In valuing equity-settled transactions, no account is taken of any performance conditions, other than conditions linked to the price of the shares of Austbrokers Holdings Limited (market conditions) if applicable.
The cost of equity-settled transactions is recognised, together with a corresponding increase in equity, over the period in which the performance and/or service conditions are fulfilled, ending on the date on which the relevant employees become fully entitled to the award (the vesting period).
The cumulative expense recognised for equity-settled transactions at each reporting date until vesting date reflects (i) the extent to which the vesting period has expired and (ii) the Group’s best estimate of the number of equity instruments that will ultimately vest. No adjustment
is made for the likelihood of market performance conditions being met as the effect of these conditions is included in the determination of fair value at grant date. The income statement charge or credit for a period represents the movement in cumulative expense recognised as at the beginning and end of that period.
No expense is recognised for awards that do not ultimately vest, except for awards that are cancelled or where vesting is only conditional upon a market condition.
In the event options are cancelled, or cancelled and reissued, the unexpensed cost for these is brought forward and immediately charged against profits in addition to the charge for any reissued/new options.
If the terms of an equity-settled award are modified, as a minimum an expense is recognised as if the terms had not been modified. In addition, an expense is recognised for any modification that increases the total fair value of the share-based payment arrangement, or is otherwise beneficial to the employee as measured at the date of modification.
The dilutive effect, if any, of outstanding options is reflected as additional share dilution in the computation of earnings per share (see note 6).
(u) Plant and equipment
Plant and equipment, is stated at cost less depreciation and any impairment in value.
Depreciation is calculated on a straight-line over the estimated useful life of the asset as follows:
Motor vehicles 5 to 8 years
Plant and equipment 5 to 10 years
Impairment
The carrying value of plant and equipment is reviewed for impairment at each reporting date, with recoverable amount being estimated when events or changes in circumstances indicate the carrying value may be impaired.
For an asset that does not generate largely independent cash inflows, the recoverable amount is determined for the cash generating unit to which the asset belongs. If any such indication exists and where the carrying value exceeds the estimated recoverable amount, the asset or cash generating unit are written down to their recoverable amount.
Derecognition and disposal
An item of property, plant and equipment is derecognised upon disposal or when no further future economic benefits are expected from its use or disposal.
Any gain or loss arising on derecognition of the asset (calculated as the difference between the net disposal proceeds and the carrying amount of the asset) is included in profit or loss in the year the asset is derecognised.
(v) Income tax
Current tax assets and liabilities for the current and prior periods are measured at the amount expected to be recovered from or paid to the taxation authorities. The tax rates and tax laws used to compute the amount are those that are enacted or substantively enacted by the balance sheet date.
Deferred income tax is provided on all temporary differences at the balance sheet date between the tax bases of assets and liabilities and their carrying amounts for financial reporting purposes.
For the year ended 30 June 2010
notes to the financial statementsF
or p
erso
nal u
se o
nly

austbrokers annual report 2010 67
Deferred income tax liabilities are recognised for all taxable temporary differences except:
– when the deferred income tax liability arises from the initial recognition of goodwill or of an asset or liability in a transaction that is not a business combination and, at the time of the transaction, affects neither the accounting profit nor taxable profit or loss ; or
– when the taxable temporary differences associated with investments in subsidiaries, associates or interests in joint ventures, and the timing of the reversal of the temporary difference can be controlled and it is probable that the temporary differences will not reverse in the foreseeable future.
Deferred income tax assets are recognised for all deductible temporary differences, carry-forward of unused tax assets and unused tax losses, to the extent that it is probable that taxable profit will be available against which the deductible temporary differences and the carry-forward of unused tax credits and unused tax losses can be utilised, except:
– when the deductible temporary differences arise from the initial recognition of an asset or liability in a transaction that is not a business combination and, at the time of the transaction, affects neither the accounting profit nor taxable profit or loss; or
– when the deductible temporary differences associated with investments in subsidiaries, associates or interests in joint ventures, in which case a deferred tax asset is only recognised to the extent that it is probable that the temporary difference will reverse in the foreseeable future and taxable profit will be available against which the temporary difference can be utilised.
The carrying amount of deferred income tax assets is reviewed at each balance sheet date and reduced to the extent that it is no longer probable that sufficient taxable profit will be available to allow all or part of the deferred income tax asset to be utilised.
Unrecognised deferred income tax assets are reassessed at each balance sheet date and are recognised to the extent that it has become probable that future taxable profit will allow the deferred tax asset to be recovered.
Deferred income tax assets and liabilities are measured at the tax rates that are expected to apply to the year when the asset is realised or the liability is settled, based on tax rates (and tax laws) that have been enacted or substantively enacted at the balance sheet date.
Income taxes relating to items recognised directly in equity are recognised in equity and not in profit or loss.
Deferred tax assets and deferred tax liabilities are offset only if a legally enforceable right exists to set off current tax assets against current tax liabilities and the deferred tax assets and liabilities relate to the same taxable entity and the same taxation authority.
(w) Other taxes
Revenues, expenses and assets are recognised net of the amount of goods and services tax (GST) except:
– when the GST incurred on a purchase of goods and services is not recoverable from the taxation authority, in which case the GST is recognised as part of the cost of acquisition of the asset or as part of the expense item as applicable; and
– receivables and payables, which are stated with the amount of GST included.
The net amount of GST recoverable from, or payable to, the taxation authority is included as part of receivables or payables in the balance sheet.
Cash flows are included in the Cash Flows Statement on a gross basis and the GST component of cash flows arising from investing and financing activities, which is recoverable from, or payable to, the taxation authority are classified as operating cash flows.
Commitments and contingencies are disclosed net of the amount of GST recoverable from, or payable to, the taxation authority.
(x) Operating Segments
An operating segment is a component of an entity that engages in business activities from which it may earn revenues and incur expenses, whose operating results are regularly reviewed by the entity’s chief operating decision maker (CODM) to make decisions about resources to be allocated to the segment and assess its performance and for which discrete financial information is available.
The company’s corporate structure includes equity investments in insurance intermediary entities. Discrete financial information about each of these entities is reported to management on a regular basis and accordingly management considers each entity to be a discrete operating segment of the business. The company believes that all of the Group’s equity investments in insurance intermediary entities exhibit similar economic characteristics and have therefore been aggregated into a single reporting segment, being the general insurance intermediary sector. This assessment is based on each of the operating segments having similar products and services, similar types of customer, employing similar operating processes and procedures and operating within a common regulatory environment.
However, an operating segment that does not meet the aggregation criteria is still reported separately where information about the segment would be useful for the users of the financial statements. Information about other business activities and operating segments that are below the quantitative criteria are combined and disclosed in a separate category.
For
per
sona
l use
onl
y

austbrokers annual report 201068
3.2 New accounting standards and interpretations
Certain Australian Accounting Standards and interpretations have recently been issued or amended but are not yet effective and have not been adopted by the group for the year end reporting period 30 June 2010. The directors have assessed the impact of these new or amended standards and interpretations (to the extent relevant to the group) as follows:
Reference Title SummaryApplication
date of standardImpact on
financial reportApplication
date for Group
Annual Improvements Project (issued 2009)
AASB 107 Statement of Cash Flows
Classification of expenditures on unrecognised assets. Only expenditure that results in a recognised asset can be classified as a cash flow from investing activities.
1 July 2010 No change other than potentially reporting expenditure in a different classification.
30 June 2011
Annual Improvements Project (issued 2009)
AASB 117 Leases
Classification of land and buildings. The specific guidance on classifying land as a lease has been removed so that only the general guidance remains.
1 July 2010 No change other than removing the classification of a lease as Land and buildings. This is not expected to have any impact on Austbrokers Holdings Limited reports.
30 June 2011
Annual Improvements Project (issued 2009)
AASB 136 Impairment of Assets
The largest unit permitted for allocating goodwill acquired in a business combination is the operating segment defined in AASB 8 before aggregation for reporting purposes.
1 July 2010 Not expected to impact our results as impairment testing has been carried out on individual cash generating units.
30 June 2011
Group Cash-settled Share-based Payment Transactions (amendments to AASB 2)
AASB 2009-8 [AASB 2]
These amendments to AASB 2 consist of three basic amendments:
(a) Definition of share based transactions and arrangements
(b) Scope of AASB 2
(c) Guidance on accounting for group cash-settled share-based payment transactions
1 Jan 2010 Not expected to impact results as the Group does not have cash settled share based Payment transactions.
30 June 2011
For the year ended 30 June 2010
notes to the financial statementsF
or p
erso
nal u
se o
nly

austbrokers annual report 2010 69
Consolidated
2010 2009
$’000 $’000
4. Revenue and expenses(i) Revenue
Commission, Brokerage and Fee Income 85,639 77,095
Management fees received 1,445 994
Total revenue 87,084 78,089
(ii) Other income
Dividends received from other persons 3 –
Interest from other persons/corporations 2,799 3,587
Other income 1,166 979
Total other income 3,968 4,566
(iii) Share of profit of associates
Share of Net Profits of Associates Accounted for using the Equity Method before amortisation 15,788 15,805
Amortisation of Intangibles - Associated Entities (1,230) (1,412)
Total share of profit of associates 14,558 14,393
(iv) Other expenses
Amortisation of Intangibles - controlled entities 2,530 2,379
Salaries and wages 45,117 42,113
Share-based payments 453 564
Audit fees 1,084 1,126
Travel/Telephone/ Motor/Stationery 3,911 3,660
Depreciation of property plant and equipment 1,674 1,654
Other expenses 10,617 9,418
Rent (operating leases) 4,108 3,932
Commission Paid 5,305 5,121
Insurance 1,763 1,828
Total other expenses 76,562 71,795
(v) Finance costs
Borrowing costs 2,451 2,289
Total finance costs 2,451 2,289
(vi) Profit from sale of interests in associates and controlled entities
Profit from sale of interests in associates and controlled entities 66 486
Adjustment to fair value of a controlled entity on the date it became an associate 555 –
Total profit from sale of interests in associates and controlled entities 621 486
For
per
sona
l use
onl
y
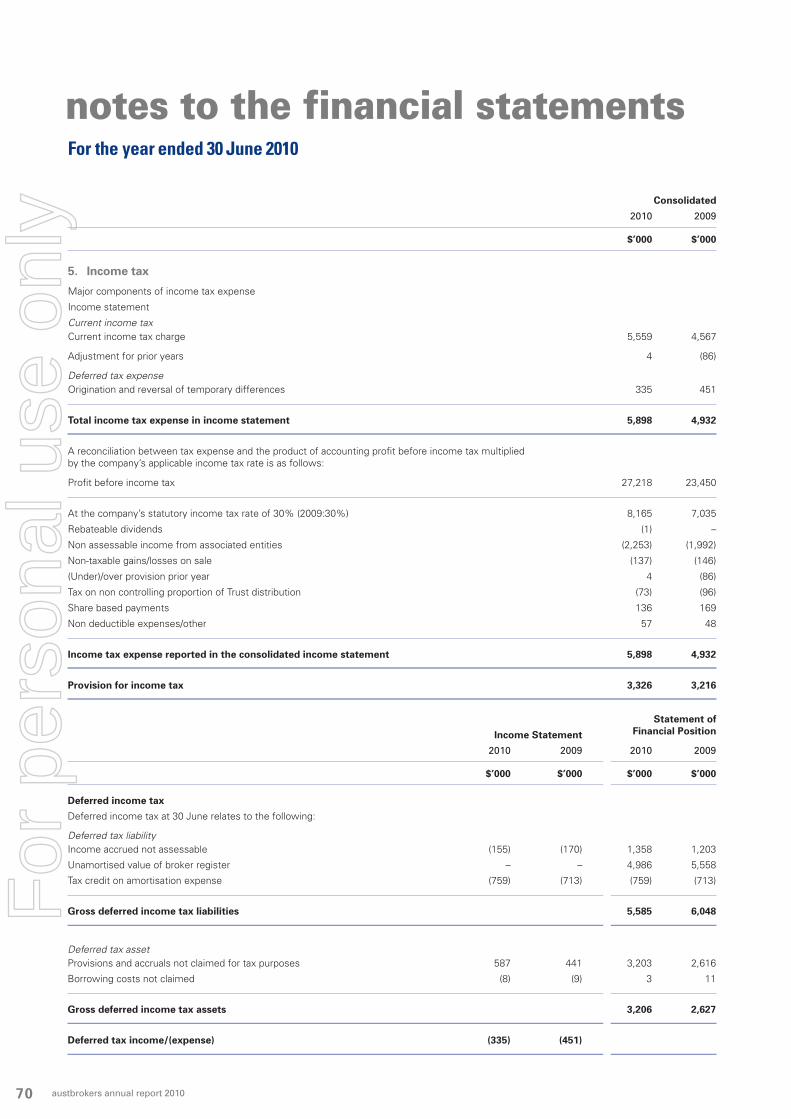
austbrokers annual report 201070
Consolidated
2010 2009
$’000 $’000
5. Income tax
Major components of income tax expense
Income statement
Current income taxCurrent income tax charge 5,559 4,567
Adjustment for prior years 4 (86)
Deferred tax expenseOrigination and reversal of temporary differences 335 451
Total income tax expense in income statement 5,898 4,932
A reconciliation between tax expense and the product of accounting profit before income tax multiplied by the company’s applicable income tax rate is as follows:
Profit before income tax 27,218 23,450
At the company’s statutory income tax rate of 30% (2009:30%) 8,165 7,035
Rebateable dividends (1) –
Non assessable income from associated entities (2,253) (1,992)
Non-taxable gains/losses on sale (137) (146)
(Under)/over provision prior year 4 (86)
Tax on non controlling proportion of Trust distribution (73) (96)
Share based payments 136 169
Non deductible expenses/other 57 48
Income tax expense reported in the consolidated income statement 5,898 4,932
Provision for income tax 3,326 3,216
Income Statement
2010 2009 2010 2009
$’000 $’000 $’000 $’000
Deferred income tax
Deferred income tax at 30 June relates to the following:
Deferred tax liabilityIncome accrued not assessable (155) (170) 1,358 1,203
Unamortised value of broker register – – 4,986 5,558
Tax credit on amortisation expense (759) (713) (759) (713)
Gross deferred income tax liabilities 5,585 6,048
Deferred tax assetProvisions and accruals not claimed for tax purposes 587 441 3,203 2,616
Borrowing costs not claimed (8) (9) 3 11
Gross deferred income tax assets 3,206 2,627
Deferred tax income/(expense) (335) (451)
Statement of Financial Position
For the year ended 30 June 2010
notes to the financial statementsF
or p
erso
nal u
se o
nly

austbrokers annual report 2010 71
5. Income tax (continued)
Tax consolidation
For the purposes of income taxation, Austbrokers Holdings Ltd entered into a Consolidated Tax Group with its 100% owned subsidiaries. Tax consolidation results in the subsidiary members being treated as part of the Head Company for tax purposes rather than as a separate taxpayers.
The Income Tax Assessment Act (1997) provides that the Consolidated Tax Group is to be treated as a single entity for Australian tax purposes with the Head Company responsible for the tax payable. Austbrokers Holdings Ltd formally notified the Australian Taxation Office of its adoption of the tax consolidation regime by lodging notice with the Australian Taxation Office.
The Consolidated Tax Group was formalised by entering into tax sharing and tax funding agreements in order to allocate income tax payable to group members. Each member of the group calculates tax expense on an entity basis. The agreement also provides that Austbrokers Holdings Limited carries forward tax funding assets or tax funding liabilities for which an intercompany loan is recognised between the parties.
Tax effect accounting by members of the tax consolidated group
Members of the tax consolidated group have entered into a tax funding agreement. The tax funding agreement provides for the allocation of current taxes to members of the tax consolidated group in accordance with their accounting profit for the period, while deferred taxes are allocated to members of the tax consolidated group in accordance with the principles of AASB 112 Income Taxes. Allocations under the tax funding agreement are made at the end of each quarter.
6. Earnings per share (EPS)
(a) Earnings used in calculating EPS
Basic earnings per share amounts are calculated by dividing net profit for the year attributable to ordinary equity holders of the parent by the weighted average number of ordinary shares outstanding during the year.
Diluted earnings per share amounts are calculated by dividing the net profit attributable to ordinary equity holders of the parent by the weighted average number of ordinary shares outstanding during the year plus the weighted average number of ordinary shares that would be issued on the conversion of all the dilutive potential ordinary shares into ordinary shares.
(b) Weighted average number of shares
There have been no significant transactions involving ordinary shares or potential ordinary shares that would significantly change the number of ordinary shares or potential ordinary shares outstanding between the reporting date and the date of completion of these financial statements. In July 2010 83,300 shares were issue as a result of the exercise of options.
(c) Information on the classification of securities
Options granted to employees as described in note 18 are considered to be potential ordinary shares and have been included in the determination of the diluted earnings per share to the extent they are dilutive. These options have not been included in the determination of the basic earnings per share. The amount of the dilution of these options is the average market price of ordinary shares during the year minus the exercise price.
The following reflects the income and share data used in the basic and diluted earnings per share computations:
Consolidated
2010 2009
$’000 $’000
Net profit attributable to ordinary equity holders of the parent 18,189 15,903
Thousands Thousands Shares Shares
Weighted average number of ordinary shares for basic earnings per share 51,493 50,184
Effect of dilution
Weighted average number of shares under option adjusted for shares that would have been issued at average market price 627 531
Weighted average number of ordinary shares adjusted for the effect of dilution 52,120 50,715
For
per
sona
l use
onl
y

austbrokers annual report 201072
Consolidated
2010 2009
$’000 $’000
7. Cash and cash equivalents
a) Reconciliation of profit after tax to net cash flows from operations
Profit after tax for the period 21,320 18,518
(Profit) on sale of interest in controlled entities and associates (621) (486)
Equity accounted (profits) after income tax (14,558) (14,393)
Dividends/trust distributions received from associates 11,824 11,621
Amortisation of intangibles 2,530 2,379
Depreciation of fixed assets 1,674 1,654
Share options expensed 453 564
Changes in assets and liabilities
(Increase)/decrease in trade and other receivables (2,534) (12,687)
Increase in provisions 483 396
Increase in other payables 10,346 21,524
(Increase) in future income tax benefit (781) (255)
(Decrease) in deferred tax liability (462) (95)
Increase/ (decrease) in provision for tax 110 (601)
Net cash flows from operating activities 29,784 28,139
Cash and cash equivalents 23,840 17,047
Cash and cash equivalents - Trust 57,147 51,611
Total cash and cash equivalents 80,987 68,658
Due to acquisitions/disposal of consolidated entities during the year, some changes in assets and liabilities shown above will not agree to the movements in the Statement of Financial Position.
Non cash financing and investing activities transactions include transactions resulting from the dividend reinvestment plan. In the previous period there were no non cash financing and investing activities.
Trust cash cannot be used to meet business obligations/operating expenses other than payments to underwriters and/or refunds to policyholders.
Business combinations
All the business combinations referred to in this note relate to Insurance Broking businesses
b) The group acquired broking portfolios by way of business combinations as follows:
Fair value recognised on acquisition
2010 2009
$’000 $’000
Intangibles 576 1,377
Deferred tax liabilities (163) (413)
Fair value of assets acquired 413 964
less:
Purchase price – cash paid 983 5,323
Purchase price – deferred – 531
Fair value of business retained by non controlling interests 544 –
Goodwill on acquisition 1,114 4,890
For the year ended 30 June 2010
notes to the financial statementsF
or p
erso
nal u
se o
nly

austbrokers annual report 2010 73
7. Cash and cash equivalents (continued)
Business combinations (continued)c) On 1 July 2008, the consolidated entity acquired an additional 10% interest in Salisbury Payne Tinslay Pty Ltd (SPT) for $327,000
bringing the total equity to 60%.
On 1 July 2008, a controlled entity acquired a 50% equity in SPT Financial Services Pty Ltd (SPTFS) which was increased to 75% on 1 January 2009. The total amount paid by the Group for its 75% interest was $782,000
Fair values of the identifiable assets and liabilities of SPT and SPTFS as at the date of acquisition were:
SPTFS SPT
Fair value Fair value recognised Carrying recognised Carrying on acquistion value on acquistion value
$’000 $’000 $’000 $’000
Cash 2 2 1,884 1,884
Receivables 28 28 2,812 2,812
Plant and equipment 6 6 61 61
Other Assets 8 8 10 10
Intangibles 263 174 854 792
Total Assets 307 218 5,621 5,559
Payables 1 1 4,644 4,644
Provisions 60 60 109 109
Borrowings – – 161 161
Deferred Tax Liabilities 79 – 256 –
Total Liabilities 140 61 5,170 4,914
Net Assets 167 157 451 645
Fair value of assets acquired 125 45
Purchase price - cash paid 782 327
Goodwill arising on acquisition 657 282
Goodwill recognised in previous exchange transactions – 1,428
Total Goodwill 657 1,710
Cash outflow on acquisition is as follows;
Net cash acquired with the subsidiary 2 1,884
Cash paid (782) (327)
Net cash inflow/(outflow) (780) 1,557
The acquisition of the SPT was effective on 1 July 2008 and the acquisition contributed $480,097 to net profit after tax and $3,015,510 to revenue.
The acquisition of the SPTFS was effective on 1 January 2009 and the acquisition contributed $38,110 to net profit after tax and $296,912 to revenue. Had the acquisition taken place at the beginning of the period, the profit before tax contribution would have been $137,981 and revenue would have been $550,924
Goodwill represents the excess of the purchase consideration over the fair value of identifiable net assets acquired at the time of acquisition of the business. As at acquisition date, any goodwill relates to benefits from the combination of synergies as well as the entity’s ability to generate future profits.
For
per
sona
l use
onl
y

austbrokers annual report 201074
7. Cash and cash equivalents (continued)
Business combinations (continued)
d) On 1 September 2008, the Company acquired an additional 20% interest in North Coast Insurance Brokers Pty Ltd for $312,000 bringing the total equity to 70%.
On 1 April 2009, the Company acquired an additional 16% interest in Aprikeesh Pty Ltd for $2,084,000 bringing the total equity to 66%.
Fair values of the identifiable assets and liabilities of North Coast Insurance Brokers Pty Ltd and Aprikeesh Pty Ltd as at the date of acquisition were:
APRIKEESH NORTH COAST INSURANCE PTY LTD BROKERS PTY LTD
Fair value Fair value recognised Carrying recognised Carrying on acquistion value on acquistion value
$’000 $’000 $’000 $’000
Cash 2,461 2,461 565 565
Receivables 2,321 2,321 165 165
Plant and equipment 207 207 956 956
Other assets – – 51 51
Deferred tax asset 108 108 53 53
Intangibles 2,444 2,314 579 1,216
Total Assets 7,541 7,411 2,369 3,006
Payables 4,142 4,143 573 573
Provisions 360 360 123 123
Borrowings 349 349 1,195 1,195
Deferred Tax Liabilities 733 – 174 –
Total Liabilities 5,584 4,852 2,065 1,891
Net Assets 1,957 2,559 304 1,115
Fair value of assets acquired 313 61
Purchase price - cash paid 2,084 312
Goodwill arising on acquisition 1,771 251
Goodwill recognised in previous exchange transaction 285 172
Total Goodwill 2,056 423
Cash outflow on acquisition is as follows;
Net cash acquired with the controlled entity 2,461 565
Cash paid (2,084) (312)
Net cash inflow 377 253
The acquisition of an additional 20% of North Coast Insurance Brokers Pty Ltd was effective on 1 September 2008. The additional acquisition contributed $94,352 to net profit after tax and $1,079,329 to revenue. Had the acquisition taken place at the beginning of the period, the profit before tax contribution would have been $116,983 and revenue would have been $1,335,387.
The acquisition of an additional 16% of Aprikeesh Pty Ltd was effective on 1 April 2009. The additional acquisition contributed $295,302 to net profit after tax and $1,919,208 to revenue. Had the acquisition taken place at the beginning of the period, the profit before tax contribution would have been $578,718 and revenue would have been $5,540,244.
Goodwill represents the excess of the purchase consideration over the fair value of identifiable net assets acquired at the time of acquisition of the business. As at acquisition date, any goodwill relates to benefits from the combination of synergies as well as the entity’s ability to generate future profits.
For the year ended 30 June 2010
notes to the financial statementsF
or p
erso
nal u
se o
nly

austbrokers annual report 2010 75
7. Cash and cash equivalents (continued)
Business combinations (continued)
e) On 1 April 2009, the Company acquired an additional 15% interest in Austbrokers Trade Credit Pty Ltd for $172,000 bringing the total equity to 65%.
Fair values of the identifiable assets and liabilities of Austbrokers Trade Credit Pty Ltd as at the date of acquisition were:
Fair value recognised Carrying on acquistion value
$’000 $’000
Cash 270 270
Receivables 173 173
Intangibles 241 –
Total Assets 684 443
Payables 307 307
Provisions 45 45
Deferred Tax Liabilities 72 –
Total Liabilities 424 352
Net Assets 260 91
Fair value of assets acquired 39
Purchase price - cash paid 172
Goodwill arising on acquisition 133
Goodwill recognised in previous exchange transactions 374
Total Goodwill 507
Cash outflow on acquisition is as follows;
Net cash acquired with the subsidiary 270
Cash paid (172)
Net cash inflow 98
The acquisition of an additional 15% of Austbrokers Trade Credit Pty Ltd was effective on 1 April 2009. The additional acquisition contributed $13,181 to net profit after tax and $96,302 to revenue. Had the acquisition taken place at the beginning of the period, the profit before tax contribution would have been $215,987 and revenue would have been $768,050.
Goodwill represents the excess of the purchase consideration over the fair value of identifiable net assets acquired at the time of acquisition of the business. As at acquisition date, any goodwill relates to benefits from the combination of synergies as well as the entity’s ability to generate future profits.F
or p
erso
nal u
se o
nly

austbrokers annual report 201076
7. Cash and cash equivalents (continued)
Business combinations (continued)
f) On 1 April 2010, a controlled entity acquired an 80% interest in Austbrokers AEI Pty Ltd (formerly Chegwyn Pty Ltd) for $434,782.
Fair values of the identifiable assets and liabilities of Austbrokers AEI Pty Ltd as at the date of acquisition were:
Fair value recognised Carrying on acquistion value
$’000 $’000
Cash 143 143
Receivables 7 7
Intangibles 150 –
Total Assets 300 150
Payables 141 141
Deferred Tax Liabilities 45 –
Total Liabilities 186 141
Net Assets 114 9
Fair value of assets acquired 91
Purchase price - cash paid 435
Goodwill arising on acquisition 344
Goodwill recognised in previous exchange transactions 151
Total Goodwill on acquisition 495
Cash outflow on acquisition is as follows;
Net cash acquired with the controlled entity 143
Cash paid (435)
Net cash (outflow) (292)
The acquisition of 80% (52% group ownership) of Austbrokers AEI Pty Ltd was effective on 1 April 2010. The acquisition contributed $21,279 to net profit after tax and $185,275 to revenue. Had the acquisition taken place at the beginning of the period, the profit before tax contribution would have been $22,042 and revenue would have been $389,522.
The acquisition of Austbrokers AEI Pty Ltd resulted in the recognition of $173,220 of non controlling interests at the acquisition date. This amount was measured at fair value of the net assets of the business attributable to the non controlling interests.
Goodwill represents the excess of the purchase consideration over the fair value of identifiable net assets acquired at the time of acquisition of the business. As at acquisition date, any goodwill relates to benefits from the combination of synergies as well as the entity’s ability to generate future profits.
g) During the period, the consolidated entity acquired a 50% holding in Tasman Underwriting Agency Pty Ltd for $300,000 and contributed a further $180,000 to maintain a 50% holding in IAA Holdings Pty Ltd.
h) On 1 July 2008, the consolidated entity acquired a 50% holding in SRG Group Pty Ltd for $2,217,022. The deferred settlement amount on this acquisition was $716,000 which was payable over 2 years. (Net cash paid during previous period $1,501,022)
i) On 30 June 2009, the consolidated entity acquired a 50% holding in Austral Insurance Brokers Pty Ltd for $2,816,072 the deferred settlement amount on this acquisition was $1,050,400 which was payable over 2 years. (Net cash paid during previous period $1,765,672)
For the year ended 30 June 2010
notes to the financial statementsF
or p
erso
nal u
se o
nly

austbrokers annual report 2010 77
7. Cash and cash equivalents (continued)
Business combinations (continued)
j) The Group had previously acquired 60% of Dolphin Insurance Pty Limited. During the prior period the Group acquired the remaining 40% equity in Dolphin for $136,765
k) On 1 July 2008, the Company acquired a further 20% interest in Drummond Porter Pty Ltd for $463,274 increasing the shareholding to 100%.
l) During the prior year, the group incorporated an associated entity, Austbrokers ABS Aviation Pty Ltd. During the current year, the Group paid $100 for 50% of the issued capital of Austbrokers Aviation Pty Limited.
Consolidated
2010 2009
$’000 $’000
m) The group disposed of broking portfolios as follows:
Book value of assets disposed
Intangibles net of amortisation – –
Goodwill – 403
Book value assets disposed. – 403
Proceeds from sale of broking portfolio – (403)
Profit on sale of broking portfolio – –
n) On 1 July 2008, the company sold its 25% holding in Tealrose Pty Ltd/Financial Insurance Services (Brokers) Pty Ltd to an associate entity.
Carrying value of interest sold – 354
Cash received – (523)
Profit on sale (pre tax) – 169
o) On 1 October 2009, the company reduced its equity in SGP Insurance Brokers Pty Ltd (SGP) from 70% to 50% through the issue of new shares by SGP and the sale a parcel of shares by the company. On this date the company ceased to be a controlled entity and became an Associate.
Carrying value of interest disposed 622 –
Carrying value of investment transferred to Investment in Associates (593) –
Fair value adjustment at the date the entity became an Associate (555) –
Cash received on disposal of controlled entity 95 –
Profit on sale (pre tax) 621 –
Cash outflow on disposal is as follows;
Net cash reduction on deconsolidation of controlled entity (1,167) –
Cash received on disposal of controlled entity 95 –
Net cash (outflow) (1,072) –
p) During the prior period, the company reduced its equity in Finsura Holdings Pty Ltd from 80% to 70%.
Carrying value of interest sold – 301
Cash received – (583)
Profit on sale (pre tax) – 282
For
per
sona
l use
onl
y

austbrokers annual report 201078
Consolidated
2010 2009
$’000 $’000
7. Cash and cash equivalents (continued)
Business combinations (continued)
q) During the prior period, the company reduced its equity in Austbrokers AEI Transport Pty Limited from 67.5% to 65%.
Carrying value of interest sold – 192
Cash received – (231)
Profit on sale (pre tax) – 39
r) During the prior period, the company reduced its equity in Austbrokers RWA Pty Ltd from 80% to 60%.
Carrying value of interest sold – 740
Cash received – (736)
Loss on sale (pre tax) – (4)
Total profit on disposals - 7(m) to 7(r) 621 486
8. Dividends paid and proposed
Equity dividends on ordinary shares:
(a) Dividends paid during the year
Final franked dividend for financial year ended 30 June 2008: 11.5 cents – 5,765
Interim franked dividend for financial year ended 30 June 2009: 7.0 cents – 3,516
Final franked dividend for financial year ended 30 June 2009: 13.5 cents 6,809 –
Interim franked dividend for financial year ended 30 June 2010: 7.5 cents 3,889 –
Total dividends paid in current year 10,698 9,281
In addition to the above, dividends paid to non controlling interests totalled $2,186,000 (2009: $2,514,000).
(b) Dividends proposed and not recognised as a liability
Final franked dividend for financial year ended 30 June 2009: 13.5 cents – 6,782
Final franked dividend for financial year ended 30 June 2010: 15.0 cents 7,911 –
7,911 6,782
Dividends paid per share (cents per share) 21.0 18.5
Dividends proposed per share (cents per share) not recognised at balance date 15.0 13.5
For the year ended 30 June 2010
notes to the financial statementsF
or p
erso
nal u
se o
nly

austbrokers annual report 2010 79
Consolidated
2010 2009
$’000 $’000
8. Dividends paid and proposed (continued)
Franking credit balance
The amount of franking credits available for the subsequent financial year are:
– franking account balance as at the end of the financial year at 30% (2009: 30%) 16,906 13,663
– franking credits that will arise from the payment of income tax payable as at the end of the financial year 1,326 1,049
The amount of franking credits available for future reporting periods. 18,232 14,712
– impact on the franking account of dividends proposed or declared before the financial report was authorised for issue but not recognised as a distribution to equity holders during the year. (3,390) (2,907)
The amount of franking credits available for future reporting periods after payment of dividend. 14,842 11,805
The tax rate at which paid dividends have been franked is 30% (2009: 30%)
Dividends proposed will be franked at the rate of 30% (2009: 30%)
9. Trade and other receivables (current)
Trade receivables 5,941 6,032
Amount due from broking operations/underwriting agency receivables 82,508 80,461
Related party receivables
– other related 1,901 1,101
Total receivables (current) 90,350 87,594
10. Other financial assets (current)
Mortgages - related entities (amortised cost) 347 363
Mortgages - other (amortised cost) 1,114 340
Total other financial assets (current) 1,461 703
The mortgages are secured by registered fixed and floating charges over assets in the business, securities and supplemented with cross guarantees and indemnities where necessary.
11. Trade And Other Receivables (non current)
Trade receivables 30 27
Loans to associated entities 133 –
Total receivables (non current) 163 27For
per
sona
l use
onl
y

austbrokers annual report 201080
Consolidated
2010 2009
$’000 $’000
12. Investment in associates
Investments at equity accounted amount:
Associated entities - unlisted shares 72,177 67,561
Equity accounted
Name Jun-10 Jun-09 2010 2009
% % $’000 $’000
Austral Insurance Brokers Pty Ltd 50.0 50.0 3,114 2,816
Austbrokers RIS Pty Ltd 49.9 49.9 2,188 2,396
Austbrokers ABS Aviation Pty Ltd 50.0 100.0 – –
Bruce Park Pty Ltd trading as Fergusons Financial Services 49.9 49.9 1,383 1,333
Citycover (Aust) Pty Ltd 49.9 49.9 1,666 1,655
Comsure Insurance Brokers Pty Ltd 49.9 49.9 711 704
Insurance Advisernet Australia Pty Ltd/ Insurance Advisernet Australia Unit Trust and controlled entity 49.9 49.9 15,580 15,597
Insurance Advisernet Holdings Unit Trust 49.9 49.9 246 34
JMD Ross Insurance Brokers Pty Ltd 49.9 49.9 662 546
Markey Group Pty Ltd 49.9 49.9 2,532 1,626
MGA Management Services Pty Ltd 49.9 49.9 5,374 4,569
Northern Tablelands Insurance Brokers Pty Ltd 49.9 49.9 39 13
Peter L Brown & Associates Pty Ltd 49.9 49.9 494 555
Power Insurance Brokers Pty Ltd and controlled entity 49.9 49.9 774 633
Rivers Insurance Brokers Pty Ltd 49.9 49.9 2,967 2,917
Adroit Insurance Brokers Pty Ltd 49.9 49.9 2,118 1,751
Secure Enterprises Pty Ltd / Strathearn Insurance Brokers Unit Trust 49.9 49.9 19,635 20,233
Parkstar Enterprises Pty Ltd / Strathearn Insurance Brokers (Qld) Unit Trust 49.9 49.9 5,209 4,963
Supabrook Pty Ltd trading as Austbrokers HCI 49.9 49.9 869 864
SRG Group Pty Ltd 50.0 50.0 2,126 2,294
SGP Insurance Brokers Pty Ltd 50.0 70.0 1,257 –
Tasman Underwriting Agency Pty Ltd 50.0 0.0 363 –
Western United Financial Services Pty Ltd and controlled entity 49.9 49.9 742 480
Oxley Insurance Brokers Pty Ltd / Port Macquarie Insurance Brokers Unit Trust and consolidated entities 49.9 49.9 154 –
Oxley Insurance Brokers Pty Ltd / Coffs Harbour Unit Trust 37.5 37.5 55 32
Countrywide Tolstrup Financial Services Group Pty Ltd / Countrywide Tolstrup Group Unit Trust 49.9 49.9 1,919 1,550
72,177 67,561
For the year ended 30 June 2010
notes to the financial statementsF
or p
erso
nal u
se o
nly

austbrokers annual report 2010 81
12. Investment in associates (continued)
On 1 October 2009, the consolidated entity acquired a 50% interest in Tasman Underwriting Agency Pty Ltd for $300,000.
On 1 July 2009, Austbrokers ABS Aviation Pty Ltd issued 50 shares to a new shareholder and 50 shares to a controlled entity. On this date the company reduced its holding to 50% and the company ceased to be a controlled entity.
On 1 October 2009, the consolidated entity disposed of 20% of its interest in SGP Insurance Brokers Pty Ltd at which date it ceased to be a controlled entity and became an Associate. The difference between the previous carrying value and fair value at the date the company became an associate of $555,000 has been credited to the income statement.
On 1 July 2008, the consolidated entity acquired a 50% holding in SRG Group Pty Ltd for $2,217,022. The deferred settlement amount on this acquisition is $716,000 which was payable over 2 years.
On 30 June 2009, the consolidated entity acquired a 50% holding in Austral Insurance Brokers Pty Ltd for $2,816,072. The deferred settlement amount on this acquisition is $1,050,400 which was payable over 2 years.
On 1 September 2008, the Company rolled over its investment in Austbrokers ALIB Pty Ltd into Austbrokers RIS Pty Ltd (formerly BHI Insurance Brokers Pty Ltd) .
On 1 July 2008, the company disposed of its holding in Tealrose Pty Ltd/Financial Insurance Services (Brokers) Pty Ltd to Adroit Holdings Pty Ltd (previously Stateplan Holdings) for $523,288.
Other information in respect of associated entities which carry on business directly or through controlled entities.
(a) The principal activity of each associate - insurance broking.
(b) The proportion of voting power is in accordance with the ownership interest of each associate.
(c) The reporting date of each associate is 30 June 2010 (prior year reporting date 30 June 2009).
(d) There have been no significant subsequent events affecting the associates’ profits for the ensuing year.
(e) There were no impairment issues relating to the investment in associates.
(f) All associates were incorporated in Australia.
(g) The entity’s share of the associate’s commitments and contingent liabilities are disclosed in note 23.
Consolidated
2010 2009
$’000 $’000
(h) The entity’s share of associates’ profits/(losses)
Share of associates’:
Revenue 66,088 61,878
Operating profits before income tax 19,416 19,248
Amortisation of intangibles (1,230) (1,411)
Net profit before income tax 18,186 17,837
Income tax expense attributable to operating profits (3,628) (3,444)
Share of associates’ net profits 14,558 14,393
(i) The entity’s share of the assets and liabilities of associates in aggregate:
Current assets 133,109 117,412
Non-current assets 36,840 34,301
Current liabilities (128,527) (114,354)
Non-current liabilities (10,811) (10,134)
Net assets 30,611 27,225
For
per
sona
l use
onl
y

austbrokers annual report 201082
Consolidated
2010 2009
$’000 $’000
13. Other financial assets (non current)
Mortgages – related entities (amortised cost) – 135
Mortgages – other (amortised cost) 106 714
Other 22 188
128 1,037
The mortgages are secured by registered fixed and floating charges over assets in the business, securities and supplemented with cross guarantees and indemnities where necessary.
Consolidated Equity interest held
Name and Interests in controlled entities 2010 2009
% %
14. Shares in controlled entities
*All controlled entities are incorporated in Australia and comprise:
Austbrokers Pty Ltd and its controlled entities 100 100
Finsura Holdings Pty Ltd and its controlled entities 70 70
Finsura Insurance Broking (Australia) Pty Ltd 70 70
Finsura Financial Services Pty Limited 70 70
Finsura Investment Management Services Pty Limited 70 70
Finsura Insurance Broking Unit Trust 70 70
RI Hornsby Pty Limited 70 70
Austbrokers Trade Credit Pty Ltd 65 65
Salisbury Payne Tinslay Pty Limited As Trustee For Salisbury Payne Tinslay Unit Trust 60 60
Austbrokers Services Pty Ltd 100 100
Austbrokers Investments Pty Ltd 100 100
Austbrokers Business Centre Pty Ltd 100 0
Adept Insurance Brokers Pty Ltd and its controlled entity 100 100
Geary Smith Pty Limited 100 100
Aprikeesh Pty Ltd and its controlled entities 66 66
Austbrokers Phillips Pty Ltd 66 66
Interfin Pty Ltd 45 54
AEI Holdings Pty Ltd / AEI Insurance (Brokers) Pty Ltd 100 100
Austbrokers Financial Solutions (Syd) Pty Ltd and its controlled entity 100 100
SPT Financial Services Pty Ltd 75 75
Austbrokers Sydney Pty Ltd and its controlled entities 100 100
Austbrokers Canberra Pty Ltd 75 75
Austbrokers FWR Pty Ltd 100 100
Austbrokers Professional Services Pty Ltd 80 80
Austbrokers ABS Aviation Pty Ltd (see below) 50 100
Austbrokers AEI Transport Pty Ltd 65 65
Carriers Insurance Brokers Pty Ltd 52 52
Austbrokers AEI Pty Ltd 52 0
AHL Insurance Brokers Pty Ltd and its controlled entities 100 100
AHL Insurance Brokers (Aust) Pty Ltd 100 100
Austagencies Pty Ltd 100 100
For the year ended 30 June 2010
notes to the financial statementsF
or p
erso
nal u
se o
nly

austbrokers annual report 2010 83
Consolidated Equity interest held
Name and Interests in controlled entities 2010 2009
% %
14. Shares in controlled entities (continued) Latitude Underwriting Agency Pty Ltd 100 100
Dolphin Underwriting Agency Pty Ltd 100 100
Austbrokers C.E. McDonald Pty Ltd 100 100
Traders Voice Services Pty Ltd 100 0
Austbrokers Central Coast Pty Ltd and its controlled entity 80 80
Austbrokers Central Coast Financial Services Pty Ltd 80 80
Austbrokers Southern Pty Ltd 80 80
Austbrokers RWA Pty Ltd 60 60
Austbrokers RWA Financial Services Pty Ltd 60 60
Harvey Business Management Pty Ltd 60 60
Austbrokers City State Pty Ltd 100 100
Adroit Hume Pty Ltd and its controlled entity 70 70
Adroit Hume Financial Services Pty Ltd 52.5 52.5
Shield Underwriting Holdings Pty Ltd and its controlled entity 100 100
5 Star Underwriting Agency Pty Ltd 100 100
McNaughton Gardiner Insurance Brokers Pty Ltd and its controlled entity 70 70
McNaughton Gardiner Financial Services Pty Ltd 70 70
North Coast Insurance Brokers Pty Ltd 70 70
NCFS Unit Trust 70 70
Ballina Insurance Brokers Pty Ltd as trustee for Ballina Insurance Brokers unit trust 56 0
SGP Insurance Brokers Pty Ltd (see below) 50 70
Austbrokers Premier Pty Ltd 80 80
Austbrokers Terrace Insurance Brokers Pty Ltd and controlled entity 85 85
Austbrokers Financial Solutions (SA) Pty Limited 43 43
During the current year, the company deregistered AEI Financial planning Pty Ltd, AEI Mortgage and Financial Solutions Pty Ltd, AFS (Syd) Pty Ltd, Austbrokers Finance Pty Ltd and WUIB Pty Ltd. During the prior year, the company deregistered Shield Underwriting Agencies Pty Ltd, Shield Shared Services Pty Ltd, MTA Insurance Agency Pty Ltd and Austagencies Leasebond Pty Ltd.
On 1 July 2009, Austbrokers ABS Aviation Pty Ltd issued 50 shares to a new shareholder at which date the company ceased to be a controlled entity. In December 2009, the company incorporated a new company Austbrokers Business Centre Pty Ltd for $2.
On 1 October 2009, the consolidated entity disposed of 20% of its interest in SGP Insurance Brokers Pty Ltd at which date it ceased to be a controlled entity and became an Associate. The difference between the previous carrying value and fair value at the date the company became an associate of $555,000 has been credited to the income statement.
On 28 February 2010, a controlled entity North Coast Insurance Brokers Pty Ltd subscribed for 80% (Austbrokers group share 56%) of the capital in a newly incorporated entity, Ballina Insurance Brokers Pty Ltd for $772,000 to acquire a broking portfolio.
On 28 February 2010, a controlled entity, CE McDonald Pty Ltd subscribed for 100% of the capital in a newly incorporated entity, Traders Voice Services Pty Ltd for $1.
On 1 April 2010, a controlled entity Austbrokers AEI Transport Pty Limited acquired an 80% interest in Austbrokers AEI Pty Limited for $434,782.
During the prior year, AHL Insurance Brokers Pty Ltd acquired a further 40% equity in Dolphin Insurance Pty Ltd for $136,765.
On 1 July 2008, the Company acquired a further 20% interest in Drummond Porter Pty Ltd for $462,974 increasing the shareholding to 100%.
On 1 July 2008, the consolidated entity acquired a further 10% interest in SPT Insurance Brokers Pty Ltd for $327,000, increasing the shareholding to 60%. On 1 July 2008, a controlled entity acquired a 50% equity in SPT Financial Services Pty Ltd which was increased to 75% on 1 January 2009. The total amount paid by the Group for its 75% interest was $782,000.
On 1 September 2008, the Company acquired a further 20% interest in North Coast Insurance Brokers Pty Ltd for $312,000 increasing the shareholding to 70%.
On 1 July 2008 the consolidated entity disposed of 10% of Finsura Holdings Pty Ltd for $583,000, 2.5% of Austbrokers AEI Transport Pty Ltd for $231,000 and 20% of Austbrokers RWA Pty Ltd for $736,000.
On 1 April 2009, the consolidated entity acquired a further 15% interest in Austbrokers Trade Credit Pty Ltd for $172,000, increasing the shareholding to 65%.
On 1 April 2009, the Company acquired a further 16% interest in Aprikeesh Pty Ltd for $2,084,000 increasing the shareholding to 66%.
For
per
sona
l use
onl
y

austbrokers annual report 201084
For the year ended 30 June 2010
Consolidated
Plant and Motor Property equipment Vehicle Total
$’000 $’000 $’000 $’000
15. Property, plant and equipment
Year ended 30 June 2010
Balance at the beginning of the year 703 11,117 1,636 13,456
Disposal of controlled entity – (718) (53) (771)
Additions during the year – 896 172 1,068
Disposals during the year – (217) (467) (684)
Plant and equipment at cost 703 11,078 1,288 13,069
Depreciation
Balance at the beginning of the year 32 7,117 462 7,611
Disposal of controlled entity – (495) (23) (518)
Disposals during the year – (191) (181) (372)
Depreciation during year 14 1,428 232 1,674
Accumulated depreciation 46 7,859 490 8,395
Summary
Net carrying amount at beginning of year 671 4,000 1,174 5,845
Net carrying amount at end of year 657 3,219 798 4,674
Year ended 30 June 2009
Balance at the beginning of the year – 8,802 1,488 10,290
Acquisition of a subsidiary 703 1,450 31 2,184
Additions – 1,441 645 2,086
Disposals – (576) (528) (1,104)
Plant and equipment at cost 703 11,117 1,636 13,456
Depreciation
Balance at the beginning of the year – 5,247 499 5,746
Acquisition of a subsidiary 14 934 6 954
Disposals – (452) (291) (743)
Depreciation during year 18 1,388 248 1,654
Accumulated depreciation 32 7,117 462 7,611
Summary
Net carrying amount at beginning of year – 3,555 989 4,544
Net carrying amount at end of year 671 4,000 1,174 5,845
notes to the financial statementsF
or p
erso
nal u
se o
nly

austbrokers annual report 2010 85
Consolidated
Insurance broking Goodwill registers Total
$’000 $’000 $’000
16. Intangible assets and goodwill
Year ended 30 June 2010
Balance at the beginning of the year 57,502 26,214 83,716
Additional businesses and portfolios acquired 1,609 726 2,335
Disposal of controlled entity (873) (1,153) (2,026)
Disposals of broking portfolios (131) – (131)
Total Intangibles 58,107 25,787 83,894
Amortisation
Balance at the beginning of the year – 10,067 10,067
Amortisation current year – 2,530 2,530
Disposal of controlled entity – (901) (901)
Accumulated amortisation – 11,696 11,696
SummaryNet carrying amount at beginning of year 57,502 16,147 73,649
Net carrying amount at end of year 58,107 14,091 72,198
Year ended 30 June 2009
Balance at the beginning of the year 47,508 22,070 69,578
Additional businesses and portfolios acquired 10,492 5,758 16,250
Disposals of broking portfolios (498) (1,614) (2,112)
Total Intangibles 57,502 26,214 83,716
AmortisationBalance at the beginning of the year – 8,902 8,902
Amortisation current year – 2,379 2,379
Disposals of broking portfolios – (1,214) (1,214)
Accumulated amortisation – 10,067 10,067
SummaryNet carrying amount at beginning of year 47,508 13,168 60,676
Net carrying amount at end of year 57,502 16,147 73,649
Goodwill represents the excess of the purchase consideration over the fair value of identifiable net assets acquired at the time of acquisition of the business. As at acquisition date, any goodwill relates to benefits from the combination of synergies as well as the entity’s ability to generate future profits. The balance of the Insurance broking register will be amortised over the remaining period ranging from 1 to 10 years depending on original acquisition date.
For
per
sona
l use
onl
y

austbrokers annual report 201086
16. Intangible assets and goodwill (continued)
The goodwill totalling $58.1 million (2009: $57.5 million) is attributable to the following entities. Consolidated
2010 2009
$’000 $’000
Austbrokers Sydney Pty Ltd and its controlled entities 25,293 25,459
Austbrokers Central Coast Pty Ltd and its controlled entities 2,452 2,452
Austbrokers RWA Pty Ltd and its controlled entities 2,757 2,756
Aprikeesh Pty Ltd and its controlled entities 2,315 2,305
Finsura Holdings Pty Ltd and its controlled entities 1,777 1,777
Shield Underwriting Holdings Pty Ltd and its controlled entity 6,555 6,555
SPT Insurance Brokers Pty Ltd 1,707 1,710
Austbrokers Terrace Insurance Brokers Pty Ltd and its controlled entities 1,812 1,805
Austbrokers Premier Pty Ltd 3,400 3,400
Austbrokers City State Pty Ltd 1,839 1,039
Other controlled entities 8,200 8,244
Total 58,107 57,502
17. Impairment testing of intangible assets, goodwill and investment in associates
The recoverable amount of the equity accounted associates and goodwill and registers arising on consolidation of broking subsidiaries has been determined based on the directors’ estimate of fair value of the cash generating unit to which they relate less costs to sell. In determining fair value, each subsidiary or associate is considered a separate cash generating unit or grouped into the one cash generating unit where operations are linked. The determination of fair value is based on consideration of two measurement bases derived from net profits or commission income of the businesses.
The first of the fair value measures is based on the directors estimates of the sustainable profits, which have been tested against the current and prior year’s profits as well as the following year’s financial budgets approved by senior management. After determining the appropriate after tax profit for each associate/controlled entity, the after tax profit is multiplied by a profit multiple from within the range of 9.58 to 11.32 times (2009: 9.56 to 11.29 times).
The profit multiples have been determined based on weighted average cost of capital (WACC) for each cash generating unit factoring in an assumed sustainable profit growth of 2.5% per annum and after factoring in the cost of debt.
The WACC is based on the cost of capital calculated for each cash generating unit after taking into account the risk free rate, market risks, a risk loading recognising the size of the business, current borrowing interest rates and factoring in the borrowing capacity of the businesses.
The resulting profit multiples used are reviewed against externally accessible factors and are considered by directors to be reflective of generally accepted market values.
In determining a directors’ estimate of fair value a secondary test is applied which is based on a market multiple of 1.6 times broking revenue (2009: 1.6 times) for general insurance broking businesses and 2.5 times life insurance renewable commissions (2009: 2.5 times). These valuation bases are commonly applied in market acquisitions of similar businesses.
The resulting fair values are compared to the carrying value for each cash generating unit and in the event that the carrying value exceeds the higher of the fair value less estimated costs to sell, an impairment loss is recognised.
For the year ended 30 June 2010
notes to the financial statementsF
or p
erso
nal u
se o
nly

austbrokers annual report 2010 87
18. Share-based payment plans
Employee Share Option Plan
Share options are granted to senior executives by the ultimate parent company Austbrokers Holdings Ltd.
The share-based payments expense recognised in the income statement is included in note 4 (iv) Expenses.
The following table illustrates the number (No.) and weighted average exercise prices (WAEP) of and movements in share options issued during the year:
Unless otherwise stated, all options are granted over shares in the ultimate controlling entity, Austbrokers Holdings Ltd.
2010 2009 2010 2009
No. No. WAEP($) WAEP($)
Outstanding at the beginning of the year 2,179,479 2,137,300 3.13 3.19
Granted during the year – 49,942 – 4.22
Granted during the year - Zero priced options 89,104 100,537 0.00 0.00
Lapsed during the year: Options issued during 2007 (52,150) – 4.20 –
Lapsed during the year: Options issued during 2008 (7,750) – 0.00 –
Exercised during the year: Options issued during 2005 (165,850) (108,300) 2.00 2.00
Exercised during the year: Options issued during 2006 (30,200) – 3.47 0.00
Outstanding at the end of the year 2,012,633 2,179,479 3.06 3.13
The outstanding balance as at 30 June 2010 is represented by:
– 465,850 (2009: 631,700) options granted on 5 October 2005, exercisable 3 years from the issue date at an exercise price of $2.00. On 30 September 2009, 165,850 (28 December 2008: 108,300) options were exercised at an option price of $2.00. The average market price on the date the options were exercised was $4.81
– 626,200 (2009: 656,400) options granted on 25 September 2006, exercisable 3 years from the issue date at an exercise price of $3.47. On 30 September 2009, 30,200 options were exercised at an option price of $3.47. The average market price on the date the options were exercised was $4.81
– 77,800 (2009: 77,800) options granted on 29 January 2007, exercisable 3 years from 25 September 2006 at an exercise price of $3.47.
– 590,950 (2009: 643,100) options granted on 14 September 2007, exercisable 3 years from the issue date at an exercise price of $4.20.
– 20,000 (2009: 20,000) options granted on 29 January 2008, exercisable 3 years from 14 September 2007 at an exercise price of $4.20.
– 49,942 (2009: 49,942) options granted on 29 September 2008, exercisable 3 years from 29 September 2008 at an exercise price of $4.22.
– 92,787 (2009: 100,537) options granted on 29 September 2008, exercisable 3 years from 29 September 2008 at an exercise price of $NIL.
– 89,104 Share options were granted on 3 November 2009, exercisable 3 years from 3 November 2009 at an exercise price of $NIL.
All options must be exercised by no later than 7 years from the issue date.
The fair value of the equity-settled share options granted under the option plan is estimated as at the date of grant using a binomial model taking into account the terms and conditions upon which the options were granted.
During the current year 89,104 (2009: 100,537) zero priced options were granted. The options were valued using the volume weighted average price for the five days prior to the grant date.
The following table lists the inputs to the model used for the options issued during the prior year.
2010 2009
Dividend yield (%) – 3.69
Expected volatility (%) – 27
Expected life of option (years) – 5.00
Binomial value (fair value) ($) – 1.03
Risk free rate (%) – 5.44
Exercise Price ($) – 4.22
For
per
sona
l use
onl
y

austbrokers annual report 201088
For the year ended 30 June 2010
18. Share-based payment plans (continued)
Options issued under the Austbroker’s Senior Executive Option Plan (the Plan) have a 7 year life. The expected life of the options is 5 years. This assumes that participants will take the opportunity to exercise vested options at an earlier date in the life of the option.
Options issued under the 2009 Austbroker’s Senior Executive Option Plan (the Plan) have a 7 year life. The expected life of the options is at least 5 years. If options are exercised within two years of the date the options vest, the shares cannot be disposed of before the expiry of the two year period from the date the options vested, except if employment is terminated.
The company has applied a volatility of 0% (2009: 28%) based on the historical volatility for Austbrokers Holdings since listing on the Australian Securities Exchange.
The Binomial value takes into account that the participant can exercise options from year 3 onwards and that there was no cessation of employment of any employee with granted options.
Option Exercise conditions
(a) subject to satisfaction of the performance based conditions referred to in paragraphs (b) and (c) below, the Options will vest 3 years after the date of grant;
(b) if the First Test Compound Earnings Per Share Growth (Compound Growth) is:
(i) greater than or equal to 8.5% per annum, 20% of the Options will become exercisable;
(ii) equal to 10% per annum, 50% of the Options will become exercisable;
(iii) between 10% and 15%, the percentage of Options that are exercisable will be determined on a pro rata basis so that the number of Options that are exercisable will increase from 50% by 1 percentage point for every 0.1% percent additional Compound Growth over 10%;
(iv) 15% per annum or more, 100% of the Options will become exercisable
in each case on the date on which the Company’s audited financial statements for the third financial year ending after the grant are lodged with the Australian Securities Exchange (the First Test Date);
(c) if all of the Options do not become exercisable on the First Test Date and the Second Test Compound Growth is higher than the First Test Compound Growth then on the date on which the Company’s audited financial statements for the fourth financial year ending after the grant are lodged with the Australian Securities Exchange (the Second Test Date) an additional number of Options will become exercisable as is equal to the difference between the number of Options which became exercisable under paragraph (b) and the number of Options which would have become exercisable if paragraph (b) applied on the basis of the Second Test Compound Growth (rather than the First Test Compound Growth);
(d) any Options which have not become exercisable by the Second Test Date lapse are of no further force or effect
These option exercise conditions apply to all options.
Consolidated
2010 2009
$’000 $’000
19. Trade and other payables
CurrentTrade payables 5,995 5,090
Amount payable to broking operations/underwriting agency operations 123,935 117,035
Other payables 8,063 18,969
Related party payables
– Related entities 203 394
138,196 141,488
Non-currentTrade payables – 28
– 28
notes to the financial statementsF
or p
erso
nal u
se o
nly

austbrokers annual report 2010 89
Consolidated
Employee Make good entitlements Provision Total
$’000 $’000 $’000
20. Provisions
Year ended 30 June 2010
Balance at the beginning of the year 7,702 749 8,451
Arising during the year 359 (46) 313
Balance at the end of the year 8,061 703 8,764
Current 2010 7,014 438 7,452
Non-current 2010 1,047 265 1,312
8,061 703 8,764
Year ended 30 June 2009
Balance at the beginning of the year 6,752 714 7,466
Arising during the year 360 35 395
Acquired during the year 590 – 590
Balance at the end of the year 7,702 749 8,451
Current 2009 6,699 123 6,822
Non-current 2009 1,003 626 1,629
7,702 749 8,451
Makegood provision on leased premises
In accordance with the various lease agreements, the Group must restore the leased premises to a similar condition that existed prior to leasing the premises by removing all fixed and removable partitions. A provision has been included for expected amounts payable.
Because of the long-term nature of the liability, the greatest uncertainty in estimating the provision is the costs that will ultimately be incurred. During the year further amounts were provided for premises leased during the year.
Current lease durations range from less than 1year to 5 years and therefore makegood payments will only be made at the end of the lease.
Employee entitlements
Refer to note 3.1(r) for the relevant accounting policy and a discussion of the significant estimation and assumptions applied in the measurement of this provision.
For
per
sona
l use
onl
y

austbrokers annual report 201090
For the year ended 30 June 2010
Consolidated
2010 2009
$’000 $’000
21. Interest bearing loans and borrowings
Current
Obligations under finance leases and hire purchase contracts (note 23) 303 427
Unsecured loan from other related parties 159 164
Unsecured loan - Bank overdraft 19 –
Secured bank loan* – 20
481 611
Non-current
Obligations under finance leases and hire purchase contracts (note 23) 738 1,138
Unsecured loan from other parties 82 41
Secured bank loan* 33,598 32,427
34,418 33,606
*The Group has negotiated facilities through various banks including St George Bank, Macquarie Bank and Commonwealth Bank.
St George Bank Facilities
St George Bank has provided finance facilities to the Austbrokers Holdings Ltd Group amounting to $44,118,500 (30 June 2009: $44,091,000). At balance date these facilities have been utilised to the amount of $33,247,500 (30 June 2009 $32,749,000) in bill acceptance/discount facilities and bank guarantees.
The term of the loan facility is five years covering the period 11 August 2008 to 11 August 2013.
The facilities are secured by registered fixed and floating charges over the assets and undertakings of the Group and cross guarantees and indemnities given by each of the wholly owned subsidiaries.
The facilities are subject to financial undertakings and warranties typical of facilities of this nature and have sub-limits for various purposes including acquisitions.
During the current and prior years, there were no defaults or breaches of terms and conditions of any of these loans.
The amounts of the facilities utilised totalling $33,247,000 ($31,821,000 loans advanced plus $1,426,000 in guarantees) and their respective terms, are as follows;
– A controlled entity, Austbrokers Services Pty Ltd, has utilised $26,426,000 of the facility, including $25,000,000 in loans and $1,426,000 for bank guarantees (30 June 2009: $26,344,000). Interest rates on $25,000,000 have been fixed at an effective rate of 6.8% until November 2011. Bills are rolled over on quarterly intervals. Rollover of the bills are guaranteed for the duration of the facility as long as there are no breaches of the agreement.
The undrawn amount of the facility allocated to this entity at 30 June 2010 was $10,837,500
– A controlled entity, Austbrokers AEI Transport Pty Ltd has entered into an agreement with St George Bank to provide finance facilities amounting to $5,100,000 (30 June 2009: $4,650,000) to secure funding for the acquisition of two broking entities and a broking portfolio. At balance date these facilities have been utilised to the amount of $5,069,500 (30 June 2009: $4,650,000) in a bill acceptance/discount facility. The undrawn amount of the facility at 30 June 2010 was $30,500.
The term of the loan facility is five years from 11 August 2008.
The facilities are secured by registered fixed and floating charges over the assets of Austbrokers AEI Transport Pty Ltd, a letter of comfort given by Austbrokers Holdings Ltd and guarantees and indemnities given by the shareholders with non controlling interests.
Interest rates have been fixed at an effective rate of 5.94% (June 2009: 6.33%) until 30 March 2012. Rollover of the bills are guaranteed for the duration of the facility as long as there are no breaches of the agreement.
notes to the financial statementsF
or p
erso
nal u
se o
nly

austbrokers annual report 2010 91
21. Interest bearing loans and borrowings (continued)
– A controlled entity, Austbrokers Central Coast Pty Ltd entered into an agreement with St George Bank to provide finance facilities amounting to $1,005,000 (2009: $1,005,000) to secure funding for the acquisition of broking portfolios. At balance date these facilities have been utilised to the amount of $1,005,000 (2009: $1,005,000).
The term of the bill acceptance/discount facility is for 10 years from the first drawdown date which was October 2007. The facility is interest only for the first 3 years with full amortisation over the remaining period.
The facilities are secured by registered fixed and floating charges over the assets of Austbrokers Central Coast Pty Ltd, a letter of comfort given by Austbrokers Holdings Ltd, and guarantees and indemnities given by the shareholders with non controlling interests. The interest rate is currently fixed at 5.83%. (2009: 5.83%).
– A controlled entity, Finsura Holdings Pty Ltd, entered into an agreement with St George Bank to provide finance facilities amounting to $750,000 (2009: $750,000). At balance date these facilities have been utilised to the amount of $747,000 (2009: $747,000). The undrawn amount of the facility at 30 June 2010 was $3,000
$375,000 of the total facility is fixed for 2 years until March 2012 at a rate of 7.07%. The balance of $372,000 is renegotiated quarterly and the rate applicable at 30 June 2010 was 6.64%.(2009: 6.43%)
The facilities are secured by registered fixed and floating charges over the assets of Finsura Holdings Pty Ltd , a letter of comfort given by Austbrokers Holdings Ltd, and guarantees and indemnities given by the shareholders with non controlling interests.
The facilities are subject to financial undertakings and warranties typical of facilities of this nature and have sub-limits for various purposes including acquisitions.
Macquarie Bank facilities
Aprikeesh Pty Ltd and its controlled entities (Aprikeesh Group) , negotiated with Macquarie Bank to provide finance facilities to the Aprikeesh Group amounting to $550,000. At 30 June 2010 these facilities have been utilised to the amount of $502,000. (2009: $440,000) The undrawn amount of the facility at 30 June 2010 was $48,000.
The term of the loan facility is interest only for 5 years ending in March 2014. Interest rates on the facility are negotiated quarterly and the interest rate at 30 June 2010 was 8.1%. (2009: 6.9%)
The facilities are secured by registered fixed and floating charges over the assets and undertakings of the Aprikeesh Group and cross guarantees and indemnities given by each of the wholly owned subsidiaries.
The facilities are subject to financial undertakings and warranties typical of facilities of this nature and have sub limits for various purposes including acquisitions.
During the current and prior years, there were no defaults or breaches of terms and conditions of any of these loans.
The facilities are secured by registered fixed and floating charges over the assets of Aprikeesh Pty Ltd.
Commonwealth Bank facilities
A controlled entity, North Coast Insurance Brokers Pty Ltd has negotiated a $1,275,000 loan facility that expires in September 2012. The total facility has been drawn down at year end and is repayable in September 2012.
Of the non current loan facility totalling $1,275,000, an amount of $375,000 (2009:$375,000 fixed at 9.15%) has been fixed for 3 years at a rate of 9.15% and the balance of $900,000 is at a variable rate of 8.72% (2009: 210,000 variable rate 7.54%).
The facilities are subject to financial undertakings and warranties typical of facilities of this nature and have sub limits for various purposes including acquisitions.
During the current and prior years, there were no defaults or breaches of terms and conditions of any of these loans.
The facilities are secured by registered fixed and floating charges over the assets of North Coast Insurance Brokers Pty Ltd, its controlled entities and guarantees and indemnities given by the shareholders with non controlling interests.
Consolidated
2010 2009
$’000 $’000
Summary of secured bank loans
St George Bank 31,821 31,402
Macquarie Bank 502 440
Commonwealth Bank 1,275 585
Total secured bank loans (non-current) 33,598 32,427
For
per
sona
l use
onl
y
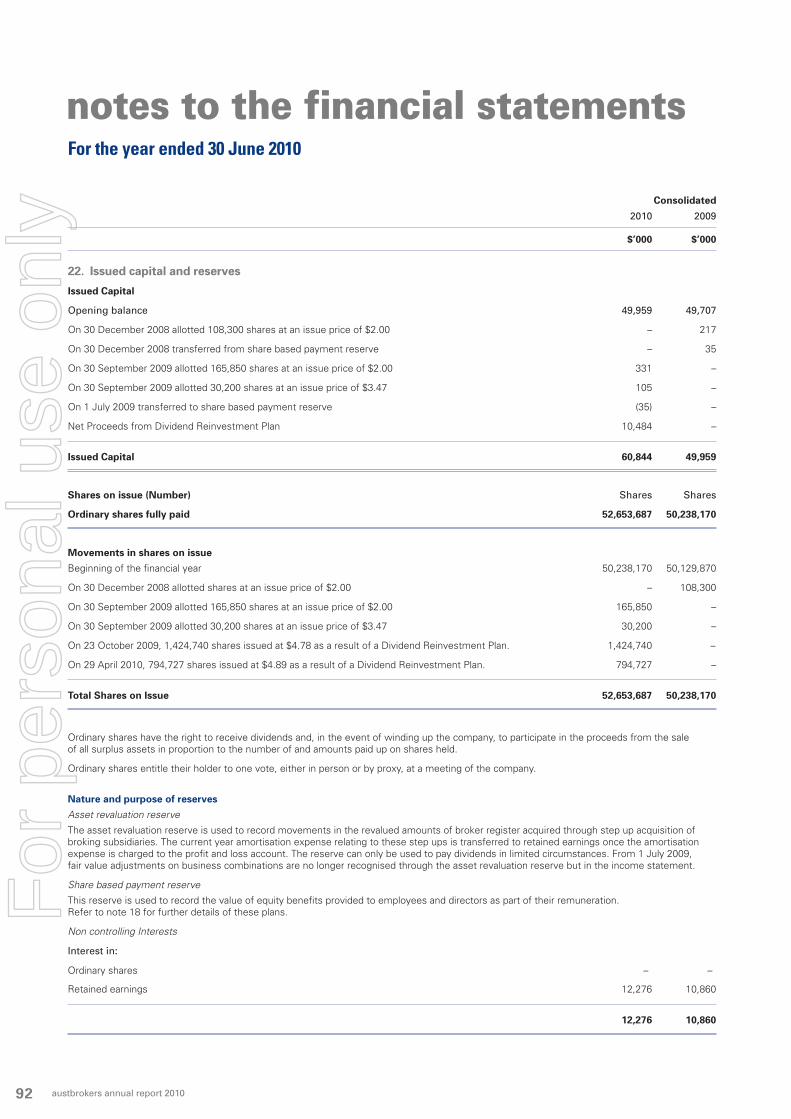
austbrokers annual report 201092
Consolidated
2010 2009
$’000 $’000
22. Issued capital and reserves
Issued Capital
Opening balance 49,959 49,707
On 30 December 2008 allotted 108,300 shares at an issue price of $2.00 – 217
On 30 December 2008 transferred from share based payment reserve – 35
On 30 September 2009 allotted 165,850 shares at an issue price of $2.00 331 –
On 30 September 2009 allotted 30,200 shares at an issue price of $3.47 105 –
On 1 July 2009 transferred to share based payment reserve (35) –
Net Proceeds from Dividend Reinvestment Plan 10,484 –
Issued Capital 60,844 49,959
Shares on issue (Number) Shares Shares
Ordinary shares fully paid 52,653,687 50,238,170
Movements in shares on issue
Beginning of the financial year 50,238,170 50,129,870
On 30 December 2008 allotted shares at an issue price of $2.00 – 108,300
On 30 September 2009 allotted 165,850 shares at an issue price of $2.00 165,850 –
On 30 September 2009 allotted 30,200 shares at an issue price of $3.47 30,200 –
On 23 October 2009, 1,424,740 shares issued at $4.78 as a result of a Dividend Reinvestment Plan. 1,424,740 –
On 29 April 2010, 794,727 shares issued at $4.89 as a result of a Dividend Reinvestment Plan. 794,727 –
Total Shares on Issue 52,653,687 50,238,170
Ordinary shares have the right to receive dividends and, in the event of winding up the company, to participate in the proceeds from the sale of all surplus assets in proportion to the number of and amounts paid up on shares held.
Ordinary shares entitle their holder to one vote, either in person or by proxy, at a meeting of the company.
Nature and purpose of reserves
Asset revaluation reserve
The asset revaluation reserve is used to record movements in the revalued amounts of broker register acquired through step up acquisition of broking subsidiaries. The current year amortisation expense relating to these step ups is transferred to retained earnings once the amortisation expense is charged to the profit and loss account. The reserve can only be used to pay dividends in limited circumstances. From 1 July 2009, fair value adjustments on business combinations are no longer recognised through the asset revaluation reserve but in the income statement.
Share based payment reserve
This reserve is used to record the value of equity benefits provided to employees and directors as part of their remuneration. Refer to note 18 for further details of these plans.
Non controlling Interests
Interest in:
Ordinary shares – –
Retained earnings 12,276 10,860
12,276 10,860
For the year ended 30 June 2010
notes to the financial statementsF
or p
erso
nal u
se o
nly

austbrokers annual report 2010 93
Consolidated
2010 2009
$’000 $’000
23. Commitments and contingencies
Finance lease and hire purchase commitments - Group as lesseeThe Group has finance leases and hire purchase contracts for various items of plant and machinery. These leases have terms of renewal but no purchase options and escalation clauses. Renewals are at the option of the specific entity that holds the lease.
Finance Lease and Hire Purchase Commitments
Payable
– Not later than one year 382 573
– Later than one year and not later than five years 699 1,106
– Later than five years 80 130
Minimum lease and hire purchase payments 1,161 1,809
Deduct: Future finance charges 120 244
Present value of minimum lease and hire purchase payments (refer note 21) 1,041 1,565
Operating lease commitments - Group as lesseeThe Group has entered into leases for premises, commercial leases on certain motor vehicles and items of machinery. These leases have an average life of between 3 and 7 years with no renewal option included in the contracts. There are no restrictions placed upon the lessee by entering into these leases.
Operating Lease Commitments: Non Cancellable operating leases contracted for but not capitalised in the financial statements
Payable
– Not later than one year 3,028 2,698
– Later than one year and not later than five years 3,906 3,344
– Later than five years – –
6,934 6,042
Operating lease commitments – Associates as lesseeOperating Lease Commitments: Non Cancellable operating leases contracted for but not capitalised in the financial statements
Payable
– Not later than one year 1,711 1,239
– Later than one year and not later than five years 3,885 3,033
– Later than five years 1,051 –
6,647 4,272
Contingent liabilitiesEstimates of the maximum amounts of contingent liabilities that may become payable
Austbrokers Holdings Ltd has guaranteed loan facilities provided to an associate in proportion to its shareholding. 1,200 –
Austbrokers Holdings Ltd has guaranteed lease facilities provided to an associate in proportion to its shareholding. 260 –
1,460 –
Austbrokers Holdings Ltd has provided indemnities to other shareholders of related entities and associates in relation to guarantees given by those shareholders, to financiers of or lessors to entities in which Austbrokers has an equity interest. At balance date no liability has arisen in relation to these indemnities.
For
per
sona
l use
onl
y

austbrokers annual report 201094
24. Operating segments
The company’s corporate structure includes equity investments in insurance intermediary entities. Discrete financial information about each of these entities is reported to management on a regular basis and accordingly management considers each entity to be a discrete operating segment of the business. The company believes that all of the Group’s equity investments in insurance intermediary entities exhibit similar economic characteristics and have therefore been aggregated into a single reporting segment, being the general insurance intermediary sector. This assessment is based on each of the operating segments having similar products and services, similar types of customer, employing similar operating processes and procedures and operating within a common regulatory environment. The group is in the business of distributing and advising on insurance products in Australia.
Consolidated
2010 2009
$ $
25. Auditor’s remuneration
Amounts received or due to Ernst & Young (Australia) for:
Audit of the financial statements 635,000 670,000
Other - taxation services 116,778 58,215
Total auditors’ remuneration 751,778 728,215
Amounts received or due to non Ernst & Young audit firms for:
Audit of the financial statements 237,615 244,182
Other assurance related services 16,930 31,982
Other - taxation services 95,188 115,270
Total auditors’ remuneration 349,733 391,434
26. Subsequent events
On 26 August 2010 the Directors of Austbrokers Holdings Ltd declared a final dividend on ordinary shares in respect of the 2010 financial year. The total amount of the dividend is $7,910,548 which represents a fully franked dividend of 15.0 cents per share. The dividend has not been provided for in the 30 June 2010 financial statements.
27. Related party disclosures
(a) The following related party transactions occurred during the year:
(i) Transactions with related parties in parent, subsidiaries and associates.
Entities within the wholly owned group charge/receive management fees for expenses incurred and services rendered. Further entities within the wholly owned group invest in trusts managed by related parties. These transactions are at normal commercial terms and conditions.
Entities within the wholly owned group provide funds to other entities within the group. These funds are non-interest bearing and are repayable on demand.
(ii) Transactions with other related parties.
Entities within the wholly owned group charge associated entities interest on interest bearing loans. Total interest charged for the period was $431,613 (2009: $703,893).The interest charged is at normal commercial terms and conditions.
Members of the economic entity have repaid loans issued by Austbroker Services Pty Ltd totalling $384,977 (2009: $2,617,717) during the year. Further loans have been advanced to members of the economic entity of $399,000 (2009: 614,122). The balance outstanding at 30 June 2010 was $1,566,519 (2009: $1,552,497).
(iii) Transactions with directors and director-related entities.
Other than disclosed in notes 27(c)(d), there were no other transactions with directors or director related entities.
Information regarding outstanding balances at year end is included in notes 9, 10 11, 13 and 19
For the year ended 30 June 2010
notes to the financial statementsF
or p
erso
nal u
se o
nly
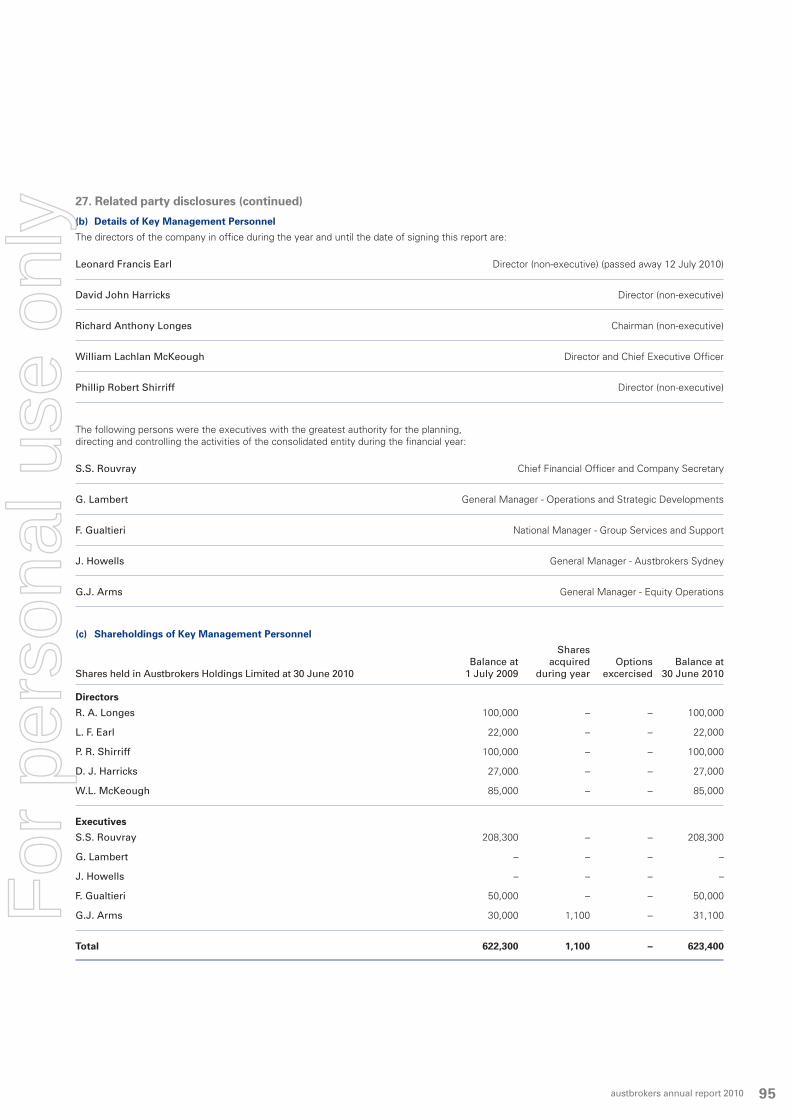
austbrokers annual report 2010 95
27. Related party disclosures (continued)
(b) Details of Key Management Personnel
The directors of the company in office during the year and until the date of signing this report are:
Leonard Francis Earl Director (non-executive) (passed away 12 July 2010)
David John Harricks Director (non-executive)
Richard Anthony Longes Chairman (non-executive)
William Lachlan McKeough Director and Chief Executive Officer
Phillip Robert Shirriff Director (non-executive)
The following persons were the executives with the greatest authority for the planning, directing and controlling the activities of the consolidated entity during the financial year:
S.S. Rouvray Chief Financial Officer and Company Secretary
G. Lambert General Manager - Operations and Strategic Developments
F. Gualtieri National Manager - Group Services and Support
J. Howells General Manager - Austbrokers Sydney
G.J. Arms General Manager - Equity Operations
(c) Shareholdings of Key Management Personnel
Shares Balance at acquired Options Balance at Shares held in Austbrokers Holdings Limited at 30 June 2010 1 July 2009 during year excercised 30 June 2010
Directors
R. A. Longes 100,000 – – 100,000
L. F. Earl 22,000 – – 22,000
P. R. Shirriff 100,000 – – 100,000
D. J. Harricks 27,000 – – 27,000
W.L. McKeough 85,000 – – 85,000
Executives
S.S. Rouvray 208,300 – – 208,300
G. Lambert – – – –
J. Howells – – – –
F. Gualtieri 50,000 – – 50,000
G.J. Arms 30,000 1,100 – 31,100
Total 622,300 1,100 – 623,400
For
per
sona
l use
onl
y

austbrokers annual report 201096
27. Related party disclosures (continued)
Shares Balance at acquired Options Balance at Shares held in Austbrokers Holdings Limited at 30 June 2009 1 July 2008 during year excercised 30 June 2009
Directors
R. A. Longes 100,000 – – 100,000
L. F. Earl 22,000 – – 22,000
P. R. Shirriff 100,000 – – 100,000
D. J. Harricks 20,000 7,000 – 27,000
W.L. McKeough 85,000 – – 85,000
Executives
S.S. Rouvray 100,000 – 108,300 208,300
G. Lambert – – – –
J. Howells – – – –
F. Gualtieri 50,000 – – 50,000
G.J. Arms 30,000 – – 30,000
Total 507,000 7,000 108,300 622,300
(d) Compensation of Key Management Personnel by Category
Consolidated
2010 2009
$ $
Short-Term 2,763,146 2,956,349
Post Employment 324,080 243,994
Other Long-Term – –
Termination Benefits – –
Share-based Payment 253,491 262,329
3,340,717 3,462,672
(e) Options granted as part of remuneration
Fair value Exercise per option price per at grant date option
($) ($) Expiry First Excerise Last Excerise Year ended 30 June 2010 Granted No. Grant Date (note 18) (note 18) Date Date Date
Executives
S.S. Rouvray 15,487 3-Nov-09 4.81 0.00 3-Nov-16 3-Nov-12 3-Nov-16
G. Lambert 10,287 3-Nov-09 4.81 0.00 3-Nov-16 3-Nov-12 3-Nov-16
F. Gualtieri 8,403 3-Nov-09 4.81 0.00 3-Nov-16 3-Nov-12 3-Nov-16
J. Howells 9,548 3-Nov-09 4.81 0.00 3-Nov-16 3-Nov-12 3-Nov-16
G.J. Arms 8,976 3-Nov-09 4.81 0.00 3-Nov-16 3-Nov-12 3-Nov-16
Total 52,701
Where options are exercised within two years after the date the options vest, the shares cannot be disposed of prior to the expiry of the two year period from the date the options vested, except if employment is terminated.
For the year ended 30 June 2010
notes to the financial statementsF
or p
erso
nal u
se o
nly

austbrokers annual report 2010 97
27. Related party disclosures (continued)
Fair value Exercise per option price per at grant date option ($) ($) Expiry First Excerise Last Excerise Year ended 30 June 2009 Granted No. Grant Date (note 18) (note 18) Date Date Date
ExecutivesS.S. Rouvray 18,344 29-Sep-08 4.22 0.00 29-Sep-15 29-Sep-11 29-Sep-15G. Lambert 8,123 29-Sep-08 4.22 0.00 29-Sep-15 29-Sep-11 29-Sep-15 16,246 29-Sep-08 1.03 4.22 29-Sep-15 29-Sep-11 29-Sep-15F. Gualtieri 6,635 29-Sep-08 4.22 0.00 29-Sep-15 29-Sep-11 29-Sep-15 13,271 29-Sep-08 1.03 4.22 29-Sep-15 29-Sep-11 29-Sep-15J. Howells 11,309 29-Sep-08 4.22 0.00 29-Sep-15 29-Sep-11 29-Sep-15G.J. Arms 7,088 29-Sep-08 4.22 0.00 29-Sep-15 29-Sep-11 29-Sep-15 14,175 29-Sep-08 1.03 4.22 29-Sep-15 29-Sep-11 29-Sep-15
Total 95,191
(f) Option holdings of Key Management Personnel.
Balance at Balance at beginning end of of period Granted as Options period 30 Non Options held at 30 June 2010 1 July 2009 remuneration excercised Jun 2010 Exercisable Exercisable
Director W.L. McKeough 1,010,100 – – 1,010,100 673,400 336,700
Executives S.S. Rouvray 151,544 15,487 – 167,031 75,950 91,081 G. Lambert 93,419 10,287 – 103,706 38,900 64,806 F. Gualtieri 137,106 8,403 46,700 98,809 39,800 59,009 J. Howells 31,309 9,548 – 40,857 – 40,857 G.J. Arms 136,413 8,976 – 145,389 83,150 62,239
Total 1,559,891 52,701 46,700 1,565,892 911,200 654,692
These options have an exercise price ranging from $2.00 for options issued in 2005 to $4.22 for options issued in 2009.During the current year 100,537 zero priced options were issued.
Balance at Balance at beginning end of of period Granted as Options period 30 Non Options held at 30 June 2009 1 July 2008 remuneration excercised Jun 2009 Exercisable Exercisable
DirectorW.L. McKeough 1,010,100 – – 1,010,100 336,700 673,400
ExecutivesS.S. Rouvray 241,500 18,344 108,300 151,544 – 151,544 G. Lambert 69,050 24,369 – 93,419 – 93,419 F. Gualtieri 117,200 19,906 – 137,106 46,700 90,406 J. Howells 20,000 11,309 – 31,309 – 31,309 G.J. Arms 115,150 21,263 – 136,413 43,300 93,113
Total 1,573,000 95,191 108,300 1,559,891 426,700 1,133,191
These options have an exercise price ranging from $2.00 for options issued in 2005 to $4.22 for options issued in 2009.During the current year 100,537 zero priced options were issued.
(g) No loans have been advanced to key management personnel during the current year.
For
per
sona
l use
onl
y

austbrokers annual report 201098
For the year ended 30 June 2010
28. Parent entity information
Information in relation to Austbrokers Holdings Limited 2010 2009
$’000 $’000
Assets
Cash and cash equivalents 5,803 2,258
Current Assets 19,167 11,738
Non–current Assets 72,402 71,899
Total Assets 97,372 85,895
Liabilities
Current Liabilities 2,762 2,815
Non-current Liabilities – 10
Total Liabilities 2,762 2,825
Net Assets 94,610 83,070
Equity
Issued capital 60,844 49,959
Retained earnings and reserves 33,766 33,111
Total Shareholders Equity 94,610 83,070
Profit for the year before income tax 10,869 11,978
Income tax (credit) / expense 5 (80)
Net profit after tax for the period 10,864 12,058
Other comprehensive (expense)/income after income tax for the period – –
Total comprehensive income after tax for the period 10,864 12,058
Other information
Guarantees entered into by the parent entity in relation to the debts of its subsidiaries or associates
Austbrokers Holdings Ltd has guaranteed loan facilities provided to an associate in proportion to its shareholding. 1,200 –
Austbrokers Holdings Ltd has guaranteed lease facilities provided to an associate in proportion to its shareholding. 260 –
Total 1,460 –
Contingent liabilities
Austbrokers Holdings Ltd has provided indemnities to other shareholders of related entities and associates in relation to guarantees given by those shareholders, to financiers of or lessors to entities in which Austbrokers has an equity interest. At balance date no liability has arisen in relation to these indemnities.
notes to the financial statementsF
or p
erso
nal u
se o
nly

austbrokers annual report 2010 99
29. Financial Instruments
Financial risk management objectives and policies
The Group’s principal financial instruments comprise receivables, mortgages, cash and short-term deposits, payables, finance leases, overdrafts, interest bearing loans and borrowings and bank overdrafts.
The Group manages its exposure to key financial risks, including interest rate and foreign currency risk in accordance with the Group’s financial risk management policy. The objective of the policy is to support the delivery of the Group’s financial targets whilst protecting future financial security.
The Group does not enter into derivative transactions nor has any significant foreign currency transactions.
The Board reviews and agrees policies for managing each of these risks as summarised below. Primary responsibility for identification and control of financial risks rests with the Board Audit and Risk Management Committee supported by a Management Committee under the authority of the Board. The Board reviews and agrees policies for managing each of the risks identified below.
Risk exposures and Responses
(a) Credit Risk
Credit risk arises from the financial assets of the Group, which comprise cash and cash equivalents, intercompany receivables, mortgages, trade and other receivables. Although there is a concentration of cash and cash equivalents held with a major bank, credit risk is not considered significant.
The company’s exposure to credit risk is concentrated with the financial services industry with parties which are considered to be of sufficiently high credit quality. There are no financial assets which are past due or impaired.
Receivable balances are monitored on a ongoing basis with the result that the Group’s exposure to bad debts is not significant.
Insurance Broking Account receivables
Receivables include amounts due from policyholders in respect of insurances arranged by controlled entities. Insurance brokers have credit terms of 90 days from policy inception to pay funds received from policyholders to insurers. Should policyholders not pay, the insurance policy is cancelled by the insurer and a credit given against the amount due. The Group’s credit risk exposure in relation to these receivables is limited to commissions and fees charged. Commission revenue is recognised after taking into account an allowance for expected revenue losses on policy lapses and cancellations, based on past experience.
The Group’s assets and liabilities include amounts due from policyholders and amounts due to underwriters from broking activities. Due to the reasons disclosed above, these assets and liabilities have been excluded from the Group’s credit risk analysis. The net difference between the assets and liabilities relate to the undrawn commission and fee income brought to account in revenue. This amount has been deducted from broking operations payables.
Consolidated
Assets and liabilities relating to Insurance Broking Account. 2010 2009
$’000 $’000
Broking operations/underwriting activity receivables 82,508 80,461
Cash held on trust 57,147 51,611
Broking operations/underwriting activity payables (123,935) (117,035)
Undrawn income (15,720) (15,037)
Net receivables included in Insurance Broking Account – –
Financial assets
The Group’s exposure to credit risk in relation to financial assets arises from potential default of the counterparty, with a maximum exposure equal to the carrying amount of these instruments. There is no significant concentration of risks within the Group as financial instruments are spread amongst a number of financial institutions to minimise the risk of defaults by counterparties. Cash and cash equivalents are deposited with Australian Banks. The majority of trade receivables are expected to be collected within 90 days. The remainder of the financial assets are to related entities or entities that have a relationship to our associates and are either on call or where loans have a fixed maturity date, are secured by fixed and floating charges (see note 10).F
or p
erso
nal u
se o
nly

austbrokers annual report 2010100
29. Financial Instruments (continued)
ConsolidatedFinancial assets 2010 2009
$’000 $’000
Cash and cash equivalents 23,840 17,047 Trade and other receivables 5,971 6,059 Related party receivables 1,901 1,101 Loans on mortgage - related entities 347 498 Loans on mortgage - other 1,220 1,054 Other receivables 155 188
Total 33,434 25,947
The amount for trade and other receivables included in the table above excludes Insurance Broking account receivables.
(b) Liquidity Risk The company’s objective is to maintain adequate cash to ensure continuity of funding and flexibility in its day-to-day operations.
The company reviews its cash flows weekly and models expected cash flows for the following 12 to 24 months (updated monthly) to ensure that any stress on liquidity is detected, monitored and managed, before risks arise.
To monitor existing financial assets and liabilities as well as enable an effective controlling of future risks, the Group has established comprehensive risk reporting that reflects expectations of management of expected settlement of financial assets and liabilities.
The Group’s main borrowing facilities are provided by St George Bank. The terms of these arrangements have been disclosed in Note 21 Interest bearing loans and borrowings. It is the Group’s policy that the facilities expire no less than 13 months from balance date. Where facilities are due to expire, the Group will have new arrangements in place in the year the borrowing repayments become current. At 30 June 2010 there were no borrowings due to be repaid within 12 months (2009: NIL).
The company considers the maturity of its financial assets and projected cashflows from operations to monitor liquidity risk.
Liquidity risk arises in the event that the financial assets/liabilities are not able to be realised/settled for the amounts disclosed in the accounts.
The table below reflects all contractually fixed pay-outs and receivables for settlement, repayments and interest resulting from recognised financial assets and liabilities. Cash flows for financial assets and liabilities without a fixed amount or timing are based on the conditions existing at 30 June 2010 with comparatives based on conditions existing at 30 June 2009.
The table summarises the maturity profile of the Groups financial assets and financial liabilities based on contractual undiscounted payments.
Consolidated 2010 2009
$’000 $’000
Financial assetsDue not later than 6 months 171,934 156,603 6 months to not later than one year 731 352 Later than one year and not later than five years 291 1,064 Later than five years – –
Total 172,956 158,019
Financial Liabilities Due not later than 12 months (138,677) (142,099)Later than one year and not later than five years (36,623) (35,839)Later than five years – –
Total (175,300) (177,938)
The Group’s liquidity risk relating to receivables/ payables from broking operations has been included in the table above, although trust cash and amounts due from Insurance Broking Account receivables/broking account payables are not available to meet operating expenses/business obligations other than for payments to underwriters and/or repayments to policyholders.
The risk implied from the values shown in the table, reflects a balanced view of cash inflows and outflows. Lease liabilities, trade payables and other financial liabilities mainly originate from the financing of assets used in the Group’s ongoing operations such as plant and equipment and investments in working capital, e.g. trade receivables and deferred payments on broker acquisitions.
For the year ended 30 June 2010
notes to the financial statementsF
or p
erso
nal u
se o
nly

austbrokers annual report 2010 101
29. Financial Instruments (continued)
(c) Fair Values of recognised assets and liabilities.
Set out below is a comparison by category of the carrying value and the fair value of all the Group’s financial instruments.
Carrying value Fair value
2010 2009 2010 2009
$’000 $’000 $’000 $’000
Financial assets
Cash and cash equivalents 80,987 68,658 80,987 68,658
Trade and other receivables 88,612 86,520 88,612 86,520
Related party receivables 1,901 1,101 1,901 1,101
Loans on mortgage – related entities 347 498 347 498
Loans on mortgage – other 1,220 1,054 1,220 1,054
Loan with associated entities 22 188 22 188
Total financial asset 173,089 158,019 173,089 158,019
Financial liabilities
Loans and other borrowings (34,899) (34,217) (34,899) (34,217)
Trade and other payables and accruals (138,196) (141,516) (138,196) (141,516)
Total financial liabilities (173,095) (175,733) (173,095) (175,733)
Market values have been used to determine the fair value of securities. The fair value of loans and notes and other financial assets has been calculated using market interest rates The Group’s fair value of recognised assets and liabilities above include trust cash and amounts relating to receivables/ payables from broking operations, although trust cash and amounts due from Insurance Broking Account receivables/broking account payables are not available to meet operating expenses/business obligations other than for payments to underwriters and/or repayments to policyholders.
(d) Market Risk
Interest rate risk
The Group’s exposure to interest rate movements relates to cash and cash equivalents held by the Group and the Group’s long-term debt obligations. To manage interest rate risk, interest rates on borrowings are fixed for a period depending on market conditions. This risk is minimal as the Group holds cash received from policyholders to pay insurers in excess of the amount of borrowings and therefore the group has a natural hedge against interest rate rises. Loans on mortgage generally have interest rate resets every six months. In the event of interest rate rises, a net increase in interest revenue will occur due to cash and cash equivalents exceeding borrowings.
The main risk to the Group is in relation to interest rate reductions which will decrease the net income earned on cash and cash equivalents held. The cash held to pay insurers must be held in prescribed investments (Australian Bank accounts or deposits) and as such will be subject to market interest rate fluctuations. The Group has at balance date, the following mix of financial assets and liabilities exposed to Australian variable interest rate risk.
Consolidated
2010 2009
$’000 $’000
Cash and cash equivalents (including trust account balance) 80,987 68,658
Loans on mortgage – related entities 347 498
Loans on mortgage – other 1,220 1,054
Total financial assets 82,554 70,210
Financial liabilities
Loans and other borrowings (3,075) (8,842)
Net exposure to interest rate movements 79,479 61,368
Borrowings fixed for a period greater than 12 months have been excluded from the table above.
For
per
sona
l use
onl
y

austbrokers annual report 2010102
For the year ended 30 June 2010
notes to the financial statements
29. Financial Instruments (continued)
(d) Market Risk (continued)
Interest rate risk (continued)
The Group’s policy is to maintain a component of long term borrowings at fixed interest rates, determined six monthly or annually, which are carried at amortised cost and it is acknowledged that exposure to fluctuations in fair value is a by–product of the Group’s policy. $25 million has been fixed until November 2011at a rate of 6.8%, $4.65 million has been fixed until March 2012 at a rate of 5.94%, $375,000 has been fixed until September 2012 at a rate of 9.15%. and $375,000 has been fixed until March 2012 at a rate of 7.07%.
The Group constantly analyses its interest rate exposure. Within this analysis consideration is given to potential renewals of existing positions, alternative financing and the term for fixing interest rates.
The following sensitivity analysis is based on the interest rate exposures in existence at year end. The sensitivity for 2009 has been prepared on an equivalent basis.
At year end, had interest rates moved as illustrated in the table below, with all other variables held constant, post tax profits and equity would have been affected as follows:
Post Impacts directly tax profits to Equity Higher / (lower) Higher / (lower)
Judgements of reasonably possible movements. 2010 2009 2010 2009
$’000 $’000 $’000 $’000
Consolidated
+2% (200 basis points) (2009 +3% (300 basis points)) 1,156 1,474 – –
–1% (100 basis points) (2009 –1% (100 basis points)) (578) (491) – –
The net increase in consolidated profits in respect of interest rate rises is due to the net positive impact of interest bearing assets being greater than borrowings.
Price risk
Equity securities price risk arises from investments in equity securities. The group does not invest in equity securities listed on the stock exchange or derivatives.
At year end, the Group had no exposure to equities other than to shares in associated entities and controlled entities and therefore has no exposure to price risk that has not already been reflected in the financial statements. The Group tests for impairment annually and reviews all investments at least half yearly. The methodology for testing for impairment is shown in note 17. There were no impaired investments at balance date. (2009 : NIL)
(e) Capital Management
The Group’s objectives when managing capital are to safeguard the Group’s ability to continue as a going concern in order to provide returns to shareholders and benefits for other stakeholders and to maintain an optimum capital structure to reduce the cost of capital.
In order to maintain or adjust the capital structure, the Group may adjust the amount of dividends paid to shareholders, issue new shares or sell assets to reduce debt if required.
The Group monitors capital on the basis of the gearing ratio. The debt to equity ratio is calculated as total borrowings divided by total equity and borrowings.
During 2010, the Group’s strategy was to maintain a gearing ratio of not greater than 30% which was unchanged from 2009. The gearing ratio has changed marginally due to the increase in issued capital resulting from the Dividend Reinvestment Plan.
The gearing ratios at 30 June were as follows;
Consolidated
2010 2009
$’000 $’000
Debt to equity ratio
Total borrowings 34,899 34,217
Total equity 134,574 114,253
Total equity and borrowings 169,473 148,470
Debt to Equity Ratio 21% 23%
For
per
sona
l use
onl
y

austbrokers annual report 2010 103
For the year ended 30 June 2010
directors’ declaration
In accordance with a resolution of the directors of Austbrokers Holdings Limited, I state that:
In the opinion of the directors:
(a) the financial statements and notes of the consolidated entity are in accordance with the Corporations Act 2001, including:
(i) giving a true and fair view of the consolidated entity’s financial position as at 30 June 2010 and of its performance for the year ended on that date; and
(ii) complying with Australian Accounting Standards (including the Australian Accounting Interpretations) and the Corporations Regulations 2001;
(b) the financial statements and notes also comply with International Financial Reporting Standards as disclosed in note 3.1; and
(c) there are reasonable grounds to believe that the Company will be able to pay its debts as and when they become due and payable
(d) this declaration has been made after receiving the declarations required to be made to the Directors in accordance with section 295A of the Corporations Act 2001 for the financial year ending 30 June 2010.
On behalf of the Board
W L McKeough
Director
Sydney, 26 August 2010
For
per
sona
l use
onl
y

austbrokers annual report 2010104
Report on the Financial Report
We have audited the accompanying financial report of Austbrokers Holdings Limited, which comprises the statement of financial position as at 30 June 2010, and the income statement, statement of comprehensive income, statement of changes in equity and statement of cash flows for the year ended on that date, a summary of significant accounting policies, other explanatory notes and the directors’ declaration of the consolidated entity comprising the company and the entities it controlled at the year’s end or from time to time during the financial year.
Directors’ Responsibility for the Financial Report
The directors of the company are responsible for the preparation and fair presentation of the financial report in accordance with the Australian Accounting Standards (including the Australian Accounting Interpretations) and the Corporations Act 2001. This responsibility includes establishing and maintaining internal controls relevant to the preparation and fair presentation of the financial report that is free from material misstatement, whether due to fraud or error; selecting and applying appropriate accounting policies; and making accounting estimates that are reasonable in the circumstances. In Note 3(b), the directors also state that the financial report, comprising the financial statements and notes, complies with International Financial Reporting Standards as issued by the International Accounting Standards Board.
Auditor’s Responsibility
Our responsibility is to express an opinion on the financial report based on our audit. We conducted our audit in accordance with Australian Auditing Standards and International Standards on Auditing. These Auditing Standards require that we comply with relevant ethical requirements relating to audit engagements and plan and perform the audit to obtain reasonable assurance whether the financial report is free from material misstatement.
An audit involves performing procedures to obtain audit evidence about the amounts and disclosures in the financial report. The procedures selected depend on our judgment, including the assessment of the risks of material misstatement of the financial report, whether due to fraud or error. In making those risk assessments, we consider internal controls relevant to the entity’s preparation and fair presentation of the financial report in order to design audit procedures that are appropriate in the circumstances, but not for the purpose of expressing an opinion on the effectiveness of the entity’s internal controls. An audit also includes evaluating the appropriateness of accounting policies used and the reasonableness of accounting estimates made by the directors, as well as evaluating the overall presentation of the financial report.
We believe that the audit evidence we have obtained is sufficient and appropriate to provide a basis for our audit opinion.
Independence
In conducting our audit we have met the independence requirements of the Corporations Act 2001. We have given to the directors of the company a written Auditor’s Independence Declaration, a copy of which is included in the directors’ report. In addition to our audit of the financial report, we were engaged to undertake the services disclosed in the notes to the financial statements. The provision of these services has not impaired our independence.
Auditor’s Opinion
In our opinion:
1. the financial report of Austbrokers Holdings Limited is in accordance with the Corporations Act 2001, including:
(i) giving a true and fair view of the consolidated entity’s financial position of Austbrokers Holdings Limited at 30 June 2010 and of its performance for the year ended on that date; and
(ii) complying with Australian Accounting Standards (including the Australian Accounting Interpretations) and the Corporations Regulations 2001.
2. the financial report also complies with International Financial Reporting Standards as issued by the International Accounting Standards Board.
Report on the Remuneration Report
We have audited the Remuneration Report included in pages 46 to 52 of the directors’ report for the year ended 30 June 2010. The directors of the company are responsible for the preparation and presentation of the Remuneration Report in accordance with section 300A of the Corporations Act 2001 . Our responsibility is to express an opinion on the Remuneration Report, based on our audit conducted in accordance with Australian Auditing Standards.
Auditor’s Opinion
In our opinion the Remuneration Report of Austbrokers Holdings Limited for the year ended 30 June 2010, complies with section 300A of the Corporations Act 2001.
Ernst & Young
Paul HarrisPartnerSydney, 26 August 2010
To the members of Austbrokers Holdings Limited
independent auditor’s report F
or p
erso
nal u
se o
nly

austbrokers annual report 2010 105
ASX additional information
Additional information required by the Australian Stock Exchange Ltd and not shown elsewhere in this report is as follows. The information is current as at 7 September 2010.
(a) Distribution of equity securities
Ordinary share capital
– 50,736,987 paid ordinary shares are held by 1,251 individual shareholders.
All issued ordinary shares carry one vote per share and carry the rights to dividends.
Options
– 1,929,333 options are held by 12 individual option holders.
Options do not carry a right to vote.
The number of shareholders, by size of holding, in each class are:
Fully paid ordinary shares Options
1 – 1000 32 –
1,001 – 5,000 155 –
5,001 – 10,000 234 –
10,001 – 100,000 595 4
100,001 and over 235 8
1,251 12
Holding less than a marketable parcel 35 –
(b) Substantial shareholders Fully paid
Ordinary shareholders Number Percentage
QBE Insurance Group Limited (23/12/09) 7,469,201 14.40Invesco Australia Limited (13/08/10) 3,826,948 7.26Challenger Financial Services Group Limited (23/07/10) 3,530,312 6.69Westpac Banking Corporation / BT Investment Management Limited (10/08/09) 3,103,463 6.18Aviva Investors Australia Limited (27/04/10) 2,871,540 5.54Allianz Australia Insurance Limited (27/08/07) 2,557,000 5.01
(c) Twenty largest holders of quoted equity securities Fully paid
Ordinary shareholders Number Percentage
National Nominees Limited 9,525,792 18.06Citicorp Nominees Pty Limited 9,003,615 17.07J P Morgan Nominees Australia Limited 7,592,822 14.40HSBC Custody Nominees <Australia Ltd> 2,833,017 5.37Aust Executor Trustees NSW Ltd <Tea Custodians Limited> 2,058,038 3.90Cogent Nominees Pty Limited (SMP Account) 1,650,999 3.13Cogent Nominees Pty Ltd 1,101,314 2.09RBC Dexia Investor Services Australia Nominees Pty Ltd <PIPOOLED A/C> 1,067,578 2.02UBS Wealth Management Australia Nominees Pty Ltd 1,004,142 1.90UBS Nominees <PB SEG A/C> 955,274 1.81Milton Corporation Limited 856,046 1.62Mirrabooka Investments Limited 800,000 1.52ANZ Nominees Limited <Income Reinvest Plan A/C> 747,279 1.42Citicorp Nominees Pty Limited <CFSIL CWLTH SMALL CO 7 A/C> 695,507 1.32ANZ Nominees Limited <Cash Income A/C> 691,253 1.31Masfen Securities Limited 535,148 1.01SIB Holdings Pty Ltd <SIB UNIT A/C> 494,882 0.94JDV Limited <ENT INVESTMENT FUND A/C> 377,466 0.72RBC Dexia Investor Services Nominees Pty Limited <BKUST A/C> 323,193 0.61Citicorp Nominees Pty Limited <CFSIL CWLTH SML COS 1 A/C> 265,931 0.50
For
per
sona
l use
onl
y

austbrokers annual report 2010106
annual general meeting
The annual General Meeting of Austbrokers Holdings Limited will be held at the Four Seasons Hotel, 199 George Street, Sydney, NSW 2000 on Tuesday, 23 of November 2010 at 10.00am.
For
per
sona
l use
onl
y

austbrokers annual report 2010 107
This annual report covers the consolidated entity comprising Austbrokers Holdings Limited and its controlled entities. The Group’s functional and presentation currency is AUD ($).
A description of the Group’s operations and of its principal activities is included in the operating and financial review in the Directors’ report on pages 44 - 45.
Directors
R.A. Longes (Chairman)
W.L. McKeough (Chief Executive)
D.J. Harricks
P.R. Shirriff
Company Secretary
S.S. Rouvray
Registered Office
Level 21
111 Pacific Highway
North Sydney, NSW 2060
Phone: +61 2 9935 2222
Share Register
Link Market Services Limited
Level 12
680 George Street
Sydney, NSW 2000
Phone: +61 1800 194 270 (Outside Australia +61 2 8280 7209)
Solicitors
Clayton Utz
1 O’Connell Street
Sydney, NSW 2000
Bankers
St George Bank Limited
65 Berry Street
North Sydney, NSW 2060
Auditors
Ernst & Young
680 George Street
Sydney, NSW 2000
abn 60 000 000 715
corporate directoryF
or p
erso
nal u
se o
nly

austbrokers annual report 2010108
This page has been left blank intentionally
For
per
sona
l use
onl
y

Austbrokers is a leading network of insurance broking firms focused on servicing more than 200,000 clients across Australia, with a particular focus on small to medium sized businesses. The Austbrokers equity partnership business model allows member firms to benefit from the strength and scale of a national company, while still retaining the personalised service, specialisation and local knowledge that the brokers foster. Austbrokers also offers underwriting agency services to brokers through its Austagencies subsidiary, and is continually developing and expanding the company’s presence in other financial services sectors such as life insurance and superannuation.
statement of purpose
Leonard Francis Earl14.10.1946 – 12.7.2010
In memory of
Frank Earl served as a Director of Austbrokers from April 2005 and made a substantial contribution to the company through its initial
public offering and to its success over the subsequent five years. Frank was highly respected across the industry for his knowledge of and
experience in insurance broking, both in Australia and overseas.
Frank will be sorely missed as a colleague, friend and mentor by all at Austbrokers particularly his good humour and the positive and
open manner in which he approached business and life in general.
For
per
sona
l use
onl
y

austb
rokers an
nu
al repo
rt 2010
annual report 2010
For
per
sona
l use
onl
y