THE COMMONWEALTH FUND Achieving Person-Centered Primary Care: The Patient-Centered Medical Home...
22
THE COMMONWEALTH FUND Achieving Person-Centered Primary Care: The Patient-Centered Medical Home Melinda K. Abrams, M.S. Assistant Vice President The Commonwealth Fund [email protected] Senate Special Committee on Aging Hearing on “Achieving Person-Centered Primary Care: The Patient-Centered Medical Home” July 23, 2008 Charts to accompany written testimony
-
Upload
gavin-shelton -
Category
Documents
-
view
219 -
download
0
Transcript of THE COMMONWEALTH FUND Achieving Person-Centered Primary Care: The Patient-Centered Medical Home...

THE COMMONWEALTH
FUND
Achieving Person-Centered Primary Care: The Patient-Centered Medical Home
Melinda K. Abrams, M.S.Assistant Vice President
The Commonwealth [email protected]
Senate Special Committee on AgingHearing on “Achieving Person-Centered Primary Care:
The Patient-Centered Medical Home”July 23, 2008
Charts to accompany written testimony

Percent saying very or somewhat important
Figure 1. Strong Public Support for “Medical Home”:Accessible, Personal, Coordinated Care
80 78 78 74 78 84 80
17 18 20 16 12 1515
0
25
50
75
100
AUS CAN GER NETH NZ UK US
Very Important Somewhat Important
When you need care, how important is it that you have one practice/clinic wheredoctors and nurses know you, provide and coordinate the care that you need?
Source: 2007 Commonwealth Fund International Health Policy Survey.

Figure 2. Scores: Dimensions of aHigh Performance Health System
75
72
67
52
70
67
72
71
58
53
71
65
0 100
Healthy Lives
Quality
Access
Efficiency
Equity
OVERALL SCORE
2006 Revised
2008
Source: Commonwealth Fund National Scorecard on U.S. Health System Performance, 2008.

Figure 3. Average Medical Specialty Salaries
Source: Reprinted with permission from the Medical Group Management Association, 104 Inverness Terrace East,Englewood, CO 80112-5306; (303) 799-1111; www.mgma.com. Copyright 2006.
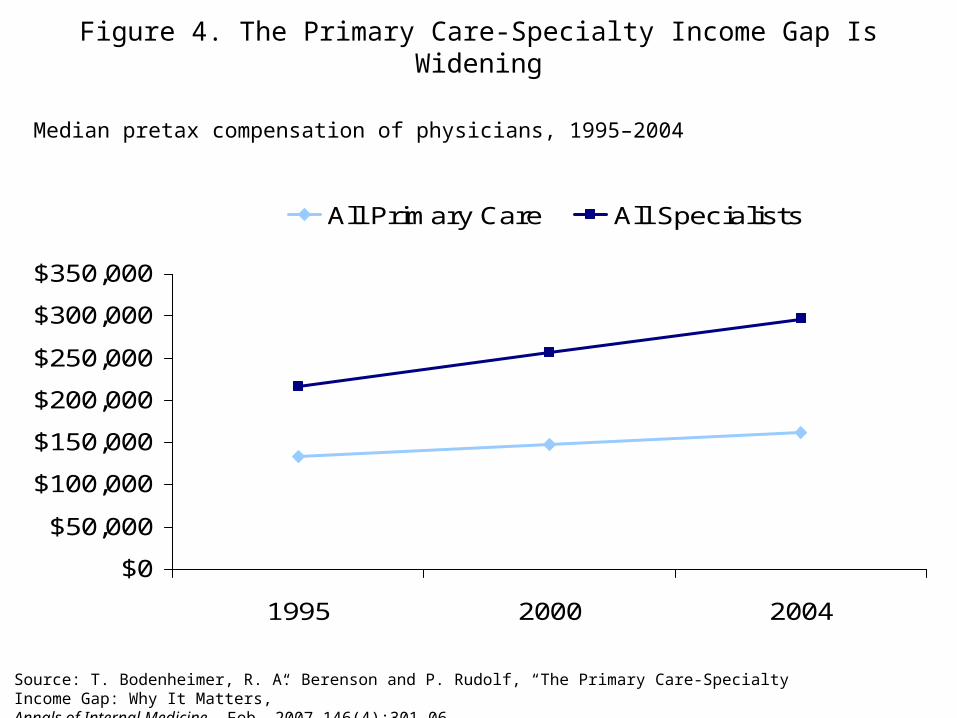
Figure 4. The Primary Care-Specialty Income Gap Is Widening
$0
$50,000
$100,000
$150,000
$200,000
$250,000
$300,000
$350,000
1995 2000 2004
All Primary Care All Specialists
Source: T. Bodenheimer, R. A. Berenson and P. Rudolf, “The Primary Care-Specialty Income Gap: Why It Matters,”Annals of Internal Medicine, Feb. 2007 146(4):301–06.
Median pretax compensation of physicians, 1995–2004
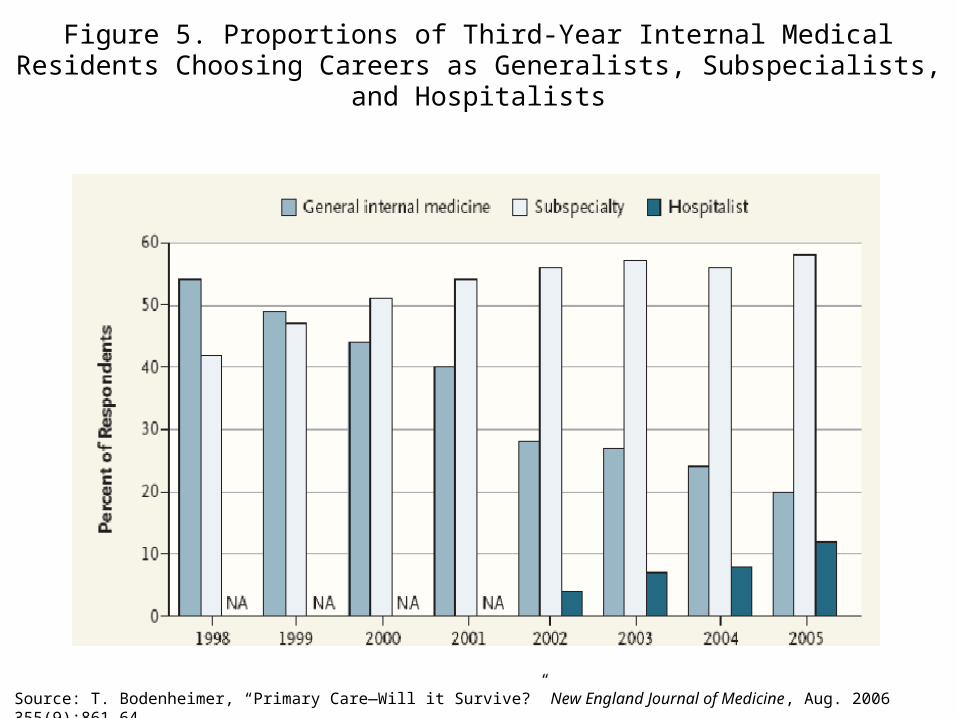
Figure 5. Proportions of Third-Year Internal Medical Residents Choosing Careers as Generalists, Subspecialists,
and Hospitalists
Source: T. Bodenheimer, “Primary Care—Will it Survive?” New England Journal of Medicine, Aug. 2006 355(9):861–64.

0
0.5
1
1.5
2
1000 1500 2000 2500 3000 3500 4000
Per Capita Health Care Expenditures
Pri
ma
ry C
are
Sco
re
Figure 6. Primary Care Score vs. Health Care Expenditures, 1997
Starfield 10/0000-133
US
NTH
CANAUS
SWEJAP
BEL FRGER
SP
DK
FIN
UK
Starfield 10/00IC 1731
Source: B. Starfield, Why More Primary Care: Better Outcomes, Lower Costs, Greater Equity, presentation given at the Primary Care Roundtable: Strengthening Adult Primary Care: Models and Policy Options, Oct. 2006.

Figure 7. 2007 International SurveyIndicators of a Medical Home: U.S.
Indicator Percent
Patient has regular doctor or place of care
90
Doctor/staff know important information about patient’s history
74
Place is easy to contact by phone during regular office hours
57
Doctor/staff help coordinate care received from other doctors/sources of care
50
All four indicators of Medical Home 50
Source: 2007 Commonwealth Fund International Health Policy Survey.

Figure 8. Access: Patients with a Medical Home Less Likelyto Report Difficulty Getting Care on Nights, Weekends,
and Holidays Without Going to the ER
57 57
41 41 42 43
616472
495858
7374
0
25
50
75
100
AUS CAN GER NETH NZ UK US
Has medical home No medical home
Percent reporting very/somewhat difficult
Note: Medical home includes having a regular provider that knows you, is easy to contact, and coordinates your care.Source: 2007 Commonwealth Fund International Health Policy Survey.Data collection: Harris Interactive, Inc.

Figure 9. Communication/Decision Making:Doctor Always Explains Things, Spends Enough Time with You, and
Involves You in Decisions, by Medical Home
83 79 78 7883
75 77
454751
585751
56
0
25
50
75
100
AUS CAN GER NETH NZ UK US
Has medical home No medical home
Average percent of adults with a regular doctor or place of care reporting “always” across three indicators of doctor-patient communication
Note: Medical home includes having a regular provider that knows you, is easy to contact, and coordinates your care.Source: 2007 Commonwealth Fund International Health Policy Survey.Data collection: Harris Interactive, Inc.

Figure 10. Coordination: Medical Records Not Available During Visit or Duplicative Tests, by Medical Home
11 10
16
8 8 7
16
29
1918
11
2319
27
0
25
50
AUS CAN GER NETH NZ UK US
Has medical home No medical home
Percent of adults reporting
Note: Medical home includes having a regular provider that knows you, is easy to contact, and coordinates your care.Source: 2007 Commonwealth Fund International Health Policy Survey.Data collection: Harris Interactive, Inc.

Percent any medical, medication, or lab error
Figure 11. Safety: Any Patient-Reported Error
18 17
11
1715
11
21
29
1922
3026
3430
0
25
50
AUS CAN GER NETH NZ UK US
Has medical home No medical home
Base: Adults with chronic condition
Note: Errors include medical mistake, wrong medication/dose, or lab/diagnostic errors. Medical home includes having a regular provider that knows you, is easy to contact, and coordinates your care.Source: 2007 Commonwealth Fund International Health Policy Survey.Data collection: Harris Interactive, Inc.

Figure 12. Chronically Ill: Doctor Gives You Written Planfor Managing Care at Home, by Medical Home
4538
24
36 3934
55
47
2530
27
19
2832
0
25
50
75
AUS CAN GER NETH NZ UK US
Has medical home No medical home
Percent with care plan
Base: Adults with chronic condition
Note: Medical home includes having a regular provider that knows you, is easy to contact, and coordinates your care.Source: 2007 Commonwealth Fund International Health Policy Survey.Data collection: Harris Interactive, Inc.
Figure 13. Receive Reminder for Preventive/Follow-Up Care, by Medical Home
50 49
6763
51
64
76
63
5044
5448
2935
0
25
50
75
100
AUS CAN GER NETH NZ UK US
Has medical home No medical home
Percent with reminder
Base: Adults with a chronic condition
Note: Medical home includes having a regular provider that knows you, is easy to contact, and coordinates your care.Source: 2007 Commonwealth Fund International Health Policy Survey.Data collection: Harris Interactive, Inc.

Figure 14. 2006 Fund Quality of Care SurveyIndicators of a Medical Home
(adults 18–64)
Total Percent by Race
IndicatorEstimated millions Percent White
African American Hispanic
Asian American
Regular doctoror source of care 142 80 85 79 57 84
Among those with a regular doctor or source of care . . .
Not difficult to contact provider over telephone
121 85 88 82 76 84
Not difficult to get care or medical advice after hours
92 65 65 69 60 66
Doctors’ office visits are always or often well organized and running on time
93 66 68 65 60 62
All four indicatorsof medical home 47 27 28 34 15 26
Source: Commonwealth Fund 2006 Health Care Quality Survey.

Figure 15. Racial and Ethnic Differences in Getting Needed Medical Care Are Eliminated When Adults Have Medical Homes
Percent of adults 18–64 reporting always getting care they need when they need it
Note: Medical home includes having a regular provider or place of care, reporting no difficulty contacting provider by phone or getting advice and medical care on weekends or evenings, and always or often finding office visits well organized and running on time.Source: Commonwealth Fund 2006 Health Care Quality Survey.
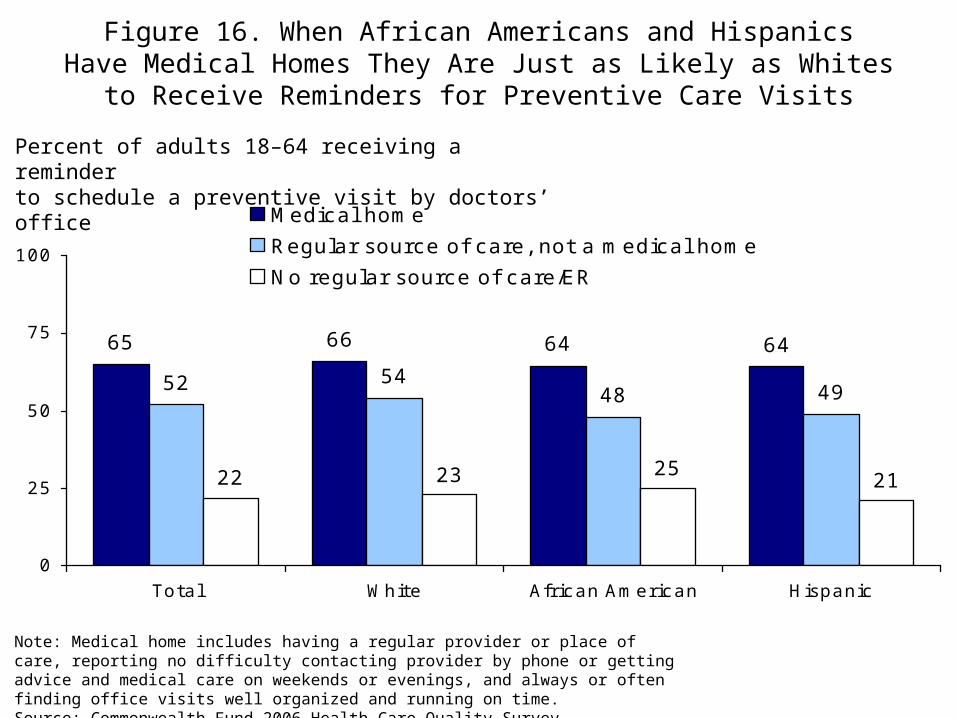
65 66 64 64
52 5448 49
21252322
0
25
50
75
100
Total White African American Hispanic
Medical home
Regular source of care, not a medical home
No regular source of care/ER
Figure 16. When African Americans and HispanicsHave Medical Homes They Are Just as Likely as Whites
to Receive Reminders for Preventive Care Visits
Percent of adults 18–64 receiving a reminderto schedule a preventive visit by doctors’ office
Note: Medical home includes having a regular provider or place of care, reporting no difficulty contacting provider by phone or getting advice and medical care on weekends or evenings, and always or often finding office visits well organized and running on time.Source: Commonwealth Fund 2006 Health Care Quality Survey.

Figure 17. Adults with a Medical Home Are More Likelyto Report Checking Their Blood Pressure Regularly
and Keeping It in Control
2942
25
1510
17
56 48 58
0
25
50
75
100
Total Medical home Regular source of care,
not a medical home
Does not check BP
Checks BP , not controlled
Checks BP , controlledPercent of adults 18–64with high blood pressure
Note: Medical home includes having a regular provider or place of care, reporting no difficulty contacting provider by phone or getting advice and medical care on weekends or evenings, and always or often finding office visits well organized and running on time.Source: Commonwealth Fund 2006 Health Care Quality Survey.

Figure 18. Estimated Distribution of 10-Year Impact on Spending from Strengthening Primary Care and Care Coordination
Source: Based on estimates by The Lewin Group for The Commonwealth Fund, 2007.
Dollars in billions
SA
VIN
GS C
OSTS

Figure 19. Community Care of North Carolina: Medical Homes
Can Save Health Care Costs
Asthma Initiative:Pediatric Asthma
Hospitalization Rates
(April 2000–December 2002)
Source: L. A. Dobson, Presentation to ERISA Industry Committee, Washington, D.C., Mar. 12, 2007 (Updated June ’08).
In patient admission rate per 1,000 member months
• 14 networks, 3,200 MDs, >800,000 patients
• $3 PMPM to each network
• Hire care managers/medical management staff
• $2.50 PMPM to each PCP to serve as medical home and participate in disease management
• Care improvement: asthma, diabetes, screening/referral of young children for developmental problems, and more!
• Case management: identify and facilitate management of costly patients
• Cost (FY2004) - $10.2 Million investment; Savings: $124M compared to FY2003 and $225M compared to Medicaid FFS (Mercer Consulting)
5.3
8.2
0123456789
10
Access I Access II & III
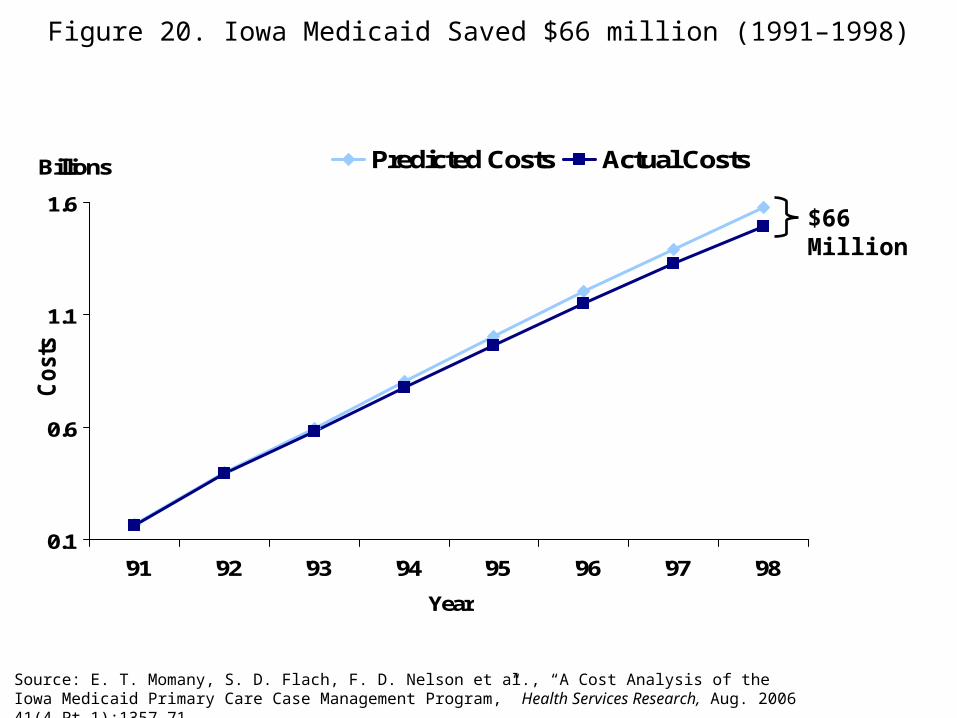
Figure 20. Iowa Medicaid Saved $66 million (1991–1998)
0.1
0.6
1.1
1.6
'91 '92 '93 '94 '95 '96 '97 '98
Billions
Year
Costs
t
Predicted Costs Actual Costs
Source: E. T. Momany, S. D. Flach, F. D. Nelson et al., “A Cost Analysis of the Iowa Medicaid Primary Care Case Management Program,” Health Services Research, Aug. 2006 41(4 Pt 1):1357–71.
$66 Million

Figure 21. Overview of Current Pilot Activity and Planning Discussions of the PCMH
(as of July 2008)
Multi-payer pilot discussions/activity
RI
Identified pilot activity
No identified pilot activity
Source: Patient-Centered Primary Care Collaborative, July 16, 2008.