The Combustion-based CO Emissions Data for GTAP Version · PDF file1 The Combustion-based CO2...
44
1 The Combustion-based CO 2 Emissions Data for GTAP Version 7 Data Base Huey-Lin Lee Department of Economic, National Chengchi University, Taipei 11605, Taiwan. Email: [email protected] December, 2008 Table of Contents: 1. Introduction ................................................................................................................... 3 2. Calculation of CO 2 emissions from fossil fuel combustion .......................................... 3 3. Top five CO 2 emitting countries/regions ....................................................................... 4 References ......................................................................................................................... 16 Appendix ........................................................................................................................... 41 List of Figures: Figure 1. The top five CO 2 emitting countries ............................................................... 5 Figure 2. Energy-specific CO 2 emitting shares: U.S.A. ................................................ 5 Figure 3. Sectoral CO 2 emitting shares: U.S.A.............................................................. 6 Figure 4. Energy-specific CO 2 emitting shares: China .................................................. 7 Figure 5. Sectoral CO 2 emitting shares: China .............................................................. 7 Figure 6. Energy-specific CO 2 emitting shares: EU27 .................................................. 9 Figure 7. Sectoral CO 2 emitting shares: EU27 .............................................................. 9 Figure 8. Energy-specific CO 2 emitting shares: Russia ............................................... 10 Figure 9. Sectoral CO 2 emitting shares: Russia ........................................................... 10 Figure 10. Energy-specific CO 2 emitting shares: Japan ............................................ 11 Figure 11. Sectoral CO 2 emitting shares: Japan......................................................... 11 Figure 12. Energy-specific CO 2 emitting shares: India ............................................. 12 Figure 13. Sectoral CO 2 emitting shares: India ......................................................... 12 Figure 14. Top 10 emitting countries/regions of oil-based CO 2 ................................ 13 Figure 15. Top 10 emitting countries/regions of coal-based CO 2 ............................. 13 Figure 16. Top 10 emitting countries/regions of natural gas-based CO 2 ................... 14 Figure 17. Top 10 emitting countries/regions of petroleum-based CO 2 .................... 14 Figure 18. Top 10 emitting countries/regions of gas distribution-based CO 2 ........... 15
Transcript of The Combustion-based CO Emissions Data for GTAP Version · PDF file1 The Combustion-based CO2...

1
The Combustion-based CO2 Emissions Data for GTAP Version 7 Data Base
Huey-Lin Lee
Department of Economic, National Chengchi University, Taipei 11605, Taiwan.
Email: [email protected]
December, 2008
Table of Contents:
1. Introduction ...................................................................................................................3
2. Calculation of CO2 emissions from fossil fuel combustion ..........................................3
3. Top five CO2 emitting countries/regions.......................................................................4
References .........................................................................................................................16
Appendix ...........................................................................................................................41
List of Figures:
Figure 1. The top five CO2 emitting countries............................................................... 5
Figure 2. Energy-specific CO2 emitting shares: U.S.A. ................................................ 5
Figure 3. Sectoral CO2 emitting shares: U.S.A.............................................................. 6
Figure 4. Energy-specific CO2 emitting shares: China.................................................. 7
Figure 5. Sectoral CO2 emitting shares: China .............................................................. 7
Figure 6. Energy-specific CO2 emitting shares: EU27 .................................................. 9
Figure 7. Sectoral CO2 emitting shares: EU27 .............................................................. 9
Figure 8. Energy-specific CO2 emitting shares: Russia............................................... 10
Figure 9. Sectoral CO2 emitting shares: Russia ........................................................... 10
Figure 10. Energy-specific CO2 emitting shares: Japan ............................................ 11
Figure 11. Sectoral CO2 emitting shares: Japan......................................................... 11
Figure 12. Energy-specific CO2 emitting shares: India ............................................. 12
Figure 13. Sectoral CO2 emitting shares: India ......................................................... 12
Figure 14. Top 10 emitting countries/regions of oil-based CO2................................ 13
Figure 15. Top 10 emitting countries/regions of coal-based CO2 ............................. 13
Figure 16. Top 10 emitting countries/regions of natural gas-based CO2................... 14
Figure 17. Top 10 emitting countries/regions of petroleum-based CO2.................... 14
Figure 18. Top 10 emitting countries/regions of gas distribution-based CO2 ........... 15

2
List of Tables:
Table 1. CO 2 emissions and fossil fuel consumption of U.S.A., 2004 .................... 17
Table 2. CO 2 emissions and fossil fuel consumption of China, 2004...................... 19
Table 3. CO 2 emissions and fossil fuel consumption of EU27, 2004 ...................... 21
Table 4. CO 2 emissions and fossil fuel consumption of Russian Federation, 2004. 23
Table 5. CO 2 emissions and fossil fuel consumption of Japan, 2004 ...................... 25
Table 6. CO 2 emissions and fossil fuel consumption of India, 2004 ....................... 27
Table 1a Significance of CO 2 emissions from emitters: U.S.A., 2004..................... 29
Table 2a Significance of CO 2 emissions from emitters: China, 2004 ...................... 31
Table 3a Significance of CO 2 emissions from emitters: EU27, 2004....................... 33
Table 4a Significance of CO 2 emissions from emitters: Russian Federation, 2004 . 35
Table 5a Significance of CO 2 emissions from emitters: Japan, 2004....................... 37
Table 6a Significance of CO 2 emissions from emitters: India, 2004........................ 39
Table A1. Values of coefficients in Equation 1 ............................................................... 41
Table A2. Feedstock use ratios of fuels by the petrochemistry sector ............................. 42

3
1. Introduction
This document describes the compilation of carbon emissions from fossil fuel
combustion by users (or sectors) of all the 113 regions as covered in the GTAP version 7
data base (Badri and Walmsley, 2008). We calculate combustion-based CO2 emissions
from the GTAP energy volume data (file named gsdvole.har among the GTAPAgg
decrypted files), which is hoped to ensure an internal consistency in terms of
classification of uses as well as consistency between values and volumes. We adopt the
Tier 1 method of the revised 1996 IPCC Guideline (IPCC/OECD/IEA, 1997) in the
calculation. We explain in section 2 how we calculate CO2 emissions from the GTAP
energy volume data. We summarize in section 3 the top five CO2 emitting countries in
the world and discuss briefly some eye-catching facts as the data reveal.
2. Calculation of CO2 emissions from fossil fuel combustion
The procedure we take for calculating CO2 emissions from the GTAP energy volume data
(i.e., the gsdvole.har) is as follows.
We follow the Tier 1 method as suggested in the revised 1996 IPCC Guidelines
(IPCC/OECD/IEA, 1997) to estimate CO2 emissions, based on the GTAP energy volume
data. The formula to calculate CO2 emissions is as follows:
CO2ijr =
FCijr × CCi × (1 - CSTijr) × EFi × FOCi ×
44
12 /1000,
iEGY_COMM, jALLSEC, rREG. (1)
Set EGY_COMM contains six energy commodities by the GTAP sector classification:
coal (ecoa), crude oil (eoil), natural gas (egas), petroleum products (ep_c), electricity
(eely), and gas distribution (egdt);
set ALLSECT contains all producers (set TRAD_COMM) and private households;
and
set REG contains all 113 regions of the GTAP version 7 data base classification.
Coefficients are defined as follows:
CO2ijr: CO2 emissions (giga gram, or Gg) from energy commodity i used by sector j
of region r;
FCijr: fuel consumption (1000 tons of oil equivalent, or 1000 toe) of energy
commodity i by sector j of region r;
CCi: conversion coefficient (tera joule per 1000 toe) of energy commodity i;
CSTijr: ratio of carbon stored of energy commodity i used by sector j of region r;
EFi: emission factor (tones Carbon per tera joule, or tC/TJ) of energy commodity i;
and
FOCi: fraction of carbon oxidized of energy commodity i.

4
GTAP-commodity-specific values of coefficients CC, EF, and FOC are listed in
Table A1.
Coefficient CST in Equation 1 accounts for fuels used as feedstocks—natural gas
(egas) and petroleum products (ep_c) used by petrochemical sector. Ratios of feedstock
usage of the petrochemical sector are derived from the energy balance tables (OECD/IEA,
2006a; OECD/IEA, 2006b). We list the feedstock ratios in Table A2 in the appendix.
Primary energy commodities are largely used for energy transformation. We specify
non-zero values of CST to avoid double-counting of CO2 emissions for energy trans-
formation activities. Due to dearth of information, we arbitrarily assume unity for the
CST's corresponding to energy transformation activities.
3. Top five CO2 emitting countries/regions
We select the top five emitting countries/regions to show their CO2 emissions and
associated energy consumption. Tables 1 - 6 show the country-specific data of CO2
emissions and energy consumption by sectors (following classification of GTAP version
7 data base). Unit of CO2 emissions is giga-gram (Gg). Unit of energy consumption is ton
of oil equivalent (toe). Tables 1a - 6a show the country-specifi sectoral significance of
CO2 emissions in terms of percentage in country total CO2 emissions.
Figure 1 shows the shares of the top five emitting countries/regions:
(1) U.S.A.: total CO2 emissions in 2004 is 6,069,543 Gg, which accounts for
23.35% of the world total;
(2) China (shorthanded as CHN): total CO2 emissions in 2004 is 4,414,122 Gg,
which accounts for16.98 % of the world total;
(3) EU27: total CO2 emissions in 2004 is 3,967,078 Gg, which accounts for
15.26% of the world total;
(4) Russia Federation (shorthanded as RUS): total CO2 emissions in 2004 is
1,552,470 Gg, which accounts for 5.97% of the world total;
(5) Japan (shorthanded as JPN): total CO2 emissions in 2004 is 1,095,640 Gg,
which accounts for 4.21% of the world total;
(6) India (shorthanded as IND): total CO2 emissions in 2004 is 1,061,474 Gg,
which accounts for 4.08% of the world total;
Figure 2 shows that petroleum products and coal are the key sources of
combustion-based CO2 emissions of the U.S., which take 40.40% and 33.49%
respectively. Figure 3 shows that electricity (ELY), private households and transport nec
(OTP) sectors contributed significantly to the U.S. CO2 emissions of 2004, which takes
41%, 20% and 13% respectively. From Table 1a, we can see that petroleum-based CO2
emissions of the U.S. are mainly from the households sector and the transport nec (OTP)
sector; and coal-based CO2 emissions are mainly from the electricity (ELY) sector.

5
Figure 1. The top five CO2 emitting countries
Figure 2. Energy-specific CO2 emitting shares: U.S.A.

6
Figure 3. Sectoral CO2 emitting shares: U.S.A.
Figure 4 shows that coal and petroleum products are the key sources of China’s
combustion-based CO2 emissions, which take 75.75% and 20.48% respectively. Figure 5
shows that electricity (ELY) and the manufacture sectors contributed significantly to
China’s CO2 emissions of 2004, which takes 52% and 15% respectively. From Table 2a,
we can see that China’s coal-based CO2 emissions are mainly from the electricity (ELY)
sector; and petroleum-based CO2 emissions are mainly from the private households,
transport nec (OTP) and water transport (WTP) sectors.

7
Figure 4. Energy-specific CO2 emitting shares: China
Figure 5. Sectoral CO2 emitting shares: China

8
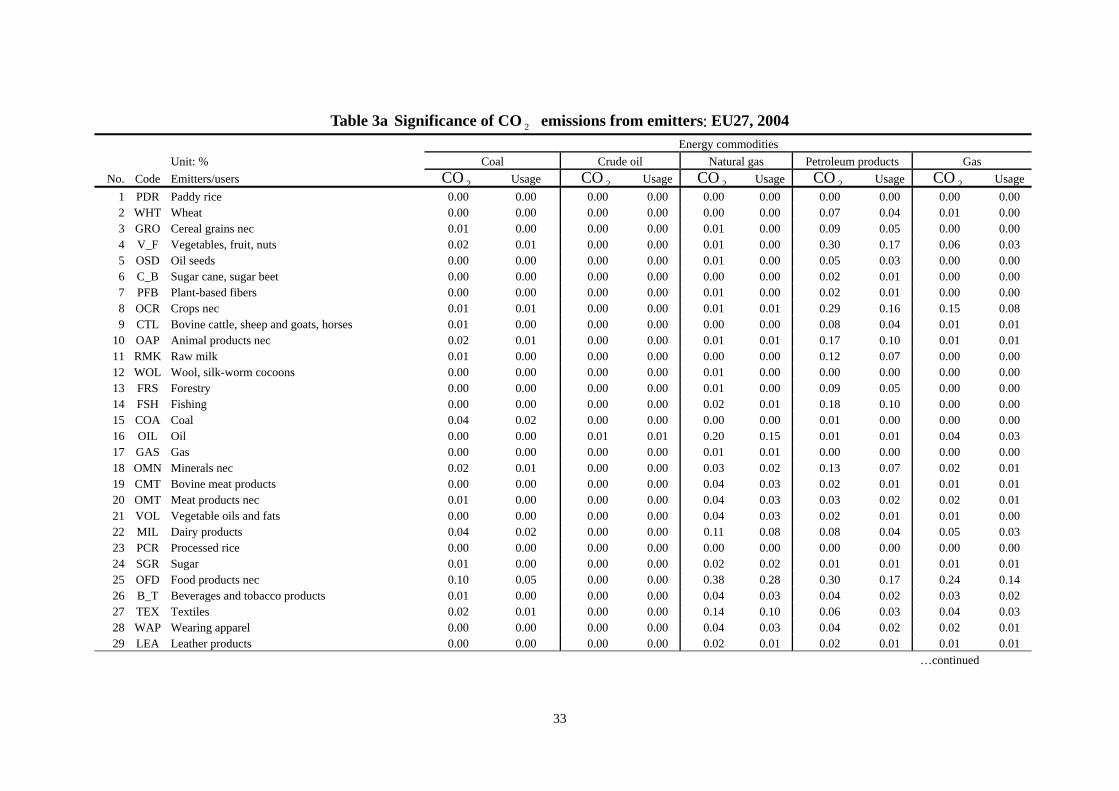
Figure 6 shows that petroleum products, coal and natural gas are the key sources of
EU27’s combustion-based CO2 emissions, which take 45.38%, 26.31%, and 17.14%
respectively. Figure 7 shows that electricity (ELY), private households and the transport
nec (OTP) sectors contributed significantly to EU27’s CO2 emissions of 2004, which
takes 35%, 23%, and 15% respectively. From Table 3a, we can see that EU27’s
petroleum-based CO2 emissions are mainly from the transport nec (OTP) and private
households sectors; and coal-based CO2 emissions are mainly from the electricity (ELY)
sector.
Figure 8 shows that natural gas, petroleum products, gas distribution as well as coal
contribute quite evenly to Russia’s combustion-based CO2 emissions, which take 33.81%,
23.02%, 22.53% and 19.99% respectively. Figure 9 shows that electricity (ELY), private
households and the transport nec (OTP) sectors contributed significantly to Russia’s CO2
emissions of 2004 as an individual sector, which takes 55%, 14%, and 11% respectively.
From Table 4a, we can see that Russia’s natural gas based CO2 emissions are mainly
from the electricity (ELY) sector; petroleum-based CO2 emissions are mainly from the
transport nec (OTP), private households and electricity (ELY) sectors; gas distribution
based CO2 emissions are mainly from the electricity (ELY) and private households
sectors; and coal-based CO2 emissions are mainly from the electricity (ELY) sector.
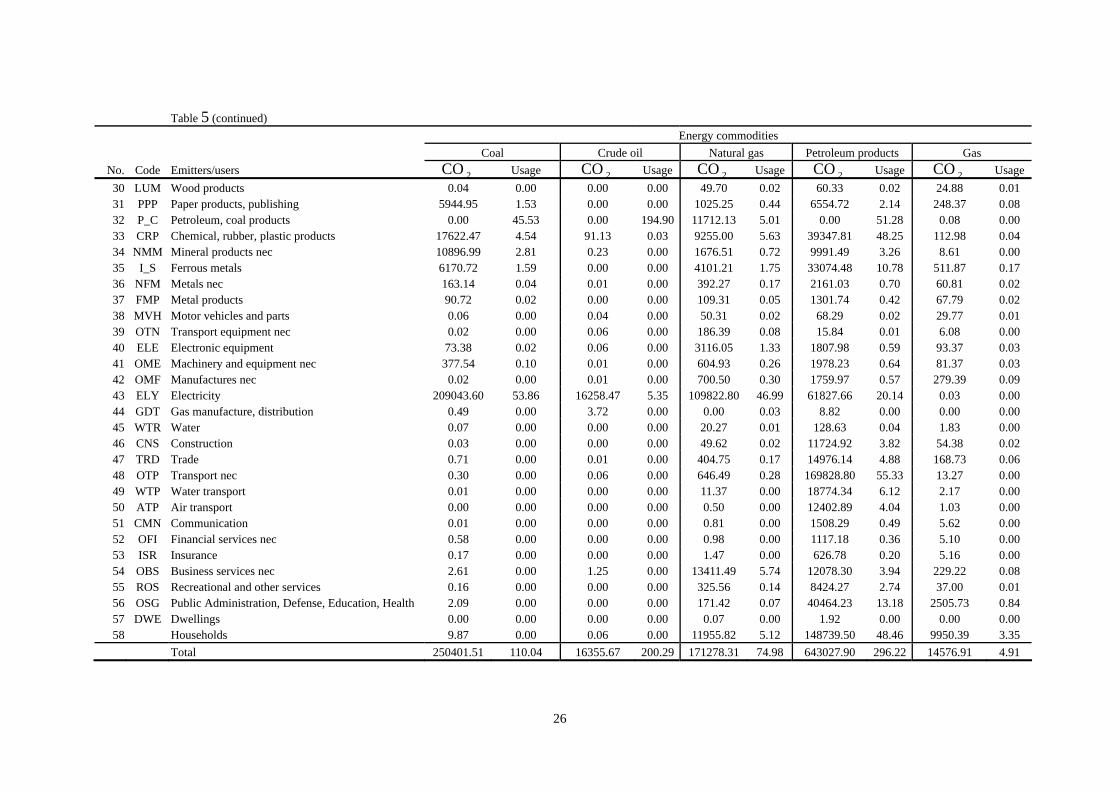
Figure 10 shows that petroleum products, coal and natural gas are the key sources of
Japan’s combustion-based CO2 emissions, which take 58.69%, 22.85%, and 15.63%
respectively. Figure 11 shows that electricity (ELY), private households, transport nec
(OTP) and service sectors contributed significantly to Japan’s CO2 emissions of 2004,
which takes 36%, 16%, 16% and 9% respectively. From Table 5a, we can see that Japan’s
petroleum-based CO2 emissions are mainly from the transport nec (OTP), private
households and electricity (ELY) sectors; coal-based CO2 emissions are mainly from the
electricity (ELY) sector; and natural gas based CO2 emissions are mainly from the
electricity (ELY) sector.
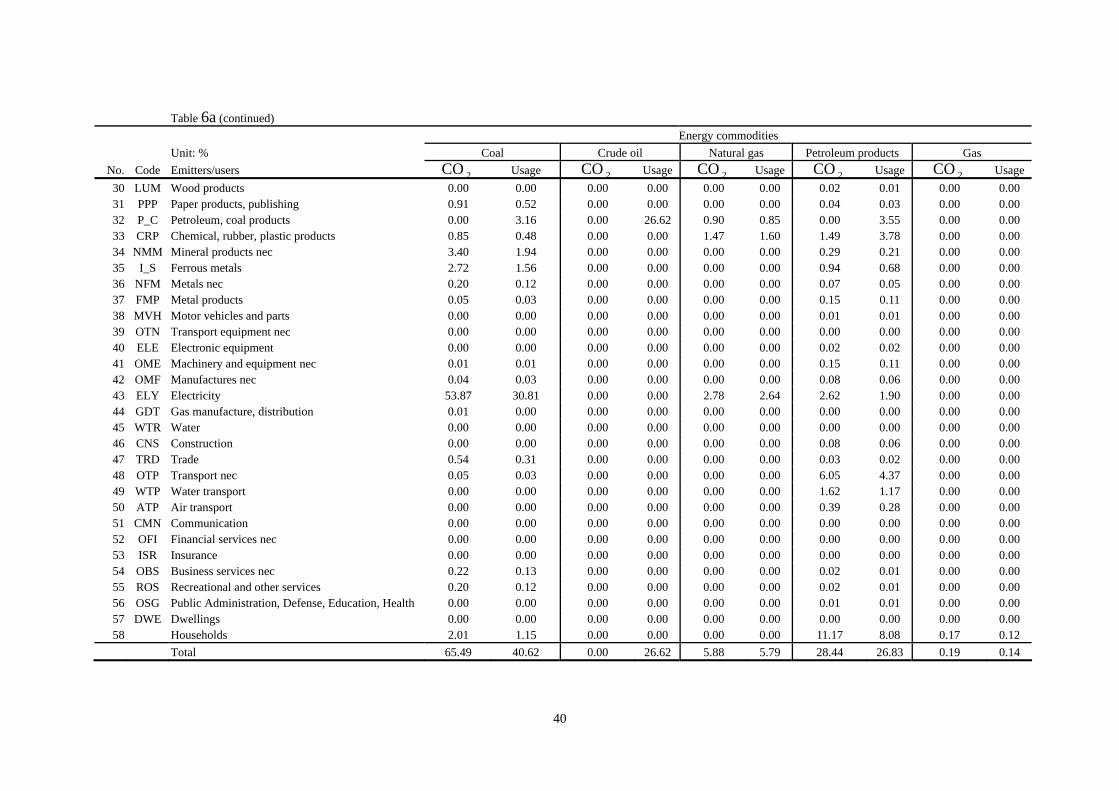
Figure 12 shows that coal and petroleum products are the key sources of India’s
combustion-based CO2 emissions, which take 65.49%, and 28.44% respectively. Figure
13 shows that electricity (ELY), private households, and manufacture sectors contributed
significantly to India’s CO2 emissions of 2004, which takes 59%, 13%, and 9%
respectively. From Table 6a, we can see that India’s coal-based CO2 emissions are mainly
from the electricity (ELY), mineral products nec (NMM) and Ferrous metals (I_S)
sectors; and petroleum-based CO2 emissions are mainly from the private households and
transport nec (OTP) sectors.
Figures 14 - 18 show the top 10 emitting countries/regions of CO2 from various
fossil fuel commodities. China and U.S.A.’s coal-based CO2 emissions are remarkably
high, which respectively accounts for 36% and 21.90% of the world’s coal-based

9
emissions. The U.S. and EU27 lead the world in petroleum-based CO2 emissions, which
respectively take 24.50% and 18% of the world total petroleum-based CO2 emissions.
Figure 6. Energy-specific CO2 emitting shares: EU27
Figure 7. Sectoral CO2 emitting shares: EU27

10
Figure 8. Energy-specific CO2 emitting shares: Russia
Figure 9. Sectoral CO2 emitting shares: Russia

11
Figure 10. Energy-specific CO2 emitting shares: Japan
Figure 11. Sectoral CO2 emitting shares: Japan

12
Figure 12. Energy-specific CO2 emitting shares: India
Figure 13. Sectoral CO2 emitting shares: India

13
Figure 14. Top 10 emitting countries/regions of oil-based CO2
Figure 15. Top 10 emitting countries/regions of coal-based CO2

14
Figure 16. Top 10 emitting countries/regions of natural gas-based CO2
Figure 17. Top 10 emitting countries/regions of petroleum-based CO2

15
Figure 18. Top 10 emitting countries/regions of gas distribution-based CO2

16
References
Badri Narayanan G. and Terrie L. Walmsley, Editors (2008). Global Trade, Assistance, and Production: The GTAP 7 Data Base, Center for Global Trade Analysis, Purdue University.
IPCC/OECD/IEA. (1997). Revised 1996 IPCC Guidelines for National Greenhouse Gas Inventories. Paris: Intergovernmental Panel on Climate Change (IPCC), Organization for Economic Co-operation and Development (OECD), International Energy Agency (IEA).
OECD/IEA. (2006a). Energy Balances of OECD Countries. Paris: Organization for Economic Co-operation and Development (OECD), International Energy Agency (IEA).
OECD/IEA. (2006b). Energy Balances of Non-OECD Countries. Paris: Organization for Economic Co-operation and Development (OECD), International Energy Agency (IEA).

17
Table 1. CO 2 emissions and fossil fuel consumption of U.S.A., 2004
Energy commodities
Coal Crude oil Natural gas Petroleum products Gas
No. Code Emitters/users CO 2 Usage CO 2 Usage CO 2 Usage CO 2 Usage CO 2 Usage
1 PDR Paddy rice 22.64 0.01 0.00 0.00 0.00 0.00 1199.85 0.39 0.08 0.00 2 WHT Wheat 37.99 0.01 0.00 0.00 0.00 0.00 6744.91 2.20 0.47 0.00 3 GRO Cereal grains nec 137.26 0.04 0.00 0.00 0.00 0.00 10140.60 3.30 1.07 0.00 4 V_F Vegetables, fruit, nuts 476.88 0.12 0.00 0.00 0.00 0.00 10383.29 3.38 1.11 0.00 5 OSD Oil seeds 79.16 0.02 0.00 0.00 0.00 0.00 3871.15 1.26 1.01 0.00 6 C_B Sugar cane, sugar beet 4.54 0.00 0.00 0.00 0.00 0.00 293.92 0.10 0.07 0.00 7 PFB Plant-based fibers 31.33 0.01 0.00 0.00 0.00 0.00 2010.57 0.66 0.76 0.00 8 OCR Crops nec 64.82 0.02 0.00 0.00 0.00 0.00 4320.58 1.41 0.14 0.00 9 CTL Bovine cattle, sheep and goats, horses 45.78 0.01 0.00 0.00 0.00 0.00 2189.20 0.71 0.05 0.00
10 OAP Animal products nec 57.48 0.01 0.00 0.00 0.00 0.00 6752.48 2.20 0.01 0.00 11 RMK Raw milk 27.22 0.01 0.00 0.00 0.00 0.00 1814.95 0.59 0.01 0.00 12 WOL Wool, silk-worm cocoons 1.03 0.00 0.00 0.00 0.00 0.00 4.92 0.00 0.00 0.00 13 FRS Forestry 855.27 0.22 0.00 0.00 0.00 0.00 883.95 0.29 0.06 0.00 14 FSH Fishing 21.32 0.01 0.00 0.00 0.00 0.00 3628.28 1.18 0.00 0.00 15 COA Coal 1187.60 0.31 0.00 0.00 0.00 0.00 10.11 0.00 0.44 0.00 16 OIL Oil 0.01 0.00 42.22 0.01 21433.94 9.17 3.72 0.00 1320.70 0.44 17 GAS Gas 0.19 0.00 20.94 0.01 3603.01 1.54 2.25 0.00 200.93 0.07 18 OMN Minerals nec 109.12 0.03 0.00 0.00 0.02 0.00 190.49 0.06 37.36 0.01 19 CMT Bovine meat products 1657.70 0.43 0.03 0.00 6.73 0.00 1171.70 0.38 5188.22 1.75 20 OMT Meat products nec 667.18 0.17 0.01 0.00 2.19 0.00 465.86 0.15 2400.72 0.81 21 VOL Vegetable oils and fats 532.89 0.14 0.02 0.00 5.60 0.00 202.21 0.07 1564.77 0.53 22 MIL Dairy products 2125.12 0.55 0.08 0.00 15.71 0.01 1467.66 0.48 4320.59 1.46 23 PCR Processed rice 49.12 0.01 0.00 0.00 0.49 0.00 46.62 0.02 107.90 0.04 24 SGR Sugar 2266.62 0.58 0.00 0.00 0.61 0.00 793.29 0.26 6247.48 2.10 25 OFD Food products nec 5566.37 1.43 0.78 0.00 141.82 0.06 5789.90 1.89 19869.48 6.69 26 B_T Beverages and tobacco products 2304.50 0.59 0.02 0.00 34.07 0.01 1564.03 0.51 3878.43 1.31 27 TEX Textiles 480.27 0.12 0.02 0.00 1.43 0.00 1663.22 0.54 5731.20 1.93 28 WAP Wearing apparel 178.51 0.05 0.00 0.00 0.18 0.00 667.36 0.22 2782.43 0.94 29 LEA Leather products 16.37 0.00 0.00 0.00 0.07 0.00 187.97 0.06 340.35 0.11
…continued

18
Table 1 (continued)
Energy commodities
Coal Crude oil Natural gas Petroleum products Gas
No. Code Emitters/users CO 2 Usage CO 2 Usage CO 2 Usage CO 2 Usage CO 2 Usage
30 LUM Wood products 145.28 0.04 0.01 0.00 4.94 0.00 6161.33 2.01 5794.68 1.95 31 PPP Paper products, publishing 18391.60 4.74 0.00 0.00 5.19 0.00 16714.77 5.45 37945.16 12.78 32 P_C Petroleum, coal products 0.00 87.82 0.00 802.86 177527.70 75.96 0.00 86.15 7577.13 2.55 33 CRP Chemical, rubber, plastic products 21906.66 5.64 66.91 0.02 69007.55 39.41 26012.86 99.45 57209.83 19.27 34 NMM Mineral products nec 32108.22 8.27 0.31 0.00 71.96 0.03 14733.85 4.80 29432.05 9.91 35 I_S Ferrous metals 3388.41 0.87 0.01 0.00 13.92 0.01 19966.63 6.51 31428.15 10.59 36 NFM Metals nec 259.94 0.07 0.16 0.00 477.61 0.20 1992.18 0.65 17180.47 5.79 37 FMP Metal products 164.71 0.04 0.01 0.00 2.64 0.00 1633.33 0.53 9811.77 3.30 38 MVH Motor vehicles and parts 665.29 0.17 0.04 0.00 3.65 0.00 1610.70 0.52 9716.15 3.27 39 OTN Transport equipment nec 285.68 0.07 0.22 0.00 18.45 0.01 1121.90 0.37 4344.19 1.46 40 ELE Electronic equipment 120.55 0.03 0.05 0.00 46.24 0.02 1229.54 0.40 5520.11 1.86 41 OME Machinery and equipment nec 732.13 0.19 0.07 0.00 59.93 0.03 3941.97 1.28 13876.44 4.67 42 OMF Manufactures nec 513.72 0.13 0.01 0.00 0.17 0.00 1197.24 0.39 150.26 0.05 43 ELY Electricity 1917905.00 494.11 33.56 0.01 65839.00 28.17 134463.70 43.81 349086.30 117.59 44 GDT Gas manufacture, distribution 6889.43 1.77 220.89 0.07 0.00 14.40 7.66 0.00 28237.56 9.51 45 WTR Water 1804.67 0.46 0.82 0.00 853.76 0.37 3070.25 1.00 16821.05 5.67 46 CNS Construction 92.65 0.02 0.00 0.00 0.01 0.00 14957.50 4.87 15.59 0.01 47 TRD Trade 1535.04 0.40 0.86 0.00 969.10 0.41 17302.79 5.64 50816.55 17.12 48 OTP Transport nec 111.51 0.03 21.07 0.01 27887.46 11.93 744910.80 242.71 9190.45 3.10 49 WTP Water transport 231.59 0.06 0.00 0.00 0.33 0.00 36031.74 11.74 2207.42 0.74 50 ATP Air transport 52.15 0.01 0.01 0.00 0.70 0.00 444402.60 144.80 1876.31 0.63 51 CMN Communication 53.82 0.01 0.00 0.00 0.56 0.00 420.13 0.14 1307.83 0.44 52 OFI Financial services nec 496.59 0.13 0.00 0.00 0.27 0.00 1354.63 0.44 8512.99 2.87 53 ISR Insurance 58.61 0.02 0.00 0.00 0.16 0.00 280.91 0.09 737.37 0.25 54 OBS Business services nec 2074.17 0.53 2.16 0.00 188.03 0.08 4509.56 1.47 11258.30 3.79 55 ROS Recreational and other services 1145.74 0.30 0.00 0.00 16.65 0.01 11559.13 3.77 21387.24 7.20 56 OSG Public Administration, Defense, Education, Health 2554.85 0.66 0.00 0.00 8.37 0.00 23672.77 7.71 90617.95 30.52 57 DWE Dwellings 0.12 0.00 0.00 0.00 0.00 0.00 4.21 0.00 6.43 0.00 58 Households 46.17 0.01 0.18 0.00 29.25 0.01 850474.70 277.10 339847.80 114.47
Total 2032738.57 611.51 411.48 803.00 368279.48 181.87 2452204.42 976.10 1215909.35 409.57

19
Table 2. CO 2 emissions and fossil fuel consumption of China, 2004
Energy commodities
Coal Crude oil Natural gas Petroleum products Gas
No. Code Emitters/users CO 2 Usage CO 2 Usage CO 2 Usage CO 2 Usage CO 2 Usage
1 PDR Paddy rice 2854.34 0.74 0.00 0.00 0.00 0.00 3541.60 1.15 0.00 0.00 2 WHT Wheat 2732.78 0.70 0.00 0.00 0.00 0.00 3072.64 1.00 0.00 0.00 3 GRO Cereal grains nec 1766.84 0.46 0.00 0.00 0.00 0.00 2030.48 0.66 0.00 0.00 4 V_F Vegetables, fruit, nuts 19254.29 4.96 0.00 0.00 0.00 0.00 22636.08 7.38 0.03 0.00 5 OSD Oil seeds 1365.45 0.35 0.00 0.00 0.00 0.00 1555.59 0.51 0.00 0.00 6 C_B Sugar cane, sugar beet 236.81 0.06 0.00 0.00 0.00 0.00 280.37 0.09 0.00 0.00 7 PFB Plant-based fibers 2440.36 0.63 0.00 0.00 0.00 0.00 2856.89 0.93 0.00 0.00 8 OCR Crops nec 271.21 0.07 0.00 0.00 0.00 0.00 314.09 0.10 0.00 0.00 9 CTL Bovine cattle, sheep and goats, horses 761.95 0.20 0.01 0.00 0.00 0.00 350.62 0.11 0.00 0.00
10 OAP Animal products nec 11054.08 2.85 0.10 0.00 0.01 0.00 4762.30 1.55 0.01 0.00 11 RMK Raw milk 244.55 0.06 0.00 0.00 0.00 0.00 109.36 0.04 0.00 0.00 12 WOL Wool, silk-worm cocoons 896.52 0.23 0.02 0.00 0.00 0.00 614.05 0.20 0.00 0.00 13 FRS Forestry 2169.09 0.56 0.08 0.00 0.00 0.00 6893.36 2.25 0.12 0.00 14 FSH Fishing 1900.04 0.49 0.00 0.00 0.00 0.00 19091.82 6.22 0.00 0.00 15 COA Coal 87414.79 22.52 0.18 0.00 0.01 0.00 3019.27 0.98 0.05 0.00 16 OIL Oil 20.78 0.01 15259.05 5.02 1098.15 0.47 7986.54 2.60 10772.65 3.63 17 GAS Gas 459.40 0.12 397.90 0.13 26.79 0.01 1240.44 0.40 217.80 0.07 18 OMN Minerals nec 10421.54 2.68 3.17 0.00 10.20 0.00 6377.73 2.08 388.92 0.13 19 CMT Bovine meat products 236.49 0.06 0.00 0.00 0.01 0.00 62.51 0.02 9.92 0.00 20 OMT Meat products nec 509.49 0.13 0.00 0.00 0.05 0.00 136.56 0.04 21.54 0.01 21 VOL Vegetable oils and fats 3227.11 0.83 1.51 0.00 0.22 0.00 346.33 0.11 51.09 0.02 22 MIL Dairy products 37.53 0.01 0.00 0.00 0.01 0.00 10.45 0.00 1.58 0.00 23 PCR Processed rice 11238.46 2.90 4.53 0.00 0.73 0.00 1152.66 0.38 177.88 0.06 24 SGR Sugar 84.06 0.02 0.04 0.00 0.01 0.00 9.13 0.00 1.35 0.00 25 OFD Food products nec 19778.88 5.10 9.52 0.00 1.51 0.00 2143.98 0.70 314.33 0.11 26 B_T Beverages and tobacco products 11189.51 2.88 5.57 0.00 0.83 0.00 1270.88 0.41 257.77 0.09 27 TEX Textiles 33105.66 8.53 34.00 0.01 38.61 0.02 4143.53 1.35 117.95 0.04 28 WAP Wearing apparel 3801.56 0.98 0.00 0.00 0.03 0.00 1163.36 0.38 39.11 0.01 29 LEA Leather products 1789.92 0.46 0.00 0.00 0.03 0.00 1023.76 0.33 13.81 0.00
…continued
20
Table 2 (continued)
Energy commodities
Coal Crude oil Natural gas Petroleum products Gas
No. Code Emitters/users CO 2 Usage CO 2 Usage CO 2 Usage CO 2 Usage CO 2 Usage
30 LUM Wood products 8095.63 2.09 7.35 0.00 0.03 0.00 878.81 0.29 37.81 8095.63 31 PPP Paper products, publishing 36253.16 9.34 0.47 0.00 2.80 0.00 2831.45 0.92 188.73 36253.16 32 P_C Petroleum, coal products 0.00 161.14 0.00 271.27 3581.54 1.53 0.00 87.08 616.78 0.00 33 CRP Chemical, rubber, plastic products 96590.64 24.88 9363.42 3.08 2000.76 2.05 58794.44 43.67 32060.17 96590.64 34 NMM Mineral products nec 334700.80 86.23 18.01 0.01 77.59 0.03 32036.90 10.44 6600.56 334700.80 35 I_S Ferrous metals 100405.60 25.87 47.95 0.02 48.61 0.02 118634.70 38.65 2381.64 100405.60 36 NFM Metals nec 22236.40 5.73 51.95 0.02 64.34 0.03 12144.09 3.96 2125.03 22236.40 37 FMP Metal products 4042.63 1.04 195.00 0.06 16.77 0.01 5625.13 1.83 239.87 4042.63 38 MVH Motor vehicles and parts 9571.03 2.47 0.85 0.00 7.99 0.00 3104.88 1.01 645.91 9571.03 39 OTN Transport equipment nec 1836.81 0.47 0.31 0.00 3.07 0.00 1926.93 0.63 547.28 1836.81 40 ELE Electronic equipment 1882.27 0.48 11.26 0.00 3.59 0.00 4078.71 1.33 1225.04 1882.27 41 OME Machinery and equipment nec 21017.24 5.41 274.57 0.09 23.38 0.01 13900.51 4.53 2571.53 21017.24 42 OMF Manufactures nec 1446.69 0.37 409.23 0.13 0.03 0.00 488.35 0.16 22.72 1446.69 43 ELY Electricity 2210053.00 569.38 583.92 0.19 1154.45 0.49 79102.95 25.77 11076.12 2210053.00 44 GDT Gas manufacture, distribution 31406.48 8.09 2844.02 0.94 0.00 0.09 10601.25 3.45 17866.15 31406.48 45 WTR Water 186.61 0.05 2.03 0.00 0.08 0.00 184.74 0.06 351.69 186.61 46 CNS Construction 13165.78 3.39 25.73 0.01 0.16 0.00 13980.95 4.56 439.95 13165.78 47 TRD Trade 7320.15 1.89 398.28 0.13 5.30 0.00 31134.45 10.14 3984.28 7320.15 48 OTP Transport nec 17307.74 4.46 4.67 0.00 6.94 0.00 96202.29 31.34 362.69 17307.74 49 WTP Water transport 785.02 0.20 0.85 0.00 1.20 0.00 118343.70 38.56 132.98 785.02 50 ATP Air transport 219.46 0.06 0.01 0.00 0.03 0.00 15456.81 5.04 90.53 219.46 51 CMN Communication 155.31 0.04 0.01 0.00 0.03 0.00 1234.85 0.40 563.88 155.31 52 OFI Financial services nec 424.07 0.11 0.01 0.00 0.01 0.00 2379.34 0.78 190.07 424.07 53 ISR Insurance 19.88 0.01 0.01 0.00 0.00 0.00 786.86 0.26 1.13 19.88 54 OBS Business services nec 4456.88 1.15 58.90 0.02 0.83 0.00 5994.06 1.95 830.56 4456.88 55 ROS Recreational and other services 6580.79 1.70 192.64 0.06 2.83 0.00 5499.17 1.79 1151.33 6580.79 56 OSG Public Administration, Defense, Education, Health 16780.34 4.32 375.94 0.12 4.87 0.00 20078.77 6.54 1805.21 16780.34 57 DWE Dwellings 37.51 0.01 0.01 0.00 0.00 0.00 2.89 0.00 2.60 37.51 58 Households 165631.30 42.67 0.00 0.00 5231.60 2.24 150345.30 48.99 21782.53 165631.30
Total 3343872.68 1022.63 30583.09 281.34 13416.04 7.02 903969.63 406.13 122280.69 3343872.68
21
Table 3. CO 2 emissions and fossil fuel consumption of EU27, 2004
Energy commodities
Coal Crude oil Natural gas Petroleum products Gas
No. Code Emitters/users CO 2 Usage CO 2 Usage CO 2 Usage CO 2 Usage CO 2 Usage
1 PDR Paddy rice 1.52 0.00 0.00 0.00 59.85 0.03 197.35 0.06 8.20 0.00 2 WHT Wheat 179.57 0.05 0.03 0.00 139.30 0.06 2859.37 0.93 230.40 0.08 3 GRO Cereal grains nec 381.67 0.10 0.01 0.00 208.81 0.09 3516.52 1.15 185.82 0.06 4 V_F Vegetables, fruit, nuts 669.13 0.17 0.57 0.00 240.88 0.10 11939.59 3.89 2371.57 0.80 5 OSD Oil seeds 96.71 0.02 0.01 0.00 221.21 0.09 1789.97 0.58 55.11 0.02 6 C_B Sugar cane, sugar beet 158.32 0.04 0.02 0.00 9.63 0.00 820.44 0.27 191.57 0.06 7 PFB Plant-based fibers 40.86 0.01 0.04 0.00 199.01 0.09 874.05 0.28 97.32 0.03 8 OCR Crops nec 515.09 0.13 0.45 0.00 480.31 0.21 11595.24 3.78 5758.23 1.94 9 CTL Bovine cattle, sheep and goats, horses 253.96 0.07 0.06 0.00 103.30 0.04 3050.47 0.99 419.97 0.14
10 OAP Animal products nec 600.83 0.15 0.08 0.00 288.37 0.12 6941.25 2.26 529.14 0.18 11 RMK Raw milk 431.96 0.11 0.14 0.00 68.49 0.03 4708.79 1.53 195.17 0.07 12 WOL Wool, silk-worm cocoons 3.52 0.00 0.01 0.00 253.45 0.11 19.63 0.01 6.18 0.00 13 FRS Forestry 184.40 0.05 0.10 0.00 240.89 0.10 3571.48 1.16 176.37 0.06 14 FSH Fishing 11.51 0.00 0.03 0.00 723.10 0.31 7204.86 2.35 132.99 0.04 15 COA Coal 1529.72 0.39 1.58 0.00 17.22 0.01 300.67 0.10 55.95 0.02 16 OIL Oil 6.97 0.00 411.03 0.14 7898.02 3.38 428.37 0.14 1705.24 0.57 17 GAS Gas 2.63 0.00 1.84 0.00 470.36 0.20 58.79 0.02 6.98 0.00 18 OMN Minerals nec 712.38 0.18 8.08 0.00 1028.62 0.44 5102.04 1.66 931.22 0.31 19 CMT Bovine meat products 129.53 0.03 0.52 0.00 1664.61 0.71 783.26 0.26 436.49 0.15 20 OMT Meat products nec 338.99 0.09 0.66 0.00 1625.67 0.70 1120.70 0.37 857.03 0.29 21 VOL Vegetable oils and fats 102.05 0.03 0.32 0.00 1462.32 0.63 833.98 0.27 330.40 0.11 22 MIL Dairy products 1721.43 0.44 1.07 0.00 4340.83 1.86 3088.61 1.01 1986.68 0.67 23 PCR Processed rice 15.80 0.00 0.37 0.00 117.70 0.05 127.58 0.04 46.42 0.02 24 SGR Sugar 317.26 0.08 1.53 0.00 908.32 0.39 518.33 0.17 421.42 0.14 25 OFD Food products nec 4057.34 1.05 8.47 0.00 14952.58 6.40 12003.61 3.91 9693.14 3.27 26 B_T Beverages and tobacco products 209.48 0.05 1.44 0.00 1603.37 0.69 1679.35 0.55 1133.08 0.38 27 TEX Textiles 619.67 0.16 7.00 0.00 5547.02 2.37 2423.30 0.79 1774.63 0.60 28 WAP Wearing apparel 129.71 0.03 0.57 0.00 1593.39 0.68 1655.11 0.54 819.89 0.28 29 LEA Leather products 92.10 0.02 1.14 0.00 631.25 0.27 885.75 0.29 442.95 0.15
…continued

22
Table 3 (continued)
Energy commodities
Coal Crude oil Natural gas Petroleum products Gas
No. Code Emitters/users CO 2 Usage CO 2 Usage CO 2 Usage CO 2 Usage CO 2 Usage
30 LUM Wood products 601.86 0.16 0.51 0.00 1071.79 0.46 2187.35 0.71 817.19 0.28 31 PPP Paper products, publishing 5461.53 1.41 2.47 0.00 17468.54 7.47 8077.28 2.63 7625.25 2.57 32 P_C Petroleum, coal products 0.00 55.84 0.00 655.45 46255.17 19.79 0.00 198.56 1392.66 0.47 33 CRP Chemical, rubber, plastic products 12636.47 3.26 89.57 0.03 48014.71 33.35 29737.98 80.63 25356.17 8.54 34 NMM Mineral products nec 20701.66 5.33 7.20 0.00 36692.50 15.70 43764.16 14.26 9320.79 3.14 35 I_S Ferrous metals 11115.09 2.86 7.26 0.00 19897.92 8.51 40766.56 13.28 9585.79 3.23 36 NFM Metals nec 1519.95 0.39 1.36 0.00 6238.19 2.67 5428.51 1.77 1562.03 0.53 37 FMP Metal products 279.17 0.07 2.76 0.00 8612.74 3.69 4603.70 1.50 2875.52 0.97 38 MVH Motor vehicles and parts 531.27 0.14 1.79 0.00 4728.22 2.02 2334.16 0.76 2397.61 0.81 39 OTN Transport equipment nec 238.17 0.06 0.83 0.00 1822.14 0.78 1115.09 0.36 983.96 0.33 40 ELE Electronic equipment 23.65 0.01 0.99 0.00 930.23 0.40 1441.06 0.47 596.70 0.20 41 OME Machinery and equipment nec 507.06 0.13 3.65 0.00 6106.02 2.61 7420.34 2.42 4737.21 1.60 42 OMF Manufactures nec 80.38 0.02 0.82 0.00 656.42 0.28 2046.50 0.67 335.34 0.11 43 ELY Electricity 935334.40 240.97 109.78 0.04 229144.60 98.05 115707.50 37.70 93665.20 31.55 44 GDT Gas manufacture, distribution 2550.14 0.66 434.86 0.14 0.00 7.54 1265.91 0.41 6440.85 2.17 45 WTR Water 659.15 0.17 1.67 0.00 5592.68 2.39 724.58 0.24 522.08 0.18 46 CNS Construction 135.17 0.03 9.08 0.00 1616.02 0.69 17886.33 5.83 1192.68 0.40 47 TRD Trade 1801.01 0.46 22.07 0.01 18270.64 7.82 30028.71 9.78 10128.12 3.41 48 OTP Transport nec 263.58 0.07 7.70 0.00 4099.38 1.75 567597.80 184.94 3370.40 1.14 49 WTP Water transport 26.48 0.01 1.77 0.00 119.28 0.05 102623.60 33.44 289.08 0.10 50 ATP Air transport 8.61 0.00 0.43 0.00 37.03 0.02 144072.10 46.94 480.57 0.16 51 CMN Communication 92.84 0.02 0.71 0.00 548.80 0.23 2622.05 0.85 966.61 0.33 52 OFI Financial services nec 331.55 0.09 0.78 0.00 676.69 0.29 2215.03 0.72 1227.49 0.41 53 ISR Insurance 53.77 0.01 0.52 0.00 113.22 0.05 1100.55 0.36 562.16 0.19 54 OBS Business services nec 1690.77 0.44 19.91 0.01 22649.22 9.69 16571.56 5.40 7950.36 2.68 55 ROS Recreational and other services 262.64 0.07 2.86 0.00 6313.54 2.70 4970.73 1.62 3612.26 1.22 56 OSG Public Administration, Defense, Education, Health 1721.26 0.44 5.28 0.00 11210.37 4.80 19757.53 6.44 15614.33 5.26 57 DWE Dwellings 1.78 0.00 0.56 0.00 1.75 0.00 3.22 0.00 0.40 0.00 58 Households 31579.23 8.14 50.64 0.02 134087.50 57.37 534166.90 174.04 197103.40 66.39
Total 1043722.79 324.74 1235.02 655.86 680073.18 311.35 1800335.23 856.08 441711.74 148.79

23
Table 4. CO 2 emissions and fossil fuel consumption of Russian Federation, 2004
Energy commodities
Coal Crude oil Natural gas Petroleum products Gas
No. Code Emitters/users CO 2 Usage CO 2 Usage CO 2 Usage CO 2 Usage CO 2 Usage
1 PDR Paddy rice 0.52 0.00 0.00 0.00 0.83 0.00 25.95 0.01 0.27 0.00 2 WHT Wheat 11.81 0.00 0.00 0.00 19.79 0.01 623.84 0.20 13.04 0.00 3 GRO Cereal grains nec 22.77 0.01 0.00 0.00 37.88 0.02 1191.84 0.39 17.47 0.01 4 V_F Vegetables, fruit, nuts 62.81 0.02 0.01 0.00 102.45 0.04 3212.07 1.05 83.40 0.03 5 OSD Oil seeds 2.40 0.00 0.00 0.00 4.00 0.00 125.64 0.04 1.78 0.00 6 C_B Sugar cane, sugar beet 0.71 0.00 0.00 0.00 1.15 0.00 36.10 0.01 0.52 0.00 7 PFB Plant-based fibers 0.00 0.00 0.00 0.00 0.00 0.00 0.06 0.00 0.00 0.00 8 OCR Crops nec 0.05 0.00 0.00 0.00 0.09 0.00 2.70 0.00 0.10 0.00 9 CTL Bovine cattle, sheep and goats, horses 67.17 0.02 0.00 0.00 0.01 0.00 1290.58 0.42 47.47 0.02
10 OAP Animal products nec 27.10 0.01 0.00 0.00 0.01 0.00 539.41 0.18 12.41 0.00 11 RMK Raw milk 144.55 0.04 0.00 0.00 0.03 0.00 2810.38 0.92 40.27 0.01 12 WOL Wool, silk-worm cocoons 3.98 0.00 0.00 0.00 0.00 0.00 63.31 0.02 1.33 0.00 13 FRS Forestry 109.18 0.03 31.94 0.01 636.08 0.27 4558.99 1.49 68.32 0.02 14 FSH Fishing 13.69 0.00 3.77 0.00 174.16 0.07 89.33 0.03 12.95 0.00 15 COA Coal 1644.91 0.42 0.56 0.00 0.39 0.00 0.25 0.00 1.06 0.00 16 OIL Oil 1.41 0.00 4339.21 1.43 9731.59 4.16 752.64 0.25 2451.17 0.83 17 GAS Gas 0.05 0.00 2209.90 0.73 22445.52 9.60 573.34 0.19 42.73 0.01 18 OMN Minerals nec 1.63 0.00 4.30 0.00 31.24 0.01 53.74 0.02 13.27 0.00 19 CMT Bovine meat products 71.11 0.02 2.39 0.00 0.08 0.00 462.46 0.15 133.58 0.04 20 OMT Meat products nec 27.95 0.01 0.87 0.00 27.92 0.01 132.63 0.04 84.81 0.03 21 VOL Vegetable oils and fats 14.19 0.00 0.76 0.00 133.26 0.06 485.29 0.16 115.64 0.04 22 MIL Dairy products 135.77 0.03 1.98 0.00 743.47 0.32 466.42 0.15 288.84 0.10 23 PCR Processed rice 0.08 0.00 0.00 0.00 0.08 0.00 0.40 0.00 0.38 0.00 24 SGR Sugar 117.71 0.03 1.90 0.00 0.05 0.00 400.79 0.13 97.65 0.03 25 OFD Food products nec 98.15 0.03 2.94 0.00 94.67 0.04 447.81 0.15 448.65 0.15 26 B_T Beverages and tobacco products 61.02 0.02 2.52 0.00 0.02 0.00 472.40 0.15 252.42 0.09 27 TEX Textiles 18.41 0.00 2.73 0.00 43.07 0.02 10.94 0.00 67.02 0.02 28 WAP Wearing apparel 7.33 0.00 0.55 0.00 0.00 0.00 10.92 0.00 49.22 0.02 29 LEA Leather products 9.24 0.00 0.66 0.00 0.00 0.00 14.51 0.00 32.48 0.01
…continued

24
Table 4 (continued)
Energy commodities
Coal Crude oil Natural gas Petroleum products Gas
No. Code Emitters/users CO 2 Usage CO 2 Usage CO 2 Usage CO 2 Usage CO 2 Usage
30 LUM Wood products 24.56 0.01 2.10 0.00 0.00 0.00 1692.94 0.55 16.63 0.01 31 PPP Paper products, publishing 6.57 0.00 1.06 0.00 246.34 0.11 27.88 0.01 652.42 0.22 32 P_C Petroleum, coal products 0.00 25.67 0.00 182.83 20760.29 8.88 0.00 23.97 2670.93 0.90 33 CRP Chemical, rubber, plastic products 27.34 0.01 14.95 0.00 3902.84 15.64 22281.20 10.28 8049.83 2.71 34 NMM Mineral products nec 1726.91 0.44 8.43 0.00 12933.92 5.53 2140.21 0.70 4261.65 1.44 35 I_S Ferrous metals 1089.27 0.28 114.40 0.04 23701.25 10.14 13873.12 4.52 7697.43 2.59 36 NFM Metals nec 3771.66 0.97 142.39 0.05 11.70 0.01 5769.53 1.88 5635.59 1.90 37 FMP Metal products 25.89 0.01 1.53 0.00 318.27 0.14 1027.86 0.33 447.37 0.15 38 MVH Motor vehicles and parts 4.79 0.00 1.92 0.00 14.46 0.01 1.97 0.00 17.68 0.01 39 OTN Transport equipment nec 0.72 0.00 0.80 0.00 7.30 0.00 3.85 0.00 15.50 0.01 40 ELE Electronic equipment 5.53 0.00 0.51 0.00 0.03 0.00 480.10 0.16 138.52 0.05 41 OME Machinery and equipment nec 188.02 0.05 5.54 0.00 1988.69 0.85 374.98 0.12 2045.09 0.69 42 OMF Manufactures nec 2.61 0.00 0.27 0.00 0.13 0.00 166.35 0.05 207.78 0.07 43 ELY Electricity 276193.60 71.16 2866.41 0.94 360533.50 154.27 66854.98 21.78 148786.00 50.12 44 GDT Gas manufacture, distribution 11.22 0.00 102.81 0.03 0.00 0.79 252.39 0.08 890.56 0.30 45 WTR Water 303.45 0.08 0.02 0.00 5.15 0.00 965.83 0.31 40.31 0.01 46 CNS Construction 113.05 0.03 75.92 0.02 129.71 0.06 3072.74 1.00 711.14 0.24 47 TRD Trade 987.57 0.25 0.05 0.00 598.87 0.26 6806.86 2.22 756.26 0.25 48 OTP Transport nec 58.27 0.02 102.94 0.03 53460.16 22.88 87151.78 28.40 24259.03 8.17 49 WTP Water transport 4.44 0.00 6.19 0.00 1208.37 0.52 8972.83 2.92 1605.58 0.54 50 ATP Air transport 2.16 0.00 9.91 0.00 733.25 0.31 21597.11 7.04 4739.49 1.60 51 CMN Communication 147.08 0.04 0.00 0.00 0.00 0.00 288.66 0.09 433.84 0.15 52 OFI Financial services nec 18.67 0.00 0.00 0.00 110.65 0.05 2965.68 0.97 961.69 0.32 53 ISR Insurance 15.31 0.00 0.00 0.00 15.31 0.01 3149.67 1.03 102.21 0.03 54 OBS Business services nec 79.37 0.02 140.36 0.05 777.56 0.33 13628.61 4.44 422.69 0.14 55 ROS Recreational and other services 358.46 0.09 0.00 0.00 329.15 0.14 545.93 0.18 392.40 0.13 56 OSG Public Administration, Defense, Education, Health 3111.67 0.80 0.01 0.00 948.89 0.41 6171.83 2.01 5371.15 1.81 57 DWE Dwellings 0.00 0.00 0.00 0.00 0.00 0.00 0.00 0.00 0.00 0.00 58 Households 19388.66 5.00 0.00 0.00 7868.61 3.37 68191.58 22.22 124071.30 41.79
Total 310342.55 105.63 10205.54 186.18 524832.24 239.33 357311.20 143.42 349778.30 117.82

25
Table 5. CO 2 emissions and fossil fuel consumption of Japan, 2004
Energy commodities
Coal Crude oil Natural gas Petroleum products Gas
No. Code Emitters/users CO 2 Usage CO 2 Usage CO 2 Usage CO 2 Usage CO 2 Usage
1 PDR Paddy rice 0.00 0.00 0.00 0.00 0.00 0.00 2194.17 0.71 0.00 0.00
2 WHT Wheat 0.00 0.00 0.00 0.00 0.00 0.00 388.09 0.13 0.00 0.00
3 GRO Cereal grains nec 0.00 0.00 0.00 0.00 0.00 0.00 52.14 0.02 0.00 0.00
4 V_F Vegetables, fruit, nuts 0.00 0.00 0.00 0.00 0.00 0.00 6885.30 2.24 0.00 0.00
5 OSD Oil seeds 0.00 0.00 0.00 0.00 0.00 0.00 53.36 0.02 0.00 0.00
6 C_B Sugar cane, sugar beet 0.00 0.00 0.00 0.00 0.00 0.00 86.40 0.03 0.00 0.00
7 PFB Plant-based fibers 0.00 0.00 0.00 0.00 0.00 0.00 109.62 0.04 0.00 0.00
8 OCR Crops nec 0.00 0.00 0.00 0.00 0.00 0.00 4388.23 1.43 0.00 0.00
9 CTL Bovine cattle, sheep and goats, horses 0.00 0.00 0.00 0.00 0.00 0.00 48.84 0.02 0.00 0.00
10 OAP Animal products nec 0.00 0.00 0.00 0.00 0.00 0.00 158.67 0.05 0.00 0.00
11 RMK Raw milk 0.00 0.00 0.00 0.00 0.00 0.00 101.10 0.03 0.00 0.00
12 WOL Wool, silk-worm cocoons 0.00 0.00 0.00 0.00 0.00 0.00 3.86 0.00 0.00 0.00
13 FRS Forestry 0.03 0.00 0.00 0.00 0.00 0.00 1030.53 0.34 0.00 0.00
14 FSH Fishing 0.01 0.00 0.00 0.00 0.01 0.00 14473.49 4.72 0.00 0.00
15 COA Coal 0.03 0.00 0.00 0.00 0.00 0.00 0.05 0.00 0.00 0.00
16 OIL Oil 0.00 0.00 0.00 0.00 0.00 0.00 0.01 0.00 0.00 0.00
17 GAS Gas 0.00 0.00 0.00 0.00 0.00 0.00 0.00 0.00 0.00 0.00
18 OMN Minerals nec 0.01 0.00 0.00 0.00 325.78 0.14 2095.30 0.68 0.84 0.00
19 CMT Bovine meat products 0.01 0.00 0.00 0.00 7.65 0.00 101.20 0.03 0.03 0.00
20 OMT Meat products nec 0.00 0.00 0.00 0.00 2.57 0.00 179.15 0.06 0.10 0.00
21 VOL Vegetable oils and fats 0.02 0.00 0.01 0.00 15.14 0.01 177.69 0.06 0.28 0.00
22 MIL Dairy products 0.05 0.00 0.02 0.00 46.74 0.02 1092.94 0.36 0.11 0.00
23 PCR Processed rice 0.02 0.00 0.02 0.00 27.26 0.01 113.99 0.04 0.02 0.00
24 SGR Sugar 0.04 0.00 0.00 0.00 0.44 0.00 551.15 0.18 0.46 0.00
25 OFD Food products nec 0.47 0.00 0.50 0.00 888.60 0.38 5997.97 1.95 2.13 0.00
26 B_T Beverages and tobacco products 0.03 0.00 0.00 0.00 2.96 0.00 1519.09 0.49 1.27 0.00
27 TEX Textiles 0.04 0.00 0.00 0.00 130.10 0.06 392.22 0.13 55.44 0.02
28 WAP Wearing apparel 0.00 0.00 0.00 0.00 22.35 0.01 56.68 0.02 10.59 0.00
29 LEA Leather products 0.01 0.00 0.00 0.00 5.70 0.00 22.09 0.01 0.62 0.00
…continued
26
Table 5 (continued)
Energy commodities
Coal Crude oil Natural gas Petroleum products Gas
No. Code Emitters/users CO 2 Usage CO 2 Usage CO 2 Usage CO 2 Usage CO 2 Usage
30 LUM Wood products 0.04 0.00 0.00 0.00 49.70 0.02 60.33 0.02 24.88 0.01
31 PPP Paper products, publishing 5944.95 1.53 0.00 0.00 1025.25 0.44 6554.72 2.14 248.37 0.08
32 P_C Petroleum, coal products 0.00 45.53 0.00 194.90 11712.13 5.01 0.00 51.28 0.08 0.00
33 CRP Chemical, rubber, plastic products 17622.47 4.54 91.13 0.03 9255.00 5.63 39347.81 48.25 112.98 0.04
34 NMM Mineral products nec 10896.99 2.81 0.23 0.00 1676.51 0.72 9991.49 3.26 8.61 0.00
35 I_S Ferrous metals 6170.72 1.59 0.00 0.00 4101.21 1.75 33074.48 10.78 511.87 0.17
36 NFM Metals nec 163.14 0.04 0.01 0.00 392.27 0.17 2161.03 0.70 60.81 0.02
37 FMP Metal products 90.72 0.02 0.00 0.00 109.31 0.05 1301.74 0.42 67.79 0.02
38 MVH Motor vehicles and parts 0.06 0.00 0.04 0.00 50.31 0.02 68.29 0.02 29.77 0.01
39 OTN Transport equipment nec 0.02 0.00 0.06 0.00 186.39 0.08 15.84 0.01 6.08 0.00
40 ELE Electronic equipment 73.38 0.02 0.06 0.00 3116.05 1.33 1807.98 0.59 93.37 0.03
41 OME Machinery and equipment nec 377.54 0.10 0.01 0.00 604.93 0.26 1978.23 0.64 81.37 0.03
42 OMF Manufactures nec 0.02 0.00 0.01 0.00 700.50 0.30 1759.97 0.57 279.39 0.09
43 ELY Electricity 209043.60 53.86 16258.47 5.35 109822.80 46.99 61827.66 20.14 0.03 0.00
44 GDT Gas manufacture, distribution 0.49 0.00 3.72 0.00 0.00 0.03 8.82 0.00 0.00 0.00
45 WTR Water 0.07 0.00 0.00 0.00 20.27 0.01 128.63 0.04 1.83 0.00
46 CNS Construction 0.03 0.00 0.00 0.00 49.62 0.02 11724.92 3.82 54.38 0.02
47 TRD Trade 0.71 0.00 0.01 0.00 404.75 0.17 14976.14 4.88 168.73 0.06
48 OTP Transport nec 0.30 0.00 0.06 0.00 646.49 0.28 169828.80 55.33 13.27 0.00
49 WTP Water transport 0.01 0.00 0.00 0.00 11.37 0.00 18774.34 6.12 2.17 0.00
50 ATP Air transport 0.00 0.00 0.00 0.00 0.50 0.00 12402.89 4.04 1.03 0.00
51 CMN Communication 0.01 0.00 0.00 0.00 0.81 0.00 1508.29 0.49 5.62 0.00
52 OFI Financial services nec 0.58 0.00 0.00 0.00 0.98 0.00 1117.18 0.36 5.10 0.00
53 ISR Insurance 0.17 0.00 0.00 0.00 1.47 0.00 626.78 0.20 5.16 0.00
54 OBS Business services nec 2.61 0.00 1.25 0.00 13411.49 5.74 12078.30 3.94 229.22 0.08
55 ROS Recreational and other services 0.16 0.00 0.00 0.00 325.56 0.14 8424.27 2.74 37.00 0.01
56 OSG Public Administration, Defense, Education, Health 2.09 0.00 0.00 0.00 171.42 0.07 40464.23 13.18 2505.73 0.84
57 DWE Dwellings 0.00 0.00 0.00 0.00 0.07 0.00 1.92 0.00 0.00 0.00
58 Households 9.87 0.00 0.06 0.00 11955.82 5.12 148739.50 48.46 9950.39 3.35
Total 250401.51 110.04 16355.67 200.29 171278.31 74.98 643027.90 296.22 14576.91 4.91

27
Table 6. CO 2 emissions and fossil fuel consumption of India, 2004
Energy commodities
Coal Crude oil Natural gas Petroleum products Gas
No. Code Emitters/users CO 2 Usage CO 2 Usage CO 2 Usage CO 2 Usage CO 2 Usage
1 PDR Paddy rice 0.00 0.00 0.00 0.00 0.52 0.00 0.14 0.00 1.16 0.00 2 WHT Wheat 0.01 0.00 0.00 0.00 1.96 0.00 2.17 0.00 7.80 0.00 3 GRO Cereal grains nec 0.01 0.00 0.00 0.00 0.21 0.00 1.16 0.00 2.74 0.00 4 V_F Vegetables, fruit, nuts 0.09 0.00 0.00 0.00 18.59 0.01 2.30 0.00 32.04 0.01 5 OSD Oil seeds 0.04 0.00 0.00 0.00 19.23 0.01 1.88 0.00 15.22 0.01 6 C_B Sugar cane, sugar beet 0.02 0.00 0.00 0.00 0.95 0.00 0.30 0.00 2.68 0.00 7 PFB Plant-based fibers 0.00 0.00 0.00 0.00 0.74 0.00 0.51 0.00 6.71 0.00 8 OCR Crops nec 0.05 0.00 0.00 0.00 13.26 0.01 1.49 0.00 29.25 0.01 9 CTL Bovine cattle, sheep and goats, horses 0.00 0.00 0.00 0.00 0.25 0.00 0.00 0.00 4.09 0.00
10 OAP Animal products nec 0.00 0.00 0.00 0.00 1.26 0.00 0.00 0.00 4.16 0.00 11 RMK Raw milk 0.29 0.00 0.01 0.00 106.72 0.05 0.03 0.00 1.09 0.00 12 WOL Wool, silk-worm cocoons 0.00 0.00 0.00 0.00 0.81 0.00 0.00 0.00 1.21 0.00 13 FRS Forestry 0.06 0.00 0.00 0.00 0.89 0.00 0.92 0.00 2.52 0.00 14 FSH Fishing 0.02 0.00 0.00 0.00 2.18 0.00 1.86 0.00 1.71 0.00 15 COA Coal 1538.71 0.40 0.00 0.00 0.00 0.00 1.90 0.00 0.00 0.00 16 OIL Oil 0.00 0.00 0.08 0.00 2699.46 1.16 0.49 0.00 20.01 0.01 17 GAS Gas 52.85 0.01 0.05 0.00 4721.32 2.02 0.35 0.00 24.49 0.01 18 OMN Minerals nec 223.28 0.06 0.00 0.00 0.96 0.00 3600.69 1.17 2.37 0.00 19 CMT Bovine meat products 3.66 0.00 0.02 0.00 0.61 0.00 335.16 0.11 0.00 0.00 20 OMT Meat products nec 0.05 0.00 0.00 0.00 0.00 0.00 1.00 0.00 0.01 0.00 21 VOL Vegetable oils and fats 24.41 0.01 0.01 0.00 0.23 0.00 893.02 0.29 0.02 0.00 22 MIL Dairy products 32.01 0.01 0.20 0.00 5.15 0.00 2888.16 0.94 0.02 0.00 23 PCR Processed rice 0.06 0.00 0.00 0.00 0.01 0.00 16518.31 5.38 0.01 0.00 24 SGR Sugar 11.75 0.00 0.10 0.00 2.61 0.00 2031.78 0.66 0.03 0.00 25 OFD Food products nec 26.91 0.01 0.18 0.00 4.54 0.00 2570.54 0.84 0.07 0.00 26 B_T Beverages and tobacco products 22.61 0.01 0.03 0.00 0.80 0.00 1417.89 0.46 0.01 0.00 27 TEX Textiles 2061.59 0.53 0.13 0.00 3.04 0.00 2698.00 0.88 0.09 0.00 28 WAP Wearing apparel 31.27 0.01 0.01 0.00 0.31 0.00 301.41 0.10 0.01 0.00 29 LEA Leather products 47.27 0.01 0.00 0.00 0.01 0.00 299.06 0.10 0.00 0.00
…continued

28
Table 6 (continued)
Energy commodities
Coal Crude oil Natural gas Petroleum products Gas
No. Code Emitters/users CO 2 Usage CO 2 Usage CO 2 Usage CO 2 Usage CO 2 Usage
30 LUM Wood products 11.59 0.00 0.00 0.00 0.89 0.00 161.71 0.05 0.14 0.00 31 PPP Paper products, publishing 9617.72 2.48 0.01 0.00 8.92 0.00 424.11 0.14 0.70 0.00 32 P_C Petroleum, coal products 0.00 15.12 0.00 127.29 9552.11 4.09 0.00 16.98 36.16 0.01 33 CRP Chemical, rubber, plastic products 8999.23 2.32 12.87 0.00 15570.44 7.67 15799.08 18.07 13.76 0.00 34 NMM Mineral products nec 36096.13 9.30 0.00 0.00 3.16 0.00 3043.11 0.99 15.63 0.01 35 I_S Ferrous metals 28898.67 7.45 0.26 0.00 52.74 0.02 9953.83 3.24 0.73 0.00 36 NFM Metals nec 2160.05 0.56 0.14 0.00 6.28 0.00 774.02 0.25 0.05 0.00 37 FMP Metal products 548.22 0.14 0.28 0.00 7.47 0.00 1581.07 0.52 0.04 0.00 38 MVH Motor vehicles and parts 11.45 0.00 0.00 0.00 1.24 0.00 76.25 0.02 1.06 0.00 39 OTN Transport equipment nec 14.35 0.00 0.00 0.00 0.66 0.00 46.37 0.02 0.87 0.00 40 ELE Electronic equipment 1.21 0.00 0.06 0.00 1.50 0.00 229.06 0.07 0.00 0.00 41 OME Machinery and equipment nec 126.95 0.03 0.60 0.00 16.07 0.01 1571.61 0.51 0.03 0.00 42 OMF Manufactures nec 465.99 0.12 0.89 0.00 16.51 0.01 875.49 0.29 0.01 0.00 43 ELY Electricity 571820.30 147.32 18.76 0.01 29493.09 12.62 27824.99 9.07 33.25 0.01 44 GDT Gas manufacture, distribution 59.42 0.02 0.00 0.00 0.00 0.01 0.00 0.00 10.68 0.00 45 WTR Water 38.54 0.01 0.00 0.00 0.00 0.00 19.73 0.01 0.00 0.00 46 CNS Construction 31.58 0.01 0.05 0.00 1.32 0.00 822.63 0.27 0.02 0.00 47 TRD Trade 5736.37 1.48 0.18 0.00 1.64 0.00 347.90 0.11 10.94 0.00 48 OTP Transport nec 539.20 0.14 0.00 0.00 0.00 0.00 64203.93 20.92 0.00 0.00 49 WTP Water transport 0.11 0.00 0.00 0.00 0.00 0.00 17197.63 5.60 0.00 0.00 50 ATP Air transport 0.02 0.00 0.00 0.00 0.00 0.00 4170.39 1.36 0.00 0.00 51 CMN Communication 1.00 0.00 0.00 0.00 0.00 0.00 41.89 0.01 0.00 0.00 52 OFI Financial services nec 2.26 0.00 0.00 0.00 0.00 0.00 37.31 0.01 0.00 0.00 53 ISR Insurance 0.36 0.00 0.00 0.00 0.00 0.00 52.29 0.02 0.00 0.00 54 OBS Business services nec 2349.17 0.61 1.41 0.00 4.82 0.00 196.52 0.06 0.01 0.00 55 ROS Recreational and other services 2145.48 0.55 1.29 0.00 4.44 0.00 180.32 0.06 0.02 0.00 56 OSG Public Administration, Defense, Education, Health 20.64 0.01 0.00 0.00 0.00 0.00 114.45 0.04 0.03 0.00 57 DWE Dwellings 0.00 0.00 0.00 0.00 0.00 0.00 0.00 0.00 0.00 0.00 58 Households 21357.42 5.50 0.16 0.00 18.94 0.01 118579.30 38.64 1757.40 0.59
Total 695130.43 194.21 37.80 127.30 62368.84 27.70 301895.50 128.27 2041.05 0.69

29
Table 1a Significance of CO 2 emissions from emitters: U.S.A., 2004
Energy commodities
Unit: % Coal Crude oil Natural gas Petroleum products Gas
No. Code Emitters/users CO 2 Usage CO 2 Usage CO 2 Usage CO 2 Usage CO 2 Usage
1 PDR Paddy rice 0.00 0.00 0.00 0.00 0.00 0.00 0.02 0.01 0.00 0.00 2 WHT Wheat 0.00 0.00 0.00 0.00 0.00 0.00 0.11 0.07 0.00 0.00 3 GRO Cereal grains nec 0.00 0.00 0.00 0.00 0.00 0.00 0.17 0.11 0.00 0.00 4 V_F Vegetables, fruit, nuts 0.01 0.00 0.00 0.00 0.00 0.00 0.17 0.11 0.00 0.00 5 OSD Oil seeds 0.00 0.00 0.00 0.00 0.00 0.00 0.06 0.04 0.00 0.00 6 C_B Sugar cane, sugar beet 0.00 0.00 0.00 0.00 0.00 0.00 0.00 0.00 0.00 0.00 7 PFB Plant-based fibers 0.00 0.00 0.00 0.00 0.00 0.00 0.03 0.02 0.00 0.00 8 OCR Crops nec 0.00 0.00 0.00 0.00 0.00 0.00 0.07 0.05 0.00 0.00 9 CTL Bovine cattle, sheep and goats, horses 0.00 0.00 0.00 0.00 0.00 0.00 0.04 0.02 0.00 0.00
10 OAP Animal products nec 0.00 0.00 0.00 0.00 0.00 0.00 0.11 0.07 0.00 0.00 11 RMK Raw milk 0.00 0.00 0.00 0.00 0.00 0.00 0.03 0.02 0.00 0.00 12 WOL Wool, silk-worm cocoons 0.00 0.00 0.00 0.00 0.00 0.00 0.00 0.00 0.00 0.00 13 FRS Forestry 0.01 0.01 0.00 0.00 0.00 0.00 0.01 0.01 0.00 0.00 14 FSH Fishing 0.00 0.00 0.00 0.00 0.00 0.00 0.06 0.04 0.00 0.00 15 COA Coal 0.02 0.01 0.00 0.00 0.00 0.00 0.00 0.00 0.00 0.00 16 OIL Oil 0.00 0.00 0.00 0.00 0.35 0.31 0.00 0.00 0.02 0.01 17 GAS Gas 0.00 0.00 0.00 0.00 0.06 0.05 0.00 0.00 0.00 0.00 18 OMN Minerals nec 0.00 0.00 0.00 0.00 0.00 0.00 0.00 0.00 0.00 0.00 19 CMT Bovine meat products 0.03 0.01 0.00 0.00 0.00 0.00 0.02 0.01 0.09 0.06 20 OMT Meat products nec 0.01 0.01 0.00 0.00 0.00 0.00 0.01 0.01 0.04 0.03 21 VOL Vegetable oils and fats 0.01 0.00 0.00 0.00 0.00 0.00 0.00 0.00 0.03 0.02 22 MIL Dairy products 0.04 0.02 0.00 0.00 0.00 0.00 0.02 0.02 0.07 0.05 23 PCR Processed rice 0.00 0.00 0.00 0.00 0.00 0.00 0.00 0.00 0.00 0.00 24 SGR Sugar 0.04 0.02 0.00 0.00 0.00 0.00 0.01 0.01 0.10 0.07 25 OFD Food products nec 0.09 0.05 0.00 0.00 0.00 0.00 0.10 0.06 0.33 0.22 26 B_T Beverages and tobacco products 0.04 0.02 0.00 0.00 0.00 0.00 0.03 0.02 0.06 0.04 27 TEX Textiles 0.01 0.00 0.00 0.00 0.00 0.00 0.03 0.02 0.09 0.06 28 WAP Wearing apparel 0.00 0.00 0.00 0.00 0.00 0.00 0.01 0.01 0.05 0.03 29 LEA Leather products 0.00 0.00 0.00 0.00 0.00 0.00 0.00 0.00 0.01 0.00
…continued

30
Table 1a (continued)
Energy commodities
Unit: % Coal Crude oil Natural gas Petroleum products Gas
No. Code Emitters/users CO 2 Usage CO 2 Usage CO 2 Usage CO 2 Usage CO 2 Usage
30 LUM Wood products 0.00 0.00 0.00 0.00 0.00 0.00 0.10 0.07 0.10 0.07 31 PPP Paper products, publishing 0.30 0.16 0.00 0.00 0.00 0.00 0.28 0.18 0.63 0.43 32 P_C Petroleum, coal products 0.00 2.94 0.00 26.92 2.92 2.55 0.00 2.89 0.12 0.09 33 CRP Chemical, rubber, plastic products 0.36 0.19 0.00 0.00 1.14 1.32 0.43 3.33 0.94 0.65 34 NMM Mineral products nec 0.53 0.28 0.00 0.00 0.00 0.00 0.24 0.16 0.48 0.33 35 I_S Ferrous metals 0.06 0.03 0.00 0.00 0.00 0.00 0.33 0.22 0.52 0.35 36 NFM Metals nec 0.00 0.00 0.00 0.00 0.01 0.01 0.03 0.02 0.28 0.19 37 FMP Metal products 0.00 0.00 0.00 0.00 0.00 0.00 0.03 0.02 0.16 0.11 38 MVH Motor vehicles and parts 0.01 0.01 0.00 0.00 0.00 0.00 0.03 0.02 0.16 0.11 39 OTN Transport equipment nec 0.00 0.00 0.00 0.00 0.00 0.00 0.02 0.01 0.07 0.05 40 ELE Electronic equipment 0.00 0.00 0.00 0.00 0.00 0.00 0.02 0.01 0.09 0.06 41 OME Machinery and equipment nec 0.01 0.01 0.00 0.00 0.00 0.00 0.06 0.04 0.23 0.16 42 OMF Manufactures nec 0.01 0.00 0.00 0.00 0.00 0.00 0.02 0.01 0.00 0.00 43 ELY Electricity 31.60 16.57 0.00 0.00 1.08 0.94 2.22 1.47 5.75 3.94 44 GDT Gas manufacture, distribution 0.11 0.06 0.00 0.00 0.00 0.48 0.00 0.00 0.47 0.32 45 WTR Water 0.03 0.02 0.00 0.00 0.01 0.01 0.05 0.03 0.28 0.19 46 CNS Construction 0.00 0.00 0.00 0.00 0.00 0.00 0.25 0.16 0.00 0.00 47 TRD Trade 0.03 0.01 0.00 0.00 0.02 0.01 0.29 0.19 0.84 0.57 48 OTP Transport nec 0.00 0.00 0.00 0.00 0.46 0.40 12.27 8.14 0.15 0.10 49 WTP Water transport 0.00 0.00 0.00 0.00 0.00 0.00 0.59 0.39 0.04 0.02 50 ATP Air transport 0.00 0.00 0.00 0.00 0.00 0.00 7.32 4.86 0.03 0.02 51 CMN Communication 0.00 0.00 0.00 0.00 0.00 0.00 0.01 0.00 0.02 0.01 52 OFI Financial services nec 0.01 0.00 0.00 0.00 0.00 0.00 0.02 0.01 0.14 0.10 53 ISR Insurance 0.00 0.00 0.00 0.00 0.00 0.00 0.00 0.00 0.01 0.01 54 OBS Business services nec 0.03 0.02 0.00 0.00 0.00 0.00 0.07 0.05 0.19 0.13 55 ROS Recreational and other services 0.02 0.01 0.00 0.00 0.00 0.00 0.19 0.13 0.35 0.24 56 OSG Public Administration, Defense, Education, Health 0.04 0.02 0.00 0.00 0.00 0.00 0.39 0.26 1.49 1.02 57 DWE Dwellings 0.00 0.00 0.00 0.00 0.00 0.00 0.00 0.00 0.00 0.00 58 Households 0.00 0.00 0.00 0.00 0.00 0.00 14.01 9.29 5.60 3.84
Total 33.49 20.51 0.01 26.93 6.07 6.10 40.40 32.73 20.03 13.73

31
Table 2a Significance of CO 2 emissions from emitters: China, 2004
Energy commodities
Unit: % Coal Crude oil Natural gas Petroleum products Gas
No. Code Emitters/users CO 2 Usage CO 2 Usage CO 2 Usage CO 2 Usage CO 2 Usage
1 PDR Paddy rice 0.06 0.04 0.00 0.00 0.00 0.00 0.08 0.07 0.00 0.00 2 WHT Wheat 0.06 0.04 0.00 0.00 0.00 0.00 0.07 0.06 0.00 0.00 3 GRO Cereal grains nec 0.04 0.03 0.00 0.00 0.00 0.00 0.05 0.04 0.00 0.00 4 V_F Vegetables, fruit, nuts 0.44 0.28 0.00 0.00 0.00 0.00 0.51 0.42 0.00 0.00 5 OSD Oil seeds 0.03 0.02 0.00 0.00 0.00 0.00 0.04 0.03 0.00 0.00 6 C_B Sugar cane, sugar beet 0.01 0.00 0.00 0.00 0.00 0.00 0.01 0.01 0.00 0.00 7 PFB Plant-based fibers 0.06 0.04 0.00 0.00 0.00 0.00 0.06 0.05 0.00 0.00 8 OCR Crops nec 0.01 0.00 0.00 0.00 0.00 0.00 0.01 0.01 0.00 0.00 9 CTL Bovine cattle, sheep and goats, horses 0.02 0.01 0.00 0.00 0.00 0.00 0.01 0.01 0.00 0.00
10 OAP Animal products nec 0.25 0.16 0.00 0.00 0.00 0.00 0.11 0.09 0.00 0.00 11 RMK Raw milk 0.01 0.00 0.00 0.00 0.00 0.00 0.00 0.00 0.00 0.00 12 WOL Wool, silk-worm cocoons 0.02 0.01 0.00 0.00 0.00 0.00 0.01 0.01 0.00 0.00 13 FRS Forestry 0.05 0.03 0.00 0.00 0.00 0.00 0.16 0.13 0.00 0.00 14 FSH Fishing 0.04 0.03 0.00 0.00 0.00 0.00 0.43 0.35 0.00 0.00 15 COA Coal 1.98 1.28 0.00 0.00 0.00 0.00 0.07 0.06 0.00 0.00 16 OIL Oil 0.00 0.00 0.35 0.29 0.02 0.03 0.18 0.15 0.24 0.21 17 GAS Gas 0.01 0.01 0.01 0.01 0.00 0.00 0.03 0.02 0.00 0.00 18 OMN Minerals nec 0.24 0.15 0.00 0.00 0.00 0.00 0.14 0.12 0.01 0.01 19 CMT Bovine meat products 0.01 0.00 0.00 0.00 0.00 0.00 0.00 0.00 0.00 0.00 20 OMT Meat products nec 0.01 0.01 0.00 0.00 0.00 0.00 0.00 0.00 0.00 0.00 21 VOL Vegetable oils and fats 0.07 0.05 0.00 0.00 0.00 0.00 0.01 0.01 0.00 0.00 22 MIL Dairy products 0.00 0.00 0.00 0.00 0.00 0.00 0.00 0.00 0.00 0.00 23 PCR Processed rice 0.25 0.16 0.00 0.00 0.00 0.00 0.03 0.02 0.00 0.00 24 SGR Sugar 0.00 0.00 0.00 0.00 0.00 0.00 0.00 0.00 0.00 0.00 25 OFD Food products nec 0.45 0.29 0.00 0.00 0.00 0.00 0.05 0.04 0.01 0.01 26 B_T Beverages and tobacco products 0.25 0.16 0.00 0.00 0.00 0.00 0.03 0.02 0.01 0.00 27 TEX Textiles 0.75 0.49 0.00 0.00 0.00 0.00 0.09 0.08 0.00 0.00 28 WAP Wearing apparel 0.09 0.06 0.00 0.00 0.00 0.00 0.03 0.02 0.00 0.00 29 LEA Leather products 0.04 0.03 0.00 0.00 0.00 0.00 0.02 0.02 0.00 0.00
…continued

32
Table 2a (continued)
Energy commodities
Unit: % Coal Crude oil Natural gas Petroleum products Gas
No. Code Emitters/users CO 2 Usage CO 2 Usage CO 2 Usage CO 2 Usage CO 2 Usage
30 LUM Wood products 0.18 0.12 0.00 0.00 0.00 0.00 0.02 0.02 0.00 0.00 31 PPP Paper products, publishing 0.82 0.53 0.00 0.00 0.00 0.00 0.06 0.05 0.00 0.00 32 P_C Petroleum, coal products 0.00 9.16 0.00 15.43 0.08 0.09 0.00 4.95 0.01 0.01 33 CRP Chemical, rubber, plastic products 2.19 1.42 0.21 0.18 0.05 0.12 1.33 2.48 0.73 0.61 34 NMM Mineral products nec 7.58 4.90 0.00 0.00 0.00 0.00 0.73 0.59 0.15 0.13 35 I_S Ferrous metals 2.27 1.47 0.00 0.00 0.00 0.00 2.69 2.20 0.05 0.05 36 NFM Metals nec 0.50 0.33 0.00 0.00 0.00 0.00 0.28 0.23 0.05 0.04 37 FMP Metal products 0.09 0.06 0.00 0.00 0.00 0.00 0.13 0.10 0.01 0.00 38 MVH Motor vehicles and parts 0.22 0.14 0.00 0.00 0.00 0.00 0.07 0.06 0.01 0.01 39 OTN Transport equipment nec 0.04 0.03 0.00 0.00 0.00 0.00 0.04 0.04 0.01 0.01 40 ELE Electronic equipment 0.04 0.03 0.00 0.00 0.00 0.00 0.09 0.08 0.03 0.02 41 OME Machinery and equipment nec 0.48 0.31 0.01 0.01 0.00 0.00 0.31 0.26 0.06 0.05 42 OMF Manufactures nec 0.03 0.02 0.01 0.01 0.00 0.00 0.01 0.01 0.00 0.00 43 ELY Electricity 50.07 32.38 0.01 0.01 0.03 0.03 1.79 1.47 0.25 0.21 44 GDT Gas manufacture, distribution 0.71 0.46 0.06 0.05 0.00 0.00 0.24 0.20 0.40 0.34 45 WTR Water 0.00 0.00 0.00 0.00 0.00 0.00 0.00 0.00 0.01 0.01 46 CNS Construction 0.30 0.19 0.00 0.00 0.00 0.00 0.32 0.26 0.01 0.01 47 TRD Trade 0.17 0.11 0.01 0.01 0.00 0.00 0.71 0.58 0.09 0.08 48 OTP Transport nec 0.39 0.25 0.00 0.00 0.00 0.00 2.18 1.78 0.01 0.01 49 WTP Water transport 0.02 0.01 0.00 0.00 0.00 0.00 2.68 2.19 0.00 0.00 50 ATP Air transport 0.00 0.00 0.00 0.00 0.00 0.00 0.35 0.29 0.00 0.00 51 CMN Communication 0.00 0.00 0.00 0.00 0.00 0.00 0.03 0.02 0.01 0.01 52 OFI Financial services nec 0.01 0.01 0.00 0.00 0.00 0.00 0.05 0.04 0.00 0.00 53 ISR Insurance 0.00 0.00 0.00 0.00 0.00 0.00 0.02 0.01 0.00 0.00 54 OBS Business services nec 0.10 0.07 0.00 0.00 0.00 0.00 0.14 0.11 0.02 0.02 55 ROS Recreational and other services 0.15 0.10 0.00 0.00 0.00 0.00 0.12 0.10 0.03 0.02 56 OSG Public Administration, Defense, Education, Health 0.38 0.25 0.01 0.01 0.00 0.00 0.45 0.37 0.04 0.03 57 DWE Dwellings 0.00 0.00 0.00 0.00 0.00 0.00 0.00 0.00 0.00 0.00 58 Households 3.75 2.43 0.00 0.00 0.12 0.13 3.41 2.79 0.49 0.42
Total 75.75 58.16 0.69 16.00 0.30 0.40 20.48 23.10 2.77 2.34
33
Table 3a Significance of CO 2 emissions from emitters: EU27, 2004
Energy commodities
Unit: % Coal Crude oil Natural gas Petroleum products Gas
No. Code Emitters/users CO 2 Usage CO 2 Usage CO 2 Usage CO 2 Usage CO 2 Usage
1 PDR Paddy rice 0.00 0.00 0.00 0.00 0.00 0.00 0.00 0.00 0.00 0.00 2 WHT Wheat 0.00 0.00 0.00 0.00 0.00 0.00 0.07 0.04 0.01 0.00 3 GRO Cereal grains nec 0.01 0.00 0.00 0.00 0.01 0.00 0.09 0.05 0.00 0.00 4 V_F Vegetables, fruit, nuts 0.02 0.01 0.00 0.00 0.01 0.00 0.30 0.17 0.06 0.03 5 OSD Oil seeds 0.00 0.00 0.00 0.00 0.01 0.00 0.05 0.03 0.00 0.00 6 C_B Sugar cane, sugar beet 0.00 0.00 0.00 0.00 0.00 0.00 0.02 0.01 0.00 0.00 7 PFB Plant-based fibers 0.00 0.00 0.00 0.00 0.01 0.00 0.02 0.01 0.00 0.00 8 OCR Crops nec 0.01 0.01 0.00 0.00 0.01 0.01 0.29 0.16 0.15 0.08 9 CTL Bovine cattle, sheep and goats, horses 0.01 0.00 0.00 0.00 0.00 0.00 0.08 0.04 0.01 0.01
10 OAP Animal products nec 0.02 0.01 0.00 0.00 0.01 0.01 0.17 0.10 0.01 0.01 11 RMK Raw milk 0.01 0.00 0.00 0.00 0.00 0.00 0.12 0.07 0.00 0.00 12 WOL Wool, silk-worm cocoons 0.00 0.00 0.00 0.00 0.01 0.00 0.00 0.00 0.00 0.00 13 FRS Forestry 0.00 0.00 0.00 0.00 0.01 0.00 0.09 0.05 0.00 0.00 14 FSH Fishing 0.00 0.00 0.00 0.00 0.02 0.01 0.18 0.10 0.00 0.00 15 COA Coal 0.04 0.02 0.00 0.00 0.00 0.00 0.01 0.00 0.00 0.00 16 OIL Oil 0.00 0.00 0.01 0.01 0.20 0.15 0.01 0.01 0.04 0.03 17 GAS Gas 0.00 0.00 0.00 0.00 0.01 0.01 0.00 0.00 0.00 0.00 18 OMN Minerals nec 0.02 0.01 0.00 0.00 0.03 0.02 0.13 0.07 0.02 0.01 19 CMT Bovine meat products 0.00 0.00 0.00 0.00 0.04 0.03 0.02 0.01 0.01 0.01 20 OMT Meat products nec 0.01 0.00 0.00 0.00 0.04 0.03 0.03 0.02 0.02 0.01 21 VOL Vegetable oils and fats 0.00 0.00 0.00 0.00 0.04 0.03 0.02 0.01 0.01 0.00 22 MIL Dairy products 0.04 0.02 0.00 0.00 0.11 0.08 0.08 0.04 0.05 0.03 23 PCR Processed rice 0.00 0.00 0.00 0.00 0.00 0.00 0.00 0.00 0.00 0.00 24 SGR Sugar 0.01 0.00 0.00 0.00 0.02 0.02 0.01 0.01 0.01 0.01 25 OFD Food products nec 0.10 0.05 0.00 0.00 0.38 0.28 0.30 0.17 0.24 0.14 26 B_T Beverages and tobacco products 0.01 0.00 0.00 0.00 0.04 0.03 0.04 0.02 0.03 0.02 27 TEX Textiles 0.02 0.01 0.00 0.00 0.14 0.10 0.06 0.03 0.04 0.03 28 WAP Wearing apparel 0.00 0.00 0.00 0.00 0.04 0.03 0.04 0.02 0.02 0.01 29 LEA Leather products 0.00 0.00 0.00 0.00 0.02 0.01 0.02 0.01 0.01 0.01
…continued

34
Table 3a (continued)
Energy commodities
Unit: % Coal Crude oil Natural gas Petroleum products Gas
No. Code Emitters/users CO 2 Usage CO 2 Usage CO 2 Usage CO 2 Usage CO 2 Usage
30 LUM Wood products 0.02 0.01 0.00 0.00 0.03 0.02 0.06 0.03 0.02 0.01 31 PPP Paper products, publishing 0.14 0.06 0.00 0.00 0.44 0.33 0.20 0.11 0.19 0.11 32 P_C Petroleum, coal products 0.00 2.43 0.00 28.54 1.17 0.86 0.00 8.64 0.04 0.02 33 CRP Chemical, rubber, plastic products 0.32 0.14 0.00 0.00 1.21 1.45 0.75 3.51 0.64 0.37 34 NMM Mineral products nec 0.52 0.23 0.00 0.00 0.92 0.68 1.10 0.62 0.23 0.14 35 I_S Ferrous metals 0.28 0.12 0.00 0.00 0.50 0.37 1.03 0.58 0.24 0.14 36 NFM Metals nec 0.04 0.02 0.00 0.00 0.16 0.12 0.14 0.08 0.04 0.02 37 FMP Metal products 0.01 0.00 0.00 0.00 0.22 0.16 0.12 0.07 0.07 0.04 38 MVH Motor vehicles and parts 0.01 0.01 0.00 0.00 0.12 0.09 0.06 0.03 0.06 0.04 39 OTN Transport equipment nec 0.01 0.00 0.00 0.00 0.05 0.03 0.03 0.02 0.02 0.01 40 ELE Electronic equipment 0.00 0.00 0.00 0.00 0.02 0.02 0.04 0.02 0.02 0.01 41 OME Machinery and equipment nec 0.01 0.01 0.00 0.00 0.15 0.11 0.19 0.11 0.12 0.07 42 OMF Manufactures nec 0.00 0.00 0.00 0.00 0.02 0.01 0.05 0.03 0.01 0.00 43 ELY Electricity 23.58 10.49 0.00 0.00 5.78 4.27 2.92 1.64 2.36 1.37 44 GDT Gas manufacture, distribution 0.06 0.03 0.01 0.01 0.00 0.33 0.03 0.02 0.16 0.09 45 WTR Water 0.02 0.01 0.00 0.00 0.14 0.10 0.02 0.01 0.01 0.01 46 CNS Construction 0.00 0.00 0.00 0.00 0.04 0.03 0.45 0.25 0.03 0.02 47 TRD Trade 0.05 0.02 0.00 0.00 0.46 0.34 0.76 0.43 0.26 0.15 48 OTP Transport nec 0.01 0.00 0.00 0.00 0.10 0.08 14.31 8.05 0.08 0.05 49 WTP Water transport 0.00 0.00 0.00 0.00 0.00 0.00 2.59 1.46 0.01 0.00 50 ATP Air transport 0.00 0.00 0.00 0.00 0.00 0.00 3.63 2.04 0.01 0.01 51 CMN Communication 0.00 0.00 0.00 0.00 0.01 0.01 0.07 0.04 0.02 0.01 52 OFI Financial services nec 0.01 0.00 0.00 0.00 0.02 0.01 0.06 0.03 0.03 0.02 53 ISR Insurance 0.00 0.00 0.00 0.00 0.00 0.00 0.03 0.02 0.01 0.01 54 OBS Business services nec 0.04 0.02 0.00 0.00 0.57 0.42 0.42 0.24 0.20 0.12 55 ROS Recreational and other services 0.01 0.00 0.00 0.00 0.16 0.12 0.13 0.07 0.09 0.05 56 OSG Public Administration, Defense, Education, Health 0.04 0.02 0.00 0.00 0.28 0.21 0.50 0.28 0.39 0.23 57 DWE Dwellings 0.00 0.00 0.00 0.00 0.00 0.00 0.00 0.00 0.00 0.00 58 Households 0.80 0.35 0.00 0.00 3.38 2.50 13.46 7.58 4.97 2.89
Total 26.31 14.14 0.03 28.56 17.14 13.56 45.38 37.27 11.13 6.48

35
Table 4a Significance of CO 2 emissions from emitters: Russian Federation, 2004
Energy commodities
Unit: % Coal Crude oil Natural gas Petroleum products Gas
No. Code Emitters/users CO 2 Usage CO 2 Usage CO 2 Usage CO 2 Usage CO 2 Usage
1 PDR Paddy rice 0.00 0.00 0.00 0.00 0.00 0.00 0.00 0.00 0.00 0.00 2 WHT Wheat 0.00 0.00 0.00 0.00 0.00 0.00 0.04 0.03 0.00 0.00 3 GRO Cereal grains nec 0.00 0.00 0.00 0.00 0.00 0.00 0.08 0.05 0.00 0.00 4 V_F Vegetables, fruit, nuts 0.00 0.00 0.00 0.00 0.01 0.01 0.21 0.13 0.01 0.00 5 OSD Oil seeds 0.00 0.00 0.00 0.00 0.00 0.00 0.01 0.01 0.00 0.00 6 C_B Sugar cane, sugar beet 0.00 0.00 0.00 0.00 0.00 0.00 0.00 0.00 0.00 0.00 7 PFB Plant-based fibers 0.00 0.00 0.00 0.00 0.00 0.00 0.00 0.00 0.00 0.00 8 OCR Crops nec 0.00 0.00 0.00 0.00 0.00 0.00 0.00 0.00 0.00 0.00 9 CTL Bovine cattle, sheep and goats, horses 0.00 0.00 0.00 0.00 0.00 0.00 0.08 0.05 0.00 0.00
10 OAP Animal products nec 0.00 0.00 0.00 0.00 0.00 0.00 0.03 0.02 0.00 0.00 11 RMK Raw milk 0.01 0.00 0.00 0.00 0.00 0.00 0.18 0.12 0.00 0.00 12 WOL Wool, silk-worm cocoons 0.00 0.00 0.00 0.00 0.00 0.00 0.00 0.00 0.00 0.00 13 FRS Forestry 0.01 0.00 0.00 0.00 0.04 0.03 0.29 0.19 0.00 0.00 14 FSH Fishing 0.00 0.00 0.00 0.00 0.01 0.01 0.01 0.00 0.00 0.00 15 COA Coal 0.11 0.05 0.00 0.00 0.00 0.00 0.00 0.00 0.00 0.00 16 OIL Oil 0.00 0.00 0.28 0.18 0.63 0.53 0.05 0.03 0.16 0.10 17 GAS Gas 0.00 0.00 0.14 0.09 1.45 1.21 0.04 0.02 0.00 0.00 18 OMN Minerals nec 0.00 0.00 0.00 0.00 0.00 0.00 0.00 0.00 0.00 0.00 19 CMT Bovine meat products 0.00 0.00 0.00 0.00 0.00 0.00 0.03 0.02 0.01 0.01 20 OMT Meat products nec 0.00 0.00 0.00 0.00 0.00 0.00 0.01 0.01 0.01 0.00 21 VOL Vegetable oils and fats 0.00 0.00 0.00 0.00 0.01 0.01 0.03 0.02 0.01 0.00 22 MIL Dairy products 0.01 0.00 0.00 0.00 0.05 0.04 0.03 0.02 0.02 0.01 23 PCR Processed rice 0.00 0.00 0.00 0.00 0.00 0.00 0.00 0.00 0.00 0.00 24 SGR Sugar 0.01 0.00 0.00 0.00 0.00 0.00 0.03 0.02 0.01 0.00 25 OFD Food products nec 0.01 0.00 0.00 0.00 0.01 0.01 0.03 0.02 0.03 0.02 26 B_T Beverages and tobacco products 0.00 0.00 0.00 0.00 0.00 0.00 0.03 0.02 0.02 0.01 27 TEX Textiles 0.00 0.00 0.00 0.00 0.00 0.00 0.00 0.00 0.00 0.00 28 WAP Wearing apparel 0.00 0.00 0.00 0.00 0.00 0.00 0.00 0.00 0.00 0.00 29 LEA Leather products 0.00 0.00 0.00 0.00 0.00 0.00 0.00 0.00 0.00 0.00
…continued

36
Table 4a (continued)
Energy commodities
Unit: % Coal Crude oil Natural gas Petroleum products Gas
No. Code Emitters/users CO 2 Usage CO 2 Usage CO 2 Usage CO 2 Usage CO 2 Usage
30 LUM Wood products 0.00 0.00 0.00 0.00 0.00 0.00 0.11 0.07 0.00 0.00 31 PPP Paper products, publishing 0.00 0.00 0.00 0.00 0.02 0.01 0.00 0.00 0.04 0.03 32 P_C Petroleum, coal products 0.00 3.24 0.00 23.07 1.34 1.12 0.00 3.03 0.17 0.11 33 CRP Chemical, rubber, plastic products 0.00 0.00 0.00 0.00 0.25 1.97 1.44 1.30 0.52 0.34 34 NMM Mineral products nec 0.11 0.06 0.00 0.00 0.83 0.70 0.14 0.09 0.27 0.18 35 I_S Ferrous metals 0.07 0.04 0.01 0.00 1.53 1.28 0.89 0.57 0.50 0.33 36 NFM Metals nec 0.24 0.12 0.01 0.01 0.00 0.00 0.37 0.24 0.36 0.24 37 FMP Metal products 0.00 0.00 0.00 0.00 0.02 0.02 0.07 0.04 0.03 0.02 38 MVH Motor vehicles and parts 0.00 0.00 0.00 0.00 0.00 0.00 0.00 0.00 0.00 0.00 39 OTN Transport equipment nec 0.00 0.00 0.00 0.00 0.00 0.00 0.00 0.00 0.00 0.00 40 ELE Electronic equipment 0.00 0.00 0.00 0.00 0.00 0.00 0.03 0.02 0.01 0.01 41 OME Machinery and equipment nec 0.01 0.01 0.00 0.00 0.13 0.11 0.02 0.02 0.13 0.09 42 OMF Manufactures nec 0.00 0.00 0.00 0.00 0.00 0.00 0.01 0.01 0.01 0.01 43 ELY Electricity 17.79 8.98 0.18 0.12 23.22 19.47 4.31 2.75 9.58 6.32 44 GDT Gas manufacture, distribution 0.00 0.00 0.01 0.00 0.00 0.10 0.02 0.01 0.06 0.04 45 WTR Water 0.02 0.01 0.00 0.00 0.00 0.00 0.06 0.04 0.00 0.00 46 CNS Construction 0.01 0.00 0.00 0.00 0.01 0.01 0.20 0.13 0.05 0.03 47 TRD Trade 0.06 0.03 0.00 0.00 0.04 0.03 0.44 0.28 0.05 0.03 48 OTP Transport nec 0.00 0.00 0.01 0.00 3.44 2.89 5.61 3.58 1.56 1.03 49 WTP Water transport 0.00 0.00 0.00 0.00 0.08 0.07 0.58 0.37 0.10 0.07 50 ATP Air transport 0.00 0.00 0.00 0.00 0.05 0.04 1.39 0.89 0.31 0.20 51 CMN Communication 0.01 0.00 0.00 0.00 0.00 0.00 0.02 0.01 0.03 0.02 52 OFI Financial services nec 0.00 0.00 0.00 0.00 0.01 0.01 0.19 0.12 0.06 0.04 53 ISR Insurance 0.00 0.00 0.00 0.00 0.00 0.00 0.20 0.13 0.01 0.00 54 OBS Business services nec 0.01 0.00 0.01 0.01 0.05 0.04 0.88 0.56 0.03 0.02 55 ROS Recreational and other services 0.02 0.01 0.00 0.00 0.02 0.02 0.04 0.02 0.03 0.02 56 OSG Public Administration, Defense, Education, Health 0.20 0.10 0.00 0.00 0.06 0.05 0.40 0.25 0.35 0.23 57 DWE Dwellings 0.00 0.00 0.00 0.00 0.00 0.00 0.00 0.00 0.00 0.00 58 Households 1.25 0.63 0.00 0.00 0.51 0.42 4.39 2.80 7.99 5.27
Total 19.99 13.33 0.66 23.50 33.81 30.20 23.02 18.10 22.53 14.87

37
Table 5a Significance of CO 2 emissions from emitters: Japan, 2004
Energy commodities
Unit: % Coal Crude oil Natural gas Petroleum products Gas
No. Code Emitters/users CO 2 Usage CO 2 Usage CO 2 Usage CO 2 Usage CO 2 Usage
1 PDR Paddy rice 0.00 0.00 0.00 0.00 0.00 0.00 0.20 0.10 0.00 0.00 2 WHT Wheat 0.00 0.00 0.00 0.00 0.00 0.00 0.04 0.02 0.00 0.00 3 GRO Cereal grains nec 0.00 0.00 0.00 0.00 0.00 0.00 0.00 0.00 0.00 0.00 4 V_F Vegetables, fruit, nuts 0.00 0.00 0.00 0.00 0.00 0.00 0.63 0.33 0.00 0.00 5 OSD Oil seeds 0.00 0.00 0.00 0.00 0.00 0.00 0.00 0.00 0.00 0.00 6 C_B Sugar cane, sugar beet 0.00 0.00 0.00 0.00 0.00 0.00 0.01 0.00 0.00 0.00 7 PFB Plant-based fibers 0.00 0.00 0.00 0.00 0.00 0.00 0.01 0.01 0.00 0.00 8 OCR Crops nec 0.00 0.00 0.00 0.00 0.00 0.00 0.40 0.21 0.00 0.00 9 CTL Bovine cattle, sheep and goats, horses 0.00 0.00 0.00 0.00 0.00 0.00 0.00 0.00 0.00 0.00
10 OAP Animal products nec 0.00 0.00 0.00 0.00 0.00 0.00 0.01 0.01 0.00 0.00 11 RMK Raw milk 0.00 0.00 0.00 0.00 0.00 0.00 0.01 0.00 0.00 0.00 12 WOL Wool, silk-worm cocoons 0.00 0.00 0.00 0.00 0.00 0.00 0.00 0.00 0.00 0.00 13 FRS Forestry 0.00 0.00 0.00 0.00 0.00 0.00 0.09 0.05 0.00 0.00 14 FSH Fishing 0.00 0.00 0.00 0.00 0.00 0.00 1.32 0.69 0.00 0.00 15 COA Coal 0.00 0.00 0.00 0.00 0.00 0.00 0.00 0.00 0.00 0.00 16 OIL Oil 0.00 0.00 0.00 0.00 0.00 0.00 0.00 0.00 0.00 0.00 17 GAS Gas 0.00 0.00 0.00 0.00 0.00 0.00 0.00 0.00 0.00 0.00 18 OMN Minerals nec 0.00 0.00 0.00 0.00 0.03 0.02 0.19 0.10 0.00 0.00 19 CMT Bovine meat products 0.00 0.00 0.00 0.00 0.00 0.00 0.01 0.00 0.00 0.00 20 OMT Meat products nec 0.00 0.00 0.00 0.00 0.00 0.00 0.02 0.01 0.00 0.00 21 VOL Vegetable oils and fats 0.00 0.00 0.00 0.00 0.00 0.00 0.02 0.01 0.00 0.00 22 MIL Dairy products 0.00 0.00 0.00 0.00 0.00 0.00 0.10 0.05 0.00 0.00 23 PCR Processed rice 0.00 0.00 0.00 0.00 0.00 0.00 0.01 0.01 0.00 0.00 24 SGR Sugar 0.00 0.00 0.00 0.00 0.00 0.00 0.05 0.03 0.00 0.00 25 OFD Food products nec 0.00 0.00 0.00 0.00 0.08 0.06 0.55 0.28 0.00 0.00 26 B_T Beverages and tobacco products 0.00 0.00 0.00 0.00 0.00 0.00 0.14 0.07 0.00 0.00 27 TEX Textiles 0.00 0.00 0.00 0.00 0.01 0.01 0.04 0.02 0.01 0.00 28 WAP Wearing apparel 0.00 0.00 0.00 0.00 0.00 0.00 0.01 0.00 0.00 0.00 29 LEA Leather products 0.00 0.00 0.00 0.00 0.00 0.00 0.00 0.00 0.00 0.00
…continued

38
Table 5a (continued)
Energy commodities
Unit: % Coal Crude oil Natural gas Petroleum products Gas
No. Code Emitters/users CO 2 Usage CO 2 Usage CO 2 Usage CO 2 Usage CO 2 Usage
30 LUM Wood products 0.00 0.00 0.00 0.00 0.00 0.00 0.01 0.00 0.00 0.00 31 PPP Paper products, publishing 0.54 0.22 0.00 0.00 0.09 0.06 0.60 0.31 0.02 0.01 32 P_C Petroleum, coal products 0.00 6.63 0.00 28.39 1.07 0.73 0.00 7.47 0.00 0.00 33 CRP Chemical, rubber, plastic products 1.61 0.66 0.01 0.00 0.84 0.82 3.59 7.03 0.01 0.01 34 NMM Mineral products nec 0.99 0.41 0.00 0.00 0.15 0.10 0.91 0.47 0.00 0.00 35 I_S Ferrous metals 0.56 0.23 0.00 0.00 0.37 0.26 3.02 1.57 0.05 0.03 36 NFM Metals nec 0.01 0.01 0.00 0.00 0.04 0.02 0.20 0.10 0.01 0.00 37 FMP Metal products 0.01 0.00 0.00 0.00 0.01 0.01 0.12 0.06 0.01 0.00 38 MVH Motor vehicles and parts 0.00 0.00 0.00 0.00 0.00 0.00 0.01 0.00 0.00 0.00 39 OTN Transport equipment nec 0.00 0.00 0.00 0.00 0.02 0.01 0.00 0.00 0.00 0.00 40 ELE Electronic equipment 0.01 0.00 0.00 0.00 0.28 0.19 0.17 0.09 0.01 0.00 41 OME Machinery and equipment nec 0.03 0.01 0.00 0.00 0.06 0.04 0.18 0.09 0.01 0.00 42 OMF Manufactures nec 0.00 0.00 0.00 0.00 0.06 0.04 0.16 0.08 0.03 0.01 43 ELY Electricity 19.08 7.85 1.48 0.78 10.02 6.85 5.64 2.93 0.00 0.00 44 GDT Gas manufacture, distribution 0.00 0.00 0.00 0.00 0.00 0.00 0.00 0.00 0.00 0.00 45 WTR Water 0.00 0.00 0.00 0.00 0.00 0.00 0.01 0.01 0.00 0.00 46 CNS Construction 0.00 0.00 0.00 0.00 0.00 0.00 1.07 0.56 0.00 0.00 47 TRD Trade 0.00 0.00 0.00 0.00 0.04 0.03 1.37 0.71 0.02 0.01 48 OTP Transport nec 0.00 0.00 0.00 0.00 0.06 0.04 15.50 8.06 0.00 0.00 49 WTP Water transport 0.00 0.00 0.00 0.00 0.00 0.00 1.71 0.89 0.00 0.00 50 ATP Air transport 0.00 0.00 0.00 0.00 0.00 0.00 1.13 0.59 0.00 0.00 51 CMN Communication 0.00 0.00 0.00 0.00 0.00 0.00 0.14 0.07 0.00 0.00 52 OFI Financial services nec 0.00 0.00 0.00 0.00 0.00 0.00 0.10 0.05 0.00 0.00 53 ISR Insurance 0.00 0.00 0.00 0.00 0.00 0.00 0.06 0.03 0.00 0.00 54 OBS Business services nec 0.00 0.00 0.00 0.00 1.22 0.84 1.10 0.57 0.02 0.01 55 ROS Recreational and other services 0.00 0.00 0.00 0.00 0.03 0.02 0.77 0.40 0.00 0.00 56 OSG Public Administration, Defense, Education, Health 0.00 0.00 0.00 0.00 0.02 0.01 3.69 1.92 0.23 0.12 57 DWE Dwellings 0.00 0.00 0.00 0.00 0.00 0.00 0.00 0.00 0.00 0.00 58 Households 0.00 0.00 0.00 0.00 1.09 0.75 13.58 7.06 0.91 0.49
Total 22.85 16.03 1.49 29.18 15.63 10.92 58.69 43.15 1.33 0.72

39
Table 6a Significance of CO 2 emissions from emitters: India, 2004
Energy commodities
Unit: % Coal Crude oil Natural gas Petroleum products Gas
No. Code Emitters/users CO 2 Usage CO 2 Usage CO 2 Usage CO 2 Usage CO 2 Usage
1 PDR Paddy rice 0.00 0.00 0.00 0.00 0.00 0.00 0.00 0.00 0.00 0.00 2 WHT Wheat 0.00 0.00 0.00 0.00 0.00 0.00 0.00 0.00 0.00 0.00 3 GRO Cereal grains nec 0.00 0.00 0.00 0.00 0.00 0.00 0.00 0.00 0.00 0.00 4 V_F Vegetables, fruit, nuts 0.00 0.00 0.00 0.00 0.00 0.00 0.00 0.00 0.00 0.00 5 OSD Oil seeds 0.00 0.00 0.00 0.00 0.00 0.00 0.00 0.00 0.00 0.00 6 C_B Sugar cane, sugar beet 0.00 0.00 0.00 0.00 0.00 0.00 0.00 0.00 0.00 0.00 7 PFB Plant-based fibers 0.00 0.00 0.00 0.00 0.00 0.00 0.00 0.00 0.00 0.00 8 OCR Crops nec 0.00 0.00 0.00 0.00 0.00 0.00 0.00 0.00 0.00 0.00 9 CTL Bovine cattle, sheep and goats, horses 0.00 0.00 0.00 0.00 0.00 0.00 0.00 0.00 0.00 0.00
10 OAP Animal products nec 0.00 0.00 0.00 0.00 0.00 0.00 0.00 0.00 0.00 0.00 11 RMK Raw milk 0.00 0.00 0.00 0.00 0.01 0.01 0.00 0.00 0.00 0.00 12 WOL Wool, silk-worm cocoons 0.00 0.00 0.00 0.00 0.00 0.00 0.00 0.00 0.00 0.00 13 FRS Forestry 0.00 0.00 0.00 0.00 0.00 0.00 0.00 0.00 0.00 0.00 14 FSH Fishing 0.00 0.00 0.00 0.00 0.00 0.00 0.00 0.00 0.00 0.00 15 COA Coal 0.14 0.08 0.00 0.00 0.00 0.00 0.00 0.00 0.00 0.00 16 OIL Oil 0.00 0.00 0.00 0.00 0.25 0.24 0.00 0.00 0.00 0.00 17 GAS Gas 0.00 0.00 0.00 0.00 0.44 0.42 0.00 0.00 0.00 0.00 18 OMN Minerals nec 0.02 0.01 0.00 0.00 0.00 0.00 0.34 0.25 0.00 0.00 19 CMT Bovine meat products 0.00 0.00 0.00 0.00 0.00 0.00 0.03 0.02 0.00 0.00 20 OMT Meat products nec 0.00 0.00 0.00 0.00 0.00 0.00 0.00 0.00 0.00 0.00 21 VOL Vegetable oils and fats 0.00 0.00 0.00 0.00 0.00 0.00 0.08 0.06 0.00 0.00 22 MIL Dairy products 0.00 0.00 0.00 0.00 0.00 0.00 0.27 0.20 0.00 0.00 23 PCR Processed rice 0.00 0.00 0.00 0.00 0.00 0.00 1.56 1.13 0.00 0.00 24 SGR Sugar 0.00 0.00 0.00 0.00 0.00 0.00 0.19 0.14 0.00 0.00 25 OFD Food products nec 0.00 0.00 0.00 0.00 0.00 0.00 0.24 0.18 0.00 0.00 26 B_T Beverages and tobacco products 0.00 0.00 0.00 0.00 0.00 0.00 0.13 0.10 0.00 0.00 27 TEX Textiles 0.19 0.11 0.00 0.00 0.00 0.00 0.25 0.18 0.00 0.00 28 WAP Wearing apparel 0.00 0.00 0.00 0.00 0.00 0.00 0.03 0.02 0.00 0.00 29 LEA Leather products 0.00 0.00 0.00 0.00 0.00 0.00 0.03 0.02 0.00 0.00
…continued
40
Table 6a (continued)
Energy commodities
Unit: % Coal Crude oil Natural gas Petroleum products Gas
No. Code Emitters/users CO 2 Usage CO 2 Usage CO 2 Usage CO 2 Usage CO 2 Usage
30 LUM Wood products 0.00 0.00 0.00 0.00 0.00 0.00 0.02 0.01 0.00 0.00 31 PPP Paper products, publishing 0.91 0.52 0.00 0.00 0.00 0.00 0.04 0.03 0.00 0.00 32 P_C Petroleum, coal products 0.00 3.16 0.00 26.62 0.90 0.85 0.00 3.55 0.00 0.00 33 CRP Chemical, rubber, plastic products 0.85 0.48 0.00 0.00 1.47 1.60 1.49 3.78 0.00 0.00 34 NMM Mineral products nec 3.40 1.94 0.00 0.00 0.00 0.00 0.29 0.21 0.00 0.00 35 I_S Ferrous metals 2.72 1.56 0.00 0.00 0.00 0.00 0.94 0.68 0.00 0.00 36 NFM Metals nec 0.20 0.12 0.00 0.00 0.00 0.00 0.07 0.05 0.00 0.00 37 FMP Metal products 0.05 0.03 0.00 0.00 0.00 0.00 0.15 0.11 0.00 0.00 38 MVH Motor vehicles and parts 0.00 0.00 0.00 0.00 0.00 0.00 0.01 0.01 0.00 0.00 39 OTN Transport equipment nec 0.00 0.00 0.00 0.00 0.00 0.00 0.00 0.00 0.00 0.00 40 ELE Electronic equipment 0.00 0.00 0.00 0.00 0.00 0.00 0.02 0.02 0.00 0.00 41 OME Machinery and equipment nec 0.01 0.01 0.00 0.00 0.00 0.00 0.15 0.11 0.00 0.00 42 OMF Manufactures nec 0.04 0.03 0.00 0.00 0.00 0.00 0.08 0.06 0.00 0.00 43 ELY Electricity 53.87 30.81 0.00 0.00 2.78 2.64 2.62 1.90 0.00 0.00 44 GDT Gas manufacture, distribution 0.01 0.00 0.00 0.00 0.00 0.00 0.00 0.00 0.00 0.00 45 WTR Water 0.00 0.00 0.00 0.00 0.00 0.00 0.00 0.00 0.00 0.00 46 CNS Construction 0.00 0.00 0.00 0.00 0.00 0.00 0.08 0.06 0.00 0.00 47 TRD Trade 0.54 0.31 0.00 0.00 0.00 0.00 0.03 0.02 0.00 0.00 48 OTP Transport nec 0.05 0.03 0.00 0.00 0.00 0.00 6.05 4.37 0.00 0.00 49 WTP Water transport 0.00 0.00 0.00 0.00 0.00 0.00 1.62 1.17 0.00 0.00 50 ATP Air transport 0.00 0.00 0.00 0.00 0.00 0.00 0.39 0.28 0.00 0.00 51 CMN Communication 0.00 0.00 0.00 0.00 0.00 0.00 0.00 0.00 0.00 0.00 52 OFI Financial services nec 0.00 0.00 0.00 0.00 0.00 0.00 0.00 0.00 0.00 0.00 53 ISR Insurance 0.00 0.00 0.00 0.00 0.00 0.00 0.00 0.00 0.00 0.00 54 OBS Business services nec 0.22 0.13 0.00 0.00 0.00 0.00 0.02 0.01 0.00 0.00 55 ROS Recreational and other services 0.20 0.12 0.00 0.00 0.00 0.00 0.02 0.01 0.00 0.00 56 OSG Public Administration, Defense, Education, Health 0.00 0.00 0.00 0.00 0.00 0.00 0.01 0.01 0.00 0.00 57 DWE Dwellings 0.00 0.00 0.00 0.00 0.00 0.00 0.00 0.00 0.00 0.00 58 Households 2.01 1.15 0.00 0.00 0.00 0.00 11.17 8.08 0.17 0.12
Total 65.49 40.62 0.00 26.62 5.88 5.79 28.44 26.83 0.19 0.14

41
Appendix
Table A1. Values of coefficients in Equation 1
Energy commodities Conversion Coefficient
(CC)
Emission Factor
(EF)
Fraction of Carbon
Oxydized (FOC)
Unit: (TJ/1000toe) (ton Carbon/TJ)
Coal 41.868 25.80 0.980
Crude oil 41.868 20.00 0.990
Natural gas 41.868 15.30 0.950
Petroleum products* 44.50 19.00 0.990
Gas** 47.31 17.20 0.995
* We use an approximate for all petroleum products.
** Mainly Liquefied Petroleum Gas (LPG).
Note: values of coefficients are obtained from the "Greenhouse Gas Inventory Reference Manual" of IEA
(1997).

42
Table A2. Feedstock use ratios of fuels by the petrochemistry sector
Ratios of fuels used by the
petrochemistry sector as feedstocks:
Natural gas Petroleum
products
1 AUS Australia 0.657 0.8435
2 NZL New Zealand 1 0
3 XOC Rest of Oceania 0 0
4 CHN China 0.5818 0.5613
5 HKG Hong Kong 0 0
6 JPN Japan 0.2966 0.7343
7 KOR Korea 0 0.9532
8 TWN Taiwan 0.7343 0.7743
9 XEA Rest of East Asia 0 0
10 KHM Cambodia 0 0
11 IDN Indonesia 1 0.9007
12 LAO Lao People's Democratic Republic 0 0
13 MMR Myanmar 1 0
14 MYS Malaysia 1 1
15 PHL Philippines 0 0
16 SGP Singapore 0 1
17 THA Thailand 1 0.935
18 VNM Vietnam 0 0
19 XSE Rest of Southeast Asia 0 1
20 BGD Bangladesh 1 0
21 IND India 0.1308 0.7152
22 PAK Pakistan 0.7865 0
23 LKA Sri Lanka 0 0
24 XSA Rest of South Asia 0 0
25 CAN Canada 0.5769 0.9912
26 USA United States of America 0.2508 0.9148
27 MEX Mexico 0.4459 0.9259
28 XNA Rest of North America 0 1
29 ARG Argentina 1 1
30 BOL Bolivia 0 0
31 BRA Brazil 0.2634 0.7282
32 CHL Chile 0 0
33 COL Colombia 0 0
34 ECU Ecuador 0 0
35 PRY Paraguay 0 0
36 PER Peru 0 0
37 URY Uruguay 0 0
38 VEN Venezuela 0 0
39 XSM Rest of South America 0 1
40 CRI Costa Rica 0 0.9074
…continued

43
Table A2 (continued)
Ratios of fuels used by the
petrochemistry sector as feedstocks:
Natural gas Petroleum
products
41 GTM Guatemala 0 0
42 NIC Nicaragua 0 0
43 PAN Panama 0 0
44 XCA Rest of Central America 0 0
45 XCB Caribbean 1 0
46 AUT Austria 0.4067 0.9675
47 BEL Belgium 0.3287 0.9589
48 CYP Cyprus 0 0
49 CZE Czech Republic 0 0.9018
50 DNK Denmark 0 0
51 EST Estonia 0.988 0
52 FIN Finland 0.6517 0.7273
53 FRA France 0.4037 0.7816
54 DEU Germany 0.303 0.9953
55 GRC Greece 0.8188 0.5905
56 HUN Hungary 0.6459 0.9504
57 IRL Ireland 0 0
58 ITA Italy 0.2438 0.8643
59 LVA Latvia 0 0
60 LTU Lithuania 0.924 0
61 LUX Luxembourg 0 0
62 MLT Malta 0 0
63 NLD Netherlands 0.4973 0.8532
64 POL Poland 0.9143 0.5056
65 PRT Portugal 0 0.8727
66 SVK Slovakia 0.8283 0.7979
67 SVN Slovenia 0.6 0
68 ESP Spain 0.1572 0.8834
69 SWE Sweden 0 0.7785
70 GBR United Kingdom 0.2008 0.981
71 CHE Switzerland 0 0.5628
72 NOR Norway 0.8206 0.9008
73 XEF Rest of EFTA 0 0
74 ALB Albania 0 0
75 BGR Bulgaria 0.8036 0.4937
76 BLR Belarus 0.7322 0.9633
77 HRV Croatia 0.729 0.4261
78 ROU Romania 0.2914 0.5544
79 RUS Russian Federation 0.8932 0.294
80 UKR Ukraine 0.8979 0.3214
…continued

44
Table A2 (continued)
Ratios of fuels used by the
petrochemistry sector as feedstocks:
Natural gas Petroleum
products
81 XEE Rest of Eastern Europe 0 0
82 XER Rest of Europe 0.9962 0
83 KAZ Kazakhstan 0 0
84 KGZ Kyrgyzstan 0 0
85 XSU Rest of Former Soviet Union 0 0
86 ARM Armenia 0 0
87 AZE Azerbaijan 0 1
88 GEO Georgia 1 1
89 IRN Iran, Islamic Republic of 0.5237 0
90 TUR Turkey 0.5506 0.4687
91 XWS Rest of Western Asia 0.2271 0.9658
92 EGY Egypt 1 0
93 MAR Morocco 0 0
94 TUN Tunisia 0 0
95 XNF Rest of North Africa 0.9873 1
96 NGA Nigeria 0 0
97 SEN Senegal 0 0
98 XWF Rest of Western Africa 0 1
99 XCF Rest of Central Africa 0 0
100 XAC Rest of South Central Africa 0 1
101 ETH Ethiopia 0 0
102 MDG Madagascar 0 1
103 MWI Malawi 0 1
104 MUS Mauritius 0 1
105 MOZ Mozambique 0 0
106 TZA Tanzania 0 0
107 UGA Uganda 0 1
108 ZMB Zambia 0 0
109 ZWE Zimbabwe 0 0
110 XEC Rest of Eastern Africa 0 1
111 BWA Botswana 0 0
112 ZAF South Africa 0 1
113 XSC Rest of South African Customs Union 0 0