The College Completion - ERICThe College Completion Agenda 2011 Progress Report The College Board is...
382
The College Completion Agenda 2011 Progress Report
Transcript of The College Completion - ERICThe College Completion Agenda 2011 Progress Report The College Board is...

TheCollege Completion Agenda2011Progress Report
The College Board is a mission-driven not-for-profit organization that connects students to college success and opportunity. Founded in 1900, the College Board was created to expand access to higher education. Today, the membership association is made up of more than 5,900 of the world’s leading educational institutions and is dedicated to promoting excellence and equity in education. Each year, the College Board helps more than seven million students prepare for a successful transition to college through programs and services in college readiness and college success — including the SAT® and the Advanced Placement Program®. The organization also serves the education community through research and advocacy on behalf of students, educators and schools.
For further information, visit www.collegeboard.org.
The College Board Advocacy & Policy Center was established to help transform education in America. Guided by the College Board’s principles of excellence and equity in education, we work to ensure that students from all backgrounds have the opportunity to succeed in college and beyond. We make critical connections between policy, research and real-world practice to develop innovative solutions to the most pressing challenges in education today. This report can be downloaded at completionagenda.collegeboard.org. Hard copies may be ordered by contacting [email protected].
advocacy.collegeboard.org
© 2011 The College Board. College Board, Advanced Placement, Advanced Placement Program, AP, SAT and the acorn logo are registered trademarks of the College Board. PSAT/NMSQT is a registered trademark of the College Board and National Merit Scholarship Corporation. All other products and services may be trademarks of their respective owners. Visit the College Board on the Web: www.collegeboard.org.
110854705 11b-3269
Th
e College
Co
mp
letion A
gend
a2011 Prog
ress Rep
ort
Acknowledgments This report was written and edited by John Michael Lee Jr., policy director of the College Board Advocacy and Policy Center; Anita Rawls, assistant research scientist in Research and Development; Kelcey Edwards, senior research analyst at the College Board; and Roxanna Menson, director in Advanced Placement. The authors would like to thank Christen Pollock, vice president of advocacy and director of the College Board Advocacy & Policy Center, for her unwavering support of this project. We would further like to thank Rosalina Colon, project manager in the College Board Advocacy and Policy Center, who provided excellent oversight for the entire project and ensured that we completed this project; and a special thanks is given to Mike Hurowitz, associate policy research scientist in the College Board Advocacy & Policy Center who provided invaluable contributions to chapters seven and eight of this report. The authors would also like to thank Wayne Camara, vice president of Research & Development at the College Board; Thanos Patelis, vice president in Research & Analysis Services at the College Board; and Ellen Sawtell, senior director of research services at the College Board who provided edits and analysis for this report.
The authors would also like to thank the College Completion Agenda Advisory Committee Members who helped to shape this document into an even better document. These advisory members include Patrick Kelly, senior associate at the National Center for Higher Education Management Systems (NCHEMS); Michael Nettles, senior vice president at Educational Testing Services (ETS); Bruce Walker, vice provost and director of admissions at The University of Texas at Austin; Trevor Packer, senior vice president at the College Board; Patricia Martin, assistant vice president and director of NOSCA at the College Board; and Sandy Baum, independent senior policy analyst at the College Board. Each provided invaluable advice and direction for this project.
We heartily acknowledge the efforts of each of these individuals in the process of conducting this research. We also recognize that the responsibility for the content of this report, including errors, lies solely with the authors.
TheCollege Completion Agenda2011Progress Report
John Michael Lee, Jr.Kelcey EdwardsRoxanna MensonAnita Rawls
The Goal: Increase the proportion of 25- to 34-year-olds who hold an associate degree or higher to 55 percent by the year 2025 in order to make America the leader in educational attainment in the world.
55% by2025

Recommendations So Important They Cannot Be IgnoredWhen the Commission on Access, Admissions and Success in Higher Education
(subsequently referred to as the commission) convened in fall 2008, the
educational landscape was facing a number of issues that the commission’s
members recognized as formidable challenges to those students who aspire
to enroll and succeed in college. Summarizing the commission’s 2008 report,
Coming to Our Senses: Education and the American Future, college and high
school completion rates had dropped dramatically; the proportion of adults
with postsecondary credentials was not keeping pace with other industrialized
nations; and signifi cant disparities existed for low-income and minority students.
As such, the commission was faced with two key questions: What must be
done to improve the nation’s educational system, and how will we know if the
changes that are made are successful?
Echoing the fi ndings of other key educational policymakers, the commission
declared that it is critical — and thus should be a primary goal — that
55 percent of the nation’s young adults attain an associate degree or higher.
The commission further offered a 10-part action plan in the form of 10
recommendations.
The commission noted that these recommendations are so important they
must be measured on a regular basis to help us understand the state of the
educational landscape in the nation and how it changes over time. This report
is designed to illustrate the degree to which the nation is moving toward —
or away from — taking the necessary steps for ensuring an educated and
enlightened citizenry.
OneProvide a program of voluntary preschool education, universally available to children from low-income families.
TwoImprove middle and high school college counseling.
ThreeImplement the best research-based dropout prevention programs.
FourAlign the K–12 education system with international standards and college admission expectations.
FiveImprove teacher quality and focus on recruitment and retention.
SixClarify and simplify the admission process.
SevenProvide more need-based grant aid while simplifying the fi nancial aid system and making it more transparent.
EightKeep college affordable.
NineDramatically increase college completion rates.
TenProvide postsecondary opportunities as an essential element of adult education programs.
iii

The Commission on Access, Admissions and Success in Higher Education
Commission Members
Gaston Caperton, President College Board
William “Brit” Kirwan (Chairman), Chancellor University System of Maryland
Jerome Lucido (Vice Chairman), Executive Director and Professor of Research
University of Southern California
Molly Broad, President, Education American Council on
Joyce Brown, Manager of Secondary School Counselors Chicago Public Schools
Arlene Wesley Cash, Vice President for Enrollment Management Spelman College
Frank Chong, President Laney College
Carl Cohn, Former Superintendent San Diego Unifi ed School District
Tom Dawson, Senior Policy Offi cer The Gates Foundation
Janice Doyle, Chief of Staff to Chancellor University System of Maryland
Susan Gendron, Commissioner of Education Maine
Barbara Gill, Director of Undergraduate Admissions University of Maryland
Natala “Tally” Hart, Senior Advisor for Economic Access The Ohio State University
Terry Hartle, Senior Vice President American Council on Education
Kati Haycock, President The Education Trust
Mary Lee Hoganson, Past President National Association for College Admission Counseling
Don Hossler, Executive Director National Student Clearinghouse
Joseph McDonald, President & Founder Salish Kootenai College
James Moeser, Chancellor Emeritus University of North Carolina at Chapel Hill
Lester Monts, Senior Vice Provost University of Michigan
Charlene Nunley, President Emerita Montgomery College
Shirley Ort, Associate Provost and Director of Scholarships & Student Aid
University of North Carolina at Chapel Hill
Charles Reed, Chancellor California State University
Manuel Rivera, Former Deputy Secretary of Education New York
Barbara Snyder, President Case Western Reserve University
Gordon Stanley, Director of Counseling Marist School
Bruce Walker, Vice Provost and Director of Admissions University of Texas at Austin
Gregory Williams, President City College of New York
James Wright, President Emeritus Dartmouth College
Mark Yudof, President University of California
College Board Staff
Tom Rudin, Senior Vice President
Wayne Camara, Vice President
Christen Pollock, Vice President
Bradley Quin, Executive Director
Sandy Baum, Independent Senior Policy Analyst for the College Board
iv
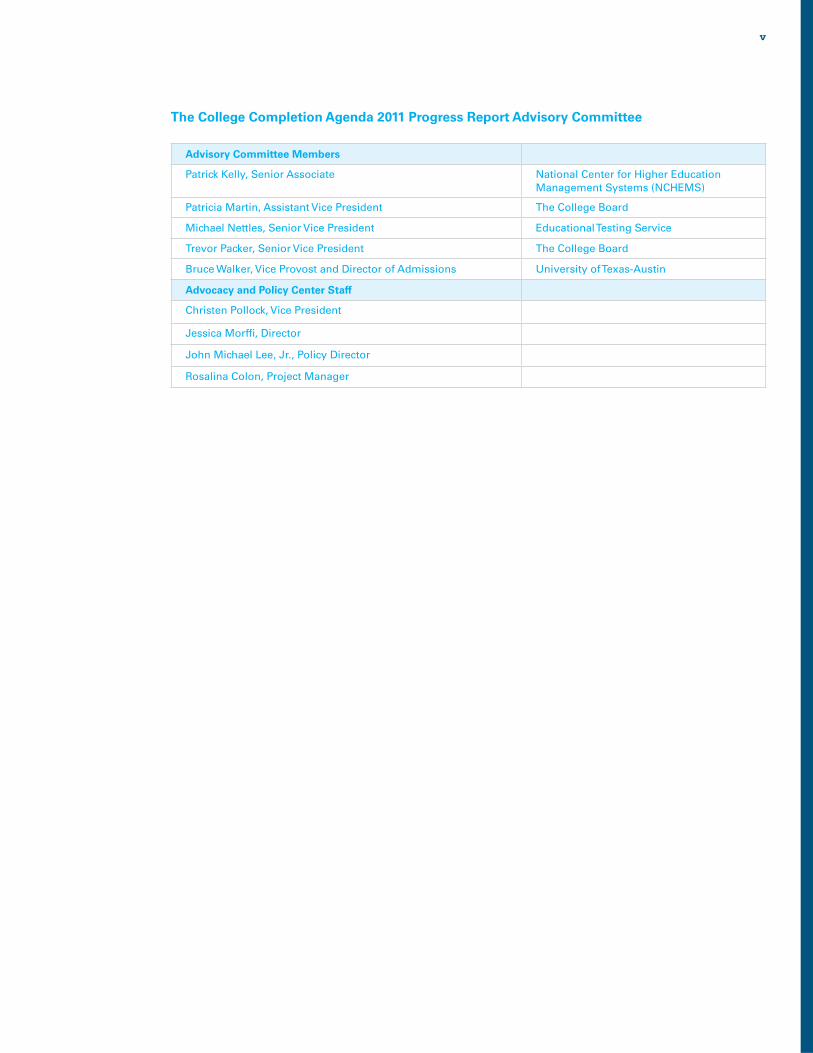
Advisory Committee Members
Patrick Kelly, Senior Associate National Center for Higher Education Management Systems (NCHEMS)
Patricia Martin, Assistant Vice President The College Board
Michael Nettles, Senior Vice President Educational Testing Service
Trevor Packer, Senior Vice President The College Board
Bruce Walker, Vice Provost and Director of Admissions University of Texas-Austin
Advocacy and Policy Center Staff
Christen Pollock, Vice President
Jessica Morffi , Director
John Michael Lee, Jr., Policy Director
Rosalina Colon, Project Manager
The College Completion Agenda 2011 Progress Report Advisory Committee
v

Contents
1 Continuing the Conversation: An overview of the measurement of progress on the commission’s recommendations
4 The Commission’s Approach to Assessing the Current Status on
the Recommendations
6 A Year in Review
10 Overall Goal of the Commission
10 Reading the Document
11 Measuring the Goal: U.S. Educational Attainment Among 25- to 34-Year-Olds
17 Recommendation One: Provide a program of voluntary preschool education, universally available to children from low-income families
19 General Findings for This Recommendation
20 Percentage of 3- and 4-Year-Olds Enrolled in Preschool Programs
33 Percentage of 3- and 4-Year-Olds Enrolled in State-Funded Pre-K Programs
38 Percentage of 3- and 4-Year-Olds Enrolled in Head Start Programs
43 Recommendation Two: Improve middle and high school counseling
45 General Findings for This Recommendation
45 Student-to-Counselor Ratio
49 Statewide Comprehensive School Counseling Programs
51 Professional Development for Secondary School Counselors
53 Percentage of Counselors’ Time Spent on Tasks
55 Eight Components of College and Career Readiness Counseling
57 Recommendation Three: Implement the best research-based dropout prevention programs
59 General Findings for This Recommendation
61 Graduation Rates of Public High School Students
74 National Status Dropout Rate — Excluding Institutional Populations
78 National Status Dropout Rate — Including Institutional Populations
81 National Event Dropout Rate
vi

97 Recommendation Four: Align the K–12 education system with international standards and college admission expectations
99 General Findings for This Recommendation
101 Percentage of Public High Schools Offering AP® or IB Courses in the
Four Core Subject Areas
111 Percentage of Schools Offering Dual Enrollment
115 Percentage of States with Alignment Between K–12 and Higher
Education Standards
119 Percentage of Students in Remedial College Classes
127 Recommendation Five: Improve teacher quality and focus on recruitment and retention
129 General Findings for This Recommendation
130 State Encouragement and Support for Teacher Professional Development
134 Percentage of Public School Teachers of Grades Nine Through 12 by Field
137 State Policies on Out-of-Field Teachers
139 Percentage of Bachelor’s, Master’s and Doctoral Degrees Earned
in Education
145 Percentage of Teachers Leaving the Profession
149 Data Systems to Monitor Teacher Quality
152 Percentage of Teachers by Full-Time Teaching Experience by State
155 Recommendation Six: Clarify and simplify the admission process
157 General Findings for This Recommendation
158 Percentage of Four-Year Colleges with Admission Applications
Available Online
161 Percentage of Four-Year Colleges That Accept Admission
Applications Online
164 Percentage of Four-Year Colleges That Participate in National and State
Application Systems
169 Immediate Enrollment Rate of High School Graduates
vii

177 Recommendation Seven: Provide more need-based grant aid while simplifying the fi nancial aid system and making it more transparent
179 General Findings for This Recommendation
180 Grant Aid for Students from Low-Income Families
188 Student Loan Debt Levels
193 Simplifying the Federal Student Aid System and the
Application Process
195 Implementation of Policies Designed to Provide Incentives for
Institutions to Promote Enrollment and Success of Low-Income
and First-Generation Students
197 Recommendation Eight: Keep college affordable199 General Findings for This Recommendation
200 State Appropriations to Fund Higher Education
205 Tuition, Fees and Other Costs of Attendance at Colleges and Universities
213 Net Price Students Pay for College
215 Changes in Family Income Levels
217 Earnings of College Graduates
219 Recommendation Nine: Dramatically increase college completion rates
221 General Findings for This Recommendation
223 Freshman-to-Sophomore Retention
230 Graduation Rates of Associate Degree– and Certifi cate-Seeking Students
249 Graduation Rates of Bachelor’s Degree–Seeking Students
268 Degrees Awarded at Colleges and Universities
279 Recommendation Ten: Provide postsecondary opportunities as an essential element of adult education programs
281 General Findings for This Recommendation
282 Educational Attainment for Adults Ages 25 to 34
288 Adults Ages 25 to 34 with No High School Diploma Who Attain a GED
294 Enrollment of Nontraditional Students in Postsecondary Education
viii

297 Appendix: Data Book298 Overall Goal of the Commission
300 Recommendation One: Provide a program of voluntary preschool education,
universally available to children from low-income families
302 Recommendation Two: Improve middle and high school counseling
304 Recommendation Three: Implement the best research-based dropout
prevention programs
307 Recommendation Four: Align the K–12 education system with international
standards and college admission expectations
310 Recommendation Five: Improve teacher quality and focus on recruitment
and retention
313 Recommendation Six: Clarify and simplify the admission process
316 Recommendation Seven: Provide more need-based grant aid while
simplifying the fi nancial aid system and making it more transparent
322 Recommendation Eight: Keep college affordable
329 Recommendation Nine: Dramatically increase college completion rates
334 Recommendation Ten: Provide postsecondary opportunities as an essential
element of adult education programs
337 List of Figures
353 National Summary
359 State Summaries
ix

Continuing the Conversation: An overview of the measurement of progress on the commission’s recommendations
completionagenda.collegeboard.org
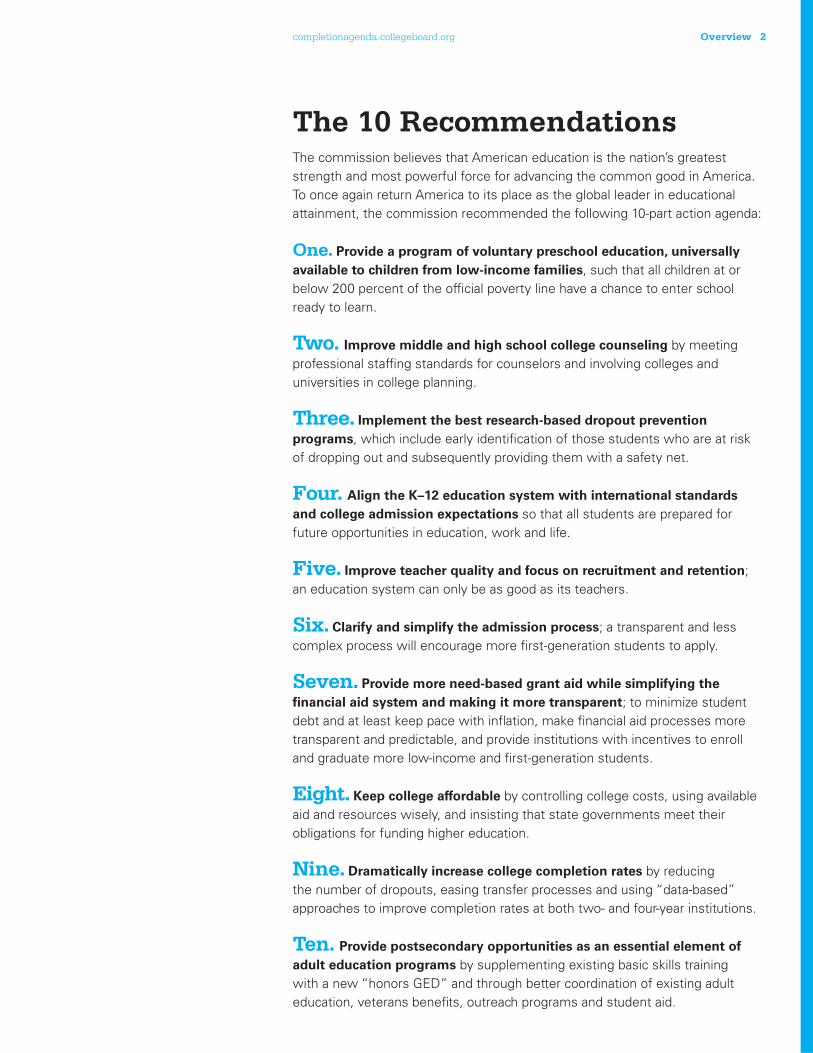
The 10 RecommendationsThe commission believes that American education is the nation’s greatest
strength and most powerful force for advancing the common good in America.
To once again return America to its place as the global leader in educational
attainment, the commission recommended the following 10-part action agenda:
One. Provide a program of voluntary preschool education, universally available to children from low-income families, such that all children at or
below 200 percent of the offi cial poverty line have a chance to enter school
ready to learn.
Two. Improve middle and high school college counseling by meeting
professional staffi ng standards for counselors and involving colleges and
universities in college planning.
Three. Implement the best research-based dropout prevention programs, which include early identifi cation of those students who are at risk
of dropping out and subsequently providing them with a safety net.
Four. Align the K–12 education system with international standards and college admission expectations so that all students are prepared for
future opportunities in education, work and life.
Five. Improve teacher quality and focus on recruitment and retention;
an education system can only be as good as its teachers.
Six. Clarify and simplify the admission process; a transparent and less
complex process will encourage more fi rst-generation students to apply.
Seven. Provide more need-based grant aid while simplifying the fi nancial aid system and making it more transparent; to minimize student
debt and at least keep pace with infl ation, make fi nancial aid processes more
transparent and predictable, and provide institutions with incentives to enroll
and graduate more low-income and fi rst-generation students.
Eight. Keep college affordable by controlling college costs, using available
aid and resources wisely, and insisting that state governments meet their
obligations for funding higher education.
Nine. Dramatically increase college completion rates by reducing
the number of dropouts, easing transfer processes and using “data-based”
approaches to improve completion rates at both two- and four-year institutions.
Ten. Provide postsecondary opportunities as an essential element of adult education programs by supplementing existing basic skills training
with a new “honors GED” and through better coordination of existing adult
education, veterans benefi ts, outreach programs and student aid.
Overview 2

completionagenda.collegeboard.org
Completion at Every StageIn order to reach the goal of 55 percent of 25- to 34-year-olds obtaining
an associate degree or higher by the year 2025, the commission has put
forth a 10-part recommendation agenda that is aimed at strengthening
the educational pipeline at every stage throughout a student’s trajectory
from the cradle to college completion.
Preschool Elementary Middle School High School Higher Education
One
Two
Three
Four
Six
Eight
Five
Seven
Nine
Ten
33
completionagenda.collegeboard.org
The Commission’s Approach to Assessing the Current Status on the RecommendationsThe commission’s goal of 55 percent of young adults, ages 25 to 34, receiving
a postsecondary credential by 2025 will be measured on a regular basis, and
this annual publication can be used to measure progress toward this goal. The
measures identifi ed in this report give some indication of the current status
of where the nation and state are on the overall goal and with each of the
recommendations. As such, one or more indicators have been identifi ed that,
when taken together, allow one to infer the current status and trends over
time. The 2010 progress report served as a gauge of the current state of affairs
based on these indicators. This report will add to the data collected in the 2010
progress report and will aid in understanding trends and in measuring change
for each of the recommendations.
Enhancements to the ReportThe 2011 progress report has many new additions that are worth noting.
Although the source of most of the indicators are the same in the 2011 report
as they were in the 2010 report, it was necessary to change the source or
discontinue the use of data for some indicators. This was primarily due to
changes to the original data or the need to collect data from the primary source
(e.g., IPEDS1). In a few cases, the data were discontinued. These sources have
been replaced with the best data available, if any. Another notable change in
the 2011 report is the addition of many more disaggregations of data to the
state level and by race/ethnicity. This report also includes a state-level overview
chart at the end of each chapter and a national level overview to more easily
summarize the data presented in the chapter. These changes continue to
strengthen this report and make the data more easily digestible for the reader.
In addition, it is important to note that the recommendations drove the
decisions about which indicators to include in the fi nal report. In some cases,
data are not yet available to measure some of the indicators identifi ed in the
1. Integrated Postsecondary Education Data System.
Helpful Icons
Students
Institutions
Gender Progress Indicators & Figures
Category
Female
Male
Positive change
Negative change
No change
Updated
New
Overview 4

completionagenda.collegeboard.org
report. This is an important testament to the need to continue the national
dialogue about developing effective data sources to measure educational
endeavors. The commission recognizes that the measurement of educational
efforts can take many forms. Because of the nature of the commission’s goal
and 10 recommendations, some of the indicators take the form of traditional
quantitative statistics, whereas others are in the form of narratives. Wherever
possible, data and indicators represent the most current nationally recognized
sources. Rather than create new measures to assess the educational climate,
this report seeks to determine the degree to which the commission’s goal and
10 recommendations are being met. Many high-quality data sources and reports
exist that can be used to inform current status and future progress on the goal
and recommendations. This report employs data provided by well-respected
organizations such as the National Center for Education Statistics, the National
Center for Public Policy and Higher Education, and the U.S. Census Bureau,
among others.
In the selection of the indicators to measure the commission’s goal and10 recommendations, the statistics were vetted using the following criteria:
• The indicators are rigorous. All data must meet the generally accepted
standards for rigor within the fi eld of educational measurement. All data
and collection methods are examined to ensure policymakers, educators,
parents and students can make valid inferences about the nation’s current
status on each indicator.
• The indicators are measurable on a regular basis. A key concern for
the commission is determining the degree to which progress is made
over time on the goal and 10 recommendations. Therefore, only data
sources available on a regular basis are included in this report. One-time
reports, although helpful in providing a snapshot of the status of the nation
on the goal and recommendations, will not aid in helping track progress
over the coming years.
• The indicators can be disaggregated. Whenever possible, indicators
are applicable to the nation and comparable across the 50 states and
the District of Columbia. The commission’s recommendations concern
the entire nation, thus the indicators have a national focus. Importantly,
individual states are conducting excellent work to allow policymakers
and citizens within those states to track the status and note the trends
on the goal and recommendations put forth by the commission. Many
states, such as Florida, have already built state-level data systems that are
being used to track students from preschool to college completion. Only
indicators available on a national basis are featured herein. This is a report
on the nation’s status on the commission’s goal and 10 recommendations.
The indicators highlighted in this report represent those data that are
available to help policymakers, educators, parents and students understand
where the nation stands on the goal. As policies and practices continue
to change, future iterations of this report may include new indicators that
may be added or obsolete indicators removed to ensure that the indicators
associated with each recommendation note the nation’s status and
subsequent progress on the commission’s goal and 10 recommendations.
5

completionagenda.collegeboard.org
A Year in ReviewSince The College Completion Agenda 2010 Progress Report was released,
the educational landscape has continued to change dramatically. These
changes directly impact the goal of the commission and each of the proposed
recommendations. In fall 2008, the nation began feeling the effects of one of
the worst periods of recession in our history since World War II. The 18-month
recession offi cially began in December 2007 and, though this recession
offi cially ended in June 2009, the effects of the recession are still lingering in
the United States today. During the recession, unemployment increased, as
did the number of home foreclosures, and budgets for both federal and state
governments declined.
The 44th president of the United States, Barack Obama, continued the road to
recovery with the American Recovery and Reinvestment Act (ARRA) in 2009, an
economic stimulus bill that provided $787 billion to stimulate the economy, and
his administration made education a major part of this investment.2 The initial
stimulus package provided money to states to help close funding gaps and
avoid massive layoffs of teachers and professors. The Obama administration also
set aside $4 billion to fund its Race to the Top initiative, which provides grants
to states to implement education reforms that work. Several states, including
New York, Delaware, Georgia, Florida, North Carolina and Tennessee, received
these grants to improve education. The Obama administration clearly recognizes
the importance of education in securing the future of America and initiated
these major investments in education. As of 2011, much of the temporary ARRA
funding has been used, and now many states once again face the prospects
of massive layoffs of both teachers and professors. Amid this challenging
economy, it is diffi cult to imagine the effect the lingering fi scal constraints of the
recession will have on the College Completion Agenda as we move forward.
While the nation struggles to strengthen the economy, the educational
capacity of our country continues to decline. The most recent fi gures from
the Organisation for Economic Co-operation and Development (OECD) show
that the United States does not rank fi rst in the attainment of “tertiary” or
postsecondary degrees among adults in developed countries. As we continue
to decline in global competitiveness, our economic strength also continues to
weaken. In order to increase our economic position in the world, it is important
that we turn around this important trend.
According to the OECD, in 2008 our nation ranked fi fth (see Figure B) in
postsecondary attainment in the world among 25- to 64-year-olds. Figure C
shows that the United States ranked third in postsecondary attainment
for citizens ages 55 to 64 in 2008. The United States trails both the Russian
Federation and Israel in this age group. As America’s aging and highly
educated workforce moves into retirement, the nation will rely on young
2. American Recovery and Reinvestment Act, 2009.
Overview 6

completionagenda.collegeboard.org
Americans to increase our standing in the world. Figure A illustrates that among
citizens between the ages of 25 and 34 in developed countries, America ranks
12th. In this key demographic group, Republic of Korea, Canada, the Russian
Federation, Japan, New Zealand, Norway, Ireland, Denmark, Israel, Belgium and
Australia are ahead of the United States. Also, Sweden and France are close to
parity with America. If America is to regain its status as the leader in educational
attainment and increase its economic competitiveness, the nation must make an
investment in higher education access, admission and success for all students.
Much progress has also been documented within the past year. There has been
a continued movement by states to adopt common core standards in language
arts and mathematics. To date, 45 states have adopted these standards to
provide a clear and consistent framework to prepare our children for college
and the workforce. The goal is to make sure that these students are college
and career ready and have access to a multitude of postsecondary options.
Many states are also trying new ways to increase accountability and teacher
quality. While some states like Colorado have developed evaluation systems
that tie student outcomes to teacher evaluations, other states have focused
on teacher professional development to ensure that all educators are ready to
prepare a new generation of students. Reform in relation to educator quality
has become even more prevalent due to the economic crisis. States are facing
serious decisions about teacher layoffs, which have further invigorated the
discussion about performance pay. There has also been a robust movement
around the nation toward college completion at every level (e.g., federal, state
and local). The Obama administration,3 Lumina Foundation, Bill and Melinda
Gates Foundation, the College Board, National Governors Association,4 states,
school systems, and colleges and universities around the country are trying to
fi nd ways to increase college completion despite the harsh economic climate
that has made further investments in education very scarce.
3. See http://www.whitehouse.gov/sites/default/fi les/college_completion_tool_kit.pdf
4. See http://www.subnet.nga.org/ci/1011/dashboards.htm
7

completionagenda.collegeboard.org
0
10
20
30
40
50
60
70
Kor
ea
Can
ada
Rus
sian
Fed
erat
ion
Japa
n
New
Zea
land
Nor
way
Irel
and
Den
mar
k
Bel
gium
Isra
el
Aus
tral
ia
UN
ITED
STA
TES
Sw
eden
Fran
ce
Net
herl
ands
Spa
in
Luxe
mbo
urg
Sw
itzer
land
Uni
ted
Kin
gdom
Finl
and
Esto
nia
OEC
D A
vera
ge
Chi
le
Icel
and
EU19
Ave
rage
Pol
and
Slo
veni
a
Gre
ece
Hun
gary
Ger
man
y
Por
tuga
l
Ital
y
Mex
ico
Aus
tria
Slo
vak
Rep
ublic
Cze
ch R
epub
lic
Turk
ey
Bra
zil
57.9
%
55.9
%
55.5
%
55.1
%
47.6
%
45.6
%
45.1
%
43.1
%
42.3
%
42.3
%
41.7
%
41.6
%
40.8
%
40.7
%
39.8
%
38.8
%
38.7
%
38.5
%
38.4
%
38.3
%
35.8
%
35.4
%
33.7
%
32.8
%
32.2
%
32.1
%
30.0
%
28.2
%
24.0
%
23.9
%
23.2
%
19.9
%
19.7
%
19.4
%
18.4
%
17.7
%
15.5
%
11.0
%
Goal
55%
Percentage of 25- to 34-Year-Olds with an Associate Degree or Higher, 2008Source: Organisation for Economic Co-operation and Development, 2010
A Updated data source
11
United States
24
Countries
Countries
Overview 8

completionagenda.collegeboard.org
Percentage of 25- to 64-Year-Olds with an Associate Degree or Higher, 2008Source: Organisation for Economic Co-operation and Development, 2010
B
0
10
20
30
40
50
60
70R
ussi
an F
eder
atio
n
Can
ada
Isra
el
Japa
n
UN
ITED
STA
TES
New
Zea
land
Finl
and
Kor
ea
Nor
way
Aus
tral
ia
Den
mar
k
Esto
nia
Irel
and
Sw
itzer
land
Uni
ted
Kin
gdom
Bel
gium
Net
herl
ands
Sw
eden
Icel
and
Spa
in
OEC
D A
vera
ge
Luxe
mbo
urg
Fran
ce
EU19
Ave
rage
Ger
man
y
Chi
le
Gre
ece
Slo
veni
a
Pol
and
Hun
gary
Aus
tria
Mex
ico
Slo
vak
Rep
ublic
Cze
ch R
epub
lic
Ital
y
Por
tuga
l
Turk
ey
Bra
zil
54.0
%
48.8
%
44.0
%
42.8
%
41.1
%
40.0
%
36.6
%
36.6
%
36.0
%
35.6
%
34.5
%
34.3
%
33.9
%
33.7
%
32.5
%
32.3
%
32.2
%
32.0
%
31.3
%
29.2
%
28.4
%
27.7
%
27.4
%
25.4
%
25.4
%
24.2
%
23.4
%
22.6
%
19.6
%
19.2
%
18.1
%
16.0
%
14.8
%
14.5
%
14.4
%
14.3
%
12.0
%
10.8
%
Updated data source
4
United States
31
Countries
Countries
0
10
20
30
40
50
60
70
Rus
sian
Fed
erat
ion
Isra
el
UN
ITED
STA
TES
Can
ada
New
Zea
land
Esto
nia
Finl
and
Aus
tral
ia
Nor
way
Sw
itzer
land
Uni
ted
Kin
gdom
Sw
eden
Net
herl
ands
Den
mar
k
Japa
n
Ger
man
y
Icel
and
Bel
gium
OEC
D A
vera
ge
Luxe
mbo
urg
Irel
and
EU19
Ave
rage
Fran
ce
Chi
le
Slo
veni
a
Hun
gary
Spa
in
Gre
ece
Aus
tria
Kor
ea
Pol
and
Slo
vak
Rep
ublic
Cze
ch R
epub
lic
Ital
y
Mex
ico
Turk
ey
Bra
zil
Por
tuga
l
44.5
%
44.1
%
40.0
%
39.9
%
34.0
%
31.6
%
28.5
%
28.2
%
28.0
%
27.3
%
27.2
%
26.5
%
26.5
%
26.3
%
26.0
%
24.4
%
23.6
%
22.3
%
20.1
%
19.4
%
18.6
%
18.5
%
17.4
%
17.1
%
16.1
%
16.1
%
16.0
%
15.5
%
15.2
%
12.0
%
12.0
%
10.6
%
10.6
%
9.8%
9.6%
9.5%
9.1%
7.7%
Percentage of 55- to 64-Year-Olds with an Associate Degree or Higher, 2008Source: Organisation for Economic Co-operation and Development, 2010
C Updated data source
2
United States
33
Countries
Countries
9
completionagenda.collegeboard.org
Overall Goal of the CommissionThe commission believes the United States should take immediate action to
reverse its fall from the top ranks of countries with a college-educated workforce.
It warns that if postsecondary success is not made a national priority, the
country’s economic and social health will continue to weaken.
For America to be among the leaders in education and to maintain its economic
competitiveness throughout the world, the commission established a goal of
ensuring that by the year 2025, 55 percent of young Americans ages 25 to 34
earn an associate degree or higher. Part of the challenge in reaching the goal
is in increasing educational attainment for fi rst-generation, low-income and/or
underrepresented minority students. By eliminating the severity of disparities
between underrepresented minorities and white Americans, it is estimated that
more than half the degrees needed to meet the 55 percent goal will be realized.5
Reading the DocumentThe chapters in this document address the indicators used to assess the status
of the nation in achieving the commission’s goal and recommendations. Each
chapter gives an overview of the identifi ed measures, a description of their
importance, possible issues faced by policymakers, the current statistics and
points to consider when interpreting the measures. Each measure originates
from a well-respected source, and readers are encouraged to inform their
inferences about the nation’s educational progress toward the overall goal by
using the data presented in this report.
5. National Center for Higher Education Management Systems, “Adding It Up: State Challenges for Increasing
College Access and Success” (Boulder: NCHEMS, 2007).
Overview 10
completionagenda.collegeboard.org
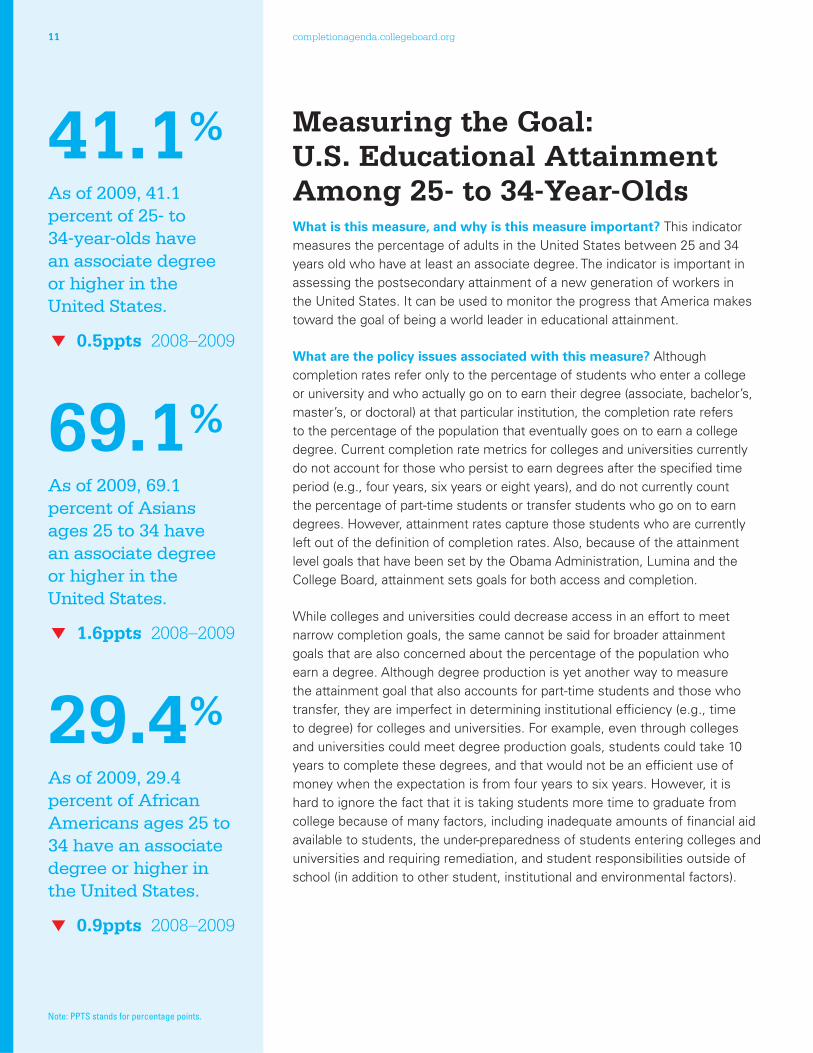
Measuring the Goal: U.S. Educational Attainment Among 25- to 34-Year-Olds What is this measure, and why is this measure important? This indicator
measures the percentage of adults in the United States between 25 and 34
years old who have at least an associate degree. The indicator is important in
assessing the postsecondary attainment of a new generation of workers in
the United States. It can be used to monitor the progress that America makes
toward the goal of being a world leader in educational attainment.
What are the policy issues associated with this measure? Although
completion rates refer only to the percentage of students who enter a college
or university and who actually go on to earn their degree (associate, bachelor’s,
master’s, or doctoral) at that particular institution, the completion rate refers
to the percentage of the population that eventually goes on to earn a college
degree. Current completion rate metrics for colleges and universities currently
do not account for those who persist to earn degrees after the specifi ed time
period (e.g., four years, six years or eight years), and do not currently count
the percentage of part-time students or transfer students who go on to earn
degrees. However, attainment rates capture those students who are currently
left out of the defi nition of completion rates. Also, because of the attainment
level goals that have been set by the Obama Administration, Lumina and the
College Board, attainment sets goals for both access and completion.
While colleges and universities could decrease access in an effort to meet
narrow completion goals, the same cannot be said for broader attainment
goals that are also concerned about the percentage of the population who
earn a degree. Although degree production is yet another way to measure
the attainment goal that also accounts for part-time students and those who
transfer, they are imperfect in determining institutional effi ciency (e.g., time
to degree) for colleges and universities. For example, even through colleges
and universities could meet degree production goals, students could take 10
years to complete these degrees, and that would not be an effi cient use of
money when the expectation is from four years to six years. However, it is
hard to ignore the fact that it is taking students more time to graduate from
college because of many factors, including inadequate amounts of fi nancial aid
available to students, the under-preparedness of students entering colleges and
universities and requiring remediation, and student responsibilities outside of
school (in addition to other student, institutional and environmental factors).
41.1% As of 2009, 41.1 percent of 25- to 34-year-olds have an associate degree or higher in the United States.
0.5ppts 2008–2009
69.1% As of 2009, 69.1 percent of Asians ages 25 to 34 have an associate degree or higher in the United States.
1.6ppts 2008–2009
29.4% As of 2009, 29.4 percent of African Americans ages 25 to 34 have an associate degree or higher in the United States.
0.9ppts 2008–2009
Note: PPTS stands for percentage points.
11

completionagenda.collegeboard.org
19.2% As of 2009, 19.2 percent of Hispanics ages 25 to 34 have an associate degree or higher in the United States.
0.6ppts 2008–2009
48.7% As of 2009, 48.7 percent of whites ages 25 to 34 have an associate degree or higher in the United States.
2008–2009
Where are we now? As of 2009, 41.1 percent of 25- to 34-year-olds have an
associate degree or higher (please note that the data presented in Figures A, B
and C are from 2008, which represents the most recent OECD data, while this
percentage represents the most recent census data from 2009). The nation is
13.9 percentage points away from the goal of obtaining 55 percent by 2025.
The percentage of adults ages 25 to 34 with an associate degree or higher
increased marginally from 38.1 percent in 2000 to 41.1 percent in 2009. If the
nation stays on its current path of growth, it is projected that we will reach 46.0
percent of 25- to 34-year-olds with an associate degree or higher by the year
2025. The projections of the percentage of 25- to 34-year-olds needed to reach
the 55 percent goal by the year 2025 are also shown in Figure D. If the United
States is to achieve the goal of 55 percent by 2025, the growth in attainment
must be signifi cantly larger over the next 14 years than it was in the previous
decade; we must increase nearly one point (.86675 percent) per year.
As of 2009, 41.2 percent of adults ages 25 to 64 in the United States have an
associate degree or higher (Figure F). Just 40.8 percent of adults ages 55 to
64 have an associate degree or higher, and 41.1 percent of adults ages 25 to
34 have an associate degree or higher. What is of great concern is how the
educational attainment has changed signifi cantly between generations in other
countries, yet it remains relatively fl at in the United States. For example, 57.9
percent of adults ages 25 to 34 in the Republic of Korea have an associate
degree or higher (Figure A), compared to 12.0 percent of adults ages 55 to 64
(Figure C). In Canada, 55.9 percent of adults ages 25 to 34 have an associate
degree or higher compared to 39.9 percent of adults ages 55 to 64. Thus,
the leading countries, in terms of educational attainment of young adults, are
making signifi cant progress in building an educated workforce.
It is important for all citizens of the United States to access and succeed in
higher education. Persistent racial/ethnic gaps in educational attainment are
a daunting problem for our country and may prove to be more challenging to
overcome as the demographics of our society continue to change. Among
adults ages 25 to 34, 69.1 percent of Asians and 48.7 percent of whites have
an associate degree or higher as of 2009 (Figure E). However, only 29.4 percent
of African Americans and 19.2 percent of Hispanics have an associate degree
or higher. Differences also emerge within race/ethnicities, such that younger
Asians and whites are more educated than their older counterparts, while
young African Americans and Hispanics are not. We must make larger gains
for underrepresented minorities in the United States.
About 64.0 percent of the citizens in the District of Columbia have an associate
degree or higher, which exceeds the national goal of 55 percent that other
states should strive to reach (Figure G). More than half of the population in the
District of Columbia and Massachusetts have an associate degree or higher.
However, less than 30.0 percent of young adults in Arkansas, Nevada, New
Mexico, Louisiana and West Virginia have an associate degree or higher.
Overview 12

completionagenda.collegeboard.org
0
10
20
30
40
50
60
70
2000 2009 2025
38.1%41.1%
55.0%
46.0%
Goal
55%
Percentage of 25- to 34-Year-Olds with an Associate Degree or Higher in the United States, 2000–2009Source: U.S. Census Bureau, Current Population Survey, 2000–2009
D
0
10
20
30
40
50
60
70
Asian AfricanAmerican
Hispanic White
62.8%
46.4%48.7%
44.3%
69.1%
52.8%
29.9% 29.4% 28.5%
20.0% 19.2% 20.6%
Goal
55%
25- to 34-Year-Olds
25- to 64-Year-Olds
55- to 64-Year-Olds
Projections to
Reach the Goal
of 55% by 2025
Current Path
Projections
Percentage of Adults with an Associate Degree or Higher in the United States by Race/Ethnicity and Age, 2009Source: U.S. Census Bureau, Current Population Survey, 2009
E
Updated data source
Updated data source
13

completionagenda.collegeboard.org
Percentage of Adults with an Associate Degree or Higher in the United States by Age, 2009Source: U.S. Census Bureau, Current Population Survey, 2009
F
0
10
20
30
40
50
60
70
25 to 64 25 to 34 55 to 64
41.2% 41.1% 40.8%
Goal
55%
Updated data source
When interpreting this measure, what should be kept in mind? For the
United States to make headway in reaching the goal of 55 percent of young
American adults with an associate degree or higher, all Americans must have
the preparation and resources to access and successfully complete a higher
education. A major part of the challenge lies in diminishing disparities in primary
and secondary education so that low-income students and underrepresented
minority populations have the foundation needed to complete degrees without
adversely affecting other populations. For this reason, we must monitor the
educational attainment of all citizens, as well as further analyze the educational
attainment of each race/ethnicity and income group.
Overview 14

completionagenda.collegeboard.org
Percentage of Adults Ages 25–34 with an Associate Degree or Higher in the United States by State Rank, 2009Source: U.S. Census Bureau, 2009 American Community Survey and Current Population Survey 2009Note: State-level data are calculated using ACS, while the national percentage is based on CPS.
0 10 20 30 40 50 60 70
District of Columbia
Massachusetts
North Dakota
Minnesota
New York
New Jersey
Maryland
New Hampshire
Connecticut
Iowa
Rhode Island
Illinois
Vermont
Virginia
Nebraska
Pennsylvania
Colorado
Hawaii
Montana
Kansas
UNITED STATES
Washington
Wisconsin
South Dakota
Missouri
North Carolina
California
Utah
Ohio
Oregon
Maine
Delaware
Michigan
Georgia
South Carolina
Florida
Indiana
Kentucky
Tennessee
Wyoming
Arizona
Alabama
Texas
Oklahoma
Idaho
Louisiana
Mississippi
Alaska
West Virginia
Nevada
New Mexico
Arkansas
67.5%
53.7%
50.5%
49.4%
49.2%
46.2%
46.1%
45.9%
45.8%
45.7%
45.3%
45.2%
44.2%
44.0%
43.4%
43.4%
42.2%
41.8%
41.7%
41.1%
41.1%
40.5%
40.5%
39.6%
38.6%
38.5%
38.0%
37.8%
37.6%
37.6%
37.5%
36.9%
36.1%
35.7%
35.7%
35.5%
35.4%
33.7%
33.4%
33.3%
32.4%
32.1%
31.6%
31.5%
31.4%
31.0%
29.9%
29.6%
29.6%
29.0%
28.9%
28.6%Goal
55%AVG
41.1%
G
15

completionagenda.collegeboard.org
Updated data source
20
U.S. Average
31
States
States
Overview 16

OneProvide a program of voluntary preschool education, universally available to children from low-income families
WE RECOMMEND that states provide a program of voluntary high-quality, preschool education, which is universally available to 3- and 4-year-old children from families at or below 200 percent of the poverty line.

completionagenda.collegeboard.org
The commission believes that preschool6 education should be available
universally to ensure that all children develop the skills needed to be successful
later in school. While children of more highly educated and higher-income
families are more likely to take advantage of preschool programs, most children
from low-income families are not afforded the same opportunities.7 Preschool
programs offer children the opportunity to develop cognitive skills and prepare
them for success in later grades.8 It will be important for local, state and federal
agencies to work together to provide universal access to high-quality preschool
programs for all children, especially those from low-income families.
Programs such as Head Start are targeted for this recommendation because
they are designed to provide comprehensive school readiness to low-income
students. Preschool education can impact positively the lives of students,
parents, teachers and others. Some of the major issues in preschool education
are insuffi cient enrollment and the variety of quality programs within a state and
across the nation.
In this era of accountability, policymakers are interested in understanding what
research reveals about the impact and importance of state-funded preschool
programs. Data are being collected, but they are fragmented. The Early
Childhood Data Collaborative is committed to creating a common integrated
approach for data collection.9 Data collected from this collaborative can be used
by policymakers to make informed decisions.
The following indicators provide insight into the accessibility of preschool education to children from low-income families:
• Percentage of 3- and 4-year-olds enrolled in preschool or kindergarten
programs;
• Percentage of 3- and 4-year-olds enrolled in state-funded pre-K
programs; and
• Percentage of 3- and 4-year-olds enrolled in Head Start programs.
6. The terms preschool and pre-K are used interchangeably.
7. Barnett, W. S., and Yarosz, D. J. (2007). Who Goes to Preschool and Why Does It Matter. Retrieved
June 1, 2011, from http://nieer.org/resources/policybriefs/15.pdf
8. Campbell, F. A., Pungello, E. P., Miller-Johnson, S., Burchinal, M., and Ramey, C. T. The Development
of Cognitive and Academic Abilities: Growth Curves from an Early Childhood Educational Experiment,
Developmental Psychology 37(2) (2001): 231–242.
9. The Early Childhood Data Collaborative. Retrieved May 6, 2011, from http://www.ecedata.org
Recommendation One 18
completionagenda.collegeboard.org
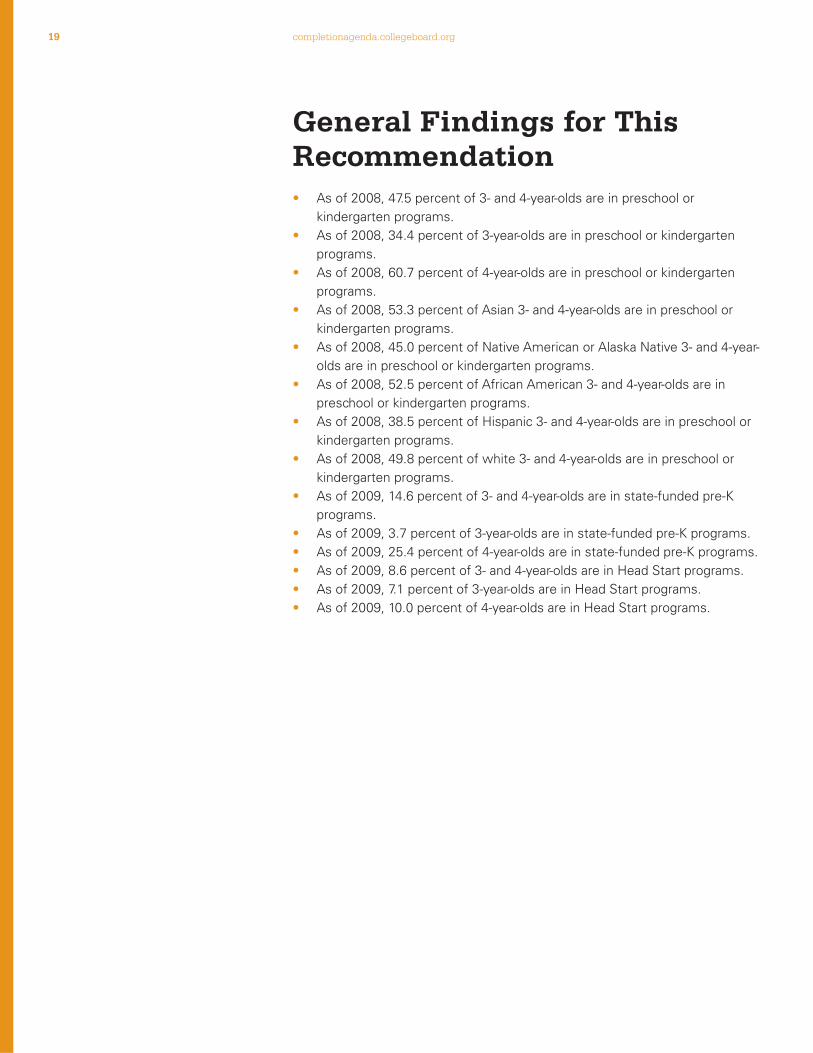
General Findings for This Recommendation• As of 2008, 47.5 percent of 3- and 4-year-olds are in preschool or
kindergarten programs.
• As of 2008, 34.4 percent of 3-year-olds are in preschool or kindergarten
programs.
• As of 2008, 60.7 percent of 4-year-olds are in preschool or kindergarten
programs.
• As of 2008, 53.3 percent of Asian 3- and 4-year-olds are in preschool or
kindergarten programs.
• As of 2008, 45.0 percent of Native American or Alaska Native 3- and 4-year-
olds are in preschool or kindergarten programs.
• As of 2008, 52.5 percent of African American 3- and 4-year-olds are in
preschool or kindergarten programs.
• As of 2008, 38.5 percent of Hispanic 3- and 4-year-olds are in preschool or
kindergarten programs.
• As of 2008, 49.8 percent of white 3- and 4-year-olds are in preschool or
kindergarten programs.
• As of 2009, 14.6 percent of 3- and 4-year-olds are in state-funded pre-K
programs.
• As of 2009, 3.7 percent of 3-year-olds are in state-funded pre-K programs.
• As of 2009, 25.4 percent of 4-year-olds are in state-funded pre-K programs.
• As of 2009, 8.6 percent of 3- and 4-year-olds are in Head Start programs.
• As of 2009, 7.1 percent of 3-year-olds are in Head Start programs.
• As of 2009, 10.0 percent of 4-year-olds are in Head Start programs.
19
completionagenda.collegeboard.org
47.5% As of 2008, 47.5 percent of 3- and 4-year-olds are in preschool or kindergarten programs.
1.5ppts 2007–2008*
34.4%As of 2008, 34.4 percent of 3-year-olds are in preschool or kindergarten programs.
1.5ppts 2007–2008*
60.7%As of 2008, 60.7 percent of 4-year-olds are in preschool or kindergarten programs.
1.7ppts 2007–2008*
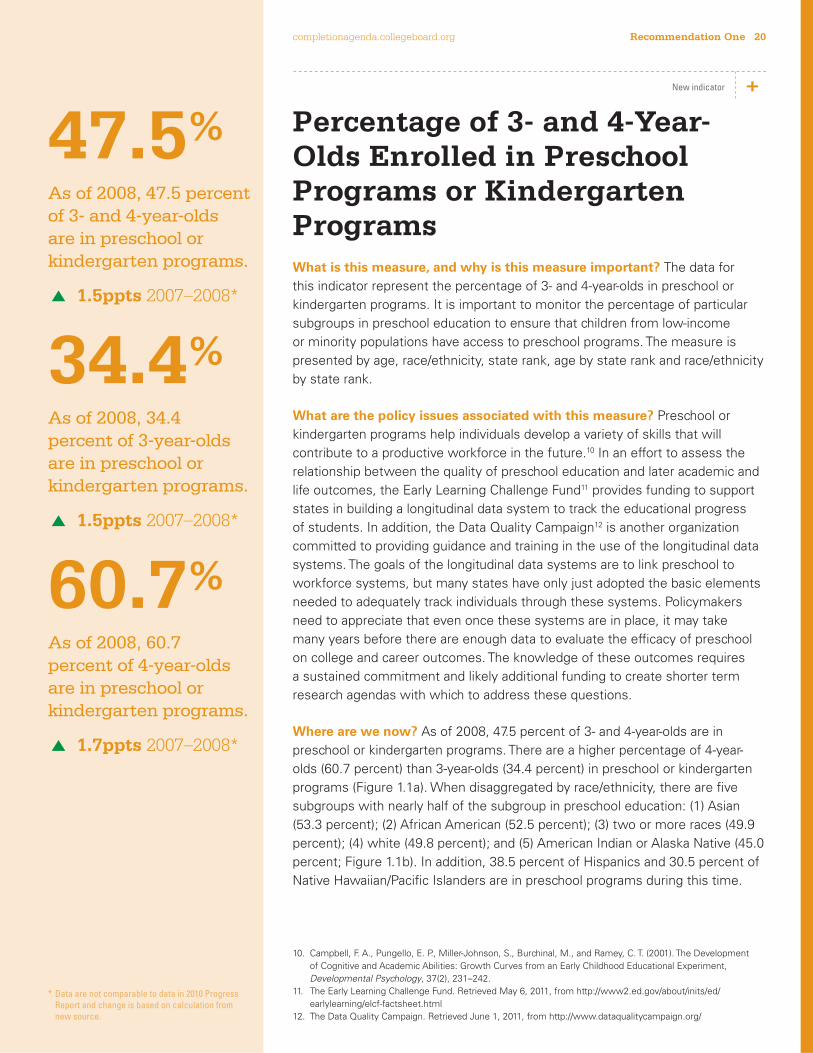
Percentage of 3- and 4-Year-Olds Enrolled in Preschool Programs or Kindergarten ProgramsWhat is this measure, and why is this measure important? The data for
this indicator represent the percentage of 3- and 4-year-olds in preschool or
kindergarten programs. It is important to monitor the percentage of particular
subgroups in preschool education to ensure that children from low-income
or minority populations have access to preschool programs. The measure is
presented by age, race/ethnicity, state rank, age by state rank and race/ethnicity
by state rank.
What are the policy issues associated with this measure? Preschool or
kindergarten programs help individuals develop a variety of skills that will
contribute to a productive workforce in the future.10 In an effort to assess the
relationship between the quality of preschool education and later academic and
life outcomes, the Early Learning Challenge Fund11 provides funding to support
states in building a longitudinal data system to track the educational progress
of students. In addition, the Data Quality Campaign12 is another organization
committed to providing guidance and training in the use of the longitudinal data
systems. The goals of the longitudinal data systems are to link preschool to
workforce systems, but many states have only just adopted the basic elements
needed to adequately track individuals through these systems. Policymakers
need to appreciate that even once these systems are in place, it may take
many years before there are enough data to evaluate the effi cacy of preschool
on college and career outcomes. The knowledge of these outcomes requires
a sustained commitment and likely additional funding to create shorter term
research agendas with which to address these questions.
Where are we now? As of 2008, 47.5 percent of 3- and 4-year-olds are in
preschool or kindergarten programs. There are a higher percentage of 4-year-
olds (60.7 percent) than 3-year-olds (34.4 percent) in preschool or kindergarten
programs (Figure 1.1a). When disaggregated by race/ethnicity, there are fi ve
subgroups with nearly half of the subgroup in preschool education: (1) Asian
(53.3 percent); (2) African American (52.5 percent); (3) two or more races (49.9
percent); (4) white (49.8 percent); and (5) American Indian or Alaska Native (45.0
percent; Figure 1.1b). In addition, 38.5 percent of Hispanics and 30.5 percent of
Native Hawaiian/Pacifi c Islanders are in preschool programs during this time.
10. Campbell, F. A., Pungello, E. P., Miller-Johnson, S., Burchinal, M., and Ramey, C. T. (2001). The Development
of Cognitive and Academic Abilities: Growth Curves from an Early Childhood Educational Experiment,
Developmental Psychology, 37(2), 231–242.
11. The Early Learning Challenge Fund. Retrieved May 6, 2011, from http://www2.ed.gov/about/inits/ed/
earlylearning/elcf-factsheet.html
12. The Data Quality Campaign. Retrieved June 1, 2011, from http://www.dataqualitycampaign.org/
* Data are not comparable to data in 2010 Progress Report and change is based on calculation from new source.
New indicator
Recommendation One 20

completionagenda.collegeboard.org
The District of Columbia has the highest percentage (68.5 percent) of 3- and
4-year-olds in preschool or kindergarten programs, and Nevada has the lowest
percentage (27.6 percent; Figure 1.1c). New Jersey has the highest percentage
(53.5 percent) of 3-year-olds in preschool programs, and Nevada has the lowest
percentage (19.7 percent; Figure 1.1d). The District of Columbia has the highest
percentage (84.7 percent) of 4-year-olds in preschool or kindergarten programs,
and Nevada has the lowest percentage (35.6 percent, Figure 1.1e).
Many states and the District of Columbia do not have data available by all racial/
ethnic groups for the percentage of each ethnicity in preschool or kindergarten
programs (Figure 1.1f). There are 34 states with data available for the percentage
of Asian 3- and 4-year-olds in preschool or kindergarten programs. Michigan has
the highest percentage (66.5 percent) of Asian 3- and 4-year-olds in preschool or
kindergarten programs, and Alabama has the lowest percentage (29.7 percent).
There are 16 states with data available for American Indian or Alaska Native
3- and 4-year-olds in preschool or kindergarten programs (Figure 1.1g). Wisconsin
has the highest percentage (65.1 percent) of American Indian or Alaska Native
3- and 4-year-olds in preschool programs, and North Dakota has the lowest
percentage (28.8 percent).
There are 38 states and the District of Columbia with data available for African
American 3- and 4-year-olds in preschool or kindergarten programs (Figure 1.1h).
New Jersey has the highest percentage (69.4 percent) of African American
3- and 4-year-olds in preschool programs, and Nebraska has the lowest
percentage (22.7 percent).
There are 44 states and the District of Columbia with data available for Hispanic
3- and 4-year-olds in preschool or kindergarten programs (Figure 1.1i). The District
of Columbia has the highest percentage (76.5 percent) of Hispanic 3- and
4-year-olds in preschool or kindergarten programs, and Nevada has the lowest
percentage (19.2 percent).
Data are available for all 50 states and the District of Columbia for white 3- and
4-year-olds in preschool or kindergarten programs (Figure 1.1j). The District
of Columbia has the highest percentage (79.8 percent) of white 3- and 4-year-
olds in preschool programs, and North Dakota has the lowest percentage
(34.5 percent).
There are 42 states with data available for 3- and 4-year-olds who are two or
more races in preschool or kindergarten programs (Figure 1.1k). New Jersey has
the highest percentage (66.8 percent) of 3- and 4-year-olds of two or more races
in preschool or kindergarten programs, and Nevada has the lowest percentage
(23.3 percent).
53.3% As of 2008, 53.3 percent of Asian 3- and 4-year-olds are in preschool or kindergarten programs.
3.0ppts 2007–2008*
45.0% As of 2008, 45.0 percent of Native American or Alaska Native 3- and 4-year-olds are in preschool or kindergarten programs.
2007–2008
52.5% As of 2008, 52.5 percent of African American 3- and 4-year-olds are in preschool or kindergarten programs.
2.0ppts 2007–2008*
* Data are not comparable to data in 2010 Progress Report and change is based on calculation from new source.
21

completionagenda.collegeboard.org
38.5% As of 2008, 38.5 percent of Hispanic 3- and 4-year-olds are in preschool or kindergarten programs.
1.6ppts 2007–2008*
49.8% As of 2008, 49.8 percent of white 3- and 4-year-olds are in preschool or kindergarten programs.
1.6ppts 2007–2008*
When interpreting this measure, what should be kept in mind? The information in this indicator describes the proportion of 3- and 4-year-olds
in a preschool or kindergarten program. These data are not detailed enough
to parse out enrollment in preschool programs versus that of kindergarten
programs. In addition, there are a variety of preschool or kindergarten programs,
each with a different focus. The foci of the program may include but are not
limited to the following topics or approaches to teaching: child/play-centered,
teacher-directed/academic, cooperative, Montessori, Reggio Emilia and
Waldorf.13 Families are given the opportunity to choose which program may
work best for their child. Some families may be limited by their selection
because of cost, distance, transportation or other competing values.
Finally, the data presented in this measure are from the American Community
Survey and are based on three-year estimates, which mean they represent
the characteristics of the population from 2006–2008. These estimates are
available over one year, three years or fi ve years. The three-year estimates are
more precise than the one-year estimates and more current than the fi ve-year
estimates. The three-year estimates also have a larger sample size than the one-
year estimates. Use of the three-year estimates reduces the size of sampling
errors, which lead to more stable estimates than the one-year estimates.
13. Wana, J. (2010). How to choose the best preschool for your child: The ultimate guide to fi nding, getting into,
and preparing for nursery school (Naperville, IL: Sourcebooks, Inc.).
Recommendation One 22

completionagenda.collegeboard.org
National Percentage of 3- and 4-Year-Olds Enrolled in Preschool or Kindergarten Programs by Age, 2006–2008Source: U.S. Census Bureau, 2006–2008 American Community Survey Three-Year Estimates
Percentage of 3- and 4-Year-Olds Enrolled in Preschool or Kindergarten Programs by Race/Ethnicity, 2006–2008Source: U.S. Census Bureau, 2006–2008 American Community Survey Three-Year Estimates
1.1a
1.1b New fi gure
0
10
20
30
40
50
60
70
3-Year-Olds 4-Year-Olds
34.4%
60.7%
AVG
47.5%
American Indian/
Alaska Native
AsianAfricanAmerican
Hispanic WhiteNative Hawaiian/
Pacific Islander
Two ormore races
0
10
20
30
40
50
60
70
30.5%
45.0%
53.3%52.5%
38.5%
49.8% 49.9%AVG
47.5%
Updated data source
23

completionagenda.collegeboard.org
Percentage of 3- and 4-Year-Olds Enrolled in Preschool or Kindergarten Programs by State Rank, 2006–2008Source: U.S. Census Bureau, 2006–2008 American Community Survey Three-Year Estimates
1.1c
0 10 20 30 40 50 60 70 80 90 100
District of Columbia
New Jersey
Connecticut
Massachusetts
New York
Illinois
Vermont
Hawaii
Louisiana
Mississippi
Florida
Georgia
Maryland
Arkansas
California
New Hampshire
Virginia
South Carolina
Pennsylvania
Michigan
Delaware
North Carolina
Rhode Island
UNITED STATES
Colorado
Kansas
Kentucky
Alabama
Minnesota
Iowa
Ohio
Oklahoma
Wisconsin
Missouri
Wyoming
Texas
Oregon
Washington
Alaska
Indiana
Nebraska
South Dakota
Tennessee
Utah
Montana
New Mexico
Maine
West Virginia
North Dakota
Idaho
Arizona
Nevada
68.5%
65.2%
61.8%
60.4%
57.7%
53.6%
53.4%
52.8%
52.2%
51.5%
50.9%
50.4%
50.1%
49.8%
49.7%
49.6%
48.8%
48.6%
48.4%
47.8%
47.6%
47.6%
47.6%
47.5%
45.6%
45.0%
44.7%
44.5%
44.4%
44.3%
44.3%
43.0%
43.0%
42.7%
42.5%
42.0%
41.0%
41.0%
40.5%
40.1%
39.9%
39.7%
39.3%
39.2%
38.7%
38.5%
37.4%
37.1%
35.8%
33.6%
33.3%
27.6%
23
U.S. Average
28
States
States
AVG
47.5%
New fi gure
Recommendation One 24

completionagenda.collegeboard.org
Percentage of 3-Year-Olds Enrolled in Preschool or Kindergarten Programs by State Rank, 2006–2008Source: U.S. Census Bureau, 2006–2008 American Community Survey Three-Year Estimates
1.1d
0 10 20 30 40 50 60 70 80 90 100
New Jersey
District of Columbia
Connecticut
Massachusetts
New York
Vermont
Hawaii
Florida
Illinois
Mississippi
Arkansas
Virginia
Maryland
New Hampshire
North Carolina
Georgia
California
Louisiana
Delaware
Pennsylvania
South Carolina
Rhode Island
UNITED STATES
Alabama
Colorado
Oregon
Michigan
Wyoming
Missouri
Kansas
Ohio
Washington
Minnesota
Alaska
Kentucky
Wisconsin
Montana
Iowa
Tennessee
Texas
South Dakota
North Dakota
Maine
New Mexico
Indiana
Oklahoma
Utah
Nebraska
Idaho
Arizona
West Virginia
Nevada
53.5%
51.5%
49.2%
48.1%
43.5%
43.1%
40.7%
39.5%
39.1%
39.0%
38.5%
37.1%
37.0%
36.6%
36.4%
36.0%
35.9%
35.9%
35.8%
35.6%
35.1%
34.7%
34.4%
33.4%
33.2%
32.3%
31.6%
31.4%
31.2%
31.1%
30.9%
30.9%
30.7%
30.1%
30.1%
29.3%
28.3%
28.2%
28.2%
27.7%
27.5%
27.2%
27.1%
26.7%
26.1%
26.0%
26.0%
25.1%
24.1%
23.4%
21.2%
19.7%
22
U.S. Average
29
States
States
AVG
34.4%
New fi gure
25

completionagenda.collegeboard.org
Percentage of 4-Year-Olds Enrolled in Preschool or Kindergarten Programs by State Rank, 2006–2008Source: U.S. Census Bureau, 2006–2008 American Community Survey Three-Year Estimates
1.1e
0 10 20 30 40 50 60 70 80 90 100
District of Columbia
New Jersey
Connecticut
Massachusetts
New York
Louisiana
Illinois
Hawaii
Georgia
Mississippi
Michigan
California
Maryland
Vermont
South Carolina
Florida
New Hampshire
Pennsylvania
Rhode Island
Delaware
Arkansas
UNITED STATES
Virginia
Oklahoma
Iowa
Kansas
North Carolina
Minnesota
Colorado
Kentucky
Ohio
Wisconsin
Texas
Alabama
Nebraska
Missouri
Indiana
Utah
South Dakota
Wyoming
Washington
West Virginia
Alaska
New Mexico
Tennessee
Oregon
Maine
Montana
North Dakota
Idaho
Arizona
Nevada
84.7%
77.1%
73.8%
72.8%
72.4%
68.6%
67.8%
65.5%
65.2%
64.4%
63.7%
63.4%
63.2%
62.8%
62.1%
62.0%
61.6%
61.6%
61.4%
60.9%
60.8%
60.7%
60.3%
59.8%
59.6%
58.8%
58.8%
58.5%
58.2%
58.0%
57.8%
57.0%
56.5%
54.9%
54.5%
54.3%
53.8%
53.2%
53.1%
53.1%
51.7%
51.5%
51.4%
50.2%
50.2%
50.0%
48.1%
47.9%
44.6%
44.4%
43.2%
35.6%
21
U.S. Average
30
States
States
AVG
60.7%
New fi gure
Recommendation One 26

completionagenda.collegeboard.org
Percentage of Asian 3- and 4-Year-Olds Enrolled in Preschool or Kindergarten Programs by State Rank, 2006–2008Source: U.S. Census Bureau, 2006–2008 American Community Survey Three-Year Estimates
1.1f
0 10 20 30 40 50 60 70 80 90 100
Michigan
Illinois
Missouri
New Jersey
Oklahoma
Massachusetts
California
Hawaii
Virginia
Kansas
Connecticut
Ohio
Pennsylvania
UNITED STATES
Indiana
Oregon
Georgia
Florida
North Carolina
Texas
Washington
New York
Louisiana
Tennessee
Iowa
Minnesota
Arizona
Kentucky
Colorado
Maryland
Wisconsin
South Carolina
Utah
Nevada
Alabama
Alaska
Arkansas
Delaware
District of Columbia
Idaho
Maine
Mississippi
Montana
Nebraska
New Hampshire
New Mexico
North Dakota
Rhode Island
South Dakota
Vermont
West Virginia
Wyoming
66.5%
64.8%
62.6%
60.2%
59.6%
57.5%
56.6%
56.5%
55.8%
55.7%
55.6%
53.4%
53.4%
53.3%
51.7%
50.9%
50.1%
50.0%
50.0%
49.5%
49.5%
49.1%
49.0%
48.7%
47.2%
44.8%
44.4%
42.1%
41.7%
41.2%
40.9%
40.3%
33.2%
31.7%
29.7%
NA
NA
NA
NA
NA
NA
NA
NA
NA
NA
NA
NA
NA
NA
NA
NA
NA
13
U.S. Average
21*
States
States
AVG
53.3%
* Indicator data not available for all states.
New fi gure
27

completionagenda.collegeboard.org
Percentage of American Indian or Alaska Native 3- and 4-Year-Olds Enrolled in Preschool or Kindergarten Programs by State Rank, 2006–2008Source: U.S. Census Bureau, 2006–2008 American Community Survey Three-Year Estimates
1.1g
0 10 20 30 40 50 60 70 80 90 100
Wisconsin
South Dakota
Michigan
Alaska
Montana
Texas
California
New York
Washington
Oklahoma
UNITED STATES
New Mexico
North Carolina
Minnesota
Arizona
Oregon
North Dakota
Alabama
Arkansas
Colorado
Connecticut
Delaware
District of Columbia
Florida
Georgia
Hawaii
Idaho
Illinois
Indiana
Iowa
Kansas
Kentucky
Louisiana
Maine
Maryland
Massachusetts
Mississippi
Missouri
Nebraska
Nevada
New Hampshire
New Jersey
Ohio
Pennsylvania
Rhode Island
South Carolina
Tennessee
Utah
Vermont
Virginia
West Virginia
Wyoming
65.1%
60.4%
57.3%
55.9%
52.8%
51.1%
48.4%
48.3%
47.7%
47.1%
45.0%
42.9%
40.7%
37.6%
33.7%
31.3%
28.8%
NA
NA
NA
NA
NA
NA
NA
NA
NA
NA
NA
NA
NA
NA
NA
NA
NA
NA
NA
NA
NA
NA
NA
NA
NA
NA
NA
NA
NA
NA
NA
NA
NA
NA
NA
10
U.S. Average
6*
States
States
AVG
45.0%
* Indicator data not available for all states.
New fi gure
Recommendation One 28
completionagenda.collegeboard.org
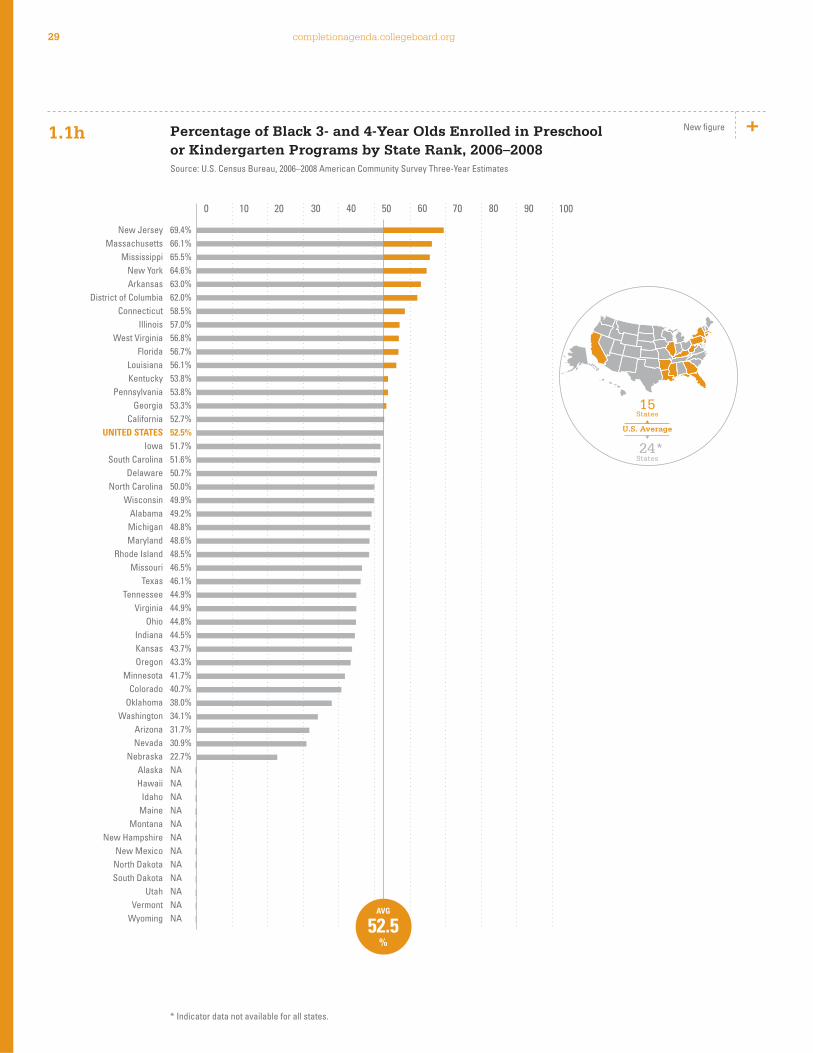
Percentage of Black 3- and 4-Year Olds Enrolled in Preschool or Kindergarten Programs by State Rank, 2006–2008Source: U.S. Census Bureau, 2006–2008 American Community Survey Three-Year Estimates
1.1h
0 10 20 30 40 50 60 70 80 90 100
New Jersey
Massachusetts
Mississippi
New York
Arkansas
District of Columbia
Connecticut
Illinois
West Virginia
Florida
Louisiana
Kentucky
Pennsylvania
Georgia
California
UNITED STATES
Iowa
South Carolina
Delaware
North Carolina
Wisconsin
Alabama
Michigan
Maryland
Rhode Island
Missouri
Texas
Tennessee
Virginia
Ohio
Indiana
Kansas
Oregon
Minnesota
Colorado
Oklahoma
Washington
Arizona
Nevada
Nebraska
Alaska
Hawaii
Idaho
Maine
Montana
New Hampshire
New Mexico
North Dakota
South Dakota
Utah
Vermont
Wyoming
69.4%
66.1%
65.5%
64.6%
63.0%
62.0%
58.5%
57.0%
56.8%
56.7%
56.1%
53.8%
53.8%
53.3%
52.7%
52.5%
51.7%
51.6%
50.7%
50.0%
49.9%
49.2%
48.8%
48.6%
48.5%
46.5%
46.1%
44.9%
44.9%
44.8%
44.5%
43.7%
43.3%
41.7%
40.7%
38.0%
34.1%
31.7%
30.9%
22.7%
NA
NA
NA
NA
NA
NA
NA
NA
NA
NA
NA
NA
15
U.S. Average
24*
States
States
AVG
52.5%
* Indicator data not available for all states.
New fi gure
29

completionagenda.collegeboard.org
0 10 20 30 40 50 60 70 80 90 100
District of Columbia
New Jersey
Connecticut
Hawaii
New York
Massachusetts
Delaware
Michigan
Louisiana
Florida
Ohio
Kentucky
Wisconsin
California
Illinois
Nebraska
UNITED STATES
Pennsylvania
Arkansas
Wyoming
Missouri
New Hampshire
Iowa
Texas
Virginia
New Mexico
Maryland
Minnesota
Indiana
Colorado
Oklahoma
Kansas
Montana
South Carolina
Oregon
North Carolina
Georgia
Utah
Rhode Island
Washington
Tennessee
Arizona
Alabama
Idaho
Mississippi
Nevada
Alaska
Maine
North Dakota
South Dakota
Vermont
West Virginia
76.5%
59.6%
50.7%
49.2%
48.9%
46.1%
44.6%
44.5%
44.2%
42.9%
42.9%
42.5%
42.4%
42.0%
39.7%
39.7%
38.5%
38.4%
37.3%
37.1%
37.0%
36.8%
36.6%
36.1%
35.7%
35.5%
35.3%
34.5%
33.2%
33.0%
32.3%
32.2%
32.2%
31.0%
30.9%
30.4%
29.9%
27.6%
27.2%
26.5%
24.0%
23.3%
21.8%
21.6%
20.8%
19.2%
NA
NA
NA
NA
NA
NA
16
U.S. Average
29*
States
States
AVG
38.5%
Percentage of Hispanic 3- and 4-Year-Olds Enrolled in Preschool or Kindergarten Programs by State Rank, 2006–2008Source: U.S. Census Bureau, 2006–2008 American Community Survey Three-Year Estimates
1.1i
* Indicator data not available for all states.
New fi gure
Recommendation One 30
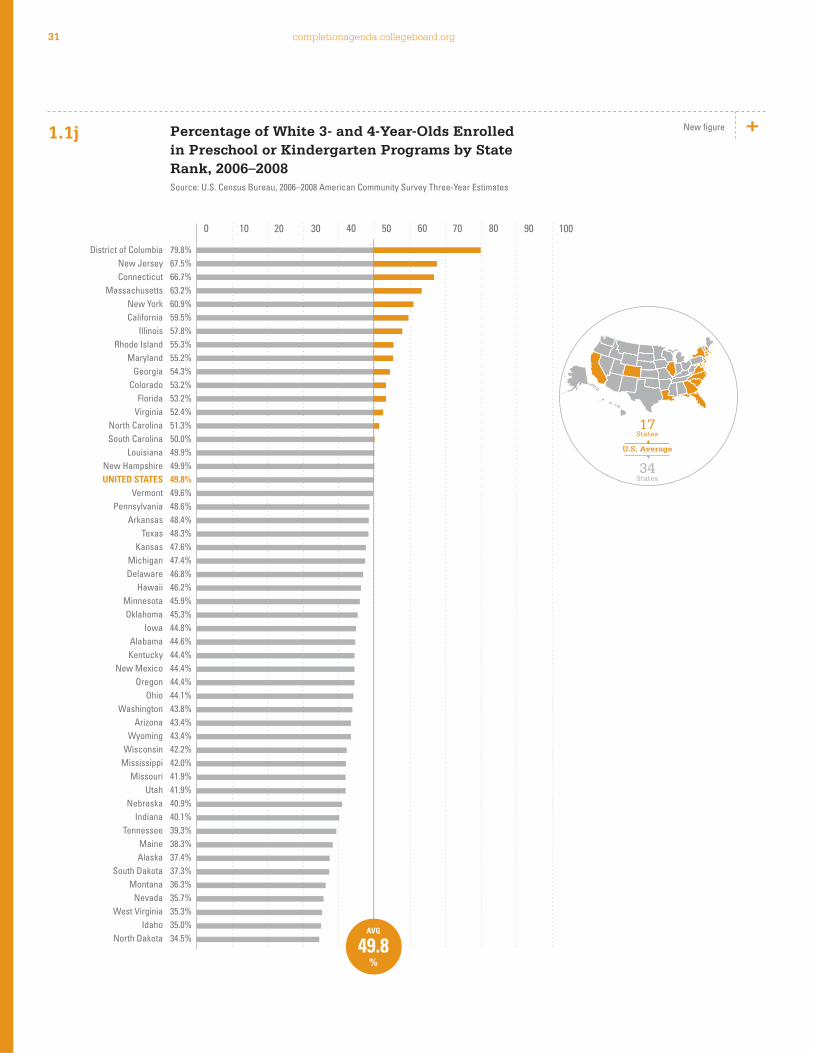
completionagenda.collegeboard.org
0 10 20 30 40 50 60 70 80 90 100
District of Columbia
New Jersey
Connecticut
Massachusetts
New York
California
Illinois
Rhode Island
Maryland
Georgia
Colorado
Florida
Virginia
North Carolina
South Carolina
Louisiana
New Hampshire
UNITED STATES
Vermont
Pennsylvania
Arkansas
Texas
Kansas
Michigan
Delaware
Hawaii
Minnesota
Oklahoma
Iowa
Alabama
Kentucky
New Mexico
Oregon
Ohio
Washington
Arizona
Wyoming
Wisconsin
Mississippi
Missouri
Utah
Nebraska
Indiana
Tennessee
Maine
Alaska
South Dakota
Montana
Nevada
West Virginia
Idaho
North Dakota
79.8%
67.5%
66.7%
63.2%
60.9%
59.5%
57.8%
55.3%
55.2%
54.3%
53.2%
53.2%
52.4%
51.3%
50.0%
49.9%
49.9%
49.8%
49.6%
48.6%
48.4%
48.3%
47.6%
47.4%
46.8%
46.2%
45.9%
45.3%
44.8%
44.6%
44.4%
44.4%
44.4%
44.1%
43.8%
43.4%
43.4%
42.2%
42.0%
41.9%
41.9%
40.9%
40.1%
39.3%
38.3%
37.4%
37.3%
36.3%
35.7%
35.3%
35.0%
34.5%
17
U.S. Average
34
States
States
AVG
49.8%
Percentage of White 3- and 4-Year-Olds Enrolled in Preschool or Kindergarten Programs by State Rank, 2006–2008Source: U.S. Census Bureau, 2006–2008 American Community Survey Three-Year Estimates
1.1j New fi gure
31

completionagenda.collegeboard.org
0 10 20 30 40 50 60 70 80 90 100
New Jersey
Massachusetts
New York
Illinois
California
Hawaii
Georgia
Connecticut
Louisiana
Maryland
Idaho
Florida
Mississippi
Washington
UNITED STATES
Alabama
West Virginia
Michigan
Virginia
Arizona
Pennsylvania
Kansas
Colorado
Texas
Ohio
Minnesota
North Carolina
South Carolina
Missouri
Oklahoma
Indiana
Tennessee
Iowa
Nebraska
Rhode Island
Wisconsin
Arkansas
New Mexico
Utah
Kentucky
Alaska
Oregon
Nevada
Delaware
District of Columbia
Maine
Montana
New Hampshire
North Dakota
South Dakota
Vermont
Wyoming
66.8%
64.7%
62.6%
60.4%
59.5%
57.8%
55.6%
54.9%
54.3%
54.0%
53.4%
52.4%
50.1%
50.0%
49.9%
48.2%
47.7%
47.1%
47.1%
46.7%
46.7%
46.5%
46.1%
45.9%
44.4%
43.9%
43.8%
43.7%
43.2%
42.8%
42.7%
42.6%
42.2%
41.6%
40.5%
40.4%
40.0%
38.7%
35.6%
35.2%
34.2%
33.9%
23.3%
NA
NA
NA
NA
NA
NA
NA
NA
NAAVG
49.9%
14
U.S. Average
28*
States
States
AVG
49.9%
Percentage of Two or More Races 3- and 4-Year-Olds Enrolled in Preschool or Kindergarten Programs by State Rank, 2006–2008Source: U.S. Census Bureau, 2006–2008 American Community Survey Three-Year Estimates
1.1k
* Indicator data not available for all states.
New fi gure
Recommendation One 32

completionagenda.collegeboard.org
Percentage of 3- and 4-Year-Olds Enrolled in State-Funded Pre-K ProgramsWhat is this measure, and why is this measure important? This indicator
measures the percentage of 3- and 4-year-olds in state-funded preschool
education programs. The measure presents an overview of data representing
enrollment in state-funded child care for 3- and 4-year-olds at the state level. It is
important because it represents the percentage of 3- and 4-year-olds who have
access to state-funded pre-K programs.
What are the policy issues associated with this measure? The commission
notes the importance of states developing funding formulas to assist
communities in establishing high-quality preschool programs. Also, the
commission recommends that local school boards and districts play a role in
helping to establish preschool programs. Local school boards can do this by
offering space for preschool programs to operate and by utilizing best practices
for the alignment of a preschool curriculum with the learning expectations
in kindergarten.
Where are we now? As of 2009, 14.6 percent of 3- and 4-year-olds are in state-
funded pre-K programs (Figure 1.2a). Thirty-eight states reported the percentage
of 3- and 4-year-olds in state-funded pre-K programs. Vermont has the highest
percentage (35.4 percent) of 3- and 4-year-olds in state-funded pre-K programs.
Nevada has the lowest percentage (1.4 percent).
Nearly 3.7 percent of 3-year-olds in the nation are in state-funded preschool
education programs (Figure 1.2b). All of the 38 reporting states have less than
25.0 percent of 3-year-olds in state-funded preschool education, 16 of which
are less than 1.0 percent. Illinois has the highest percentage (21.2 percent) of
3-year-olds in state-funded pre-K programs.
About 25.4 percent of 4-year-olds in the United States are in state-funded pre-K
programs (Figure 1.2c). Oklahoma has the highest percentage (71.0 percent)
of 4-year-olds in state-funded pre-K programs. Minnesota has the lowest
percentage (1.6 percent).
14.6% As of 2009, 14.6 percent of 3- and 4-year-olds are in state-funded pre-K programs.
0.8ppts 2008–2009
3.7% As of 2009, 3.7 percent of 3-year-olds are in state-funded pre-K programs.
2008–2009
25.4% As of 2009, 25.4 percent of 4-year-olds are in state-funded pre-K programs.
1.4ppts 2008–2009
33

completionagenda.collegeboard.org
When interpreting this measure, what should be kept in mind? The State
Preschool Yearbook data provide information for each state on access, quality
standards and resources for state-funded preschool programs.14 It is important
to note that preschools are only one type of educational program that districts
can target with Title I funds. The Title I funds are to support schools and districts
with the highest percentage of low-income students, which can include all K–12
students. In addition, there are several states that do not offer state-funded
pre-K programs: Alaska, Hawaii, Idaho, Indiana, Mississippi, Montana, New
Hampshire, North Dakota, Rhode Island, South Dakota, Utah and Wyoming.
Other states did not provide data about their enrollment disaggregated by age,
including Massachusetts, Minnesota, Pennsylvania, Vermont and Wisconsin.
14. Barnett, W., Epstein, D., Carolan, M., Fitzgerald, J., Ackerman, D., and Friedman, A. “The State of Preschool
2010” (New Brunswick, NJ: NIEER, 2010).
Recommendation One 34

completionagenda.collegeboard.org
0 10 20 30 40 50 60 70 80 90 100
**Vermont
Oklahoma
Florida
West Virginia
Georgia
Illinois
Texas
**Wisconsin
Arkansas
New Jersey
New York
South Carolina
Kentucky
Maryland
Louisiana
Iowa
UNITED STATES
Colorado
North Carolina
Tennessee
Kansas
**Pennsylvania
Connecticut
Maine
Michigan
California
New Mexico
**Massachusetts
Virginia
Ohio
Oregon
Nebraska
Washington
Delaware
Missouri
Alabama
Arizona
**Minnesota
Nevada
*Alaska
*Hawaii
*Idaho
*Indiana
*Mississippi
*Montana
*New Hampshire
*North Dakota
*Rhode Island
*South Dakota
*Utah
*Wyoming
35.4%
35.1%
33.1%
29.9%
26.7%
25.0%
25.0%
24.8%
24.6%
22.0%
21.5%
21.1%
19.1%
18.2%
15.9%
14.9%
14.6%
13.0%
12.4%
11.2%
10.6%
10.6%
9.6%
9.6%
9.6%
9.0%
8.1%
7.1%
7.1%
6.7%
6.5%
5.1%
4.8%
3.6%
2.9%
2.8%
2.7%
1.4%
1.4%
NA
NA
NA
NA
NA
NA
NA
NA
NA
NA
NA
NA
16
U.S. Average
22*
States
States
AVG
14.6%
Percentage of 3- and 4-Year-Olds Enrolled in State-Funded Pre-K Programs by State Rank, 2009Source: National Institute for Early Education Research, Rutgers Graduate School of Education, The State of Preschool, 2009Note: The District of Columbia is not included.
1.2a
* No State Funded Program. ** At least one program in these states did not break down total enrollment fi gures into specifi c numbers of 3- and 4-year-olds served.
As a result, the fi gures in this table are estimates.
New fi gure
35
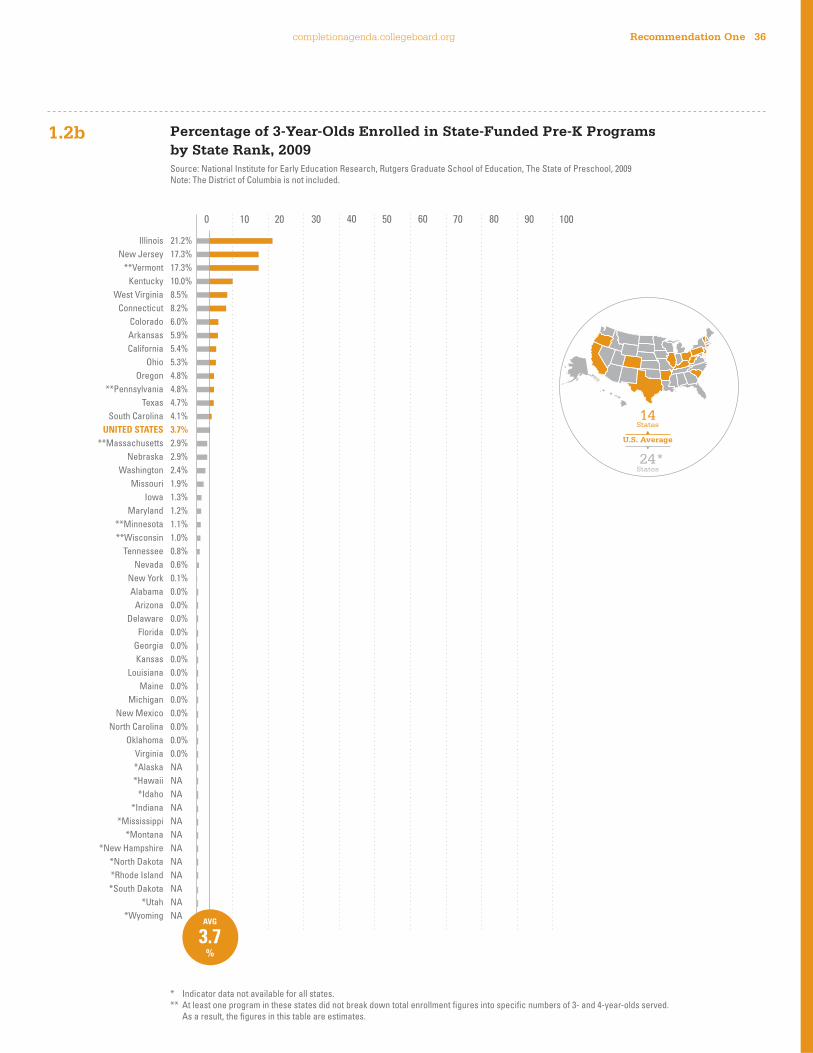
completionagenda.collegeboard.org
0 10 20 30 40 50 60 70 80 90 100
Illinois
New Jersey
**Vermont
Kentucky
West Virginia
Connecticut
Colorado
Arkansas
California
Ohio
Oregon
**Pennsylvania
Texas
South Carolina
UNITED STATES
**Massachusetts
Nebraska
Washington
Missouri
Iowa
Maryland
**Minnesota
**Wisconsin
Tennessee
Nevada
New York
Alabama
Arizona
Delaware
Florida
Georgia
Kansas
Louisiana
Maine
Michigan
New Mexico
North Carolina
Oklahoma
Virginia
*Alaska
*Hawaii
*Idaho
*Indiana
*Mississippi
*Montana
*New Hampshire
*North Dakota
*Rhode Island
*South Dakota
*Utah
*Wyoming
21.2%
17.3%
17.3%
10.0%
8.5%
8.2%
6.0%
5.9%
5.4%
5.3%
4.8%
4.8%
4.7%
4.1%
3.7%
2.9%
2.9%
2.4%
1.9%
1.3%
1.2%
1.1%
1.0%
0.8%
0.6%
0.1%
0.0%
0.0%
0.0%
0.0%
0.0%
0.0%
0.0%
0.0%
0.0%
0.0%
0.0%
0.0%
0.0%
NA
NA
NA
NA
NA
NA
NA
NA
NA
NA
NA
NA
14
U.S. Average
24*
States
States
AVG
3.7%
Percentage of 3-Year-Olds Enrolled in State-Funded Pre-K Programs by State Rank, 2009Source: National Institute for Early Education Research, Rutgers Graduate School of Education, The State of Preschool, 2009Note: The District of Columbia is not included.
1.2b
* Indicator data not available for all states.** At least one program in these states did not break down total enrollment fi gures into specifi c numbers of 3- and 4-year-olds served.
As a result, the fi gures in this table are estimates.
Recommendation One 36

completionagenda.collegeboard.org
0 10 20 30 40 50 60 70 80 90 100
Oklahoma
Florida
Georgia
**Vermont
West Virginia
**Wisconsin
Texas
Arkansas
New York
South Carolina
Maryland
Louisiana
Illinois
Iowa
Kentucky
New Jersey
UNITED STATES
North Carolina
Tennessee
Kansas
Colorado
Michigan
Maine
New Mexico
**Pennsylvania
Virginia
California
**Massachusetts
Connecticut
Oregon
Ohio
Delaware
Nebraska
Washington
Alabama
Arizona
Missouri
Nevada
**Minnesota
*Alaska
*Hawaii
*Idaho
*Indiana
*Mississippi
*Montana
*New Hampshire
*North Dakota
*Rhode Island
*South Dakota
*Utah
*Wyoming
71.0%
66.7%
53.4%
53.0%
50.1%
48.4%
45.4%
43.7%
42.6%
38.1%
35.1%
31.7%
28.7%
28.7%
28.3%
26.5%
25.4%
25.0%
21.6%
21.2%
20.2%
19.1%
19.0%
16.5%
16.4%
14.1%
12.6%
11.3%
10.9%
8.3%
8.1%
7.3%
7.3%
7.2%
5.5%
5.4%
3.9%
2.3%
1.6%
NA
NA
NA
NA
NA
NA
NA
NA
NA
NA
NA
NA
16
U.S. Average
22*
States
States
AVG
25.4%
Percentage of 4-Year-Olds Enrolled in State-Funded Pre-K Programs by State Rank, 2009Source: National Institute for Early Education Research, Rutgers Graduate School of Education, The State of Preschool, 2009Note: The District of Columbia is not included.
1.2c
* Indicator data not available for all states.** At least one program in these states did not break down total enrollment fi gures into specifi c numbers of 3- and 4-year-olds served.
As a result, the fi gures in this table are estimates.
37

completionagenda.collegeboard.org
Percentage of 3- and 4-Year-Olds Enrolled in Head Start ProgramsWhat is this measure, and why is this measure important? This measure
shows the percentage of 3- and 4-year-olds in federally funded Head Start
education programs. Head Start funding provides preschool education,
medical care, dental care, nutrition services and mental health services to its
participants.15 These multifaceted services aim to improve the overall quality
of life and provide the skills necessary to succeed later in life.
What are the policy issues associated with this measure? Head Start is a
federally funded program whose existence is based on yearly decisions made
by the federal government. Each year the level of funding may change based on
a variety of factors, including but not limited to the number of eligible children in
a state, approval of the federal budget and supplemental state appropriations.
For several years, the federal government has expressed concern about the
use of funds for Head Start programs across the nation. With this possibility of
variation in funding, states are increasing the amount of evidence they collect
and disseminate about the use of Head Start funds in their state.
Where are we now? As of 2009, 8.6 percent of 3- and 4-year-olds in the United
States are in Head Start programs (Figure 1.3a). Mississippi has the highest
percentage (29.4 percent) of 3- and 4-year-olds in Head Start programs, and
Nevada has the lowest percentage (2.4 percent).
Among 3-year-olds in the United States, 7.1 percent are in Head Start programs
(Figure 1.3b). Mississippi has the highest percentage (23.9 percent) of 3-year-
olds in Head Start programs. Nevada has the lowest percentage (1.4 percent).
The percentage of 4-year-olds in Head Start programs in the United States is
10.0 percent (Figure 1.3c). Mississippi has the highest percentage (34.9 percent)
of 4-year-olds in Head Start programs. Nevada has the lowest percentage
(3.3 percent).
15. U.S. Department of Health and Human Services, Administration for Children and Families. (January 2010).
Head Start Impact Study. Final Report (Washington, DC), 9.
8.6% As of 2009, 8.6 percent of 3- and 4-year-olds are in Head Start programs.
2008–2009
7.1% As of 2009, 7.1 percent of 3-year-olds are in Head Start programs.
2008–2009
10.0% As of 2009, 10.0 percent of 4-year-olds are in Head Start programs.
2008–2009
Recommendation One 38

completionagenda.collegeboard.org
When interpreting this measure, what should be kept in mind? Despite every state having access to federal funds for implementing a Head
Start program, the methods and level of implementation may vary from state to
state. Participating students may receive various types of instruction.16 All Head
Start programs focus on helping children to learn, but many also focus on other
aspects of childhood.
Data presented in this measure are from The State of Preschool, which are
estimates based on data from the Head Start Program Information Reports
for 2000–2010, and the Association for Children and Families. The data do not
include children funded by state match; as such, the numbers for some states
may underestimate the percentage of students who receive services from a
Head Start program despite the source of funding.
16. Mathematica Policy Research. Results from the “I Am Moving, I Am Learning” Stage 1 Survey, 2007.
Retrieved June 17, 2010, from http://www.acf.hhs.gov/programs/opre/hs/eval_move_learn/reports/stage1_
survey/stage1_survey.pdf
39

completionagenda.collegeboard.org
0 10 20 30 40 50 60 70 80 90 100
Mississippi
District of Columbia
West Virginia
Louisiana
Kentucky
North Dakota
Alabama
Michigan
Arkansas
Oklahoma
Montana
Ohio
Wyoming
New Mexico
South Carolina
South Dakota
Missouri
Illinois
Pennsylvania
Tennessee
New York
Maine
UNITED STATES
Vermont
California
Iowa
Wisconsin
Hawaii
Kansas
Nebraska
Texas
Georgia
Rhode Island
Florida
Indiana
Massachusetts
Connecticut
North Carolina
Maryland
Minnesota
New Jersey
Colorado
Alaska
Oregon
Virginia
Arizona
Washington
Delaware
Idaho
Utah
New Hampshire
Nevada
29.4%
17.7%
16.8%
15.9%
13.1%
12.8%
12.5%
12.4%
12.2%
12.0%
10.8%
10.6%
9.9%
9.8%
9.8%
9.8%
9.6%
9.5%
9.3%
9.1%
9.0%
8.9%
8.6%
8.5%
8.4%
8.3%
8.2%
8.0%
8.0%
8.0%
7.7%
7.4%
7.4%
7.1%
7.1%
7.1%
6.8%
6.7%
6.4%
6.2%
6.1%
6.0%
5.9%
5.8%
5.8%
5.4%
5.4%
5.3%
5.1%
4.8%
4.5%
2.4%
22
U.S. Average
29
States
States
AVG
8.6%
Percentage of 3- and 4-Year-Olds Enrolled in Head Start Programs by State Rank, 2009Source: National Institute for Early Education Research, Rutgers Graduate School of Education, The State of Preschool, 2009
1.3a
Recommendation One 40

completionagenda.collegeboard.org
Percentage of 3-Year-Olds Enrolled in Head Start Programs by State Rank, 2009Source: National Institute for Early Education Research, Rutgers Graduate School of Education, The State of Preschool, 2009
1.3b
0 10 20 30 40 50 60 70 80 90 100
Mississippi
Louisiana
District of Columbia
Arkansas
Oklahoma
West Virginia
Michigan
Kentucky
South Carolina
North Dakota
Alabama
Ohio
Montana
Missouri
Illinois
Georgia
Wisconsin
Vermont
New York
Pennsylvania
New Mexico
Kansas
Wyoming
Maine
Iowa
South Dakota
UNITED STATES
Texas
Maryland
Tennessee
Massachusetts
Nebraska
California
Connecticut
Hawaii
New Jersey
Florida
Rhode Island
Indiana
North Carolina
Minnesota
Alaska
Virginia
Colorado
Oregon
Washington
New Hampshire
Delaware
Arizona
Utah
Idaho
Nevada
23.9%
16.8%
12.9%
11.5%
11.0%
10.8%
10.1%
9.9%
9.8%
9.7%
9.3%
9.0%
8.9%
8.5%
8.3%
8.2%
8.2%
7.9%
7.9%
7.8%
7.7%
7.6%
7.5%
7.4%
7.1%
7.1%
7.1%
6.9%
6.6%
6.3%
6.2%
6.2%
5.8%
5.7%
5.7%
5.7%
5.5%
5.4%
5.3%
5.2%
5.0%
4.9%
4.9%
4.8%
4.4%
3.9%
3.6%
3.5%
3.4%
2.9%
2.3%
1.4%
26
U.S. Average
25
States
States
AVG
7.1%
41

completionagenda.collegeboard.org
Percentage of 4-Year-Olds Enrolled in Head Start Programs by State Rank, 2009Source: National Institute for Early Education Research, Rutgers Graduate School of Education, The State of Preschool, 2009
1.3c
0 10 20 30 40 50 60 70 80 90 100
Mississippi
West Virginia
District of Columbia
Kentucky
North Dakota
Alabama
Louisiana
Michigan
Arkansas
Oklahoma
Montana
South Dakota
Wyoming
Ohio
New Mexico
Tennessee
California
Missouri
Pennsylvania
Illinois
Maine
New York
Hawaii
UNITED STATES
South Carolina
Nebraska
Iowa
Rhode Island
Vermont
Indiana
Florida
Texas
Kansas
North Carolina
Wisconsin
Massachusetts
Idaho
Connecticut
Arizona
Minnesota
Oregon
Colorado
Delaware
Alaska
Virginia
Washington
Georgia
Utah
New Jersey
Maryland
New Hampshire
Nevada
34.9%
22.7%
22.5%
16.2%
15.9%
15.7%
15.0%
14.8%
13.0%
13.0%
12.7%
12.6%
12.4%
12.3%
12.0%
11.8%
11.0%
10.8%
10.7%
10.6%
10.5%
10.2%
10.1%
10.0%
9.8%
9.7%
9.5%
9.2%
9.1%
8.9%
8.8%
8.6%
8.3%
8.3%
8.1%
8.0%
7.8%
7.8%
7.5%
7.4%
7.3%
7.2%
7.1%
6.9%
6.8%
6.8%
6.7%
6.7%
6.4%
6.1%
5.5%
3.3%
23
U.S. Average
28
States
States
AVG
10.0%
Recommendation One 42
TwoImprove middle school and high school counseling
WE RECOMMEND that states and localities move toward professional norms for staffi ng middle and high school counseling offi ces and that colleges and universities collaborate actively to provide college information and planning services to all students (with a special focus on low-income students).

completionagenda.collegeboard.org
Middle and high school counseling programs have the potential to build a
college-going culture and help students understand the value of and prepare
for college. To create this culture, school counselors must ensure that students
and families understand the importance of taking college-preparatory courses
and know how to navigate the college admission and fi nancial aid processes.
Middle school counseling programs are critical to ensuring that students
complete course work that will allow them to participate in a college-preparatory
curriculum upon entering high school. Middle school is not too early to start
implementing some, if not all, aspects of college counseling, and it is often too
late to begin preparing students after they reach high school.
A major function of the college counseling program in high schools is to expose
students to various colleges, universities and other postsecondary opportunities
that may fi t their career and personal goals. College counselors should help
students understand the importance of college and other postsecondary
educational opportunities and guide students through the often complex college
admission and fi nancial aid processes.17 Counselors should use their knowledge
of postsecondary options to help students choose the path that is best for their
future goals and expectations. The information provided in college and career
counseling is invaluable for low-income, fi rst-generation and other traditionally
underrepresented students who may not have access to this information.
The earlier college and career counseling begins, the better prepared students
will be for life after high school.
One comprehensive, systemic approach for providing college and career
counseling to various populations is outlined in the National Offi ce for School
Counselor Advocacy’s Eight Components of College and Career Readiness
Counseling.18 These components encourage counselors to increase student
college aspirations, aid in college and career exploration and selection, aid in
college admission processes, and aid in college affordability planning at a young
age, among other things.
The following indicators refl ect the state of middle and high school college counseling:
• Student-to-counselor ratio;
• Student-to-college-counselor ratio;
• Number of statewide comprehensive school counseling programs;
• Professional development for secondary school college counselors;
• Percentage of counselors’ time spent on tasks; and
• Implementation of the Eight Components of College and Career
Readiness Counseling.
17. American School Counselor Association, School counselor competencies. Retrieved Feb. 2, 2010,
from the ASCA website: http://www.schoolcounselor.org/fi les/SCCompetencies.pdf, 68
18. Eight Components of College and Career Readiness Counseling. Retrieved June 1, 2011, from
http://advocacy.collegeboard.org/sites/default/fi les/10b_2217_EightComponents_WEB_100625.pdf
Recommendation Two 44

completionagenda.collegeboard.org
General Findings for This Recommendation• As of 2008, 457:1 is the average student-to-counselor ratio in the
United States.
• As of 2008, 320:1 is the average student-to-college-counselor ratio in
the United States.
• As of 2009, 36 states have a statewide comprehensive school counseling
program.
• As of 2009, 31.2 percent of secondary schools require counselors to
participate in professional development.
• As of 2009, 32.2 percent of secondary schools cover all professional
development costs.
• As of 2009, counselors spend 26.0 percent of their time on postsecondary
admission counseling.
Student-to-Counselor RatioWhat is this measure, and why is this measure important? This measure
provides the student-to-counselor and student-to-college-counselor ratios. The
student-to-counselor ratio identifi es the potential access a student may have
to the counseling services provided in a particular school, district or state. The
student-to-college-counselor ratio describes the access a student may have
to an individual who is responsible for providing college counseling. These
college counselors include those who are solely responsible for providing
college counseling and those who provide college counseling among other
counseling responsibilities.
What are the policy issues associated with this measure? While counselors work in schools across the nation, many of the state-level
student-to-counselor ratios suggest that school counselors are overloaded
with the number of students to whom they must provide college counseling
services. Overburdened counselors may not be able to effectively implement
a comprehensive college and career counseling program. States should adopt
policies that move toward reducing the number of students who are assigned
to a counselor. Attention should be paid also to increasing the number of school
counselors in a school, district or state to meet the recommended student-
to-counselor ratio. Some schools are trying to increase student access to
college counseling by hiring counselors who are only responsible for helping
the students complete college admission paperwork in high school. By not
providing students with college counseling in middle school, students may
be limited in their access to an academic trajectory necessary to attend the
college of their choice. For example, if a student does not take Algebra I by
457:1 As of 2008, 457:1 is the average student-to-counselor ratio in the United States.
10:1 2007–2008
320:1 As of 2008, 320:1 is the average student-to-college-counselor ratio in the United States.
4:1 2007–2008
45

completionagenda.collegeboard.org
eighth grade, he or she will not have access to a calculus course in high school,
which is desired by many colleges for students who want to major in science,
technology, engineering or mathematics fi elds.
Where are we now? On average, each counselor in the United States is
responsible for 457 students (Figure 2.1a). This is the lowest student-
to-counselor ratio for the nation since 1997. This is nearly two times the
recommended ratio from the American School Counselor Association of 250:1.19
Wyoming, Vermont, New Hampshire, Mississippi and Louisiana have less than
the recommended ratio (Figure 2.1b). California, Minnesota, Arizona, Utah and
Illinois are among the states with the highest student-to-counselor ratios.
The average student-to-college-counselor ratio trend decreases between
2005 and 2007 (Figure 2.1c). Since 2007, the student-to-college-counselor ratio
remains relatively stable at 320:1. The trend for public schools is somewhat
different from the trend for private schools. The public school student-to-college-
counselor ratio trend decreases from 383:1 in 2005 to 325:1 in 2009. The
student-to-college-counselor ratio trend for private schools fl uctuates between
214:1 and 300:1. The student-to-college-counselor ratio trend for private schools
slightly decreases between 2007 and 2008, but the latest ratio increases
toward the higher end of the spectrum, 283:1.
19. American School Counselor Association, Student-to-counselor ratios. Retrieved March 5, 2010,
from the ASCA website: http://www.schoolcounselor.org/content.asp?contentid=460
0
110
220
330
440
550
1998 1999 2000 2001 2002 2003 2004 2005 2006 2007 2008 2009
506 500 490 483 476 477 488 479 473 480 457467
National Student-to-Counselor Ratio, 1998–2009Source: NCES Common Core of Data, State Nonfi scal Survey of Public Elementary/Secondary Education, 1998–2009
2.1a
Recommendation Two 46

completionagenda.collegeboard.org
Student-to-Counselor Ratio by State Rank, 2009Source: NCES Common Core of Data, State Nonfi scal Survey of Public Elementary/Secondary Education, 2009
2.1b
0 10 20 30 40 50 60 70 80 90 100
197
209
233
234
238
272
275
308
309
318
333
335
348
353
354
356
366
372
374
381
383
386
387
387
391
398
399
411
419
432
434
434
435
440
449
457
459
464
467
491
499
507
511
522
540
613
638
672
733
743
759
814
Wyoming
Vermont
New Hampshire
Mississippi
Louisiana
Hawaii
District of Columbia
Virginia
Montana
Maine
Arkansas
North Dakota
Maryland
Tennessee
Iowa
Rhode Island
Nebraska
Missouri
North Carolina
Oklahoma
South Carolina
Pennsylvania
Colorado
West Virginia
New Mexico
Alabama
South Dakota
New York
Kansas
Massachusetts
Florida
Idaho
Texas
Delaware
Georgia
UNITED STATES
Kentucky
Wisconsin
Alaska
Washington
Ohio
Connecticut
Nevada
Oregon
Indiana
New Jersey
Michigan
Illinois
Utah
Arizona
Minnesota
California
0 0 0 0 0 0 0 0 0 0
35
U.S. Average
16
States
States
Goal
250AVG
457
47

completionagenda.collegeboard.org
When interpreting this measure, what should be kept in mind? The student-to-counselor ratio data include all school counselors and do not
identify how much time, if any, they spend providing college counseling to
students. It is important that all students receive college and career counseling
early, particularly by middle school. Middle school is a critical point at which they
must begin taking the necessary academic trajectory to prepare for college.
School and college counselors are essential to students because the counselors
improve student access to information about college and career options.
The student-to-college-counseling ratio is based on both the number of
counselors who solely provide college counseling services and those who
provide college counseling services among other services, thus it overestimates
the focus on college counseling. The data for the student-to-college-counselor
ratio are from an annual survey by the National Association for College
Admission Counseling (NACAC). As with data from any survey, responses are
requested from a sample of the population, and of those from whom responses
are solicited, only a small percentage respond to the request. The sample
for the 2009 NACAC Counseling Trends Survey is somewhat unique in that
private, nonparochial schools are overrepresented and private, parochial schools
are underrepresented.
0
110
220
330
440
550
2005 2006 2007 2008 2009
383358
321 331325
348 345311 316
320
214
300254 250
283
Public
Private
Total
National Student-to-College-Counselor Ratio by School Type, 2005–2009Source: NACAC State of College Admission, 2006–2010
2.1c New fi gure
Recommendation Two 48

completionagenda.collegeboard.org
Statewide Comprehensive School Counseling ProgramsWhat is this measure, and why is this measure important? This measure
is the percentage of states whose pre-K–12 schools offer a statewide
comprehensive school counseling program. A comprehensive school counseling
program is one in which a plan or framework is in place that provides a
structured program and guidelines for school counselors such that counselors
are able to work with all students on career, academic and personal/social
development. Monitoring the existence of such programs is important in
order to understand how many states encourage school counselors to provide
support, encouragement and guidance to students, particularly in helping
students prepare for and succeed in college.
What are the policy issues associated with this measure? While most states
have a comprehensive school counseling program, many school counselors
are often assigned to complete auxiliary tasks. The American School Counselor
Association (ASCA) recommends appropriate and inappropriate work activities
for school counselors.20 Some appropriate activities include academic planning,
interpretation of achievement tests, and advocating for students at individual
education plan meetings. Some inappropriate activities for counselors include
registration and scheduling of all new students, performing of disciplinary
actions, clerical record keeping and teaching classes when teachers are absent.
State policies should make an effort to remind and encourage teachers,
school administrators and other school offi cials to allow school counselors
the opportunity to participate in appropriate activities as suggested by ASCA
and to implement the national model of comprehensive school counseling.21
State policies should also make an effort to move toward the development of a
measure and collection of data that will determine the level of implementation
of the comprehensive school counseling programs in the state.
Where are we now? As of 2009, 36 states (70.6 percent) have a statewide
comprehensive school counseling program (Figure 2.2). The District of
Columbia and 14 states (29.4 percent) do not have a comprehensive school
counseling program.
20. American School Counselor Association, “Appropriate and inappropriate activities for school
counselors,” Retrieved from American School Counselor Association website on Feb. 2, 2010:
http://www.schoolcounselor.org/fi les/appropriate.pdf, 2008, 1.
21. American School Counselor Association, ASCA National Model. Retrieved March 5, 2010,
from ASCA website: http://www.ascanationalmodel.org/
70.6% As of 2009, 36 states have a statewide comprehensive school counseling program.
7.8ppts 2008–2009
49

completionagenda.collegeboard.org
When interpreting this measure, what should be kept in mind? Currently, no rigorous data are regularly available for the percentage of students
who have access to college counseling in middle and high school. Although
estimates for the student-to-counselor ratio are available, these estimates
do not take into account the myriad functions fi lled by contemporary school
counselors in addition to college counseling. Disciplinary issues, scheduling
and other guidance issues tend to crowd the schedule for the nation’s middle
and high school counselors, leaving little time to implement the ASCA national
model. Policymakers and educators must discuss ways to create a measure
that can gauge the degree to which students have access to high-quality college
counselors. Further, it is believed that more data must be collected on the
interactions between counselors and students.
States with Comprehensive School Counseling ProgramsSource: American School Counselor Association, 2011
2.2
YES 71%
NO 29%
YESAlabamaAlaskaArizonaArkansasConnecticutDelawareFloridaGeorgiaIdahoIllinoisIndianaIowaKansasLouisianaMaineMassachusettsMichiganMissouri
MontanaNebraskaNew HampshireNew JerseyNew MexicoNew YorkNorth CarolinaOklahomaOregonRhode IslandSouth CarolinaSouth DakotaTennesseeTexasUtahVirginiaWest VirginiaWisconsin
NO CaliforniaColoradoDistrict of ColumbiaHawaiiKentuckyMarylandMinnesotaMississippiNevadaNorth DakotaOhioPennsylvaniaVermontWashingtonWyoming
Recommendation Two 50

completionagenda.collegeboard.org
Professional Development for Secondary School CounselorsWhat is this measure, and why is this measure important? The continued
development or education of employees is a common practice across many
professions. Professional development is critical to a counselor’s ability to
provide students with current and complete access to resources for preparing
for college. This indicator measures the percentage of secondary schools that
require their counselors to participate in professional development. The measure
also gives the percentage of schools that cover all of the costs associated with
the required professional development.
What are the policy issues associated with this measure?
Although schools, districts and states require counselors to participate in
professional development, many of them do not provide the necessary funding
to enroll in courses. Policymakers should ensure that budget appropriations are
adequate to support the cost of the required professional development for all
counselors, such that counselors are not making choices related to professional
development based on convenience as opposed to quality/content. Support
for school counselors to attend professional development activities related
to college counseling may increase the potential for counselors to provide
students with the most current and useful information about college.
Where are we now? As of 2009, 31.2 percent of secondary schools require
school counselors to participate in professional development (Figure 2.3a). This
is a substantial drop from 45.1 percent in 2006. A higher percentage of private
schools (50.6 percent) than public schools (28.5 percent) require counselors to
participate in professional development. The trend decreases from 41.0 percent
in 2006 to 28.5 percent in 2009 for the percentage of public schools that require
counselors to participate in professional development. The trend varies more
over time for the percentage of private schools that require counselors to
participate in professional development.
The trend decreases from 50.5 percent in 2006 to 32.2 percent in 2009 for
the percentage of schools that cover all costs associated with professional
development (Figure 2.3b). This decreasing trend is also true for the percentage
of public and private schools that cover all costs associated with professional
development. However, a higher percentage of private schools provide their
counselors with support for professional development. The range in the
percentage of schools that support counselor professional development is
between 67.2 percent and 79.4 percent.
When interpreting this measure, what should be kept in mind? Another important aspect of professional development is maintaining fi delity
when implementing ideas, services and products by the trainees. Currently, the
nation lacks a measure to assess the effectiveness of professional development
for school counselors; an understanding of the variety, or lack thereof, of
professional development opportunities for counselors; and an understanding
31.2% As of 2009, 31.2 percent of secondary schools require counselors to participate in professional development.
8.7ppts 2008–2009
32.2% As of 2009, 32.2 percent of secondary schools cover all professional development costs.
2.8ppts 2008–2009
51

completionagenda.collegeboard.org
of the percentage of counselor professional development that is specifi c to
college counseling. It is unknown whether the common practices of a school
counselor change after participating in professional development related to
career and college readiness counseling. This indicator does not eliminate the
gap in the data; however, it will indirectly provide information about the level of
importance placed on professional development by schools, districts and states.
0
10
20
30
40
50
60
70
80
2006 2007 2008 2009
60.1%
41.0%
45.1%49.2%
36.6%
34.2%
61.3%
35.0%
39.9%
50.6%
28.5%
31.2%
Public
Private
Total
Percentage of Secondary Schools That Require Professional Development by School Type, 2006–2009Source: NACAC State of College Admission, 2007–2010
2.3a
0
10
20
30
40
50
60
70
80
2006 2007 2008 2009
79.4%
41.2%
50.5%
70.3%
39.2%
33.3%
72.2%
31.7%
39.2%
67.2%
27.6%
32.2%
Public
Private
Total
Percentage of Secondary Schools That Cover All Professional Development Costs by School Type, 2006–2009Source: NACAC State of College Admission, 2007–2010
2.3b
Recommendation Two 52

completionagenda.collegeboard.org
Percentage of Counselors’ Time Spent on TasksWhat is this measure, and why is this measure important? The day-to-
day role and responsibilities of the school counselor can vary from building
to building. This measure presents the average percentage of time spent
on various tasks. The measure seeks to raise awareness of the roles and
responsibilities of school counselors and, in particular, how often the counselors
are engaged in postsecondary admission counseling. It is important to monitor
the amount of time spent on postsecondary education to ensure that students
are receiving the information, services and support they need to gain access
to college.
What are the policy issues associated with this measure? When administrators gain a thorough understanding of the most appropriate
roles and responsibilities,22 they will be able to advocate for the tools necessary
for school counselors to fulfi ll their duties. Policymakers are encouraged to use
this measure in combination with the others presented in this recommendation
to ensure that there are no confl icting policies that will prevent school
counselors from working to the best of their ability.
Where are we now? The national trend is decreasing from 38.8 percent in
2006 to 26.0 percent in 2009 for the percentage of school counselors’ time spent
on postsecondary admission counseling (Figure 2.4a). The public school trend
is decreasing from 28.0 percent to 22.3 percent for the percentage of school
counselors’ time spent on postsecondary admission counseling. The private
school trend is decreasing from 60.8 percent to 53.6 percent for counselors’
time spent on postsecondary admission counseling. The nature of the public and
private school counselor’s roles differ tremendously. For example, while many
public school survey respondents are general school counselors, many of the
private school survey respondents are specifi cally college counselors.
School counselors spend their time providing postsecondary admission
counseling (26.0 percent), scheduling high school courses (23.7 percent),
providing personal needs counseling (19.5 percent) and administering various
levels of academic testing (14.0 percent; Figure 2.4b). School counselors
from public schools are similar to the general population; they spend their
time scheduling high school courses (25.1 percent), providing postsecondary
admission counseling (22.3 percent), providing personal needs counseling
(20.5 percent) and administering various levels of academic testing (14.7
percent). School counselors in private schools focus on providing postsecondary
admission counseling (53.6 percent). The next largest categories for private
school counselors are scheduling high school courses (12.8 percent) and
providing personal needs counseling (11.5 percent).
22. American School Counselor Association, “Appropriate and inappropriate activities for school counselors,”
Retrieved from American School Counselor Association website on Feb. 2, 2010:
http://www.schoolcounselor.org/fi les/appropriate.pdf, 2008.
26.0% As of 2009, counselors spend 26.0 percent of their time on postsecondary admission counseling.
2.8ppts 2008–2009
53

completionagenda.collegeboard.org
0
10
20
30
40
50
60
70
80
2006 2007 2008 20092004 2005
60.8%
28.0%
38.8%
57.8%
32.2%
24.6%
56.4%
22.9%
29.9%
57.5%
23.1%
28.7%
54.4%
22.8%
28.8%
53.6%
22.3%
26.0%
Public
Private
Total
Percentage of Counselors’ Time Spent on Postsecondary Admission Counseling by School Type, 2004–2009Source: NACAC State of College Admission, 2005–2010
2.4a
0
10
20
30
40
50
60
70
80
PostsecondaryAdmissionCounseling
Choice andSchedulingHS Courses
PersonalNeeds
Counseling
AcademicTesting
OccupationalCounseling andJob Placement
Teaching OtherNon-Guidance
Activities
22.3
%
53.6
%
26.0
%
25.1
%
12.8
%
23.7
%
20.5
%
11.5
% 19.5
%
14.7
%
9.2% 14
.0%
7.6%
2.6% 7.
0%
4.8% 5.6%
4.9%
5.0%
4.7%
4.9%
Public
Private
Total
Percentage of Counselors’ Time Spent on Tasks by School Type, 2009Source: NACAC State of College Admission, 2010
2.4b
Recommendation Two 54

completionagenda.collegeboard.org
When interpreting this measure, what should be kept in mind? The percentage of time a school counselor spends on one task can vary
depending on the grade levels assigned to the school counselor. This measure
looks primarily at secondary school counselors; it does not account for the
role of the elementary school counselor. Caution should also be taken when
interpreting this measure because it is not all inclusive of every task a school
counselor must undertake. This measure reports the most common tasks
for school counselors. The American School Counselor Association highlights
all of the tasks in which a school counselor should be competent.23 ASCA
recommends counselors address the educational, vocational and personal/
social development of students. When counselors spend more time on
college counseling, there is less time to meet the demands of the other areas
recommended by ASCA.
Eight Components of College and Career Readiness CounselingWhat is this measure, and why is this measure important? Eight Components of College and Career Readiness Counseling24 is a
comprehensive, systematic counseling approach for students in K–12 schools.
The approach as described in this measure is especially important for traditionally
underrepresented students because it provides them with access to information
and resources to help prepare for college opportunity and success.
What are the policy issues associated with this measure? There are other
highly structured programs offering college counseling services to students
that are supported by institutions of higher education and state and federal
governments. Some of the programs include the following: Mathematics,
Engineering, Science Achievement (MESA); AVID; Upward Bound; “I Have
A Dream”; Puente; College Summit; GEAR UP; and other local programs.
The above-mentioned programs target specifi c groups of students and are
attractive to students when states, districts and schools are experiencing
budget cuts, which often lead to the elimination of a school counselor position.
When counseling positions are eliminated in schools, it is more diffi cult for the
remaining counselors to implement the eight components and prepare students
for college and career success.
Where are we now? The Eight Components of College and Career Readiness
Counseling, released in April 2010 at the annual conference of the National
Offi ce for Student Counselor Advocacy, should be applied by counselors in
23. American School Counselor Association, “School Counselor Competencies.” Retrieved on Feb. 2, 2010, from
the ASCA website: http://www.schoolcounselor.org/fi les/SCCompetencies.pdf
24. Eight Components of College and Career Readiness Counseling. Retrieved June 1, 2011, from
http://advocacy.collegeboard.org/sites/default/fi les/10b_2217_EightComponents_WEB_100625.pdf
55

completionagenda.collegeboard.org
elementary, middle and high schools across the nation in developmentally
appropriate formats. The eight components are:
1. College Aspirations — Increase student awareness to inspire them to
attend college;
2. Academic Planning for College and Career Readiness — Help students
plan and prepare for rigorous K–12 course work that will prepare them
for college;
3. Enrichment and Extracurricular Engagement — Encourage students
to participate in activities to build their character and increase student
engagement;
4. College and Career Exploration and Selection Processes — Expose
students to a variety of colleges and careers;
5. College and Career Assessments — Promote student preparation and
participation in college and career assessments;
6. College Affordability Planning — Provide resources to help students fi nd
funding for college;
7. College and Career Admission Processes — Provide students with
information about college application requirements and deadlines for
completion; and
8. Transition from High School Graduation to College Enrollment —
Provide support for students to help them complete the fi nal steps for
enrollment in college after high school graduation.
When interpreting this measure, what should be kept in mind? This indicator requires counselors to implement models that are equitable for
the students they serve. This means the method of implementation may vary
from student to student and from school to school. There are no measures
to evaluate the effi cacy of the components of college and career counseling.
An examination of the effi cacy of the components will allow counselors to
demonstrate a need for their skills in a school building, thus reducing the
possibility of losing their jobs.
In addition, policymakers and counselors should be aware that the components
in this indicator are not the only approaches for creating a college-going culture.
For example, Tierney and Hagedorn wrote a guide for improving college
preparation programs.25 The guide describes a college preparation model and
nine strategies for improving program effectiveness. The University of California
provides ideas about how to create a college-going culture; many of the ideas
are specifi c to California schools, but the concepts related to creating a college-
going culture may be applied in various settings.26 In addition, Tierney, Corwin
and Colyar edited a book that describes nine elements of effective outreach
with the intent of preparing students for college.27 Schools, districts and/or
states should work to fi nd the best approach for their students.
25. Tierney, W., and Hagedorn, L. (2002). Making the Grade in College Prep. Retrieved June 2, 2011, from
http://www.usc.edu/dept/chepa/pdf/makinggrade.pdf
26. University of California Los Angeles. Advancing College-Going: What Is a College-Going Culture?
Retrieved June 2, 2011, from http://collegetools.berkeley.edu/resources.php?cat_id=6
27. Tierney, W., Corwin, Z., and Colyar, J. (2005). Preparing for College (Albany: State University of
New York Press).
Recommendation Two 56

ThreeImplement the best research-based dropout prevention programs
WE RECOMMEND that states and local educational agencies adopt targeted interventions (starting in elementary and middle schools) focused on early warning signs of students in danger of dropping out in order to identify such students and put an “educational safety net” under them.

completionagenda.collegeboard.org
Measuring and understanding the numerous factors associated with dropping
out of school is daunting, and fi nding solutions to this problem is just as
challenging. The commission suggests that educators pay close attention to the
early warning signs of dropping out and that state and local educators take the
lead in implementing dropout prevention programs.
To develop an effective dropout prevention program, it is important to study
the trends and patterns of students who drop out of school in this country.
Specifi cally, it is important to know whether the dropout rate is increasing or
decreasing and which students are most likely to drop out of high school.
The following indicators can aid legislators in understanding these questions:
• Graduation rates of public high school students;
• National status dropout rates — excluding institutional populations;
• National status dropout rates — including institutional populations; and
• National event dropout rates.
Understanding the Difference: Status Versus Event DropoutThe status rates show the percentage of the population in a given age range
who have not fi nished high school or are not enrolled in school at a given point
in time. In contrast, the event dropout rates refl ect the percentage of students
who drop out of grades nine through 12 within a single year without completing
high school. Status dropout rates are generally higher than event rates, since
they refl ect the number of students in a given age range who have dropped
out of school over a number of years, rather than in a one-year snapshot. For
example, the status dropout rate (excluding institutionalized persons) was 8.0
percent in 2008, while the national event dropout rate in grades nine through 12
for 2008 was 4.1 percent.
Recommendation Three 58

completionagenda.collegeboard.org
General Findings for This Recommendation • As of 2008, 74.9 percent of students who enter public high school as
freshmen graduate within four years.
• As of 2008, 61.5 percent of African American students who enter public
high school as freshmen graduate with a high school diploma.
• As of 2008, 63.5 percent of Hispanic students who enter public high school
as freshmen graduate with a high school diploma.
• As of 2008, 64.2 percent of Native American students who enter public high
school as freshmen graduate with a high school diploma.
• As of 2008, 91.4 percent of Asian students who enter public high school as
freshmen graduate with a high school diploma.
• As of 2010, 25 states require exit examinations for students to earn a high
school diploma.
• As of 2010, 10 states use end-of-course examinations as the exit exam to
earn a high school diploma.
• As of 2010, seven states allow credit for exit examinations taken in other
states to earn a high school diploma.
• As of 2010, 12 states have substitute exit examination assessments to allow
students to earn a high school diploma.
• As of 2010, nine states have an alternative diploma or certifi cate that
students can earn in the place of a high school diploma.
• As of 2008, status dropouts account for 8.0 percent of the 37.6 million
noninstitutionalized civilians ages 16 to 24 living in the nation.
• As of 2008, the noninstitutional status dropout rate of American Indians or
Alaska Natives is 14.6 percent.
• As of 2008, the noninstitutional status dropout rate of Hispanics is 18.3
percent.
• As of 2008, the status dropout rate is 9.1 percent for 16- to 24-year-olds
(including institutional populations).28
• As of 2008, the status dropout rate for Hispanics is 19.0 percent (including
institutional populations).
• As of 2008, the status dropout rate for American Indians or Alaska Natives
is 16.3 percent (including institutional populations).
• As of 2008, the status dropout rate for African Americans is 10.4 percent
(including institutional populations).
• As of 2008, the status dropout rate for Asians is 3.2 percent (including
institutional populations).
28. The status dropout rate represents the percentage of 16- through 24-year-olds who are not enrolled in school
and have not earned a high school credential.
59

completionagenda.collegeboard.org
• As of 2008, the status dropout rate for whites is 6.2 percent (including
institutional populations).
• As of 2008, the national event dropout rate is 4.1 percent for public high
school students in grades nine through 12.29
• As of 2010, 19 states have a legal age of 16 for students to legally drop out
of school.
• As of 2010, 11 states have a legal age of 17 for students to legally drop out
of school.
• As of 2010, 21 states have a legal age of 18 for students to legally drop out
of school.
• As of 2008, the event dropout rate for African Americans is 6.7 percent.
• As of 2008, the event dropout rate for American Indians or Alaska Natives
is 7.3 percent.
• As of 2008, the event dropout rate for Asian or Pacifi c Islanders is 2.4
percent.
• As of 2008, the event dropout rate for Hispanics is 6.0 percent.
• As of 2008, the event dropout rate for whites is 2.0 percent.
29. The event dropout rate represents the proportion of public high schools students who drop out of grades nine
through 12 in a 12-month period.
Recommendation Three 60

completionagenda.collegeboard.org
Graduation Rates of Public High School StudentsWhat is this measure, and why is this measure important? This measures
the percentage of students who enter public high school as freshmen and
graduate with a diploma in four years. The measure is important in assessing
whether students are completing high school within four years. Graduation
rates of public high school students also show whether adequate supports are
in place to graduate students.
This indicator also provides the states that require exit examinations, states that
use end-of-course tests as the exit examinations, states that allow reciprocity
with other states’ exit examinations, states that allow substitute assessments
to count for exit examinations, and states that allow graduates to obtain
alternative credentials or diplomas. These measures are important for allowing
the reader to understand the differences in policies that exist among states that
can directly affect the graduation rates of students.
What are the policy issues associated with this measure? In order to
understand the dropout problem, it is important to know the percentage of
students who enter high school as freshmen and graduate on time with a
diploma. This will help policymakers gauge the success of high schools in
getting students from the beginning of freshman year to the end of senior year
in a timely manner. Reducing the dropout rate and increasing the graduation
rate in each state will ensure that students will be eligible for postsecondary
options in higher education and in the workforce.
While not all states require exit examinations, many states do provide these
exams. However, the implementation of exit examinations and the accompanying
policies associated with exit examinations vary signifi cantly by state. While exit
examinations can inhibit students from graduating, some states accompany
these exit exams with other policies that provide opportunities for students to
show competency and obtain a high school diploma. However, other states allow
exit exams to serve as the sole determinant of graduation without accompanying
policies that allow students who fail these exams to earn diplomas.
Where are we now? As of 2008, 74.9 percent of all students in the United
States who enter public high school as freshmen graduate on time (Figure 3.1a).
The national graduation rate is relatively stable since 2003, peaking at 75.0
percent in 2004.
Despite the slight gain in the overall graduation rate, the racial gaps in
graduation rates remain strikingly large (Figure 3.1b). With African American,
Hispanic, and American Indian or Alaska Native students from the class of
2008 graduating at rates of no more than 64.2 percent, a gap of as much
74.9% As of 2008, 74.9 percent of students who enter public high school as freshmen earn a high school diploma within four years.
1.5ppts 2007–2008
61.5% As of 2008, 61.5 percent of African American students who enter public high school as freshmen graduate with a high school diploma.
1.2ppts 2007–2008
63.5% As of 2008, 63.5 percent of Hispanic students who enter public high school as freshmen graduate with a high school diploma.
1.2ppts 2007–2008
61

completionagenda.collegeboard.org
0
10
20
30
40
50
60
70
80
90
100
2003 2004 2005 2006 2007 2008
73.9% 75.0% 74.7% 73.2% 73.9% 74.9%
National Average Graduation Rates for Public High School Students, 2003–2008Source: NCES, Public School Graduates and Dropouts From the Common Core of Data: School Year 2007-08, 2010Note: This is based on the percentage of public high school students who enter school as freshmen and graduate in four years.
3.1a64.2% As of 2008, 64.2 percent of Native American students who enter public high school as freshmen graduate with a high school diploma.
2.9ppts 2007–2008
91.4% As of 2008, 91.4 percent of Asian students who enter public high school as freshmen graduate with a high school diploma.
2007–2008
49.0% As of 2010, 25 states require exit examinations for students to earn a high school diploma.
0
10
20
30
40
50
60
70
80
90
100
AfricanAmerican
AmericanIndian/
Alaska Native
Asian/Pacific Islander
Hispanic White
89.9
%
156,687
138,589
144,675
61.8
%
31,707
29,724
28,060
59.1
%
60.3
%
61.5
%
61.4
%
443,328
376,396
377,499
80.6
%
1,853,476
1,723,915
1,634,143
80.3
%
81.0
%
61.3
%
64.2
%
91.4
%
91.4
%
62.3
%
63.5
%
415,111
374,075
335,746
New indicator for 2011
National Average Graduation Rates for Public High School Students by Race/Ethnicity, 2006–2008Source: NCES, Public School Graduates and Dropouts From the Common Core of Data, 2008–2010Note: (1) This is based on the percentage of public high school students who enter school as freshmenand graduate in four years. (2) Race categories exclude Hispanic origin unless specifi ed.
3.1b 2008
2007
2006
Recommendation Three 62

completionagenda.collegeboard.org
Average Graduation Rates for Public High School Students by State Rank, 2008Source: NCES, Public School Graduates and Dropouts From the Common Core of Data: School Year 2007-08, 2010Note: (1) NA is not available. State or jurisdiction did not report diploma count. (2) Maine reported 1,161 diplomas that were awarded to students attending private high schools who received a majority of their funding from public sources. These 1,161 diplomas were included in Maine and the Reporting States counts but were not included in the graduation rate calculations for the state and for the reporting states total. The diploma counts used to calculate the graduation rates for Maine and for the United States were 13,189 and 2,964,125, respectively. (3) This is based on the percentage of public high school students who enter school as freshmen and graduate in four years.
3.1c
0 10 20 30 40 50 60 70 80 90 100
Wisconsin
Vermont
Iowa
Minnesota
New Jersey
South Dakota
Nebraska
North Dakota
New Hampshire
Pennsylvania
Missouri
Connecticut
Montana
Massachusetts
Illinois
Maryland
Idaho
Kansas
Maine
Ohio
Oklahoma
West Virginia
Virginia
Oregon
Arkansas
Rhode Island
Michigan
Hawaii
Wyoming
Colorado
Tennessee
UNITED STATES
Kentucky
Utah
Indiana
Texas
North Carolina
Delaware
Washington
California
New York
Arizona
Alaska
Alabama
Florida
New Mexico
Georgia
Mississippi
Louisiana
District of Columbia
Nevada
South Carolina
89.6%
89.3%
86.4%
86.4%
84.6%
84.4%
83.8%
83.8%
83.4%
82.7%
82.4%
82.2%
82.0%
81.5%
80.4%
80.4%
80.1%
79.1%
79.1%
79.0%
78.0%
77.3%
77.0%
76.7%
76.4%
76.4%
76.3%
76.0%
76.0%
75.4%
74.9%
74.9%
74.4%
74.3%
74.1%
73.1%
72.8%
72.1%
71.9%
71.2%
70.8%
70.7%
69.1%
69.0%
66.9%
66.8%
65.4%
63.9%
63.5%
56.0%
51.3%
NA
65,183
7,392
34,573
60,409
94,994
8,582
20,035
6,999
14,982
130,298
61,717
38,419
10,396
65,197
135,143
59,171
16,567
30,737
14,350
120,758
37,630
17,489
77,369
34,949
28,725
10,347
115,183
11,613
5,494
46,082
57,486
2,965,286
39,339
28,167
61,901
252,121
83,307
7,388
61,625
374,561
176,310
61,667
7,855
41,346
149,046
18,264
83,505
24,795
34,401
3,352
17,149
NA
31
U.S. Average
19*
States
States
No. ofStudents
AVG
74.9%
* Indicator data not available for all states.
63

completionagenda.collegeboard.org
19.6%As of 2010, 10 states use end-of-course examinations as the exit exam to earn a high school diploma.
13.7% As of 2010, 7 states allow credit for exit examinations taken in other states to earn a high school diploma.
as 29 percentage points divide these historically underserved students of
color/underrepresented populations from their Asian/Pacifi c Islander peers.
The gap between the underserved students and their white peers is 16.8
percentage points.
When disaggregated by state, the average freshman graduation rate for public
high school students ranges from 51.3 percent in Nevada to 89.6 percent in
Wisconsin (Figure 3.1c). When placed in rank order, the states with the highest
graduation rates are Wisconsin, Vermont, Iowa, Minnesota and New Jersey.
The states with the lowest graduation rates are Nevada, the District of
Columbia, Louisiana, Mississippi and Georgia.
The average freshman graduation rate for Asian American or Pacifi c Islander
public high school students ranges from 73.5 percent in Utah to 100.0 percent
in 12 states (Figure 3.1d). When placed in rank order, the states with the highest
graduation rates for Asian American or Pacifi c Islander students are Arkansas,
Illinois, Indiana, Kentucky, Maryland, Missouri, Montana, New Jersey, New
Mexico, Oklahoma, Pennsylvania and West Virginia (Figure 3.1d). The states
with the lowest graduation rates for these students are Utah, Rhode Island,
the District of Columbia, Alaska and Hawaii.
The average freshman graduation rate for American Indian or Alaska Native public
high school students ranges from 38.5 percent in Wyoming to 100.0 percent
in the District of Columbia and New Jersey (Figure 3.1e). When placed in rank
order, the states with the highest graduation rates for American Indian or Alaska
Native students are the District of Columbia, New Jersey, Illinois, Missouri and
Arkansas (Figure 3.1e). The states with the lowest graduation rates for these
students are Wyoming, North Dakota, Washington, Kentucky and South Dakota.
The average freshman graduation rate for African American public high school
students ranges from 51.8 percent in Alaska to 100.0 percent in New Hampshire
(Figure 3.1f). When placed in rank order, the states with the highest graduation
rates for African American students are New Hampshire, North Dakota, Vermont,
South Dakota and Idaho (Figure 3.1f). The states with the lowest graduation rates
for these students are Alaska, Indiana, Louisiana, Utah and New York.
The average freshman graduation rate for Hispanic public high school students
ranges from 48.1 percent in New Hampshire to 100.0 percent in Vermont (Figure
3.1g). When placed in rank order, the states with the highest graduation rates for
Hispanic students are Vermont, Alaska, West Virginia, Missouri and Arkansas. The
states with the lowest graduation rates for these students are New Hampshire,
Utah, New York, the District of Columbia and Georgia.
The average freshman graduation rate for white public high school students
ranges from 67.0 percent in Mississippi to 94.0 percent in Wisconsin (Figure
3.1h). When placed in rank order, the states with the highest graduation rates
for white students are Wisconsin, Minnesota, District of Columbia, Nebraska
and New Jersey (Figure 3.1h). The states with the lowest graduation rates are
Mississippi, Florida, Alaska, Georgia and Louisiana.
Recommendation Three 64

completionagenda.collegeboard.org
0 10 20 30 40 50 60 70 80 90 100
Arkansas
Illinois
Indiana
Kentucky
Maryland
Missouri
Montana
New Jersey
New Mexico
Oklahoma
Pennsylvania
West Virginia
New Hampshire
Virginia
Connecticut
Texas
Arizona
Wyoming
Nebraska
Wisconsin
South Dakota
Ohio
Michigan
Tennessee
Kansas
Iowa
Georgia
Colorado
Idaho
Florida
UNITED STATES
Oregon
California
Massachusetts
Mississippi
Minnesota
Alabama
North Carolina
Louisiana
North Dakota
Washington
New York
Vermont
Hawaii
Alaska
District of Columbia
Rhode Island
Utah
Maine
Delaware
Nevada
South Carolina
100.0%
100.0%
100.0%
100.0%
100.0%
100.0%
100.0%
100.0%
100.0%
100.0%
100.0%
100.0%
99.2%
99.1%
99.0%
98.6%
98.5%
98.5%
97.8%
97.5%
97.4%
95.3%
94.8%
94.3%
93.4%
93.2%
92.9%
92.1%
91.5%
91.4%
91.4%
91.2%
91.1%
89.1%
88.3%
87.9%
87.3%
86.9%
86.1%
85.9%
84.4%
84.2%
81.8%
77.3%
76.6%
74.4%
74.4%
73.5%
RSNM
NA
NA
NA
513
6,000
844
390
3,392
1,024
133
7,501
297
867
3,439
147
257
4,689
1,307
9,750
1,878
67
355
2,428
111
1,749
2,807
906
710
631
2,868
1,617
279
4,255
156,687
1,811
54,019
3,072
280
3,351
474
1,944
622
55
5,496
13,720
99
8,718
575
58
314
868
234
NA
1,678
NA
30
U.S. Average
17*
States
States
No. ofStudents
AVG
91.4%
Average Graduation Rates for Asian American or Pacifi c Islander Public High School Students by State Rank, 2008Source: NCES, Public School Graduates and Dropouts From the Common Core of Data: School Year 2007-08, 2010Note: (1) NA is not available. State or jurisdiction did not report diploma count by race/ethnicity. Nevada did not report membership data needed to calculate the graduation rate by race/ethnicity. (2) RSNM is Reporting standards not met. Maine reported 1,161 diplomas that were awarded to students attending private high schools who received a majority of their funding from public sources. Because the racial/ethnic breakdown of these students was not known, and because these students were not reported on Maine’s state-level reporting in the past, the graduation rate was not calculated by race/ethnicity, nor were Maine’s data included among the United States total. (3) This is based on the percentage of public high school students who enter school as freshmen and graduate in four years. (4) This race category excludes persons of Hispanic origin.
3.1d
* Indicator data not available for all states.
New fi gure
65

completionagenda.collegeboard.org
0 10 20 30 40 50 60 70 80 90 100
District of Columbia
New Jersey
Illinois
Missouri
Arkansas
Vermont
Alabama
Hawaii
Texas
Rhode Island
Oklahoma
Ohio
Wisconsin
Maryland
Georgia
Tennessee
Florida
West Virginia
Indiana
Massachusetts
Michigan
Connecticut
Idaho
California
Louisiana
UNITED STATES
Kansas
Pennsylvania
Iowa
Montana
Oregon
Colorado
New Mexico
North Carolina
New Hampshire
Mississippi
Utah
Arizona
Minnesota
New York
Virginia
Nebraska
Alaska
South Dakota
Kentucky
Washington
North Dakota
Wyoming
Maine
Delaware
Nevada
South Carolina
100.0%
100.0%
95.8%
93.2%
86.9%
83.9%
82.3%
80.3%
80.1%
78.0%
76.4%
74.1%
73.9%
73.4%
72.1%
71.9%
70.3%
70.0%
69.8%
66.8%
66.6%
65.8%
65.8%
65.3%
65.2%
64.2%
63.9%
63.8%
63.6%
63.3%
62.8%
62.0%
61.0%
60.7%
60.0%
58.0%
57.6%
56.3%
55.6%
55.5%
55.2%
55.1%
51.9%
51.3%
51.0%
50.6%
47.0%
38.5%
RSNM
NA
NA
NA
3
227
318
273
185
47
437
53
944
64
6,770
160
800
193
145
105
443
14
141
161
967
104
202
3,071
238
31,707
382
146
159
904
725
438
2,177
1,010
30
40
382
3,625
830
599
200
228
1,523
515
53
1,219
357
100
73
NA
252
NA
25
U.S. Average
22*
States
States
No. ofStudents
AVG
64.2%
3.1e
* Indicator data not available for all states.
Average Graduation Rates for American Indian or Alaska Native Public High School Students by State Rank, 2008Source: NCES, Public School Graduates and Dropouts From the Common Core of Data: School Year 2007-08, 2010Note: (1) NA is not available. State or jurisdiction did not report diploma count by race/ethnicity. Nevada did not report membership data needed to calculate the graduation rate by race/ethnicity. (2) Note: RSNM is Reporting standards not met. Maine reported 1,161 diplomas that were awarded to students attending private high schools who received a majority of their funding from public sources. Because the racial/ethnic breakdown of these students was not known, and because these students were not reported on Maine’s state-level reporting in the past, the graduation rate was not calculated by race/ethnicity, nor were Maine’s data included among the United States total. (3) This is based on the percentage of public high school students who enter school as freshmen and graduate in four years. (4) This race category excludes persons of Hispanic origin.
New fi gure
Recommendation Three 66

completionagenda.collegeboard.org
Average Graduation Rates for African American Public High School Students by State Rank, 2008Source: NCES, Public School Graduates and Dropouts From the Common Core of Data: School Year 2007-08, 2010Note: (1) NA is not available. State or jurisdiction did not report diploma count by race/ethnicity. Nevada did not report membership data needed to calculate the graduation rate by race/ethnicity. (2) RSNM is Reporting standards not met. Maine reported 1,161 diplomas that were awarded to students attending private high schools who received a majority of their funding from public sources. Because the racial/ethnic breakdown of these students was not known, and because these students were not reported on Maine’s state-level reporting in the past, the graduation rate was not calculated by race/ethnicity, nor were Maine’s data included among the United States total. (3) This is based on the percentage of public high school students who enter school as freshmen and graduate in four years. (4) This race category excludes persons of Hispanic origin.
3.1f
0 10 20 30 40 50 60 70 80 90 100
New Hampshire
North Dakota
Vermont
South Dakota
Idaho
Arizona
Rhode Island
Maryland
New Jersey
Oklahoma
West Virginia
Iowa
New Mexico
Connecticut
Arkansas
Hawaii
Massachusetts
Missouri
Kentucky
Tennessee
Minnesota
Oregon
Texas
Virginia
Colorado
Kansas
Montana
Pennsylvania
Wisconsin
North Carolina
Wyoming
Illinois
UNITED STATES
Alabama
Mississippi
Michigan
District of Columbia
Washington
California
Georgia
Nebraska
Florida
Ohio
New York
Utah
Louisiana
Indiana
Alaska
Maine
Delaware
Nevada
South Carolina
100.0%
95.1%
91.2%
88.4%
78.2%
76.9%
74.7%
73.0%
72.9%
72.4%
72.3%
71.9%
71.4%
71.1%
70.2%
69.6%
69.6%
68.0%
67.8%
67.4%
66.6%
65.8%
65.7%
65.3%
65.1%
64.7%
64.6%
64.5%
63.1%
61.9%
61.8%
61.5%
61.5%
60.6%
60.5%
59.2%
58.8%
58.2%
57.4%
57.4%
57.0%
55.7%
55.5%
54.7%
54.4%
53.3%
52.6%
51.8%
RSNM
NA
NA
NA
320
98
93
129
133
3,398
890
20,602
14,776
3,926
724
1,266
467
4,775
6,132
217
5,161
9,178
3,769
13,207
3,678
830
33,873
17,960
2,498
2,217
53
16,111
4,827
23,002
55
21,728
415,111
13,343
11,660
19,158
2,871
2,699
25,911
29,010
1,049
30,239
14,956
28,814
229
13,253
5,564
262
285
NA
1,449
NA
32
U.S. Average
15*
States
States
No. ofStudents
AVG
61.5%
* Indicator data not available for all states.
New fi gure
67
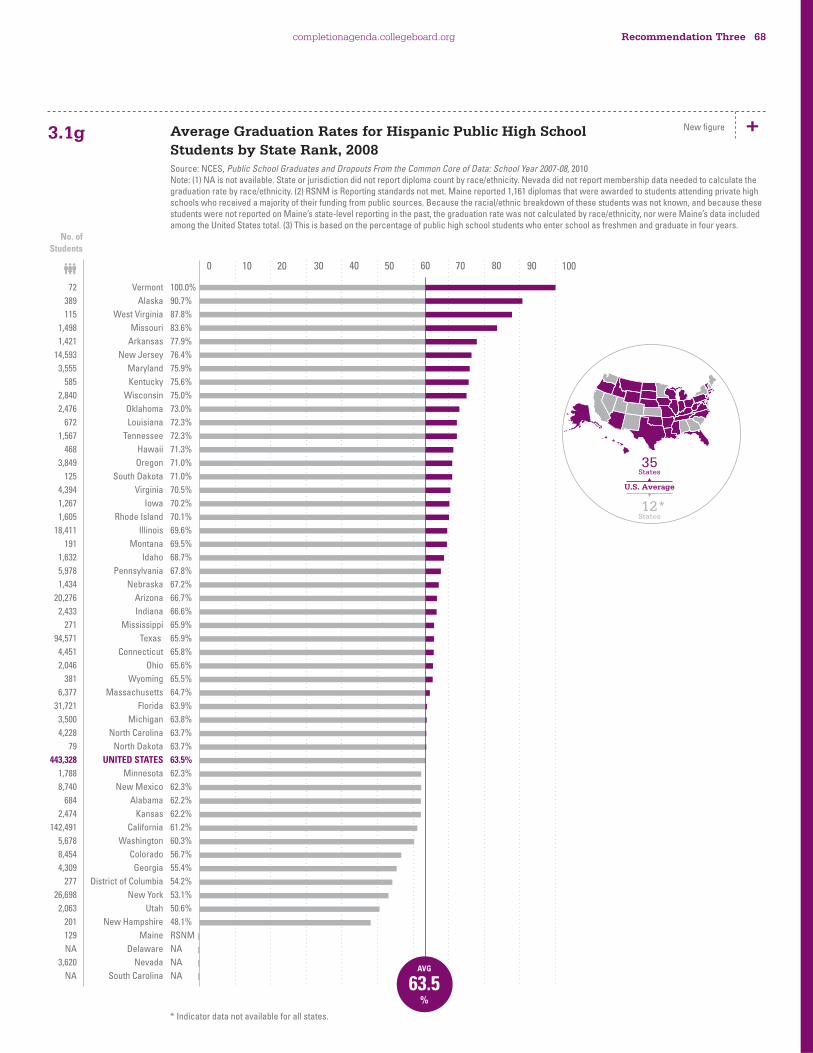
completionagenda.collegeboard.org
Average Graduation Rates for Hispanic Public High School Students by State Rank, 2008Source: NCES, Public School Graduates and Dropouts From the Common Core of Data: School Year 2007-08, 2010Note: (1) NA is not available. State or jurisdiction did not report diploma count by race/ethnicity. Nevada did not report membership data needed to calculate the graduation rate by race/ethnicity. (2) RSNM is Reporting standards not met. Maine reported 1,161 diplomas that were awarded to students attending private high schools who received a majority of their funding from public sources. Because the racial/ethnic breakdown of these students was not known, and because these students were not reported on Maine’s state-level reporting in the past, the graduation rate was not calculated by race/ethnicity, nor were Maine’s data included among the United States total. (3) This is based on the percentage of public high school students who enter school as freshmen and graduate in four years.
3.1g
0 10 20 30 40 50 60 70 80 90 100
Vermont
Alaska
West Virginia
Missouri
Arkansas
New Jersey
Maryland
Kentucky
Wisconsin
Oklahoma
Louisiana
Tennessee
Hawaii
Oregon
South Dakota
Virginia
Iowa
Rhode Island
Illinois
Montana
Idaho
Pennsylvania
Nebraska
Arizona
Indiana
Mississippi
Texas
Connecticut
Ohio
Wyoming
Massachusetts
Florida
Michigan
North Carolina
North Dakota
UNITED STATES
Minnesota
New Mexico
Alabama
Kansas
California
Washington
Colorado
Georgia
District of Columbia
New York
Utah
New Hampshire
Maine
Delaware
Nevada
South Carolina
100.0%
90.7%
87.8%
83.6%
77.9%
76.4%
75.9%
75.6%
75.0%
73.0%
72.3%
72.3%
71.3%
71.0%
71.0%
70.5%
70.2%
70.1%
69.6%
69.5%
68.7%
67.8%
67.2%
66.7%
66.6%
65.9%
65.9%
65.8%
65.6%
65.5%
64.7%
63.9%
63.8%
63.7%
63.7%
63.5%
62.3%
62.3%
62.2%
62.2%
61.2%
60.3%
56.7%
55.4%
54.2%
53.1%
50.6%
48.1%
RSNM
NA
NA
NA
72
389
115
1,498
1,421
14,593
3,555
585
2,840
2,476
672
1,567
468
3,849
125
4,394
1,267
1,605
18,411
191
1,632
5,978
1,434
20,276
2,433
271
94,571
4,451
2,046
381
6,377
31,721
3,500
4,228
79
443,328
1,788
8,740
684
2,474
142,491
5,678
8,454
4,309
277
26,698
2,063
201
129
NA
3,620
NA
35
U.S. Average
12*
States
States
No. ofStudents
AVG
63.5%
* Indicator data not available for all states.
New fi gure
Recommendation Three 68

completionagenda.collegeboard.org
Average Graduation Rates for White Public High School Students by State Rank, 2008Source: NCES, Public School Graduates and Dropouts From the Common Core of Data: School Year 2007-08, 2010Note: (1) NA is not available. State or jurisdiction did not report diploma count by race/ethnicity. Nevada did not report membership data needed to calculate the graduation rate by race/ethnicity. (2) Note: RSNM is Reporting standards not met. Maine reported 1,161 diplomas that were awarded to students attending private high schools who received a majority of their funding from public sources. Because the racial/ethnic breakdown of these students was not known, and because these students were not reported on Maine’s state-level reporting in the past, the graduation rate was not calculated by race/ethnicity, nor were Maine’s data included among the United States total. (3) This is based on the percentage of public high school students who enter school as freshmen and graduate in four years. (4) This race category excludes persons of Hispanic origin.
3.1h
0 10 20 30 40 50 60 70 80 90 100
Wisconsin
Minnesota
District of Columbia
Nebraska
New Jersey
South Dakota
Iowa
North Dakota
Illinois
Connecticut
Pennsylvania
Missouri
Maryland
Montana
Massachusetts
Ohio
New Hampshire
Colorado
New York
Kansas
Idaho
Michigan
Texas
Vermont
UNITED STATES
Virginia
California
Oklahoma
Rhode Island
Wyoming
Utah
Arkansas
North Carolina
Tennessee
West Virginia
Oregon
Indiana
New Mexico
Kentucky
Alabama
Arizona
Washington
Hawaii
Louisiana
Georgia
Alaska
Florida
Mississippi
Maine
Delaware
Nevada
South Carolina
94.0%
90.3%
88.9%
88.6%
88.3%
88.3%
88.0%
87.8%
87.7%
87.5%
86.9%
85.2%
84.9%
84.7%
84.4%
84.4%
83.3%
82.9%
82.7%
82.4%
81.7%
81.6%
81.6%
81.1%
81.0%
80.8%
80.1%
79.0%
79.0%
78.5%
77.9%
77.7%
77.3%
77.3%
77.3%
77.1%
75.9%
74.7%
74.2%
73.9%
73.6%
73.6%
72.7%
71.9%
70.7%
70.3%
70.1%
67.0%
RSNM
NA
NA
NA
54,288
50,762
144
16,969
57,702
7,707
31,250
6,410
87,097
27,782
104,355
49,744
31,429
9,115
49,566
99,936
14,174
33,075
106,219
24,349
14,321
88,225
112,983
6,408
1,853,476
49,155
141,011
23,591
7,474
4,891
24,549
20,474
51,582
41,700
16,489
26,846
51,810
6,583
34,185
26,375
32,490
45,905
2,157
19,616
45,701
4,742
79,596
12,544
13,629
NA
10,150
NA
24
U.S. Average
23*
States
States
No. ofStudents
AVG
81.0%
* Indicator data not available for all states.
New fi gure
69

completionagenda.collegeboard.org
States with Exit Examinations, 2010Source: Education Commission of the States, 2010Note: Indiana — beginning with the class of 2012, students will be required to pass end-of-course assessments instead of the GQE. Oklahoma — effective with the class of 2012.
States Where End-of-Course Exams Are Used as the Exit Exam, 2010Source: Education Commission of the States, 2010
3.1i
3.1j
YES 49.0% NO 51.0%
YESAlabama Alaska Arizona Arkansas California Florida Georgia Idaho Indiana Louisiana Maryland Massachusetts Mississippi Nevada New Jersey New Mexico New York North Carolina
Ohio Oklahoma South Carolina Tennessee Texas Virginia Washington Minnesota
NOColorado Connecticut Delaware District of Columbia Hawaii Illinois Iowa Kansas
Kentucky Maine Michigan Missouri Montana Nebraska New Hampshire North Dakota Oregon Pennsylvania Rhode Island South Dakota Utah Vermont West Virginia Wisconsin Wyoming
YES 19.6%
NO 31.4%
NO EXIT
EXAM 49.0%
YESArkansas Maryland Mississippi New York North Carolina Oklahoma South Carolina Tennessee Texas Virginia
NOAlabama Alaska Arizona California Florida Georgia Idaho Indiana Louisiana Massachusetts Minnesota Nevada New Jersey New Mexico Ohio Washington
NO EXIT EXAMColorado Connecticut Delaware District of Columbia Hawaii Illinois Iowa Kansas Kentucky Maine Michigan Missouri Montana Nebraska New Hampshire North Dakota Oregon Pennsylvania Rhode Island South Dakota Utah Vermont West Virginia Wisconsin Wyoming
New fi gure
New fi gure
Recommendation Three 70

completionagenda.collegeboard.org
States That Have Reciprocity with Other States’ Exit Exams, 2010Source: Education Commission of the States, 2010
States with Substitute Assessments, 2010Source: Education Commission of the States, 2010
3.1k
3.1l
NO 37.3%
YES
13.7%
NO EXIT
EXAM 49.0%
YESAlaska Arizona Idaho Indiana Maryland Mississippi Ohio
NOAlabama Arkansas California Florida Georgia Louisiana Massachusetts Minnesota Nevada New Jersey New Mexico New York North Carolina Oklahoma South Carolina Tennessee Texas Virginia Washington
NO EXIT EXAMColorado Connecticut Delaware District of Columbia Hawaii Illinois Iowa Kansas Kentucky Maine Michigan Missouri Montana Nebraska New Hampshire North Dakota Oregon Pennsylvania Rhode Island South Dakota Utah Vermont West Virginia Wisconsin Wyoming
New fi gure
New fi gure
NO 27.5%
YES 23.5%
NO EXIT
EXAM 49.0%
YESAlabama Arkansas Florida Idaho Maryland New Jersey New Mexico New York North Carolina Texas Virginia Washington
NOAlaska Arizona California Georgia Indiana Louisiana Massachusetts Minnesota Mississippi Nevada Ohio Oklahoma South Carolina Tennessee
NO EXIT EXAMColorado Connecticut Delaware District of Columbia Hawaii Illinois Iowa Kansas Kentucky Maine Michigan Missouri Montana Nebraska New Hampshire North Dakota Oregon Pennsylvania Rhode Island South Dakota Utah Vermont West Virginia Wisconsin Wyoming
71
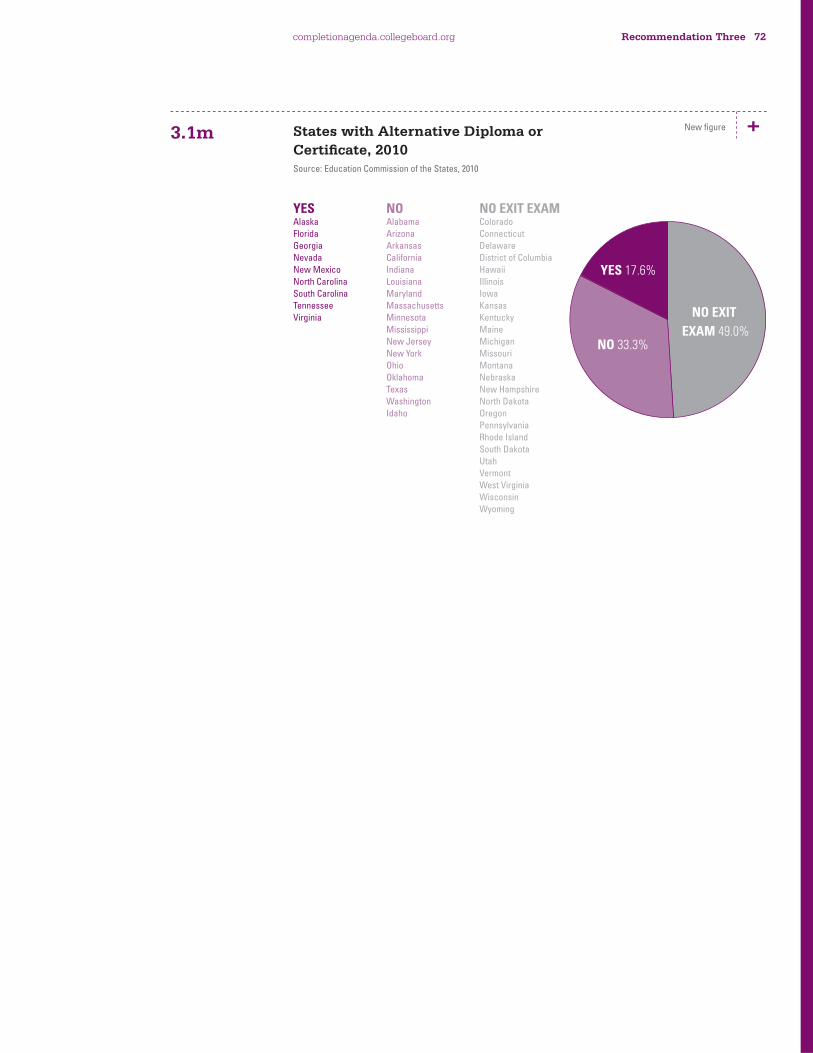
completionagenda.collegeboard.org
States with Alternative Diploma or Certifi cate, 2010Source: Education Commission of the States, 2010
3.1m
NO 33.3%
YES 17.6%
NO EXIT
EXAM 49.0%
YESAlaska Florida Georgia Nevada New Mexico North Carolina South Carolina Tennessee Virginia
NOAlabama Arizona Arkansas California Indiana Louisiana Maryland Massachusetts Minnesota Mississippi New Jersey New York Ohio Oklahoma Texas Washington Idaho
NO EXIT EXAMColorado Connecticut Delaware District of Columbia Hawaii Illinois Iowa Kansas Kentucky Maine Michigan Missouri Montana Nebraska New Hampshire North Dakota Oregon Pennsylvania Rhode Island South Dakota Utah Vermont West Virginia Wisconsin Wyoming
New fi gure
Recommendation Three 72
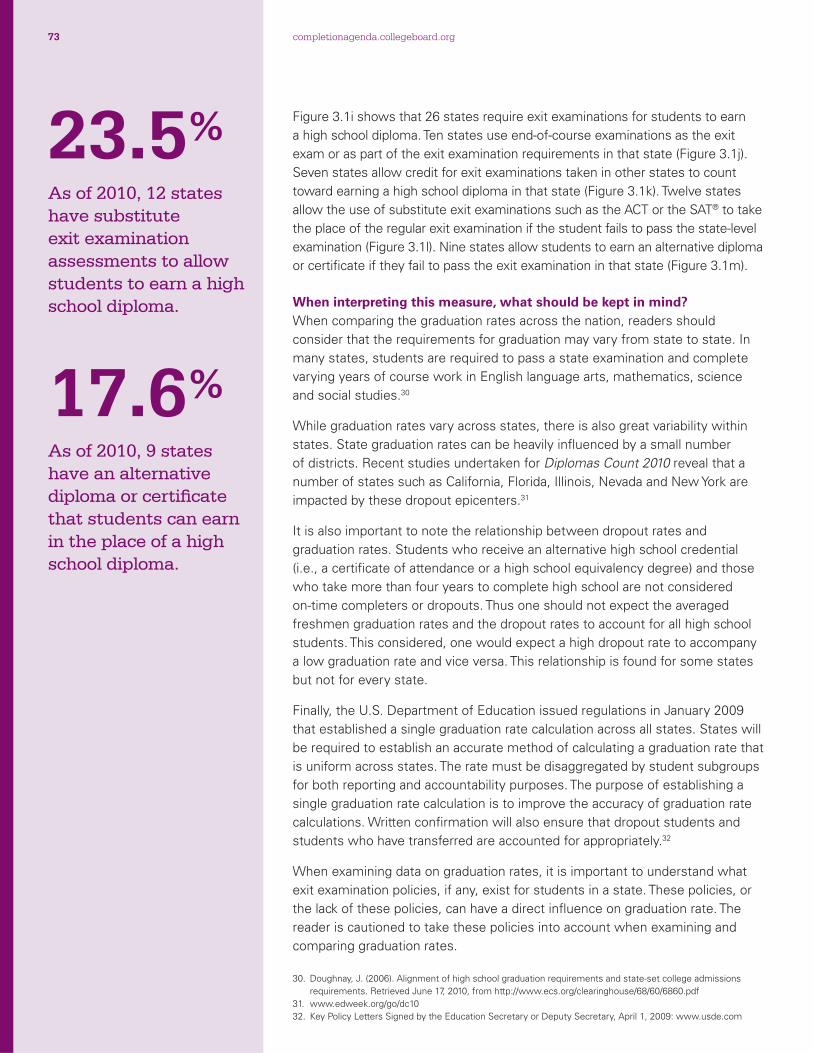
completionagenda.collegeboard.org
Figure 3.1i shows that 26 states require exit examinations for students to earn
a high school diploma. Ten states use end-of-course examinations as the exit
exam or as part of the exit examination requirements in that state (Figure 3.1j).
Seven states allow credit for exit examinations taken in other states to count
toward earning a high school diploma in that state (Figure 3.1k). Twelve states
allow the use of substitute exit examinations such as the ACT or the SAT® to take
the place of the regular exit examination if the student fails to pass the state-level
examination (Figure 3.1l). Nine states allow students to earn an alternative diploma
or certifi cate if they fail to pass the exit examination in that state (Figure 3.1m).
When interpreting this measure, what should be kept in mind? When comparing the graduation rates across the nation, readers should
consider that the requirements for graduation may vary from state to state. In
many states, students are required to pass a state examination and complete
varying years of course work in English language arts, mathematics, science
and social studies.30
While graduation rates vary across states, there is also great variability within
states. State graduation rates can be heavily infl uenced by a small number
of districts. Recent studies undertaken for Diplomas Count 2010 reveal that a
number of states such as California, Florida, Illinois, Nevada and New York are
impacted by these dropout epicenters.31
It is also important to note the relationship between dropout rates and
graduation rates. Students who receive an alternative high school credential
(i.e., a certifi cate of attendance or a high school equivalency degree) and those
who take more than four years to complete high school are not considered
on-time completers or dropouts. Thus one should not expect the averaged
freshmen graduation rates and the dropout rates to account for all high school
students. This considered, one would expect a high dropout rate to accompany
a low graduation rate and vice versa. This relationship is found for some states
but not for every state.
Finally, the U.S. Department of Education issued regulations in January 2009
that established a single graduation rate calculation across all states. States will
be required to establish an accurate method of calculating a graduation rate that
is uniform across states. The rate must be disaggregated by student subgroups
for both reporting and accountability purposes. The purpose of establishing a
single graduation rate calculation is to improve the accuracy of graduation rate
calculations. Written confi rmation will also ensure that dropout students and
students who have transferred are accounted for appropriately.32
When examining data on graduation rates, it is important to understand what
exit examination policies, if any, exist for students in a state. These policies, or
the lack of these policies, can have a direct infl uence on graduation rate. The
reader is cautioned to take these policies into account when examining and
comparing graduation rates.
30. Doughnay, J. (2006). Alignment of high school graduation requirements and state-set college admissions
requirements. Retrieved June 17, 2010, from http://www.ecs.org/clearinghouse/68/60/6860.pdf
31. www.edweek.org/go/dc10
32. Key Policy Letters Signed by the Education Secretary or Deputy Secretary, April 1, 2009: www.usde.com
23.5% As of 2010, 12 states have substitute exit examination assessments to allow students to earn a high school diploma.
17.6% As of 2010, 9 states have an alternative diploma or certifi cate that students can earn in the place of a high school diploma.
73

completionagenda.collegeboard.org
8.0% As of 2008, status dropouts account for 8.0 percent of the 37.6 million noninstitutionalized civilians ages 16 to 24 living in the nation.
0.7ppts 2007–2008
18.3% As of 2008, the noninstitutional status dropout rate of Hispanics is 18.3 percent.
3.1ppts 2007–2008
National Status Dropout Rate — Excluding Institutional PopulationsWhat is this measure, and why is this measure important? This measures
the percentage of noninstitutionalized individuals ages 16 through 24 who are
not enrolled in high school and who do not have a high school credential (e.g.,
diploma or certifi cate of General Education Development [GED]). It refl ects the
percentage of this age group who do not have a basic high school education.
It excludes individuals living in military barracks, adult or juvenile correctional
facilities, or nursing or other health care facilities and is irrespective of when the
individual dropped out of school. This measure helps gauge the challenges to
overall educational attainment at the national level across years.
What are the policy issues associated with this measure? It is important
for states to identify and support students who drop out. Minority and fi rst-
generation students are reported as more likely to be at risk of dropping out of
K–12 schools. States should implement a dropout prevention program as well as
work to improve the high school performance of their at-risk students overall.
Where are we now? As of 2008, just over three million 16- to 24-year-olds
are not enrolled in high school and have not earned a high school diploma or
alternative credential. These dropouts account for 8.0 percent of the 37.6 million
noninstitutionalized civilians ages 16 through 24 in the nation. This estimate
decreased since 1999 when the status dropout rate of noninstitutionalized
16- to 24-year-olds was 11.2 percent (Figure 3.2a).
While the noninstitutionalized status dropout rate decreased overall, the rates
are still high for many racial and ethnic groups. As of 2008, the status dropout
rate for those of two or more races is 4.2 percent and 4.4 percent for Asian or
Pacifi c Islanders, and the dropout rate is considerably higher among Hispanics
and American Indian or Alaska Natives (18.3 percent and 14.6 percent,
respectively) (Figure 3.2b). African Americans’ status dropout rate is 9.9 percent.
Recommendation Three 74

completionagenda.collegeboard.org
0
5
10
15
20
25
1999 2000 2001 2002 2003 2004 2005 2006 2007 2008
11.2% 10.9% 10.7% 10.5% 9.9% 10.3%9.4% 9.3%
8.0%8.7%
0
5
10
15
20
25
AfricanAmerican
AmericanIndian/
Alaska Native
Asian/Pacific Islander
Hispanic White(Non-Hispanic)
Two orMoreRaces
4.8%
18.3%
4.4%
14.6%
9.9%
535,000 43,000
4.2%
67,000 30,0001,232,000 1,103,000
AVG
8.0%
National Status Dropout Rates — Excluding Institutional Populations, 1999–2008Source: NCES, Condition of Education, 2010
3.2a
National Status Dropout Rates by Race/Ethnicity — Excluding Institutional Populations, 2008Source: NCES, Trends in High School Dropout and Completion Rates in the United States, 2010Note: (1) Respondents were able to identify themselves as being two or more races. The white (non-Hispanic), African American (non-Hispanic), Asian/Pacifi c Islander (non-Hispanic) and American Indian/Alaska Native (non-Hispanic) categories consist of individuals who considered themselves to be one race and who did not identify as Hispanic. Non-Hispanics who identifi ed themselves as multiracial are included in the Two or More Races (non-Hispanic) category. The Hispanic category consists of Hispanics of all races and racial combinations. (2) Race categories exclude persons of Hispanic origin unless specifi ed.
3.2b
75

completionagenda.collegeboard.org
The dropout rate for noninstitutional males is 8.5 percent, compared to 7.5
percent for females (Figure 3.2c).
The status dropout rate is the highest among 19-year-olds (Figure 3.2d). The
rate ranges from 2.2 percent for 16-year-olds, 7.8 percent for 18-year-olds, to 9.9
percent for 19-year-olds.
When interpreting this measure, what should be kept in mind? The status
dropout rates in this indicator are calculated using the United States Census
Current Population Survey (CPS), which is based on the noninstitutionalized
population in the United States. This rate does not provide information about
military personnel or individuals residing in group quarters, such as prison
inmates or patients in long-term medical facilities. The data from this indicator
should be interpreted with caution because of the inclusion of immigrants (e.g.,
individuals who may have never attended a school in the United States). In
addition, these data from the CPS are not directly comparable to the dropout
rates from the American Community Survey (ACS).33 One advantage of the data
from the CPS over that of the ACS is the ability to examine historical trends.
33. http://www.census.gov/hhes/socdemo/education/data/factsheet.html
14.6% As of 2008, the noninstitutional status dropout rate of American Indians or Alaska Natives is 14.6 percent.
4.8ppts 2007–2008
9.9% As of 2008, the noninstitutional status dropout rate of African Americans is 9.9 percent.
1.5ppts 2007–2008
Recommendation Three 76
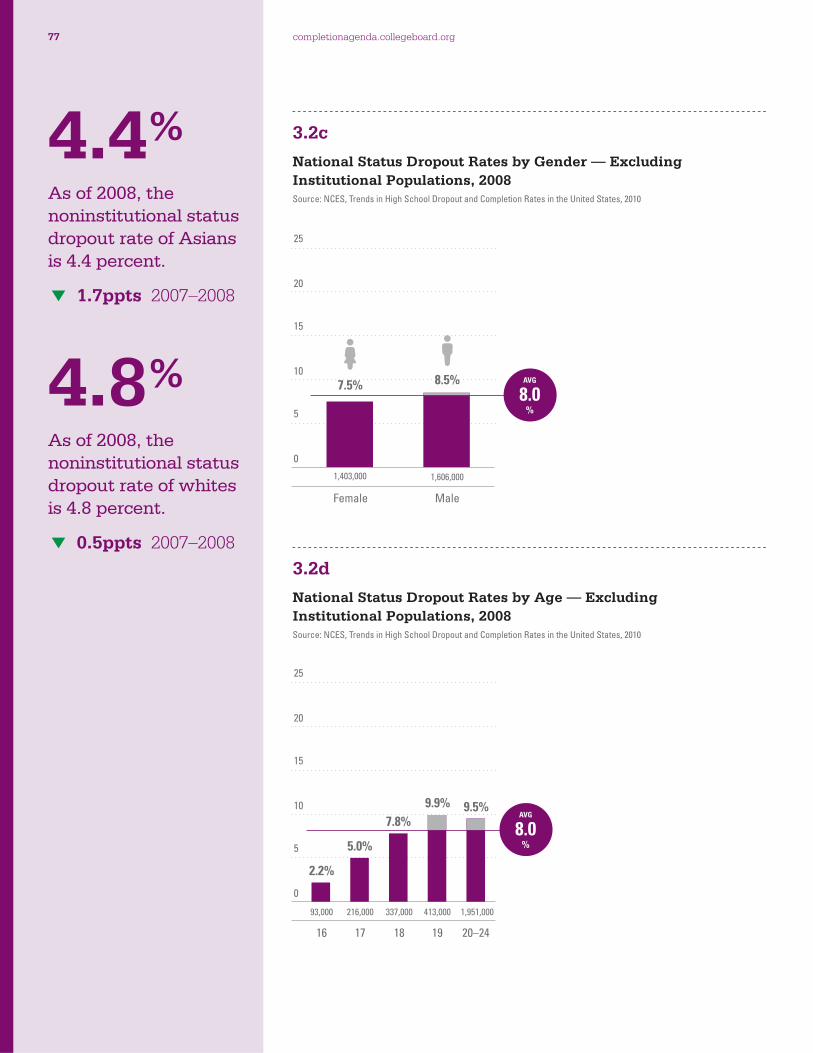
completionagenda.collegeboard.org
4.4% As of 2008, the noninstitutional status dropout rate of Asians is 4.4 percent.
1.7ppts 2007–2008
4.8% As of 2008, the noninstitutional status dropout rate of whites is 4.8 percent.
0.5ppts 2007–2008
0
5
10
15
20
25
Female Male
8.5%7.5%
1,403,000 1,606,000
AVG
8.0%
0
5
10
15
20
25
16 17 18 19 20–24
93,000 216,000 337,000 413,000 1,951,000
5.0%
2.2%
7.8%
9.9% 9.5%AVG
8.0%
National Status Dropout Rates by Gender — Excluding Institutional Populations, 2008Source: NCES, Trends in High School Dropout and Completion Rates in the United States, 2010
3.2c
National Status Dropout Rates by Age — Excluding Institutional Populations, 2008Source: NCES, Trends in High School Dropout and Completion Rates in the United States, 2010
3.2d
77

completionagenda.collegeboard.org
National Status Dropout Rate — Including Institutional PopulationsWhat is this measure, and why is this measure important? This measures
the overall percentage of individuals ages 16 through 24 who are not enrolled in
high school and who do not have a high school credential (e.g., diploma or GED),
irrespective of when they dropped out or whether they are in an institutional or
noninstitutional setting. It refl ects the percentage of this age group that does
not have a basic high school education. The measure is based on the American
Community Survey (ACS) and includes those living in military barracks in the
United States and those who are institutionalized, which provides us with a
broader, more inclusive population.
What are the policy issues associated with this measure? It is important that
states understand the dropout rate of institutionalized and noninstitutionalized
individuals so that early intervention programs can position students to choose
positive postsecondary options (i.e., college, military and/or employment). While
there is much debate over whether dropout rates that include institutionalized
individuals or noninstitutionalized dropout rates are more accurate, there
is no debate about the fact that society benefi ts when more people attain
a college degree.
Where are we now? As of 2008, the status dropout rate is 9.1 percent for
16- to 24-year-olds (Figure 3.3a), including those living in military barracks and
institutionalized persons. The status dropout rates are very high for many racial
and ethnic groups. While the status dropout rates are lowest among Asians (3.2
percent), whites (6.2 percent) and students of two or more races (7.3 percent),
status dropout rates are considerably higher among Hispanics (19.0 percent),
American Indians or Alaska Natives (16.3 percent), and African Americans (10.4
percent) (Figure 3.3b).
The national dropout rate for males is 10.4 percent compared to 7.9 percent
for females (Figure 3.3c). The status dropout rate ranges from 2.8 percent for
16-year-olds to 11.2 percent for 20- to 24-year-olds (Figure 3.3d).
When interpreting this measure, what should be kept in mind? This status
dropout rate is calculated using the American Community Survey, which
includes residents of military barracks in the United States and individuals
living in institutionalized group quarters such as adult and juvenile correctional
facilities, nursing facilities and other health care facilities. The data from this
indicator should be interpreted with caution because of the inclusion of
immigrants (e.g., individuals who may have never attended a school in the
United States). In addition, these data from the ACS are not directly comparable
to the dropout rates from the CPS.34
34. The Condition of Education. (2010). Retrieved June 2, 2011, from
http://nces.ed.gov/programs/coe/supnotes/2010-n06.asp
9.1% As of 2008, the status dropout rate is 9.1 percent for 16- to 24-year-olds (including institutional populations).
2007–2008
19.0% As of 2008, the status dropout rate for Hispanics is 19.0 percent (including institutional populations).
0.9ppts 2007–2008
Recommendation Three 78

completionagenda.collegeboard.org
16.3% As of 2008, the status dropout rate for American Indians or Alaska Natives is 16.3 percent (including institutional populations).
1.0ppts 2007–2008
10.4% As of 2008, the status dropout rate for African Americans is 10.4 percent (including institutional populations).
1.1ppts 2007–2008
National Status Dropout Rates — Including Institutional Populations, 1999–2008Source: NCES, The Condition of Education, 2010
3.3a
DROPOUT RATE9.1%
CONTINUING RATE90.7%
National Status Dropout Rates by Race/Ethnicity — Including Institutional Populations, 2008Source: NCES, The Condition of Education, 2010Note: Race categories exclude persons of Hispanic origin unless specifi ed.
3.3b
0
5
10
15
20
25
AfricanAmerican
American Indian/
Alaska Native
Asian Hispanic White(Non-
Hispanic)
Native Hawaiian/
PacificIslander
Two or More Races
9.5%
19.0%
3.2%
16.3%
10.4%
6.2%7.3%
528,000 49,000 45,000 1,322,000 54,0001,234,000 7,000
AVG
9.1%
79

completionagenda.collegeboard.org
3.2% As of 2008, the status dropout rate for Asians is 3.2 percent (including institutional populations).
2007–2008
6.2% As of 2008, the status dropout rate for whites is 6.2 percent (including institutional populations).
2007–2008
National Status Dropout Rates by Gender — Including Institutional Populations, 2008Source: U.S. Department of Education, National Center for Education Statistics, The Condition of Education, 2010
National Status Dropout Rates by Age — Including Institutional Populations, 2008Source: NCES, The Condition of Education, 2010
3.3c
3.3d
0
5
10
15
20
25
Female Male
10.4%7.9%
1,373,000 1,876,000
AVG
9.1%
0
5
10
15
20
25
16 17 18 19 20–24
4.7%
2.8%
9.0%
11.1
%
11.2
%
117,000 199,000 356,000 388,000 2,190,000
AVG
9.1%
Recommendation Three 80

completionagenda.collegeboard.org
National Event Dropout Rates of Public High School Students in Grades 9–12, 2003–2008Source: NCES, Public School Graduates and Dropouts From the Common Core of Data: School Year 2007-08, 2010
3.4a
0
5
10
15
20
25
2003 2004 2005 2006 2007 2008
3.9% 4.1% 3.9% 3.9% 4.4% 4.1%
National Event Dropout RateWhat is this measure, and why is this measure important? This measure
refl ects the annual rate at which public high school students in the United
States leave grades nine through 12 during a 12-month period without a
successful outcome (i.e., October 2007 to October 2008). This measure can
be used to study student experiences in high school in a given year. It helps
understand which students drop out of school during a particular period of time.
This is different from the status dropout rate that measures the percentage
of a target population (e.g., ages 16 through 24) who are not enrolled in high
school and who do not have a high school credential, irrespective of when they
dropped out of school.
This indicator also shows the age at which students can legally drop out of
school in each state. This measure is important for allowing the reader to
understand the differences in policies that exist among states that can directly
affect the dropout rates of students.
What are the policy issues associated with this measure? It is important for
states to identify and support students who are most likely to drop out. States
should be aware that it is important to implement dropout prevention programs
as well as understand the experiences and challenges of the students who
are dropping out. It is also important that states understand the relationship
between policies that allow students to legally drop out of school and the effect
that these policies have on dropout rates.
4.1% As of 2008, the national event dropout rate is 4.1 percent for public high school students in grades nine through 12.
2007–2008
37.3% As of 2010, 19 states have a legal age of 16 for students to drop out of school.
21.6% As of 2010, 11 states have a legal age of 17 for students to drop out of school.
41.2% As of 2010, 21 states have a legal age of 18 for students to drop out of school.
81
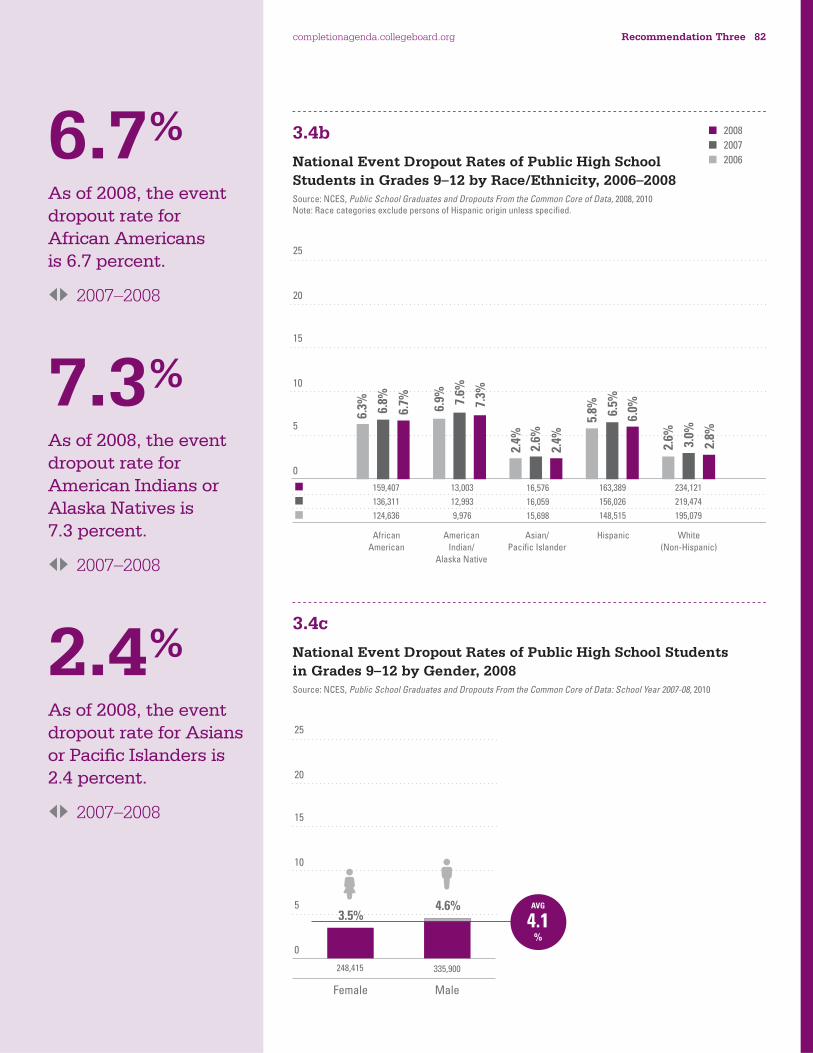
completionagenda.collegeboard.org
6.7% As of 2008, the event dropout rate for African Americans is 6.7 percent.
2007–2008
7.3% As of 2008, the event dropout rate for American Indians or Alaska Natives is 7.3 percent.
2007–2008
2.4% As of 2008, the event dropout rate for Asians or Pacifi c Islanders is 2.4 percent.
2007–2008
National Event Dropout Rates of Public High School Students in Grades 9–12 by Race/Ethnicity, 2006–2008Source: NCES, Public School Graduates and Dropouts From the Common Core of Data, 2008, 2010 Note: Race categories exclude persons of Hispanic origin unless specifi ed.
3.4b
0
5
10
15
20
25
AfricanAmerican
AmericanIndian/
Alaska Native
Asian/Pacific Islander
Hispanic White(Non-Hispanic)
2.6% 3.0%
2.8%
5.8% 6.
5%
6.0%
2.4%
2.4%
6.9% 7.
6%
7.3%
6.3% 6.8%
6.7%
2.6%
16,576
16,059
15,698
13,003
12,993
9,976
163,389
156,026
148,515
234,121
219,474
195,079
159,407
136,311
124,636
2008
2007
2006
National Event Dropout Rates of Public High School Students in Grades 9–12 by Gender, 2008Source: NCES, Public School Graduates and Dropouts From the Common Core of Data: School Year 2007-08, 2010
3.4c
0
5
10
15
20
25
Female Male
4.6%3.5%
248,415 335,900
AVG
4.1%
Recommendation Three 82
completionagenda.collegeboard.org
Where are we now? As of 2008, the national event dropout rate is 4.1 percent
for public high school students (Figure 3.4a). This includes all students who drop
out in grades nine through 12. The national event dropout rate remains relatively
stable at approximately 4 percent since 2003, peaking at 4.4 percent in 2007
(Figure 3.4a).
While Asians or Pacifi c Islanders have the lowest event dropout rate at 2.4
percent, the dropout rates are more than two times higher among American
Indians or Alaska Natives, African Americans, and Hispanics (Figure 3.4b).
Nationally, a slightly higher percentage of males drop out compared to females
(Figure 3.4c). The event dropout rate for males is 4.6 percent compared to 3.5
percent for females.
Figure 3.4d shows that the average age at which students can legally drop out
of school in the United States is 17 years old, yet this age varies from state to
state. As of 2010, 19 states have a legal dropout age of 16 years old, 11 states
have a legal dropout age of 17 years old, and 21 states have a legal dropout age
of 18 years old.
When disaggregated by state, the percentages range from 1.7 percent in
Indiana and New Jersey to 7.5 percent in Louisiana (Figure 3.4e). When placed
in rank order, Indiana, New Jersey, Idaho, Alabama and South Dakota have the
lowest event dropout rates (Figure 3.4e). Louisiana, Alaska, Arizona, Colorado
and Michigan have the highest event dropout rates.
The event dropout rates for Asian American or Pacifi c Islander public high school
students range from 0.5 percent in New Jersey to 6.9 percent in Alaska (Figure
3.4f). The states with the lowest event dropout rates for this group are New
Jersey, Indiana, Alabama, Florida and Idaho (Figure 3.4f). The states with the
highest event dropout rates are Alaska, Hawaii, Rhode Island, North Dakota
and Montana.
The event dropout rates for American Indian or Alaska Native public high school
students range from 0.0 percent in South Carolina to 12.2 percent in Alaska
(Figure 3.4g). The states with the lowest event dropout rates for this group
are South Carolina, Alabama, Idaho, Connecticut and Florida (Figure 3.4g). The
states with the highest event dropout rates are Alaska, Montana, Minnesota,
Arizona and Washington.
The event dropout rates for African American public high school students range
from 1.9 percent in Idaho to 12.9 percent in Missouri (Figure 3.4h). The states
with the lowest event dropout rates for this group are Idaho, Alabama, South
Dakota, Indiana and New Jersey (Figure 3.4h). The states with the highest event
dropout rates are Missouri, Michigan, Louisiana, Colorado and Ohio.
6.0% As of 2008, the event dropout rate for Hispanics is 6.0 percent.
0.5ppts 2007–2008
2.8% As of 2008, the event dropout rate for whites is 2.8 percent.
2007–2008
83

completionagenda.collegeboard.org
The event dropout rates for white public high school students range from 1.0
percent in New Jersey to 5.9 percent in Hawaii (Figure 3.4i). The states with
the lowest event dropout rates for this group are New Jersey, South Dakota,
Wisconsin, Connecticut and Indiana (Figure 3.4i). The states with the highest
event dropout rates are Hawaii, Arizona, Alaska, Washington and Delaware.
The event dropout rates for Hispanic public high school students range from 2.2
percent in Alabama to 12.1 percent in Colorado (Figure 3.4j). The states with the
lowest event dropout rates for this group are Alabama, Indiana, New Hampshire,
New Jersey and Idaho (Figure 3.4j). The states with the highest event dropout
rates are Colorado, Michigan, Ohio, Massachusetts and Rhode Island.
While the national event dropout rate is 4.1 percent for all students in grades
nine through 12, the rate varies greatly by grade level. The national event
dropout rate is more than two times higher among 12th-grade students
compared to ninth-grade students (Figures 3.4l–n). The national event dropout
rate is 3.0 percent for ninth-grade students, 3.6 percent for 10th-grade students,
4.0 percent for 11th-grade students and 6.1 percent for 12th-grade students
(Figure 3.4k–n).
The ninth-grade public school event dropout rates range from 0.2 percent
in Indiana and New Hampshire to 8.9 percent in Louisiana (Figure 3.4k). The
states with the lowest event dropout rates for ninth-graders are Indiana, New
Hampshire, Iowa, Minnesota and North Dakota. The states with the highest
rates are Louisiana, Delaware, District of Columbia, North Carolina and Missouri.
The 10th-grade public school event dropout rates range from 0.8 percent in
Indiana to 6.6 percent in Louisiana (Figure 3.4l). The states with the lowest
event dropout rates for 10th-graders are Indiana, Wisconsin, New Hampshire,
Iowa and Minnesota (Figure 3.4l). The states with the highest rates are
Louisiana, Michigan, Delaware, Hawaii and Wyoming.
The 11th-grade public school event dropout rates range from 1.8 percent in
New Jersey to 9.0 percent in Alaska (Figure 3.4m). The states with the lowest
event dropout rates for 11th-graders are New Jersey, Indiana, Wisconsin, Idaho
and South Dakota (Figure 3.4m). The states with the highest rates are Alaska,
Colorado, Arizona, Washington and Louisiana.
The 12th-grade public school event dropout rates range from 1.8 percent in
Alabama to 11.0 percent in California (Figure 3.4n). The states with the lowest
event dropout rates for 12th-graders are Alabama, New Jersey, Kentucky,
Connecticut and Idaho (Figure 3.4n). The states with the highest rates are
California, Arizona, Alaska, Colorado and Maine.
Recommendation Three 84

completionagenda.collegeboard.org
When interpreting this measure, what should be kept in mind? A dropout
is an individual who enrolls at some point during the prior academic year, does
not enroll at the beginning of the following school year, has not graduated or
earned a GED, and does not meet the test for exclusion. Students are excluded
from the count if they transfer to another public school district, private school,
or state- or district-approved education program; if they have a temporary
absence due to suspension or school-approved illness; or because of death.35
This is a very detailed defi nition of a dropout; however, it does not address what
happens to students who repeat a grade. It is not well suited for studying how
many people in the country lack a high school credential, since students may
reenter the school system at a later time or go on to earn a GED through adult
education programs.
When comparing graduation rates, the reader is encouraged to also take into
account the age at which students are legally able to drop out of school in a
given state. States that allow students to legally drop out of school at age 16
may see more students who drop out in the ninth and 10th grades, while states
that allow students to legally drop out of school at ages 17 or 18 may experience
higher dropout rates in the 11th or 12th grades. This context is especially
important when analyzing dropout rates by grade level.
35. National Center for Education Statistics. Public School Graduates and Dropouts From the
Common Core of Data: School Year 2007-08. (NCES 2010-341). Retrieved June 3, 2011, from
http://nces.ed.gov/pubs2010/2010341.pdf
85

completionagenda.collegeboard.org
State Statutory Age When Students Can Legally Drop Out, 2010Source: Education Commission of the States, 2010Note: Indiana: An individual is required to stay in school until he or she: graduates; is between 16 and 18 and meets the requirements for an exit interview; or reaches at least 18 years of age. Withdrawal before 18 requires parent’s/guardian’s and principal’s written permission. Louisiana: “A child between the ages of seventeen and eighteen may withdraw from school prior to graduation if both the following circumstances exist: (a) The written consent of his parents, tutor, or legal guardian. (b) An exit interview is conducted where the student and his parent, tutor, or legal guardian provide written acknowledgment that withdrawal from school shall likely reduce the student’s future earning potential and increase the student’s likelihood of being unemployed in the future. During such exit interview, a student who is withdrawing from school shall be given information that has been prepared and supplied by the Louisiana Workforce Commission regarding available training and employment opportunity programs, provided such information is available.” Montana: requires that a child shall remain in school until the latter of either the child’s 16th birthday or the date of completion of the work of the eighth grade. New Hampshire: The superintendent may grant waivers upon proof that the pupil is 16 years of age or older and has an alternative learning plan for obtaining either a high school diploma or its equivalent. New York: Both New York City and Buffalo require minors to attend school from the age of 6 until the age of 17. Each district in the state is authorized to require minors between 16 and 17 who are not employed to attend school. The board of education of the Syracuse city school district is authorized to require minors who are 5 years of age on or before December fi rst to attend kindergarten instruction. Texas: School districts may require persons who voluntarily enroll in school or voluntarily attend school after their 18th birthday to attend school until the end of the school year. Virginia: “For a student who is at least 16 years of age, there shall be a meeting of the student, the student’s parents, and the principal or his designee of the school in which the student is enrolled in which an individual student alternative education plan shall be developed in conformity with guidelines prescribed by the Board … .”
3.4d
18California Connecticut District of Columbia Hawaii IndianaKansas LouisianaMichigan Nebraska Nevada New HampshireNew Mexico Ohio Oklahoma Oregon South Dakota TexasUtah Virginia Washington Wisconsin
17Alabama ArkansasColorado Illinois MaineMississippiMissouriPennsylvaniaSouth CarolinaTennesseeWest Virginia
16Alaska Arizona Delaware Florida Georgia Idaho Iowa Kentucky Maryland MassachusettsMinnesota MontanaNew Jersey New YorkNorth Carolina North Dakota Rhode Island Vermont Wyoming
16 38%
17 22%
18 40%
New fi gure
Recommendation Three 86
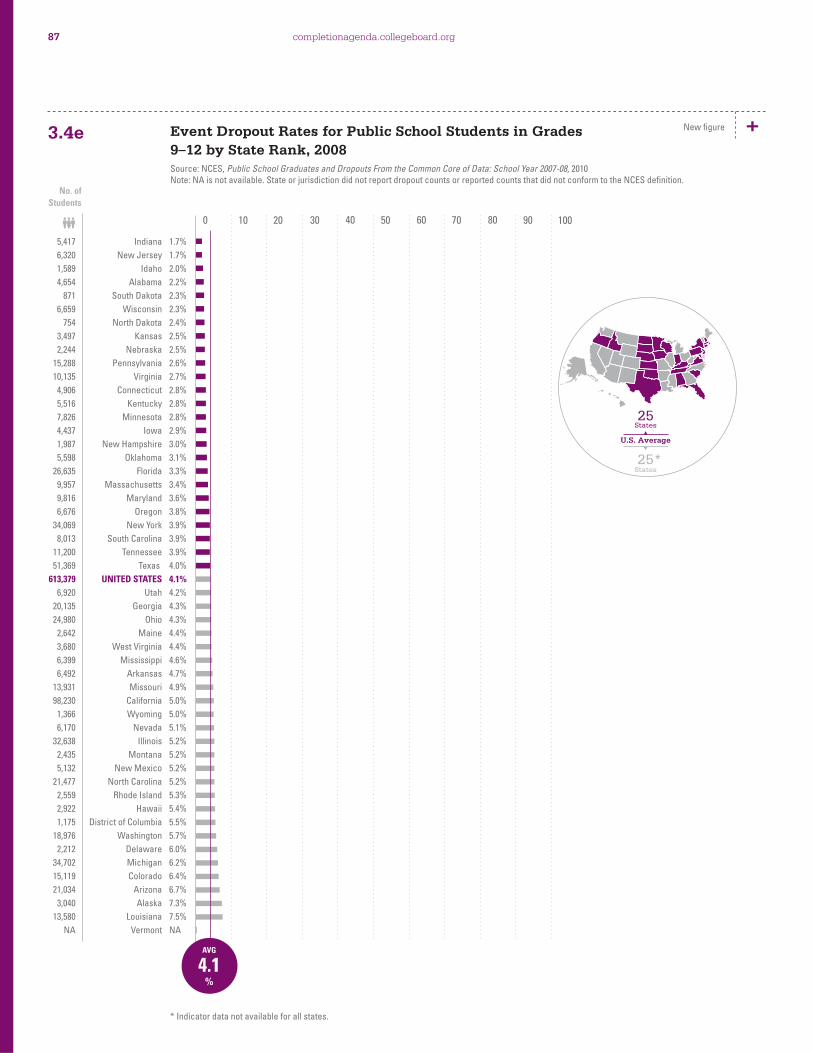
completionagenda.collegeboard.org
Event Dropout Rates for Public School Students in Grades 9–12 by State Rank, 2008Source: NCES, Public School Graduates and Dropouts From the Common Core of Data: School Year 2007-08, 2010Note: NA is not available. State or jurisdiction did not report dropout counts or reported counts that did not conform to the NCES defi nition.
3.4e
0 10 20 30 40 50 60 70 80 90 100
Indiana
New Jersey
Idaho
Alabama
South Dakota
Wisconsin
North Dakota
Kansas
Nebraska
Pennsylvania
Virginia
Connecticut
Kentucky
Minnesota
Iowa
New Hampshire
Oklahoma
Florida
Massachusetts
Maryland
Oregon
New York
South Carolina
Tennessee
Texas
UNITED STATES
Utah
Georgia
Ohio
Maine
West Virginia
Mississippi
Arkansas
Missouri
California
Wyoming
Nevada
Illinois
Montana
New Mexico
North Carolina
Rhode Island
Hawaii
District of Columbia
Washington
Delaware
Michigan
Colorado
Arizona
Alaska
Louisiana
Vermont
1.7%
1.7%
2.0%
2.2%
2.3%
2.3%
2.4%
2.5%
2.5%
2.6%
2.7%
2.8%
2.8%
2.8%
2.9%
3.0%
3.1%
3.3%
3.4%
3.6%
3.8%
3.9%
3.9%
3.9%
4.0%
4.1%
4.2%
4.3%
4.3%
4.4%
4.4%
4.6%
4.7%
4.9%
5.0%
5.0%
5.1%
5.2%
5.2%
5.2%
5.2%
5.3%
5.4%
5.5%
5.7%
6.0%
6.2%
6.4%
6.7%
7.3%
7.5%
NA
5,417
6,320
1,589
4,654
871
6,659
754
3,497
2,244
15,288
10,135
4,906
5,516
7,826
4,437
1,987
5,598
26,635
9,957
9,816
6,676
34,069
8,013
11,200
51,369
613,379
6,920
20,135
24,980
2,642
3,680
6,399
6,492
13,931
98,230
1,366
6,170
32,638
2,435
5,132
21,477
2,559
2,922
1,175
18,976
2,212
34,702
15,119
21,034
3,040
13,580
NA
25
U.S. Average
25*
States
States
No. ofStudents
AVG
4.1%
* Indicator data not available for all states.
New fi gure
87
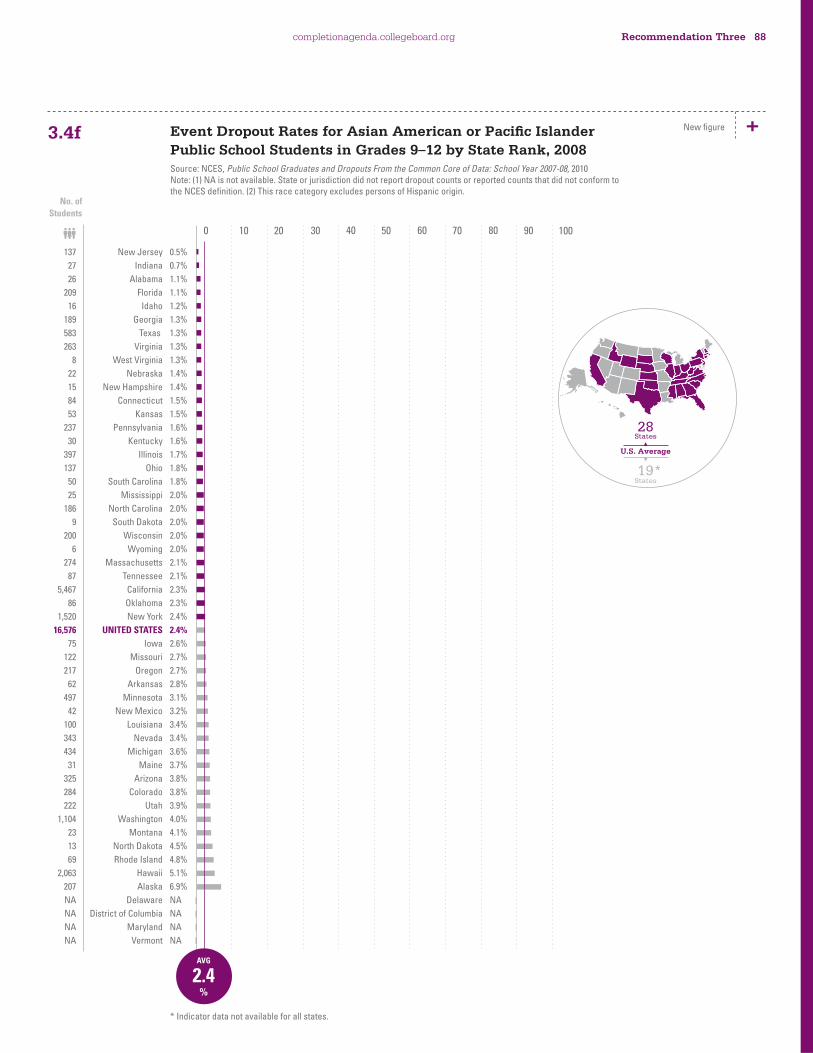
completionagenda.collegeboard.org
Event Dropout Rates for Asian American or Pacifi c Islander Public School Students in Grades 9–12 by State Rank, 2008Source: NCES, Public School Graduates and Dropouts From the Common Core of Data: School Year 2007-08, 2010 Note: (1) NA is not available. State or jurisdiction did not report dropout counts or reported counts that did not conform to the NCES defi nition. (2) This race category excludes persons of Hispanic origin.
3.4f
0 10 20 30 40 50 60 70 80 90 100
New Jersey
Indiana
Alabama
Florida
Idaho
Georgia
Texas
Virginia
West Virginia
Nebraska
New Hampshire
Connecticut
Kansas
Pennsylvania
Kentucky
Illinois
Ohio
South Carolina
Mississippi
North Carolina
South Dakota
Wisconsin
Wyoming
Massachusetts
Tennessee
California
Oklahoma
New York
UNITED STATES
Iowa
Missouri
Oregon
Arkansas
Minnesota
New Mexico
Louisiana
Nevada
Michigan
Maine
Arizona
Colorado
Utah
Washington
Montana
North Dakota
Rhode Island
Hawaii
Alaska
Delaware
District of Columbia
Maryland
Vermont
0.5%
0.7%
1.1%
1.1%
1.2%
1.3%
1.3%
1.3%
1.3%
1.4%
1.4%
1.5%
1.5%
1.6%
1.6%
1.7%
1.8%
1.8%
2.0%
2.0%
2.0%
2.0%
2.0%
2.1%
2.1%
2.3%
2.3%
2.4%
2.4%
2.6%
2.7%
2.7%
2.8%
3.1%
3.2%
3.4%
3.4%
3.6%
3.7%
3.8%
3.8%
3.9%
4.0%
4.1%
4.5%
4.8%
5.1%
6.9%
NA
NA
NA
NA
137
27
26
209
16
189
583
263
8
22
15
84
53
237
30
397
137
50
25
186
9
200
6
274
87
5,467
86
1,520
16,576
75
122
217
62
497
42
100
343
434
31
325
284
222
1,104
23
13
69
2,063
207
NA
NA
NA
NA
28
U.S. Average
19*
States
States
No. ofStudents
AVG
2.4%
* Indicator data not available for all states.
New fi gure
Recommendation Three 88

completionagenda.collegeboard.org
Event Dropout Rates for American Indian or Alaska Native Public School Students in Grades 9–12 by State Rank, 2008Source: NCES, Public School Graduates and Dropouts From the Common Core of Data: School Year 2007-08, 2010Note: (1) NA is not available. State or jurisdiction did not report dropout counts or reported counts that did not conform to the NCES defi nition. (2) This race category excludes persons of Hispanic origin.
3.4g
0 10 20 30 40 50 60 70 80 90 100
South Carolina
Alabama
Idaho
Connecticut
Florida
Kentucky
New Jersey
Mississippi
Texas
Oklahoma
Georgia
Indiana
Missouri
Illinois
Virginia
Kansas
Pennsylvania
Tennessee
Arkansas
Nevada
New York
Maine
Wisconsin
Oregon
West Virginia
California
Hawaii
Louisiana
North Dakota
UNITED STATES
Massachusetts
Utah
Nebraska
North Carolina
Ohio
Michigan
New Hampshire
Iowa
New Mexico
Delaware
South Dakota
Rhode Island
Wyoming
Colorado
Washington
Arizona
Minnesota
Montana
Alaska
District of Columbia
Maryland
Vermont
0.0%
1.8%
2.3%
2.5%
2.5%
2.5%
2.7%
3.0%
3.2%
3.3%
3.6%
3.6%
3.7%
3.8%
3.8%
3.9%
4.1%
4.7%
4.9%
4.9%
5.7%
5.8%
5.8%
6.1%
6.5%
6.6%
7.2%
7.2%
7.3%
7.3%
7.5%
7.5%
7.6%
7.7%
8.2%
8.3%
8.3%
9.1%
9.2%
9.4%
9.9%
10.3%
11.0%
11.3%
11.3%
11.4%
11.6%
11.7%
12.2%
NA
NA
NA
0
37
28
14
57
6
16
7
145
1,106
26
30
47
64
43
91
38
27
49
97
215
22
248
235
6
1,075
21
98
195
13,003
62
236
106
427
66
422
15
80
1,169
12
343
32
96
328
981
2,211
668
554
1,152
NA
NA
NA
29
U.S. Average
19*
States
States
No. ofStudents
AVG
7.3%
* Indicator data not available for all states.
New fi gure
89

completionagenda.collegeboard.org
Event Dropout Rates for African American Public School Students in Grades 9–12 by State Rank, 2008Source: NCES, Public School Graduates and Dropouts From the Common Core of Data: School Year 2007-08, 2010Note: (1) NA is not available. State or jurisdiction did not report dropout counts or reported counts that did not conform to the NCES defi nition. (2) This race category excludes persons of Hispanic origin.
3.4h
0 10 20 30 40 50 60 70 80 90 100
Idaho
Alabama
South Dakota
Indiana
New Jersey
Oklahoma
Kansas
North Dakota
Virginia
South Carolina
Georgia
Florida
Kentucky
West Virginia
Maine
Connecticut
Mississippi
Pennsylvania
Massachusetts
New Mexico
Nebraska
Iowa
New York
North Carolina
Montana
Nevada
Texas
Utah
Arkansas
UNITED STATES
Arizona
Minnesota
Hawaii
Delaware
Tennessee
Rhode Island
Wisconsin
Oregon
Wyoming
Washington
California
Illinois
Alaska
New Hampshire
Ohio
Colorado
Louisiana
Michigan
Missouri
District of Columbia
Maryland
Vermont
1.9%
2.2%
2.4%
2.8%
2.8%
3.5%
3.6%
3.9%
4.0%
4.3%
4.6%
4.7%
4.8%
5.0%
5.4%
5.6%
5.6%
5.7%
5.9%
5.9%
6.0%
6.2%
6.2%
6.2%
6.3%
6.3%
6.3%
6.6%
6.7%
6.7%
7.1%
7.1%
7.3%
7.7%
7.7%
7.8%
7.8%
7.9%
8.1%
8.9%
9.0%
9.1%
9.6%
9.6%
10.1%
10.6%
10.9%
12.6%
12.9%
NA
NA
NA
15
1,765
17
1,019
1,877
664
439
20
3,957
3,578
8,632
8,710
1,018
197
72
1,387
3,946
4,901
1,526
148
395
471
10,800
7,683
20
889
12,116
160
2,131
159,407
1,288
1,778
78
913
5,618
341
2,160
381
30
1,611
14,476
11,360
152
97
9,863
1,544
8,580
14,355
6,229
NA
NA
NA
29
U.S. Average
19*
States
States
No. ofStudents
AVG
6.7%
* Indicator data not available for all states.
New fi gure
Recommendation Three 90
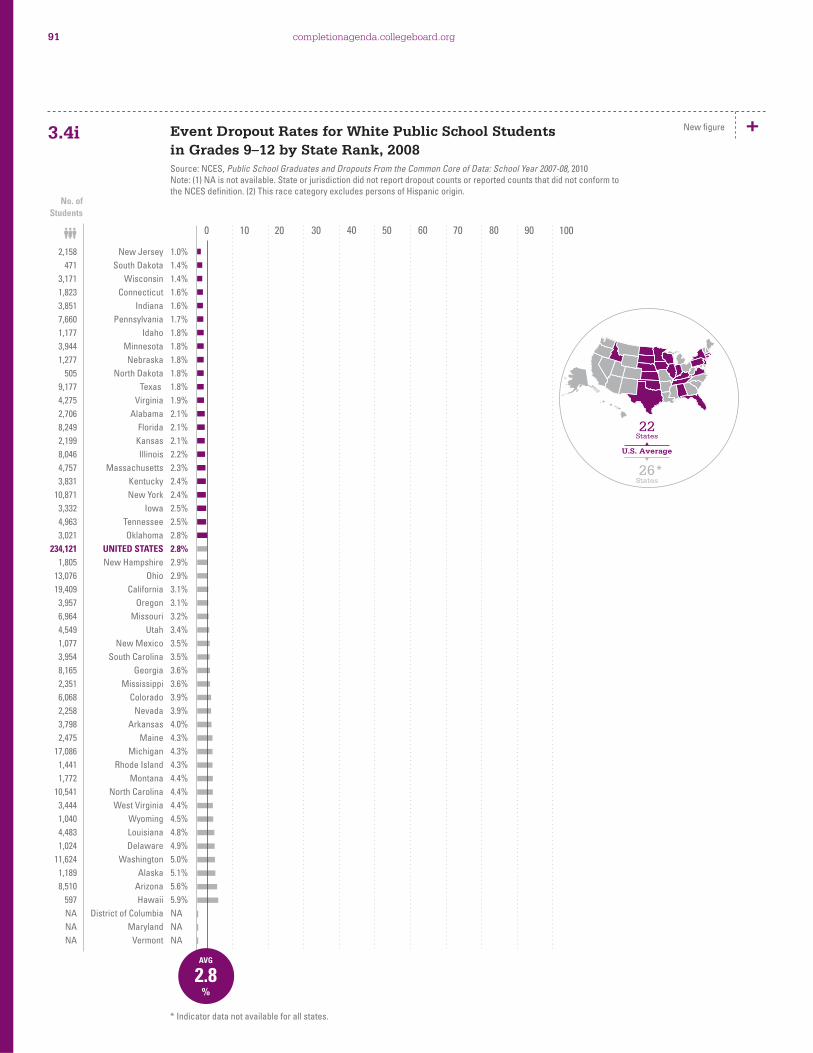
completionagenda.collegeboard.org
Event Dropout Rates for White Public School Students in Grades 9–12 by State Rank, 2008Source: NCES, Public School Graduates and Dropouts From the Common Core of Data: School Year 2007-08, 2010Note: (1) NA is not available. State or jurisdiction did not report dropout counts or reported counts that did not conform to the NCES defi nition. (2) This race category excludes persons of Hispanic origin.
3.4i
0 10 20 30 40 50 60 70 80 90 100
New Jersey
South Dakota
Wisconsin
Connecticut
Indiana
Pennsylvania
Idaho
Minnesota
Nebraska
North Dakota
Texas
Virginia
Alabama
Florida
Kansas
Illinois
Massachusetts
Kentucky
New York
Iowa
Tennessee
Oklahoma
UNITED STATES
New Hampshire
Ohio
California
Oregon
Missouri
Utah
New Mexico
South Carolina
Georgia
Mississippi
Colorado
Nevada
Arkansas
Maine
Michigan
Rhode Island
Montana
North Carolina
West Virginia
Wyoming
Louisiana
Delaware
Washington
Alaska
Arizona
Hawaii
District of Columbia
Maryland
Vermont
1.0%
1.4%
1.4%
1.6%
1.6%
1.7%
1.8%
1.8%
1.8%
1.8%
1.8%
1.9%
2.1%
2.1%
2.1%
2.2%
2.3%
2.4%
2.4%
2.5%
2.5%
2.8%
2.8%
2.9%
2.9%
3.1%
3.1%
3.2%
3.4%
3.5%
3.5%
3.6%
3.6%
3.9%
3.9%
4.0%
4.3%
4.3%
4.3%
4.4%
4.4%
4.4%
4.5%
4.8%
4.9%
5.0%
5.1%
5.6%
5.9%
NA
NA
NA
2,158
471
3,171
1,823
3,851
7,660
1,177
3,944
1,277
505
9,177
4,275
2,706
8,249
2,199
8,046
4,757
3,831
10,871
3,332
4,963
3,021
234,121
1,805
13,076
19,409
3,957
6,964
4,549
1,077
3,954
8,165
2,351
6,068
2,258
3,798
2,475
17,086
1,441
1,772
10,541
3,444
1,040
4,483
1,024
11,624
1,189
8,510
597
NA
NA
NA
22
U.S. Average
26*
States
States
No. ofStudents
AVG
2.8%
* Indicator data not available for all states.
New fi gure
91

completionagenda.collegeboard.org
Event Dropout Rates for Hispanic Public School Students in Grades 9–12 by State Rank, 2008Source: NCES, Public School Graduates and Dropouts From the Common Core of Data: School Year 2007-08, 2010Note: NA is not available. State or jurisdiction did not report dropout counts or reported counts that did not conform to the NCES defi nition.
3.4j
0 10 20 30 40 50 60 70 80 90 100
Alabama
Indiana
New Hampshire
New Jersey
Idaho
Florida
West Virginia
Kansas
Mississippi
South Dakota
North Dakota
Kentucky
Georgia
Nebraska
Arkansas
Oklahoma
New Mexico
South Carolina
Tennessee
Texas
Virginia
Wisconsin
California
UNITED STATES
Connecticut
Iowa
New York
Montana
Hawaii
Nevada
Oregon
Pennsylvania
Maine
Missouri
Arizona
Illinois
Alaska
Minnesota
North Carolina
Louisiana
Utah
Washington
Wyoming
Delaware
Rhode Island
Massachusetts
Ohio
Michigan
Colorado
District of Columbia
Maryland
Vermont
2.2%
2.4%
3.1%
3.1%
3.5%
3.7%
3.8%
3.9%
3.9%
4.0%
4.4%
4.6%
4.8%
4.8%
5.1%
5.2%
5.3%
5.3%
5.3%
5.3%
5.4%
5.4%
6.0%
6.0%
6.1%
6.1%
6.1%
6.5%
6.7%
6.7%
6.7%
6.9%
7.0%
7.2%
7.3%
7.3%
7.5%
7.5%
7.6%
7.8%
8.0%
8.0%
8.0%
8.2%
8.2%
8.3%
8.5%
10.3%
12.1%
NA
NA
NA
108
380
55
2,116
350
6,816
25
595
70
31
21
164
1,593
444
452
721
2,696
397
505
29,348
1,484
880
54,911
163,389
1,598
479
10,606
66
163
2,583
1,611
2,387
42
569
8,700
7,553
164
939
2,139
319
1,732
3,223
194
232
676
3,171
1,051
2,135
6,895
NA
NA
NA
23
U.S. Average
25*
States
States
No. ofStudents
AVG
6.0%
* Indicator data not available for all states.
New fi gure
Recommendation Three 92

completionagenda.collegeboard.org
Event Dropout Rates for Public School Students in Ninth Grade by State Rank, 2008Source: NCES, Public School Graduates and Dropouts From the Common Core of Data: School Year 2007-08, 2010Note: NA is not available. State or jurisdiction did not report dropout counts or reported counts that did not conform to the NCES defi nition.
3.4k
0 10 20 30 40 50 60 70 80 90 100
Indiana
New Hampshire
Iowa
Minnesota
North Dakota
Idaho
Kansas
Nebraska
New Jersey
Maine
Oregon
Utah
Wisconsin
South Dakota
Wyoming
Alabama
Pennsylvania
Virginia
Kentucky
Texas
California
Connecticut
Oklahoma
Arkansas
Florida
Tennessee
UNITED STATES
Massachusetts
Montana
New York
Mississippi
South Carolina
Illinois
Hawaii
Washington
Colorado
West Virginia
Maryland
Arizona
Georgia
Alaska
Nevada
Ohio
Michigan
New Mexico
Rhode Island
Missouri
North Carolina
District of Columbia
Delaware
Louisiana
Vermont
0.2%
0.2%
0.8%
0.9%
1.0%
1.1%
1.2%
1.3%
1.3%
1.4%
1.4%
1.4%
1.4%
1.5%
1.8%
1.9%
1.9%
2.1%
2.2%
2.4%
2.5%
2.6%
2.7%
2.8%
2.8%
2.8%
3.0%
3.1%
3.1%
3.1%
3.5%
3.5%
3.6%
3.7%
3.8%
3.9%
3.9%
4.0%
4.2%
4.2%
4.3%
4.6%
4.6%
4.7%
4.9%
5.0%
5.3%
5.4%
5.7%
6.3%
8.9%
NA
182
31
291
604
84
237
453
321
1,346
213
621
599
997
161
126
1,256
2,984
2,296
1,248
9,358
13,316
1,233
1,309
1,076
6,393
2,270
126,057
2,400
375
7,823
1,497
2,334
6,427
593
3,423
2,469
930
3,066
3,538
6,126
455
1,857
7,501
7,061
1,468
681
4,110
6,841
436
710
4,931
NA
26
U.S. Average
24*
States
States
0
No. ofStudents
AVG
3.0%
* Indicator data not available for all states.
New fi gure
93

completionagenda.collegeboard.org
Event Dropout Rates for Public School Students in 10th Grade by State Rank, 2008Source: NCES, Public School Graduates and Dropouts From the Common Core of Data: School Year 2007-08, 2010Note: NA is not available. State or jurisdiction did not report dropout counts or reported counts that did not conform to the NCES defi nition.
3.4l
0 10 20 30 40 50 60 70 80 90 100
Indiana
Wisconsin
New Hampshire
Iowa
Minnesota
New Jersey
Idaho
Kansas
Nebraska
North Dakota
Virginia
Alabama
Oregon
South Dakota
Utah
Maine
Pennsylvania
Connecticut
California
Florida
Ohio
Oklahoma
Tennessee
Kentucky
Massachusetts
Texas
UNITED STATES
Maryland
Arkansas
New York
South Carolina
Illinois
Georgia
Mississippi
West Virginia
Missouri
Washington
Nevada
Colorado
Arizona
Montana
North Carolina
New Mexico
Rhode Island
Alaska
District of Columbia
Wyoming
Hawaii
Delaware
Michigan
Louisiana
Vermont
0.8%
1.0%
1.4%
1.6%
1.6%
1.6%
1.8%
2.2%
2.2%
2.3%
2.3%
2.4%
2.4%
2.4%
2.4%
2.6%
2.6%
2.9%
3.0%
3.0%
3.1%
3.1%
3.2%
3.3%
3.6%
3.6%
3.6%
3.7%
4.2%
4.2%
4.2%
4.3%
4.4%
4.4%
4.4%
4.6%
4.6%
4.7%
4.8%
5.1%
5.1%
5.5%
5.6%
5.7%
5.8%
5.9%
6.0%
6.2%
6.4%
6.5%
6.6%
NA
660
678
226
630
1,064
1,588
373
801
510
185
2,256
1,335
1,071
243
1,039
400
3,828
1,271
15,150
6,212
4,528
1,446
2,380
1,704
2,663
11,760
135,244
2,547
1,561
9,845
2,319
7,143
5,419
1,631
927
3,352
3,910
1,582
2,915
4,141
613
5,740
1,491
700
607
314
434
847
622
9,476
3,107
NA
26
U.S. Average
24*
States
States
No. ofStudents
AVG
3.6%
* Indicator data not available for all states.
New fi gure
Recommendation Three 94

completionagenda.collegeboard.org
Event Dropout Rates for Public School Students in 11th Grade by State Rank, 2008Source: NCES, Public School Graduates and Dropouts From the Common Core of Data: School Year 2007-08, 2010Note: NA is not available. State or jurisdiction did not report dropout counts or reported counts that did not conform to the NCES defi nition.
3.4m
0 10 20 30 40 50 60 70 80 90 100
New Jersey
Indiana
Wisconsin
Idaho
South Dakota
Alabama
Minnesota
Pennsylvania
Virginia
Nebraska
Kansas
Connecticut
Florida
Iowa
Kentucky
Maryland
North Dakota
Texas
Massachusetts
Ohio
New Hampshire
Oklahoma
New York
Oregon
UNITED STATES
California
South Carolina
Georgia
Illinois
Nevada
Tennessee
Mississippi
Utah
Maine
West Virginia
Missouri
Delaware
District of Columbia
New Mexico
North Carolina
Arkansas
Rhode Island
Hawaii
Wyoming
Michigan
Montana
Louisiana
Washington
Arizona
Colorado
Alaska
Vermont
1.8%
1.9%
2.0%
2.3%
2.4%
2.5%
2.7%
2.7%
2.7%
2.8%
3.0%
3.1%
3.1%
3.2%
3.2%
3.3%
3.3%
3.3%
3.4%
3.6%
3.7%
3.7%
3.9%
4.0%
4.0%
4.1%
4.1%
4.2%
4.2%
4.2%
4.2%
4.6%
4.6%
4.7%
4.8%
5.0%
5.2%
5.2%
5.3%
5.5%
5.7%
5.7%
5.8%
5.9%
6.1%
6.2%
6.5%
6.5%
6.8%
7.2%
9.0%
NA
1,710
1,458
1,444
445
211
1,221
1,806
3,775
2,464
606
1,016
1,296
5,954
1,212
1,502
2,083
259
9,688
2,374
5,027
599
1,573
7,754
1,745
139,144
19,468
1,893
4,416
6,255
1,085
2,888
1,450
1,899
704
959
3,357
422
226
1,192
5,273
1,922
644
764
384
8,034
700
2,666
5,206
5,108
4,067
940
NA
24
U.S. Average
26*
States
States
No. ofStudents
AVG
4.0%
* Indicator data not available for all states.
New fi gure
95

completionagenda.collegeboard.org
Event Dropout Rates for Public School Students in 12th Grade by State Rank, 2008Source: NCES, Public School Graduates and Dropouts From the Common Core of Data: School Year 2007-08, 2010Note: NA is not available. State or jurisdiction did not report dropout counts or reported counts that did not conform to the NCES defi nition.
3.4n
0 10 20 30 40 50 60 70 80 90 100
Alabama
New Jersey
Kentucky
Connecticut
Idaho
North Dakota
South Dakota
Georgia
Oklahoma
Maryland
Pennsylvania
Florida
Nebraska
Kansas
Massachusetts
South Carolina
Virginia
Mississippi
North Carolina
Indiana
New York
District of Columbia
West Virginia
Missouri
Rhode Island
Wisconsin
New Mexico
Illinois
Tennessee
Minnesota
Ohio
Iowa
UNITED STATES
Delaware
Arkansas
Hawaii
Montana
Wyoming
New Hampshire
Nevada
Texas
Louisiana
Oregon
Michigan
Washington
Utah
Maine
Colorado
Alaska
Arizona
California
Vermont
1.8%
1.9%
2.5%
2.7%
2.9%
2.9%
2.9%
3.1%
3.2%
3.4%
3.4%
3.6%
3.6%
3.7%
3.7%
3.7%
3.7%
4.0%
4.3%
4.4%
4.4%
4.7%
4.7%
4.8%
5.0%
5.0%
5.1%
5.7%
5.8%
5.9%
5.9%
6.0%
6.1%
6.2%
6.3%
6.4%
6.6%
6.8%
7.1%
7.5%
7.5%
7.6%
7.6%
7.9%
8.2%
8.4%
8.8%
10.2%
10.4%
10.8%
11.0%
NA
842
1,676
1,062
1,106
534
226
256
3,001
1,270
2,120
4,689
5,882
807
1,227
2,520
1,467
3,119
1,139
3,623
3,117
8,374
199
864
3,112
534
3,540
981
8,032
3,662
4,352
7,924
2,304
203,630
458
1,933
718
726
422
1,131
1,646
20,563
2,876
3,238
10,131
6,437
3,383
1,325
5,668
1,038
8,247
50,129
NA
32
U.S. Average
18*
States
States
No. ofStudents
AVG
6.1%
* Indicator data not available for all states.
New fi gure
Recommendation Three 96

FourAlign the K–12 education system with international standards and college admission expectations
WE RECOMMEND that governors, legislators and state education agencies work to provide a world-class education to every American student by aligning high school programs with international benchmarks tied to the demands of college and career.

completionagenda.collegeboard.org
The commission believes that the academic intensity of the high school
curriculum is the most important predictor of college success. However, many
students do not have access to a rigorous high school curriculum and graduate
unprepared to succeed in college or in careers.
The knowledge and skills for success in the workplace are increasingly similar
to those required for college.36 This lack of preparation is affecting the economic
viability of the United States and our competitiveness with other industrialized
nations around the world. Leaders in K–12 and higher education must work
together to align these educational systems. States must align standards,
pedagogy, assessment and professional development activities to meet the
expectations of college and workforce readiness.
Since the commission released its initial recommendations in 2008, there is
an increasing national interest and momentum in aligning the K–12 education
system with college and career readiness standards. The Common Core State
Standards Initiative, launched in 2009 by the National Governors Association
and the Council of Chief State School Offi cers, has resulted in the development
of K–12 English Language Arts and Mathematics standards that outline the
knowledge and skills students need in order to be prepared for college and
careers. As of June 2011, 45 states have already taken formal steps to adopt
these common standards. The federally funded Race to the Top initiative has
also sharpened the focus and attention on the importance of aligning the K–12
system to college and career readiness expectations. The 45 states participating
in the two common assessment consortia, which are funded through the
Race to the Top initiative, are working together to create common assessment
systems that are closely aligned to these new rigorous Common Core
State Standards.
Four indicators are presented to monitor the degree to which the nation is aligning K–12 education systems with international standards and college admission expectations:
• Percentage of public high schools offering Advanced Placement® (AP®) or
International Baccalaureate (IB) courses in the four core subject areas;
• Percentage of schools offering dual enrollment;
• Percentage of states with alignment between K–12 and higher education
standards; and
• Percentage of students in remedial college classes.
36. American Diploma Project, What Is College- and Career-Ready? (Washington, DC: Achieve, Inc., 2009).
Recommendation Four 98
completionagenda.collegeboard.org
General Findings for This Recommendation• As of 2010, 33.7 percent of public schools in the United States offer
AP or IB courses in the four core subject areas: English language arts,
mathematics, natural sciences and social studies.
• As of 2010, 32.6 percent of public high schools in the United States offer AP
courses in the four core subject areas: English language arts, mathematics,
science and social studies.
• As of 2010, 508,818 students of the 853,314 students in the class of 2010
who take an AP Exam scored a 3 or higher.
• As of 2010, 28.3 percent of public high school students take an AP Exam in
the United States.
• As of 2010, 16.9 percent of public high school students scored a 3 or higher
on at least one AP Exam in the United States.
• As of 2010, 2.9 percent of public high schools in the United States offer IB
courses in the four core subject areas: English language arts, mathematics,
science and social studies.
• As of 2010, 83.6 percent of schools in the United States offer dual
enrollment.
• As of 2010, 31 states have alignment between high school standards and
college and workplace expectations.
• As of 2010, 21 states and the District of Columbia have alignment
between high school graduation requirements and college and workplace
expectations.
• As of 2010, 14 states have a college- and career-ready assessment system.
• As of 2010, 16 states have P–20 longitudinal data systems.
• As of 2010, 42 states and the District of Columbia have adopted the
Common Core State Standards.
• As of 2008, 37.6 percent of fi rst- and second-year undergraduates in the
United States are in remedial courses after high school graduation.
• As of 2008, 47.3 percent of African American fi rst- and second-year
undergraduate students in the United States are in remedial courses after
high school graduation.
• As of 2008, 45.1 percent of Hispanic fi rst- and second-year undergraduate
students in the United States are in remedial courses after high school
graduation.
• As of 2008, 43.9 percent of Native American fi rst- and second-year
undergraduate students in the United States are in remedial courses after
high school graduation.
• As of 2008, 33.1 percent of white fi rst- and second-year undergraduate
students in the United States are in remedial courses after high school
graduation.
• As of 2008, 38.1 percent of Asian fi rst- and second-year undergraduate
students in the United States are in remedial courses after high school
graduation.
99

completionagenda.collegeboard.org
Percentage of Public High Schools Offering AP® or IB Courses in the Four Core Subject AreasWhat is this measure, and why is this measure important? This indicator
measures the percentage of public high schools in the United States that offer
AP or IB courses in each of the four core subject areas: English language arts,
mathematics, science and social studies.
Advanced Placement® is a cooperative endeavor between secondary
schools and colleges; college faculty connect college-level standards into the
development, validation, and scoring processes. Comparability studies ensure
that the performance of students on AP Exams is aligned to the performance of
students in the comparable college course.
In 2009, a study revealed that IB standards were highly aligned to the
Knowledge and Skills for University Success (KSUS) college-ready standards
in terms of both cognitive strategies and individual subject area knowledge.37
Both programs are a good measure of the alignment of high school standards to
college expectations.
What are the policy issues associated with this measure? There is
considerable variation among colleges and universities in policies that specify
the score a student must achieve on an AP and/or IB exam to receive college
course credit or advanced standing. As more academically prepared high school
students gain access to AP, IB and other rigorous course work, state leaders
and policymakers should consider the extent to which the variance among
institutions’ credit-granting policies present barriers for these students as they
transition to college. State policymakers and higher education agencies can
agree that successful performance on external examinations offered by AP
and IB is recognized as a measure of academic profi ciency for college credit
accepted toward a bachelor’s degree.
37. Conley, D. T., and Ward, T. (2009). Summary Brief: International Baccalaureate Standards Development and
Alignment Project. Eugene, OR: Educational Policy Improvement Center.
33.7% As of 2010, 33.7 percent of public high schools in the United States offer AP or IB courses in English language arts, mathematics, science and social studies.
1.1ppts 2009–2010
32.6% As of 2010, 32.6 percent of public high schools in the United States offer AP courses in the four core subject areas: English language arts, mathematics, science and social studies.
1.3ppts 2009–2010
Recommendation Four 100

completionagenda.collegeboard.org
Aligned standards for college readiness will streamline and strengthen an
effective K–16 educational system. Two in three postsecondary students
attend two or more institutions before obtaining a bachelor’s degree. Student
and credit transition between institutions is often complicated, and AP and IB
students presenting qualifying exam scores for college credit can encounter
similar frustrations in the transfer process. The lack of consistent or transparent
credit granting polices for AP and IB can negatively impact these students trying
to maximize the application of credit and save tuition costs. States can direct,
encourage and reward institutions who implement comprehensive policies for
qualifying AP and IB exams that promote seamless transfer and articulation
of college credit to satisfy common introductory requirements. (See K. Peter
and E. F. Cataldi, The Road Less Traveled? Students Who Enroll in Multiple
Institutions [Washington, DC: U.S. Department of Education, National Center for
Education Statistics, 2005], http://nces.ed.gov/pubs2005/2005157.pdf)
While state policymakers often face challenges reconciling the competing
values of system effi ciency/accountability and institutional autonomy, research
fi ndings confi rm that earning credit through AP and IB yields a range of positive
outcomes, including improved academic persistence and enhanced disciplinary
focus. Policymakers can review and compare state policies for awarding credit
for AP and IB by using the Education Commission of the States searchable
database.38
Through efforts like the College Board AP Florida Partnership promoting
educational excellence and equity for all students, and state requirements to
administer the PSAT/ NMSQT® or PLAN in grade 10, students can be identifi ed
for rigorous course work early in their high school years, encouraging increased
access and success.
Where are we now? As of 2010, 33.7 percent of public high schools across the
nation offer AP or IB courses in the four core subject areas (English language
arts, mathematics, science and social studies).
The percentage of public high schools that offer AP or IB courses in the four
core subject areas (English language arts, mathematics, science and social
studies) ranges from 5.5 percent in North Dakota to 84.2 percent in Arkansas.
When placed in rank order, the states with the highest percentage are
Arkansas, Maryland, Connecticut, New Jersey and Massachusetts (Figure 4.1a).
The states with the lowest percentage are North Dakota, Alaska, South Dakota,
Montana and Nebraska.
The percentage of public high schools that offer AP courses in the four
core subject areas ranges from 5.5 percent in North Dakota to 84.2 percent
in Arkansas (Figure 4.1b). When placed in rank order, the states with the
highest percentages are Arkansas, Maryland, Connecticut, New Jersey and
Massachusetts. The states with the lowest percentages are North Dakota,
Alaska, South Dakota, Montana and Nebraska.
38. Database can be accessed at: http://mb2.ecs.org/reports/Report.aspx?id=2134
28.3% As of 2010, 28.3 percent of public high school students in the graduating class of 2010 took an AP Exam in the United States.
16.9% As of 2010, 16.9 percent of public high school students in the graduating class of 2010 scored a 3 or higher on at least one AP Exam in the United States.
2.9% As of 2010, 2.9 percent of public high schools in the United States offer IB courses in the four core subject areas: English language arts, mathematics, science and social studies.
2009–2010
101

completionagenda.collegeboard.org
Figure 4.1c shows the distribution of AP examinees by race/ethnicity for the
graduating class of 2010. AP examinees are very diverse; 8.6 percent of AP
examinees are African American and 16.0 percent are Hispanic. Similarly,
0.6 percent of the class of 2010 is American Indian or Alaska Native and
10.2 percent of the class is Asian American or Pacifi c Islander. Furthermore,
57.9 percent of AP examinees in the Class of 2010 are white.
The percentage of public high school students in the class of 2010 who took an
AP Exam in the United States was 28.3 percent (Figure 4.1d). This percentage
of public high school students who took an AP Exam ranges from 10.4 percent
in North Dakota to 43.5 percent in Florida. When placed in rank order, the
states with the highest percentages are Florida, Maryland, Virginia, New
York and Georgia. The states with the lowest percentages are North Dakota,
Louisiana, Nebraska, Missouri and Mississippi.
The percentage of public high school students in the class of 2010 who scored
a 3 or higher on at least one AP Exam in the United States was 16.9 percent
(Figure 4.1e). This percentage of public high school students who took an
AP Exam ranges from 4.4 percent in Mississippi to 26.4 percent in Maryland.
When placed in rank order, the states with the highest percentages are
Maryland, New York, Virginia, Connecticut and Massachusetts. The states with
the lowest percentages are Mississippi, Louisiana, North Dakota, the District of
Columbia and Nebraska.
Recommendation Four 102

completionagenda.collegeboard.org
Percentage of Public High Schoolsa Offering AP or IB Courses in the Four Core Subject Areas,b 2010Source: The College Board and International Baccalaureate, 2010a. Number of public high schools in the United States, as maintained by the College Board b. Core subject areas include courses in English, mathematics, science and social studies
4.1a
0 10 20 30 40 50 60 70 80 90 100
Arkansas
Maryland
Connecticut
New Jersey
Massachusetts
Virginia
Delaware
New Hampshire
Georgia
Kentucky
Vermont
North Carolina
Florida
Pennsylvania
Maine
Indiana
Hawaii
Rhode Island
South Carolina
California
Utah
Nevada
Washington
Colorado
UNITED STATES
West Virginia
New York
Wisconsin
Illinois
District of Columbia
Texas
Tennessee
Ohio
Arizona
Michigan
Oregon
Alabama
Mississippi
Minnesota
New Mexico
Idaho
Oklahoma
Kansas
Missouri
Wyoming
Iowa
Louisiana
Nebraska
Montana
South Dakota
Alaska
North Dakota
84.2%
64.2%
59.9%
59.2%
58.0%
57.2%
55.8%
55.2%
55.1%
53.1%
53.1%
49.5%
46.1%
43.4%
42.0%
41.8%
41.3%
40.7%
40.3%
39.3%
38.8%
37.4%
36.9%
34.3%
33.7%
32.1%
31.9%
31.8%
31.3%
30.8%
29.5%
29.1%
27.5%
26.8%
25.2%
22.0%
21.2%
20.3%
19.7%
17.0%
16.4%
14.4%
14.0%
14.0%
13.8%
12.3%
11.6%
9.6%
9.4%
8.8%
7.9%
5.5%
316
274
207
483
383
381
43
87
472
273
64
584
796
774
138
409
63
54
243
2,075
165
131
425
402
21,756
137
1,396
494
764
26
2,073
371
891
414
828
318
382
291
508
188
189
499
344
556
80
365
361
280
171
170
254
164
No. ofInsts.
24
U.S. Average
27
States
States
AVG
33.7%
103

completionagenda.collegeboard.org
Percentage of Public High Schoolsa Offering Advanced Placement (AP) in the Four Core Subject Areas,b 2010Source: The College Board, 2010a. Number of public high schools in the United States, as maintained by the College Board b. Core subject areas include courses in English, mathematics, science and social studies
4.1b
0 10 20 30 40 50 60 70 80 90 100
Arkansas
Maryland
Connecticut
New Jersey
Massachusetts
Delaware
New Hampshire
Georgia
Vermont
Virginia
Kentucky
North Carolina
Florida
Pennsylvania
Hawaii
Maine
Rhode Island
Indiana
Utah
California
Nevada
South Carolina
Washington
Colorado
UNITED STATES
West Virginia
District of Columbia
Illinois
New York
Wisconsin
Tennessee
Texas
Ohio
Arizona
Michigan
Alabama
Mississippi
Minnesota
Oregon
New Mexico
Idaho
Oklahoma
Kansas
Missouri
Wyoming
Iowa
Louisiana
Nebraska
Montana
South Dakota
Alaska
North Dakota
84.2%
63.5%
58.9%
58.0%
56.4%
55.8%
54.0%
53.6%
53.1%
52.5%
52.0%
48.1%
45.4%
43.0%
41.3%
41.3%
40.7%
40.6%
38.8%
38.1%
37.4%
36.6%
33.6%
32.8%
32.6%
31.4%
30.8%
30.6%
30.5%
30.4%
29.1%
29.0%
27.2%
25.1%
23.9%
20.7%
19.2%
17.3%
17.3%
16.5%
14.8%
14.4%
13.4%
13.1%
12.5%
12.3%
11.1%
9.3%
8.8%
8.8%
7.5%
5.5%
316
274
207
483
383
43
87
472
64
381
273
584
796
774
63
138
54
409
165
2,075
131
243
425
402
21,756
137
26
764
1,396
494
371
2,073
891
414
828
382
291
508
318
188
189
499
344
556
80
365
361
280
171
170
254
164
No. ofInsts.
24
U.S. Average
27
States
States
AVG
32.6%
Recommendation Four 104
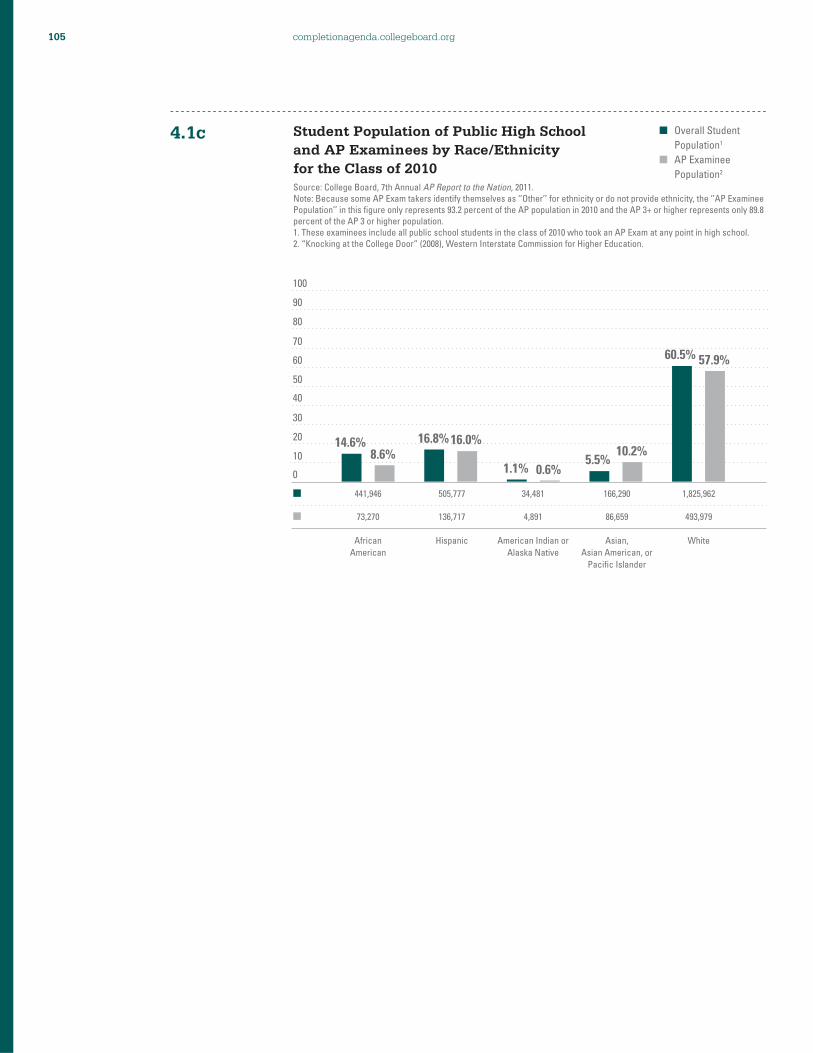
completionagenda.collegeboard.org
Student Population of Public High School and AP Examinees by Race/Ethnicity for the Class of 2010Source: College Board, 7th Annual AP Report to the Nation, 2011.Note: Because some AP Exam takers identify themselves as ‘’Other’’ for ethnicity or do not provide ethnicity, the ‘’AP Examinee Population’’ in this fi gure only represents 93.2 percent of the AP population in 2010 and the AP 3+ or higher represents only 89.8 percent of the AP 3 or higher population. 1. These examinees include all public school students in the class of 2010 who took an AP Exam at any point in high school. 2. “Knocking at the College Door” (2008), Western Interstate Commission for Higher Education.
4.1c
0
10
20
30
40
50
60
70
80
90
100
Hispanic Asian,Asian American, or
Pacific Islander
American Indian orAlaska Native
AfricanAmerican
White
441,946 34,481 166,290 1,825,962
73,270 4,891 86,659
505,777
136,717 493,979
14.6%8.6%
16.8% 16.0%
1.1% 0.6%5.5%
10.2%
60.5% 57.9%
Overall Student
Population1
AP Examinee
Population2
105

completionagenda.collegeboard.org
Percentage of Public High School Students Taking an AP Exam, Class of 2010Source: College Board, 7th Annual AP Report to the Nation, 2011.
4.1d
0 10 20 30 40 50 60 70 80 90 100
Florida
Maryland
Virginia
New York
Georgia
Arkansas
Colorado
California
Massachusetts
Connecticut
Vermont
Maine
Texas
Indiana
North Carolina
Utah
UNITED STATES
Nevada
Delaware
Washington
South Carolina
Minnesota
Illinois
Wisconsin
New Jersey
District of Columbia
Kentucky
Oregon
Michigan
New Hampshire
Alaska
New Mexico
Oklahoma
Pennsylvania
Hawaii
Alabama
Ohio
Tennessee
South Dakota
West Virginia
Montana
Rhode Island
Idaho
Kansas
Wyoming
Arizona
Iowa
Mississippi
Missouri
Nebraska
Louisiana
North Dakota
43.5%
43.4%
38.1%
38.0%
37.3%
36.6%
34.6%
34.0%
33.2%
32.2%
31.8%
31.6%
30.2%
29.3%
28.8%
28.4%
28.3%
28.3%
28.1%
28.0%
26.8%
26.4%
26.3%
26.3%
25.6%
25.1%
24.4%
23.4%
23.2%
22.7%
22.3%
22.3%
20.8%
19.7%
19.6%
19.5%
18.9%
18.6%
18.4%
18.4%
18.0%
17.9%
16.3%
16.0%
15.7%
15.6%
14.4%
14.1%
13.4%
12.4%
11.4%
10.4%
65,741
24,961
30,781
60,856
30,643
10,635
16,740
131,123
20,352
11,952
2,126
4,034
82,249
18,425
24,629
9,614
853,314
5,949
2,149
18,296
9,626
15,354
35,133
16,691
25,016
1,037
9,779
7,584
24,658
3,160
1,683
3,980
7,853
25,561
2,095
7,710
23,045
9,637
1,481
3,204
1,802
1,795
2,816
4,705
827
12,335
5,135
3,576
8,364
2,498
3,198
721
No. ofStudents
16
U.S. Average
35
States
States
AVG
28.3%
Recommendation Four 106

completionagenda.collegeboard.org
Percentage of Public High School Students Scoring 3 or Higher on an AP Exam, Class of 2010Source: College Board, 7th Annual AP Report to the Nation, 2011.
4.1e
0 10 20 30 40 50 60 70 80 90 100
Maryland
New York
Virginia
Connecticut
Massachusetts
California
Florida
Vermont
Colorado
Utah
Georgia
Maine
New Jersey
Wisconsin
North Carolina
Illinois
Washington
UNITED STATES
Minnesota
New Hampshire
Texas
Delaware
South Carolina
Michigan
Nevada
Alaska
Oregon
Pennsylvania
Arkansas
Indiana
Kentucky
Ohio
Montana
Idaho
South Dakota
Rhode Island
Oklahoma
New Mexico
Tennessee
Kansas
Hawaii
Alabama
Arizona
Iowa
Wyoming
West Virginia
Missouri
Nebraska
District of Columbia
North Dakota
Louisiana
Mississippi
26.4%
24.6%
23.7%
23.2%
23.1%
22.3%
22.3%
21.8%
21.4%
19.2%
19.1%
19.0%
18.6%
18.3%
17.5%
17.2%
17.1%
16.9%
16.8%
16.6%
15.5%
15.4%
15.1%
15.0%
15.0%
14.3%
14.1%
12.7%
12.5%
12.4%
12.2%
11.8%
11.7%
11.0%
11.0%
10.9%
10.3%
10.2%
9.7%
9.5%
9.4%
9.0%
8.8%
8.8%
8.5%
7.6%
7.5%
7.4%
6.9%
6.8%
4.6%
4.4%
15,167
39,463
19,162
8,629
14,122
85,890
33,712
1,460
10,330
6,503
15,668
2,430
18,214
11,618
15,019
23,028
11,182
508,818
9,797
2,311
42,254
1,180
5,409
15,914
3,148
1,080
4,580
16,488
3,623
7,807
4,903
14,323
1,174
1,893
885
1,095
3,895
1,820
5,017
2,805
1,001
3,573
6,963
3,145
450
1,328
4,682
1,497
285
474
1,307
1,115
No. ofStudents
17
U.S. Average
34
States
States
AVG
16.9%
107

completionagenda.collegeboard.org
Percentage of Public High Schoolsa Offering IB Courses in the Four Core Subject Areas,b 2010Source: The College Board and International Baccalaureate, 2010a. Number of public high schools in the United States, as maintained by the College Board b. Core subject areas include courses in English, mathematics, science and social studies
4.1f
0 10 20 30 40 50 60 70 80 90 100
South Carolina
Virginia
Maryland
Florida
Colorado
Oregon
Georgia
North Carolina
Indiana
Utah
District of Columbia
Minnesota
California
Washington
Arizona
Hawaii
Alabama
New York
UNITED STATES
Wyoming
Tennessee
Delaware
Nevada
Michigan
New Jersey
Texas
Illinois
Ohio
Arkansas
Massachusetts
Missouri
Wisconsin
Idaho
Kansas
Kentucky
Connecticut
Maine
Mississippi
Pennsylvania
New Hampshire
Alaska
Louisiana
Nebraska
West Virginia
Montana
New Mexico
Oklahoma
Iowa
North Dakota
Rhode Island
South Dakota
Vermont
10.3%
8.9%
8.0%
7.5%
7.2%
6.0%
4.9%
4.5%
4.2%
4.2%
3.8%
3.7%
3.6%
3.5%
3.4%
3.2%
2.9%
2.9%
2.9%
2.5%
2.4%
2.3%
2.3%
2.2%
2.1%
2.1%
2.0%
2.0%
1.9%
1.8%
1.8%
1.8%
1.6%
1.5%
1.5%
1.4%
1.4%
1.4%
1.4%
1.1%
0.8%
0.8%
0.7%
0.7%
0.6%
0.5%
0.4%
0.3%
0.0%
0.0%
0.0%
0.0%
243
381
274
796
402
318
472
584
409
165
26
508
2,075
425
414
63
382
1,396
21,756
80
371
43
131
828
483
2,073
764
891
316
383
556
494
189
344
273
207
138
291
774
87
254
361
280
137
171
188
499
365
164
54
170
64
No. ofInsts.
18
U.S. Average
33
States
States
AVG
2.9%
Recommendation Four 108

completionagenda.collegeboard.org
Given that schools must adopt a comprehensive IB program as opposed to
individual courses, an IB school automatically meets the requirement of offering
course work in the four core subject areas. The percentage of public high schools
offering the IB program ranges from 0.0 percent in North Dakota, Rhode Island,
South Dakota and Vermont to 10.3 percent in South Carolina (Figure 4.1f). When
placed in rank order, the states with the highest percentage are South Carolina,
Virginia, Maryland, Florida and Colorado.
When interpreting this measure, what should be kept in mind?
The presentation of AP and IB courses should not be misconstrued as the
only types of rigorous high school curricula. This measure should be used as
one gauge of the amount of rigor available to student in public high schools
across the nation. Rigorous course work can also be found in magnet and
honors programs throughout the country; however, data for these programs are
limited and do not meet the standards for inclusion in this report. While there is
cause for concern about limited availability of AP core course curricula in some
schools, a list of 171 online AP course providers is available through the AP
Course Ledger website.
Readers should also consider the fact that a school is counted whether or not
it offers one or 30 AP courses. This indicator only addresses participation (i.e.,
access) and not performance, which is more closely tied to college readiness.
Taking IB, for example, is not the same thing as earning the IB diploma.
College and career readiness pertains to the skills and content knowledge that
students should possess in reading, mathematics, writing and communications
in order to be successful in the workforce or in college.39
39. Wiley, A., Wyatt, J., and Camara, W. J. (2010). The Development of a Multidimensional College Readiness
Index (College Board Research Report No. 2010-3) (New York: The College Board).
109

completionagenda.collegeboard.org
A growing number of educational leaders contend that institutional, state, and
federal policies can create unintended barriers for low-income and minority
students. Several states have enacted legislation to reduce these barriers and
improve higher education system accountability by (1) ensuring that AP and
IB credit policies accurately inform prospective students and families about
credit-granting and tuition saving options; (2) supporting seamless articulation
of postsecondary credit for qualifying AP and IB exam scores; and (3) ensuring
broader consistency among the state’s postsecondary institutions to maximize
students’ application and transfer of credit to reduce the accumulation of excess
credits. The Education Commission of the States provides a searchable database
comparing state policies on awarding credit for AP and IB exam scores.40
While low-income and minority students continue to struggle with access to
college for a number of reasons, states should not focus solely on affordability.
There are a number of exemplary state models and initiatives that have
expanded access to AP and IB courses.41 Promising practices underscore
the need to create greater access to college admission exams (SAT and ACT)
and simplify the fi nancial aid application process, while promoting a resolute
commitment to eliminate barriers that restrict underserved and low-income
students from access to rigorous course work.
40. The Education Commission of the States, Advanced Placement: State Requires Postsecondary Institutions to
Award Credit for AP Exam Scores (2010). http://mb2.ecs.org/reports/Report.aspx?id=2134
41. The Education Commission of the States Policy Brief, Strategies to Empower Low-Income and Minority
Students in Gaining Admission to and Paying for College, (2008).
Recommendation Four 110
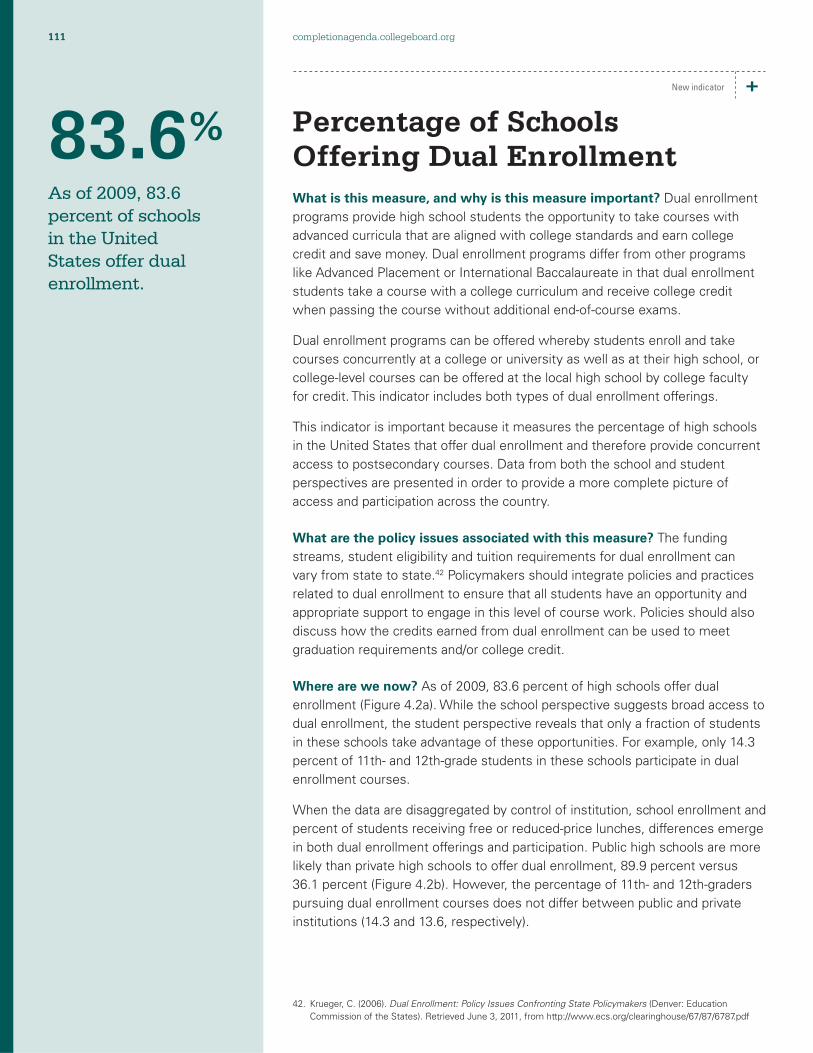
completionagenda.collegeboard.org
Percentage of Schools Offering Dual EnrollmentWhat is this measure, and why is this measure important? Dual enrollment
programs provide high school students the opportunity to take courses with
advanced curricula that are aligned with college standards and earn college
credit and save money. Dual enrollment programs differ from other programs
like Advanced Placement or International Baccalaureate in that dual enrollment
students take a course with a college curriculum and receive college credit
when passing the course without additional end-of-course exams.
Dual enrollment programs can be offered whereby students enroll and take
courses concurrently at a college or university as well as at their high school, or
college-level courses can be offered at the local high school by college faculty
for credit. This indicator includes both types of dual enrollment offerings.
This indicator is important because it measures the percentage of high schools
in the United States that offer dual enrollment and therefore provide concurrent
access to postsecondary courses. Data from both the school and student
perspectives are presented in order to provide a more complete picture of
access and participation across the country.
What are the policy issues associated with this measure? The funding
streams, student eligibility and tuition requirements for dual enrollment can
vary from state to state.42 Policymakers should integrate policies and practices
related to dual enrollment to ensure that all students have an opportunity and
appropriate support to engage in this level of course work. Policies should also
discuss how the credits earned from dual enrollment can be used to meet
graduation requirements and/or college credit.
Where are we now? As of 2009, 83.6 percent of high schools offer dual
enrollment (Figure 4.2a). While the school perspective suggests broad access to
dual enrollment, the student perspective reveals that only a fraction of students
in these schools take advantage of these opportunities. For example, only 14.3
percent of 11th- and 12th-grade students in these schools participate in dual
enrollment courses.
When the data are disaggregated by control of institution, school enrollment and
percent of students receiving free or reduced-price lunches, differences emerge
in both dual enrollment offerings and participation. Public high schools are more
likely than private high schools to offer dual enrollment, 89.9 percent versus
36.1 percent (Figure 4.2b). However, the percentage of 11th- and 12th-graders
pursuing dual enrollment courses does not differ between public and private
institutions (14.3 and 13.6, respectively).
42. Krueger, C. (2006). Dual Enrollment: Policy Issues Confronting State Policymakers (Denver: Education
Commission of the States). Retrieved June 3, 2011, from http://www.ecs.org/clearinghouse/67/87/6787.pdf
83.6% As of 2009, 83.6 percent of schools in the United States offer dual enrollment.
New indicator
111

completionagenda.collegeboard.org
0
10
20
30
40
50
60
70
80
90
100
Schools offeringenrollment
Mean studentsenrolled
83.6%
14.3%
0
10
20
30
40
50
60
70
80
90
100
Public Private
89.9%
36.1%
14.3% 13.6%
National Percentage of Schools That Offer Dual Enrollment and Mean Percentage of Students Enrolled in Dual Enrollment, 2009Source: NACAC, State of College Admission, 2010
4.2a
National Percentage of Schools That Offer Dual Enrollment and Mean Percentage of Students Enrolled in Dual Enrollment, by Control of Institution, 2009Source: NACAC, State of College Admission, 2010
4.2b Schools Offering
Enrollment
Mean StudentsEnrolled
New fi gure
New fi gure
Recommendation Four 112

completionagenda.collegeboard.org
Schools with 1,500 to 1,999 students are most likely to offer dual enrollment
(92.6 percent), while smaller schools with fewer than 500 students are least
likely to offer dual enrollment (79.6 percent). However, a higher percentage of
11th- and 12th-grade students participate in dual enrollment in smaller schools.
An average of 19.0 percent of 11th- and 12th-grade students in schools with
fewer than 500 students participate in dual enrollment (Figure 4.2c), compared
to 12.8 percent or less in schools with 500 or more students.
There is little variability in the percentage of schools that offer dual enrollment
based on the percentage of students eligible for free or reduced-price lunch
programs (FRPL) (Figure 4.2d).
When interpreting this measure, what should be kept in mind? The terms
dual enrollment, middle college high schools and early college high schools are
used interchangeably, but are structured in very different ways. Dual enrollment
programs have the most fl exible locations — on high school campuses, on
college campuses or through distance-learning programs. Middle college
high schools are less fl exible with location and are only available on college
campuses. Early college high schools combine the resources of high school
and college to provide an advanced curriculum for students. The presentation
of schools offering dual enrollment courses should not be misconstrued as
the only type of rigorous high school curriculum. It is the best measure that is
available to date.
0
10
20
30
40
50
60
70
80
90
100
Fewer than500 students
500to 999
1,000to 1,499
1,500to 1,999
2,000or more
79.6%
19.0%
82.0%
12.8%
86.5%
9.6% 11.8%
92.6% 91.1%
10.2%
National Percentage of Schools That Offer Dual Enrollment and Mean Percentage of Students Enrolled in Dual Enrollment, by School Enrollment, 2009Source: NACAC, State of College Admission, 2010
4.2c Schools Offering
Enrollment
Mean StudentsEnrolled
New fi gure
113

completionagenda.collegeboard.org
0
10
20
30
40
50
60
70
80
90
100
0 to 25Percent
26 to 50Percent
51 to 75Percent
76 to 100Percent
87.5%
13.8%
91.7%
14.8%
89.9%
14.6%
86.6%
13.7%
National Percentage of Schools That Offer Dual Enrollment and Mean Percentage of Students Enrolled in Dual Enrollment Who Receive Free or Reduced-Price Lunches, 2009Source: NACAC, State of College Admission, 2010
4.2d Schools Offering
Enrollment
Mean StudentsEnrolled
New fi gure
Recommendation Four 114

completionagenda.collegeboard.org
Percentage of States with Alignment Between K–12 and Higher Education StandardsWhat is this measure, and why is this measure important? This indicator
measures the degree to which states have coordinated K–12 and postsecondary
expectations to ensure that students have access to and complete a high
school curriculum that will prepare them for success after graduation.
Measures include the percentage of states that have aligned high school
standards and college and workplace expectations; the percentage of states
with alignment between high school graduation requirements and college and
workplace expectations; the percentage of states with college- and career-
ready assessment systems; the percentage of states with longitudinal data
systems connecting preschool through graduate study educational data; and
the percentage of states committed to adopting the Common Core State
Standards. These measures are important because they establish the state
environment necessary to foster student access to a curriculum that will ensure
that they are ready for college and work after leaving high school.
What are the policy issues associated with this measure? These measures
are important because they refl ect policies that have the potential to improve
educational and workforce outcomes. States that encourage collaboration and
alignment between K–12 and higher education benefi t when students need less
remediation in order to be successful in college or the workplace.
Where are we now? As of 2010, 31 states (60.8 percent) have alignment
between high school standards and college and workplace expectations (Figure
4.3a). However, only 20 states and the District of Columbia (41.2 percent)
have alignment between high school graduation requirements with college
and workplace expectations (Figure 4.3b). Fourteen states (27.5 percent) have
a college- and career-ready assessment system (Figure 4.3c). Sixteen states
(31.4 percent) have P–20 longitudinal data systems that integrate educational
information from preschool through graduate school (Figure 4.3d). Forty-one
states and the District of Columbia (82.4 percent) have adopted the Common
Core State Standards in English language arts and mathematics (Figure 4.3e).
When interpreting this measure, what should be kept in mind? There is
a lot of variation in high school graduation requirements across states. High
schools and institutions of higher education may work together to align courses
within a state, but until these standards are implemented nationwide students
who attend college out-of-state may fi nd diffi culty in making sure these
systems are aligned.
60.8% As of 2010, 31 states have alignment between high school standards and college and workplace expectations.
15.8ppts 2009–2010
41.2% As of 2010, 20 states and the District of Columbia have alignment between high school graduation requirements and college and workplace expectations.
2.2ppts 2009–2010
115

completionagenda.collegeboard.org
YES 60.8%
NO 39.2%
YESAlabamaArizonaArkansasCaliforniaColoradoDelawareFloridaGeorgiaIndianaKentuckyLouisianaMaineMarylandMichiganMinnesotaMississippiNebraskaNew JerseyNew Mexico
New YorkNorth CarolinaOhioOklahomaOregonRhode IslandSouth CarolinaTennesseeTexasVirginiaWashingtonWest Virginia
NO AlaskaConnecticutDistrict of ColumbiaHawaiiIdaho
IllinoisIowaKansasMassachusettsMissouriMontanaNevadaNew HampshireNorth DakotaPennsylvaniaSouth DakotaUtahVermontWisconsinWyoming
YES 41.2%
NO 58.8%
YESAlabamaArizonaArkansasDelawareDistrict of ColumbiaGeorgiaIndianaKentuckyMichiganMinnesotaMississippiNebraskaNew MexicoNew YorkNorth CarolinaOhioOklahomaSouth DakotaTennesseeTexasWashington
NO AlaskaCaliforniaColoradoConnecticutFloridaHawaiiIdahoIllinoisIowaKansasLouisianaMaineMarylandMassachusettsMissouriMontanaNevadaNew HampshireNew JerseyNorth DakotaOregon
PennsylvaniaRhode IslandSouth CarolinaUtahVermontVirginiaWest VirginiaWisconsinWyoming
Percentage of States with Alignment Between High School Standards and College and Workplace Expectations, 2010Source: Achieve, Inc., 2010
Percentage of States with Alignment Between High School Graduation Requirements and College and Workplace Expectations, 2010Source: Achieve, Inc., 2010
4.3a
4.3b
Recommendation Four 116

completionagenda.collegeboard.org
27.5% As of 2010, 14 states have a college- and career-ready assessment system.
7.5ppts 2009–2010
31.4% As of 2010, 16 states have P–20 longitudinal data systems.
8.4ppts 2009–2010
82.4%As of 2010, 41 states and the District of Columbia have adopted the Common Core State Standards.
13.6ppts 2009–2010
YES 27.5%
NO 72.5%
YESAlabamaCaliforniaColoradoGeorgiaHawaiiIllinoisKentuckyLouisianaMaineMichiganNew YorkTennesseeTexasWisconsin
NO AlaskaArizonaArkansasConnecticutDelawareDistrict of ColumbiaFloridaIdahoIndianaIowaKansasMarylandMassachusettsMinnesotaMississippiMissouriMontanaNebraskaNevadaNew HampshireNew Jersey
New MexicoNorth CarolinaNorth DakotaOhioOklahomaOregonPennsylvaniaRhode IslandSouth CarolinaSouth DakotaUtahVermontVirginiaWashingtonWest VirginiaWyoming
YESAlabamaAlaskaArkansasDelawareFloridaGeorgiaIowaLouisianaMissouriNevadaOregonPennsylvaniaTexasUtahWashingtonWyoming
NO ArizonaCaliforniaColoradoConnecticutDistrict of ColumbiaHawaiiIdahoIllinoisIndianaKansasKentuckyMaineMarylandMassachusettsMichiganMinnesotaMississippiMontanaNebraskaNew Hampshire
New JerseyNew MexicoNew YorkNorth CarolinaNorth DakotaOhioOklahomaRhode IslandSouth CarolinaSouth DakotaTennesseeVermontVirginiaWest VirginiaWisconsin
YES 31.4%
NO 68.6%
Percentage of States with College- and Career-Ready Assessment Systems, 2010Source: Achieve, Inc., 2010
Percentage of States with P–20 Longitudinal Data Systems, 2010Source: Achieve, Inc., 2010
4.3c
4.3d
117
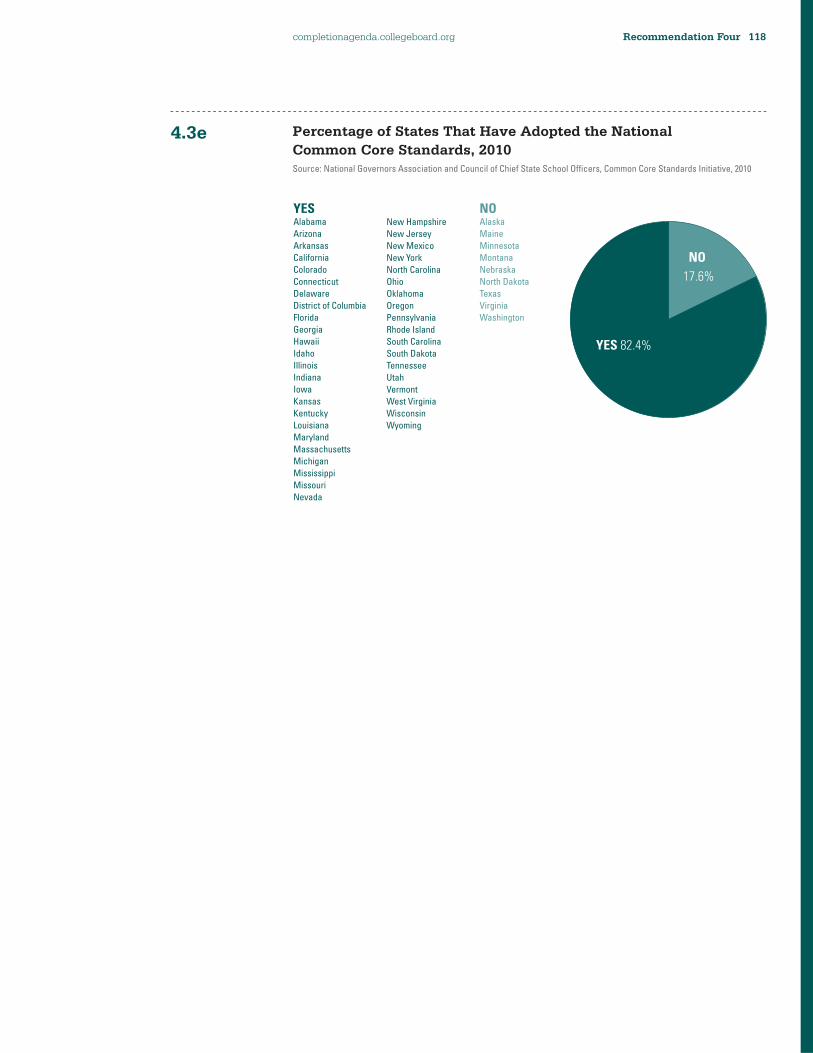
completionagenda.collegeboard.org
YES 82.4%
NO
17.6%
YESAlabamaArizonaArkansasCaliforniaColoradoConnecticutDelawareDistrict of ColumbiaFloridaGeorgiaHawaiiIdahoIllinoisIndianaIowaKansasKentuckyLouisianaMarylandMassachusettsMichiganMississippiMissouriNevada
New HampshireNew JerseyNew MexicoNew YorkNorth CarolinaOhioOklahomaOregonPennsylvaniaRhode IslandSouth CarolinaSouth DakotaTennesseeUtahVermontWest VirginiaWisconsinWyoming
NOAlaskaMaineMinnesotaMontanaNebraskaNorth DakotaTexasVirginiaWashington
Percentage of States That Have Adopted the National Common Core Standards, 2010Source: National Governors Association and Council of Chief State School Offi cers, Common Core Standards Initiative, 2010
4.3e
Recommendation Four 118

completionagenda.collegeboard.org
Percentage of Students in Remedial College ClassesWhat is this measure, and why is this measure important? This indicator
measures the percentage of fi rst- and second-year undergraduate students
who participate in remedial or developmental classes to improve basic skills
in reading, writing, mathematics or study skills. This can be used to examine
whether students are prepared adequately for college-level work and illustrates
the consequences of misaligned expectations for high school graduates and
beginning college students. The data contained in this indicator refl ect both
degree- and nondegree-seeking students (i.e., those pursuing certifi cates and/or
not enrolled in a degree program).
What are the policy issues associated with this measure? Central to this
discussion is the question of whether remedial course offerings are appropriate
at the college level and whether those courses should be offered at all colleges
or be restricted to two-year colleges.43 There are concerns about the costs
of remedial course offerings and the impact of remedial course offerings on
academic standards at four-year institutions.44 In response to these pressures,
some states have taken steps to reduce or eliminate remedial course offerings
at four-year institutions and to restrict the use of public funds for such courses.
Policies should be in place to ensure that students who are in remedial courses
are aware of the implications this may have on their educational trajectory and/
or expected graduation date. But fundamentally, the policy issue is that students
are not arriving at college ready to participate in classes. Unfortunately, minority
students are typically overrepresented in these remedial classes.
Where are we now? As of 2008, 37.6 percent of fi rst- and second-year
undergraduate students are in at least one remedial college class (Figure 4.4a).
While the remediation rates are lowest for students who identify as white (33.1
percent), “two or more races” (35.5 percent), “other” (37.0 percent) and Asian
(38.1 percent); the remediation rates are considerably higher among students
who identify as African American (47.3 percent), Hispanic (45.1 percent) and
American Indian (43.9 percent; Figure 4.4b).
Females have a higher remediation rate than males (40.2 percent versus 34.2
percent; Figure 4.4c). The remediation rate is higher for 30- to 39-year-olds
(Figure 4.4d). The remediation rate ranges from 29.7 percent for students who
are 18 years old or younger to 43.2 percent for students who are 30 to 39
years old.
43. McCabe, R. No One to Waste (Denver: Community College Press, 2000); Shults, C. Institutional Policies and
Practices in Remedial Education: A National Study of Community Colleges (ED447884) (Washington, DC:
American Association of Community Colleges, 2000).
44. Hoyt, J., and Sorenson, C. (2001). High School Preparation, Placement Testing, and College Remediation.
Journal of Developmental Education, 25(2): 26–33.
37.6% As of 2008, 37.6 percent of fi rst- and second-year undergraduate students in the United States are in remedial courses after high school graduation.
47.3% As of 2008, 47.3 percent of African American fi rst- and second-year undergraduate students in the United States are in remedial courses after high school graduation.
Updated data source
119

completionagenda.collegeboard.org
45.1% As of 2008, 45.1 percent of Hispanic fi rst- and second-year undergraduate students in the United States are in remedial courses after high school graduation.
43.9% As of 2008, 43.9 percent of Native American fi rst- and second-year undergraduate students in the United States are in remedial courses after high school graduation.
0
10
20
30
40
50
60
70
80
90
100
AfricanAmerican
AmericanIndian
Asian Hispanic OtherPacificIslander
Two orMoreRaces
White
47.3%43.9%
38.1%45.1%
37.0%40.6%35.5%33.1%
AVG
37.6%
Percentage of First- and Second-Year Undergraduates in Remedial Courses After High School Graduation by Race/Ethnicity, 2008Source: NCES, Profi le of Undergraduate Students: 2007-08, 2010
4.4b
ENROLLED
37.6% NOT
ENROLLED
62.4%
Percentage of First- and Second-Year Undergraduates in Remedial Courses After High School Graduation, 2008Source: NCES, Profi le of Undergraduate Students: 2007-08, 2010
4.4a New fi gure
New fi gure
Recommendation Four 120

completionagenda.collegeboard.org
Across income levels, the remediation rate is higher among low-income fi rst-
and second-year undergraduate students. The remediation rate for students
in the lowest income quartile is 41.9 percent compared to 31.3 percent for
students in the highest income quartile (Figure 4.4e).
In general, remediation rates are higher for public institutions versus private
institutions. Public two-year institutions have the highest remediation rates
(44.5 percent; Figures 4.4f and 4.4g). Exclusively, part-time students have
higher remediation rates compared to full-time students (42.5 percent and 34.5
percent, respectively (Figure 4.4h). A slightly higher proportion of second-year
undergraduate students (39.9 percent) take at least one remedial course
when compared to fi rst-year students (36.2 percent; Figure 4.4i).
When interpreting this measure, what should be kept in mind? The National Center for Education Statistics generally defi nes postsecondary
remedial education as courses in reading, writing, mathematics or study skills
for college-level students lacking the skills necessary to perform at the level
required by the institution.45 Students participating in remedial education in
college may not earn credit toward their degrees following course completion.
The National Postsecondary Student Aid Study (NPSAS) data, unlike the other
indicators in this report, include Puerto Rico. The NPSAS is based on a nationally
representative sample of all students in postsecondary education institutions,
which comprises undergraduate, graduate and fi rst-professional students.
Despite the number of students with access to the survey, only the responses
from fi rst- and second-year undergraduates or undergraduates not in a degree
program are considered for the question related to remedial courses. A study
of this type, designed to collect data on signifi cant fi nancial aid issues, has not
been replicated since 2008.
45. Parsad, B., Lewis, L., and Greene, B. (November 2003). Remedial Education at Degree-Granting
Postsecondary Institutions in Fall 2000 (Washington, DC: National Center for Education Statistics).
33.1% As of 2008, 33.1 percent of white fi rst- and second-year undergraduate students in the United States are in remedial courses after high school graduation.
38.1% As of 2008, 38.1 percent of Asian fi rst- and second-year undergraduate students in the United States are in remedial courses after high school graduation.
121

completionagenda.collegeboard.org
Percentage of First- and Second-Year Undergraduates in Remedial Courses After High School Graduation by Gender, 2008Source: NCES, Profi le of Undergraduate Students: 2007-08, 2010
4.4c
0
10
20
30
40
50
60
70
80
90
100
MaleFemale
34.2%40.2% AVG
37.6%
New fi gure
Recommendation Four 122

completionagenda.collegeboard.org
Percentage of First- and Second-Year Undergraduates in Remedial Courses After High School Graduation by Income, 2008Source: NCES, Profi le of Undergraduate Students: 2007-08, 2010
4.4e
0
10
20
30
40
50
60
70
80
90
100
Highest25 percent
Lowest25 percent
Middle50 percent
41.9%38.1%
31.3%
AVG
37.6%
New fi gure
Percentage of First- and Second-Year Undergraduates in Remedial Courses After High School Graduation by Age, 2008Source: NCES, Profi le of Undergraduate Students: 2007-08, 2010
4.4d
0
10
20
30
40
50
60
70
80
90
100
18 or younger 19–23 24–29 30–39 40 or older
29.7%
36.1%42.5% 43.2% 40.8% AVG
37.6%
New fi gure
123
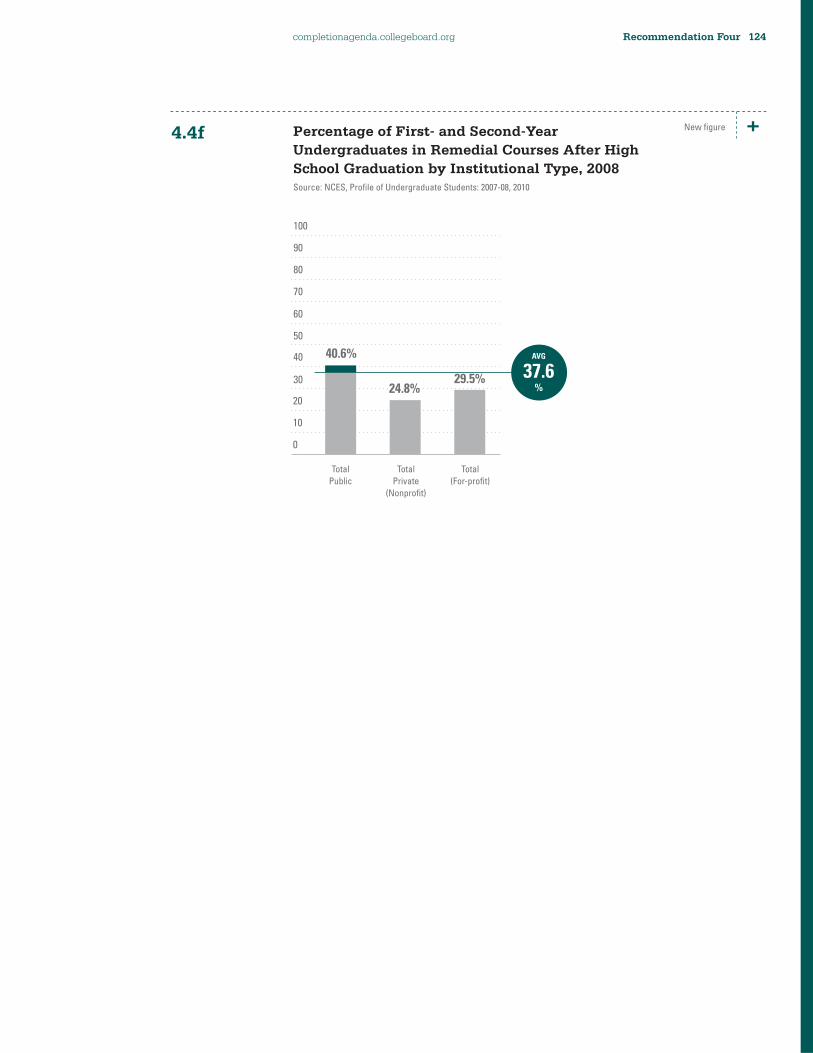
completionagenda.collegeboard.org
Percentage of First- and Second-Year Undergraduates in Remedial Courses After High School Graduation by Institutional Type, 2008Source: NCES, Profi le of Undergraduate Students: 2007-08, 2010
4.4f
0
10
20
30
40
50
60
70
80
90
100
Total(For-profit)
TotalPublic
TotalPrivate
(Nonprofit)
40.6%
24.8%29.5%
AVG
37.6%
New fi gure
Recommendation Four 124

completionagenda.collegeboard.org
Percentage of First- and Second-Year Undergraduates in Remedial Courses After High School Graduation by Attendance Intensity, 2008Source: NCES, Profi le of Undergraduate Students: 2007-08, 2010
4.4h
0
10
20
30
40
50
60
70
80
90
100
Exclusivelypart-time
Anyfull-time
34.5%42.5%
AVG
37.6%
New fi gure
Percentage of First- and Second-Year Undergraduates in Remedial Courses After High School Graduation by Institutional Type, 2008Source: NCES, Profi le of Undergraduate Students: 2007-08, 2010
4.4g
0
10
20
30
40
50
60
70
80
90
100
For-profit(Lessthan
2-year)
For-profit(2 yearsor more)
Public(Less than
2-year)
Public(2-year)
Private(Nonprofit,
Lessthan
4-year)
Public(4-year
doctorate-granting)
Public(4-year
non-doctorate-granting)
Private(Nonprofit,
4-yearnon-
doctorate-granting)
Private(Nonprofit,
4-yeardoctorate-granting)
44.5%
35.8%
26.4%21.4%
26.1% 30.7%32.3% 37.6%
23.7%
AVG
37.6%
New fi gure
125

completionagenda.collegeboard.org
Percentage of First- and Second-Year Undergraduates in Remedial Courses After High School Graduation by Class Level, 2008Source: NCES, Profi le of Undergraduate Students: 2007-08, 2010
4.4i
0
10
20
30
40
50
60
70
80
90
100
Second-yearundergraduate
First-yearundergraduate
36.2%39.9% AVG
37.6%
New fi gure
Recommendation Four 126
FiveImprove teacher quality and focus on recruitment and retention
WE RECOMMEND that states, localities and the federal government step up to the crisis in teaching by providing market-competitive salaries, creating multiple pathways into teaching, and fi xing the math and science crisis.
completionagenda.collegeboard.org
It is critical for the United States to substantially improve the quality of
teachers to ensure that students have the benefi t of learning from the most
highly qualifi ed and innovative teachers possible. Professional development
is important to constantly improving the quality of teachers, yet more must
be done to encourage more highly qualifi ed individuals to choose teaching as
a profession. The issue is so important that the National Council on Teacher
Quality (NCTQ) began creating a biennial State Teacher Policy Yearbook that
identifi es critical areas in which teacher policy needs to improve for every state
in the nation.46
NCTQ’s Yearbook evaluates states based on fi ve goals: (1) teacher preparation;
(2) teacher recruitment; (3) identifi cation of effective teachers; (4) retention of
effective teachers; and (5) exiting of ineffective teachers. In general, these goals
cover the areas of recruitment and retention of teachers. In the Yearbook, each
state receives an overall grade and a grade in each of the fi ve areas mentioned
above. In the 2010 Yearbook, most of the states received an overall grade of
C or D. The recruitment and retention for individuals in the teaching profession
is complex, yet it is necessary to ensure that teacher quality is constantly
improving.
There are multiple approaches to assessing teacher quality; those featured in this report include:
• State encouragement and support for teacher professional development;
• Percentage of public school teachers of grades nine through 12 by fi eld;
• State policies on out-of-fi eld teachers;
• Percentage of bachelor’s, master’s and doctoral degrees earned in
education;
• Percentage of teachers leaving the profession;
• Data systems to monitor teacher quality; and
• Percentage of teachers by full-time teaching experience.
46. National Council on Teacher Quality. Blueprint for Change: 2010 State Teacher Policy Yearbook. Retrieved from
http://www.nctq.org/stpy09/updates/national.jsp
Recommendation Five 128

completionagenda.collegeboard.org
General Findings for This Recommendation• As of 2010, 40 states have professional development standards for teachers.
• As of 2010, 24 states fi nance professional development for all districts.
• As of 2010, 16 states require districts/schools to set aside time for
professional development.
• As of 2010, 31 states require districts to align professional development with
local priorities and goals.
• As of 2008, English or language arts teachers represent 15.9 percent of the
public secondary school teachers, followed by 13.4 percent for mathematics,
12.8 percent for vocational/technical, 11.6 percent for natural sciences, 11.4
for social sciences, 10.2 percent for special education, and less than 8.0
percent each for arts and music, foreign languages and health and physical
education.
• As of 2010, six states require parental notifi cation of out-of-fi eld teachers.
• As of 2010, four states have a ban or cap on the number of out-of-fi eld
teachers allowed in K–12 classrooms.
• As of 2008, education degrees represent 6.6 percent of bachelor’s degrees,
28.1 percent of master’s degrees, and 13.3 percent of doctoral degrees
earned in one year.
• As of 2008, 8.0 percent of public school teachers and 15.9 percent of private
school teachers do not return to the teaching profession the following
academic year.
• As of 2010, 13 states include student achievement as a part of the teacher
evaluation process.
• As of 2010, 20 states are able to match student and teacher records by
course/subject with state assessment results.
• As of 2008, 13.4 percent of teachers have less than three years , 33.6
percent of teachers have three to nine years, 29.3 percent of teachers have
ten to 20 years, and 23.7 percent of teachers have more than 20 years of
full-time teaching experience.
129

completionagenda.collegeboard.org
State Encouragement and Support for Teacher Professional DevelopmentWhat is this measure, and why is this measure important? To ensure that
teachers continue to build upon the knowledge and skills developed through
undergraduate and/or graduate education, they must participate in ongoing quality
professional development initiatives. The content of professional development
activities for teachers may be guided by a set of agreed upon standards by a local
education agency, the decision of the building administrator and/or the decision
of an individual teacher. Thus, the quality of these experiences must be closely
monitored to assure teachers are gaining access to knowledge that will provide
more opportunity for students to attain college and career success. One such
entity that monitors and identifi es teachers who have met high standards based
on what teachers know and should be able to do is the National Board
for Professional Teaching Standards.47
47. National Board for Professional Teaching Standards. For more information, see http://www.nbpts.org/
78.4% As of 2010, 40 states have professional development standards for teachers.
1.6ppts 2009–2010
47.1% As of 2010, 24 states fi nance professional development for all districts.
2009–2010
States with Professional Development Standards, 2010Source: Education Week, Quality Counts, 2010
5.1a
YES 78%
NO 22%
YESAlabamaArizonaArkansasColoradoConnecticutDelawareFloridaGeorgiaHawaiiIndianaIowaKansasKentuckyLouisianaMaineMarylandMassachusettsMichiganMinnesotaMississippi
MissouriMontanaNew HampshireNew JerseyNew MexicoNew YorkNorth CarolinaNorth DakotaOhioOklahomaOregonPennsylvaniaRhode IslandSouth CarolinaTennesseeUtahVermontVirginiaWashingtonWest Virginia
NOAlaskaCaliforniaDistrict of ColumbiaIdahoIllinoisNebraskaNevadaSouth DakotaTexasWisconsinWyoming
Recommendation Five 130
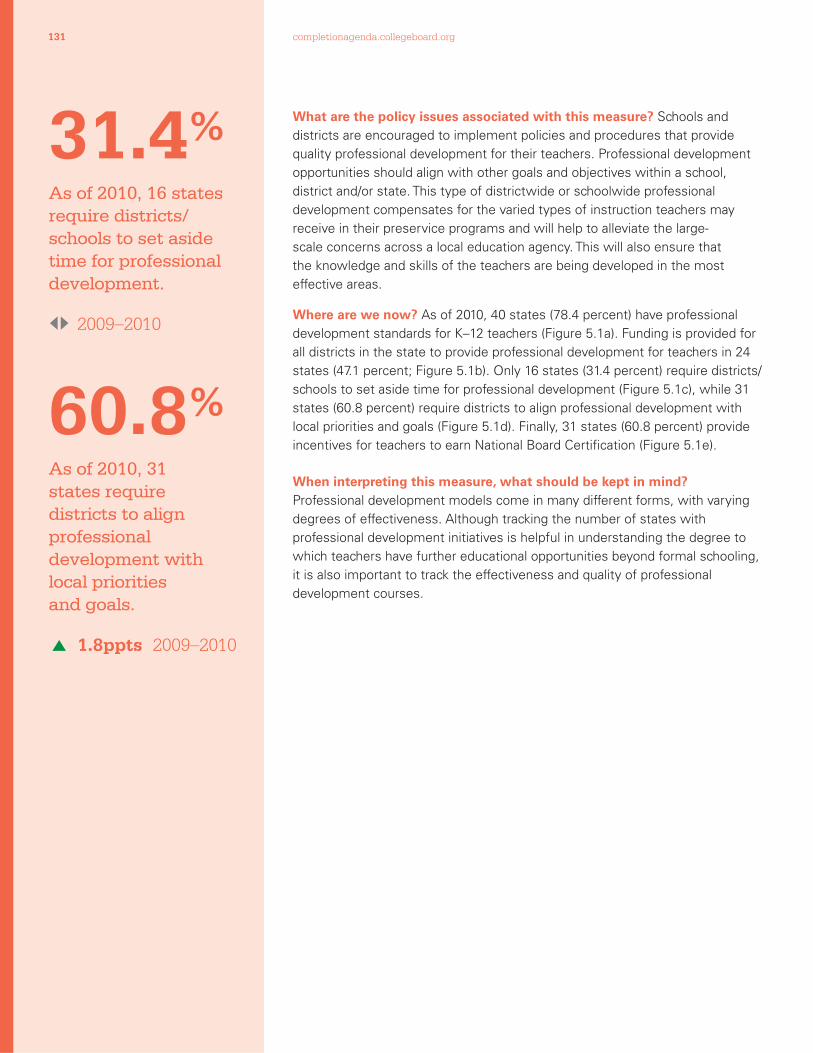
completionagenda.collegeboard.org
What are the policy issues associated with this measure? Schools and
districts are encouraged to implement policies and procedures that provide
quality professional development for their teachers. Professional development
opportunities should align with other goals and objectives within a school,
district and/or state. This type of districtwide or schoolwide professional
development compensates for the varied types of instruction teachers may
receive in their preservice programs and will help to alleviate the large-
scale concerns across a local education agency. This will also ensure that
the knowledge and skills of the teachers are being developed in the most
effective areas.
Where are we now? As of 2010, 40 states (78.4 percent) have professional
development standards for K–12 teachers (Figure 5.1a). Funding is provided for
all districts in the state to provide professional development for teachers in 24
states (47.1 percent; Figure 5.1b). Only 16 states (31.4 percent) require districts/
schools to set aside time for professional development (Figure 5.1c), while 31
states (60.8 percent) require districts to align professional development with
local priorities and goals (Figure 5.1d). Finally, 31 states (60.8 percent) provide
incentives for teachers to earn National Board Certifi cation (Figure 5.1e).
When interpreting this measure, what should be kept in mind? Professional development models come in many different forms, with varying
degrees of effectiveness. Although tracking the number of states with
professional development initiatives is helpful in understanding the degree to
which teachers have further educational opportunities beyond formal schooling,
it is also important to track the effectiveness and quality of professional
development courses.
31.4% As of 2010, 16 states require districts/schools to set aside time for professional development.
2009–2010
60.8% As of 2010, 31 states require districts to align professional development with local priorities and goals.
1.8ppts 2009–2010
131

completionagenda.collegeboard.org
YES 47% NO 53%
YESAlabamaArkansasDelawareGeorgiaHawaiiIowaKentuckyLouisianaMarylandMinnesotaMissouriMontanaNebraskaNevadaNorth CarolinaNorth DakotaPennsylvaniaRhode IslandSouth Carolina
UtahVirginiaWashingtonWest VirginiaWisconsin
NO AlaskaArizonaCaliforniaColoradoConnecticutDistrict of ColumbiaFloridaIdahoIllinoisIndianaKansasMaine
MassachusettsMichiganMississippiNew HampshireNew JerseyNew MexicoNew YorkOhioOklahomaOregonSouth DakotaTennesseeTexasVermontWyoming
YES 31%
NO 69%
YESAlabamaArkansasConnecticutDelawareGeorgiaKentuckyLouisianaMichiganMontanaNebraskaNew YorkNorth DakotaSouth CarolinaTennesseeVermontWest Virginia
NOAlaskaArizonaCaliforniaColoradoDistrict of ColumbiaFloridaHawaiiIdahoIllinoisIndianaIowaKansasMaineMarylandMassachusettsMinnesotaMississippiMissouri
NevadaNew HampshireNew JerseyNew MexicoNorth CarolinaOhioOklahomaOregonPennsylvaniaRhode IslandSouth DakotaTexasUtahVirginiaWashingtonWisconsinWyoming
States That Finance Professional Development for All Districts, 2010Source: Education Week, Quality Counts, 2010
States That Require Districts/Schools to Set Aside Time for Professional Development, 2010Source: Education Week, Quality Counts, 2010
5.1b
5.1c
Recommendation Five 132
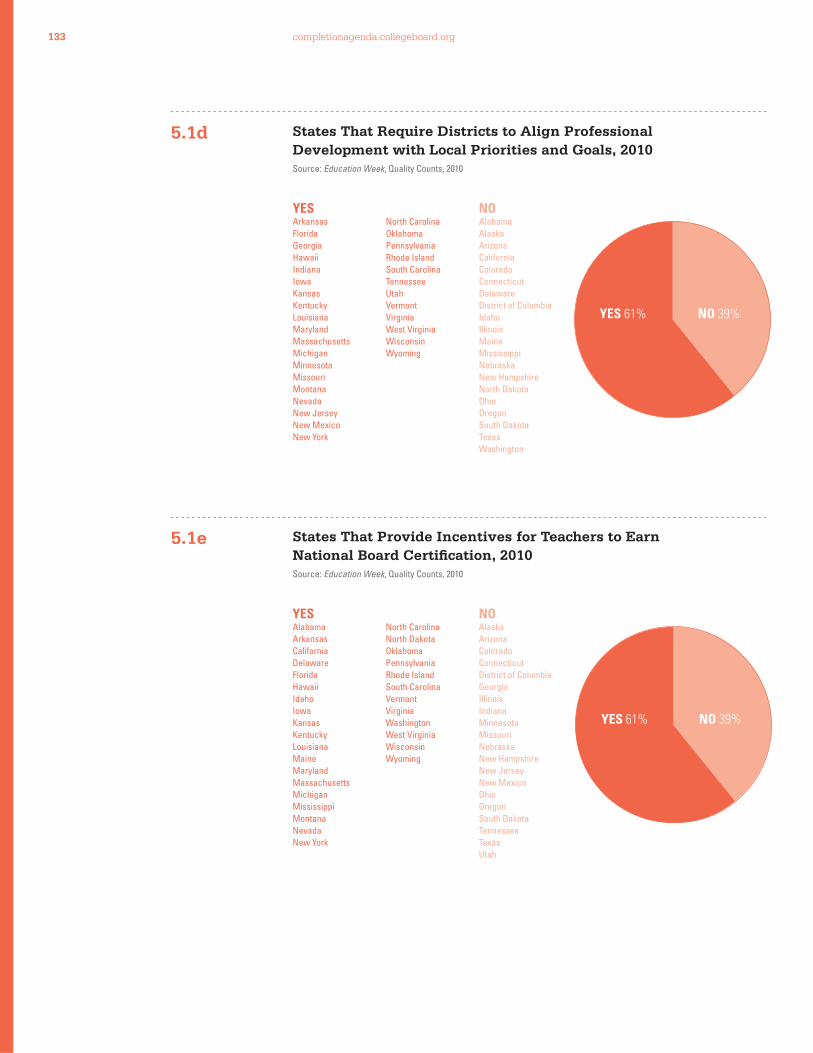
completionagenda.collegeboard.org
YES 61% NO 39%
YESArkansasFloridaGeorgiaHawaiiIndianaIowaKansasKentuckyLouisianaMarylandMassachusettsMichiganMinnesotaMissouriMontanaNevadaNew JerseyNew MexicoNew York
North CarolinaOklahomaPennsylvaniaRhode IslandSouth CarolinaTennesseeUtahVermontVirginiaWest VirginiaWisconsinWyoming
NOAlabamaAlaskaArizonaCaliforniaColoradoConnecticutDelawareDistrict of ColumbiaIdahoIllinoisMaineMississippiNebraskaNew HampshireNorth DakotaOhioOregonSouth DakotaTexasWashington
YES 61% NO 39%
YESAlabamaArkansasCaliforniaDelawareFloridaHawaiiIdahoIowaKansasKentuckyLouisianaMaineMarylandMassachusettsMichiganMississippiMontanaNevadaNew York
North CarolinaNorth DakotaOklahomaPennsylvaniaRhode IslandSouth CarolinaVermontVirginiaWashingtonWest VirginiaWisconsinWyoming
NOAlaskaArizonaColoradoConnecticutDistrict of ColumbiaGeorgiaIllinoisIndianaMinnesotaMissouriNebraskaNew HampshireNew JerseyNew MexicoOhioOregonSouth DakotaTennesseeTexasUtah
States That Require Districts to Align Professional Development with Local Priorities and Goals, 2010Source: Education Week, Quality Counts, 2010
States That Provide Incentives for Teachers to Earn National Board Certifi cation, 2010Source: Education Week, Quality Counts, 2010
5.1d
5.1e
133

completionagenda.collegeboard.org
Percentage of Public School Teachers of Grades Nine Through 12 by FieldWhat is this measure, and why is this measure important? The data in
this measure present the primary teaching assignments of public school
teachers for grades nine through 12. This highlights the demand for teachers
in the mathematics and science fi elds — disciplines that have long struggled
with recruitment and retention issues. Highly qualifi ed teachers in this area
are necessary to build the pipeline of students who will be able to work in
the mathematics and science fi elds. The United States Department of Labor
recommends building the gateway to science, technology, engineering and
mathematics career fi elds through K–12 education.48 Thus, the identifi cation of
STEM teachers is a pivotal role in the nation’s ability to remain competitive with
other countries in economic growth and sustainability.
What are the policy issues associated with this measure? The number of
teachers of grades nine through 12 in a specifi c subject area is closely related to
the course requirements for graduation. If states require students to complete
a specifi c sequence of courses to receive a high school diploma, it is expected
that the schools offer these courses to students. Thus states, districts and
schools may be limited in the number of mathematics and science teachers
they can hire if these courses are not required for graduation. Policymakers
should strive to ensure that their graduation standards require students to
complete rigorous mathematics and science courses, specifi cally with the intent
of preparing students for the demands of the workforce.
Where are we now? As of 2008, 15.9 percent of public high school teachers
teach English or language arts while 11.4 percent teach social sciences
(Figure 5.2a). Collectively, one out of four public high school teachers teaches
mathematics or science, 13.4 percent teach mathematics and 11.6 percent
teach natural sciences. Vocational/technical teachers constitute 12.8 percent of
public high school teachers, and special education teachers represent a slightly
smaller portion of teachers (10.2 percent). Arts and music, foreign languages,
and health and physical education teachers each represent less than 8.0 percent
of public high school teachers.
48. United States Department of Labor. (2007). The STEM Workforce Challenge: The role of the public workforce
system in a national solution for a competitive science, technology, engineering, and mathematics (STEM)
workforce. Retrieved from http://www.doleta.gov/youth_services/pdf/STEM_Report_4%2007.pdf
15.9% As of 2008, 15.9 percent of public high school teachers teach English or language arts classes.
13.4% As of 2008, 13.4 percent of public high school teachers teach mathematics classes.
11.6% As of 2008, 11.6 percent of public high school teachers teach science classes.
Recommendation Five 134
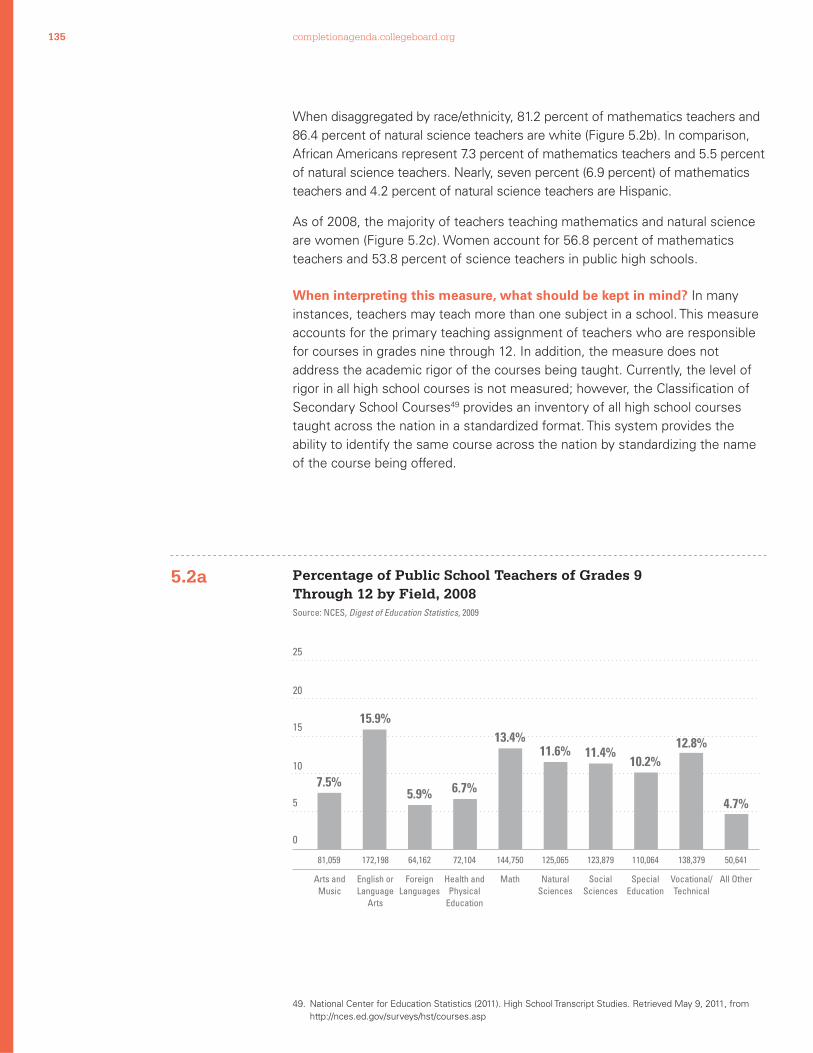
completionagenda.collegeboard.org
When disaggregated by race/ethnicity, 81.2 percent of mathematics teachers and
86.4 percent of natural science teachers are white (Figure 5.2b). In comparison,
African Americans represent 7.3 percent of mathematics teachers and 5.5 percent
of natural science teachers. Nearly, seven percent (6.9 percent) of mathematics
teachers and 4.2 percent of natural science teachers are Hispanic.
As of 2008, the majority of teachers teaching mathematics and natural science
are women (Figure 5.2c). Women account for 56.8 percent of mathematics
teachers and 53.8 percent of science teachers in public high schools.
When interpreting this measure, what should be kept in mind? In many
instances, teachers may teach more than one subject in a school. This measure
accounts for the primary teaching assignment of teachers who are responsible
for courses in grades nine through 12. In addition, the measure does not
address the academic rigor of the courses being taught. Currently, the level of
rigor in all high school courses is not measured; however, the Classifi cation of
Secondary School Courses49 provides an inventory of all high school courses
taught across the nation in a standardized format. This system provides the
ability to identify the same course across the nation by standardizing the name
of the course being offered.
49. National Center for Education Statistics (2011). High School Transcript Studies. Retrieved May 9, 2011, from
http://nces.ed.gov/surveys/hst/courses.asp
0
5
10
15
20
25
Arts andMusic
English orLanguage
Arts
ForeignLanguages
Health andPhysical
Education
Math NaturalSciences
SocialSciences
SpecialEducation
Vocational/Technical
All Other
13.4%11.6%
6.7%5.9%7.5%
15.9%
11.4%10.2%
12.8%
4.7%
81,059 172,198 64,162 125,065 123,879 110,064 138,379 50,64172,104 144,750
Percentage of Public School Teachers of Grades 9 Through 12 by Field, 2008Source: NCES, Digest of Education Statistics, 2009
5.2a
135

completionagenda.collegeboard.org
0
10
20
30
40
50
60
70
80
90
AfricanAmerican
AsianAmericanIndian/
Alaska Native
PacificIslander
Hispanic White Two or More Races
2.9%
2.0%
0.4%
0.7%
0.2%
0.4% 1.1%
0.8%7.
3%
5.5% 6.9%
4.2%
81.2
%
86.4
%
10,567 579 4,198 117,537 1,5929,988 290
6,879 875 2,501 108,057 1,0015,253 500
0
10
20
30
40
50
60
70
80
90
Female Male
56.8%53.8%
43.2%46.2%
82,218 62,532
67,285 57,780
Percentage of Public School Teachers of Grades 9 Through 12 in Mathematics and Science Fields by Race/Ethnicity, 2008Source: NCES, Digest of Education Statistics, 2009
Percentage of Public School Teachers of Grades 9 Through 12 in Mathematics and Science Fields by Gender, 2008Source: NCES, Digest of Education Statistics, 2009
5.2b
5.2c
Mathematics
Natural Sciences
Mathematics
Natural Sciences
Recommendation Five 136
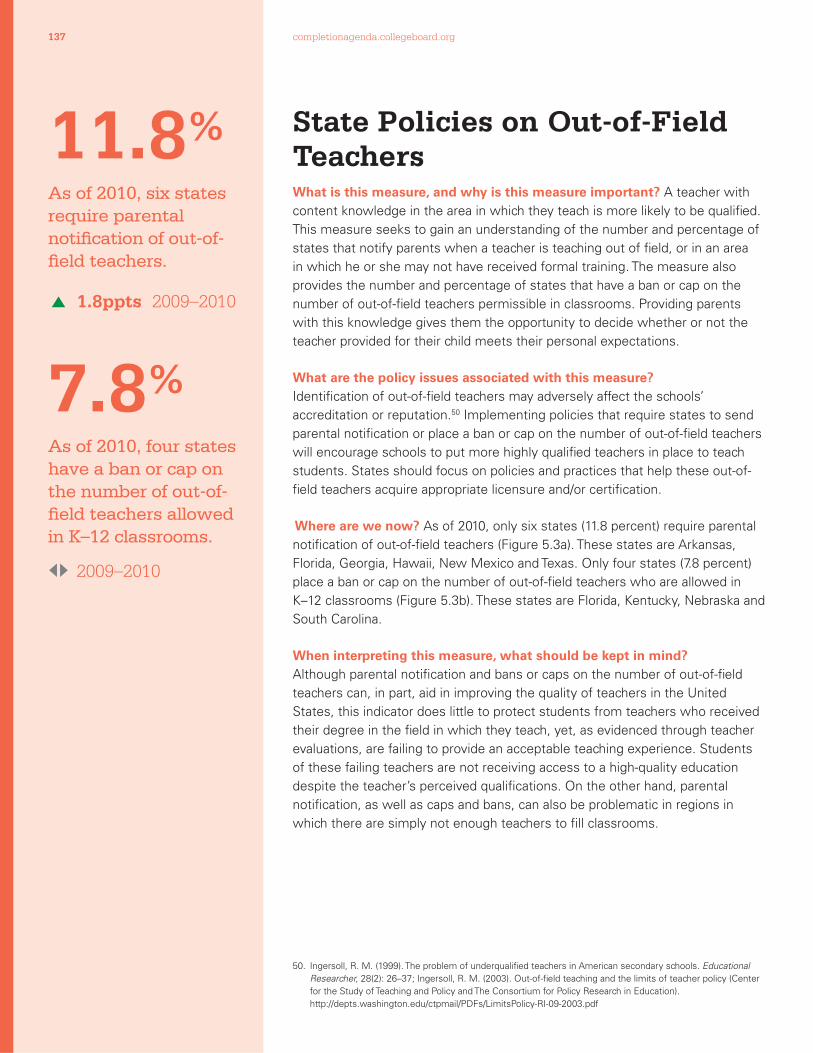
completionagenda.collegeboard.org
State Policies on Out-of-Field TeachersWhat is this measure, and why is this measure important? A teacher with
content knowledge in the area in which they teach is more likely to be qualifi ed.
This measure seeks to gain an understanding of the number and percentage of
states that notify parents when a teacher is teaching out of fi eld, or in an area
in which he or she may not have received formal training. The measure also
provides the number and percentage of states that have a ban or cap on the
number of out-of-fi eld teachers permissible in classrooms. Providing parents
with this knowledge gives them the opportunity to decide whether or not the
teacher provided for their child meets their personal expectations.
What are the policy issues associated with this measure? Identifi cation of out-of-fi eld teachers may adversely affect the schools’
accreditation or reputation.50 Implementing policies that require states to send
parental notifi cation or place a ban or cap on the number of out-of-fi eld teachers
will encourage schools to put more highly qualifi ed teachers in place to teach
students. States should focus on policies and practices that help these out-of-
fi eld teachers acquire appropriate licensure and/or certifi cation.
Where are we now? As of 2010, only six states (11.8 percent) require parental
notifi cation of out-of-fi eld teachers (Figure 5.3a). These states are Arkansas,
Florida, Georgia, Hawaii, New Mexico and Texas. Only four states (7.8 percent)
place a ban or cap on the number of out-of-fi eld teachers who are allowed in
K–12 classrooms (Figure 5.3b). These states are Florida, Kentucky, Nebraska and
South Carolina.
When interpreting this measure, what should be kept in mind? Although parental notifi cation and bans or caps on the number of out-of-fi eld
teachers can, in part, aid in improving the quality of teachers in the United
States, this indicator does little to protect students from teachers who received
their degree in the fi eld in which they teach, yet, as evidenced through teacher
evaluations, are failing to provide an acceptable teaching experience. Students
of these failing teachers are not receiving access to a high-quality education
despite the teacher’s perceived qualifi cations. On the other hand, parental
notifi cation, as well as caps and bans, can also be problematic in regions in
which there are simply not enough teachers to fi ll classrooms.
50. Ingersoll, R. M. (1999). The problem of underqualifi ed teachers in American secondary schools. Educational
Researcher, 28(2): 26–37; Ingersoll, R. M. (2003). Out-of-fi eld teaching and the limits of teacher policy (Center
for the Study of Teaching and Policy and The Consortium for Policy Research in Education).
http://depts.washington.edu/ctpmail/PDFs/LimitsPolicy-RI-09-2003.pdf
11.8% As of 2010, six states require parental notifi cation of out-of-fi eld teachers.
1.8ppts 2009–2010
7.8% As of 2010, four states have a ban or cap on the number of out-of-fi eld teachers allowed in K–12 classrooms.
2009–2010
137

completionagenda.collegeboard.org
YES 8%
NO 92%
YESFloridaKentuckyNebraskaSouth Carolina
NO AlabamaAlaskaArizonaArkansasCaliforniaColoradoConnecticutDelawareDistrict of ColumbiaGeorgiaHawaii
IdahoIllinoisIndianaIowaKansasLouisianaMaineMarylandMassachusettsMichiganMinnesotaMississippiMissouriMontanaNevadaNew HampshireNew JerseyNew Mexico
New YorkNorth CarolinaNorth DakotaOhioOklahomaOregonPennsylvaniaRhode IslandSouth DakotaTennesseeTexasUtahVermontVirginiaWashingtonWest VirginiaWisconsinWyoming
YES
12%
NO 88%
YESArkansasFloridaGeorgiaHawaiiNew MexicoTexas
NO AlabamaAlaskaArizonaCaliforniaColoradoConnecticutDelawareDistrict of ColumbiaIdahoIllinois
IndianaIowaKansasKentuckyLouisianaMaineMarylandMassachusettsMichiganMinnesotaMississippiMissouriMontanaNebraskaNevadaNew HampshireNew JerseyNew YorkNorth Carolina
North DakotaOhioOklahomaOregonPennsylvaniaRhode IslandSouth CarolinaSouth DakotaTennesseeUtahVermontVirginiaWashingtonWest VirginiaWisconsinWyoming
States That Require Parental Notifi cation of Out-of-Field Teachers, 2010Source: Education Week, Quality Counts, 2010
States That Have a Ban or Cap on the Number of Out-of-Field Teachers, 2010Source: Education Week, Quality Counts, 2010
5.3a
5.3b
Recommendation Five 138

completionagenda.collegeboard.org
Percentage of Bachelor’s, Master’s and Doctoral Degrees Earned in EducationWhat is this measure, and why is this measure important? The percentage
of degrees earned in education indirectly refl ects the proportion of graduates
who may be eligible for teacher licensure. Obtaining teacher licensure is a
critical step in becoming a highly qualifi ed teacher.
What are the policy issues associated with this measure? Students seeking
teacher licensure or certifi cation upon graduation are encouraged to attend
an institution with an approved education program. The National Council for
Accreditation of Teacher Education (NCATE)51 is a membership organization that
provides standards by which schools of education are assessed to determine
the level of rigor in the curriculum and the quality of the teacher preparation
programs. Policymakers should ensure that their decisions about improving
teacher education programs in their state are supported by organizations such
as NCATE and are grounded in evidence-based research.
Where are we now? The trend is decreasing for the percentage of graduates
who earn a bachelor’s degree in education (Figure 5.4a). Conversely, the trend is
slightly increasing for the percentage of graduates who earn a master’s degree
in education. The trend is relatively stable for percentage of graduates who earn
a doctoral degree in education with the highest percentage (14.8 percent) in
2002 and 2003.
When disaggregated by race/ethnicity, whites represent 84.4 percent of
bachelor’s degrees, 76.7 percent of master’s degrees and 65.8 percent of
doctoral degrees conferred in education (Figure 5.4b). African Americans earn
6.4 percent of bachelor’s degrees, 10.2 percent of master’s degrees and 16.9
percent of doctoral degrees in education. Nonresident aliens represent about
8.0 percent of doctoral degrees in education.
When disaggregated by gender, women earn the majority of bachelor’s degrees
(78.7 percent), master’s degrees (77.2 percent) and doctoral degrees (67.3
percent) in education (Figure 5.4c).
51. National Council for Accreditation of Teacher Education (2010). Retrieved March 21, 2010, from
http://www.ncate.org/
6.6% As of 2008, education degrees represent 6.6 percent of the bachelor’s degrees earned in one year.
2007–2008*
28.1% As of 2008, education degrees represent 28.1 percent of master’s degrees earned in one year.
1.1ppts 2007–2008*
* Data are not comparable to data in 2010 Progress Report and change is based on calculation from new source.
139

completionagenda.collegeboard.org
13.3% As of 2008, education degrees represent 13.3 percent of doctoral degrees earned in one year.
2007–2008*
0
10
20
30
40
50
60
70
80
1997 1998 1999 2000 2001 2002 2003 2004 2005 2006 2007 2008
25.9%
13.7%
9.0%
26.4%
13.6%
8.9%
26.8%
14.5%
8.9%
26.9%
14.3%
8.7%
27.3%
14.0%
8.5%
28.0%
14.8%
8.2%
28.8%
14.8%
7.8%
29.0%
14.7%
7.6%
29.1%
14.6%
7.3%
29.4%
13.5%
7.2%
29.2%
13.6%
6.9%
28.1%
13.3%
6.6%
0
10
20
30
40
50
60
70
80
Asian/Pacific Islander
AmericanIndian/
Alaska Native
AfricanAmerican
(Non-Hispanic)
Hispanic White(Non-Hispanic)
NonresidentAlien
2.1%
2.6%
3.3%
0.9%
0.7%
0.7%
6.4% 10
.2% 16
.9%
5.3% 6.8%
5.2%
84.4
%
76.7
%
65.8
%
1.0% 3.0% 8.
0%
2,154
4,573
280
923
1,231
59
5,437
11,960
442
86,579
134,900
5,587
1,026
5,276
679
6,565
17,940
1,435
Bachelor’s
Master’s
Doctoral
Bachelor’s
Master’s
Doctoral
Updated data source
Updated data source
* Data are not comparable to data in 2010 Progress Report and change is based on calculation from new source.
Percentage of Bachelor’s, Master’s or Doctoral Degrees Earned in Education, 1997–2008Source: NCES, Digest of Education Statistics, 2009
Percentage of Bachelor’s, Master’s or Doctoral Degrees Earned in Education by Race/Ethnicity, 2008Source: NCES, Digest of Education Statistics, 2009
5.4a
5.4b
Recommendation Five 140

completionagenda.collegeboard.org
When placed in rank order by state, Minnesota has the highest percentage
(22.4 percent) of bachelor’s and master’s degrees earned in education (Figure
5.4d). Mississippi, Kentucky, Arizona and Delaware are among the states
with the highest percentage of bachelor’s and master’s degrees earned in
education. The District of Columbia has the lowest percentage (5.5 percent)
of bachelor’s and master’s degrees earned in education. Colorado, Texas,
California and Rhode Island are among the states with the lowest percentage of
bachelor’s and master’s degrees earned in education. Wyoming has the highest
percentage (13.9 percent) of bachelor’s degrees earned in education (Figure
5.4e). Colorado has the lowest percentage (0.7 percent) of bachelor’s degrees
earned in education. Minnesota has the highest percentage (46.0 percent) of
master’s degrees earned in education (Figure 5.4f). The District of Columbia has
the lowest percentage (10.3 percent) of master’s degrees earned in education.
When interpreting this measure, what should be kept in mind? Education degree programs include various areas of education beyond
teacher education, such as educational psychology, religious education, school
counseling, athletic training, curriculum and instruction, educational statistics
and educational evaluation, among other areas. The number of graduates in
education is not a direct measure of the number of graduates completing an
approved teacher education program.
0
10
20
30
40
50
60
70
80
MaleFemale
80,732
135,779
5,714
21,850
40,101
2,777
21.3
%
22.8
%
32.7
%
78.7
%
77.2
%
67.3
%
Percentage of Bachelor’s, Master’s or Doctoral Degrees Earned in Education by Gender, 2008Source: NCES, Digest of Education Statistics, 2009
5.4c Bachelor’s
Master’s
Doctoral
Updated data source
141

completionagenda.collegeboard.org
Percentage of Bachelor’s and Master’s Degrees Earned in Education by State Rank, 2008Source: NCES, Digest of Education Statistics, 2009
5.4d
0 10 20 30 40 50 60 70 80 90 100
Minnesota
Mississippi
Kentucky
Arizona
Delaware
New Mexico
Nevada
Arkansas
Alabama
Nebraska
Wyoming
Illinois
Idaho
Maine
Kansas
New York
Ohio
South Carolina
Alaska
Georgia
South Dakota
Wisconsin
Michigan
Indiana
West Virginia
Montana
Missouri
Oregon
Utah
Pennsylvania
North Dakota
Tennessee
UNITED STATES
Oklahoma
Hawaii
Massachusetts
North Carolina
Iowa
New Jersey
Connecticut
Florida
New Hampshire
Louisiana
Maryland
Vermont
Washington
Virginia
Rhode Island
California
Texas
Colorado
District of Columbia
22.4%
19.9%
19.0%
18.3%
18.1%
18.0%
17.8%
17.4%
16.6%
16.6%
16.4%
16.3%
16.1%
16.1%
15.8%
15.7%
15.4%
15.0%
14.5%
14.3%
14.1%
14.0%
13.8%
13.6%
13.6%
13.4%
13.1%
13.1%
13.1%
12.9%
12.8%
12.8%
12.7%
12.4%
11.9%
11.7%
11.7%
11.6%
11.4%
11.3%
11.0%
11.0%
10.8%
10.7%
10.0%
9.8%
9.3%
9.2%
8.1%
6.8%
6.3%
5.5%
32
U.S. Average
19
States
States
AVG
12.7%
New fi gure
Recommendation Five 142

completionagenda.collegeboard.org
Percentage of Bachelor’s Degrees Earned in Education by State Rank, 2008Source: NCES, Digest of Education Statistics, 2009
5.4e
0 10 20 30 40 50 60 70 80 90 100
Wyoming
Mississippi
Idaho
Arkansas
New Mexico
Kentucky
North Dakota
Utah
Nebraska
Maine
Indiana
Montana
Georgia
Ohio
Oklahoma
South Dakota
Alabama
Kansas
South Carolina
Delaware
Illinois
West Virginia
Wisconsin
Michigan
North Carolina
Minnesota
Missouri
Iowa
Louisiana
Pennsylvania
Nevada
Florida
Hawaii
Rhode Island
UNITED STATES
Arizona
New York
New Jersey
New Hampshire
Tennessee
Vermont
Washington
Maryland
Alaska
Oregon
Connecticut
Massachusetts
Texas
Virginia
California
District of Columbia
Colorado
13.9%
13.5%
12.5%
12.4%
12.3%
11.2%
11.1%
10.9%
10.8%
10.8%
10.5%
10.3%
10.1%
10.0%
9.9%
9.7%
9.6%
9.6%
9.5%
9.3%
9.2%
9.2%
9.0%
8.8%
8.5%
8.4%
8.2%
7.9%
7.6%
7.5%
7.3%
7.3%
6.8%
6.7%
6.6%
6.2%
6.2%
5.6%
5.6%
5.4%
5.1%
4.9%
4.6%
4.5%
4.0%
3.8%
2.7%
2.2%
2.0%
1.8%
0.9%
0.7%
34
U.S. Average
17
States
States
AVG
6.6%
New fi gure
143

completionagenda.collegeboard.org
Percentage of Master’s Degrees Earned in Education by State Rank, 2008Source: NCES, Digest of Education Statistics, 2009
5.4f
0 10 20 30 40 50 60 70 80 90 100
Minnesota
Nevada
Kentucky
Oregon
Mississippi
Maine
Delaware
South Carolina
Alaska
Tennessee
Arizona
Idaho
Arkansas
Nebraska
New York
Wisconsin
Kansas
Alabama
South Dakota
New Mexico
Ohio
Virginia
Illinois
Iowa
UNITED STATES
Montana
Pennsylvania
Connecticut
Wyoming
Hawaii
Georgia
Michigan
Massachusetts
West Virginia
Washington
New Jersey
New Hampshire
California
Indiana
Missouri
Utah
Louisiana
North Carolina
Maryland
Florida
Oklahoma
Vermont
Rhode Island
Texas
Colorado
North Dakota
District of Columbia
46.0%
45.7%
40.8%
40.6%
39.2%
38.9%
38.5%
36.3%
36.1%
35.1%
35.0%
34.3%
34.1%
34.1%
33.1%
33.1%
32.7%
32.1%
32.0%
31.2%
30.8%
29.4%
28.9%
28.9%
28.1%
27.9%
27.7%
27.7%
27.2%
27.2%
26.9%
26.9%
26.9%
26.5%
26.4%
26.2%
25.1%
24.9%
23.5%
23.1%
22.2%
22.2%
21.7%
21.7%
21.6%
21.5%
21.5%
20.5%
20.4%
20.2%
19.8%
10.3%
24
U.S. Average
27
States
States
AVG
28.1%
New fi gure
Recommendation Five 144

completionagenda.collegeboard.org
Percentage of Teachers Leaving the ProfessionWhat is this measure, and why is this measure important? This measure
tracks the percentage of teachers leaving the profession from one school year to
the next. It provides insight into the number of teachers needed to be recruited
and trained to replace those leaving the profession.
What are the policy issues associated with this measure? Teacher attrition occurs for a variety of reasons; however, many teachers have
cited dissatisfaction with the various aspects of the job as their reason for
leaving.52 Teacher turnover can be very costly. These teachers have received
professional development and other support services during their tenure that
will have to be repeated for their replacement counterparts. Schools with
high poverty rates and high populations of African American and/or Latino
students lose teachers at a higher rate than other schools.53 The Alliance for
Excellent Education estimates that the cost of replacing teachers who leave
the profession is $2.2 billion per year.54
Where are we now? Overall the annual rate of public and private school teachers
leaving the profession has increased from 1989 to 2009, although there was a
slight decrease for public school teachers from 2005–2009 (Figure 5.5a). As of
2008, 8.0 percent of public school teachers and 15.9 percent of private school
teachers do not return to the teaching profession the following academic year.
When disaggregated by race/ethnicity, the attrition rate is highest among African
American teachers in both public (9.0 percent) and private (24.2 percent) schools
(Figure 5.5b). In public schools, Hispanic teachers have the lowest attrition
rate (5.6 percent). In private schools, the attrition rate is lowest among white
teachers (14.7 percent).
52. Ingersoll, R. M. (2001). Teacher turnover and teacher shortages: An organizational analysis. American
Educational Research Journal, 38(3): 499–534.
53. Barnes, G., Crowe, E., and Schafer, B. (2007). The cost of teacher turnover in fi ve school districts:
A pilot study. Retrieved Feb. 19, 2010, from http://www.nctaf.org/resources/demonstration_projects/turnover/
TeacherTurnoverCostStudy.htm
54. Alliance for Excellent Education (2005). Teacher attrition: A costly loss to the nation and to the states. Retrieved
Feb. 19, 2010, from http://www.all4ed.org/fi les/archive/publications/TeacherAttrition.pdf p.1.
8.0% As of 2008, 8.0 percent of public school teachers do not return to the teaching profession the following academic year.
2007–2008
15.9% As of 2008, 15.9 percent of private school teachers do not return to the teaching profession the following academic year.
2.3ppts 2007–2008
145

completionagenda.collegeboard.org
The attrition rate for public school teachers does not vary by gender (Figure
5.5c). As of 2008, 8.0 percent of male and female public school teachers
do not return to the teaching profession the following academic year. In the
private sector, however, a slightly higher percentage of females (16.4 percent)
than males (14.3 percent) do not return to the teaching profession after the
academic year.
When disaggregated by age, the attrition rate in public schools is highest among
teachers ages 50 and over (10.0 percent; Figure 5.5d). Public school teachers
ages 40 to 49 have the lowest attrition rate (3.9 percent) among public school
teachers. In private schools the attrition rate is highest among teachers who are
younger than 30 years old (21.1 percent). Private school teachers ages 40 to 49
have the lowest attrition rate (10.9 percent).
When interpreting this measure, what should be kept in mind? This measure describes teachers who left the profession entirely. Individual
schools, districts and states may face additional attrition challenges when staff
pursue teaching opportunities in other schools, districts or states. This measure
also does not consider the factors that result in teachers leaving the profession.
National Percentage of Teachers Leaving the Profession by School Type, 1989–2009Source: NCES, Teacher Attrition and Mobility: Results From the 2008-09 Teacher Follow-up Survey, 2010
5.5a
0
5
10
15
20
25
30
1989 1992 1995 2001 2005 2009
12.7% 13.6%
5.6%
12.3%
5.1%
11.9%
6.6%
12.5%
7.4%8.4%
15.9%
8.0%
Public
Private
Recommendation Five 146

completionagenda.collegeboard.org
National Percentage of Teachers Leaving the Profession by Race/Ethnicity, 2009Source: NCES, Teacher Attrition and Mobility: Results From the 2008-09 Teacher Follow-up Survey, 2010*Data not available
National Percentage of Teachers Leaving the Profession by Gender, 2009Source: NCES, Teacher Attrition and Mobility: Results From the 2008-09 Teacher Follow-up Survey, 2010
5.5b
5.5c
0
5
10
15
20
25
30
Asian/ Pacific Islander*
American Indian/ Alaska Native*
AfricanAmerican
Hispanic White Total
8.0%9.0%
24.2%
5.6%
23.7%
8.0%
14.7%
8.0%
15.9%
0
5
10
15
20
25
30
MaleFemale Total
7.9%
14.3%
8.0%
16.4%
8.0%
15.9%
Public
Private
Public
Private
147

completionagenda.collegeboard.org
National Percentage of Teachers Leaving the Profession by Age, 2009Source: NCES, Teacher Attrition and Mobility: Results From the 2008-09 Teacher Follow-up Survey, 2010
5.5d
0
5
10
15
20
25
30
Less Than 30 30 to 39 40 to 49 50 and Over Total
9.2%
21.1%
8.4%
18.2%
3.9%
10.9%10.0%
14.7%
8.0%
15.9%
Public
Private
Recommendation Five 148

completionagenda.collegeboard.org
Data Systems to Monitor Teacher QualityWhat is this measure, and why is this measure important? This measure
identifi es states that are able to match student and teacher records for the
purpose of evaluating teachers and monitoring student achievement. These
systems allow for the evaluation of teachers based on how their students
perform on state assessments. Teacher quality is evaluated via student
performance across courses/subject areas. Overall these data systems allow
for a more detailed look at the quality of a teacher.
What are the policy issues associated with this measure? The Educational
Technical Assistance Act of 2002 provides grant funding to states to support
the design, development and implementation of a statewide longitudinal data
system.55 With this funding came strong recommendations for best practices
for use of these data systems. States should be sure that their longitudinal data
systems provide them with the most information and align with federal policies
related to privacy, security and confi dentiality.
Where are we now? As of 2010, only 13 states (25.5 percent) can link teacher
evaluation to student achievement in their state data systems (Figure 5.6a).
Twenty states (39.2 percent) have the ability to link teacher and student records
by course/subject (Figure 5.6b). All states and the District of Columbia have
assigned unique identifi cation numbers to teachers (Figure 5.6c).
When interpreting this measure, what should be kept in mind? The creation
of integrated, statewide longitudinal data systems is a relatively new concept
in the fi eld of education. The knowledge and information that can be gleaned
from such longitudinal data systems are invaluable. The existence of these
longitudinal data systems is only one step; future efforts to improve teacher
quality should advocate for increased and appropriate usage of the data from
the longitudinal data systems to inform decision making.
55. National Center for Education Statistics. Statewide longitudinal data systems grant programs. Retrieved May
13, 2011, from http://nces.ed.gov/Programs/SLDS/index.asp
25.5% As of 2010, 13 states include student achievement as a part of the teacher evaluation process.
39.2% As of 2010, 20 states are able to match student and teacher records by course/subject with state assessment results.
New indicator
149
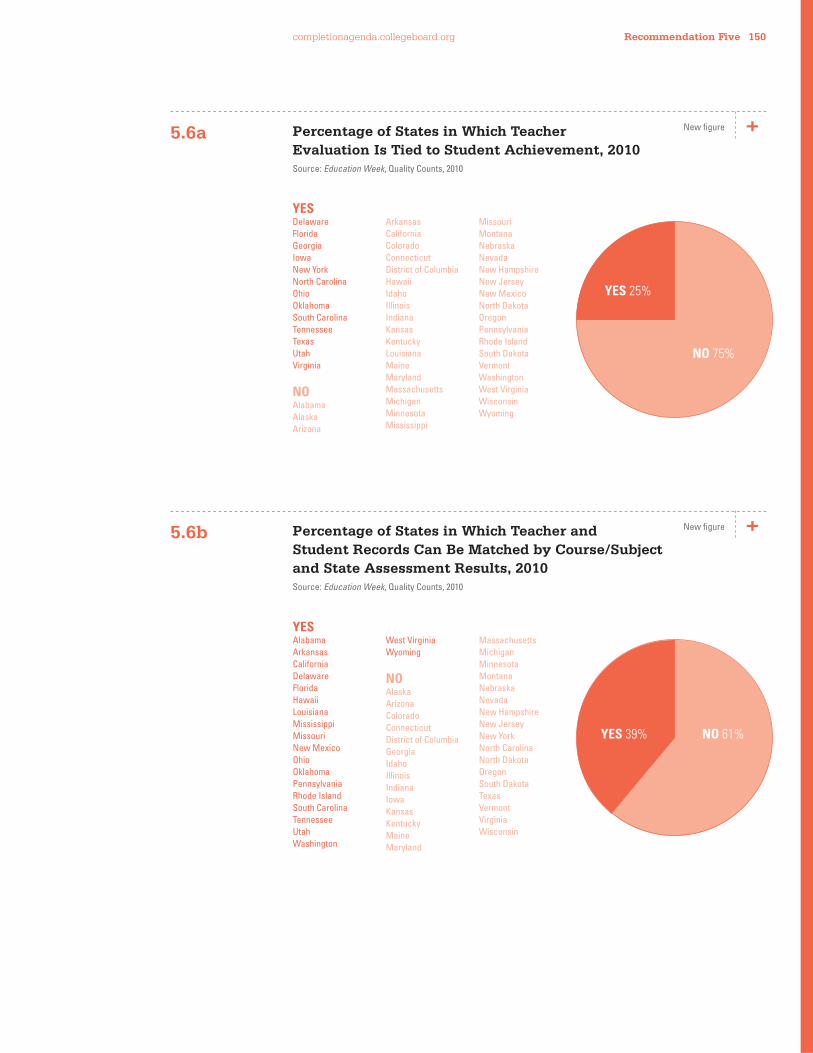
completionagenda.collegeboard.org
YES 25%
NO 75%
YESDelawareFloridaGeorgiaIowaNew YorkNorth CarolinaOhioOklahomaSouth CarolinaTennesseeTexasUtahVirginia
NO AlabamaAlaskaArizona
ArkansasCaliforniaColoradoConnecticutDistrict of ColumbiaHawaiiIdahoIllinoisIndianaKansasKentuckyLouisianaMaineMarylandMassachusettsMichiganMinnesotaMississippi
MissouriMontanaNebraskaNevadaNew HampshireNew JerseyNew MexicoNorth DakotaOregonPennsylvaniaRhode IslandSouth DakotaVermontWashingtonWest VirginiaWisconsinWyoming
YES 39% NO 61%
YESAlabamaArkansasCaliforniaDelawareFloridaHawaiiLouisianaMississippiMissouriNew MexicoOhioOklahomaPennsylvaniaRhode IslandSouth CarolinaTennesseeUtahWashington
West VirginiaWyoming
NO AlaskaArizonaColoradoConnecticutDistrict of ColumbiaGeorgiaIdahoIllinoisIndianaIowaKansasKentuckyMaineMaryland
MassachusettsMichiganMinnesotaMontanaNebraskaNevadaNew HampshireNew JerseyNew YorkNorth CarolinaNorth DakotaOregonSouth DakotaTexasVermontVirginiaWisconsin
Percentage of States in Which Teacher Evaluation Is Tied to Student Achievement, 2010Source: Education Week, Quality Counts, 2010
Percentage of States in Which Teacher and Student Records Can Be Matched by Course/Subject and State Assessment Results, 2010Source: Education Week, Quality Counts, 2010
5.6a
5.6b New fi gure
New fi gure
Recommendation Five 150

completionagenda.collegeboard.org
YES 100%
YESAlabamaAlaskaArizonaArkansasCaliforniaColoradoConnecticutDelawareDistrict of ColumbiaFloridaGeorgiaHawaiiIdahoIllinoisIndianaIowaKansasKentucky
LouisianaMaineMarylandMassachusettsMichiganMinnesotaMississippiMissouriMontanaNebraskaNevadaNew HampshireNew JerseyNew MexicoNew YorkNorth CarolinaNorth DakotaOhio
OklahomaOregonPennsylvaniaRhode IslandSouth CarolinaSouth DakotaTennesseeTexasUtahVermontVirginiaWashingtonWest VirginiaWisconsinWyoming
Percentage of States in Which Teachers Are Assigned a Unique Identifi cation Number, 2010Source: Education Week, Quality Counts, 2010
5.6c New fi gure
151
completionagenda.collegeboard.org
Percentage of Teachers by Full-Time Teaching Experience by StateWhat is this measure, and why is this measure important? This measure
describes teachers in terms of their years of full-time teaching experience.
This helps states plan strategies to recruit and retain teachers. For example,
states should consider the implications of when the percentage approaching
more than 20 years is relatively high and/or when the percentage of those
with three to 19 years of experience is decreasing. States will need to develop
and implement different strategies to retain teachers when the percentage of
teachers with less than three years of experience is relatively high.
What are the policy issues associated with this measure? The recruitment,
preparation and retention of teachers via competitive compensation and
benefi ts are important policy issues in many states. Some states are examining
these issues collectively, while others are focusing on the area of immediate
need. There is a need for states to collaborate more on these efforts by
providing licensure reciprocity between more states for families who relocate.
Where are we now? As of 2008, 13.4 percent of teachers in the United States
have less than three years of full-time teaching experience (Figure 5.7). When
disaggregated by state, Arizona has the highest percentage (21.0 percent) of
teachers with less than three years of full-time teaching experience. Rhode
Island has the lowest percentage (7.7 percent) of teachers with less than three
years of full-time teaching experience.
As of 2008, 33.6 percent of the teachers in the United States have three to nine
years of experience. Delaware has the highest percentage (43.3 percent) of
teachers with three to nine years of full-time teaching experience. North Dakota
has the lowest percentage (23.3 percent) of teachers with three to nine years
of full-time teaching experience.
As of 2008, 29.3 percent of the teachers in the United States have 10 to
20 years of experience. Alaska has the highest percentage (39.7 percent)
of teachers with 10 to 20 years of experience. New Jersey has the lowest
percentage (22.8 percent) of teachers with 10 to 20 years of experience.
13.4% As of 2008, 13.4 percent of teachers have less than three years of full-time teaching experience.
33.6% As of 2008, 33.6 percent of teachers have three to nine years of full-time teaching experience.
New indicator
Recommendation Five 152

completionagenda.collegeboard.org
29.3% As of 2008, 29.3 percent of teachers have 10 to 20 years of full-time teaching experience.
23.7% As of 2008, 23.7 percent of teachers have more than 20 years of full-time teaching experience.
The remaining 23.7 percent represent teachers with more than 20 years of
full-time teaching experience. West Virginia has the highest percentage (37.4
percent) of teachers with more than 20 years of teaching experience. Colorado
has the lowest percentage (16.8 percent) of teachers with more than 20 years
of teaching experience.
States such as Montana, Nebraska, North Dakota and West Virginia will face
unique challenges in coming years given that over one-third of their teachers
have more than 20 years of experience and may be nearing retirement.
When interpreting this measure, what should be kept in mind? The number
of years of teaching experience is a strong measure to help states understand
the teacher pipeline for their state. States should also consider these data
in conjunction with demographic information. For example, having a high
percentage of relatively inexperienced teachers may, in fact, refl ect a surge
in student enrollment that necessitated the hiring of new teachers. Also, the
percentage of teachers within a state by years of experience does not provide
any information about the quality of those teachers.
153

completionagenda.collegeboard.org
Percentage of Public K–12 Teachers by Years of Teaching Experience by State, 2008Source: NCES, Digest of Education Statistics, 2009
5.7
60 50 40 30 20 10 0 10 20 30 4090 80 70
Colorado
Alabama
Delaware
Arizona
Hawaii
Nevada
California
New York
Alaska
Missouri
Oregon
Utah
Georgia
New Mexico
Illinois
Massachusetts
Michigan
North Carolina
Florida
Idaho
Rhode Island
Minnesota
UNITED STATES
Texas
New Jersey
Kentucky
Maryland
Mississippi
District of Columbia
Washington
New Hampshire
Louisiana
Ohio
Wisconsin
Virginia
Tennessee
Oklahoma
Connecticut
Pennsylvania
Vermont
Iowa
South Carolina
Maine
Indiana
Kansas
Wyoming
Arkansas
South Dakota
Montana
Nebraska
North Dakota
West Virginia
17.2
14.4
10.6
21.0
18.6
15.6
13.5
12.8
12.0
13.3
18.0
19.9
10.3
13.3
13.4
11.1
9.4
15.6
14.8
12.5
7.7
12.7
13.4
17.1
12.3
10.2
12.0
17.1
20.0
14.1
13.3
12.7
12.1
9.8
14.1
13.6
10.9
12.2
12.5
11.7
11.4
12.8
12.3
9.2
13.0
10.3
10.7
11.4
11.0
11.4
12.0
13.1
37.9
31.3
43.3
34.6
34.3
37.3
35.9
38.0
27.5
34.2
31.5
32.9
32.4
35.6
35.6
39.9
32.5
37.3
35.0
31.0
37.0
28.5
33.6
31.2
40.8
35.5
37.1
31.8
29.9
27.8
31.7
33.3
29.9
32.4
32.8
28.8
31.4
29.7
33.6
30.5
30.5
31.5
27.0
32.3
30.2
27.3
25.7
23.7
26.9
24.2
23.3
26.4
28.1
36.1
27.9
26.1
28.6
27.8
30.3
28.5
39.7
31.6
29.5
26.0
35.9
29.6
29.3
27.2
36.3
25.0
27.4
33.6
32.2
35.3
29.3
27.7
22.8
30.1
26.2
26.1
24.6
32.6
29.1
27.6
31.6
31.4
26.6
30.8
30.7
31.1
26.7
30.5
29.9
27.3
31.5
29.1
27.2
32.5
32.1
32.5
28.8
30.2
30.0
23.1
16.8
18.2
18.2
18.4
18.6
19.4
20.3
20.6
20.7
20.8
21.0
21.2
21.4
21.5
21.6
21.8
21.8
22.0
22.8
22.8
23.1
23.6
23.7
24.0
24.1
24.2
24.8
25.1
25.5
25.5
26.0
26.3
26.3
26.4
26.5
26.8
27.0
27.1
27.2
27.3
28.2
28.5
29.1
29.4
29.6
29.9
31.6
32.4
33.3
34.2
34.7
37.4
Over 20 years
10 to 20 years
3 to 9 years
Less than 3 years
New fi gure
Recommendation Five 154

SixClarify and simplify the admission process
WE RECOMMEND that public and private institutions of higher education continue to uphold the highest professional standards in admission and fi nancial aid, and collaborate to make the admission process more transparent and less complex.
The commission believes that all students should easily navigate the college
admission process and that higher education should take steps to reduce the
complexity and mystery surrounding the process. Simplifying the admission
process does not necessarily mean requiring fewer application components.
Application requirements should offer suffi cient insight into the student’s
potential for success and provide a complete picture of the applicant. Applicants
will benefi t from increased transparency in admission terminology and greater
clarity in how admission decisions are made. For example, many students
agonize over the subtleties of recommended versus required application
components. Others devote an extraordinary amount of time to interviews,
many of which will play little to no role in admission decisions. Limiting
application requirements to elements that lend meaningful insight into the
student and to those that are truly factored into decisions will benefi t applicants,
as well as the admission offi cers tasked with reading applications.
Complexity is relative to the student, and no single metric exists with which
to assess it. While many applicants approach the admission process as well-
informed consumers with a comprehensive support system (e.g., counselors,
tutors and parents who have experienced the admission process), far more —
especially those from underrepresented minority, low-income and fi rst-generation,
college-going backgrounds — encounter the admission process without this
backing. Modern technology has led to several innovations that ultimately serve to
streamline and simplify the admission process and have the potential to reach a
broader array of applicants. Thus, we focus here primarily on the growth of online
application tools.
We look at the admission process from both the student’s and the institution’s perspective and focus on four indicators:
• Percentage of four-year colleges with applications available online;
• Percentage of four-year colleges to which students can submit
applications online;
• Percentage of four-year colleges that participate in national application
systems; and
• Immediate enrollment rate for high school graduates.
Recommendation Six 156completionagenda.collegeboard.org

General Findings for This Recommendation• As of 2009, 82.0 percent of four-year colleges report that their applications
are available online through their websites.
• As of 2009, applicants are able to submit applications online to 75.2 percent
of four-year colleges.
• As of 2009, 22.8 percent of four-year institutions participate in national
application systems that aim to streamline the admission process.
• As of 2010, 16 states and the District of Columbia have statewide
application systems for public four-year institutions that aim to streamline
the admission process.
• As of 2008, 68.6 percent of high school completers enroll in a two- or four-
year college immediately after completing high school.
• As of 2008, 55.7 percent of African American high school completers enroll
in a two- or four-year college immediately after completing high school.
• As of 2008, 63.9 percent of Hispanic high school completers enroll in a two-
or four-year college immediately after completing high school.
• As of 2008, 63.8 percent of high school graduates attend a two- or four-year
institution.
• As of 2008, 51.8 percent of high school graduates attend a two- or four-year
college located in the student’s home state.
• As of 2008, 12.0 percent of high school graduates attend a two- or four-year
college located outside of the student’s home state.
157 completionagenda.collegeboard.org
Percentage of Four-Year Colleges with Admission Applications Available OnlineWhat is this measure, and why is this measure important? The admission
profession fundamentally changed with the emergence of the Internet.
Institutions made great strides over the past decade and a half in utilizing the
Internet as an outreach tool for a new generation of technologically savvy
applicants. Admission offi cers quickly recognized the potential of the Internet
to disseminate applications to a broader range of applicants than the institution
might have attracted through traditional mailings.
One of the fi rst steps toward simplifying the process for all students is for
institutions to make their applications readily available online. This removes
potential obstacles for applicants, such as having to call during the school
day in order to reach the admission offi ce during business hours or missing
a deadline because of insuffi cient turnaround time to request, complete and
return the application.
What are the policy issues associated with this measure? Institutions and
their applicants benefi t from policies that increase the availability of applications
online. For most institutions, this means ensuring that adequate staff and
fi nancial resources are in place to develop, maintain and improve the admission
website. In addition, outreach efforts that aim to connect students with the
online application must be in place.
Where are we now? As of 2009,56 82.0 percent of four-year colleges and
universities in the United States have admission applications available online
for students. The percentage of colleges with an admission application available
online has grown from a low of 53.1 percent in 2001 to a high of 82.0 percent
in 2009 (Figure 6.1a).
56. These data refl ect policies that were in place during the 2008–2009 admission cycle, affecting students
who enrolled in fall 2009.
82.0% As of 2009, 82.0 percent of four-year colleges report that their application is available online through their website.
1.1ppts 2008–2009
Recommendation Six 158completionagenda.collegeboard.org

When disaggregated by state, the percentage ranges from 38.5 percent in
Arizona to 100 percent in Colorado, Hawaii and Wyoming. When placed in rank
order, the states with the highest percentage of institutions with admission
applications online are Colorado, Hawaii, Wyoming, Vermont and Iowa (Figure
6.1b). The states with the lowest percentage of institutions with admission
applications online are Arizona, Delaware, New York, Mississippi and Utah.
When interpreting this measure, what should be kept in mind? The Annual Survey of Colleges data are based on self-reported information from
the institutions, and colleges do not necessarily respond to all questions on the
survey. This indicator is calculated solely from affi rmative responses (i.e., those
institutions that explicitly indicate the application is available online through the
college’s website). This method may slightly underestimate the proportion of
four-year colleges with the option.
National Percentage of Four-Year Colleges with Admission Applications Available Online, 2001–2009Source: College Board, Annual Survey of Colleges, 2000–2008; NCES, IPEDS Institutional Characteristics Survey, 2001–2009
6.1a
0
10
20
30
40
50
60
70
80
90
100
2001 2002 2003 2004 2005 2006 2007 2008 2009
82.0%
53.1%60.6%
66.2%69.7%
74.4% 76.8%80.6% 80.9%
159 completionagenda.collegeboard.org
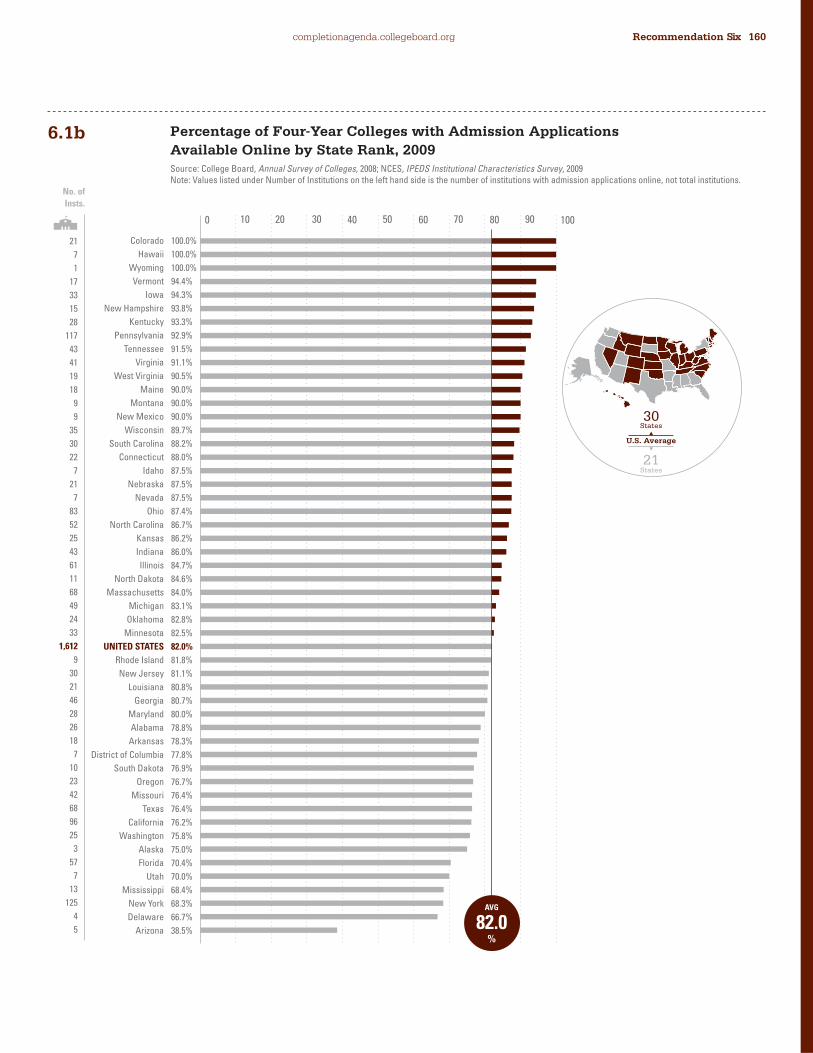
Percentage of Four-Year Colleges with Admission Applications Available Online by State Rank, 2009Source: College Board, Annual Survey of Colleges, 2008; NCES, IPEDS Institutional Characteristics Survey, 2009Note: Values listed under Number of Institutions on the left hand side is the number of institutions with admission applications online, not total institutions.
6.1b
0 10 20 30 40 50 60 70 80 90 100
Colorado
Hawaii
Wyoming
Vermont
Iowa
New Hampshire
Kentucky
Pennsylvania
Tennessee
Virginia
West Virginia
Maine
Montana
New Mexico
Wisconsin
South Carolina
Connecticut
Idaho
Nebraska
Nevada
Ohio
North Carolina
Kansas
Indiana
Illinois
North Dakota
Massachusetts
Michigan
Oklahoma
Minnesota
UNITED STATES
Rhode Island
New Jersey
Louisiana
Georgia
Maryland
Alabama
Arkansas
District of Columbia
South Dakota
Oregon
Missouri
Texas
California
Washington
Alaska
Florida
Utah
Mississippi
New York
Delaware
Arizona
100.0%
100.0%
100.0%
94.4%
94.3%
93.8%
93.3%
92.9%
91.5%
91.1%
90.5%
90.0%
90.0%
90.0%
89.7%
88.2%
88.0%
87.5%
87.5%
87.5%
87.4%
86.7%
86.2%
86.0%
84.7%
84.6%
84.0%
83.1%
82.8%
82.5%
82.0%
81.8%
81.1%
80.8%
80.7%
80.0%
78.8%
78.3%
77.8%
76.9%
76.7%
76.4%
76.4%
76.2%
75.8%
75.0%
70.4%
70.0%
68.4%
68.3%
66.7%
38.5%
21
7
1
17
33
15
28
117
43
41
19
18
9
9
35
30
22
7
21
7
83
52
25
43
61
11
68
49
24
33
1,612
9
30
21
46
28
26
18
7
10
23
42
68
96
25
3
57
7
13
125
4
5
30
U.S. Average
21
States
States
No. ofInsts.
AVG
82.0%
Recommendation Six 160completionagenda.collegeboard.org

Percentage of Four-Year Colleges That Accept Admission Applications OnlineWhat is this measure, and why is this measure important? The previous
measure demonstrates that the vast majority of four-year institutions have
made their applications available through their websites. This indicator examines
a similar issue but focuses more specifi cally on the ability to submit the
application electronically.
The technology with which to submit the application online has lagged slightly
behind the general availability of online applications. This is understandable
given the relative ease with which an institution can post a PDF of the
application compared to the amount of work required to develop a tool that
captures information entered into an online application. Given the increase
in the proportion of four-year colleges with this technology, it is clear that
institutions are making online applications a priority. The ability to submit the
application online streamlines the process for students and frees up resources
in the admission offi ce. In theory, if these resources are no longer devoted to
the manual entry of data, they can be used in other productive ways to improve
the admission process.
What are the policy issues associated with this measure? Of increasing
concern is the complexity involved when some, but not all, elements of the
application can be submitted electronically. Institutions should ensure that
students fully understand which requirements have been submitted and which
elements may require additional work on the student’s part. For example,
students may need to contact teachers to send recommendations directly
to the college, or the school may need to send the transcript or counselor
recommendation. Secondary schools and higher education institutions
should improve outreach to help students understand how to use these
tools effectively.
Institutions should make sure that online application tracking technology does
not sacrifi ce accuracy for effi ciency. Online application submission tools should
also ensure the integrity of information, particularly as schools increasingly
use such technology to submit confi dential student information such as
recommendations or transcripts.
75.2% As of 2009, students are able to submit applications online to 75.2 percent of four-year colleges.
1.8ppts 2008–2009
161 completionagenda.collegeboard.org

Where are we now? Although many institutions have applications available
online, not all institutions are equipped to accept these applications electronically.
As of 2009, 75.2 percent of four-year colleges and universities in the United
States accept admission applications online from students (Figure 6.2a). The
percentage of colleges that accept admission applications online has grown
from a low of 38.0 percent in 2001 to a high of 75.2 percent in 2009.
When disaggregated by state, the percentage ranges from 46.2 percent in
Arizona to 100 percent in Alaska and Wyoming (Figure 6.2b). When placed in
rank order, the states with the highest percentage of institutions that accept the
admission application online are Alaska, Wyoming, Colorado, Kentucky and New
Mexico. The states with the lowest percentage of institutions that accept the
admission application online are Arizona, District of Columbia, Florida, New York
and California.
When interpreting this measure, what should be kept in mind? As was the
case with the previous indicator, the Annual Survey of Colleges data are based
on self-reported information from the institution, and colleges do not necessarily
respond to all questions on the survey. This indicator is calculated solely from
affi rmative responses (i.e., those institutions that explicitly indicated that the
application can be submitted online) and may underestimate the proportion of
colleges for which the Internet technology is in place.
National Percentage of Four-Year Colleges to Which Students Can Submit Admission Applications Online, 2001–2009Source: College Board, Annual Survey of Colleges, 2000–2008; NCES, IPEDS Institutional Characteristics Survey, 2001–2009
6.2a
0
10
20
30
40
50
60
70
80
90
100
2001 2002 2003 2004 2005 2006 2007 2008 2009
75.2%
38.0%
47.7%54.2%
59.2%64.6%
67.8%70.9% 73.4%
Recommendation Six 162completionagenda.collegeboard.org

Percentage of Four-Year Colleges to Which Students Can Submit Admission Applications Online by State Rank, 2009Source: College Board, Annual Survey of Colleges, 2008; NCES, IPEDS Institutional Characteristics Survey, 2009Note: Values listed under Number of Institutions on the left hand side is the number of institutions students can submit applications online, not total institutions.
6.2b
0 10 20 30 40 50 60 70 80 90 100
Alaska
Wyoming
Colorado
Kentucky
New Mexico
Pennsylvania
Vermont
Virginia
Idaho
Wisconsin
Hawaii
West Virginia
Maine
Minnesota
North Carolina
Nebraska
Ohio
Tennessee
Iowa
Massachusetts
Indiana
Rhode Island
New Hampshire
Connecticut
Oklahoma
Michigan
UNITED STATES
Illinois
Nevada
Georgia
Washington
Kansas
Maryland
Texas
Montana
Utah
Alabama
Arkansas
Louisiana
North Dakota
South Dakota
Missouri
South Carolina
Delaware
New Jersey
Oregon
Mississippi
California
New York
Florida
District of Columbia
Arizona
100.0%
100.0%
95.2%
90.0%
90.0%
89.7%
88.9%
88.9%
87.5%
87.2%
85.7%
85.7%
85.0%
85.0%
85.0%
83.3%
83.2%
83.0%
82.9%
82.7%
82.0%
81.8%
81.3%
80.0%
79.3%
78.0%
75.2%
75.0%
75.0%
73.7%
72.7%
72.4%
71.4%
70.8%
70.0%
70.0%
69.7%
69.6%
69.2%
69.2%
69.2%
69.1%
67.6%
66.7%
64.9%
63.3%
63.2%
62.7%
62.3%
59.3%
55.6%
46.2%
4
1
20
27
9
113
16
40
7
34
6
18
17
34
51
20
79
39
29
67
41
9
13
20
23
46
1,479
54
6
42
24
21
25
63
7
7
23
16
18
9
9
38
23
4
24
19
12
79
114
48
5
6
26
U.S. Average
25
States
States
No. ofInsts.
AVG
75.2%
163 completionagenda.collegeboard.org

Percentage of Four-Year Colleges That Participate in National and State Application SystemsWhat is this measure, and why is this measure important? This measure
represents the proportion of four-year colleges that participate in application
systems that aim to simplify the admission process, and the number of states
that offer statewide application systems for their public four year institutions.
The application systems address the overlap in applications and provide a
platform for students to enter information once and then send the application to
multiple colleges.
Over the past two decades, national application options themselves, as well as
the number of participating institutions, have expanded greatly. The Common
Application (CA), which existed in paper form since 1975, was introduced online
in 1998; and by 2006, all members accepted the application online. Since then,
the CA launched its online school form system and partnered with Naviance to
provide school offi cials the option of submitting transcripts, school forms and
recommendations electronically.
The Universal College Application (UCA), introduced in 2007, expanded the
opportunity for a centralized electronic application to colleges that do not
necessarily use “holistic” review processes. While CA membership is limited to
those requiring components such as teacher recommendations and an essay,
the UCA does not have this stipulation. This potentially opened the door to a
wider range of higher education institutions, particularly in the public sector.
The Common Black College Application (CBCA), started roughly 10 years ago,
originally collaborated with fi ve historically black colleges and universities with
the goal of increasing the presence of these colleges in new markets and
increasing educational options for students. The CBCA participates in a range of
outreach activities in schools and communities. Students pay a single application
fee and are able to apply simultaneously to over 30 colleges with the CBCA.
This measure also shows those states that have statewide application systems
at public, four-year colleges and universities within the state. These application
systems also aim to simplify applying to schools within a given state to make it
simpler for students to apply to public four-year colleges and universities within
that state. There are many variations to these systems among states. While
some states provide online systems that students can use to apply to all public,
four-year universities within that state, others provide a paper application that
can be used to apply to all the public, four-year universities in that system.
22.8% As of 2009, 22.8 percent of four-year institutions participate in national application systems that aim to streamline the admission process.
2.4ppts 2008–2009
33.3%As of 2010, 16 states and the District of Columbia have state-wide application systems for public four-year institutions that aim to streamline the admission process.
Recommendation Six 164completionagenda.collegeboard.org
What are the policy issues associated with this measure? Perhaps the
greatest concern is access to information and resources — knowing that
the above options exist, having the ability to pay application fees or having
the knowledge to seek fee waivers, and subsequently having access to the
technology with which to complete one of the above options. Institutions should
examine payment and fee-waiver policies in order to ensure that all students
have the ability to participate equally in these application systems. Institutions
that are not current members of a centralized application system and states that
do not currently have a system for all students to apply to all public universities
should examine the costs and benefi ts of participation in or development of such
a system. The K–12 and higher education communities should strive to improve
outreach to underrepresented minority, low-income and fi rst-generation students
about the benefi ts of these application systems.
Where are we now? As of 2009, 22.8 percent of four-year institutions in the
United States participate in these national application systems (Figure 6.3a).
This number has risen steadily from 10.8 percent in 2000 to 22.8 percent in
2009. When disaggregated by state, the percentage ranges from 0.0 percent
in Alaska, Kansas, Nevada, New Mexico and North Dakota to 100 percent in
Wyoming (Figure 6.3b). When placed in rank order, states with the highest
percentage of institutions using national application systems are Wyoming,
Rhode Island, New Hampshire, Vermont and Maine. As of 2010, 16 states and
the District of Columbia have statewide application systems for public four-year
institutions that aim to streamline the admission process (Figure 6.3c).
When interpreting this measure, what should be kept in mind? The goal in
this indicator is to describe application systems that connect students to a broad
array of colleges and universities on a state or national level. However, many
four-year institutions that do, in fact, participate in local or regional application
systems are excluded. In addition, other application platforms simplify the
process for school offi cials, which can have an indirect effect on the process
for students. For example, schools that use Naviance’s “College Planner” or
ConnectEDU’s “SuperAPP” are able to send materials electronically to more
than 1,000 colleges.
165 completionagenda.collegeboard.org

National Percentage of Four-Year Colleges That Use the Common Application, Universal College Application or Common Black College Application, 2000–2009 Source: Common Application, Universal College Application, Common Black College Application; NCES, IPEDS Institutional Characteristics Survey, 2001–2009
6.3a
0
10
20
30
40
50
60
70
80
90
100
2001 2002 2003 2004 2005 2006 2007 2008 20092000
22.8%
10.8% 11.7% 11.9% 12.4% 13.2% 14.2% 15.5% 17.9% 20.4%
Recommendation Six 166completionagenda.collegeboard.org

Percentage of Four-Year Colleges That Use the Common Application, Universal College Application or Common Black College Application by State Rank, 2009Source: Common Application, Universal College Application, Common Black College Application; NCES, IPEDS Institutional Characteristics Survey, 2009Note: Values listed under Number of Institutions on the left hand side is the number of institutions that use a common application, not total institutions.
6.3b
0 10 20 30 40 50 60 70 80 90 100
Wyoming
Rhode Island
New Hampshire
Vermont
Maine
Massachusetts
New York
Pennsylvania
Delaware
District of Columbia
Connecticut
Virginia
Montana
South Carolina
New Jersey
Maryland
Colorado
Oregon
UNITED STATES
Minnesota
Washington
Wisconsin
Ohio
California
Georgia
Florida
North Carolina
Indiana
Mississippi
Louisiana
Alabama
Tennessee
Hawaii
Iowa
Illinois
Idaho
Texas
Missouri
Kentucky
Utah
Arkansas
Michigan
Arizona
South Dakota
Oklahoma
West Virginia
Nebraska
Alaska
Kansas
Nevada
New Mexico
North Dakota
100.0%
63.6%
56.3%
55.6%
55.0%
49.4%
39.9%
35.7%
33.3%
33.3%
32.0%
31.1%
30.0%
29.4%
27.0%
25.7%
23.8%
23.3%
22.8%
22.5%
21.2%
20.5%
20.0%
19.8%
19.3%
17.3%
16.7%
16.0%
15.8%
15.4%
15.2%
14.9%
14.3%
14.3%
13.9%
12.5%
12.4%
10.9%
10.0%
10.0%
8.7%
8.5%
7.7%
7.7%
6.9%
4.8%
4.2%
0.0%
0.0%
0.0%
0.0%
0.0%
1
7
9
10
11
40
73
45
2
3
8
14
3
10
10
9
5
7
448
9
7
8
19
25
11
14
10
8
3
4
5
7
1
5
10
1
11
6
3
1
2
5
1
1
2
1
1
0
0
0
0
0
18
U.S. Average
33
States
States
No. ofInsts.
AVG
22.8%
167 completionagenda.collegeboard.org
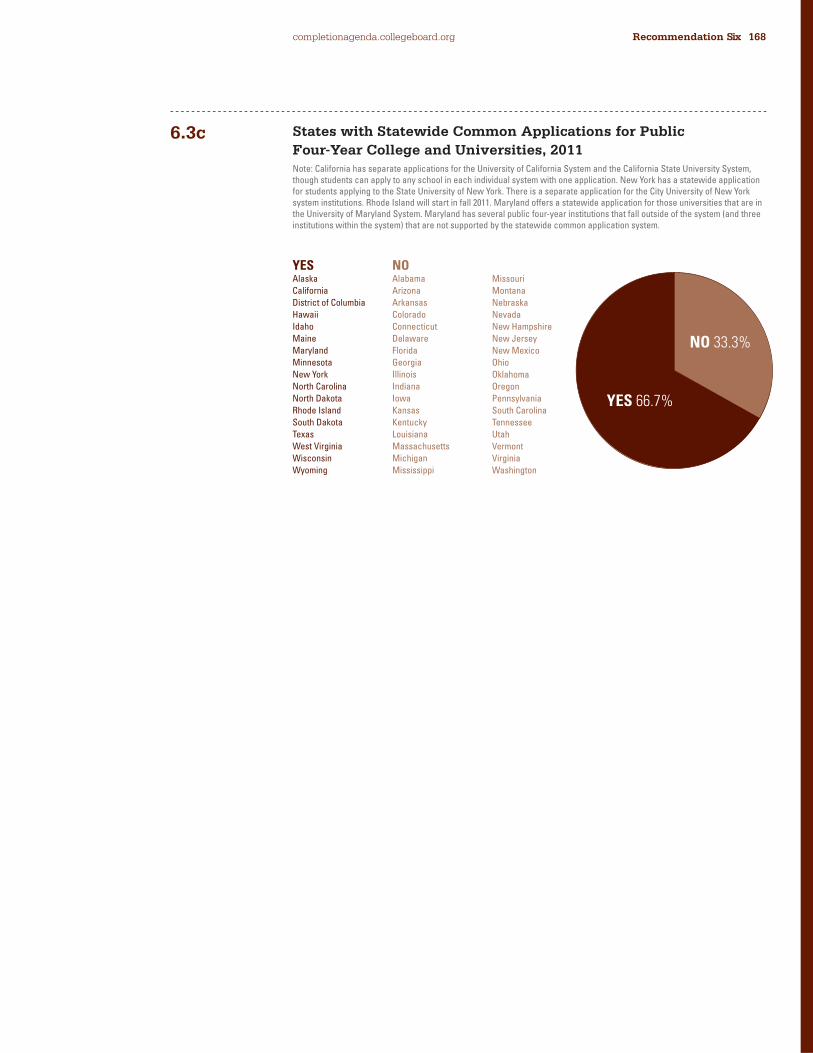
States with Statewide Common Applications for Public Four-Year College and Universities, 2011 Note: California has separate applications for the University of California System and the California State University System, though students can apply to any school in each individual system with one application. New York has a statewide application for students applying to the State University of New York. There is a separate application for the City University of New York system institutions. Rhode Island will start in fall 2011. Maryland offers a statewide application for those universities that are in the University of Maryland System. Maryland has several public four-year institutions that fall outside of the system (and three institutions within the system) that are not supported by the statewide common application system.
6.3c
YES 66.7%
NO 33.3%
YESAlaskaCaliforniaDistrict of ColumbiaHawaiiIdahoMaineMarylandMinnesotaNew YorkNorth CarolinaNorth DakotaRhode IslandSouth DakotaTexasWest VirginiaWisconsinWyoming
NO AlabamaArizonaArkansasColoradoConnecticutDelawareFloridaGeorgiaIllinoisIndianaIowaKansasKentuckyLouisianaMassachusettsMichiganMississippi
MissouriMontanaNebraskaNevadaNew HampshireNew JerseyNew MexicoOhioOklahomaOregonPennsylvaniaSouth CarolinaTennesseeUtahVermontVirginiaWashington
Recommendation Six 168completionagenda.collegeboard.org
Immediate Enrollment Rate of High School GraduatesWhat is this measure, and why is this measure important? One way to
assess whether efforts to streamline, simplify and demystify the admission
process are effective is to examine the proportion of students applying to
college. This hinges upon an assumption that if the process is perceived to be
less intimidating, then more students will ultimately apply to college. However,
there does not appear to be a comprehensive source for this information. This
can be explored indirectly through the immediate enrollment rate of students
who recently completed high school. If a greater proportion of students enroll,
then a greater proportion of them must have applied to college in the fi rst place.
This measure is fundamental to the overall goal of the commission. These
data indirectly refl ect application behavior and thus provide insight into an
important piece of the education pipeline, in which students must apply, enroll,
return for the sophomore year and ultimately complete their degrees (see
Recommendation Nine for more details on retention and completion).
What are the policy issues associated with this measure? Enrollment rates
differ based on family income, parental education, race/ethnicity and gender.
Policies geared toward improving application and enrollment rates for low-
income and underrepresented minority students in particular will contribute
greatly to the commission’s goal.
Where are we now? As of 2008, 68.6 percent of high school completers in the
United States enroll in a two- or four-year college immediately after completing
high school (Figure 6.4a). This includes those who received a high school
diploma or a GED. However, the immediate enrollment rate for African American
(55.7 percent) and Hispanic (63.9 percent) students trails that of white (71.7
percent) students (Figure 6.4b).
The immediate enrollment rate for males (65.9 percent) is lower than the rate
for females (71.6 percent; Figure 6.4c), and enrollment rates vary according
to family income (Figure 6.4d). While 57.1 percent of those in the bottom 20
percent of all family incomes (i.e., low-income students) enroll in two- or four-
year colleges immediately after completing high school, 81.9 percent of those in
the highest 20 percent of all family incomes (i.e., high-income students) enroll
immediately after completing high school. The immediate enrollment rate also
differed according to parental educational attainment (Figure 6.4e). Although
53.8 percent of students whose parents have high school diplomas or less
enroll immediately in college, 72.0 percent of students whose parents have
some college and 82.4 percent of students whose parents have a bachelor’s
degree or higher do so.
68.6% As of 2008, 68.6 percent of high school completers enroll in a two- or four-year college immediately after completing high school.
1.4ppts 2007–2008
55.7% As of 2008, 55.7 percent of African American high school completers enroll in a two- or four-year college immediately after completing high school.
2007–2008
169 completionagenda.collegeboard.org

When disaggregated by state, the estimated rate of high school graduates
(excluding those with a GED) going to college ranges from 45.7 percent in
Alaska to 77.4 percent in Mississippi (Figure 6.4f). When placed in rank order,
the states with the highest overall percentage of high school graduates going
to college are Mississippi, Massachusetts, New York, South Dakota and New
Jersey. The states with the lowest percentage of high school graduates going
to college are Alaska, Oregon, Vermont, Idaho and Washington.
The estimated rate of high school graduates (excluding those with a GED)
going to college in their home state ranges from 11.2 percent in the District of
Columbia to 71.7 percent in Mississippi (Figure 6.4g). When placed in rank order,
the states with the highest overall percentage of high school graduates going to
college in their home state are Mississippi, South Carolina, Alabama, California
and New York. The states with the lowest percentage of high school graduates
going to college in their home state are Idaho, New Hampshire, Alaska, Vermont
and the District of Columbia.
The estimated rate of high school graduates (excluding those with a GED)
going to college outside of their home state ranges from to 4.9 percent in Utah
to 42.3 percent in the District of Columbia (Figure 6.4h). When placed in rank
order, the states with the highest overall percentage of high school graduates
going to college outside of their home state are the District of Columbia, New
Hampshire, Connecticut, New Jersey and Vermont. The states with the lowest
percentage of high school graduates going to college outside of their home
state are Louisiana, Mississippi, California, Arizona and Utah.
When interpreting this measure, what should be kept in mind? A student
may complete the admission process only to fi nd that certain factors, such as
family fi nances, prevent him or her from enrolling. Therefore, this measure likely
underestimates the actual proportion of recent high school completers who
applied to college. It is also important to consider that this measure refl ects
students who have made it to a certain point of the educational pipeline and
completed high school. State outcomes may be impacted by differential dropout
rates (see Recommendation Three for additional details).
Readers should note that rates in Figures 6.4a through 6.4e are based on high
school completers, which included both high school graduates and individuals
who earned high school equivalency certifi cates (i.e., GEDs). Rates in Figures
6.4f through 6.4h are based on high school graduates only.
63.9% As of 2008, 63.9 percent of Hispanic high school completers enroll in a two- or four-year college immediately after completing high school.
3.0ppts 2007–2008
63.8% As of 2008, 63.8 percent of high school graduates attend a two- or four-year institution.
1.8ppts 2007–2008
Recommendation Six 170completionagenda.collegeboard.org

51.8% As of 2008, 51.8 percent of high school graduates attend a two- or four-year college located in the student’s home state.
1.7ppts 2007–2008
12.0% As of 2008, 12.0 percent of high school graduates attend a two- or four-year college located outside of the student’shome state.
2007–2008
0
10
20
30
40
50
60
70
80
90
100
2001 2002 2003 2004 2005 2006 2007 2008200019991998
68.6%65.6% 62.9% 63.3% 61.7%65.2% 63.9% 66.7% 68.6% 66.0% 67.2%
0
10
20
30
40
50
60
70
80
90
100
2001 2002 2003 2004 2005 2006 2007 2008200019991998
68.5% 66.3% 65.7% 64.2%68.9% 66.2% 68.8%
73.2%68.5% 69.5% 71.7%
59.8%51.9% 58.6%
47.4%
56.3%
48.6% 52.7%56.3% 57.2%
54.7%
60.0%57.7%
58.8%
57.7%58.2%
57.5% 55.6%58.5%
55.7%
62.0%
55.7%
63.9%
African American
Hispanic
White
Percentage of High School Completers Enrolled in Two- or Four-Year Colleges Immediately Following High School Completion, 1998–2008Source: NCES, Condition of Education, 2010Note: High school completer refers to those who received a high school diploma or equivalency certifi cate. This indicator provides data on high school completers ages 16–24, who account for about 98 percent of all high school completers in a given year.
6.4a
Percentage of High School Completers Enrolled in Two- or Four-Year Colleges Immediately Following High School Completion by Race/Ethnicity,a 1998–2008Source: NCES, Condition of Education, 2010Note: High school completer refers to those who received a high school diploma or equivalency certifi cate. This indicator provides data on high school completers ages 16–24, who account for about 98 percent of all high school completers in a given year.a. Due to unreliable (or unstable) estimates associated with small sample sizes for the low-income, African American and Hispanic categories, moving average rates are presented. These rates were generally calculated as the average of the annual rates for the following three adjacent years: the year in question, the year immediately before it and the year immediately after it.
6.4b
171 completionagenda.collegeboard.org

Percentage of High School Completers Enrolled in Two- or Four-Year Colleges Immediately Following High School Completion by Family Income, 1998–2008 Source: NCES, Condition of Education, 2010Note: High school completer refers to those who received a high school diploma or equivalency certifi cate. This indicator provides data on high school completers ages 16–24, who account for about 98 percent of all high school completers in a given year.
6.4d
0
10
20
30
40
50
60
70
80
90
100
2001 2002 2003 2004 2005 2006 2007 2008200019991998
77.5% 76.1% 76.9% 79.9% 78.2% 80.1% 80.1% 81.2% 80.7% 78.2%81.9%
50.9%
64.7%
48.5%
59.4%
47.8%
59.5% 56.3%
50.0% 51.0%
60.7%
52.6%
57.6%
51.4%
63.3%
50.8%
65.1%
54.5%
61.4%
55.3%
63.3%
57.1%
65.2%
Low Income
Middle Income
High Income
Percentage of High School Completers Enrolled in Two- or Four-Year Colleges Immediately Following High School Completion by Gender, 1998–2008 Source: NCES, Condition of Education, 2010Note: High school completer refers to those who received a high school diploma or equivalency certifi cate. This indicator provides data on high school completers ages 16–24, who account for about 98 percent of all high school completers in a given year.
6.4c
0
10
20
30
40
50
60
70
80
90
100
2001 2002 2003 2004 2005 2006 2007 2008200019991998
62.4%
69.1%
61.4%
64.4%
59.9%
66.2% 63.6%
59.7% 62.1%
68.3%
61.2%
66.5%
61.4%
71.5%
66.5%
70.4%
65.8%
66.1%
66.1%
68.3%
65.9%
71.6%
Male
Female
Recommendation Six 172completionagenda.collegeboard.org

Percentage of High School Completers Enrolled in Two- or Four-Year Colleges Immediately Following High School Completion by Parental Education,a 1998–2008 Source: NCES, Condition of Education, 2010Note: High school completer refers to those who received a high school diploma or equivalency certifi cate. This indicator provides data on high school completers ages 16–24, who account for about 98 percent of all high school completers in a given year. a. Information on parents’ education was not available for approximately 7–14 percent of high school completers ages 16–24 for the period covered.b. Including vocational/technical
6.4e
0
10
20
30
40
50
60
70
80
90
100
2001 2002 2003 2004 2005 2006 2007 2008200019991998
82.3% 82.2% 81.2% 81.3% 82.6% 82.1%85.9% 88.8%
78.2%85.8%
82.4%
55.7%
67.7%
49.8%
60.3%
50.1%
63.8% 62.0%
48.9% 49.7%
65.9%
51.6%
62.9%
50.8%
67.0%
57.6%
65.6%
53.2%
67.0%
50.9%
65.2%
53.8%
72.0%
High School or Less
Some Collegeb
Bachelor’s Degree or Higher
173 completionagenda.collegeboard.org

Rate of High School Graduates Going to College by State Rank, 2008Source: NCES, Digest of Education Statistics, 2010Note: North Dakota and Wyoming fi gures only include students graduating from public schools.
6.4f
0 10 20 30 40 50 60 70 80 90 100
Mississippi
Massachusetts
New York
South Dakota
New Jersey
South Carolina
Georgia
Minnesota
Virginia
Connecticut
New Mexico
North Dakota
Rhode Island
Alabama
Delaware
North Carolina
Indiana
Nebraska
Kansas
California
Louisiana
Iowa
Pennsylvania
New Hampshire
UNITED STATES
Maryland
Ohio
Colorado
Arkansas
Hawaii
Tennessee
Kentucky
Missouri
Michigan
Wyoming
Wisconsin
West Virginia
Florida
Utah
Illinois
Maine
Texas
Oklahoma
Nevada
District of Columbia
Montana
Arizona
Washington
Idaho
Vermont
Oregon
Alaska
77.4%
74.7%
74.2%
72.1%
71.1%
70.4%
69.6%
69.2%
68.7%
68.0%
67.7%
67.6%
67.4%
66.7%
66.1%
66.0%
65.7%
65.5%
65.4%
65.4%
65.3%
64.3%
63.9%
63.9%
63.8%
62.9%
62.7%
62.6%
62.5%
62.3%
61.6%
60.9%
60.0%
59.9%
59.4%
59.1%
59.1%
58.8%
58.5%
57.4%
57.1%
56.9%
56.0%
55.6%
53.5%
51.9%
51.4%
50.7%
49.1%
48.3%
46.5%
45.7%
24
U.S. Average
27
States
States
AVG
63.8%
Recommendation Six 174completionagenda.collegeboard.org

Rate of High School Graduates Going to College In State by State Rank, 2008Source: NCES, Digest of Education Statistics, 2010Note: North Dakota and Wyoming fi gures only include students graduating from public schools.
6.4g
0 10 20 30 40 50 60 70 80 90 100
Mississippi
South Carolina
Alabama
California
New York
North Carolina
Louisiana
Georgia
New Mexico
Indiana
Virginia
Kansas
Arkansas
Iowa
South Dakota
Kentucky
Utah
Nebraska
Michigan
Ohio
Pennsylvania
West Virginia
Tennessee
Florida
UNITED STATES
Massachusetts
Minnesota
Missouri
Texas
Oklahoma
North Dakota
Colorado
Wisconsin
Arizona
Wyoming
Delaware
Rhode Island
Hawaii
Nevada
New Jersey
Illinois
Washington
Montana
Maryland
Maine
Connecticut
Oregon
Idaho
New Hampshire
Alaska
Vermont
District of Columbia
71.7%
63.5%
60.4%
59.9%
59.8%
59.1%
59.0%
58.0%
57.9%
57.7%
56.2%
55.7%
55.6%
55.0%
54.9%
54.0%
53.6%
53.5%
53.3%
52.6%
52.5%
52.4%
52.3%
52.0%
51.8%
50.6%
50.0%
49.9%
49.8%
49.5%
48.5%
47.7%
47.7%
45.9%
45.1%
44.7%
44.3%
41.8%
41.8%
41.4%
40.9%
39.9%
39.6%
39.2%
38.7%
37.4%
35.3%
34.4%
33.2%
26.4%
21.4%
11.2%
24
U.S. Average
27
States
States
AVG
51.8%
175 completionagenda.collegeboard.org

Rate of High School Graduates Going to College Out of State by State Rank, 2008Source: NCES, Digest of Education Statistics, 2010Note: North Dakota and Wyoming fi gures only include students graduating from public schools.
6.4h
0 10 20 30 40 50 60 70 80 90 100
District of Columbia
New Hampshire
Connecticut
New Jersey
Vermont
Massachusetts
Maryland
Rhode Island
Delaware
Hawaii
Alaska
Minnesota
North Dakota
Maine
South Dakota
Illinois
Colorado
Idaho
New York
Wyoming
Nevada
Virginia
Montana
UNITED STATES
Nebraska
Georgia
Pennsylvania
Wisconsin
Oregon
Washington
Ohio
Missouri
New Mexico
Kansas
Iowa
Tennessee
Indiana
Texas
Kentucky
South Carolina
North Carolina
Arkansas
Florida
Michigan
West Virginia
Oklahoma
Alabama
Louisiana
Mississippi
California
Arizona
Utah
42.3%
30.7%
30.6%
29.7%
26.9%
24.0%
23.7%
23.1%
21.5%
20.5%
19.3%
19.2%
19.1%
18.4%
17.1%
16.5%
14.9%
14.6%
14.4%
14.3%
13.8%
12.5%
12.3%
12.0%
11.9%
11.6%
11.4%
11.4%
11.3%
10.8%
10.1%
10.0%
9.8%
9.7%
9.3%
9.3%
7.9%
7.1%
7.0%
6.9%
6.9%
6.9%
6.8%
6.7%
6.7%
6.5%
6.3%
6.3%
5.7%
5.6%
5.5%
4.9%
23
U.S. Average
28
States
States
AVG
12.0%
Recommendation Six 176completionagenda.collegeboard.org

SevenProvide more need-based grant aid while simplifying the fi nancial aid system and making it more transparent
WE RECOMMEND that federal and state offi cials encourage increased access by providing more need-based grant aid, by making the process of applying for fi nancial assistance more transparent and predictable, and by fi nding ways to inform families, as early as the middle school years, of aid amounts likely to be available to individual students.
It is important that suffi cient need-based aid be available for low- and moderate-
income students to enroll and succeed in college. First-generation students
and underrepresented minorities are particularly vulnerable when our fi nancial
aid system is inadequate. In Coming to Our Senses, the commission called
for an increase in need-based grant aid, for avoidance of excessive reliance
on student debt, and for simplifying fi nancial aid processes and making them
more transparent. The commission also recommended providing institutions
with incentives to enroll and graduate more low-income and fi rst-generation
students. Better information for students is vital as many students, particularly
those whose parents did not go to college, are unaware of the available
fi nancial aid and do not know how to access it.57 The nation must do more to
simplify the fi nancial aid process for all students and to make the process more
transparent for all families. In many cases, social capital58 is directly tied to the
ability of students and families to gain access to higher education.59 Simplifying
the fi nancial aid system and providing early information can improve access to
higher education for low-income and fi rst-generation students.
Indicators of progress on this recommendation include:
• Grant aid for students from low- and moderate-income families;
• Student debt levels;
• Changes in the federal student aid application process and fi nancial aid
programs; and
• Implementation of policies designed to provide incentives for
institutions to promote enrollment and success of low-income
and fi rst-generation students.
57. College Board. (2010). Cracking the Student Aid Code. Retrieved May 13, 2010, from
http://advocacy.collegeboard.org/sites/default/fi les/11b_3172_Cracking_Code_Update_WEB_110112.pdf
58. Social capital is a sociological concept, which refers to connections within and between social networks.
59. Cracking the Student Aid Code.
completionagenda.collegeboard.org Recommendation Seven 178

General Findings for This Recommendation• As of 2008, the national total grant aid per low-income dependent student
at public two-year institutions is $3,252.
• As of 2008, the national total grant aid per low-income dependent student
at public four-year institutions is $7,364.
• As of 2008, the national total grant aid per low-income dependent student
at private not-for-profi t four-year institutions is $14,215.
• As of 2008, the national total grant aid per low-income dependent student
at private for-profi t four-year institutions was $3,745.
• From 2004 to 2008, average grant aid increased by 1.7 percent or $54
per year from 1996 to 2008 (after adjusting for infl ation) for low-income
dependent students at public two-year colleges.
• From 2004 to 2008, average grant aid increased by 4.4 percent or $292 per
year from 1996 to 2008 (after adjusting for infl ation) for low-income students
at public four-year colleges.
• From 2004 to 2008, average grant aid increased by 5.7 percent or $710
per year from 1996 to 2008 (after adjusting for infl ation) for low-income
dependent students at private four-year colleges.
• As of 2008, the median student loan debt for those who borrowed
increased by 1.4 percent per year beyond infl ation.
• As of 2010, average debt per bachelor’s degree recipient spread across all
public four-year college graduates who earned degrees from the institution
at which they began their studies is $12,300 in 2009-10.
• As of 2010, average debt per bachelor’s degree recipient spread across all
private nonprofi t four-year college graduates who earned degrees from the
institution at which they began their studies is $18,300 in 2009-10.
completionagenda.collegeboard.org179

Grant Aid for Students from Low-Income FamiliesWhat is this measure, and why is this measure important? This indicator
measures the amount of grant aid available to students by income level. This
measure includes (1) the total grant aid per low-income dependent student; (2)
the average percentage increase in total grant aid per dependent student; (3)
the average dollar increase in total grant aid per low-income dependent student;
and (4) the average amount of fi nancial aid (grants or loans) used to fi nance
postsecondary education expenses in the United States. These measures are
important because sources of aid help to offset the advertised tuition and fees,
which for many students are prohibitively high. Financial aid for postsecondary
education takes many shapes and forms. Among the different types of aid,
including federal loans, federal work-study, and federal education tax credits and
deductions, grant aid is the most effective at relieving the burdens of college
costs. These scholarships do not need to be repaid, they are not accompanied
by work obligations, and they do not require an understanding of the tax code
or regulations.
During the 2010-11 academic year, grant aid accounted for nearly 53 percent of
the $177.6 billion in fi nancial aid awarded to undergraduate students. The origins
of these grants include the federal government, states, employers and private
entities, as well as the institutions at which the students enroll.
Two broad types of grant aid exist: (1) grant aid that is used to meet a student’s
fi nancial need and (2) grant aid that exceeds a student’s fi nancial need. The
latter category is commonly referred to as “merit aid”, though the lines between
merit aid and need-based aid are blurry. Institutions frequently package and refer
to grant aid as merit aid, when this merit aid is actually being used to meet a
student’s fi nancial need.
Diverting fi nancial resources away from students with need toward students
without need does not enhance college affordability. During the time period
from 2007-08 through 2010-11, both public four-year and private not-for-profi t
four-year postsecondary institutions increased the fraction of total grant aid
awarded that was used to meet the fi nancial need of students.60
What are the policy issues associated with this measure? Total grant aid
awarded to postsecondary students, in current dollars, has increased each
year over the past decade. During the 2000-01 academic year, nearly $48 billion
(in 2010 dollars) of grant aid was awarded, and by the 2010-11 academic year
that amount had more than doubled and stood at $107 billion. Postsecondary
enrollment increased by 43 percent during this time period, but the growth in
grant aid outpaced this growth in enrollment, generating a 58 percent increase
in infl ation-adjusted grant dollars per FTE student.
60. College Board. (2011). Trends in Financial Aid. Retrieved November 1, 2011, from
http://trends.collegeboard.org/student_aid/
$3,252 As of 2008, thenational total grantaid per low-incomedependent student at public two-yearinstitutions is $3,252.
$7,364 As of 2008, thenational total grantaid per low-incomedependent student at public four-yearinstitutions is $7,364.
$14,215 As of 2008, the national total grant aid per low-income dependent student at private not-for-profi t four-year institutions is $14,215.
completionagenda.collegeboard.org Recommendation Seven 180
$3,745 As of 2008, the national total grant aid per low-income dependent student at private, for-profi t, four-year institutions was $3,745.
1.7% As of fall 2007, average grant aid has increased by 1.7 percent or $54 per year from 1996 to 2008 (after adjusting for infl ation) for low-income dependent students at public two-year colleges.
The change in grant aid awarded between the 2008-09 academic year and the
2010-11 academic year was dramatic, and much larger than any other two-year
changes in grant aid over the past decade. In fact, the change in total grant aid
awarded, in 2010 dollars, between the 2008-09 academic year and the 2010-11
academic year ($30.9 billion) was actually larger than the change that occurred
between the 2000-01 and the 2008-09 academic years ($28.4 billion).
What explains the recent surge in total grant aid? During the 2008-09 academic
year, the maximum Pell grant was $4,731 ($4,689 in 2010 dollars). During the
2009-10 academic year, the maximum Pell grant jumped by 16 percent over the
previous year in infl ation adjusted dollars to $5,350 ($5,416 in 2010 dollars), and
during the 2010-11 academic year, the maximum Pell grant value was $5,550.
The sizeable change in maximum Pell value in conjunction with a 31 percent
increase in number of recipients between the 2008-09 academic year and the
2009-10 academic year is partially responsible for the increase in share of total
grant aid originating from the federal government from 33 percent to 44 percent
over these two academic years. In fact, Pell grants increased from 24 percent
of total grant aid in 2008-09 to 30 percent in 2009-10. The other major source
of increase between these two years in federal grant aid was the escalation of
veterans’ grants from 5 percent of total grant aid in 2008-09 to 10 percent of
total grant aid in 2009-10.
In an era of economic downtown during which families’ and students’ ability
to pay for college is diminished and state appropriations per student have
decreased while tuition and fee sticker prices have increased, the role of
federal grant aid is of tremendous importance. Furthermore, many college
endowments dropped substantially in the wake of the 2008 stock market crash,
and have not rebounded to their prerecession values. An increased reliance
on institutional grant aid would put substantial pressure on postsecondary
institutions, some of which are already in a precarious state fi nancially.
Where are we now? Though total grant aid is estimable on a year-by-year basis,
an examination of the types of students to whom this aid is awarded requires
student-level data collected through large-scale national surveys of students
like the National Center for Education Statistics administered NPSAS. The last
administration of NPSAS occurred during the 2007-08 academic year, yet these
NPSAS data can offer insight into where we are now in terms of how this aid
is allocated by student or a student’s family’s income, and how grant aid has
changed over time across the income strata. Figure 7.1a shows that the average
total grant aid for full-time students from low-income families attending public
two-year institutions has increased from $1,844 in 1996 to $3,252 in 2008. The
average total grant aid for full-time, low-income students attending public four-
year institutions rose from $4,137 in 1996 to $7,364 in 2008 and from $9,203
in 1996 to $14,215 in 2008 for those attending private, not-for-profi t, four-year
institutions. The average total grant aid for full-time, low-income students
attending private, for-profi t, four-year institutions rose from $2,342 in 1996 to
$3,745 in 2008.
completionagenda.collegeboard.org181

0
2
4
6
8
10
12
14
16
20001996 2004 2008
In T
hous
ands
$1,844
$4,137
$9,203
$2,611
$5,062
$10,701
$3,036
$6,196
$11,375
$3,252
$7,364
$14,215
$2,342
$3,607 $4,595
$3,745
Private, 4-Year Not-for-Profi t
Private, 4-Year For-Profi t
Public, 4-Year
Public, 2-Year
National Total Grant Aid per Low-Income Dependent Student, 1996–2008 (in Constant 2008 Dollars)Source: NCES, National Postsecondary Student Aid Study, calculations by the College BoardNote: Constant 2008 dollars calculated through the CPI website http://146.142.4.24/cgi-bin/cpicalc.pl
7.1a4.4%As of fall 2007, average grant aid has increased by 4.4 percent or $292 per year from 1996 to 2008 (after adjusting for infl ation) for low-income dependent students at public four-year colleges.
5.7% As of fall 2007, average grant aid has increased by 5.7 percent or $710 per year from 1996 to 2008 (after adjusting for infl ation) for low-income dependent students at private four-year colleges.
Figure 7.1b shows that the percentage increase in average total grant aid to
low-income dependent students from 2004 to 2008 was 1.7 percent at public
two-year institutions, 4.4 percent at public four-year institutions and 5.7 percent
at private, not-for-profi t, four-year institutions. The average total grant aid to low-
income dependent students declined 5.0 percent from 2004 to 2008 at private,
for-profi t, institutions. Figure 7.1c shows the annual dollar increase in total grant
aid to low-income dependent students from 2004 to 2008 was $54 at public
two-year institutions, $292 at public four-year institutions and $710 at private,
not-for-profi t, four-year institutions. The total grant aid to low-income dependent
students from 2004 to 2008 was $212 at private, for-profi t, four-year institutions.
Figure 7.1d shows the average total aid, average grant aid and average federal
loans awarded to all students (undergraduate and graduate) per FTE. Figure
7.1e shows the average grant aid and average federal loans awarded to all
undergraduate students per FTE. Figure 7.1f shows the average grant aid and
average federal loans awarded to all graduate students per FTE.
Figure 7.1g shows that total undergraduate student aid amounts to $177.6 billion
in 2010–11. Figure 7.1h shows that over 9 million Pell Grant recipients receive an
average Pell award of $3,828.
completionagenda.collegeboard.org Recommendation Seven 182

Average Percentage Change in Total Grant Aid per Dependent Student by Income, 2004–2008 (in Constant 2008 Dollars)Source: NCES, National Postsecondary Student Aid Study, calculations by the College BoardNote: Constant 2008 dollars calculated through the CPI website http://146.142.4.24/cgi-bin/cpicalc.pl
-20
-15
-10
-5
0
5
10
15
20
Public2-Year
Public4-Year
Private4-Year
Not-for-Profit
-25
-35
-30
Private4-Year
For-Profit
-40
1.7%
12.5
%
-5.3
%
-4.4
%
4.4%
8.7%
5.5% 6.3%
5.7%
5.1%
4.2%
3.2%
-5.0
%
-7.9
%
-30.
7%
-34.
2%
Low-Income
Mid-Low Income
Mid-High Income
High-Income
7.1b
completionagenda.collegeboard.org183

-100
0
100
200
300
400
500
600
700
Public2-Year
Public4-Year
Private4-Year
Not-for-Profit
Private4-Year
For-Profit
$54
$186
$-32 $-18
$292 $322
$112
$102
$710
$583
$414
$214
$212
$171
$318
$180
Low-Income
Mid-Low Income
Mid-High Income
High-Income
National Average Dollar Increase in Total Grant Aid per Dependent Student by Income, 2004–2008 (in Constant 2008 Dollars)Source: NCES, National Postsecondary Student Aid Study, calculations by the College BoardNote: Constant 2008 dollars calculated through the CPI website http://146.142.4.24/cgi-bin/cpicalc.pl
7.1c
completionagenda.collegeboard.org Recommendation Seven 184

Average Aid (Federal Loans & Grant Aid) perFull-Time Equivalent (FTE) Student in Constant 2010Dollars, 1973-74 to 2010-11
1973-74
1976-77
1979-80
1982-83
1985-86
1988-89
1991-92
1994-95
1997-98
2000-01
2003-04
2006-07
2009-10
In T
hous
ands
0
5
10
15
20
25
$6,368
$985 $2,114
$6,566
$3,497 $3,027
$13,914
$4,678 $5,260
New fi gure7.1d
Average Total Aid per FTE
Average Grant Aid per FTE
Average Federal Loans per FTE
Source: The College Board, Trends in Student Aid, 2011Note: Loan numbers do not include nonfederal loans, which provide funding for students but do not involve subsidies. The fi gures reported here refl ect total student aid amounts divided across all students, including those who did not receive aid. Federal Loan dollars refl ect disbursements beginning 1995-96. Loan disbursements are estimated for years prior to 1995-96.
completionagenda.collegeboard.org185

1995-96
1997-98
1999-00
2001-02
2003-04
2005-06
2007-08
2009-10
1996-97
1998-99
2000-01
2002-03
2004-05
2006-07
2008-09
2010-11
In T
hous
ands
0
5
10
15
20
25
$4,907
$2,967$3,241
$6,539
$3,346$4,369
Average Aid (Federal Loans & Grant Aid) perUndergraduate FTE in Constant 2010 Dollars,1995-96 to 2010-11Source: The College Board, Trends in Student Aid, 2011
7.1e New fi gure
Average Grant Aid per FTE
Average Federal Loans per FTENote: Loan numbers do not include nonfederal loans, which provide funding for students but do not involve subsidies. The fi gures reported here refl ect total student aid amounts divided across all students, including those who did not receive aid. Federal Loan dollars refl ect disbursements beginning 1995-96. Loan disbursements are estimated for years prior to 1995-96.
completionagenda.collegeboard.org Recommendation Seven 186

1995-96
1996-97
1997-98
1998-99
1999-00
2000-01
2001-02
2002-03
2003-04
2004-05
2005-06
2006-07
2007-08
2008-09
2009-10
2010-11
In T
hous
ands
0
5
10
15
20
25
$16,423
$8,425
$10,410
$6,750
$3,984$5,183
Average Aid (Federal Loans & Grant Aid) perGraduate FTE in Constant 2010 Dollars,1995-96 to 2010-11Source: The College Board, Trends in Student Aid, 2011
7.1f New fi gure
Average Federal Loans per FTE
Average Grant Aid per FTENote: Loan numbers do not include nonfederal loans, which provide funding for students but do not involve subsidies. The fi gures reported here refl ect total student aid amounts divided across all students, including those who did not receive aid. Federal Loan dollars refl ect disbursements beginning 1995-96. Loan disbursements are estimated for years prior to 1995-96.
completionagenda.collegeboard.org187

Total Undergraduate Student Aid by Source (in Billions), 2010-11Source: The College Board, Trends in Student Aid, 2011
Number of Recipients of Federal Aid by Program (with Average Aid Received), 2010-11Source: The College Board, Trends in Student Aid, 2011
7.1g
7.1h
0
40
80
120
160
200
Education TaxCredits andDeductions
FederalLoans
TotalFederalWork-Study
InstitutionalGrants
PellGrants
OtherFederal Grant
Programs
In B
illio
ns
Private andEmployer
Grants
StateGrants
$13.4
$70.0
$1.0
$29.7
$13.1
$34.8
$6.6 $9.1
$177.6
ACG FederalEducation Tax
Benefits
FederalPell Grant
FSEOG PerkinsLoan
Post-9/11GI Bill Veterans
Benefits
SMART Work-Study
0
1
2
3
4
5
6
7
8
12
0
1
2
3
4
5
6
7
8
9 9
10 10
11 11
12
In ThousandsIn M
illio
ns
0.79
$697 1.
34$5
66
0.15
$2,5
60
0.71
$1,6
42
0.61
$7,2
82
0.49
$1,9
69
9.08
$3,8
28
12.0
0$1
,236
2010-11 Recipients
2010-11 Aid Per Recipient
New fi gure
New fi gure
completionagenda.collegeboard.org Recommendation Seven 188

Percentage of Undergraduate Students Borrowing Federal Stafford Loans, 2000-01, 2005-06 and 2010-11Source: The College Board, Trends in Student Aid, 2011
7.1i
0
10
20
30
40
50
60
70
80
90
100
2000-01(2.5% with PLUS)
2005-06(3.6% with PLUS)
2010-11(3.5% with PLUS)
78%
10%
4%8%
72%
11%5%
13%
66%
25%
4%5%
No Stafford Loans
Subsidized Only
Unsubsidized Only
Both Subsidized & Unsubsidized
New fi gure
When interpreting this measure, what should be kept in mind? The introduction of the American Opportunity Tax Credit (AOTC) in 2009
represented a signifi cant commitment by the federal government to defray
college tuition costs. In 2008, total federal tax benefi ts stood at $6.6 billion and
these benefi ts jumped to $14.7 billion (in constant 2009 dollars) in 2009 — the
last year for which data are available. Unlike Pell grants, the subsidies provided by
the federal government, up to $2,500 per student, are not based on ability to pay,
though only taxpayers with incomes up to $180,000 per year are eligible for the
tax benefi ts. A major perk of the AOTC is partial refundability. Individuals with no
tax liability are eligible for a refund not exceeding $1,000.
The AOTC shifted the distribution of individuals receiving federal tax benefi ts.
In 2008, only 5 percent of the federal tax benefi t recipients had adjusted gross
incomes less than $25,000. In 2009, this percentage had risen to 17 percent.
The percentage of tax benefi ts awarded to families with adjusted gross incomes
between $100,000 and $180,000 increased from 18 percent in 2008 to 26
percent in 2009.
Functioning similarly to grant aid in the sense that it is not accompanied by
any obligations on the part of the student, the AOTC differs from grant aid
because its benefi ts can only be realized if taxpayers are aware of its existence.
Moreover, unlike grant aid, which benefi ts students immediately upon their
enrollment, the benefi ts of tax credits and deductions are delayed until taxes
are fi led. A widespread push to make sure eligible taxpayers are aware of this
tuition assistance has the potential to ease fi nancial strains associated with
college attendance.
completionagenda.collegeboard.org189
Student Loan Debt LevelsWhat is this measure, and why is this measure important? This indicator
measures the student loan debt accumulated by students from the 1999-2000
academic year and the 2009-10 academic year. Postsecondary education is
an investment with a high rate of return for most students. However, some
students do not complete the programs they begin and, for others, the payoff
in the labor market is less than they might have anticipated. Although most
students can pay off their education debts without undue diffi culty, debt
burdens are unmanageable for a growing number of students. The need to
borrow at high levels discourages some students from enrolling or persisting
in college and, for others, it creates very diffi cult circumstances during the
repayment period after college.
What are the policy issues associated with this measure? Many factors,
including income inequality, rising college prices and lifestyle choices, contribute
to the amount students borrow. However, more generous need-based federal,
state and institutional grant programs can mitigate the need for students to rely
on borrowed funds.
Where are we now? Student debt levels in the United States continue to rise
each year for students who persist to bachelor’s degree completion. Figure 7.2a
shows that from 1999–2000 to 2009-10, the average debt per borrower among
public college bachelor’s degree recipients increased at an average annual rate
of 1.1 percent beyond infl ation. The percentage of nontransfer graduates with
debt increased from 54 to 56 percent. Average debt grew by 1.4 percent per
year over the most recent fi ve years of the decade. Figure 7.2b shows that from
1999–2000 to 2009-10, the average debt per borrower among private nonprofi t
bachelor’s degree recipients increased at an average annual rate of 2.2 percent
beyond infl ation. The percentage of nontransfer graduates with debt increased
from 63 to 65 percent. Average debt grew by 1.5 percent per year over the most
recent fi ve years of the decade.
Figure 7.2c shows the distribution of total undergraduate debt by sector and
type of degree or certifi cate in 2007-08. Figures 7.2d, 7.2e and 7.2f show that
among dependent students graduating from public and private nonprofi t four-
year institutions in 2007-08, those from low-income families borrowed only
slightly more than those from middle-income families.
When interpreting this measure, what should be kept in mind? Median student loan debt levels conceal the range of borrowing levels. About
a third of bachelor’s degree recipients graduate with no education debt. In any
given academic year, only about half of all full-time students take education
loans. However, increases in median debt levels for those who do borrow,
combined with information on the proportion of students with debt, provide an
important indicator of reliance on debt.
$12,300 As of 2010, average debt per bachelor’s degree recipient spread across all public four-year college graduates who earned degrees from the institution at which they began their studies is $12,300.
$18,300 As of 2010, average debt per bachelor’s degree recipient spread across all private nonprofi t four-year college graduates who earned degrees from the institution at which they began their studies is $18,300 in 2009-10.
completionagenda.collegeboard.org Recommendation Seven 190

7.2a Public Four Year: Average Total Debt Levels of Bachelor’s Degree Recipients in Constant 2010 Dollars, 1999–2000 to 2009-10Source: The College Board, Trends in Student Aid, 2011Note: Debt fi gures include both federal loans and loans from nonfederal sources that have been reported to the institutions, based on institutional reporting of aggregate debt fi gures. The data are not adequate to allow comparable calculations for-profi t institutions.
1999-00
2000-01
2001-02
2002-03
2003-04
2004-05
2005-06
2006-07
2007-08
2008-09
2009-10
In T
hous
ands
0
5
10
15
20
30
25
$22,000$19,800
$10,700 $11,200
$20,500
$12,300
Per Borrower
Per Bachelor’s Degree Recipient
Per Borrower
Per Bachelor’s Degree Recipient
Private Nonprofi t Four Year: Average Total Debt Levels of Bachelor’s Degree Recipients in Constant 2010 Dollars, 1999–2000 to 2009-10Source: The College Board, Trends in Student Aid, 2011Note: Debt fi gures include both federal loans and loans from nonfederal sources that have been reported to the institutions, based on institutional reporting of aggregate debt fi gures.
0
5
10
15
20
30
25
1999-00
2000-01
2001-02
2002-03
2003-04
2004-05
2005-06
2006-07
2007-08
2008-09
2009-10
In T
hous
ands
$28,100
$22,600
$14,200
$16,800
$26,100
$18,300
7.2b
completionagenda.collegeboard.org191

Median Debt Levels of 2007-08 Bachelor’s Degree Recipients at Public Four-Year Institutions Who Borrowed and Percentage with Debt, by Dependency Status and Family IncomeSource: The College Board, Trends in Student Aid, 2011
7.2d New fi gure
0
10
20
30
40
50
60
70
80
90
100
0
10
20
30
40
50
60
70
80
90
100
Percent
Less Than $30,000
$30,000 to$59,999
$60,000 to$89,999
$90,000 to$119,999
$120,000 orHigher
IndependentStudents
$16,
500
68%
$17,
400
69%
$17,
000
61%
$16,
300
52%
$14,
500
40%
68%
$20,
000In
Tho
usan
ds
Median Debt
Percentage with Debt
Distribution of Total Undergraduate Debt by Sector and Type of Degree or Certifi cate, 2007-08Source: The College Board, Trends in Student Aid, 2011
New fi gure
0
10
20
30
40
50
60
70
80
90
100
Public4-Year
(Bachelor'sDegree)
Private Nonprofit
4-Year(Bachelor's
Degree)
For-Profit(Bachelor's
Degree)
Public2-Year
(AssociateDegree)
For-Profit (Associate
Degree)
Public2-Year
(Certificate)
For-Profit(Certificate)
38%
16%
19%
14%
6%6%
28%
10%
19%
17%
10%
15%
4%4%
12%
23%
33%
24%
62%
23%
9%3%1%1%
2%
22%
34%
23%
13%
6%
70%
21%
7%
1%1%0%
10%
46%
34%
8%2%1%
No Debt
Less than $10,000
$10,000 to $19,999
$20,000 to $29,999
$30,000 to $39,999
$40,000 or more
7.2c
completionagenda.collegeboard.org Recommendation Seven 192
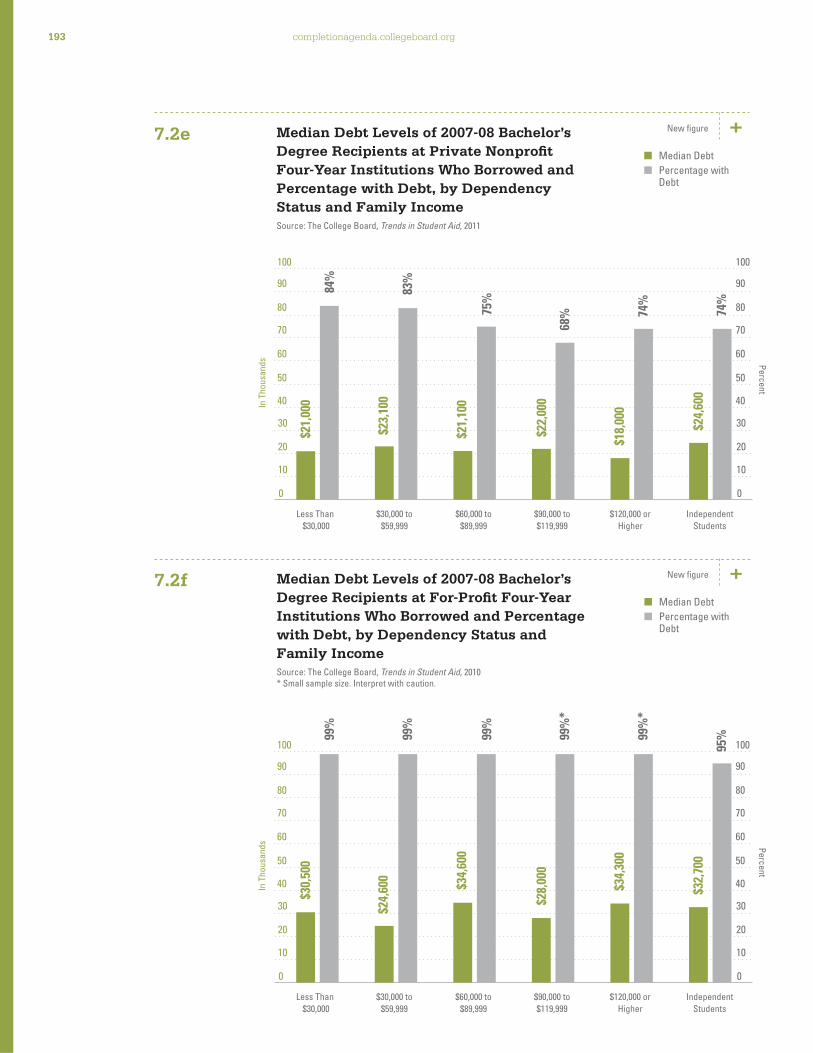
Median Debt Levels of 2007-08 Bachelor’s Degree Recipients at For-Profi t Four-Year Institutions Who Borrowed and Percentage with Debt, by Dependency Status and Family IncomeSource: The College Board, Trends in Student Aid, 2010* Small sample size. Interpret with caution.
7.2f New fi gure
0
10
20
30
40
50
60
70
80
90
100
0
10
20
30
40
50
60
70
80
90
100
Percent
Less Than $30,000
$30,000 to$59,999
$60,000 to$89,999
$90,000 to$119,999
$120,000 orHigher
IndependentStudents
$30,
500
$24,
600
99%
99%
99%
99%
*
99%
*
95%
$32,
700
$34,
600
$28,
000
$34,
300
In T
hous
ands
Median Debt
Percentage with Debt
Median Debt Levels of 2007-08 Bachelor’s Degree Recipients at Private Nonprofi t Four-Year Institutions Who Borrowed and Percentage with Debt, by Dependency Status and Family IncomeSource: The College Board, Trends in Student Aid, 2011
7.2e New fi gure
0
10
20
30
40
50
60
70
80
90
100
0
10
20
30
40
50
60
70
80
90
100
Percent
Less Than $30,000
$30,000 to$59,999
$60,000 to$89,999
$90,000 to$119,999
$120,000 orHigher
IndependentStudents
$21,
000
$23,
100
84%
83%
75%
68% 74
%
74%
$24,
600
$21,
100
$22,
000
$18,
000In
Tho
usan
ds
Median Debt
Percentage with Debt
completionagenda.collegeboard.org193

Simplifying the Federal Student Aid System and the Application ProcessWhat is this measure, and why is this measure important? Even when
suffi cient fi nancial aid funds are available, many students have diffi culty
accessing those funds. Navigating the fi nancial aid process is especially diffi cult
for low-income and fi rst-generation college students.61 A simpler application
process and fi nancial aid programs that are more predictable and transparent
have the potential to increase educational opportunities for all students,
especially for those students from families with low and moderate incomes and
for fi rst-generation students.
What are the policy issues associated with this measure? The Department of Education has the authority to modify the student aid
application process in signifi cant ways. Other measures, including removing
questions from the application, modifying the formula used to calculate aid
eligibility and consolidating programs, require congressional action. States
can also integrate state fi nancial aid systems into federal systems to allow
students to understand their full aid eligibility after completing the FAFSA. With
greater coordination of both federal and state aid, students can more easily
obtain the student aid needed to access and complete their higher education.62
The federal and state governments should also do more to make fi nancial aid
eligibility simpler and clearer so that students can determine their full fi nancial
aid eligibility. If these systems are made easier and more transparent, then low-
and moderate-income and fi rst-generation students will see that entering and
completing college is a realistic option.
61. Cracking the Student Aid Code. Retrieved May 12, 2010 from
http://www.advocacy.collegeboard.org/sites/default/fi les/11b_3172_Cracking_Code_Update_WEB_110112.pdf
62. See http://www2.ed.gov/fi naid/info/apply/fafsa-project.html
completionagenda.collegeboard.org Recommendation Seven 194

Where are we now? Many students who would be eligible for federal aid do
not complete the FAFSA, and many students forgo state dollars that they are
eligible to receive. Some of these students would likely apply if the application
processes for the FAFSA and state aid were simpler or if students and parents
were less intimidated by the application. Others might apply if they had better
information about the aid for which they could qualify. In 2009, the Department
of Education made considerable strides toward improving the application
process by implementing the following changes:
• Applicants can populate the FAFSA with data supplied directly from the tax
forms they have fi led with the IRS.
• The online FAFSA has been modifi ed to incorporate increased use of “skip
logic,” reducing the number of questions many applicants must answer.
• Applicants who complete the FAFSA immediately receive information
about the types and amounts of aid they are likely to receive, as well as
information about the colleges to which they are applying, including tuition
and graduation rates.
Congress should consider removing from the FAFSA all fi nancial questions that
cannot be answered with IRS data. This change could allow for the creation
of a formula that would simplify the eligibility formula, making it possible for
students to predict in advance the Pell Grants for which they would be eligible,
and all fi nancial data would come directly from the IRS. However, these changes
to the FAFSA have yet to be enacted by Congress.
Although there has been some movement in simplifying the FAFSA, there have
been some changes that are required of institutions that may go a long way
toward helping students and families. In accordance with the Higher Education
Opportunity Act of 2008, by Oct. 29, 2011, each postsecondary institution
that participates in Title IV federal student aid programs must post a net price
calculator on its website that uses institutional data to provide estimated net
price information to current and prospective students and their families based
on a student’s individual circumstances.63 Though institutions are required to
have net price calculators on their websites for students and their families,
institutions must market this new resource to current and prospective students
and their families if it is to serve as an effective tool.
63. See http://nces.ed.gov/ipeds/resource/
completionagenda.collegeboard.org195
Implementation of Policies Designed to Provide Incentives for Institutions to Promote Enrollment and Success of Low-Income and First-Generation StudentsWhat is this measure, and why is this measure important? Existing student-
aid programs were designed primarily to promote access to postsecondary
education. The nation has done a good job of increasing enrollment rates,
yet there is more that needs to be done in promoting college success and
completion. Too many students — particularly low-income and fi rst-generation
students — are beginning postsecondary education but never earning
a credential.64
What are the policy issues associated with this measure? The federal
government provides funds directly to students and provides some student-
aid funds to campuses to distribute to their students in the form of grants,
loans and work-study programs. The allocation of these funds is unrelated to
institutional success rates.
Where are we now? Our understanding of the best ways to use fi nancial
incentives to promote student success is limited. Any program designed to
further this goal should involve sound evaluation plans to assure that the use
of funds is as productive as possible. The Health Care Reconciliation Act of
2010 passed by Congress in March 2010 includes the Student Aid and Fiscal
Responsibility Act that includes College Access and Completion funds.65 These
funds will allocate $2.5 billion, over the course of fi ve years, in supporting
state efforts to boost the college completion rates of low-income students. An
evaluative component will be created to assess these many efforts in order to
pinpoint the most successful ones. This step that Congress has taken will allow
valuable data to be created that will inform states about effective promotion of
success for low-income students.
64. Choy, Susan P. (2001). Students Whose Parents Did Not Go To College: Postsecondary Access,
Persistence, and Attainment (NCES 2001-126). (Washington, DC: U.S. Department of Education,
National Center for Education).
65. Health Care Reconciliation Act, 2010.
completionagenda.collegeboard.org Recommendation Seven 196

EightKeep college affordable
WE RECOMMEND restraining growth in college costs and prices, using available aid and resources wisely, and insisting that state governments meet their obligations for funding higher education.
In Coming to Our Senses, the commission called for assuring college
affordability by restraining increases in college prices. In order to make this a
reality, the state governments must meet their obligations for funding higher
education. State appropriations are not keeping pace with the increasing
enrollments at colleges and universities, contributing to rapid increases in
tuition and fees.66 The lag in appropriations by states is leaving families and
students with the burden of fi nancing an increasing portion of the cost of higher
education. However, state appropriations and tuition prices cannot be viewed in
a vacuum. While state appropriations and tuition are indeed important, ensuring
college affordability also depends on other factors, such as living expenses,
family ability to pay and the availability of fi nancial aid. Each of these factors
affects the affordability of attending a college or university. All of these areas are
refl ected in the measures that have been chosen for this recommendation.
Indicators of progress on this recommendation include:
• State appropriations to fund public higher education;
• Tuition, fees and other costs of attendance at colleges and universities;
• Net price students pay for college;
• Change in family income levels; and
• Earnings of college graduates.
66. College Board. (2011). Trends in College Pricing. Retrieved October 26, 2011, from
http://trends.collegeboard.org/college_pricing/
completionagenda.collegeboard.org Recommendation Eight 198

General Findings for This Recommendation• As of 2010-11, total state appropriations to fund public higher education are
$78.9 billion.
• As of 2010-11, total state appropriations to fund public higher education per
FTE are $7,171.
• From 1980-81 to 2010-11, the change in total state appropriations for public
higher education has increased from $55.3 billion in 1980-81 to $78.9 billion
in 2010-11, or 42.7 percent.
• From 1980-81 to 2010-11, the change in total state appropriations for public
higher education per FTE decreased from $8,326 in 1980-81 to $7,171 in
2010-11, or -13.9 percent.
• As of the 2011-12 academic year, the average estimated undergraduate
budget for public two-year commuter students is $15,286, including tuition
and fees, room and board, books and supplies, transportation, and other
expenses.
• As of the 2011-12 academic year, the average estimated undergraduate
budget for public four-year in-state on-campus students is $21,447, including
tuition and fees, room and board, books and supplies, transportation, and
other expenses.
• As of the 2011-12 academic year, the average estimated undergraduate
budget for public four-year out-of-state on-campus students is $33,973,
including tuition and fees, room and board, books and supplies,
transportation, and other expenses.
• As of the 2011-12 academic year, the average estimated undergraduate
budget for private nonprofi t four-year on-campus students is $42,224,
including tuition and fees, room and board, books and supplies,
transportation, and other expenses.
• As of the 2011-12 academic year, at public two-year institutions, the net
price students pay for tuition and fees is -$810 (after subtracting grants and
federal tax benefi ts).
• As of the 2011-12 academic year, at public four-year institutions, the net
price students pay for tuition and fees is $2,490 (after subtracting grants and
federal tax benefi ts).
• As of the 2011-12 academic year, at private nonprofi t four-year institutions,
the net price students pay for tuition and fees is $12,970 (after subtracting
grants and federal tax benefi ts).
• From 2000 to 2010, the average family income has declined 16 percent
(infl ation adjusted) for low-income families.
• From 2000 to 2010, the average family income has declined 6 percent
(infl ation adjusted) for moderate-income families.
• As of 2009, the average amount of earnings for full-time workers ages
25 to 34 whose highest degree is a high school diploma is $34,594.
• As of 2009, the average amount of earnings for full-time workers ages
25 to 34 whose highest degree is an associate degree is $42,391.
• As of 2009, the average amount of earnings for full-time workers ages
25 to 34 whose highest degree is a bachelor’s degree is $53,483.
completionagenda.collegeboard.org199

State Appropriations to Fund Higher EducationWhat is this measure, and why is this measure important? This indicator
measures the state appropriation dollars used to support higher education in
both total dollars and per full-time equivalent (FTE) student in the United States.
Revenues for public colleges and universities, where about 70 percent of
students are enrolled, come primarily from a combination of state appropriations
and the tuition and fees students pay. This measure is important because the
inability of state appropriations to keep up with enrollment growth is a primary
driver of rising tuition levels.
What are the policy issues associated with this measure? State funding
levels depend on the interaction of state priorities and philosophies of
educational funding with fi scal constraints. With the pressures on state budgets
from declining revenues and competing demands, only a strong commitment to
affordable, high-quality public higher education on the part of state legislatures
can assure the funding levels required to restrain tuition increases and provide
adequate need-based aid.
Where are we now? In the United States, state fi scal support for education has
increased 42.7 percent from 1981-82 and 2010-11 (after adjusting for infl ation).
Figure 8.1a shows that this increase is despite the adjustment of these
numbers for infl ation. Figure 8.1b shows that after increasing by 6 percent in
the 1980s and by 5 percent in the 1990s, state appropriations per FTE student
declined by 23% in infl ation-adjusted dollars over the decade from 2000-
01 to 2010-11. This decline in fi scal support per FTE can be attributed largely
to the recession that has crippled state and federal budgets in the time of
increasing enrollments at public institutions. The 18 percent real decline in state
appropriations per FTE student from 2007-08 to 2010-11 was the largest three-
year decline in the 30 years of data reported here.
When the data are disaggregated by state, fi scal support for education ranges
from $66.9 million in Vermont to $11.7 billion in California. Figure 8.1c shows
that when states are placed in rank order, states with the highest fi scal support
for education are California, Texas, New York, North Carolina and Florida.
The states with the lowest fi scal support for education are Vermont, New
Hampshire, South Dakota, Rhode Island and Montana.
$78.9 Billion As of 2010-11, total public support for public higher education is $78.9 billion.
$1.6 billion FY2009–FY2010
$7,171 As of 2010-11, total state appropriations to fund higher education per FTE is $7,171.
$319 FY2009–FY2010
Updated data source
completionagenda.collegeboard.org Recommendation Eight 200

When the data are disaggregated by state, state fi scal support for education
per FTE ranges from $2,754 in Vermont to $13,090 in Wyoming. Figure 8.1d
shows that when states are placed in rank order, states with the highest fi scal
support for education per FTE are Wyoming, Alaska, North Carolina, Texas and
Connecticut. The states with the lowest fi scal support for education per FTE
are Vermont, New Hampshire, Colorado, Ohio and Montana.
When interpreting this measure, what should be kept in mind? State
appropriation levels and patterns differ considerably across states. Both
enrollment levels and economic circumstances must be understood to put
appropriations into context. However, national appropriations do provide an
important snapshot. It is much more important to understand the support in
education per FTE because this value takes into account the enrollment of the
state in addition to the allocation of education dollars. Further, this mitigates the
advantage that larger states have in allocating more money to higher education.
42.7% From 1980-81 to 2010-11 total public support for public higher education increased from $55.3 billion (in 2010 constant dollars) in 1980-81 to $78.9 billion in 2010-11, or 42.7 percent.
-13.9% From 1980-81 to 2010-11 total public support for public higher education per FTE decreased from $8,326 (in 2010 constant dollars) in 1980-81 to $7,171 in 2010-11, or -13.9 percent.
completionagenda.collegeboard.org201

Total Appropriations in Constant 2010 Dollars (in Billions), 1980-81 to 2010-11Sources: College Board, Trends in College Pricing, 2011Note: Fall 2010 FTE enrollment was based on preliminary IPEDS numbers. Appropriations reported here are for institutional operating expenses, not for capital expenditures. Funding includes both tax revenues and other state funds allocated to higher education.
Appropriations per Public FTE Student in Constant 2010 Dollars (in Thousands), 1980-81 to 2010-11Sources: College Board, Trends in College Pricing, 2011Note: Fall 2010 FTE enrollment was based on preliminary IPEDS numbers. Appropriations reported here are for institutional operating expenses, not for capital expenditures. Funding includes both tax revenues and other state funds allocated to higher education.
8.1a
8.1b
0
10
20
30
40
50
60
70
80
90
100
2004-05
2006-07
2008-09
2010-11
2002-03
2000-01
1998-99
1996-97
1994-95
1992-93
1990-91
1988-89
1986-87
1984-85
1982-83
1980-81
In B
illio
ns$78.9
$76.1
$55.3$63.5
2004-05
2006-07
2008-09
2010-11
2002-03
2000-01
1998-99
1996-97
1994-95
1992-93
1990-91
1988-89
1986-87
1984-85
1982-83
1980-81
0
1
2
3
4
5
6
7
8
9
10
In T
hous
ands
$7.2$8.3
$8.2
$6.9
New fi gure
New fi gure
Appropriations
Appropriations Excluding Federal Stimulus
Appropriations per FTE
Appropriations per
FTE Excluding Federal Stimulus
completionagenda.collegeboard.org Recommendation Eight 202

Educational Fiscal Support by State Rank, FY 2010–2011Source: State Higher Education Finance, State Higher Education, Executive Offi cers, 2011
8.1c
California
Texas
New York
North Carolina
Florida
Illinois
Georgia
Michigan
Ohio
Pennsylvania
New Jersey
Arizona
Maryland
Wisconsin
Virginia
Washington
Tennessee
Indiana
Minnesota
Massachusetts
Louisiana
Missouri
Alabama
Kentucky
Oklahoma
Connecticut
South Carolina
Colorado
Mississippi
Kansas
Oregon
New Mexico
Iowa
Arkansas
Utah
Nebraska
Nevada
Hawaii
West Virginia
Idaho
Alaska
Wyoming
North Dakota
Maine
Delaware
Montana
Rhode Island
South Dakota
New Hampshire
Vermont
District of Columbia
$11,683,824,350
$6,581,785,758
$4,817,473,365
$3,541,451,114
$3,408,549,094
$3,325,837,582
$2,558,404,198
$2,291,948,391
$2,041,142,065
$1,977,641,215
$1,929,769,000
$1,673,804,800
$1,658,253,134
$1,607,966,188
$1,583,189,711
$1,555,846,701
$1,317,599,357
$1,313,270,756
$1,280,857,000
$1,196,403,246
$1,174,964,909
$1,174,959,206
$1,137,010,562
$1,040,087,184
$981,978,880
$889,346,452
$834,817,353
$825,096,369
$796,728,225
$785,116,448
$750,948,945
$747,161,865
$741,743,209
$705,599,663
$672,510,100
$607,145,616
$516,471,637
$461,116,903
$386,020,036
$354,996,631
$302,853,868
$298,261,301
$246,221,389
$237,532,814
$228,167,650
$190,346,889
$168,351,962
$155,341,395
$127,897,496
$66,931,354
N/A
0 1 2 3 4 5 6 7 8 9 10 11 12 13 14 15
In Billions
New fi gure
completionagenda.collegeboard.org203

Educational Fiscal Support per FTE by State Rank, FY 2010–2011Source: State Higher Education Finance, State Higher Education, Executive Offi cers, 2011
8.1d New fi gure
Wyoming
Alaska
North Carolina
Texas
Connecticut
Oklahoma
Illinois
Mississippi
Nevada
New York
Idaho
New Mexico
Kentucky
Tennessee
Hawaii
Georgia
Maryland
Arkansas
New Jersey
Louisiana
Nebraska
North Dakota
Wisconsin
UNITED STATES
Alabama
Arizona
Maine
West Virginia
Missouri
Massachusetts
California
Florida
Washington
Minnesota
Delaware
South Carolina
Utah
Iowa
Kansas
Pennsylvania
Virginia
Michigan
Rhode Island
South Dakota
Oregon
Indiana
Montana
Ohio
Colorado
New Hampshire
Vermont
Distict of Columbia
$13,090
$12,606
$9,007
$8,897
$8,450
$8,400
$8,120
$7,942
$7,800
$7,783
$7,746
$7,589
$7,532
$7,477
$7,451
$7,319
$7,163
$7,144
$7,136
$6,995
$6,731
$6,520
$6,499
$6,451
$6,361
$6,322
$6,215
$6,155
$6,074
$6,006
$5,941
$5,922
$5,831
$5,645
$5,643
$5,477
$5,328
$5,276
$5,191
$5,159
$5,096
$4,822
$4,817
$4,809
$4,538
$4,325
$4,293
$4,293
$3,781
$2,884
$2,754
N/A
0 1 2 3 4 5 6 7 8 9 10 11 12 13 14 15
In Thousands
5.0%
18.6%
10.6%
25.6%
1.4%
25.9%
8.0%
17.2%
-12.2%
5.4%
-10.9%
-20.0%
0.1%
-3.9%
9.6%
-14.9%
5.4%
2.4%
-16.9%
12.1%
7.8%
26.6%
-1.8%
-3.2%
1.2%
0.4%
-6.2%
-0.2%
-10.7%
-8.5%
-7.9%
-19.0%
-7.7%
-3.8%
-1.6%
-16.2%
-6.3%
-1.9%
-18.7%
-14.3%
-8.9%
-19.3%
-27.4%
-6.0%
-9.9%
-16.8%
12.9%
-13.9%
19.1%
-13.1%
-9.3%
N./A
5 YearChange
23
U.S. Average
28*
States
States
AVG
6,451$
completionagenda.collegeboard.org Recommendation Eight 204

Tuition, Fees and Other Costs of Attendance at Colleges and UniversitiesWhat is this measure, and why is this measure important? This indicator
shows the tuition, fees and other costs of attendance at colleges and
universities, the published tuition price by state and the average annual
percentage increase in infl ation-adjusted published prices by decade. Although
published prices can be deceptive because many students receive grant aid
that reduces the price they actually pay, other students do pay the full price.
Moreover, because of incomplete knowledge about the complex system of
fi nancial aid, many students are unaware of the subsidies available to them and
make decisions based on the published prices. Other costs, including room,
board, books and other expenses are larger than tuition for many students and
must also be considered in evaluating fi nancial barriers to college participation.
What are the policy issues associated with this measure? Prices are
sometimes set by institutions and sometimes by state legislatures or other
public bodies. While it is tempting to push for small tuition increases in order
to promote affordability, the provision of quality education requires adequate
resources, and educational expenditures per student continue to rise across all
postsecondary sectors. Moderate increases in tuition and fees may allow for an
increased commitment to aid for low-income students without disadvantaging
the higher-income students for whom these increases would not pose any
substantial fi nancial barriers. Annual changes in tuition and fees cannot be
viewed in isolation from changes in state appropriations, federal aid programs,
educational expenditures, and strategic priorities with respect to redistributing
educational subsidies across the enrolling students.
Where are we now? In the United States, the average published charges for
undergraduates have continued to increase. Figure 8.2a shows that the average
estimated undergraduate budget, including tuition and fees, room and board,
books and supplies, transportation, and other expenses, is $15,286 for commuter
students at public two-year institutions, $21,447 for in-state on-campus students
at public four-year institutions, $33,973 for out-of-state on-campus students
at public four-year institutions, and $42,224 for on-campus students at private
nonprofi t four-year institutions. On average, tuition and fees at public four-year
colleges are 2.8 times as high as at public two-year colleges. However, the
total budget for a public four-year college student, including housing, food,
transportation, books and supplies, and other expenses, is only about 40 percent
higher than the total budget for a public two-year college student. Tuition and fees
constitute 67 percent of the average total budget for full-time students at private
nonprofi t four-year colleges and universities.
$15,286 As of the 2011-12 academic year, the average estimated undergraduate budget for public two-year commuter students is $15,286, including tuition and fees, room and board, books and supplies, transportation, and other expenses.
$21,447 As of the 2011-12 academic year, the average estimated undergraduate budget for public four-year in-state on-campus students is $21,447, including tuition and fees, room and board, books and supplies, transportation, and other expenses.
completionagenda.collegeboard.org205

Figure 8.2b shows that both tuition and fees and room and board differ by the
Carnegie classifi cation of the school. Figure 8.2c shows the annual percentage
increase in infl ation-adjusted tuition and fees by decade. In 2011-12, the average
published tuition and fees at public four-year institutions are 29 percent of the
average published tuition and fees at private nonprofi t four-year institutions, up
from 22 percent a decade earlier.
Figure 8.2d shows that from 1981-82 to 1991-92, average published tuition and
fees increased slightly more rapidly at private than at public four-year colleges
and universities. Over the most recent decade, the average public four-year
price rose more than twice as fast as the average private four-year price.
When the data are disaggregated by state, in-state published tuition prices at
public two-year institutions range from $1,119 in California to $6,741 in New
Hampshire. Figure 8.2e shows that when states are placed in rank order,
the states with the lowest in-state published tuition prices at public two-year
institutions are California, New Mexico, Texas, North Carolina and Arizona.
The states with the highest in-state published tuition prices at public two-
year institutions are New Hampshire, Vermont, Minnesota, South Dakota and
Massachusetts.
When the data are disaggregated by state, in-state published tuition prices
at public four-year institutions range from $4,125 in Wyoming to $13,507 in
New Hampshire. Figure 8.2f shows that when states are placed in rank order,
the states with the lowest in-state published tuition prices at public four-year
institutions are Wyoming, Louisiana, Utah, Alaska, New Mexico and West
Virginia. The states with the highest in-state published tuition prices at public
four-year institutions are New Hampshire, Vermont, Pennsylvania, New Jersey
and Illinois.
When the data are disaggregated by state, published tuition prices at private
not-for-profi t four-year institutions range from $6,198 in Utah to $36,724 in
Massachusetts. Figure 8.2g shows that when states are placed in rank order,
the states with the lowest published tuition prices at private not-for-profi t
four-year institutions are Utah, Idaho, Hawaii, Delaware and Mississippi. The
states with the highest published tuition prices at private not-for-profi t four-year
institutions are Massachusetts, Connecticut, California, the District of Columbia
and Maryland.
When interpreting this measure, what should be kept in mind?
Focusing on published prices without also considering student aid can give an
exaggerated picture of the fi nancial hurdles facing students. Moreover, there
is considerable variation in the prices charged by colleges and universities in
the United States. Typically, two-year public colleges charge less than four-
year public institutions, which have lower prices than for-profi t institutions and
the highest published prices are in the private not-for-profi t sector. However,
there are also sizable differences within these sectors, particularly by state or
region and among doctoral universities, master’s universities and baccalaureate
colleges. Increasingly, there are also multiple tuition levels within institutions,
depending on program and/or year of study.
$33,973 As of the 2011-12 academic year, the average estimated undergraduate budget for public four-year out-of-state on-campus students is $33,973, including tuition and fees, room and board, books and supplies, transportation, and other expenses.
$42,224 As of the 2011-12 academic year, the average estimated undergraduate budget for private nonprofi t four-year on-campus students is $42,224, including tuition and fees, room and board, books and supplies, transportation, and other expenses.
completionagenda.collegeboard.org Recommendation Eight 206

Average Estimated Undergraduate Budgets by Type and Control of Institution, 2011–12 (Enrollment Weighted)Source: The College Board, Trends in College Pricing, 2011Note: Average total expenses include room and board costs for commuter students, which are average estimated living expenses for students living off campus but not with parents. Expense categories are based on institutional budgets for students as reported by colleges and universities in the Annual Survey of Colleges. They do not necessarily refl ect actual student expenditures.
8.2a
0
5
10
15
20
25
30
Public 2-Year(Commuter)
Public 4-Year(In-State On-Campus)
Public 4-Year(Out-of-State On-Campus)
Private Nonprofit4-Year
(On-Campus)
In T
hous
ands
35
40
45
$2,963
$7,408
$1,182$1,606
$2,127
$15,286
$8,244
$8,887
$1,168$1,082$2,066
$21,447
$20,770
$8,887
$1,168$1,082$2,066
$33,973
$28,500
$10,089
$1,213$926
$1,496
$42,224
Tuition and Fees
Room and Board
Books and Supplies
Transportation
Other Expenses
New fi gure
completionagenda.collegeboard.org207

Average Published Charges for Undergraduates by Carnegie Classifi cation, 2011-12 (Enrollment Weighted) Source: The College Board, Trends in College Pricing, 2011Note: Enrollment-weighted tuition and fees are derived by weighting the price charged by each institution by the number of full-time students enrolled in fall 2010. Public four-year in-state charges are weighted by total fall 2010 full-time enrollment in each institution. Out-of-state tuition and fees are computed by adding the average in-state price to the out-of-state premium weighted by the number of full-time out-of-state students enrolled at each institution. Room and board charges are weighted by the number of students residing on campus.
8.2b
0
5
10
15
20
25
30
Public Doctoral
(In State)
Public Master's
(In State)
Public Bachelor's
(In State)
Private Doctoral
In T
hous
ands
35
Private Master's
40
45
Private Bachelor's
$9,185
$9,353
$18,538
$7,186
$8,153
$15,339
$6,604
$8,251
$14,855 $35,195
$11,806
$47,001
$25,863
$9,629
$35,492
$25,838
$9,233
$35,071
Tuition and Fees
Room and Board
New fi gure
completionagenda.collegeboard.org Recommendation Eight 208

Average Annual Percentage Increases in Infl ation-Adjusted Published Prices by Decade, 1981-82 to 2011-12Source: The College Board, Trends in College Pricing, 2011
Infl ation-Adjusted Published Tuition and Fees Relative to 1981-82, 1981-82 to 2011-12 (1981-82 = 100)Source: The College Board, Trends in College Pricing, 2011
8.2c
8.2d
0
1
2
3
4
5
6
7
8
9
10
Private Nonprofit4-Year
(Tuition & Fees)
Public4-Year
(Tuition & Fees)
Public2-Year
(Tuition & Fees)
Private Nonprofit4-Year
(Tuition & Fees &Room & Board)
Public4-Year
(Tuition & Fees &Room & Board)
4.8%
3.1%2.6%
4.5%
3.2%
5.6%6.1%
0.5%
3.8%4.2%
2.6%2.4% 2.5%2.4%
4.1%
0
1
2
3
4
5
6
7
8
9
10
2011-12
2009-10
1981-82
1983-84
1985-86
1987-88
1989-90
1991-92
1993-94
1995-96
1997-98
1999-00
2001-02
2003-04
2005-06
2007-08
In H
umdr
eds
276.8
367.7
280.9
100.0100.0100.0
184.3
190.9196.9
Private Not-for-Profi t 4-Year
Public 4-Year
Public 2-Year
New fi gure
New fi gure
1981-82 to 1991-92
1991-92 to 2001-02
2001-02 to 2011-12
completionagenda.collegeboard.org209
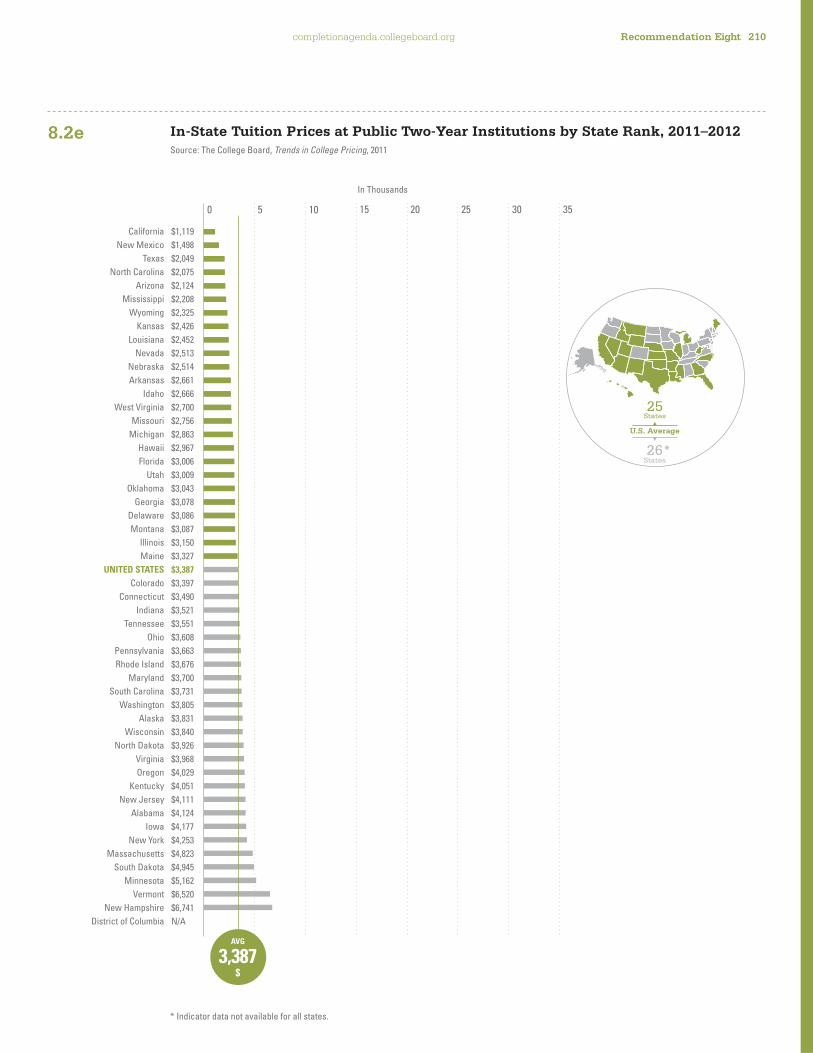
In-State Tuition Prices at Public Two-Year Institutions by State Rank, 2011–2012Source: The College Board, Trends in College Pricing, 2011
8.2e
0 5 10 15 20 25 30 35
California
New Mexico
Texas
North Carolina
Arizona
Mississippi
Wyoming
Kansas
Louisiana
Nevada
Nebraska
Arkansas
Idaho
West Virginia
Missouri
Michigan
Hawaii
Florida
Utah
Oklahoma
Georgia
Delaware
Montana
Illinois
Maine
UNITED STATES
Colorado
Connecticut
Indiana
Tennessee
Ohio
Pennsylvania
Rhode Island
Maryland
South Carolina
Washington
Alaska
Wisconsin
North Dakota
Virginia
Oregon
Kentucky
New Jersey
Alabama
Iowa
New York
Massachusetts
South Dakota
Minnesota
Vermont
New Hampshire
District of Columbia
$1,119
$1,498
$2,049
$2,075
$2,124
$2,208
$2,325
$2,426
$2,452
$2,513
$2,514
$2,661
$2,666
$2,700
$2,756
$2,863
$2,967
$3,006
$3,009
$3,043
$3,078
$3,086
$3,087
$3,150
$3,327
$3,387
$3,397
$3,490
$3,521
$3,551
$3,608
$3,663
$3,676
$3,700
$3,731
$3,805
$3,831
$3,840
$3,926
$3,968
$4,029
$4,051
$4,111
$4,124
$4,177
$4,253
$4,823
$4,945
$5,162
$6,520
$6,741
N/A
In Thousands
25
U.S. Average
26*
States
States
AVG
3,387$
* Indicator data not available for all states.
completionagenda.collegeboard.org Recommendation Eight 210

In-State Tuition Prices at Public Four-Year Institutions by State Rank, 2011–2012Source: The College Board, Trends in College Pricing, 2011
8.2f
0 5 10 15 20 25 30 35
Wyoming
Louisiana
Utah
Alaska
New Mexico
West Virginia
Florida
Mississippi
Idaho
North Carolina
Montana
Nevada
Oklahoma
New York
Arkansas
Georgia
North Dakota
South Dakota
Nebraska
Kansas
District of Columbia
Tennessee
Iowa
Missouri
Colorado
Kentucky
Oregon
Maryland
Alabama
UNITED STATES
Texas
Wisconsin
Indiana
Hawaii
Ohio
California
Connecticut
Maine
Arizona
Washington
Virginia
Minnesota
Rhode Island
Massachusetts
South Carolina
Delaware
Michigan
Illinois
New Jersey
Pennsylvania
Vermont
New Hampshire
$4,125
$5,123
$5,292
$5,456
$5,457
$5,532
$5,626
$5,668
$5,681
$5,685
$5,874
$6,044
$6,059
$6,213
$6,646
$6,808
$6,847
$6,873
$6,934
$6,960
$7,000
$7,209
$7,562
$7,668
$7,849
$7,963
$7,988
$7,993
$7,993
$8,043
$8,078
$8,193
$8,334
$8,352
$8,904
$9,022
$9,197
$9,354
$9,428
$9,484
$9,618
$9,966
$10,007
$10,173
$10,300
$10,496
$10,837
$11,600
$12,041
$12,079
$13,078
$13,507
In Thousands
29
U.S. Average
22
States
States
AVG
8,043$
completionagenda.collegeboard.org211

Tuition Prices at Private Four-Year Institutions by State Rank, 2011–2012Source: The College Board, Trends in College Pricing, 2011
8.2g
0 5 10 15 20 25 30 35
Utah
Idaho
Hawaii
Delaware
Mississippi
North Dakota
Arkansas
West Virginia
Alabama
Michigan
Nebraska
Kansas
South Carolina
Kentucky
Oklahoma
South Dakota
Montana
Tennessee
Missouri
Virginia
Nevada
Alaska
UNITED STATES
Georgia
Florida
Iowa
Arizona
Texas
North Carolina
Wisconsin
Ohio
Illinois
Indiana
Louisiana
Maine
Minnesota
Washington
New Mexico
Oregon
New Jersey
Pennsylvania
Colorado
New York
Vermont
New Hampshire
Rhode Island
Maryland
District of Columbia
California
Connecticut
Massachusetts
Wyoming
$6,198
$6,614
$12,610
$13,888
$14,635
$14,700
$18,250
$18,606
$18,719
$19,414
$20,213
$21,042
$21,951
$22,171
$22,415
$22,926
$22,987
$23,485
$24,476
$24,683
$25,370
$25,406
$25,869
$26,029
$26,494
$26,551
$26,712
$26,828
$27,015
$27,239
$28,376
$28,903
$29,578
$30,024
$31,414
$31,462
$31,618
$31,656
$31,827
$32,447
$32,559
$33,129
$33,151
$33,643
$33,761
$33,943
$34,269
$35,581
$35,766
$35,991
$36,724
N/A
In Thousands
22
U.S. Average
29*
States
States
AVG
25,869$
* Indicator data not available for all states.
completionagenda.collegeboard.org Recommendation Eight 212
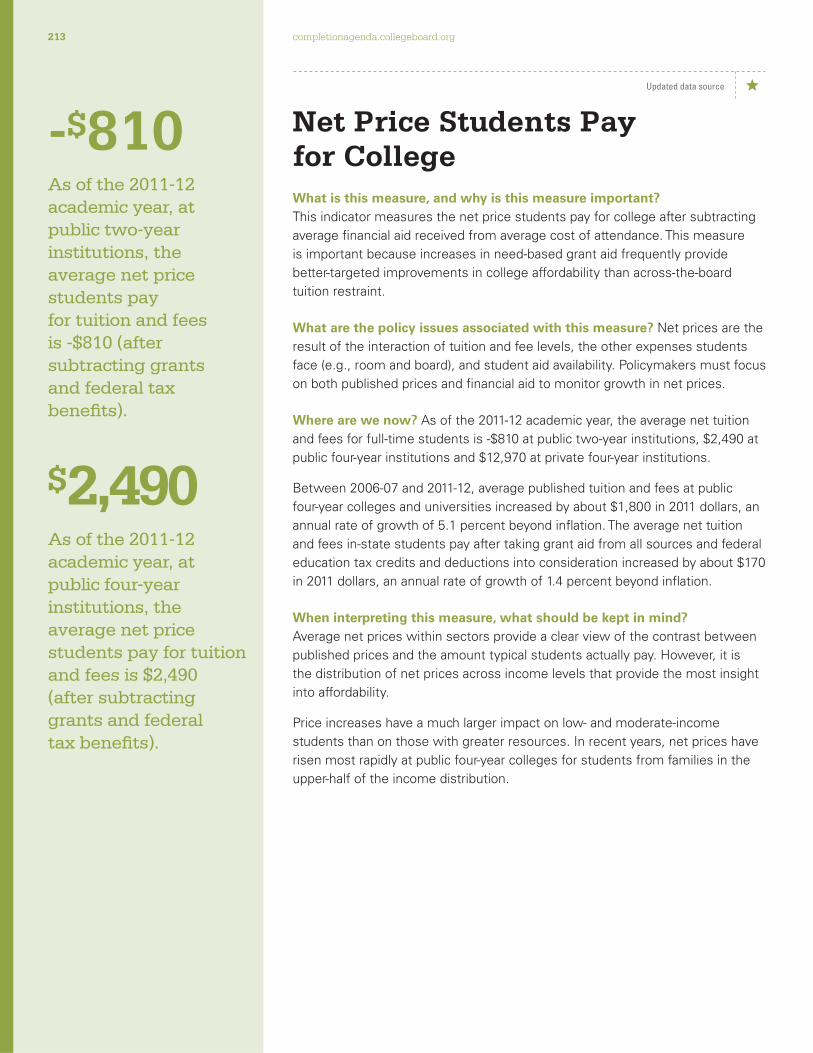
Net Price Students Pay for CollegeWhat is this measure, and why is this measure important? This indicator measures the net price students pay for college after subtracting
average fi nancial aid received from average cost of attendance. This measure
is important because increases in need-based grant aid frequently provide
better-targeted improvements in college affordability than across-the-board
tuition restraint.
What are the policy issues associated with this measure? Net prices are the
result of the interaction of tuition and fee levels, the other expenses students
face (e.g., room and board), and student aid availability. Policymakers must focus
on both published prices and fi nancial aid to monitor growth in net prices.
Where are we now? As of the 2011-12 academic year, the average net tuition
and fees for full-time students is -$810 at public two-year institutions, $2,490 at
public four-year institutions and $12,970 at private four-year institutions.
Between 2006-07 and 2011-12, average published tuition and fees at public
four-year colleges and universities increased by about $1,800 in 2011 dollars, an
annual rate of growth of 5.1 percent beyond infl ation. The average net tuition
and fees in-state students pay after taking grant aid from all sources and federal
education tax credits and deductions into consideration increased by about $170
in 2011 dollars, an annual rate of growth of 1.4 percent beyond infl ation.
When interpreting this measure, what should be kept in mind?
Average net prices within sectors provide a clear view of the contrast between
published prices and the amount typical students actually pay. However, it is
the distribution of net prices across income levels that provide the most insight
into affordability.
Price increases have a much larger impact on low- and moderate-income
students than on those with greater resources. In recent years, net prices have
risen most rapidly at public four-year colleges for students from families in the
upper-half of the income distribution.
-$810 As of the 2011-12 academic year, at public two-year institutions, the average net price students pay for tuition and fees is -$810 (after subtracting grants and federal tax benefi ts).
$2,490 As of the 2011-12 academic year, at public four-year institutions, the average net price students pay for tuition and fees is $2,490 (after subtracting grants and federal tax benefi ts).
Updated data source
completionagenda.collegeboard.org213

$12,970 As of the 2011-12 academic year, at private four-year institutions, the average net price students pay for tuition and fees is $12,970 (after subtracting grants and federal tax benefi ts).
Average Net Tuition and Fees, and Room and Board in Constant 2011 Dollars for Full-Time Undergraduate Students, 2011-12 (Estimated)Source: The College Board, Trends in College Pricing, 2011
8.3
TotalPublic 2-Year
NetPublic 2-Year
TotalPublic 4-Year
NetPublic 4-Year
TotalPrivate 4-Year
NetPrivate 4-Year
0
3
6
9
12
15
18
21
24
27
30
$2,9
60
$7,4
10
-$81
0
$7,4
10
$8,2
40
$8,8
90 $12,
970
$10,
090
$28,
500
$10,
090
$2,4
90
$8,8
90
Tuition and Fees
Room and Board
completionagenda.collegeboard.org Recommendation Eight 214

Changes in Family Income LevelsWhat is this measure, and why is this measure important? This indicator
measures the percentage growth in mean family income by quintile in constant
infl ation-adjusted dollars. This measure is important because college affordability
depends on family fi nancial capacity and on the prices of other major goods and
services. Much of the current diffi culty families and students face in fi nancing
postsecondary education arises from widespread unemployment, increased
income inequality and general economic weakness.
What are the policy issues associated with this measure? Income levels are
not directly correlated to education policy, but changes in incomes must be kept
in mind in evaluating reasonable education fi nancing policies.
Where are we now? In the United States, average family income for low-
income families declined 16 percent from 2000 to 2010. Figure 8.4 shows that
the percentage growth in mean family income also declined for the second
lowest quintile by 9 percent, and the percentage growth in mean family income
for middle-income families declined by 6 percent. Income levels decreased by
3 percent for the second highest quintile, declined by 6 percent for the highest
quintile, and declined 11 percent for the top 5 percent (which is a subset of
the highest quintile). Over the entire income distribution in the United States,
average family incomes in 2010 were lower in infl ation-adjusted dollars than they
were a decade earlier. The largest declines were for the families in the lowest
20 percentage of the population and for those in the highest 5 percentage.
When interpreting this measure, what should be kept in mind? The distribution of income and changes in that distribution over time highlight
the extent to which college affordability problems are concentrated in certain
segments of the population.
-16.0% From 2000 to 2010, average family income has declined 16 percent (infl ation adjusted) for low-income families.
-6.0% From 2000 to 2010, average family income has declined 6 percent (infl ation adjusted) for moderate-income families.
completionagenda.collegeboard.org215
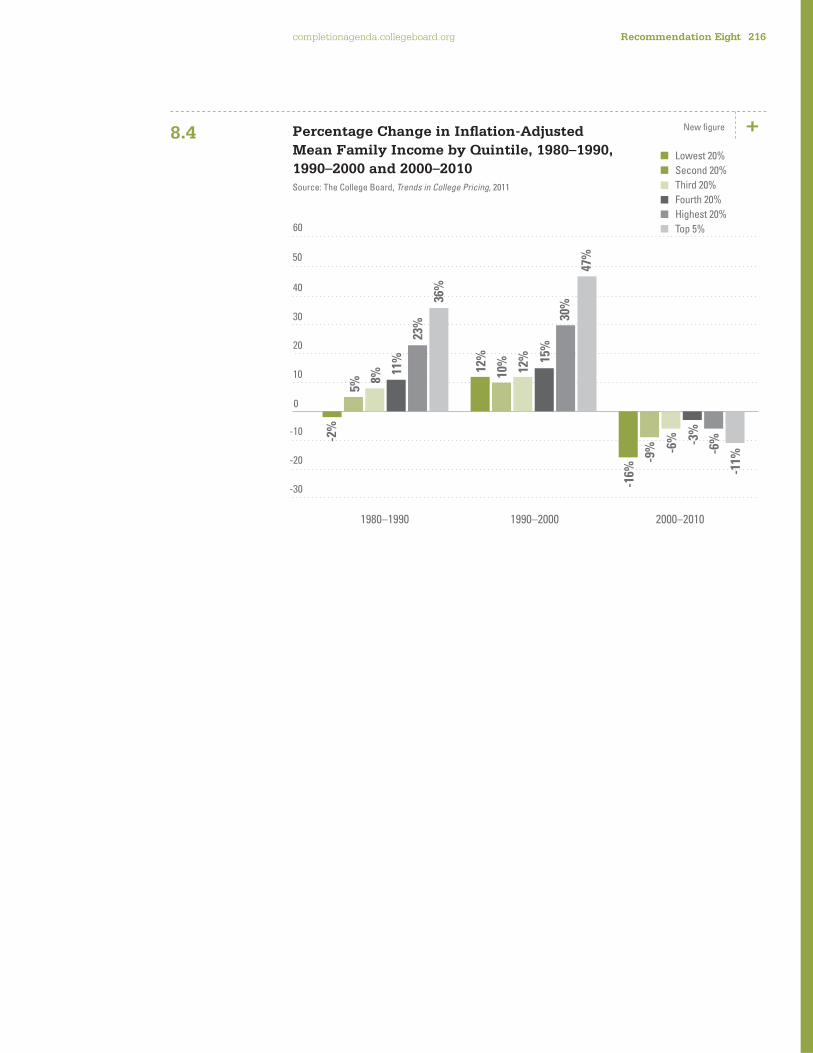
-30
-20
-10
0
10
20
30
40
50
1980–1990
-2%
5%
8%
11%
23%
36%
12%
10% 12% 15
%
30%
47%
-16%
-9% -6
% -3%
-6%
-11%
1990–2000 2000–2010
60
Percentage Change in Infl ation-Adjusted Mean Family Income by Quintile, 1980–1990, 1990–2000 and 2000–2010Source: The College Board, Trends in College Pricing, 2011
8.4 Lowest 20%
Second 20%
Third 20%
Fourth 20%
Highest 20%
Top 5%
New fi gure
completionagenda.collegeboard.org Recommendation Eight 216

Earnings of College GraduatesWhat is this measure, and why is this measure important? This indicator
measures the average earnings of full-time workers ages 25 to 34 in the
United States. This measure is important because postsecondary education
is an investment in the future that pays off in a variety of ways, including
higher lifetime earnings. It is reasonable for students to borrow and repay their
debts out of future earnings, yet the earnings premium for college education
determines how feasible it is to repay these debts.
What are the policy issues associated with this measure? The earnings
of recent college graduates determine the ease with which they can repay
their student debt. Slow growth and instability in these earnings levels make
the need for income-based repayment and other protections for borrowers in
repayment more urgent.
Where are we now? As of 2009, the infl ation adjusted average earnings
for full-time workers ages 25 to 34 in the United States is $34,594 for high
school graduates and GED recipients, compared with $53,483 for those with
a bachelor’s degree (Figure 8.5). The infl ation adjusted average earnings for
full-time workers ages 25 to 34 in the United States are $42,391 for those
with an associate degree.
When interpreting this measure, what should be kept in mind? Earnings for
25- to 34-year-olds have not grown measurably in recent years — even without
adjusting for infl ation — for workers at any level of educational attainment.
Those with no college education and those with associate degrees have seen
the largest declines. The gap in mean earnings between those who have earned
bachelor’s degrees and those with no college experience was $18,889 in 2009.
$34,594 As of 2009, the average earnings for full-time workers ages 25 to 34 whose highest degree is a high school diploma or a GED is $34,594.
$42,391 As of 2009, the average earnings for full-time workers ages 25 to 34 whose highest degree is an associate degree is $42,391.
$53,483 As of 2009, the average earnings for full-time workers ages 25 to 34 whose highest degree is a bachelor’s degree is $53,483.
completionagenda.collegeboard.org217

Average Earnings of Full-Time Workers Ages 25–34, 2009Source: U.S. Census Bureau, Current Population Survey, 2010
8.5
0
10
20
30
40
50
60
70
80
90
100
High School Some CollegeNo Degree
AssociateDegree
Bachelor'sDegree
Bachelor'sDegreeor More
$34,594 $39,110
$42,391
$53,483 $59,690
In T
hous
ands
completionagenda.collegeboard.org Recommendation Eight 218
NineDramatically increase college completion rates
WE RECOMMEND that institutions of higher education set out to dramatically increase college completion rates by improving retention, easing transfer among institutions and implementing data-based strategies to identify retention and dropout challenges.

Increasing college graduation, or completion, rates is essential to reaching the
commission’s goal. The commission noted that it is imperative for institutions
to have the determination to understand why some students do not graduate,
with the hope of developing and implementing interventions that will enhance
graduation rates across all student groups.
Increasing college completion rates will be more challenging in light of projected
demographic changes that vary across states.67 The greatest growth in high
school graduates will be among groups who historically have not had as much
access to or success in higher education. The commission’s goal cannot be
met without a substantial commitment by states and institutions to eliminate
racial and ethnic gaps in degree completion. States will have to develop and
differentiate strategies geared toward the particular needs of their population.
Policymakers will need to consider the impact of both demographic changes
and the current economic crisis in order to implement effective approaches that
improve graduation rates.
It is important to understand the difference between educational attainment
rates and graduation rates in order to avoid confusing the two concepts. The
former is the focus of the commission’s overall goal, while the latter is the focus
of this recommendation. While graduation rates affect educational attainment
rates, the two are distinctly different measures.
Educational attainment is based on the highest level of education completed
by an individual, regardless of when or where a person started or fi nished their
education, how long he or she took to earn the degree or whether the individual
attended on a part- or full-time basis. These estimates are useful for making
judgments about how well educated the United States is in comparison to
other nations.
Graduation rates provide important insights into the success of institutions,
states and the country as a whole in moving students in a timely manner
from the point of entry to degree attainment. As mandated by Congress, they
are based on fi rst-time, full-time students entering a two- or four-year college
at a specifi c point in time and graduating from that same institution within a
particular amount of time. These estimates provide insights into postsecondary
outcomes, but they are not useful for comparing the United States to other
nations because of the differences in how graduation rates are defi ned and
calculated in various countries.
In understanding the degree to which the nation is increasing completion rates, three indicators may prove fruitful to policymakers and educators:
• Freshman-to-sophomore retention;
• Graduation rates of associate degree– and certifi cate-seeking students;
• Graduation rates of bachelor’s degree–seeking students; and
• Degrees Awarded at Colleges and Universities.
67. For more details, see Knocking at the College Door. (2008). (Boulder: Western Interstate Commission for
Higher Education).
completionagenda.collegeboard.org Recommendation Nine 220

General Findings for This Recommendation• As of 2008, 60.0 percent of full-time freshmen at public two-year colleges
return for the sophomore year.
• As of 2008, 69.0 percent of full-time freshmen at private, for-profi t, two-year
colleges return for the sophomore year.
• As of 2008, 78.2 percent of full-time freshmen at public four-year colleges
return for the sophomore year.
• As of 2008, 79.1 percent of full-time freshmen at private, not-for-profi t, four-
year colleges return for the sophomore year.
• As of 2008, 27.5 percent of full-time degree- or certifi cate-seeking students
at two-year colleges graduate in three years or less.
• As of 2008, 22.6 percent of full-time African American degree- or certifi cate-
seeking students at two-year colleges graduate in three years or less.
• As of 2008, 24.9 percent of full-time American Indian or Alaska Native
degree- or certifi cate-seeking students at two-year colleges graduate in
three years or less.
• As of 2008, 25.7 percent of full-time Hispanic degree- or certifi cate-seeking
students at two-year colleges graduate in three years or less.
• As of 2008, 34.1 percent of full-time degree- or certifi cate-seeking students
at two-year colleges graduate in four years or less.
• As of 2008, 57.7 percent of full-time bachelor’s degree–seeking students at
four-year colleges graduate in six years or less.
• As of 2008, 38.5 percent of American Indian or Alaska Native full-time
bachelor’s degree–seeking students at four-year colleges graduate in six
years or less.
• As of 2008, 40.5 percent of African American full-time bachelor’s degree–
seeking students at four-year colleges graduate in six years or less.
• As of 2008, 49.4 percent of Hispanic full-time bachelor’s degree–seeking
students at four-year colleges graduate in six years or less.
• As of 2008, 60.6 percent of full-time bachelor’s degree–seeking students at
four-year colleges graduate in eight years or less.
• As of 2009, the number of associate degrees has increased 36.0 percent
from 1,159,550 in 2001 to 1,577,136 in 2009.
• As of 2009, the number of bachelor’s degrees has increased 29.6 percent
from 2,597,018 in 2001 to 3,366,858 in 2009.
• As of 2009, 1.1 percent of all associate degrees are awarded to American
Indians or Alaska Natives.
• As of 2009, 5.3 percent of all associate degrees are awarded to Asian
Americans and Pacifi c Islanders.
• As of 2009, 13.1 percent of all associate degrees are awarded to African
Americans.
• As of 2009, 12.7 percent of all associate degrees are awarded to Hispanics.
completionagenda.collegeboard.org221
• As of 2009, 67.8 percent of all associate degrees are awarded to whites.
• As of 2009, 0.8 percent of all bachelor’s degrees are awarded to American
Indians or Alaska Natives.
• As of 2009, 7.3 percent of all bachelor’s degrees are awarded to Asian
Americans and Pacifi c Islanders.
• As of 2009, 9.8 percent of all bachelor’s degrees are awarded to African
Americans.
• As of 2009, 8.3 percent of all bachelor’s degrees are awarded to Hispanics.
• As of 2009, 73.8 percent of all bachelor’s degrees are awarded to whites.
• As of 2009, 62.1 percent of all associate degrees are awarded to females.
• As of 2009, 57.3 percent of all bachelor’s degrees are awarded to females.
• As of 2009, 19.6 percent of all degrees are awarded in business,
management and marketing.
• As of 2009, 17.7 percent of all degrees are awarded in health professions
and clinical sciences.
• As of 2009, 9.8 percent of all degrees are awarded in education.
• As of 2009, 3.3 percent of all degrees are awarded engineering.
completionagenda.collegeboard.org Recommendation Nine 222
Freshman-to-Sophomore RetentionWhat is this measure, and why is this measure important? This indicator
represents the persistence of students from freshman to sophomore year and
provides insights into students’ progress through the postsecondary education
system. This measure is important in ensuring that students are on track to
complete an associate or bachelor’s degree in a timely manner.
Retention rates are calculated by aggregating, by sector and/or state, the
institution-level adjusted entering cohorts and the number of students from
these cohorts that enroll the following fall. Estimates therefore can be
interpreted as a percentage of students in the given sector and/or state.
Given that students enter college with a variety of objectives (e.g., work and
study versus solely study) and that institutions have varying missions, we have
presented a variety of sectors for both full- and part-time students. This provides
a more nuanced picture of retention across the nation’s institutions — one that
is sometimes lost in favor of presenting a single statistic.
What are the policy issues associated with this measure? Persistence indicators are one of the tools used to better understand the nature
of educational progress and the challenges faced by institutions or a state as
a whole for increasing educational attainment. In the words of Amy Guidera
from the Data Quality Campaign, “We need to use data as a fl ashlight, not
a hammer.”68 The appropriate context (e.g., institutional mission) should be
taken into account when considering whether persistence indicators such as
retention can or should be used as accountability measures. These data are
aggregated across institutions in order to provide a weighted average for states
and the nation. Larger institutions thus have more of an impact on state results.
Policymakers should consider the range of institutional outcomes that contribute
to overall state fi gures when developing strategies to improve retention.
Institutions should make every effort to learn from students who are not
retained (e.g., through exit surveys) in order to develop policies that result in
the best outcomes for the students and for the institutions. Administrators and
faculty should examine the ways in which they can improve the transition of
new students from the fi rst day of orientation to sophomore year.
68. Guidera, Amy. (2010, June). Speech presented in conjunction with Education Week’s “Diplomas Count” press
conference at the National Press Club, Washington, DC.
60.0% As of 2008, 60.0 percent of full-time freshmen at public two-year colleges return for the sophomore year.
1.0ppts 2007–2008
69.0% As of 2008, 69.0 percent of full-time freshmen at private for-profi t two-year colleges return for the sophomore year.
4.1ppts 2007–2008
completionagenda.collegeboard.org223

Where are we now? As of 2008, 60.0 percent of full-time, fi rst-time degree-
or certifi cate-seeking freshmen at public two-year colleges are retained from
freshman to sophomore year (Figure 9.1a). Part-time students account for
approximately four of every 10 freshmen in this sector, and only 40.1 percent
of these part-time students return for sophomore year (Figure 9.1b). When
disaggregated by state, the full-time freshman-to-sophomore retention rate at
public two-year colleges ranges from 47.7 percent in Louisiana to 68.6 percent
in California (Figure 9.1c). When placed in rank order, the states with the highest
retention rates for this sector are California, North Dakota, South Dakota,
Florida and New York. The states with the lowest retention rates are Louisiana,
Montana, Alaska, West Virginia and Oklahoma.
As of 2008, 78.2 percent of full-time, fi rst-time degree-seeking freshmen at
public four-year colleges are retained from freshman to sophomore year (Figure
9.1a). Part-time students account for a small proportion (roughly 5 percent) of
the overall freshmen enrollment in this sector, and 47.7 percent of these part-
time students who enter in the fall return for sophomore year (Figure 9.1b).
When disaggregated by state, the full-time freshman-to-sophomore retention
rate at public four-year colleges ranges from 39.5 percent in the District
of Columbia to 86.1 percent in Virginia (Figure 9.1d). When placed in rank
order, the states with the highest retention rates for this sector are Virginia,
Delaware, New Jersey, California and New Hampshire. The states with the
lowest retention rates are District of Columbia, Idaho, Oklahoma, Arkansas
and Montana.
As of 2008, 79.1 percent of full-time, fi rst-time degree-seeking freshmen at
private not-for-profi t four-year colleges are retained from freshman to sophomore
year (Figure 9.1a). As in the public four-year sector, part-time students account
for only a few percentage points of the fi rst-year enrollment, and 43.6 percent
of these part-time students who enter in fall return for sophomore year (Figure
9.1b). When disaggregated by state, the full-time freshman-to-sophomore
retention rate at private not-for-profi t four-year colleges ranges from 57.2 percent
in Delaware to 87.3 percent in the District of Columbia (Figure 9.1e). When
placed in rank order, the states with the highest retention rates for this sector
are District of Columbia, California, Massachusetts, Minnesota and Connecticut.
The states with the lowest retention rates are Delaware, Nevada, Michigan,
Kansas and Hawaii.
Despite gains between 2007 and 2008, the full-time freshman-to-sophomore
retention rate is lowest among private for-profi t four-year colleges, where just
under half of freshmen return for sophomore year (Figure 9.1a). Part-time
students make up roughly one-quarter of fi rst-time, degree–seeking freshmen
in this sector, and 43.2 percent of these part-time students who enter in fall
return for sophomore year (Figure 9.1b).
78.2% As of 2008, 78.2 percent of full-time freshmen at public four-year colleges return for the sophomore year.
2007–2008
79.1% As of 2008, 79.1 percent of full-time freshmen at private not-for-profi t four-year colleges return for the sophomore year.
2007–2008
completionagenda.collegeboard.org Recommendation Nine 224

When interpreting this measure, what should be kept in mind? Retention is
based solely on continuing within the institution in which one originally enrolled.
Students who successfully transfer to other institutions count against the
original institution but do not impact the receiving institution.
Caution is warranted when interpreting the estimates related to for-profi t and
private not-for-profi t sectors in this indicator. The number of for-profi t institutions
grew signifi cantly between fall 2007 and fall 2008 and the underlying enrollment
changed as well. This results in less stable estimates for this sector. Also, there
are very few private not-for-profi t two-year institutions, which also leads to
unstable estimates.
Finally, as indicated above, the proportion of fi rst-time students who are
enrolled part-time versus full-time varied substantially by sector. For example,
part-time students account for a much larger portion of the student enrollment
at public two-year colleges compared to public four-year colleges. This should
be considered when examining the part- and full-time retention rates for
these sectors.
The estimates contained in this report should not be compared against
estimates based on the 2003–2006 surveys. Retention rates were collected
on the 2003–2006 IPEDS enrollment surveys, but institutions were calculating
and reporting retention rates based on different student groups (e.g., full-
time students versus all students; original versus adjusted cohort). This led to
changes in the 2007 survey, whereby institutions now report the raw numbers
for clearly defi ned cohorts. IPEDS then calculates the rates for institutions
based on these raw numbers.
completionagenda.collegeboard.org225
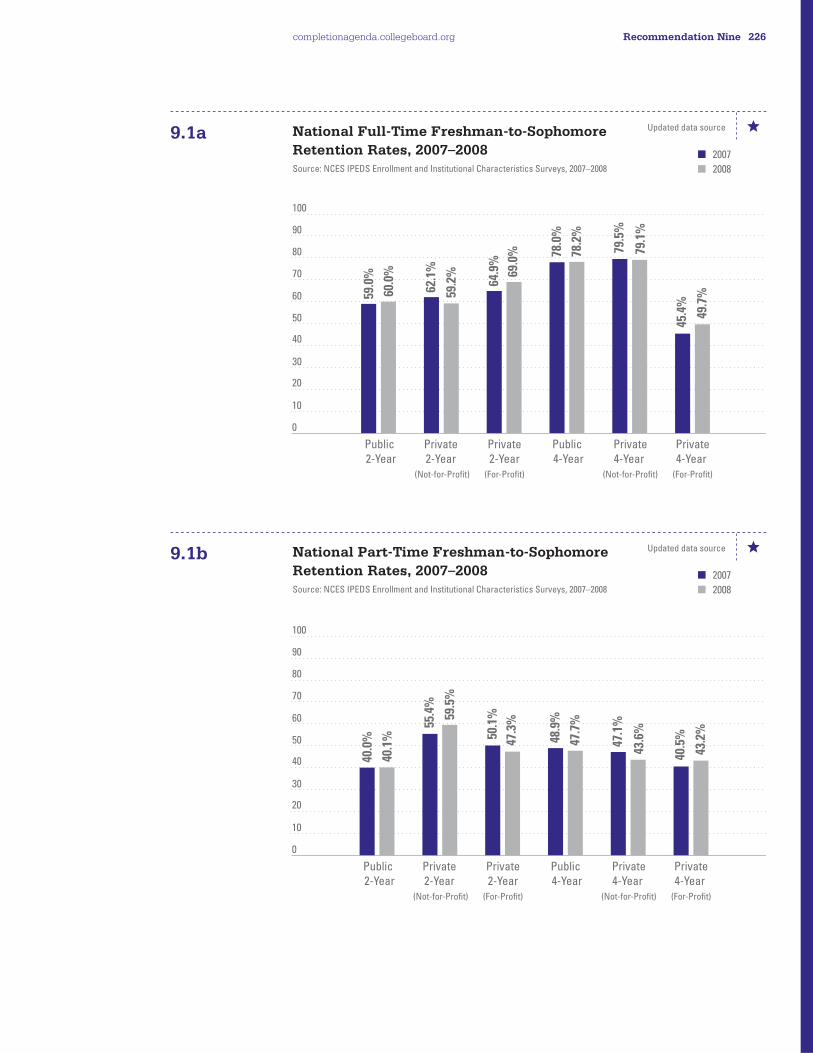
National Full-Time Freshman-to-Sophomore Retention Rates, 2007–2008Source: NCES IPEDS Enrollment and Institutional Characteristics Surveys, 2007–2008
National Part-Time Freshman-to-Sophomore Retention Rates, 2007–2008Source: NCES IPEDS Enrollment and Institutional Characteristics Surveys, 2007–2008
9.1a
9.1b
0
10
20
30
40
50
60
70
80
90
100
Public 2-Year
Public 4-Year
Private 2-Year
(Not-for-Profit)
Private2-Year
(For-Profit)
Private4-Year
(Not-for-Profit)
Private4-Year
(For-Profit)
59.0
%
60.0
%
62.1
%
59.2
%
64.9
%
69.0
% 78.0
%
78.2
%
79.5
%
79.1
%
45.4
%
49.7
%
0
10
20
30
40
50
60
70
80
90
100
Public 2-Year
Public 4-Year
Private 2-Year
(Not-for-Profit)
Private2-Year
(For-Profit)
Private4-Year
(Not-for-Profit)
Private4-Year
(For-Profit)
40.0
%
40.1
%
55.4
%
59.5
%
50.1
%
47.3
%
48.9
%
47.7
%
47.1
%
43.6
%
40.5
%
43.2
%
2007
2008
2007
2008
Updated data source
Updated data source
completionagenda.collegeboard.org Recommendation Nine 226
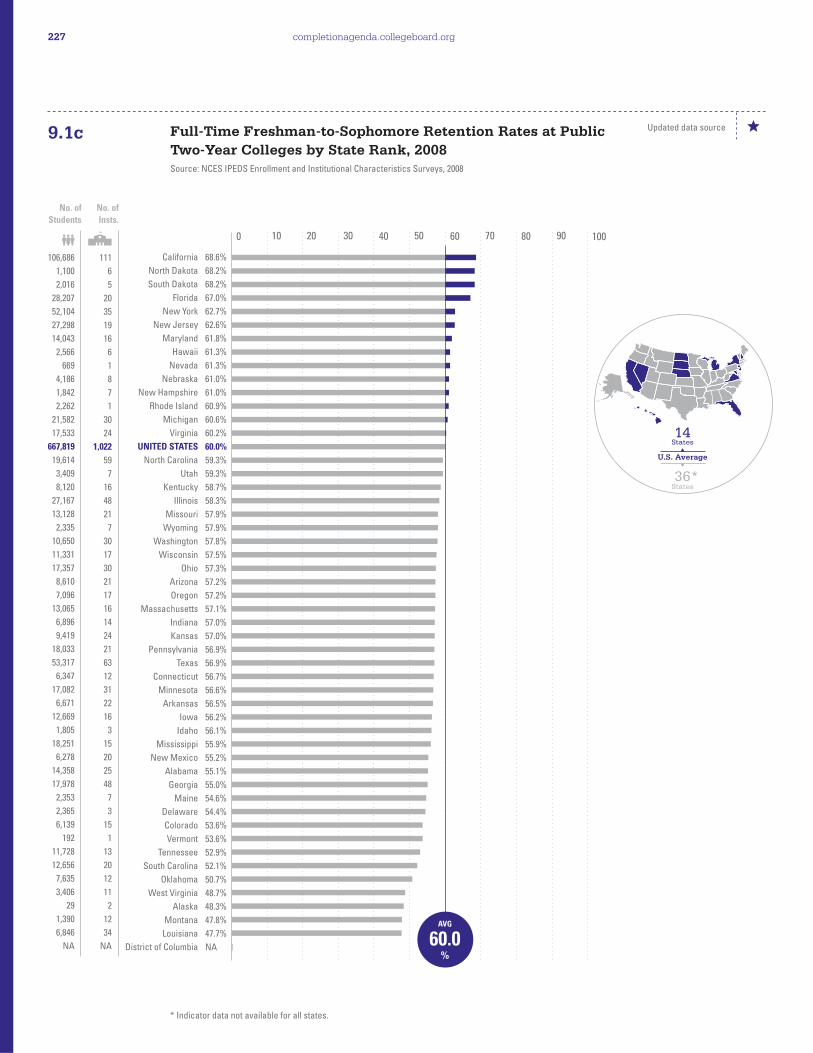
Full-Time Freshman-to-Sophomore Retention Rates at Public Two-Year Colleges by State Rank, 2008Source: NCES IPEDS Enrollment and Institutional Characteristics Surveys, 2008
9.1c
* Indicator data not available for all states.
0 10 20 30 40 50 60 70 80 90 100
California
North Dakota
South Dakota
Florida
New York
New Jersey
Maryland
Hawaii
Nevada
Nebraska
New Hampshire
Rhode Island
Michigan
Virginia
UNITED STATES
North Carolina
Utah
Kentucky
Illinois
Missouri
Wyoming
Washington
Wisconsin
Ohio
Arizona
Oregon
Massachusetts
Indiana
Kansas
Pennsylvania
Texas
Connecticut
Minnesota
Arkansas
Iowa
Idaho
Mississippi
New Mexico
Alabama
Georgia
Maine
Delaware
Colorado
Vermont
Tennessee
South Carolina
Oklahoma
West Virginia
Alaska
Montana
Louisiana
District of Columbia
68.6%
68.2%
68.2%
67.0%
62.7%
62.6%
61.8%
61.3%
61.3%
61.0%
61.0%
60.9%
60.6%
60.2%
60.0%
59.3%
59.3%
58.7%
58.3%
57.9%
57.9%
57.8%
57.5%
57.3%
57.2%
57.2%
57.1%
57.0%
57.0%
56.9%
56.9%
56.7%
56.6%
56.5%
56.2%
56.1%
55.9%
55.2%
55.1%
55.0%
54.6%
54.4%
53.6%
53.6%
52.9%
52.1%
50.7%
48.7%
48.3%
47.8%
47.7%
NA
111
6
5
20
35
19
16
6
1
8
7
1
30
24
1,022
59
7
16
48
21
7
30
17
30
21
17
16
14
24
21
63
12
31
22
16
3
15
20
25
48
7
3
15
1
13
20
12
11
2
12
34
NA
No. ofStudents
No. ofInsts.
106,686
1,100
2,016
28,207
52,104
27,298
14,043
2,566
669
4,186
1,842
2,262
21,582
17,533
667,819
19,614
3,409
8,120
27,167
13,128
2,335
10,650
11,331
17,357
8,610
7,096
13,065
6,896
9,419
18,033
53,317
6,347
17,082
6,671
12,669
1,805
18,251
6,278
14,358
17,978
2,353
2,365
6,139
192
11,728
12,656
7,635
3,406
29
1,390
6,846
NA
14
U.S. Average
36*
States
States
AVG
60.0%
Updated data source
completionagenda.collegeboard.org227
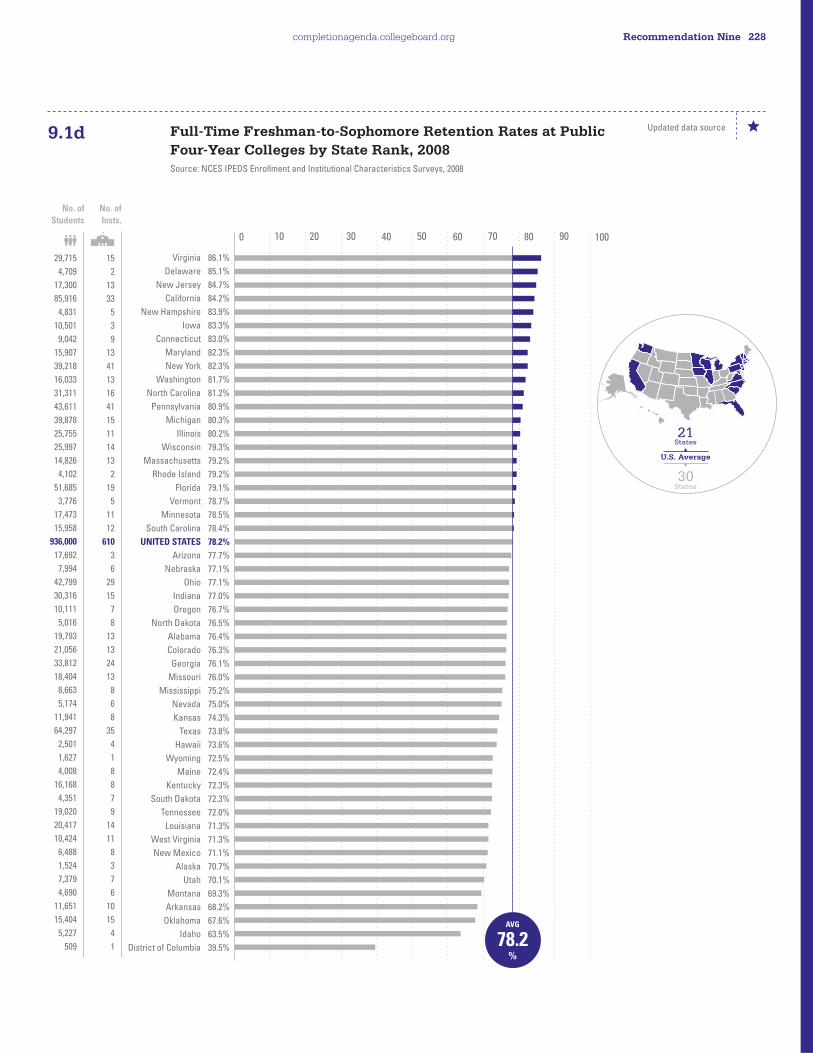
Full-Time Freshman-to-Sophomore Retention Rates at Public Four-Year Colleges by State Rank, 2008Source: NCES IPEDS Enrollment and Institutional Characteristics Surveys, 2008
9.1d
0 10 20 30 40 50 60 70 80 90 100
Virginia
Delaware
New Jersey
California
New Hampshire
Iowa
Connecticut
Maryland
New York
Washington
North Carolina
Pennsylvania
Michigan
Illinois
Wisconsin
Massachusetts
Rhode Island
Florida
Vermont
Minnesota
South Carolina
UNITED STATES
Arizona
Nebraska
Ohio
Indiana
Oregon
North Dakota
Alabama
Colorado
Georgia
Missouri
Mississippi
Nevada
Kansas
Texas
Hawaii
Wyoming
Maine
Kentucky
South Dakota
Tennessee
Louisiana
West Virginia
New Mexico
Alaska
Utah
Montana
Arkansas
Oklahoma
Idaho
District of Columbia
86.1%
85.1%
84.7%
84.2%
83.9%
83.3%
83.0%
82.3%
82.3%
81.7%
81.2%
80.9%
80.3%
80.2%
79.3%
79.2%
79.2%
79.1%
78.7%
78.5%
78.4%
78.2%
77.7%
77.1%
77.1%
77.0%
76.7%
76.5%
76.4%
76.3%
76.1%
76.0%
75.2%
75.0%
74.3%
73.8%
73.6%
72.5%
72.4%
72.3%
72.3%
72.0%
71.3%
71.3%
71.1%
70.7%
70.1%
69.3%
68.2%
67.6%
63.5%
39.5%
15
2
13
33
5
3
9
13
41
13
16
41
15
11
14
13
2
19
5
11
12
610
3
6
29
15
7
8
13
13
24
13
8
6
8
35
4
1
8
8
7
9
14
11
8
3
7
6
10
15
4
1
No. ofStudents
No. ofInsts.
29,715
4,709
17,300
85,916
4,831
10,501
9,042
15,907
39,218
16,033
31,311
43,611
39,878
25,755
25,997
14,826
4,102
51,685
3,776
17,473
15,958
936,000
17,692
7,994
42,799
30,316
10,111
5,016
19,793
21,056
33,812
18,404
8,663
5,174
11,941
64,297
2,501
1,627
4,008
16,168
4,351
19,020
20,417
10,424
6,488
1,524
7,379
4,690
11,651
15,404
5,227
509
21
U.S. Average
30
States
States
AVG
78.2%
Updated data source
completionagenda.collegeboard.org Recommendation Nine 228

Full-Time Freshman-to-Sophomore Retention Rates at Private Not-for-Profi t Four-Year Colleges by State Rank, 2008Source: NCES IPEDS Enrollment and Institutional Characteristics Surveys, 2008
9.1e
0 10 20 30 40 50 60 70 80 90 100
District of Columbia
California
Massachusetts
Minnesota
Connecticut
Washington
Pennsylvania
Colorado
Maryland
Rhode Island
New York
Maine
New Jersey
Indiana
Wisconsin
New Hampshire
Oregon
Vermont
UNITED STATES
Alaska
Ohio
Utah
Illinois
South Dakota
Louisiana
Arizona
Iowa
North Dakota
Tennessee
Missouri
New Mexico
North Carolina
Texas
Nebraska
Georgia
Montana
Florida
Virginia
Arkansas
Idaho
Oklahoma
Kentucky
South Carolina
Alabama
Mississippi
West Virginia
Hawaii
Kansas
Michigan
Nevada
Delaware
Wyoming
87.3%
85.8%
85.4%
84.7%
84.6%
84.2%
83.5%
83.2%
83.1%
82.8%
82.4%
81.3%
81.3%
81.0%
80.0%
79.8%
79.4%
79.2%
79.1%
78.6%
77.7%
77.6%
77.4%
77.2%
76.9%
76.3%
76.1%
76.1%
76.1%
75.4%
75.4%
75.3%
75.3%
74.9%
74.8%
73.8%
72.4%
72.0%
70.9%
70.9%
70.8%
70.1%
68.8%
68.5%
67.2%
66.8%
66.7%
66.7%
63.9%
63.4%
57.2%
NA
9
82
64
26
15
16
83
9
19
8
135
11
22
35
23
11
19
13
1,242
1
59
3
52
6
9
5
32
4
38
37
4
43
43
17
29
4
50
29
12
4
13
22
21
17
10
9
3
20
41
1
4
NA
No. ofStudents
No. ofInsts.
7,763
23,966
36,680
9,956
8,927
5,827
40,592
2,817
5,869
8,362
63,053
3,427
8,522
14,025
8,343
3,948
4,195
2,879
468,714
42
21,453
4,906
24,980
1,076
3,268
586
8,600
787
11,150
10,707
362
15,566
17,546
3,268
9,601
724
15,115
11,846
3,273
1,789
3,341
5,458
7,344
4,781
1,916
1,889
1,102
2,468
13,657
71
891
NA
18
U.S. Average
32*
States
States
AVG
79.1%
* Indicator data not available for all states.
Updated data source
completionagenda.collegeboard.org229
Graduation Rates of Associate Degree– and Certifi cate-Seeking StudentsWhat is this measure, and why is this measure important? This measure
builds upon the retention indicator to provide a more complete picture of the
educational progress of college students in the United States. The majority
of data in this indicator refl ect the proportion of fi rst-time, full-time associate
degree- or certifi cate-seeking students who graduate within 150 percent of
normal program length (i.e., three years). In addition, four-year graduation rates
(200 percent of normal program length) are available for the fi rst time and
are included in this indicator. Graduation rates are calculated by aggregating,
across institutions in a given state and/or sector, the institution-level adjusted
entering cohorts and the number of students from these cohorts who graduate
within the appropriate time frame. Estimates therefore can be interpreted as a
percentage of students in the given sector and/or state.
The measure is central to the commission’s goal because of the role that
two-year colleges play in the higher education system. This role may become
increasingly important because of the changing demographics described in the
introduction to this section and the economic challenges faced by a growing
number of Americans.
The data are disaggregated by state, race/ethnicity and institutional control
(i.e., public, private not-for-profi t, private for-profi t) to help states understand
the differential outcomes across groups and to illustrate the state’s overall
graduation rate as a function of the varying performance of students in
different types of institutions.
What are the policy issues associated with this measure? Addressing
socioeconomic, racial and ethnic inequalities in higher education requires
persistent and meaningful efforts by states to provide postsecondary access
and opportunity to the steadily growing numbers of undereducated and
underrepresented minorities. Beyond the moral imperative to achieve equity
among populations of different racial and ethnic backgrounds, there are
economic reasons for doing so.
Policymakers should consider both the challenges and opportunities facing
two-year colleges in light of current economic conditions. Many adults are
returning to the educational pipeline in order to build skills and increase future
job opportunities. At the same time, budget cuts threaten funding in this
vital sector.
27.5% As of 2008, 27.5 percent of full-time degree- or certifi cate-seeking students at two-year colleges graduate in three years or less.
2007–2008
22.6% As of 2008, 22.6 percent of full-time African American degree- or certifi cate-seeking students at two-year colleges graduate in three years or less.
3.8ppts 2007–2008
completionagenda.collegeboard.org Recommendation Nine 230
Graduation rates have been a part of the higher education landscape since
Congress passed the Student Right-to-Know Act in 1990. They are the primary
national, standardized measure of postsecondary outcomes. However,
policymakers should consider the signifi cance and meaning of high or low
graduation rates. The appropriate context should be taken into account when
considering whether persistence indicators such as graduation rates can or
should be used as accountability measures. Institutions vary in their missions,
as well as in the composition of entering students — factors that should be
recognized when interpreting estimates, particularly at the institutional level.
Institutions that aim to educate low-income, fi rst-generation, traditionally
underserved students will face substantially different enrollment, retention
and graduation challenges compared to institutions that attract most of
their students from the top of the nation’s high school graduating classes.
Policymakers should seek to understand the benefi ts and limitations of
graduation rates in order to better serve all constituents.
Where are we now? As of 2008, 27.5 percent of fi rst-time, full-time associate
degree- or certifi cate-seeking students in the nation’s two-year colleges
graduate within three years (Figure 9.2a). This estimate dropped slightly from
a high of 30.5 percent in 2003. Graduation rates vary by sector, such that 20.6
percent of these students in public two-year colleges graduate within three
years, compared to 48.3 percent and 57.7 percent at private not-for-profi t and
for-profi t two-year colleges, respectively. Public institutions account for nearly
four out of fi ve fi rst-time, full-time students at two-year colleges and thus shape
states’ overall estimates.
Three-year graduation rates of fi rst-time, full-time students at two-year colleges
vary by race/ethnicity and sector (Figures 9.2b, 9.2g–9.2k). Asian students have
the highest three-year graduation rate (31.5 percent), followed by white students
(28.5 percent), Hispanic students (25.7 percent), American Indian students (24.9
percent), and African American students (22.6 percent). When disaggregated
by state, the three-year graduation rate at two-year colleges ranges from 9.0
percent in Delaware to 60.0 percent in Wyoming (Figure 9.2c). Private for-profi t
institutions greatly infl uence overall three-year graduation rates in states such as
Arizona, Colorado, Idaho, Indiana, Louisiana, Nevada, Pennsylvania, Tennessee
and Wyoming (Figure 9.2f).
When comparing three-year graduation rates against four-year graduation rates,
it is clear that the additional year affords a substantial number of students
the opportunity to complete their degrees. For example, while 27.8 percent
of fi rst-time, full-time associate degree- or certifi cate-seeking students who
entered in fall 2004 graduate within three years (Figure 9.2a), 34.1 percent of
these students graduate within four years (Figure 9.2l). When disaggregated
by state, the four-year graduation rate ranges from 18.0 percent in Delaware to
74.1 percent in South Dakota (Figure 9.2m).
24.9% As of 2008, 24.9 percent of full-time American Indian or Alaska Native degree- or certifi cate-seeking students at two-year colleges graduate in three years or less.
3.7ppts 2007–2008
25.7% As of 2008, 25.7 percent of full-time Hispanic degree- or certifi cate-seeking students at two-year colleges graduate in three years or less.
7.6ppts 2007–2008
completionagenda.collegeboard.org231
When interpreting this measure, what should be kept in mind? Because of the manner in which data are collected in the IPEDS graduation
survey, researchers are unable to separate associate degree–seeking students
from certifi cate-seeking students. One concern is that the normal time to
completion varies across certifi cate programs, whereas it is more standardized
for associate programs. Given the emphasis of the commission goal on
obtaining an associate degree or higher, data would ideally be presented for
associate degree–seeking students only. This presents a challenge for using this
indicator to examine issues related to degree attainment among students at
two-year colleges.
The limitations of these graduation rates deserve consideration. For example,
as was the case with the previous indicator, graduation rates are based solely
on degree completion within the institution in which one enrolled as a full-time,
fi rst-time student. In addition, they do not refl ect part-time students, students
who begin college in terms other than fall, or incoming transfer students who
go on to successfully complete a degree. In fact, successful transfer students
count against the original institution’s graduation rate (which also infl uences
estimates at the state level) and do nothing to benefi t the receiving institution.
Many policymakers and researchers have called for reforms to standardize the
way that transfer rates are measured and reported by states and institutions.
Because of the lack of the standardization of transfer rates, this indicator
is not yet available to help contextualize the nation’s success in increasing
completion rates.
It is also important to consider that graduation rates are associated with many
other factors not directly addressed in these data (e.g., fi rst-generation status,
academic preparation, socioeconomic background, adjustment to college, etc.).
In addition, many students take longer than the traditional two-to-three year
window to graduate, including students who begin as full-time students but
spend most of their experience attending part time and students who must
work while attending college. The inclusion of four-year graduation rates in this
year’s report is meant to address some of these limitations and provide a more
complete picture of degree completion.
Recent changes in the rules regarding maintenance, collection, and reporting of
federal data on race and ethnicity should be considered when interpreting data
in this indicator. Institutions must now collect these data using a two-question
format, in which the fi rst assesses whether the individual is Hispanic/Latino
(ethnicity), and the second evaluates whether the respondent is one or more
of the following races: American Indian or Alaska Native, Asian, black or African
American, Native Hawaiian or Other Pacifi c Islander, or white. In addition, Asian
and Native Hawaiian or Other Pacifi c Islander was separated into two categories
and a reporting category “two or more races” was introduced.
34.1% As of 2008, 34.1 percent of full-time, degree- or certifi cate-seeking students at two-year colleges graduate in four years or less.
completionagenda.collegeboard.org Recommendation Nine 232
In the most recent graduation survey, institutions had the option to report under
old or new race/ethnicity categories. IPEDS then derived a total, where the new
category overlapped with the old. The data contained in this indicator refl ect
these derived categories. It is possible that the addition of “two or more races”
in the new system changed how institutions reported students, which raises
questions about the ability to compare estimates from the 2008 survey to those
from previous or future years (when institutions will have fully transitioned to
the new system).
Finally, some estimates are based on a very small number of students,
particularly when disaggregated by state by sector by ethnicity. Readers are
advised to consider the number of institutions behind various estimates as
well as the number of students who underlie these estimates. In some cases,
institutional responses are altered by NCES to protect the privacy of students.
Thus, the publicly available survey data may not refl ect the exact value reported
by institutions. The impact of this likely varies across fi gures within this indicator.
For example, there is likely a greater impact on American Indian or Alaska
Native estimates than there is for white students, since a greater number of
institutional responses regarding American Indian or Alaska Natives may have
been altered by NCES. Similarly, estimates based on the cumulative responses
of many small colleges may be impacted more than those based on the
cumulative responses of larger colleges.
completionagenda.collegeboard.org233

National Three-Year Graduation Rates of Degree- and Certifi cate-Seeking Students at Two-Year Colleges, 2002–2008Source: NCES IPEDS Graduation and Institutional Characteristics Surveys, 2002–2008
9.2a
0
10
20
30
40
50
60
70
80
90
100
2002 2003 2004 2005 2006 2007 2008
23.6%
45.7%
22.9%
50.1%54.9%
49.3% 49.2%44.5%
48.3%
22.9% 21.9% 21.5% 20.3% 20.6%
29.4% 30.5% 30.0% 29.3% 29.1% 27.8% 27.5%
62.5%59.1% 58.7% 57.1% 57.3% 58.3% 57.7%
Total, 2-Year
Private, 2-Year (Not-for-Profi t)
Private, 2-Year (For-Profi t)
Public, 2-Year
National Three-Year Graduation Rates of Degree- and Certifi cate-Seeking Students at Two-Year Colleges by Race/Ethnicity, 2008Source: NCES IPEDS Graduation and Institutional Characteristics Surveys, 2008
9.2b
0
10
20
30
40
50
60
70
80
90
100
AmericanIndian
AsianAfricanAmerican
Hispanic White
15.1
%
18.3
%24.9
%
22.6
%
25.7
%
28.5
%
31.5
%
55.8
%
25.8
%
12.1
%
15.6
% 22.9
%
65.8
%
41.7
% 47.3
%
52.4
%
41.7
% 47.8
%
61.4
%
62.9
%
Total, 2-Year
Private, 2-Year (Not-for-Profi t)
Private, 2-Year (For-Profi t)
Public, 2-Year
Updated data source
Updated data source
completionagenda.collegeboard.org Recommendation Nine 234

Three-Year Graduation Rates of Degree- and Certifi cate-Seeking Students at Two-Year Colleges by State Rank, 2008Source: NCES IPEDS Graduation and Institutional Characteristics Surveys, 2008
9.2c
* Indicator data not available for all states.
0 10 20 30 40 50 60 70 80 90 100
60.0%
56.7%
40.7%
40.2%
39.9%
39.6%
39.3%
36.6%
35.1%
34.4%
34.0%
33.7%
33.6%
32.9%
32.3%
31.1%
30.9%
30.3%
29.7%
29.6%
29.0%
27.9%
27.5%
27.1%
27.0%
26.4%
26.4%
25.6%
25.5%
25.2%
25.1%
24.7%
24.5%
24.4%
22.2%
20.9%
20.9%
19.9%
19.2%
19.0%
18.6%
18.6%
18.4%
18.3%
18.2%
15.7%
14.9%
14.2%
14.1%
11.6%
9.0%
NA
Wyoming
South Dakota
Arizona
Colorado
Florida
Utah
Pennsylvania
Nevada
North Dakota
Idaho
Iowa
Missouri
Wisconsin
Nebraska
Kansas
California
Minnesota
Louisiana
Montana
Tennessee
Washington
Oklahoma
UNITED STATES
Indiana
New Hampshire
Georgia
Maine
Virginia
Kentucky
Ohio
Oregon
Mississippi
Illinois
Arkansas
New York
North Carolina
West Virginia
Alabama
Maryland
Hawaii
Alaska
Texas
Massachusetts
New Mexico
Vermont
New Jersey
Michigan
South Carolina
Rhode Island
Connecticut
Delaware
District of Columbia
8
6
34
34
61
11
105
6
7
4
18
44
21
10
31
188
38
46
13
33
34
21
1,636
30
9
60
10
42
29
92
21
18
64
23
77
63
21
28
19
7
2
101
24
20
2
21
32
26
2
16
4
NA
22
U.S. Average
28*
States
States
4,408
2,042
18,085
11,640
31,746
5,743
34,556
2,899
1,314
2,554
11,492
17,484
11,211
4,854
10,172
157,264
18,216
8,234
1,497
19,503
11,828
11,104
798,381
8,513
2,505
18,570
2,612
15,227
8,699
25,017
9,086
18,316
30,143
6,835
53,065
19,525
3,348
14,469
14,715
2,741
59
62,897
13,485
6,226
296
24,252
18,288
12,410
1,905
5,604
1,727
NA
No. ofStudents
No. ofInsts.
AVG
27.5%
Updated data source
completionagenda.collegeboard.org235

Three-Year Graduation Rates of Degree- and Certifi cate-Seeking Students at Public Two-Year Colleges by State Rank, 2008Source: NCES IPEDS Graduation and Institutional Characteristics Surveys, 2008
9.2d
* Indicator data not available for all states.
0 10 20 30 40 50 60 70 80 90 100
57.2%
38.9%
37.5%
33.6%
33.0%
32.9%
32.1%
32.0%
30.5%
29.5%
28.6%
27.7%
26.5%
24.2%
24.2%
23.2%
22.9%
22.6%
22.5%
22.1%
21.8%
20.6%
20.6%
19.9%
19.9%
19.5%
18.9%
18.6%
18.2%
17.0%
16.2%
15.7%
15.4%
15.1%
14.7%
14.7%
14.6%
14.6%
14.6%
14.3%
14.2%
13.4%
12.8%
11.5%
11.1%
11.1%
11.1%
10.3%
10.3%
10.3%
7.4%
NA
South Dakota
Utah
North Dakota
Iowa
Wisconsin
Florida
Wyoming
Nebraska
Montana
Kansas
Minnesota
Washington
Maine
California
Mississippi
Colorado
Georgia
Arkansas
Missouri
New Hampshire
Kentucky
Illinois
UNITED STATES
New York
North Carolina
Idaho
Arizona
Alaska
Alabama
Oklahoma
West Virginia
Massachusetts
Oregon
Louisiana
Michigan
Pennsylvania
New Jersey
Vermont
Virginia
Hawaii
New Mexico
Ohio
Maryland
South Carolina
Nevada
Tennessee
Texas
Connecticut
Indiana
Rhode Island
Delaware
District of Columbia
5
7
6
16
17
20
7
7
12
24
31
30
7
110
15
15
48
22
20
7
16
48
1,011
35
59
3
21
2
25
12
11
16
17
28
30
20
19
1
24
6
19
30
16
20
1
13
63
12
14
1
3
NA
22
U.S. Average
28*
States
States
2,016
5,315
1,174
11,404
10,780
22,951
2,112
4,582
1,410
9,260
16,836
11,421
2,252
128,274
17,965
6,076
16,140
6,222
12,108
2,109
7,725
26,977
647,059
46,819
18,550
1,823
8,930
59
13,749
8,151
2,927
12,331
6,872
4,618
18,008
16,249
23,584
246
11,303
2,336
5,815
17,391
12,432
11,475
594
11,517
52,529
5,353
4,951
1,702
1,636
NA
No. ofStudents
No. ofInsts.
AVG
20.6%
Updated data source
completionagenda.collegeboard.org Recommendation Nine 236
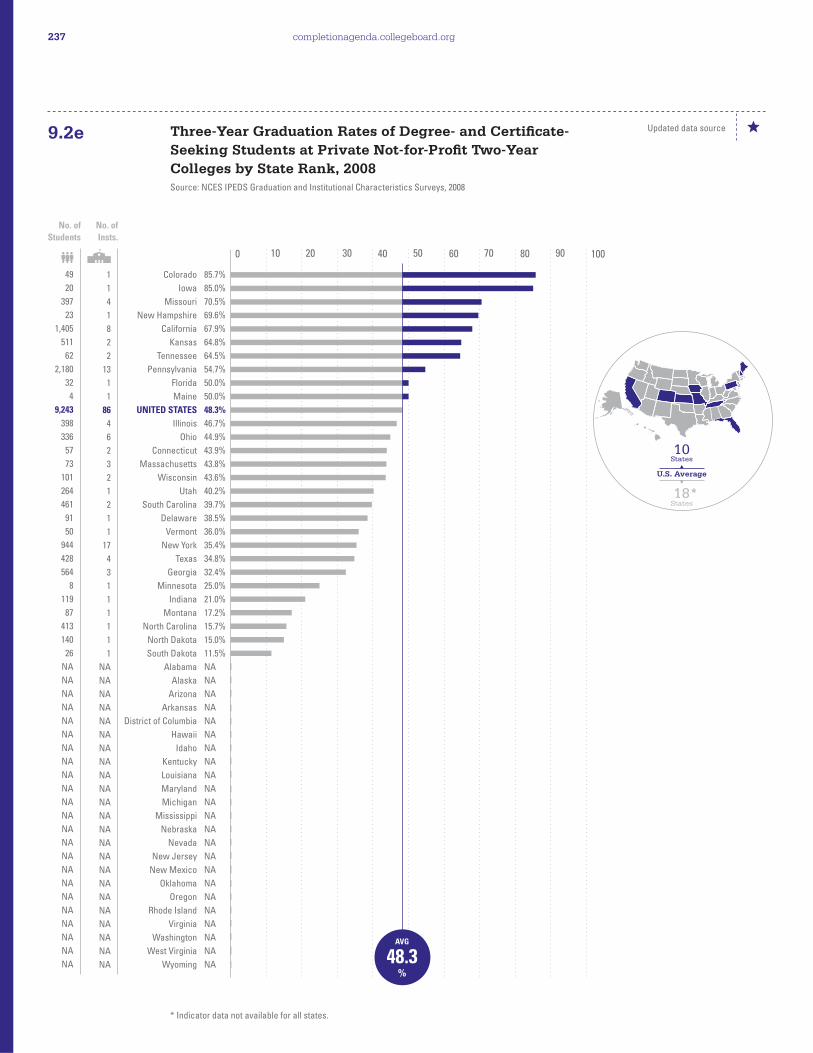
Three-Year Graduation Rates of Degree- and Certifi cate-Seeking Students at Private Not-for-Profi t Two-Year Colleges by State Rank, 2008Source: NCES IPEDS Graduation and Institutional Characteristics Surveys, 2008
9.2e
* Indicator data not available for all states.
0 10 20 30 40 50 60 70 80 90 100
85.7%
85.0%
70.5%
69.6%
67.9%
64.8%
64.5%
54.7%
50.0%
50.0%
48.3%
46.7%
44.9%
43.9%
43.8%
43.6%
40.2%
39.7%
38.5%
36.0%
35.4%
34.8%
32.4%
25.0%
21.0%
17.2%
15.7%
15.0%
11.5%
NA
NA
NA
NA
NA
NA
NA
NA
NA
NA
NA
NA
NA
NA
NA
NA
NA
NA
NA
NA
NA
NA
NA
Colorado
Iowa
Missouri
New Hampshire
California
Kansas
Tennessee
Pennsylvania
Florida
Maine
UNITED STATES
Illinois
Ohio
Connecticut
Massachusetts
Wisconsin
Utah
South Carolina
Delaware
Vermont
New York
Texas
Georgia
Minnesota
Indiana
Montana
North Carolina
North Dakota
South Dakota
Alabama
Alaska
Arizona
Arkansas
District of Columbia
Hawaii
Idaho
Kentucky
Louisiana
Maryland
Michigan
Mississippi
Nebraska
Nevada
New Jersey
New Mexico
Oklahoma
Oregon
Rhode Island
Virginia
Washington
West Virginia
Wyoming
1
1
4
1
8
2
2
13
1
1
86
4
6
2
3
2
1
2
1
1
17
4
3
1
1
1
1
1
1
NA
NA
NA
NA
NA
NA
NA
NA
NA
NA
NA
NA
NA
NA
NA
NA
NA
NA
NA
NA
NA
NA
NA
10
U.S. Average
18*
States
States
49
20
397
23
1,405
511
62
2,180
32
4
9,243
398
336
57
73
101
264
461
91
50
944
428
564
8
119
87
413
140
26
NA
NA
NA
NA
NA
NA
NA
NA
NA
NA
NA
NA
NA
NA
NA
NA
NA
NA
NA
NA
NA
NA
NA
No. ofStudents
No. ofInsts.
AVG
48.3%
Updated data source
completionagenda.collegeboard.org237

Three-Year Graduation Rates of Degree- and Certifi cate-Seeking Students at Private For-Profi t Two-Year Colleges by State Rank, 2008Source: NCES IPEDS Graduation and Institutional Characteristics Surveys, 2008
9.2f
* Indicator data not available for all states.
0 10 20 30 40 50 60 70 80 90 100
92.6%
85.5%
77.1%
71.4%
63.9%
62.1%
62.1%
61.4%
59.6%
59.2%
59.1%
58.5%
58.1%
58.1%
57.9%
57.7%
57.7%
57.5%
57.3%
56.7%
56.2%
55.2%
54.8%
54.6%
54.4%
54.2%
54.2%
53.8%
53.7%
52.6%
52.0%
51.6%
49.7%
49.3%
48.5%
48.1%
47.7%
46.3%
46.2%
43.2%
42.6%
40.0%
38.7%
30.0%
25.6%
NA
NA
NA
NA
NA
NA
NA
Iowa
Wyoming
New Mexico
Idaho
Washington
Arizona
Pennsylvania
California
Minnesota
Illinois
Utah
Colorado
Florida
Oklahoma
Missouri
North Carolina
UNITED STATES
Texas
Virginia
New Jersey
Tennessee
Oregon
Georgia
Kentucky
Kansas
Maryland
South Carolina
Alabama
West Virginia
Ohio
New Hampshire
Indiana
Louisiana
Nebraska
Wisconsin
Mississippi
Massachusetts
Rhode Island
Hawaii
Nevada
Arkansas
New York
Connecticut
Michigan
Maine
Alaska
Delaware
District of Columbia
Montana
North Dakota
South Dakota
Vermont
1
1
1
1
4
13
72
70
6
12
3
18
40
9
20
3
539
34
18
2
18
4
9
13
5
3
4
3
10
56
1
15
18
3
2
3
5
1
1
5
1
25
2
2
2
NA
NA
NA
NA
NA
NA
NA
16
U.S. Average
28*
States
States
68
2,296
411
731
407
9,155
16,127
27,585
1,372
2,768
164
5,515
8,763
2,953
4,979
562
142,079
9,940
3,924
668
7,924
2,214
1,866
974
401
2,283
474
720
421
7,290
373
3,443
3,616
272
330
351
1,081
203
405
2,305
613
5,302
194
280
356
NA
NA
NA
NA
NA
NA
NA
No. ofStudents
No. ofInsts.
AVG
57.7%
Updated data source
completionagenda.collegeboard.org Recommendation Nine 238

Three-Year Graduation Rates of Asian, Native Hawaiian and Other Pacifi c Islander Degree- and Certifi cate-Seeking Students at Two-Year Colleges by State Rank, 2008Source: NCES IPEDS Graduation and Institutional Characteristics Surveys, 2008
9.2g
* Indicator data not available for all states.
0 10 20 30 40 50 60 70 80 90 100
61.4%
46.9%
46.1%
43.0%
38.7%
36.3%
35.1%
35.1%
33.8%
33.3%
33.3%
33.3%
31.5%
31.3%
30.8%
30.3%
28.3%
28.2%
28.1%
27.4%
25.5%
25.3%
25.0%
25.0%
24.1%
23.5%
22.6%
22.6%
21.6%
21.1%
20.7%
20.6%
20.5%
20.0%
20.0%
20.0%
19.7%
19.7%
17.8%
16.7%
15.9%
14.9%
14.4%
14.3%
14.1%
12.9%
11.8%
7.8%
5.1%
0.0%
0.0%
NA
Wyoming
Arizona
Florida
Nevada
California
Colorado
Pennsylvania
Utah
Louisiana
Idaho
New Hampshire
Oklahoma
UNITED STATES
Missouri
Arkansas
Washington
Minnesota
Oregon
Nebraska
Wisconsin
Iowa
Mississippi
Alabama
Montana
Maine
Tennessee
Kentucky
Rhode Island
Ohio
West Virginia
New York
North Carolina
Georgia
Kansas
New Mexico
South Dakota
Hawaii
Virginia
Indiana
North Dakota
Massachusetts
Illinois
Texas
Michigan
Maryland
New Jersey
Connecticut
South Carolina
Delaware
Alaska
Vermont
District of Columbia
8
34
61
6
188
34
105
11
46
4
9
21
1,636
44
23
34
38
21
10
21
18
18
28
13
10
33
29
2
92
21
77
63
60
31
20
6
7
42
30
7
24
64
101
32
19
21
16
26
4
2
2
NA
12
U.S. Average
38*
States
States
57
420
765
235
21,924
300
609
148
77
27
27
189
40,114
179
65
683
756
387
64
274
137
91
120
12
29
200
62
53
199
19
2,294
316
555
170
90
15
1,904
851
45
6
517
1,060
1,641
265
596
1,339
152
141
39
5
5
NA
No. ofStudents
No. ofInsts.
AVG
31.5%
Updated data source
completionagenda.collegeboard.org239

Three-Year Graduation Rates of American Indian or Alaska Native Degree- and Certifi cate-Seeking Students at Two-Year Colleges by State Rank, 2008Source: NCES IPEDS Graduation and Institutional Characteristics Surveys, 2008
9.2h
* Indicator data not available for all states.
0 10 20 30 40 50 60 70 80 90 100
42.1%
39.2%
38.7%
37.4%
36.6%
33.6%
33.3%
29.6%
28.9%
27.3%
27.3%
26.9%
26.8%
26.0%
25.3%
25.2%
25.2%
24.9%
24.4%
23.4%
23.1%
22.9%
22.4%
21.7%
21.1%
18.9%
18.6%
18.6%
18.2%
17.8%
17.4%
17.2%
16.5%
16.1%
15.8%
15.4%
15.4%
14.8%
14.4%
14.3%
14.3%
13.0%
12.1%
11.4%
10.8%
7.2%
7.1%
6.7%
0.0%
0.0%
0.0%
NA
Nevada
Pennsylvania
Wyoming
Arizona
Mississippi
Colorado
Vermont
Florida
Idaho
Hawaii
Louisiana
California
New Mexico
Virginia
Utah
Kansas
Missouri
UNITED STATES
Oklahoma
Georgia
Massachusetts
Tennessee
Iowa
Alabama
Montana
North Dakota
Arkansas
Washington
Maine
Ohio
South Dakota
Illinois
North Carolina
Alaska
Oregon
Minnesota
Wisconsin
Texas
New York
Indiana
South Carolina
Kentucky
Nebraska
Michigan
New Jersey
Maryland
Rhode Island
Connecticut
Delaware
New Hampshire
West Virginia
District of Columbia
6
105
8
34
18
34
2
61
4
7
46
188
20
42
11
31
44
1,636
21
60
24
33
18
28
13
7
23
34
10
92
6
64
63
2
21
38
21
101
77
30
26
29
10
32
21
19
2
16
4
9
21
NA
17
U.S. Average
33*
States
States
57
102
111
1,620
101
149
3
142
38
11
55
1,480
1,168
73
166
127
115
10,824
1,409
64
78
70
85
161
280
244
70
145
44
107
115
99
327
31
209
409
253
324
277
21
70
23
33
175
65
69
14
15
5
5
10
NA
No. ofStudents
No. ofInsts.
AVG
24.9%
Updated data source
completionagenda.collegeboard.org Recommendation Nine 240

Three-Year Graduation Rates of African American Degree- and Certifi cate-Seeking Students at Two-Year Colleges by State Rank, 2008Source: NCES IPEDS Graduation and Institutional Characteristics Surveys, 2008
9.2i
* Indicator data not available for all states.
0 10 20 30 40 50 60 70 80 90 100
40.5%
36.1%
36.0%
35.5%
34.5%
31.3%
30.6%
30.5%
30.4%
30.1%
29.0%
26.2%
25.6%
25.2%
24.7%
23.9%
23.3%
23.2%
23.1%
22.7%
22.6%
21.5%
21.4%
21.4%
21.0%
20.7%
20.0%
19.0%
18.1%
17.5%
17.0%
16.9%
16.3%
16.0%
15.8%
14.7%
14.1%
13.5%
13.2%
13.0%
10.9%
10.8%
10.5%
7.8%
7.8%
6.7%
5.1%
3.4%
0.0%
0.0%
NA
NA
Pennsylvania
Colorado
Missouri
Florida
Arizona
Wyoming
Virginia
Tennessee
Louisiana
Nevada
North Dakota
Utah
Oklahoma
Indiana
Georgia
Ohio
Idaho
Wisconsin
Mississippi
Nebraska
UNITED STATES
Oregon
California
New Hampshire
Alabama
Washington
South Dakota
Illinois
Texas
Kansas
North Carolina
Maryland
Kentucky
Arkansas
Hawaii
New York
South Carolina
West Virginia
Iowa
New Mexico
Minnesota
Massachusetts
Maine
Michigan
New Jersey
Connecticut
Rhode Island
Delaware
Montana
Vermont
Alaska
District of Columbia
105
34
44
61
34
8
42
33
46
6
7
11
21
30
60
92
4
21
18
10
1,636
21
188
9
28
34
6
64
101
31
63
19
29
23
7
77
26
21
18
20
38
24
10
32
21
16
2
4
13
2
2
NA
20
U.S. Average
29*
States
States
6,491
822
2,786
6,985
1,041
48
4,363
5,710
3,931
432
31
65
1,474
1,366
7,074
5,010
30
487
7,485
198
125,407
293
14,064
28
4,355
498
5
5,372
9,450
1,051
4,842
3,621
674
1,527
38
8,547
4,085
304
585
192
1,350
1,226
57
2,284
3,864
806
118
328
10
4
0
NA
No. ofStudents
No. ofInsts.
AVG
22.6%
Updated data source
completionagenda.collegeboard.org241

Three-Year Graduation Rates of Hispanic Degree- and Certifi cate-Seeking Students at Two-Year Colleges by State Rank, 2008Source: NCES IPEDS Graduation and Institutional Characteristics Surveys, 2008
9.2j
* Indicator data not available for all states.
0 10 20 30 40 50 60 70 80 90 100
57.1%
40.1%
39.6%
39.6%
38.1%
36.2%
35.3%
33.2%
32.6%
31.5%
31.4%
31.4%
30.0%
29.9%
29.7%
28.1%
27.3%
26.3%
25.7%
25.2%
25.0%
24.1%
23.4%
23.1%
23.0%
23.0%
22.7%
22.5%
22.2%
20.1%
19.6%
19.6%
19.5%
19.5%
18.3%
17.4%
15.9%
15.9%
15.7%
15.6%
15.2%
14.9%
14.8%
14.6%
14.1%
13.3%
10.6%
9.9%
9.1%
8.8%
0.0%
NA
Wyoming
Florida
Arizona
Colorado
Nevada
Pennsylvania
Missouri
Utah
Tennessee
Louisiana
Arkansas
New Hampshire
Maine
Kansas
Georgia
Idaho
California
Montana
UNITED STATES
Oklahoma
South Dakota
Virginia
Illinois
North Dakota
Iowa
Texas
North Carolina
Wisconsin
Vermont
Minnesota
Oregon
Washington
Nebraska
Ohio
Alabama
Indiana
New Mexico
New York
Maryland
Mississippi
Rhode Island
Kentucky
South Carolina
Hawaii
Massachusetts
West Virginia
Michigan
Delaware
Connecticut
New Jersey
Alaska
District of Columbia
8
61
34
34
6
105
44
11
33
46
23
9
10
31
60
4
188
13
1,636
21
6
42
64
7
18
101
63
21
2
38
21
34
10
92
28
30
20
77
19
18
2
29
26
7
24
21
32
4
16
21
2
NA
18
U.S. Average
32*
States
States
310
5,287
5,340
2,032
543
1,589
416
349
340
108
159
51
30
629
572
185
45,622
19
110,080
484
16
870
3,297
13
335
19,673
599
280
9
363
561
817
231
657
169
207
2,468
7,562
574
128
198
101
203
48
1,450
30
517
81
839
3,717
2
NA
No. ofStudents
No. ofInsts.
AVG
25.7%
Updated data source
completionagenda.collegeboard.org Recommendation Nine 242

Three-Year Graduation Rates of White Degree- and Certifi cate-Seeking Students at Two-Year Colleges by State Rank, 2008Source: NCES IPEDS Graduation and Institutional Characteristics Surveys, 2008
9.2k
* Indicator data not available for all states.
0 10 20 30 40 50 60 70 80 90 100
61.5%
60.0%
41.1%
40.7%
40.6%
40.3%
39.5%
39.4%
38.8%
36.4%
35.4%
34.5%
34.5%
33.9%
33.8%
33.6%
32.5%
32.2%
31.6%
30.0%
29.5%
29.2%
29.1%
28.7%
28.5%
28.1%
27.8%
27.3%
27.0%
26.8%
26.5%
26.3%
26.2%
26.0%
25.8%
23.0%
23.0%
21.8%
20.2%
20.2%
19.6%
19.2%
18.1%
17.1%
16.9%
16.5%
15.7%
14.6%
14.5%
13.1%
10.4%
NA
Wyoming
South Dakota
Arizona
Colorado
Florida
Pennsylvania
North Dakota
Utah
Idaho
Iowa
Nevada
Nebraska
Wisconsin
Kansas
Missouri
Minnesota
Montana
California
Alaska
Louisiana
Washington
Oklahoma
New Hampshire
Tennessee
UNITED STATES
Indiana
Georgia
Maine
Kentucky
Arkansas
Illinois
Oregon
Ohio
New York
Mississippi
North Carolina
Virginia
West Virginia
Massachusetts
New Jersey
Alabama
Vermont
Hawaii
Maryland
New Mexico
Michigan
Texas
Rhode Island
South Carolina
Connecticut
Delaware
District of Columbia
8
6
34
34
61
105
7
11
4
18
6
10
21
31
44
38
13
188
2
46
34
21
9
33
1,636
30
60
10
29
23
64
21
92
77
18
63
42
21
24
21
28
2
7
19
20
32
101
2
26
16
4
NA
24
U.S. Average
26*
States
States
3,826
1,851
7,780
7,147
16,215
23,504
999
4,168
1,827
9,570
1,398
4,218
9,650
7,360
13,197
14,478
1,097
54,162
19
3,991
8,083
7,377
1,933
12,409
454,591
6,527
9,902
2,229
6,995
4,958
19,761
6,857
18,308
30,179
9,944
12,838
8,764
2,947
9,186
12,680
9,432
229
282
7,594
1,959
13,647
29,653
1,377
7,536
3,418
1,130
NA
No. ofStudents
No. ofInsts.
AVG
28.5%
Updated data source
completionagenda.collegeboard.org243
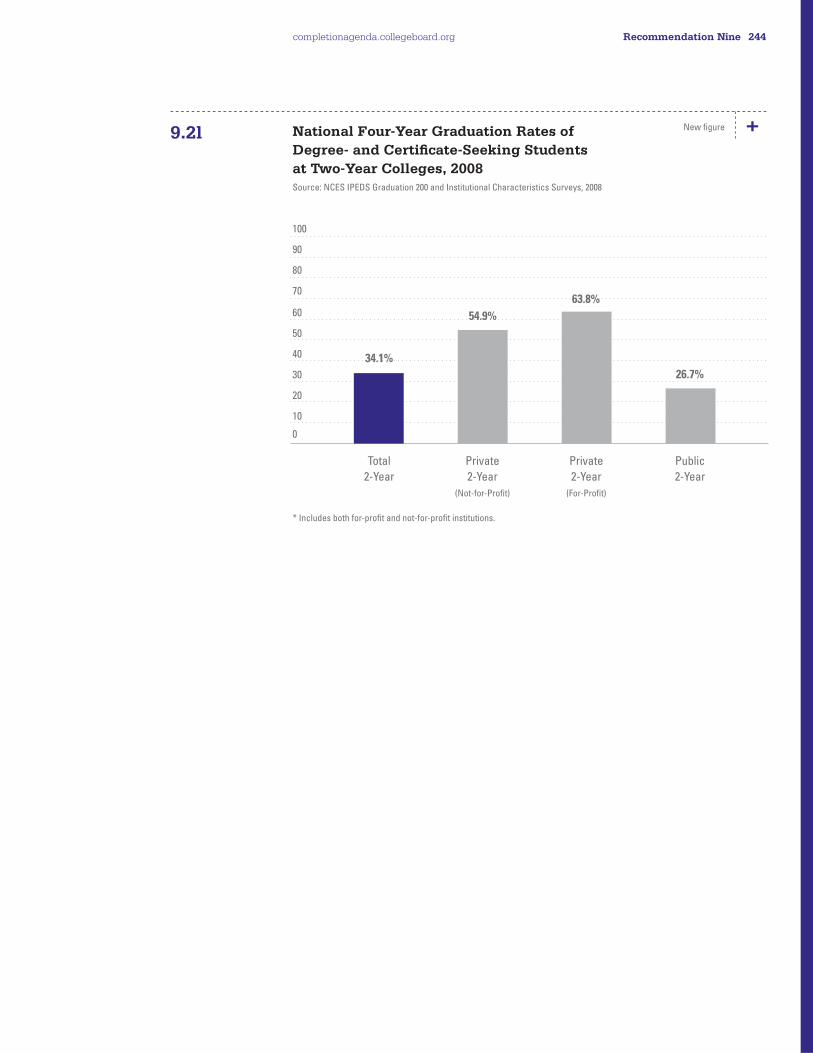
National Four-Year Graduation Rates of Degree- and Certifi cate-Seeking Students at Two-Year Colleges, 2008Source: NCES IPEDS Graduation 200 and Institutional Characteristics Surveys, 2008
* Includes both for-profi t and not-for-profi t institutions.
9.2l
0
10
20
30
40
50
60
70
80
90
100
Total2-Year
Public2-Year
Private2-Year
(Not-for-Profit)
Private2-Year
(For-Profit)
54.9%
63.8%
26.7%
34.1%
completionagenda.collegeboard.org Recommendation Nine 244
New fi gure

Four-Year Graduation Rates of Degree- and Certifi cate-Seeking Students at Two-Year Colleges by State Rank, 2008Source: NCES IPEDS Graduation 200 and Institutional Characteristics Surveys, 2008
9.2m
* Indicator data not available for all states.
0 10 20 30 40 50 60 70 80 90 100
74.1%
64.0%
53.8%
51.0%
48.5%
48.5%
48.3%
44.8%
44.7%
43.8%
41.3%
41.2%
40.6%
39.9%
39.8%
39.4%
38.6%
38.5%
37.5%
37.2%
35.7%
35.1%
34.8%
34.6%
34.6%
34.1%
34.0%
33.6%
32.8%
32.4%
31.7%
31.6%
31.5%
30.6%
29.4%
29.3%
28.3%
28.1%
25.6%
25.5%
25.2%
25.2%
23.6%
22.3%
21.3%
20.3%
20.3%
20.1%
19.6%
18.1%
18.0%
NA
South Dakota
Wyoming
Nevada
Arizona
Iowa
Utah
Alaska
Pennsylvania
Florida
Idaho
Colorado
Kansas
North Dakota
Nebraska
California
New Hampshire
Wisconsin
Oregon
Washington
Missouri
Arkansas
Maine
West Virginia
Oklahoma
Tennessee
UNITED STATES
Georgia
Virginia
Minnesota
Indiana
Ohio
New York
Montana
North Carolina
Louisiana
Illinois
Alabama
Kentucky
Massachusetts
Mississippi
Maryland
Texas
New Mexico
Michigan
Connecticut
Hawaii
Vermont
South Carolina
New Jersey
Rhode Island
Delaware
District of Columbia
6
8
6
34
18
8
2
105
53
4
34
31
7
12
181
9
20
21
34
43
23
10
19
19
31
1,614
60
41
37
28
89
78
13
63
51
64
29
28
25
19
19
101
21
32
16
7
2
26
21
2
4
NA
25
U.S. Average
25*
States
States
AVG
34.1%
1,853
4,989
2,264
21,162
11,721
4,278
29
34,254
30,480
3,092
12,958
10,674
1,250
5,250
114,423
2,516
10,758
9,607
11,555
16,762
6,748
2,415
3,409
10,515
17,892
768,298
19,116
17,226
21,361
7,863
26,374
54,408
1,472
19,321
11,297
31,224
14,446
8,114
12,980
17,726
14,482
66,806
6,243
18,089
5,753
2,631
231
12,481
24,182
1,969
1,649
NA
No. ofStudents
No. ofInsts.
completionagenda.collegeboard.org245
New fi gure
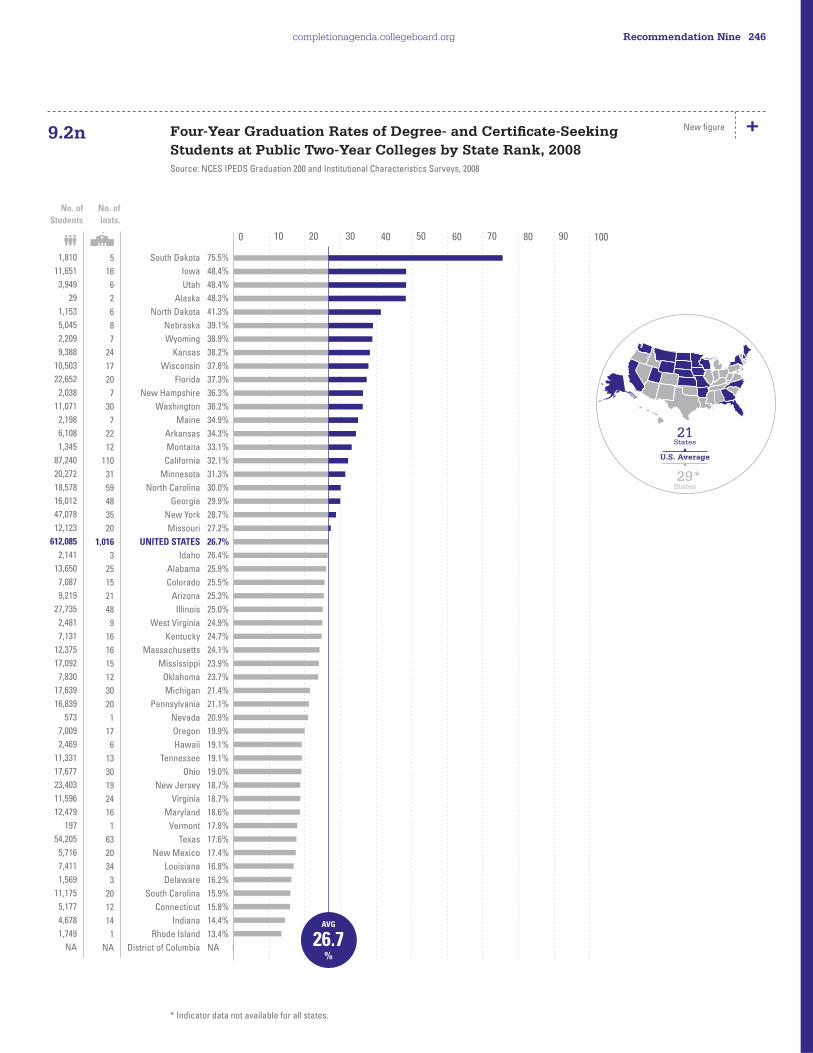
Four-Year Graduation Rates of Degree- and Certifi cate-Seeking Students at Public Two-Year Colleges by State Rank, 2008Source: NCES IPEDS Graduation 200 and Institutional Characteristics Surveys, 2008
9.2n
* Indicator data not available for all states.
0 10 20 30 40 50 60 70 80 90 100
75.5%
48.4%
48.4%
48.3%
41.3%
39.1%
38.9%
38.2%
37.8%
37.3%
36.3%
36.2%
34.9%
34.3%
33.1%
32.1%
31.3%
30.0%
29.9%
28.7%
27.2%
26.7%
26.4%
25.9%
25.5%
25.3%
25.0%
24.9%
24.7%
24.1%
23.9%
23.7%
21.4%
21.1%
20.9%
19.9%
19.1%
19.1%
19.0%
18.7%
18.7%
18.6%
17.8%
17.6%
17.4%
16.8%
16.2%
15.9%
15.8%
14.4%
13.4%
NA
South Dakota
Iowa
Utah
Alaska
North Dakota
Nebraska
Wyoming
Kansas
Wisconsin
Florida
New Hampshire
Washington
Maine
Arkansas
Montana
California
Minnesota
North Carolina
Georgia
New York
Missouri
UNITED STATES
Idaho
Alabama
Colorado
Arizona
Illinois
West Virginia
Kentucky
Massachusetts
Mississippi
Oklahoma
Michigan
Pennsylvania
Nevada
Oregon
Hawaii
Tennessee
Ohio
New Jersey
Virginia
Maryland
Vermont
Texas
New Mexico
Louisiana
Delaware
South Carolina
Connecticut
Indiana
Rhode Island
District of Columbia
5
16
6
2
6
8
7
24
17
20
7
30
7
22
12
110
31
59
48
35
20
1,016
3
25
15
21
48
9
16
16
15
12
30
20
1
17
6
13
30
19
24
16
1
63
20
34
3
20
12
14
1
NA
21
U.S. Average
29*
States
States
AVG
26.7%
1,810
11,651
3,949
29
1,153
5,045
2,209
9,388
10,503
22,652
2,038
11,071
2,198
6,108
1,345
87,240
20,272
18,578
16,012
47,078
12,123
612,085
2,141
13,650
7,087
9,219
27,735
2,481
7,131
12,375
17,092
7,830
17,639
16,839
573
7,009
2,469
11,331
17,677
23,403
11,596
12,479
197
54,205
5,716
7,411
1,569
11,175
5,177
4,678
1,749
NA
No. ofStudents
No. ofInsts.
completionagenda.collegeboard.org Recommendation Nine 246
New fi gure

Four-Year Graduation Rates of Degree- and Certifi cate-Seeking Students at Private Not-for-Profi t Two-Year Colleges by State Rank, 2008Source: NCES IPEDS Graduation 200 and Institutional Characteristics Surveys, 2008
9.2o
* Indicator data not available for all states.
0 10 20 30 40 50 60 70 80 90 100
100.0%
100.0%
100.0%
88.0%
72.2%
71.6%
71.4%
66.1%
64.1%
63.2%
60.8%
60.5%
59.0%
57.6%
54.9%
53.4%
52.5%
50.2%
43.7%
42.3%
40.6%
36.6%
35.3%
35.2%
32.0%
25.3%
18.8%
16.3%
15.0%
7.7%
NA
NA
NA
NA
NA
NA
NA
NA
NA
NA
NA
NA
NA
NA
NA
NA
NA
NA
NA
NA
NA
NA
Colorado
Maine
Minnesota
Missouri
Kansas
California
New Hampshire
Florida
Tennessee
Iowa
Pennsylvania
Connecticut
Wisconsin
Illinois
UNITED STATES
Massachusetts
Delaware
Utah
Texas
Georgia
New York
Ohio
Vermont
South Carolina
North Dakota
Indiana
North Carolina
South Dakota
Montana
Nebraska
Alabama
Alaska
Arizona
Arkansas
District of Columbia
Hawaii
Idaho
Kentucky
Louisiana
Maryland
Michigan
Mississippi
Nevada
New Jersey
New Mexico
Oklahoma
Oregon
Rhode Island
Virginia
Washington
West Virginia
Wyoming
1
1
1
4
2
8
1
1
2
1
13
2
2
4
89
4
1
1
4
3
18
6
1
2
1
1
1
1
1
1
NA
NA
NA
NA
NA
NA
NA
NA
NA
NA
NA
NA
NA
NA
NA
NA
NA
NA
NA
NA
NA
NA
14
U.S. Average
15*
States
States
AVG
54.9%
10
2
1
416
889
1,604
14
56
64
19
1,793
81
156
675
9,889
103
80
255
355
568
1,083
350
34
488
97
170
330
43
127
26
NA
NA
NA
NA
NA
NA
NA
NA
NA
NA
NA
NA
NA
NA
NA
NA
NA
NA
NA
NA
NA
NA
No. ofStudents
No. ofInsts.
completionagenda.collegeboard.org247
New fi gure

Four-Year Graduation Rates of Degree- and Certifi cate-Seeking Students at Private For-Profi t Two-Year Colleges by State Rank, 2008Source: NCES IPEDS Graduation 200 and Institutional Characteristics Surveys, 2008
9.2p
* Indicator data not available for all states.
0 10 20 30 40 50 60 70 80 90 100
99.0%
90.9%
88.6%
83.8%
83.0%
71.9%
70.9%
70.3%
69.2%
68.5%
68.0%
66.8%
66.7%
66.2%
66.1%
66.0%
65.9%
65.3%
65.2%
65.0%
64.2%
64.1%
63.8%
61.3%
61.3%
61.1%
60.8%
60.3%
59.7%
58.3%
58.2%
58.2%
58.0%
56.2%
55.9%
53.4%
52.1%
51.9%
51.8%
50.0%
48.8%
46.7%
45.1%
38.9%
36.3%
NA
NA
NA
NA
NA
NA
NA
Wisconsin
New Mexico
Oregon
Wyoming
Idaho
Connecticut
Arizona
Mississippi
Alabama
Pennsylvania
South Carolina
North Carolina
Iowa
Oklahoma
Florida
Maryland
Nebraska
Washington
Illinois
Nevada
Virginia
California
UNITED STATES
Tennessee
West Virginia
Missouri
Indiana
Colorado
Minnesota
Ohio
Michigan
Texas
Georgia
Massachusetts
Rhode Island
Louisiana
Kentucky
New Hampshire
New York
Utah
Arkansas
New Jersey
Kansas
Hawaii
Maine
Alaska
Delaware
District of Columbia
Montana
North Dakota
South Dakota
Vermont
1
1
4
1
1
2
13
4
4
72
4
3
1
7
32
3
3
4
12
5
17
63
509
16
10
19
13
18
5
53
2
34
9
5
1
17
12
1
25
1
1
2
5
1
2
NA
NA
NA
NA
NA
NA
NA
22
U.S. Average
22*
States
States
AVG
63.8%
99
527
2,598
2,780
951
495
11,943
634
796
15,622
818
413
51
2,685
7,772
2,003
179
484
2,814
1,691
5,630
25,579
146,324
6,497
928
4,223
3,015
5,861
1,088
8,347
450
12,246
2,536
502
220
3,886
983
464
6,247
74
640
779
397
162
215
NA
NA
NA
NA
NA
NA
NA
No. ofStudents
No. ofInsts.
completionagenda.collegeboard.org Recommendation Nine 248
New fi gure

Graduation Rates of Bachelor’s Degree–Seeking StudentsWhat is this measure, and why is this measure important? This measure
provides a more complete picture of the educational progress of American
college students. The majority of data in this indicator refl ect the proportion of
fi rst-time, full-time bachelor’s degree–seeking students who graduate within
150 percent of normal program length (i.e., six years). In addition, eight-year
graduation rates (200 percent of normal program length) are available for the
fi rst time and are included in this indicator. Graduation rates are calculated by
aggregating, across institutions in a given state and/or sector, the institution-
level adjusted entering cohorts and the number of students from these cohorts
who graduate within the appropriate time frame. Estimates therefore can be
interpreted as a percentage of students in the given sector and/or state.
Traditional graduation rates refl ect persistence and degree attainment within the
institution in which one originally enrolls. One criticism of this approach is that
this does not account for transfer students who go on to earn a degree from
an institution other than the one fi rst attended. Recent data from the Beginning
Postsecondary Student (BPS) longitudinal study are included in this indicator in
order to address this limitation.
The data are disaggregated by state, race/ethnicity and source of institutional
control (i.e., public, private not-for-profi t, private for-profi t) to help states
understand the differential outcomes across groups and to illustrate how the
state’s overall graduation rate is a function of the varying performance of these
students in different types of institutions.
What are the policy issues associated with this measure? National and state
policymakers are highly attuned to the graduation rate discussion. Individuals, as
well as states, invest money in higher education with the expectation of degree
completion — a credential that can improve the economic well-being of both
the student and the state as a whole. The consequences of failing to complete
a degree are of great concern, especially when one considers the growth in
average student loan debt and student loan default rates in recent years (see
Recommendation Seven for more details).
Graduation rates have been a part of the higher education landscape since
Congress passed the Student Right-to-Know Act in 1990. They are the primary
national, standardized measure of postsecondary outcomes. However,
policymakers should consider the signifi cance and meaning of high or low
graduation rates. The appropriate context should be taken into account when
considering whether persistence indicators such as graduation rates can or
should be used as accountability measures. Institutions vary in their mission
as well as the composition of entering students, factors which should be
recognized when interpreting estimates, particularly at the institution level.
Institutions that aim to educate low-income, fi rst-generation, traditionally
57.7% As of 2008, 57.7 percent of full-time bachelor’s degree–seeking students at four-year colleges graduate in six years or less.
2007–2008
38.5% As of 2008, 38.5 percent of American Indian or Alaska Native full-time bachelor’s degree–seeking students at four-year colleges graduate in six years or less.
2007–2008
completionagenda.collegeboard.org249

underserved students will face substantially different enrollment, retention
and graduation challenges compared to institutions that attract most of
their students from the top of the nation’s high school graduating classes.
Policymakers should seek to understand the benefi ts and limitations of
graduation rates in order to better serve all constituents.
As discussed in the previous indicator, substantial persistent gaps exist
between the graduation rates of Asian and white students and the graduation
rates of students in other racial/ethnic groups. There is a tremendous amount
of research being done to understand the factors that contribute to these
differential outcomes. A complete discussion of this research is beyond the
scope of this publication.
Where are we now? As of 2008, 57.7 percent of fi rst-time, full-time bachelor’s
degree–seeking students in the nation’s four-year colleges graduate within six
years (Figure 9.3a). This estimate increased slightly from a low of 55.5 percent
in 2002. Graduation rates vary by sector, such that 55.3 percent of bachelor’s
degree–seeking students in public four-year colleges graduate within six years,
compared to 65.1 percent and 23.5 percent at private not-for-profi t and for-
profi t four-year colleges, respectively. Public institutions account for just under
two-thirds of fi rst-time, full-time students at four-year colleges. Private not-
for-profi t institutions constitute approximately one-third of enrollment, while
private for-profi t institutions refl ect only 2 to 3 percent of four-year college
freshmen enrollment.
Six-year graduation rates of fi rst-time, full-time students at four-year colleges
vary by race/ethnicity and sector (Figure 9.3b). Asian students at four-year
colleges have the highest six-year graduation rate (67.5 percent), followed
by white students (60.7 percent), Hispanic students (49.4 percent), African
American students (40.5 percent) and American Indian students (38.5 percent).
Six-year graduation rates are highest in the private not-for-profi t sector, a fi nding
which is consistent across racial/ethnic groups.
Similar fi ndings emerge from the Beginning Postsecondary Student (BPS)
longitudinal survey data (Figure 9.3c), such that just over half (50.5 percent) of
students who enter a four-year college graduate within six years. Graduation
rates are substantially higher among public and private not-for-profi t institutions
compared to private for-profi t colleges. BPS data also provide insight into
the impact of transferring across institutions. Six-year graduation rates are
somewhat higher when taking into account whether the student graduates
from any institution (58.0 percent), as opposed to just looking at the original
institution (50.5 percent) in which the student is enrolled (Figure 9.3c).
When disaggregated by state, the six-year graduation rate at four-year colleges
ranges from 25.5 percent in Alaska to 73.2 percent in the District of Columbia
(Figure 9.3d). States such as Connecticut, District of Columbia, Indiana, Maine,
Massachusetts, Minnesota, New York, Ohio, Pennsylvania, Rhode Island,
Tennessee, Utah and Vermont are impacted largely, and positively, by the private
40.5% As of 2008, 40.5 percent of African American full-time bachelor’s degree–seeking students at four-year colleges graduate in six years or less.
2007–2008
49.4% As of 2008, 49.4 percent of Hispanic full-time bachelor’s degree–seeking students at four-year colleges graduate in six years or less.
2.6ppts 2007–2008
completionagenda.collegeboard.org Recommendation Nine 250
not-for-profi t sector (Figure 9.3f). Private for-profi t institutions account for over
four of every 10 fi rst-time, full-time students in Arizona, thus the overall six-year
graduation rate in this state is infl uenced greatly by this sector (Figure 9.3g).
Graduation rates also vary by race/ethnicity and sector (Figures 9.3h–9.3l).
When six-year graduation rates are compared against eight-year graduation
rates, it is clear that the additional time affords a number of students the
opportunity to complete their degrees. For example, while 57.7 percent of
fi rst-time, full-time degree–seeking students who entered in fall 2000 earn a
bachelor’s degree in six years (Figure 9.3a), 60.6 percent of this same cohort
graduate within eight years (Figure 9.3m). When disaggregated by state, the
eight-year graduation rate ranges from 30.6 percent in Alaska to 75.4 percent
in the District of Columbia (Figure 9.3n).
When interpreting this measure, what should be kept in mind? The limitations of these graduation rates deserve consideration. For example, as
was the case with the previous indicator, graduation rates are based solely on
degree completion within the institution in which one enrolls as a full-time, fi rst-
time student. In addition, they do not refl ect part-time students, students who
begin college in terms other than the fall term, or incoming transfer students
who go on to successfully complete a degree. In fact, successful transfer
students count against the original institution’s graduation rate (which also
infl uences estimates at the state level) and do nothing to benefi t the receiving
institution. Many policymakers and researchers have called for reforms to
standardize the way that transfer rates are measured and reported by states and
institutions. Because of the lack of the standardization of transfer rates, these
data are not yet available to help contextualize the nation’s success in increasing
completion rates.
It is also important to consider that graduation rates are associated with many
other factors not directly addressed in these data (e.g., fi rst-generation status
academic preparation, socioeconomic background, adjustment to college,
etc.). In addition, many students take longer than the traditional four- to six-
year window to graduate, including students who begin as full-time students
but spend most of their undergraduate experience attending part time and
students who work while attending college. The inclusion of BPS estimates and
eight-year graduation rates in this report is meant to address some of these
limitations and provide a more complete picture of degree completion.
Recent changes in the rules regarding maintenance, collection, and reporting of
federal data on race and ethnicity should be considered when interpreting data
in this indicator. Institutions must now collect these data using a two-question
format in which the fi rst assesses whether the individual is Hispanic/Latino
(ethnicity) and the second evaluates whether the respondent is one or more of
the following races: American Indian or Alaska Native, Asian, black or African
American, Native Hawaiian or Other Pacifi c Islander, or white. In addition,
Asian and Native Hawaiian or Other Pacifi c Islander were separated into two
categories and a reporting category “two or more races” was introduced.
60.6% As of 2008, 60.6 percent of full-time bachelor’s degree–seeking students at four-year colleges graduate in eight years or less.
completionagenda.collegeboard.org251

In the most recent graduation survey, institutions had the option to report under
old or new race/ethnicity categories. IPEDS then derived a total, where the new
category overlapped with the old. The data contained in this indicator refl ect
these derived categories. It is possible that the addition of “two or more races”
in the new system changes how institutions report students, which raises
questions about the ability to compare estimates from the 2008 survey to those
from previous or future years (when institutions will have fully transitioned to
the new system).
Finally, some estimates are based on a very small number of students,
particularly when disaggregated by state by sector by ethnicity. Readers are
advised to consider the number of institutions behind various estimates as
well as the number of students that underlie these estimates. In some cases,
institutional responses are altered by NCES to protect the privacy of students.
Thus, the publicly available survey data may not refl ect the exact value reported
by institutions. The impact of this likely varies across fi gures within this indicator.
For example, there is likely a greater impact on American Indian or Alaska
Native estimates than there is for white students, since a greater number of
institutional responses regarding American Indian or Alaska Natives may have
been altered by NCES. Similarly, estimates based on the cumulative responses
of many small colleges may be impacted more than those based on the
cumulative responses of larger colleges.
National Six-Year Graduation Rates of Bachelor’s Degree–Seeking Students, 2002–2008Source: NCES IPEDS Graduation and Institutional Characteristics Surveys, 2008
9.3a
0
10
20
30
40
50
60
70
80
90
100
2002 2003 2004 2005 2006 2007 2008
52.8%
63.4%
51.7%
64.0% 63.9% 64.5% 64.7% 64.5% 65.1%
53.2% 54.1% 54.8% 55.1% 55.3%
29.4%25.1% 25.4%
29.5%34.9%
26.3%23.5%
55.5% 56.4% 56.4% 57.2% 57.7% 57.5% 57.7%
Total, 4-Year
Private, 4-Year (Not-for-Profi t)
Private, 4-Year (For-Profi t)
Public, 4-Year
completionagenda.collegeboard.org Recommendation Nine 252
New fi gure

National Six-Year Graduation Rates of Bachelor’s Degree–Seeking Students by Race/Ethnicity, 2008Source: NCES IPEDS Graduation and Institutional Characteristics Surveys, 2008
9.3b
0
10
20
30
40
50
60
70
80
90
100
American Indian
AsianAfricanAmerican
Hispanic White
50.0
%
35.8
%
75.8
%
45.5
%
59.7
% 67.7
%
64.9
%
39.6
% 46.9
%
57.9
%
17.6
%
38.0
%
17.2
%
28.5
%
26.4
%
38.5
%
67.5
%
40.5
% 49.4
%
60.7
%
Total, 4-Year
Private, 4-Year (Not-for-Profi t)
Private, 4-Year (For-Profi t)
Public, 4-Year
Six-Year Bachelor’s Degree Attainment Rates of Students Beginning at Four-Year Colleges,2003–2004Source: NCES, Persistence and Attainment of 2003–04 Beginning Postsecondary Students: After 6 Years, 2010
9.3c
0
10
20
30
40
50
60
70
80
90
100
Total4-Year
Public4-Year
Private4-Year
(Not-for-Profit)
Private4-Year
(For-Profit)
50.5%
58.0%51.5%
59.5%57.0%64.6%
13.3% 15.7%
First Institution
Any Institution
New fi gure
Updated data source
completionagenda.collegeboard.org253
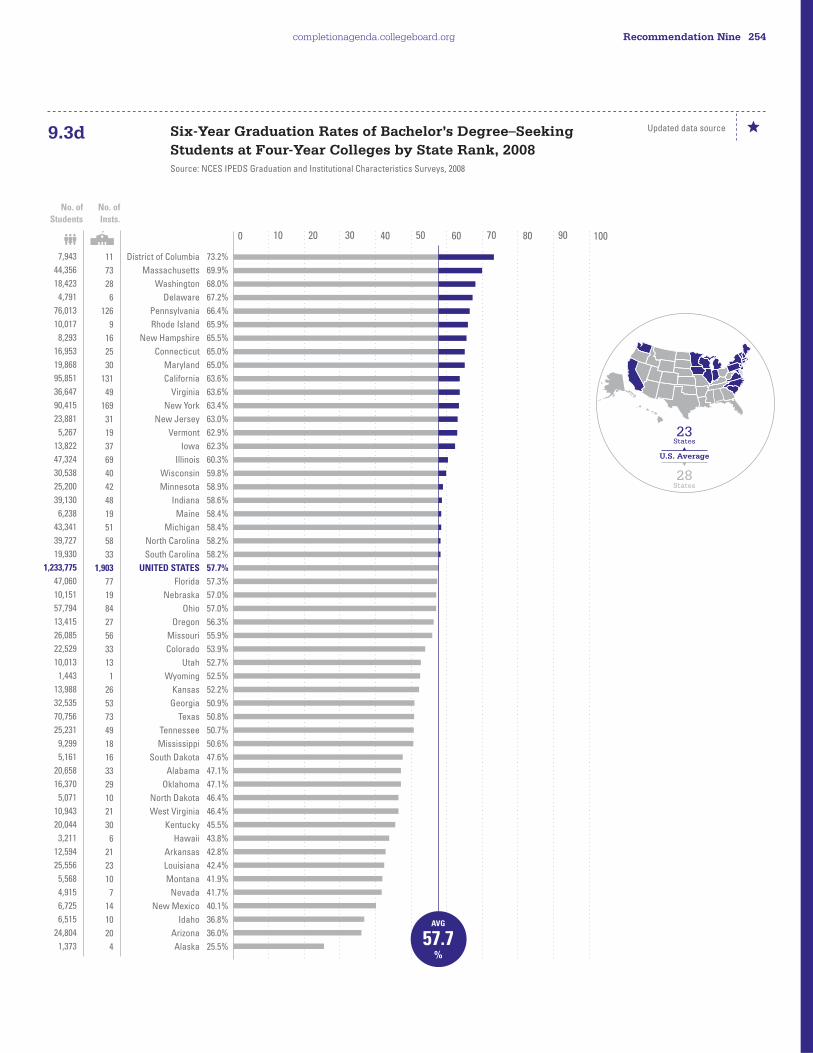
Six-Year Graduation Rates of Bachelor’s Degree–Seeking Students at Four-Year Colleges by State Rank, 2008Source: NCES IPEDS Graduation and Institutional Characteristics Surveys, 2008
9.3d
0 10 20 30 40 50 60 70 80 90 100
73.2%
69.9%
68.0%
67.2%
66.4%
65.9%
65.5%
65.0%
65.0%
63.6%
63.6%
63.4%
63.0%
62.9%
62.3%
60.3%
59.8%
58.9%
58.6%
58.4%
58.4%
58.2%
58.2%
57.7%
57.3%
57.0%
57.0%
56.3%
55.9%
53.9%
52.7%
52.5%
52.2%
50.9%
50.8%
50.7%
50.6%
47.6%
47.1%
47.1%
46.4%
46.4%
45.5%
43.8%
42.8%
42.4%
41.9%
41.7%
40.1%
36.8%
36.0%
25.5%
District of Columbia
Massachusetts
Washington
Delaware
Pennsylvania
Rhode Island
New Hampshire
Connecticut
Maryland
California
Virginia
New York
New Jersey
Vermont
Iowa
Illinois
Wisconsin
Minnesota
Indiana
Maine
Michigan
North Carolina
South Carolina
UNITED STATES
Florida
Nebraska
Ohio
Oregon
Missouri
Colorado
Utah
Wyoming
Kansas
Georgia
Texas
Tennessee
Mississippi
South Dakota
Alabama
Oklahoma
North Dakota
West Virginia
Kentucky
Hawaii
Arkansas
Louisiana
Montana
Nevada
New Mexico
Idaho
Arizona
Alaska
11
73
28
6
126
9
16
25
30
131
49
169
31
19
37
69
40
42
48
19
51
58
33
1,903
77
19
84
27
56
33
13
1
26
53
73
49
18
16
33
29
10
21
30
6
21
23
10
7
14
10
20
4
No. ofStudents
No. ofInsts.
23
U.S. Average
28
States
States
7,943
44,356
18,423
4,791
76,013
10,017
8,293
16,953
19,868
95,851
36,647
90,415
23,881
5,267
13,822
47,324
30,538
25,200
39,130
6,238
43,341
39,727
19,930
1,233,775
47,060
10,151
57,794
13,415
26,085
22,529
10,013
1,443
13,988
32,535
70,756
25,231
9,299
5,161
20,658
16,370
5,071
10,943
20,044
3,211
12,594
25,556
5,568
4,915
6,725
6,515
24,804
1,373
AVG
57.7%
Updated data source
completionagenda.collegeboard.org Recommendation Nine 254

Six-Year Graduation Rates of Bachelor’s Degree–Seeking Students at Public Four-Year Colleges by State Rank, 2008Source: NCES IPEDS Graduation and Institutional Characteristics Surveys, 2008
9.3e
0 10 20 30 40 50 60 70 80 90 100
71.5%
67.7%
67.7%
66.0%
64.1%
63.9%
63.3%
62.6%
61.7%
60.6%
59.9%
59.7%
59.2%
59.1%
58.9%
58.8%
56.8%
56.5%
55.9%
55.6%
55.3%
54.7%
54.4%
54.4%
54.4%
54.0%
53.7%
53.5%
53.4%
52.9%
52.5%
50.3%
49.6%
49.4%
49.1%
47.2%
47.2%
47.1%
46.6%
46.0%
45.8%
45.5%
45.5%
44.0%
43.1%
40.7%
40.2%
39.5%
39.1%
32.9%
25.4%
7.9%
Delaware
Virginia
Washington
Iowa
New Jersey
New Hampshire
California
Maryland
Pennsylvania
South Carolina
Florida
Michigan
Wisconsin
Illinois
Vermont
North Carolina
New York
Connecticut
Arizona
Nebraska
UNITED STATES
Massachusetts
Minnesota
Missouri
Rhode Island
Indiana
Oregon
Colorado
Ohio
Kansas
Wyoming
Maine
Mississippi
Georgia
Texas
Alabama
Hawaii
North Dakota
Oklahoma
South Dakota
Tennessee
Kentucky
West Virginia
Nevada
Utah
Montana
New Mexico
Louisiana
Arkansas
Idaho
Alaska
District of Columbia
2
15
6
2
12
5
30
12
41
11
11
15
13
11
5
16
38
9
3
6
557
13
11
13
2
14
7
13
25
8
1
8
8
20
29
13
2
6
14
7
9
8
11
3
6
6
6
13
10
4
3
1
No. ofStudents
No. ofInsts.
20
U.S. Average
31
States
States
4,163
26,675
12,842
5,988
15,773
4,684
69,621
14,278
39,192
13,703
32,603
34,925
22,924
24,750
2,751
26,320
32,886
8,524
13,860
7,417
795,902
11,916
15,984
16,409
3,196
27,286
9,564
19,185
38,502
11,727
1,443
3,625
7,789
22,776
53,720
16,397
2,130
4,134
13,318
4,107
15,767
15,012
9,076
4,497
6,115
5,037
6,032
20,848
9,852
5,041
1,349
189
AVG
55.3%
Updated data source
completionagenda.collegeboard.org255

Six-Year Graduation Rates of Bachelor’s Degree–Seeking Students at Private Not-for-Profi t Four-Year Colleges by State Rank, 2008Source: NCES IPEDS Graduation and Institutional Characteristics Surveys, 2008
9.3f
0 10 20 30 40 50 60 70 80 90 100
77.3%
76.0%
75.8%
74.3%
73.9%
72.5%
72.4%
71.3%
71.1%
69.5%
69.3%
68.3%
67.7%
67.4%
67.3%
67.3%
65.5%
65.3%
65.1%
64.6%
62.6%
61.6%
60.6%
59.8%
59.8%
59.3%
58.1%
57.6%
57.1%
57.1%
56.3%
55.8%
55.6%
55.4%
54.4%
53.4%
53.1%
53.0%
52.2%
51.1%
51.1%
50.9%
49.5%
49.1%
47.7%
43.6%
43.5%
39.2%
38.4%
33.3%
21.4%
NA
Utah
District of Columbia
Massachusetts
Connecticut
Maryland
Pennsylvania
California
Rhode Island
Washington
Maine
Indiana
Colorado
New York
New Hampshire
Minnesota
Vermont
Oregon
Ohio
UNITED STATES
Illinois
Wisconsin
New Jersey
Nebraska
Iowa
Missouri
Tennessee
Texas
Georgia
Louisiana
North Carolina
Arkansas
South Dakota
Mississippi
Michigan
Florida
Virginia
Montana
South Carolina
Idaho
Oklahoma
West Virginia
Arizona
Kentucky
Kansas
Alabama
New Mexico
North Dakota
Hawaii
Delaware
Alaska
Nevada
Wyoming
2
9
57
14
17
78
76
7
14
11
30
7
122
11
23
13
17
56
1,139
48
23
18
13
30
34
37
40
28
9
40
11
6
10
34
42
27
4
20
4
12
9
5
21
17
16
4
4
3
4
1
1
NA
No. ofStudents
No. ofInsts.
18
U.S. Average
32*
States
States
3,216
7,605
31,775
8,250
5,367
35,712
21,696
6,821
5,061
2,613
11,708
2,265
55,699
3,609
9,034
2,492
3,596
18,665
405,529
20,566
7,380
7,882
2,734
7,704
9,267
9,361
16,190
8,817
4,470
13,321
2,742
980
1,510
7,964
12,761
9,672
531
6,219
1,401
2,811
1,815
428
4,445
2,238
4,160
326
937
977
628
24
84
NA
AVG
65.1%
* Indicator data not available for all states.
completionagenda.collegeboard.org Recommendation Nine 256
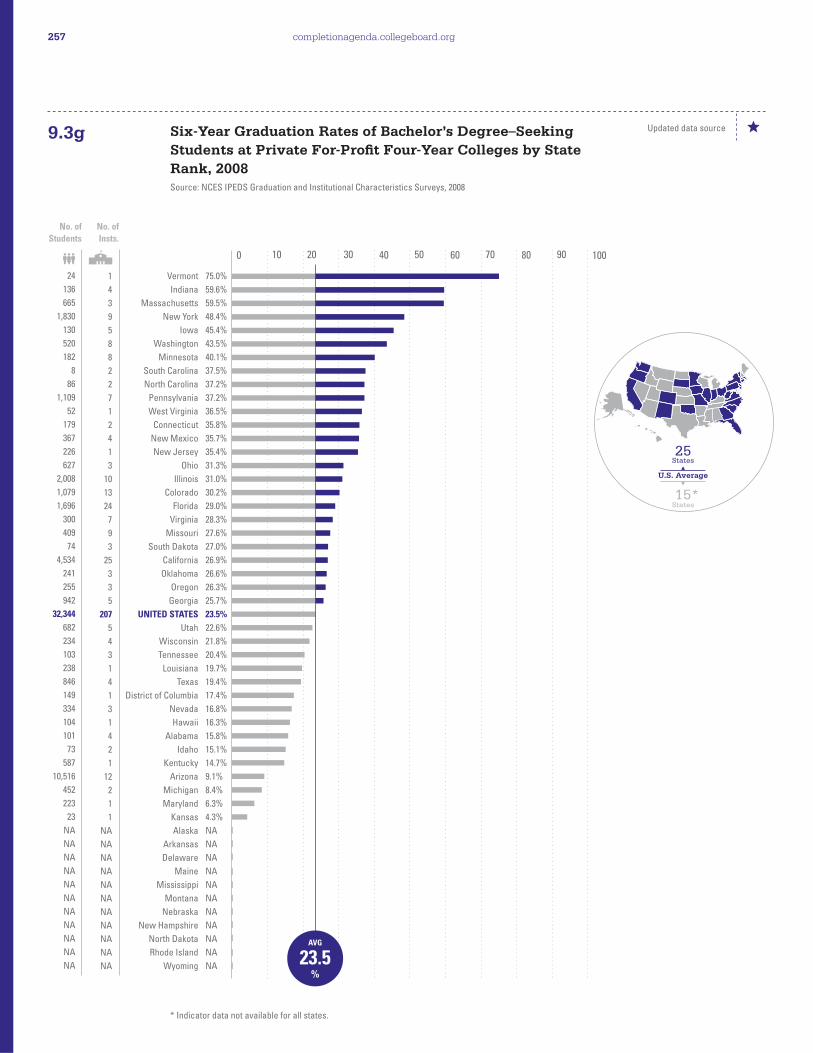
Six-Year Graduation Rates of Bachelor’s Degree–Seeking Students at Private For-Profi t Four-Year Colleges by State Rank, 2008Source: NCES IPEDS Graduation and Institutional Characteristics Surveys, 2008
9.3g
0 10 20 30 40 50 60 70 80 90 100
75.0%
59.6%
59.5%
48.4%
45.4%
43.5%
40.1%
37.5%
37.2%
37.2%
36.5%
35.8%
35.7%
35.4%
31.3%
31.0%
30.2%
29.0%
28.3%
27.6%
27.0%
26.9%
26.6%
26.3%
25.7%
23.5%
22.6%
21.8%
20.4%
19.7%
19.4%
17.4%
16.8%
16.3%
15.8%
15.1%
14.7%
9.1%
8.4%
6.3%
4.3%
NA
NA
NA
NA
NA
NA
NA
NA
NA
NA
NA
Vermont
Indiana
Massachusetts
New York
Iowa
Washington
Minnesota
South Carolina
North Carolina
Pennsylvania
West Virginia
Connecticut
New Mexico
New Jersey
Ohio
Illinois
Colorado
Florida
Virginia
Missouri
South Dakota
California
Oklahoma
Oregon
Georgia
UNITED STATES
Utah
Wisconsin
Tennessee
Louisiana
Texas
District of Columbia
Nevada
Hawaii
Alabama
Idaho
Kentucky
Arizona
Michigan
Maryland
Kansas
Alaska
Arkansas
Delaware
Maine
Mississippi
Montana
Nebraska
New Hampshire
North Dakota
Rhode Island
Wyoming
1
4
3
9
5
8
8
2
2
7
1
2
4
1
3
10
13
24
7
9
3
25
3
3
5
207
5
4
3
1
4
1
3
1
4
2
1
12
2
1
1
NA
NA
NA
NA
NA
NA
NA
NA
NA
NA
NA
No. ofStudents
No. ofInsts.
25
U.S. Average
15*
States
States
24
136
665
1,830
130
520
182
8
86
1,109
52
179
367
226
627
2,008
1,079
1,696
300
409
74
4,534
241
255
942
32,344
682
234
103
238
846
149
334
104
101
73
587
10,516
452
223
23
NA
NA
NA
NA
NA
NA
NA
NA
NA
NA
NA
AVG
23.5%
* Indicator data not available for all states.
Updated data source
completionagenda.collegeboard.org257

Six-Year Graduation Rates of Asian, Native Hawaiian and Other Pacifi c Islander Bachelor’s Degree–Seeking Students at Four-Year Colleges by State Rank, 2008Source: NCES IPEDS Graduation and Institutional Characteristics Surveys, 2008
9.3h
0 10 20 30 40 50 60 70 80 90 100
79.0%
78.4%
78.0%
77.4%
76.2%
75.0%
74.3%
73.8%
73.8%
73.1%
72.8%
71.9%
71.2%
70.3%
69.7%
69.5%
69.2%
67.9%
67.9%
67.5%
67.3%
65.3%
65.2%
63.8%
62.8%
62.4%
62.0%
61.7%
59.9%
59.1%
58.9%
56.1%
56.0%
55.3%
53.9%
52.7%
51.5%
50.0%
49.6%
49.6%
49.2%
49.0%
48.0%
47.1%
47.0%
43.5%
43.4%
38.8%
38.5%
36.6%
35.6%
21.3%
Massachusetts
New Hampshire
District of Columbia
Vermont
Connecticut
Maine
Rhode Island
Delaware
Pennsylvania
Maryland
Washington
North Carolina
California
Virginia
Michigan
New Jersey
Illinois
Indiana
Ohio
UNITED STATES
New York
Florida
South Carolina
Missouri
Nebraska
Georgia
Texas
Utah
Iowa
Minnesota
Oregon
Colorado
Tennessee
Oklahoma
Wisconsin
Mississippi
South Dakota
Alabama
Arizona
West Virginia
Hawaii
Arkansas
Kansas
Kentucky
Nevada
North Dakota
Louisiana
Montana
Wyoming
Idaho
New Mexico
Alaska
73
16
11
19
25
19
9
6
126
30
28
58
131
49
51
31
69
48
84
1,903
169
77
33
56
19
53
73
13
37
42
27
33
49
29
40
18
16
33
20
21
6
21
26
30
7
10
23
10
1
10
14
4
No. ofStudents
No. ofInsts.
19
U.S. Average
32
States
States
AVG
67.5%
3,460
250
477
93
793
148
467
122
3,215
1,399
2,292
1,036
22,766
1,996
1,773
2,542
3,538
955
1,339
76,881
7,842
2,015
287
655
239
1,496
4,442
329
279
1,142
967
1,074
552
371
1,053
91
33
264
816
121
1,842
149
321
255
560
46
523
85
13
134
149
75
Updated data source
completionagenda.collegeboard.org Recommendation Nine 258

Six-Year Graduation Rates of American Indian or Alaska Native Bachelor’s Degree–Seeking Students at Four-Year Colleges by State Rank, 2008Source: NCES IPEDS Graduation and Institutional Characteristics Surveys, 2008
9.3i
0 10 20 30 40 50 60 70 80 90 100
66.7%
64.0%
63.8%
62.8%
57.7%
57.6%
56.3%
55.0%
53.9%
53.1%
52.9%
52.6%
51.2%
50.7%
48.3%
47.9%
47.7%
46.7%
45.2%
45.1%
44.0%
44.0%
42.4%
41.7%
41.7%
41.1%
40.5%
39.7%
39.5%
39.5%
38.5%
38.5%
37.5%
34.6%
34.5%
33.7%
33.5%
33.3%
31.8%
30.8%
27.0%
25.7%
25.0%
23.6%
22.2%
22.2%
21.9%
21.4%
21.2%
20.7%
12.7%
8.9%
Delaware
Vermont
New Hampshire
Maryland
Massachusetts
Pennsylvania
New Jersey
Iowa
California
Washington
Connecticut
New York
Florida
Michigan
North Carolina
Maine
Virginia
Mississippi
Indiana
Arkansas
Rhode Island
Texas
Illinois
Oregon
West Virginia
Ohio
Wisconsin
Louisiana
Georgia
Nebraska
Alabama
UNITED STATES
Utah
Minnesota
South Carolina
Tennessee
Oklahoma
Missouri
Colorado
District of Columbia
South Dakota
New Mexico
Wyoming
Kansas
Hawaii
Kentucky
Arizona
Nevada
Idaho
Montana
Alaska
North Dakota
6
19
16
30
73
126
31
37
131
28
25
169
77
51
58
19
49
18
48
21
9
73
69
27
21
84
40
23
53
19
33
1,903
13
42
33
49
29
56
33
11
16
14
1
26
6
30
20
7
10
10
4
10
No. ofStudents
No. ofInsts.
31
U.S. Average
20
States
States
AVG
38.5%
9
25
58
86
175
151
48
40
681
260
70
268
162
296
333
48
151
30
135
113
25
343
132
163
36
192
158
146
76
43
117
9,167
72
185
58
95
1,667
156
384
13
126
280
12
318
18
45
452
56
85
179
205
191
Updated data source
completionagenda.collegeboard.org259
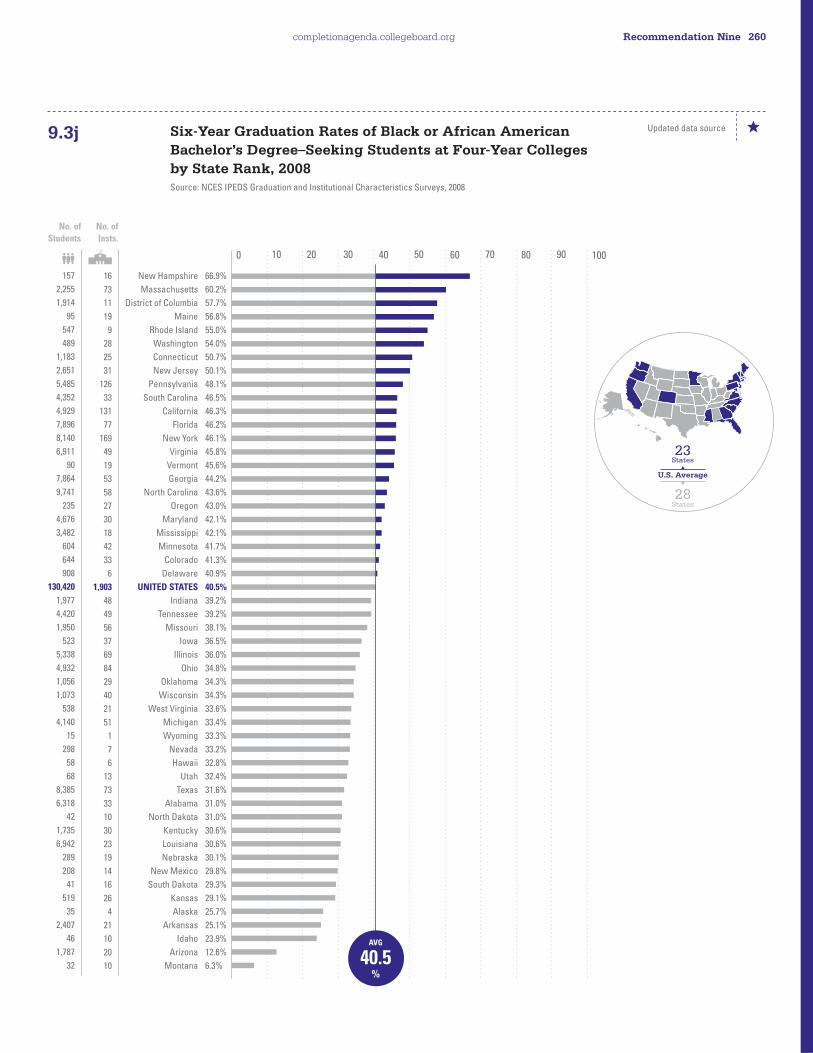
Six-Year Graduation Rates of Black or African American Bachelor’s Degree–Seeking Students at Four-Year Colleges by State Rank, 2008Source: NCES IPEDS Graduation and Institutional Characteristics Surveys, 2008
9.3j
0 10 20 30 40 50 60 70 80 90 100
66.9%
60.2%
57.7%
56.8%
55.0%
54.0%
50.7%
50.1%
48.1%
46.5%
46.3%
46.2%
46.1%
45.8%
45.6%
44.2%
43.6%
43.0%
42.1%
42.1%
41.7%
41.3%
40.9%
40.5%
39.2%
39.2%
38.1%
36.5%
36.0%
34.8%
34.3%
34.3%
33.6%
33.4%
33.3%
33.2%
32.8%
32.4%
31.6%
31.0%
31.0%
30.6%
30.6%
30.1%
29.8%
29.3%
29.1%
25.7%
25.1%
23.9%
12.6%
6.3%
New Hampshire
Massachusetts
District of Columbia
Maine
Rhode Island
Washington
Connecticut
New Jersey
Pennsylvania
South Carolina
California
Florida
New York
Virginia
Vermont
Georgia
North Carolina
Oregon
Maryland
Mississippi
Minnesota
Colorado
Delaware
UNITED STATES
Indiana
Tennessee
Missouri
Iowa
Illinois
Ohio
Oklahoma
Wisconsin
West Virginia
Michigan
Wyoming
Nevada
Hawaii
Utah
Texas
Alabama
North Dakota
Kentucky
Louisiana
Nebraska
New Mexico
South Dakota
Kansas
Alaska
Arkansas
Idaho
Arizona
Montana
16
73
11
19
9
28
25
31
126
33
131
77
169
49
19
53
58
27
30
18
42
33
6
1,903
48
49
56
37
69
84
29
40
21
51
1
7
6
13
73
33
10
30
23
19
14
16
26
4
21
10
20
10
No. ofStudents
No. ofInsts.
23
U.S. Average
28
States
States
AVG
40.5%
157
2,255
1,914
95
547
489
1,183
2,651
5,485
4,352
4,929
7,896
8,140
6,911
90
7,864
9,741
235
4,676
3,482
604
644
908
130,420
1,977
4,420
1,950
523
5,338
4,932
1,056
1,073
538
4,140
15
298
58
68
8,385
6,318
42
1,735
6,942
289
208
41
519
35
2,407
46
1,787
32
Updated data source
completionagenda.collegeboard.org Recommendation Nine 260

Six-Year Graduation Rates of Hispanic or Latino Bachelor’s Degree–Seeking Students at Four-Year Colleges by State Rank, 2008Source: NCES IPEDS Graduation and Institutional Characteristics Surveys, 2008
9.3k
0 10 20 30 40 50 60 70 80 90 100
70.5%
70.5%
68.7%
67.0%
64.4%
62.5%
61.0%
60.4%
59.7%
59.7%
59.0%
57.0%
56.7%
56.2%
55.5%
55.1%
54.1%
53.6%
53.2%
52.4%
51.8%
51.4%
50.5%
50.0%
49.7%
49.4%
48.0%
47.8%
46.9%
45.8%
44.8%
44.4%
44.2%
43.7%
43.6%
43.5%
42.8%
42.4%
41.7%
40.3%
39.8%
38.7%
38.5%
38.2%
38.1%
36.7%
33.3%
30.5%
29.6%
29.0%
24.4%
17.9%
Maryland
New Hampshire
District of Columbia
Maine
Massachusetts
Delaware
Pennsylvania
Rhode Island
Connecticut
Virginia
North Carolina
Washington
South Carolina
Florida
Minnesota
Missouri
Michigan
California
Indiana
Georgia
New Jersey
Wisconsin
Vermont
Ohio
New York
UNITED STATES
Nebraska
Oregon
Illinois
Louisiana
Tennessee
Wyoming
Colorado
Kansas
Iowa
Oklahoma
Utah
Mississippi
Alabama
West Virginia
Texas
Arizona
Kentucky
Arkansas
New Mexico
Nevada
Hawaii
Montana
North Dakota
Idaho
South Dakota
Alaska
30
16
11
19
73
6
126
9
25
49
58
28
33
77
42
56
51
131
48
53
31
40
19
84
169
1,903
19
27
69
23
49
1
33
26
37
29
13
18
33
21
73
20
30
21
14
7
6
10
10
10
16
4
No. ofStudents
No. ofInsts.
25
U.S. Average
26
States
States
AVG
49.4%
650
166
300
88
2,038
136
1,994
465
867
1,004
771
758
238
6,534
355
457
1,175
16,615
1,126
605
2,701
706
91
1,022
7,974
79,663
252
441
3,758
533
433
45
1,868
451
298
499
402
59
206
129
15,124
2,418
169
173
2,531
444
78
82
54
300
41
39
Updated data source
completionagenda.collegeboard.org261

0 10 20 30 40 50 60 70 80 90 100
79.9%
74.9%
73.6%
70.1%
68.9%
68.2%
68.0%
67.6%
67.5%
66.6%
65.9%
65.4%
65.3%
65.3%
64.6%
64.0%
63.3%
61.8%
61.4%
61.3%
61.1%
61.1%
60.7%
59.6%
59.6%
58.2%
57.8%
57.7%
57.7%
56.9%
56.1%
56.0%
55.4%
55.4%
53.5%
53.4%
53.3%
52.2%
49.9%
49.2%
48.5%
47.4%
47.4%
47.1%
47.0%
43.8%
43.6%
43.4%
42.7%
37.5%
35.3%
29.2%
District of Columbia
Delaware
Maryland
Massachusetts
Washington
Virginia
Pennsylvania
California
New York
New Jersey
Rhode Island
Connecticut
Illinois
New Hampshire
Iowa
Vermont
North Carolina
South Carolina
Wisconsin
Michigan
Florida
Minnesota
UNITED STATES
Indiana
Ohio
Nebraska
Texas
Maine
Missouri
Oregon
Mississippi
Colorado
Alabama
Kansas
Tennessee
Utah
Wyoming
Georgia
Oklahoma
South Dakota
North Dakota
Louisiana
West Virginia
Arkansas
Kentucky
New Mexico
Nevada
Montana
Arizona
Idaho
Hawaii
Alaska
11
6
30
73
28
49
126
131
169
31
9
25
69
16
37
19
58
33
40
51
77
42
1,903
48
84
19
73
19
56
27
18
33
33
26
49
13
1
53
29
16
10
23
21
21
30
14
7
10
20
10
6
4
No. ofStudents
No. ofInsts.
22
U.S. Average
29
States
States
AVG
60.7%
4,248
3,494
11,846
30,878
13,109
25,010
61,183
39,344
56,508
14,280
7,611
12,403
31,934
7,050
11,819
4,569
26,529
14,151
27,013
33,787
28,054
20,200
858,080
33,349
47,851
8,858
40,229
5,560
21,657
10,360
5,483
17,535
12,821
11,647
18,972
8,656
1,284
21,062
12,144
4,717
4,566
16,350
9,816
9,251
17,352
3,086
3,077
4,932
15,076
5,511
933
925
Six-Year Graduation Rates of White Bachelor’s Degree–Seeking Students at Four-Year Colleges by State Rank, 2008Source: NCES IPEDS Graduation and Institutional Characteristics Surveys, 2008
9.3l Updated data source
completionagenda.collegeboard.org Recommendation Nine 262

National Eight-Year Graduation Rates of Bachelor’s Degree–Seeking Students, 2008Source: NCES IPEDS Graduation 200 and Institutional Characteristics Surveys, 2008
9.3m
0
10
20
30
40
50
60
70
80
90
100
Private4-Year
(Not-for-Profit)
Private4-Year
(For-Profit)
Total4-Year
Public4-Year
60.6% 58.3%
66.4%
37.8%
New fi gure
completionagenda.collegeboard.org263

Eight-Year Graduation Rates of Bachelor’s Degree–Seeking Students at Four-Year Colleges by State Rank, 2008Source: NCES IPEDS Graduation 200 and Institutional Characteristics Surveys, 2008
9.3n
0 10 20 30 40 50 60 70 80 90 100
75.4%
70.4%
69.5%
67.9%
67.7%
67.7%
67.4%
67.0%
66.9%
66.2%
65.6%
65.4%
65.1%
64.4%
64.4%
63.2%
62.5%
62.4%
61.6%
60.6%
60.3%
60.1%
60.0%
59.9%
59.8%
59.8%
59.5%
59.3%
58.9%
58.7%
58.1%
57.4%
56.7%
55.6%
54.9%
53.9%
53.2%
52.9%
52.8%
52.1%
51.3%
50.3%
49.3%
48.4%
48.1%
47.9%
47.7%
46.9%
46.4%
45.5%
43.1%
30.6%
District of Columbia
Massachusetts
New Hampshire
Rhode Island
Delaware
Washington
Maryland
Pennsylvania
California
Virginia
Utah
Iowa
New Jersey
Connecticut
New York
Vermont
Michigan
Illinois
Wisconsin
UNITED STATES
North Carolina
Maine
South Carolina
Minnesota
Florida
Indiana
Nebraska
Ohio
Wyoming
Oregon
Tennessee
Missouri
Colorado
Kansas
Texas
Georgia
Alabama
Oklahoma
Mississippi
Kentucky
North Dakota
South Dakota
Hawaii
West Virginia
Nevada
Montana
Arizona
Arkansas
New Mexico
Louisiana
Idaho
Alaska
10
76
15
9
6
22
31
125
127
45
12
39
30
25
171
18
52
67
37
1,877
58
19
31
42
76
46
22
86
1
29
47
54
33
25
75
52
32
28
18
30
10
16
7
21
6
10
19
19
13
24
7
4
19
U.S. Average
32
States
States
AVG
60.6%
7,307
43,077
7,685
9,302
4,309
17,206
18,683
73,560
88,320
34,255
10,371
17,596
22,707
16,468
86,186
5,012
43,268
44,328
29,950
1,178,593
37,406
6,098
17,490
25,193
44,346
38,864
10,606
56,440
1,325
12,488
24,773
26,018
21,102
13,558
67,451
30,205
19,887
15,548
9,194
18,830
4,876
4,909
2,981
10,420
4,244
5,319
18,614
12,276
6,462
26,291
4,642
1,147
No. ofStudents
No. ofInsts.
New fi gure
completionagenda.collegeboard.org Recommendation Nine 264

Eight-Year Graduation Rates of Bachelor’s Degree–Seeking Students at Public Four-Year Colleges by State Rank, 2008Source: NCES IPEDS Graduation 200 and Institutional Characteristics Surveys, 2008
9.3o
0 10 20 30 40 50 60 70 80 90 100
70.4%
68.9%
67.9%
67.4%
67.2%
66.6%
66.5%
65.5%
63.7%
62.7%
62.6%
62.0%
61.7%
61.0%
60.5%
59.1%
58.9%
58.3%
58.3%
57.3%
57.3%
57.2%
57.0%
56.5%
56.5%
56.4%
56.2%
56.2%
55.8%
55.5%
55.4%
54.3%
54.2%
53.7%
53.4%
53.3%
52.9%
52.9%
50.9%
50.6%
50.1%
49.7%
49.3%
49.2%
47.8%
46.7%
46.1%
43.3%
43.0%
41.5%
30.6%
28.8%
Delaware
Virginia
Iowa
Washington
California
New Jersey
New Hampshire
Maryland
Michigan
Florida
South Carolina
Pennsylvania
North Carolina
Illinois
Wisconsin
Vermont
Wyoming
Arizona
UNITED STATES
Nebraska
Tennessee
Kansas
New York
Missouri
Ohio
Massachusetts
Oregon
Rhode Island
Colorado
Connecticut
Indiana
Minnesota
Texas
Utah
Alabama
Mississippi
Georgia
Hawaii
Oklahoma
North Dakota
Maine
Nevada
South Dakota
Kentucky
West Virginia
New Mexico
Montana
Arkansas
Louisiana
Idaho
Alaska
District of Columbia
2
15
3
6
30
12
4
12
15
10
11
40
16
10
13
4
1
3
549
6
9
8
36
13
24
13
7
2
13
9
14
11
31
6
13
8
20
2
13
6
8
2
7
8
11
6
6
9
13
4
3
1
18
U.S. Average
33
States
States
AVG
58.3%
3,812
25,375
10,142
12,185
62,772
15,092
4,268
13,420
34,885
29,418
12,409
37,863
24,734
23,221
22,612
2,557
1,325
13,470
757,410
7,361
15,194
11,236
30,490
16,189
37,060
11,482
8,523
3,091
18,079
8,070
27,195
15,957
49,701
5,765
15,517
7,674
20,627
1,861
12,093
4,133
3,652
4,049
3,783
13,004
8,676
5,902
4,784
9,692
21,541
4,210
1,103
156
No. ofStudents
No. ofInsts.
New fi gure
completionagenda.collegeboard.org265

Eight-Year Graduation Rates of Bachelor’s Degree–Seeking Students at Private Not-for-Profi t Four-Year Colleges by State Rank, 2008Source: NCES IPEDS Graduation 200 and Institutional Characteristics Surveys, 2008
9.3p
0 10 20 30 40 50 60 70 80 90 100
83.6%
76.4%
75.6%
74.9%
74.2%
73.7%
73.3%
73.1%
72.9%
72.6%
72.6%
70.0%
69.9%
69.8%
69.1%
67.4%
66.7%
66.4%
66.0%
65.7%
64.8%
64.6%
63.9%
62.6%
62.1%
60.9%
60.3%
59.9%
59.5%
59.5%
59.1%
59.1%
58.7%
58.6%
58.1%
57.6%
56.5%
55.2%
54.6%
54.0%
53.7%
52.2%
51.0%
50.8%
50.3%
50.2%
47.8%
47.7%
45.0%
29.5%
18.9%
NA
Utah
District of Columbia
Massachusetts
Maine
Connecticut
Rhode Island
New Hampshire
Maryland
Colorado
California
Pennsylvania
Washington
Indiana
Minnesota
New York
Vermont
Illinois
UNITED STATES
Ohio
Oregon
Wisconsin
Nebraska
Montana
Iowa
New Jersey
Oklahoma
Arkansas
Missouri
Tennessee
Texas
Georgia
Michigan
Virginia
Idaho
Louisiana
North Carolina
South Dakota
North Dakota
Florida
Arizona
South Carolina
Alabama
New Mexico
Mississippi
Kentucky
West Virginia
Kansas
Delaware
Hawaii
Alaska
Nevada
Wyoming
2
9
60
11
14
7
11
18
9
76
81
13
31
24
126
13
49
1,165
58
20
23
16
4
30
18
13
10
35
37
41
27
35
27
3
9
41
6
4
44
5
20
16
3
10
21
9
17
4
3
1
1
NA
17
U.S. Average
33*
States
States
AVG
66.4%
4,280
7,151
31,389
2,446
8,159
6,211
3,417
5,165
2,250
20,853
35,201
4,820
11,601
9,152
54,010
2,432
18,686
395,634
18,508
3,811
7,296
3,245
535
7,298
7,615
3,377
2,584
9,204
9,575
16,575
8,262
8,056
8,809
432
4,577
12,648
1,045
743
12,099
478
5,081
4,351
298
1,520
4,747
1,659
2,322
497
1,067
44
53
NA
No. ofStudents
No. ofInsts.
* Indicator data not available for all states.
New fi gure
completionagenda.collegeboard.org Recommendation Nine 266
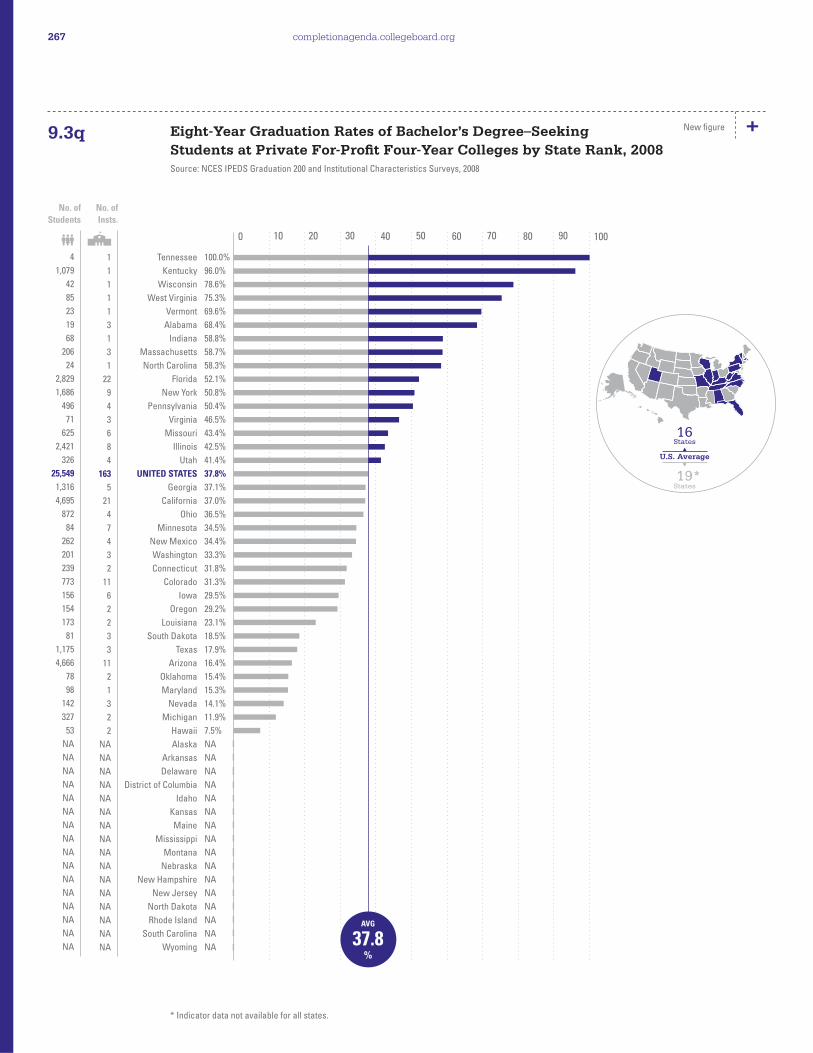
Eight-Year Graduation Rates of Bachelor’s Degree–Seeking Students at Private For-Profi t Four-Year Colleges by State Rank, 2008Source: NCES IPEDS Graduation 200 and Institutional Characteristics Surveys, 2008
9.3q
0 10 20 30 40 50 60 70 80 90 100
100.0%
96.0%
78.6%
75.3%
69.6%
68.4%
58.8%
58.7%
58.3%
52.1%
50.8%
50.4%
46.5%
43.4%
42.5%
41.4%
37.8%
37.1%
37.0%
36.5%
34.5%
34.4%
33.3%
31.8%
31.3%
29.5%
29.2%
23.1%
18.5%
17.9%
16.4%
15.4%
15.3%
14.1%
11.9%
7.5%
NA
NA
NA
NA
NA
NA
NA
NA
NA
NA
NA
NA
NA
NA
NA
NA
Tennessee
Kentucky
Wisconsin
West Virginia
Vermont
Alabama
Indiana
Massachusetts
North Carolina
Florida
New York
Pennsylvania
Virginia
Missouri
Illinois
Utah
UNITED STATES
Georgia
California
Ohio
Minnesota
New Mexico
Washington
Connecticut
Colorado
Iowa
Oregon
Louisiana
South Dakota
Texas
Arizona
Oklahoma
Maryland
Nevada
Michigan
Hawaii
Alaska
Arkansas
Delaware
District of Columbia
Idaho
Kansas
Maine
Mississippi
Montana
Nebraska
New Hampshire
New Jersey
North Dakota
Rhode Island
South Carolina
Wyoming
1
1
1
1
1
3
1
3
1
22
9
4
3
6
8
4
163
5
21
4
7
4
3
2
11
6
2
2
3
3
11
2
1
3
2
2
NA
NA
NA
NA
NA
NA
NA
NA
NA
NA
NA
NA
NA
NA
NA
NA
16
U.S. Average
19*
States
States
AVG
37.8%
4
1,079
42
85
23
19
68
206
24
2,829
1,686
496
71
625
2,421
326
25,549
1,316
4,695
872
84
262
201
239
773
156
154
173
81
1,175
4,666
78
98
142
327
53
NA
NA
NA
NA
NA
NA
NA
NA
NA
NA
NA
NA
NA
NA
NA
NA
No. ofStudents
No. ofInsts.
* Indicator data not available for all states.
New fi gure
completionagenda.collegeboard.org267

Degrees Awarded at Colleges and UniversitiesWhat is this measure, and why is this measure important? This indicator
measures the number of degrees that are awarded in the United States each
year by degree type, sector, fi eld, race/ethnicity, gender and state. This measure
is important because it shows the actual production of degrees by colleges and
universities in the United States.
What are the policy issues associated with this measure? Unlike graduation
rates, this measure includes those who earn degrees who do not graduate
in a specifi ed amount of time (e.g., 150 percent of time) and those graduates
who attend school part time and those who transfer from another institution.
These students are not currently included in graduation rates, and national data
systems do not yet exist to adequately track students across all institutions in
the United States.
Where are we now? As of 2009, the number of associate degrees has
increased 36.0 percent from 1,159,550 in 2001 to 1,577,136 in 2009, and the
number of bachelor’s degrees has increased 29.6 percent from 2,597,018 in
2001 to 3,366,858 in 2009 (Figure 9.4a).
Figure 9.4b shows degrees by institutional type. While 72.8 percent of all
associate degrees are awarded at two-year institutions, four-year institutions
awarded 27.2 percent of associate degrees. Almost all bachelor’s degrees were
awarded at four-year institutions.
There is considerable variability by race/ethnicity. Figure 9.4c shows that 1.1
percent of associate degrees are awarded to American Indians or Alaska
Natives; 5.3 percent of associate degrees are awarded to Asian Americans and
Pacifi c Islanders; 13.1 percent of associate degrees are awarded to African
Americans, and 12.7 percent of associate degrees are awarded to Hispanics.
These numbers are compared to 67.8 percent of associate degrees awarded to
white students.
Figure 9.4c also shows that 0.8 percent of bachelor’s degrees are awarded
to American Indians or Alaska Natives; 7.3 percent of bachelor’s degrees are
awarded to Asian Americans and Pacifi c Islanders; 9.8 percent of bachelor’s
degrees are awarded to African Americans and 8.3 percent of bachelor’s
degrees are awarded to Hispanics. These numbers are compared to 73.8
percent of bachelor’s degrees awarded to white students.
36.0% As of 2009, the number of associate degrees has increased 36.0 percent from 1,159,550 in 2001 to 1,577,136 in 2009.
29.6% As of 2009, the number of bachelor’s degrees has increased 29.6 percent from 2,597,018 in 2001 to 3,366,858 in 2009.
1.1% As of 2009, 1.1 percent of all associate degrees are awarded to American Indians or Alaska Natives.
completionagenda.collegeboard.org Recommendation Nine 268
New indicator
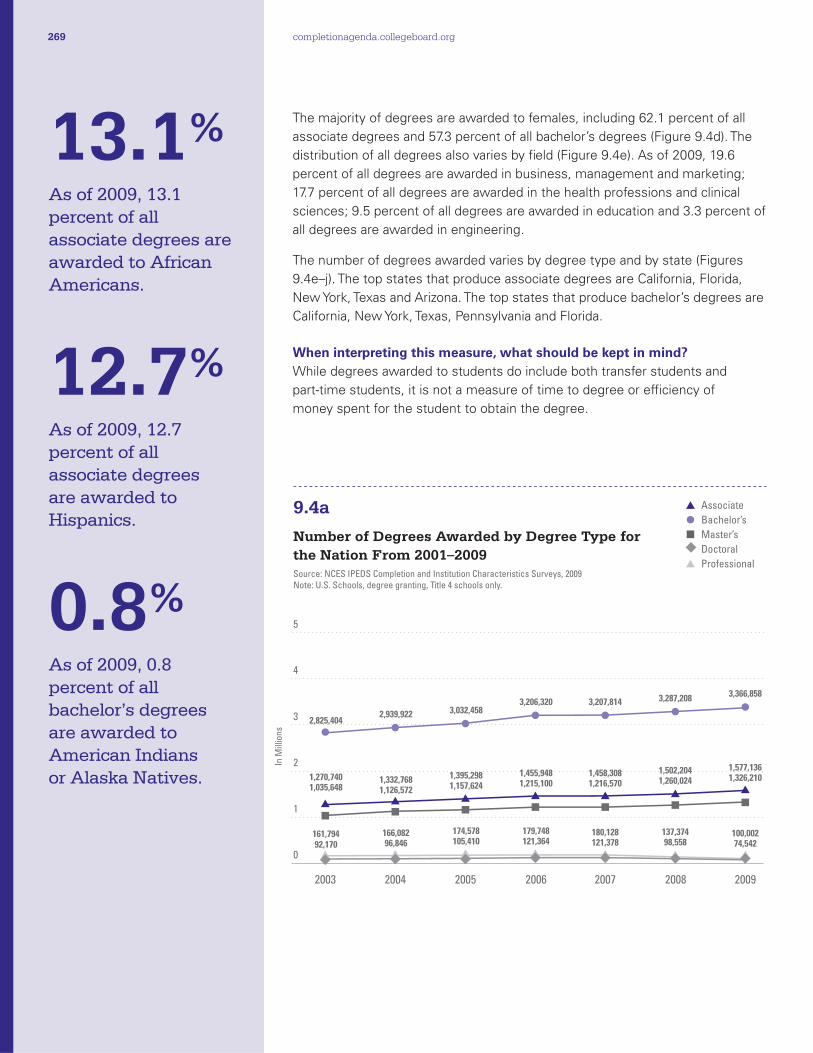
The majority of degrees are awarded to females, including 62.1 percent of all
associate degrees and 57.3 percent of all bachelor’s degrees (Figure 9.4d). The
distribution of all degrees also varies by fi eld (Figure 9.4e). As of 2009, 19.6
percent of all degrees are awarded in business, management and marketing;
17.7 percent of all degrees are awarded in the health professions and clinical
sciences; 9.5 percent of all degrees are awarded in education and 3.3 percent of
all degrees are awarded in engineering.
The number of degrees awarded varies by degree type and by state (Figures
9.4e–j). The top states that produce associate degrees are California, Florida,
New York, Texas and Arizona. The top states that produce bachelor’s degrees are
California, New York, Texas, Pennsylvania and Florida.
When interpreting this measure, what should be kept in mind? While degrees awarded to students do include both transfer students and
part-time students, it is not a measure of time to degree or effi ciency of
money spent for the student to obtain the degree.
13.1% As of 2009, 13.1 percent of all associate degrees are awarded to African Americans.
12.7% As of 2009, 12.7 percent of all associate degrees are awarded to Hispanics.
0.8% As of 2009, 0.8 percent of all bachelor’s degrees are awarded to American Indians or Alaska Natives.
Number of Degrees Awarded by Degree Type for the Nation From 2001–2009Source: NCES IPEDS Completion and Institution Characteristics Surveys, 2009Note: U.S. Schools, degree granting, Title 4 schools only.
9.4a
0
2
3
4
5
In M
illio
ns
1
2003 2004 2005 2006 2007 2008 2009
2,825,404
1,035,6481,270,740
1,126,5721,332,768
96,846166,082
1,157,6241,395,298
105,410174,578
1,215,1001,455,948
121,364179,748
1,216,5701,458,308
121,378180,128
1,260,0241,502,204
98,558137,374
1,326,2101,577,136
74,542100,002
92,170161,794
2,939,922 3,032,4583,206,320 3,207,814 3,287,208 3,366,858
Associate
Bachelor’s
Master’s
Doctoral
Professional
completionagenda.collegeboard.org269

9.8% As of 2009, 9.8 percent of all bachelor’s degrees are awarded to African Americans.
8.3% As of 2009, 8.3 percent of all bachelor’s degrees are awarded to Hispanics.
Number of Degrees Granted in the Nation by Sector, 2009Source: NCES IPEDS Completion and Institution Characteristics Surveys, 2009Note: U.S. Schools, degree granting, Title 4 schools only. Values too small (VTS) to report bachelor’s degrees and master’s degrees at two-year institutions.
9.4b
0
10
20
30
40
50
60
70
80
90
100
Private2-year
(Not-for-Profit)
Public2-year
All2-year
Private2-year
(For-Profit)
All4-year
12,766
0
0
0
0
1,019,212
0
0
0
0
116,686
VTS
VTS
0
0
428,472
3,366,856
1,326,210
74,542
100,002
Public4-year
174,970
2,121,796
617,504
46,488
47,542
Private4-year
(Not-for-Profit)
81,264
1,075,400
581,732
26,892
51,208
Private4-year
(For-Profit)
172,238
169,660
126,974
1,162
1,252
1,148,664
VTS
VTS
0
0
88.7
%
72.8
%
1.1%
10.2
%
27.2
%
40.8
%63
.0%
46.6
%62
.4%
47.5
%
19.0
%31
.9%
43.9
%36
.1%
51.2
%
40.2
%5.
0% 9.6%
1.6%
1.3%
100.
0%10
0.0%
100.
0%10
0.0%
Associate
Bachelor’s
Master’s
Doctoral
Professional
completionagenda.collegeboard.org Recommendation Nine 270
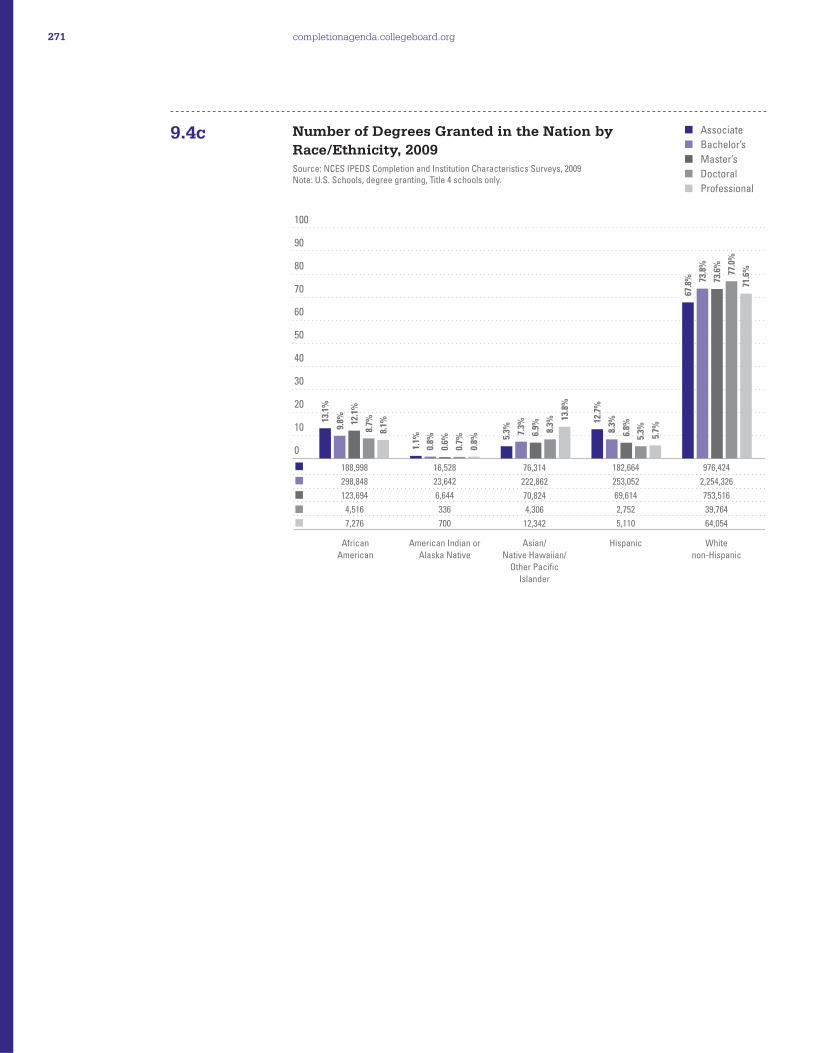
Number of Degrees Granted in the Nation by Race/Ethnicity, 2009Source: NCES IPEDS Completion and Institution Characteristics Surveys, 2009Note: U.S. Schools, degree granting, Title 4 schools only.
9.4c
0
10
20
30
40
50
60
70
80
90
100
Asian/Native Hawaiian/
Other PacificIslander
American Indian orAlaska Native
AfricanAmerican
Hispanic Whitenon-Hispanic
76,314
222,862
70,824
4,306
12,342
16,528
23,642
6,644
336
700
182,664
253,052
69,614
2,752
5,110
976,424
2,254,326
753,516
39,764
64,054
188,998
298,848
123,694
4,516
7,276
13.1
%
1.1%
0.8%
0.6%
0.7%
0.8% 5.
3% 7.3%
6.9% 8.3%
13.8
%
12.7
%
8.3%
6.8%
5.3%
5.7%
67.8
% 73.8
%
73.6
%
77.0
%
71.6
%
9.8% 12
.1%
8.7%
8.1%
Associate
Bachelor’s
Master’s
Doctoral
Professional
completionagenda.collegeboard.org271

Number of Degrees Granted by Gender, 2009Source: NCES IPEDS Completion and Institution Characteristics Surveys, 2009Note: U.S. Schools, degree granting, Title 4 schools only.
9.4d
0
10
20
30
40
50
60
70
80
90
100
MaleFemale
979,790
1,928,460
798,274
38,688
49,550
597,346
1,438,398
527,936
35,854
50,452
37.9%42.7%
39.8%
48.1%50.5%
62.1%57.3%
60.2%
51.9%49.5%
Associate
Bachelor’s
Master’s
Doctoral
Professional
completionagenda.collegeboard.org Recommendation Nine 272

Total Degrees Awarded by Major CIP Code, 2009Source: NCES IPEDS Completion and Institution Characteristics Surveys, 2009Note: U.S. Schools, degree granting, Title 4 schools only.
9.4e
0 10 20 30 40 50 60 70 80 90 100
19.6%
17.7%
9.5%
9.2%
4.9%
3.9%
3.7%
3.3%
3.0%
3.0%
2.9%
2.6%
2.0%
1.9%
1.8%
1.8%
1.4%
1.2%
1.1%
1.0%
1.0%
0.8%
0.7%
0.5%
0.5%
0.4%
0.4%
0.2%
Business,Management, Marketing
Health Professions andClinical Sciences
Education
Liberal Arts and Sciences,General Studies and Humanities
Social Sciences
Visual and Performing Arts
Psychology
Engineering
Security and Protective Services
Computer and Information Sciences
Biological and Biomedical Sciences
Communication, Journalism,Related Programs
English Language andLiterature/Letters
Legal Professions and Studies
Public Administration andSocial Service Professions
Multi/Interdisciplinary Studies
Family and Consumer Sciences/Human Sciences
History
Parks, recreation, Leisure, andFitness Studies
Physical Sciences
Foreign Languages, Literature,and Linguistics
Agriculture and Related Sciences
Mathematics and Statistics
Philosophy and Religious Studies
Architecture and Related Services
Natural Resources and Conservation
Area, Ethnic, Cultural, andGender Studies
Library Science
701,077
630,915
338,862
327,433
176,766
138,248
133,813
116,309
106,490
105,453
102,832
92,193
72,751
67,467
65,516
64,345
48,780
43,384
39,577
36,770
36,764
27,406
25,488
18,013
17,991
15,548
14,180
7,756
No. ofStudents
completionagenda.collegeboard.org273

Number of Associate Degrees Awarded by State Rank, 2009Source: NCES IPEDS Completion and Institution Characteristics Surveys, 2009Note: U.S. Schools, degree granting, Title 4 schools only.
9.4f
197,660
141,834
118,154
95,924
83,940
72,332
56,242
54,296
54,122
43,716
41,412
37,538
35,026
34,494
30,114
29,426
29,096
28,830
27,278
24,442
22,736
22,614
21,682
20,470
19,556
19,024
18,628
18,094
16,862
16,394
15,694
12,974
11,076
10,838
10,120
9,536
8,058
7,698
7,340
6,718
6,442
5,876
5,570
5,272
4,832
3,930
3,290
3,270
2,398
2,270
1,998
California
Florida
New York
Texas
Arizona
Illinois
Ohio
Michigan
Pennsylvania
Washington
North Carolina
Virginia
New Jersey
Minnesota
Indiana
Missouri
Colorado
Georgia
Iowa
Wisconsin
Massachusetts
Maryland
Kentucky
Utah
Tennessee
Oklahoma
Alabama
Mississippi
South Carolina
Oregon
Kansas
Arkansas
Connecticut
Louisiana
New Mexico
Nebraska
Rhode Island
West Virginia
Nevada
Idaho
Hawaii
New Hampshire
Wyoming
Maine
North Dakota
South Dakota
Delaware
Montana
Vermont
District of Columbia
Alaska
In Thousands
0 40 80 120 160 200 240 280 320 360 400
completionagenda.collegeboard.org Recommendation Nine 274

Number of Bachelor’s Degrees Awarded by State Rank, 2009Source: NCES IPEDS Completion and Institution Characteristics Surveys, 2009Note: U.S. Schools, degree granting, Title 4 schools only.
9.4g
0 40 80 120 160 200 240 280 320 360 400
336,594
255,690
210,128
180,334
167,778
146,142
127,974
115,912
109,372
96,748
90,414
83,722
82,600
81,230
81,182
76,514
70,600
68,858
63,120
61,138
60,260
57,160
56,764
50,966
44,522
44,120
44,064
42,034
40,872
39,464
38,092
37,106
27,250
24,936
24,524
23,924
22,920
22,054
18,970
18,572
16,032
14,612
14,494
12,502
12,086
11,776
11,706
11,118
10,858
3,798
3,252
California
New York
Texas
Pennsylvania
Florida
Illinois
Ohio
Michigan
Massachusetts
North Carolina
Virginia
Indiana
Georgia
Missouri
Arizona
Wisconsin
New Jersey
Minnesota
Washington
Tennessee
Colorado
Iowa
Maryland
Alabama
South Carolina
Louisiana
Utah
Kentucky
Connecticut
Oklahoma
Oregon
Kansas
Nebraska
Mississippi
Arkansas
District of Columbia
West Virginia
Rhode Island
New Hampshire
Idaho
New Mexico
Maine
Nevada
Vermont
North Dakota
Delaware
Hawaii
South Dakota
Montana
Wyoming
Alaska
In Thousands
completionagenda.collegeboard.org275
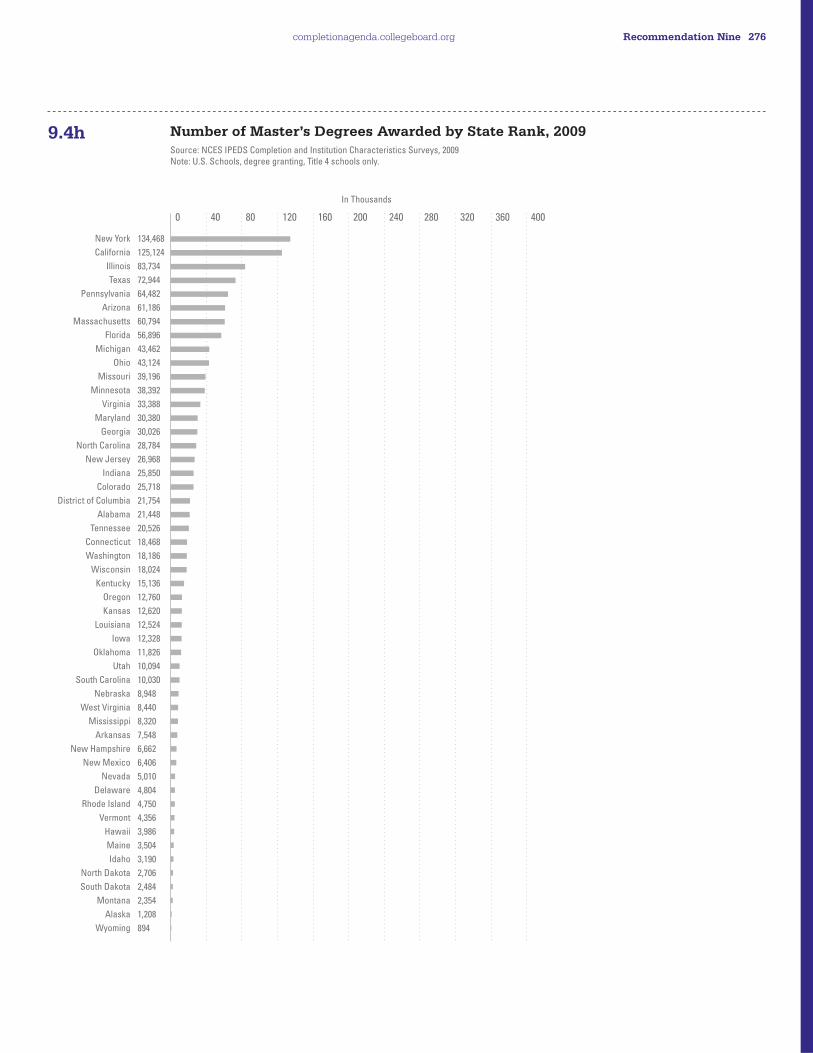
Number of Master’s Degrees Awarded by State Rank, 2009Source: NCES IPEDS Completion and Institution Characteristics Surveys, 2009Note: U.S. Schools, degree granting, Title 4 schools only.
9.4h
0 40 80 120 160 200 240 280 320 360 400
134,468
125,124
83,734
72,944
64,482
61,186
60,794
56,896
43,462
43,124
39,196
38,392
33,388
30,380
30,026
28,784
26,968
25,850
25,718
21,754
21,448
20,526
18,468
18,186
18,024
15,136
12,760
12,620
12,524
12,328
11,826
10,094
10,030
8,948
8,440
8,320
7,548
6,662
6,406
5,010
4,804
4,750
4,356
3,986
3,504
3,190
2,706
2,484
2,354
1,208
894
New York
California
Illinois
Texas
Pennsylvania
Arizona
Massachusetts
Florida
Michigan
Ohio
Missouri
Minnesota
Virginia
Maryland
Georgia
North Carolina
New Jersey
Indiana
Colorado
District of Columbia
Alabama
Tennessee
Connecticut
Washington
Wisconsin
Kentucky
Oregon
Kansas
Louisiana
Iowa
Oklahoma
Utah
South Carolina
Nebraska
West Virginia
Mississippi
Arkansas
New Hampshire
New Mexico
Nevada
Delaware
Rhode Island
Vermont
Hawaii
Maine
Idaho
North Dakota
South Dakota
Montana
Alaska
Wyoming
In Thousands
completionagenda.collegeboard.org Recommendation Nine 276

Number of Doctoral Degrees Awarded by State Rank, 2009Source: NCES IPEDS Completion and Institution Characteristics Surveys, 2009Note: U.S. Schools, degree granting, Title 4 schools only.
9.4i
0 40 80 120 160 200 240 280 320 360 400
13,514
7,628
6,166
3,980
3,310
3,170
2,874
2,476
2,208
2,140
2,078
1,818
1,810
1,782
1,704
1,620
1,350
1,300
1,244
1,186
1,140
1,128
1,034
864
836
628
576
566
530
412
402
350
322
318
282
278
252
204
198
192
176
160
116
110
98
67
8
4
0
0
0
California
New York
Florida
Texas
North Carolina
Pennsylvania
New Jersey
Ohio
Georgia
Colorado
Virginia
Washington
Iowa
Indiana
Michigan
Missouri
Alabama
Massachusetts
Louisiana
South Carolina
Arizona
Kentucky
District of Columbia
Oklahoma
Illinois
Mississippi
Arkansas
Tennessee
Delaware
Hawaii
West Virginia
North Dakota
New Hampshire
Idaho
Montana
Rhode Island
Nevada
Nebraska
South Dakota
Oregon
Utah
New Mexico
Maine
Minnesota
Wisconsin
Kansas
Vermont
Maryland
Alaska
Connecticut
Wyoming
In Thousands
completionagenda.collegeboard.org277

Number of Professional Degrees Awarded by State Rank, 2009Source: NCES IPEDS Completion and Institution Characteristics Surveys, 2009Note: U.S. Schools, degree granting, Title 4 schools only.
9.4j
0 40 80 120 160 200 240 280 320 360 400
11,512
9,994
7,804
7,036
5,612
4,046
4,010
4,000
3,590
3,466
3,060
2,972
2,940
2,784
2,698
2,530
2,268
2,122
1,942
1,772
1,752
1,728
1,524
1,414
1,012
834
722
710
554
446
446
418
382
360
350
326
296
280
134
102
54
0
0
0
0
0
0
0
0
0
0
New York
California
Florida
Texas
Pennsylvania
Ohio
Virginia
North Carolina
Massachusetts
New Jersey
Illinois
District of Columbia
Louisiana
Georgia
Indiana
Michigan
Iowa
Colorado
Oklahoma
Missouri
Kentucky
South Carolina
Washington
Alabama
Arkansas
West Virginia
Minnesota
Tennessee
Rhode Island
Nebraska
North Dakota
New Hampshire
Vermont
South Dakota
Oregon
Idaho
Hawaii
Montana
Mississippi
Nevada
Wisconsin
Alaska
Arizona
Connecticut
Delaware
Kansas
Maine
Maryland
New Mexico
Utah
Wyoming
In Thousands
completionagenda.collegeboard.org Recommendation Nine 278

TenProvide postsecondary opportunities as an essential element of adult education programs
WE RECOMMEND a renewed commitment to adult education opportunities, one that supplements existing basic skills training and General Educational Development opportunities with a new “honors GED,” and better coordination of federal and state efforts to provide adult education, veterans benefi ts, outreach programs and student aid.

Adult education generally refers to any form of continuing education beyond the
traditional school years. Thus, whether an individual is returning to college to
complete a degree, enrolling in college for the fi rst time, taking an occasional
postsecondary class or pursuing a GED certifi cate, he or she is participating in
adult education.
In accordance with the Adult Education and Family Literacy Act of the Workforce
Investment Act passed in 1998, states must report on participation and
outcomes of federally funded adult education programs through the Offi ce
of Vocational and Adult Education’s National Reporting System (NRS). NRS
tracks four core follow-up outcome measures to determine the number of
participants who enter employment, retain employment, receive a secondary
school diploma or GED, or are placed in postsecondary education or training.
The system is suffi ciently fl exible to accommodate the varying goals, objectives,
data collection and reporting constraints of the states. Because of these
inconsistencies, researchers are somewhat limited in their ability to compare
state outcomes through NRS.
Two primary limitations emerge for using NRS as a source for this recommendation.
First, the data of interest are not disaggregated by age range. While adult
education encompasses a broader age range (e.g., 25 to 64 when looking at the
workforce as a whole), the indicators in this chapter are limited to young adults,
ages 25 to 34, in order to understand the role of adult education programs
in achieving the overall commission goal. States appear to have differential
participation in adult education from various age groups. Thus, while outcomes
may be largely driven by younger adults in some states, they are a function
of older adults in other states. Second, the collection and reporting of data
make it impossible to separate postsecondary education from postsecondary
training, which is also critical to the nature of this recommendation and the
overall goal. Postsecondary training is defi ned as an occupational skills program
building on previously received services or training.
Despite these limitations for using NRS data in the current publication,
policymakers should familiarize themselves with this source, as several general
fi ndings raise concerns about the potential for increasing degree attainment
among adult learners. For example, NRS classifi es a learner’s adult education
goal into the following categories: obtain a job, retain current job, improve
current job, earn a secondary school diploma or GED, enter postsecondary
education or training, improve basic literacy skills, improve English language
skills, citizenship, work-based project learner goal, or other personal goals. The
data suggest that only a small portion of participants come into adult education
programs with the goal of entering postsecondary education or training. For
most states, the vast majority of participants aim to earn a GED or secondary
school diploma. The remaining participants indicate, in descending order, a goal
of entering employment, retaining employment, and entering postsecondary
education or training.
completionagenda.collegeboard.org Recommendation Ten 280

In addition, only a portion of those with the initial objective of entering
postsecondary education or training appear to achieve this goal. States track
core outcome achievement through follow-up surveys or through matching data
with other sources (e.g., workforce data systems). Therefore, differences in
their outcomes may stem from differential success in obtaining follow-up data
for participants in adult education programs.
The American Council on Education (ACE), which owns and administers the
GED, is in the midst of several changes that aim to improve GED attainment
and further connect adult learners with postsecondary education and career
opportunities. For example, the test will transition to a computer-based platform
by 2013. ACE also recently announced the development of a new GED test to
be introduced in 2014 that will align with the Common Core State Standards.
Three indicators are presented for this recommendation:
• Educational attainment for adults ages 25 to 34;
• Adults ages 25 to 34 with no high school diploma who attain a GED; and
• Enrollment of nontraditional students in postsecondary education.
General Findings for This Recommendation• As of 2009, 61.4 percent of adults ages 25 to 34 do not have a college
degree.
• As of 2009, 2.7 percent of adults ages 25 to 34 with no high school diploma
are GED candidates.
• As of 2009, 1.6 percent of adults ages 25 to 34 with no high school diploma
attain a GED.
• As of 2007, 6.9 percent of adults ages 25 to 34 are enrolled in
undergraduate study at postsecondary institutions in the United States.
completionagenda.collegeboard.org281

Educational Attainment for Adults Ages 25 to 34What is this measure, and why is this measure important? This measure
provides insight into the challenges and opportunities for increasing educational
attainment among adults ages 25 to 34 in states and across the nation as a
whole. The population without a college degree is composed of several groups
— individuals without a high school diploma (or its equivalent), individuals with
a high school diploma (or its equivalent) who have not attended college and
individuals with some college but who have not earned a degree. This measure
illustrates why states need to differentiate their strategies for increasing
educational attainment, as the needs of the fi rst group are substantially different
from those of the last group.
What are the policy issues associated with this measure? The composition
of young adults who have yet to earn a college degree differs across states
based on race/ethnicity, educational progress, socioeconomic status and a
variety of other factors. In order to raise educational attainment, states need
to implement different policies and approaches, depending on which specifi c
populations they need to target. For example, as refl ected in the eight-year
graduation rates in Recommendation Nine and enrollment in undergraduate
education in the fi nal indicator of this chapter, a portion of young adults with
some college are on the verge of earning a degree. However, others have exited
postsecondary education altogether.
States should consider the fi nancial challenges that young adults face when
pursuing educational opportunities in order to better understand how this age
group pays for college and what incentives might be provided to institutions,
individuals or employers to help support state and national educational
attainment goals.
Where are we now? As of 2009, 61.3 percent of adults ages 25 to 34 in the
United States do not have a college degree. Specifi cally, 13.4 percent do not
have a high school diploma (or its equivalent), 26.0 percent have a high school
diploma (or its equivalent) but have not attended college, 21.9 percent have
some college but no degree, and 38.6 percent have an associate degree or
higher (Figure 10.1a). About 69.1 percent of Asian and 48.7 percent of white
young adults have earned an associate degree or higher, compared to only 29.4
percent of African American and 19.2 percent of Hispanic young adults (Figure
10.1b). In addition, young Hispanic adults have the highest percentage without a
high school diploma (or its equivalent).
61.3% As of 2009, 61.3 percent of adults ages 25 to 34 do not have a college degree.
1.0ppts 2008–2009
completionagenda.collegeboard.org Recommendation Ten 282

National Educational Attainment of Adults Ages 25–34, 2009Source: U.S. Census Bureau, 2005–2009 American Community Survey Five-Year Estimates
National Educational Attainment of Adults Ages 25–34 by Race/Ethnicity, 2009Source: U.S. Census Bureau, Current Population Survey, 2009
10.1a
10.1b
0
10
20
30
40
50
60
70
80
Less Than aHigh School
Diploma
Only aHigh SchoolDiploma butNo College
Some Collegebut NoDegree
AssociateDegree
or Higher
13.4%
26.0%21.9%
38.6%
0
10
20
30
40
50
60
70
80
AsianAfrican American Hispanic White
4.8%
14.2
%
11.9
%
69.1
%
11.0
%
35.6
%
24.0
%29.4
%
33.7
%
32.3
%
14.8
%
19.2
%
5.2%
26.2
%
20.0
%
48.7
%
Associate Degree or Higher
Some College but No Degree
Only a High School Diploma but No College
Less Than a High School Diploma
completionagenda.collegeboard.org283
New fi gure
When disaggregated by state, the percentage of adults ages 25 to 34 with less
than a high school diploma (or its equivalent) ranges from 4.0 percent in North
Dakota to 19.5 percent in Texas (Figure 10.1c). When placed in rank order, the
states with the lowest percentage of adults ages 25 to 34 without a high school
diploma (or its equivalent) are North Dakota, Hawaii, Maine, Vermont and New
Hampshire. The states with the highest percentage of adults ages 25 to 34
without a high school diploma (or its equivalent) are Texas, California, Nevada,
Arizona and New Mexico.
When disaggregated by state, the percentage of adults ages 25 to 34 with a
high school diploma (or its equivalent) but no college ranges from 15.6 in the
District of Columbia to 37.9 percent in West Virginia (Figure 10.1d). When placed
in rank order, the states with the lowest percentage of adults ages 25 to 34
with a high school diploma (or its equivalent) but no college are the District of
Columbia, Minnesota, Nebraska, Massachusetts and Colorado. The states with
the highest percentage of adults ages 25 to 34 with a high school diploma (or
its equivalent) but no college are West Virginia, Arkansas, Maine, Tennessee
and Louisiana.
When disaggregated by state, the percentage of adults ages 25 to 34 with
some college but no degree ranges from 12.1 percent in the District of
Columbia to 31.5 in Alaska (Figure 10.1e). When placed in rank order, the states
with the lowest percentage of adults ages 25 to 34 with some college but
no degree are the District of Columbia, Massachusetts, New York, Vermont
and Pennsylvania. The states with the highest percentage of adults ages 25
to 34 with some college but no degree are Alaska, Wyoming, Idaho, Utah
and New Mexico.
When interpreting this measure, what should be kept in mind? Methodological differences between the U.S. Census Bureau’s Current
Population Survey (CPS) and the American Community Survey (ACS) result in
slightly different estimates of college degree attainment between this indicator
and that presented in Figure D of the overview. Both surveys are subject to
sampling errors, which should be considered when interpreting estimates.
Compared to the one- and three-year ACS estimates, the fi ve-year ACS estimates
show the lowest margin of error. Estimates by race/ethnicity in Figure 10.1b are
from CPS data, as they are not available by race/ethnicity in the ACS. Finally,
“high school diploma” includes high school graduates as well as those who
earned a GED or alternative high school equivalency certifi cate.
completionagenda.collegeboard.org Recommendation Ten 284

Percentage of Adults Ages 25–34 with Less Than a High School Diploma by State Rank, 2009Source: U.S. Census Bureau, 2005–2009 American Community Survey Five-Year Estimates
10.1c
0 10 20 30 40 50 60 70 80 90 100
4.0%
5.1%
6.1%
6.7%
6.9%
7.2%
7.5%
7.7%
7.7%
7.8%
8.2%
8.3%
8.4%
8.8%
8.9%
9.2%
9.7%
9.9%
10.3%
10.4%
10.4%
10.5%
10.7%
10.9%
11.2%
11.3%
11.3%
11.3%
11.8%
11.8%
11.9%
11.9%
12.6%
12.8%
12.8%
12.9%
13.1%
13.4%
13.6%
13.9%
14.2%
14.4%
14.9%
15.2%
15.2%
16.1%
16.9%
17.2%
17.6%
18.1%
18.4%
19.5%
North Dakota
Hawaii
Maine
Vermont
New Hampshire
Minnesota
South Dakota
Alaska
Montana
Massachusetts
Iowa
District of Columbia
Wyoming
Pennsylvania
Wisconsin
Connecticut
Utah
Nebraska
New Jersey
Virginia
Ohio
Maryland
Michigan
Kansas
West Virginia
Missouri
Delaware
Washington
Idaho
Illinois
Rhode Island
New York
Indiana
Oregon
Kentucky
Tennessee
Colorado
UNITED STATES
Florida
Oklahoma
Arkansas
South Carolina
North Carolina
Georgia
Louisiana
Alabama
Mississippi
New Mexico
Arizona
Nevada
California
Texas
37
U.S. Average
14
States
States
AVG
13.4%
completionagenda.collegeboard.org285

Percentage of Adults Ages 25–34 with Only a High School Diploma but No College by State Rank, 2009Source: U.S. Census Bureau, 2005–2009 American Community Survey Five-Year Estimates
10.1d
0 10 20 30 40 50 60 70 80 90 100
15.6%
20.8%
21.1%
21.9%
22.5%
22.5%
22.6%
22.6%
23.0%
23.1%
23.5%
24.1%
24.2%
24.3%
24.4%
24.6%
24.9%
24.9%
25.1%
25.9%
25.9%
26.0%
26.0%
27.1%
27.2%
27.3%
27.3%
27.5%
27.7%
27.8%
27.9%
28.0%
28.0%
28.4%
28.7%
28.8%
29.0%
29.2%
29.3%
29.4%
29.5%
29.7%
29.9%
30.1%
30.2%
30.6%
31.7%
32.0%
32.2%
32.4%
33.3%
37.9%
District of Columbia
Minnesota
Nebraska
Massachusetts
Colorado
North Dakota
California
New York
Washington
Maryland
Illinois
Oregon
Iowa
Kansas
Virginia
North Carolina
Utah
Rhode Island
New Jersey
Arizona
Connecticut
UNITED STATES
Texas
Michigan
Georgia
Wisconsin
South Dakota
New Hampshire
Missouri
Montana
New Mexico
Delaware
Idaho
Alabama
Florida
Mississippi
Indiana
South Carolina
Hawaii
Wyoming
Nevada
Ohio
Pennsylvania
Oklahoma
Alaska
Vermont
Kentucky
Louisiana
Tennessee
Maine
Arkansas
West Virginia
21
U.S. Average
30
States
States
AVG
26.0%
completionagenda.collegeboard.org Recommendation Ten 286

Percentage of Adults Ages 25–34 with Some College but No Degree by State Rank, 2009Source: U.S. Census Bureau, 2005-2009 American Community Survey Five-Year Estimates
10.1e
0 10 20 30 40 50 60 70 80 90 100
12.1%
16.4%
16.6%
18.0%
18.0%
18.2%
19.2%
19.4%
19.9%
20.9%
21.1%
21.1%
21.3%
21.3%
21.6%
21.7%
21.8%
21.9%
21.9%
22.1%
22.4%
22.6%
22.7%
23.0%
23.0%
23.0%
23.1%
23.1%
23.4%
23.5%
23.6%
23.6%
23.8%
23.9%
24.0%
24.2%
24.3%
24.3%
24.5%
24.6%
24.6%
24.9%
25.0%
25.0%
26.0%
26.0%
26.2%
26.3%
27.2%
28.0%
28.4%
31.5%
District of Columbia
Massachusetts
New York
Vermont
Pennsylvania
New Jersey
Connecticut
New Hampshire
Rhode Island
Illinois
Maryland
Virginia
Florida
Delaware
California
Georgia
South Carolina
West Virginia
UNITED STATES
Colorado
Minnesota
Tennessee
North Carolina
South Dakota
Ohio
Iowa
Wisconsin
Texas
Missouri
Indiana
Kentucky
Mississippi
Maine
Louisiana
Washington
Arizona
Nevada
Alabama
Kansas
Arkansas
Hawaii
Oklahoma
North Dakota
Nebraska
Montana
Oregon
Michigan
New Mexico
Utah
Idaho
Wyoming
Alaska
18
U.S. Average
33
States
States
AVG
21.9%
completionagenda.collegeboard.org287

Adults Ages 25 to 34 with No High School Diploma Who Attain a GEDWhat is this measure, and why is this measure important? One of the
primary focuses of most adult basic education programs is helping individuals
earn a high school equivalency certifi cate or GED. The GED provides a path
to certify high-school-level academic knowledge and skills attainment, which
can open the door to better job opportunities and/or postsecondary education.
Adults ages 25 to 34 may choose to pursue a GED for a variety of reasons,
including but not limited to having dropped out of high school or failed to
pass required state assessments that lead to a standard high school diploma,
immigration, home schooling, the desire to improve job prospects and so forth.
As shown in the previous indicator, on the path to college degree attainment,
earning a high school equivalency certifi cate represents the fi rst hurdle that
must be overcome for roughly one in eight adults ages 25 to 34. This measure
is important because it helps states understand the degree to which this group
of young adults is taking steps to improve their educational attainment. It
shows the proportion of the target population who are attempting a GED and
earning a GED.
What are the policy issues associated with this measure? A high school
diploma or its equivalent provides a foundation for basic job skills, but in order
to create a highly qualifi ed workforce, states should strive to help young adults
use a high school diploma or GED attainment as a launching point for further
education and training as opposed to an endpoint of an educational journey.
States should develop or enhance outreach programs to target segments of
the population who have not yet earned a high school credential and examine
existing policies and programs to identify potential barriers to participation in
adult basic education programs. Although there is a need to increase access
across states, it is also clear that many states need to develop strategies to
improve pass rates for young adults who are already accessing basic adult
education services.
Where are we now? As of 2009, 2.7 percent of adults ages 25 to 34 with no
high school diploma are GED candidates (Figure 10.2a). When disaggregated by
state, the percentage of young adults with no high school diploma who are GED
candidates ranges from 1.4 percent in California to 8.8 percent in Maine (Figure
10.2b). When placed in rank order, the states with the highest percentage of
adults ages 25 to 34 with no high school diploma who are GED candidates are
Maine, North Dakota, Wisconsin, Wyoming and Montana. The states with the
lowest percentage are California, Kansas, Texas, Delaware and Nevada.
2.7% As of 2009, 2.7 percent of adults ages 25 to 34 with no high school diploma are GED candidates.
2008–2009
1.6% As of 2009, 1.6 percent of adults ages 25 to 34 with no high school diploma attain a GED.
2008–2009
completionagenda.collegeboard.org Recommendation Ten 288

As of 2009, 1.6 percent of adults ages 25 to 34 with no high school diploma
attained a GED (Figure 10.2c). When disaggregated by state, the percentage
of young adults with no high school diploma who attain a GED ranges from
0.8 percent in California to 4.7 percent in North Dakota (Figure 10.2d). When
placed in rank order, the states with the highest percentage of adults ages 25
to 34 with no high school diploma who attain a GED are North Dakota, Maine,
Wyoming, Montana and West Virginia. The states with the lowest percentage
are California, Texas, the District of Columbia, Maryland and Rhode Island.
When interpreting this measure, what should be kept in mind? The GED
test battery is composed of fi ve separate assessments in reading, writing,
mathematics, science and the social sciences. To earn a GED, a test-taker
must earn a minimum passing score within each content area and surpass a
minimum total score across the fi ve areas. Passing scores are set by individual
states. ACE defi nes a “candidate” as any individual who attempts at least
one of the fi ve tests. The test-taker must neither fi nish a test nor achieve the
minimum score in order to be included as a candidate. “Completers” are
defi ned as those who test in all fi ve content areas, and “passers” have met the
requirements set forth by their state and are awarded a GED. Completion and
pass rates vary by state. Figure 10.2a focuses on candidates in order to show
the proportion of state’s target population who are taking the fi rst step toward
a GED. Figure 10.2b focuses on passers in order to show the proportion of the
target population that achieves the goal of a GED. Comparable information for
completers is not presented in the ACE annual statistical reports.
Estimates of the number of adults ages 25 to 34 with no high school diploma
are from the fi ve-year American Community Survey data, as it contains the
lowest margin of error of the three options available from the U.S. Census
Bureau. Thus, the same denominator is used for all years included in this
indicator. Although it is unlikely that the actual number of adults without a
high school diploma in this age range remained exactly stable, the size of the
margin of error in the one-year estimates relative to the size of the population
of adults in the same age range attempting or earning a GED is of concern.
State-level ranked data in particular should be interpreted with caution, as the
margin of error in estimating the size of the target population of interest is, for
some states, nearly as large as the estimate of the number of adults ages 25
to 34 attempting or earning a GED. However, both the raw numbers and the
calculated estimates suggest that for the vast majority of states, only a small
portion of adults without a high school diploma are taking the fi rst step toward
becoming eligible for entry into postsecondary education.
completionagenda.collegeboard.org289

National Percentage of Adults Ages 25–34 with No High School Diploma Who Were GED Candidates, 2005–2009Source: U.S. Census Bureau, 2005–2009 American Community Survey Five-Year Estimates; American Council on Education 2005–2009 Annual Statistical Reports
10.2a
0
10
20
30
40
50
60
70
80
2005 2006 2007 2008 2009
2.5% 2.5% 2.7% 2.7%2.4%
Updated data source
completionagenda.collegeboard.org Recommendation Ten 290

Percentage of Adults Ages 25–34 with No High School Diploma Who Were GED Candidates by State Rank, 2009Source: U.S. Census Bureau, 2005–2009 American Community Survey Five-Year Estimates; American Council on Education 2009 Annual Statistical Report
10.2b
0 10 20 30 40 50 60 70 80 90 100
8.8%
8.7%
7.7%
6.9%
6.8%
6.4%
5.7%
5.6%
5.1%
5.1%
5.0%
4.9%
4.9%
4.8%
4.7%
4.6%
4.6%
4.2%
4.2%
3.9%
3.9%
3.8%
3.8%
3.8%
3.7%
3.7%
3.7%
3.7%
3.6%
3.6%
3.3%
3.2%
3.2%
3.2%
3.2%
3.1%
3.0%
3.0%
2.9%
2.8%
2.7%
2.7%
2.7%
2.3%
2.3%
2.2%
2.2%
2.2%
1.9%
1.9%
1.8%
1.4%
Maine
North Dakota
Wisconsin
Wyoming
Montana
Alaska
Minnesota
South Dakota
New Hampshire
Washington
Iowa
Mississippi
Idaho
Oregon
Nebraska
West Virginia
Virginia
Pennsylvania
Colorado
New Mexico
North Carolina
Ohio
Connecticut
New York
Tennessee
Massachusetts
Michigan
Georgia
Kentucky
Vermont
Utah
Missouri
Oklahoma
Illinois
Rhode Island
Alabama
Arkansas
Indiana
Hawaii
New Jersey
Arizona
Florida
UNITED STATES
South Carolina
Louisiana
Maryland
District of Columbia
Nevada
Delaware
Texas
Kansas
California
AVG
2.7%
42
U.S. Average
9
States
States
Updated data source
completionagenda.collegeboard.org291

National Percentage of Adults Ages 25–34 with No High School Diploma Who Attained a GED, 2005–2009Source: U.S. Census Bureau, 2005–2009 American Community Survey Five-Year Estimates; American Council on Education 2005–2009 Annual Statistical Reports
10.2c
2005 2006 2007 2008 2009
0
10
20
30
40
50
60
70
80
1.3% 1.5% 1.6% 1.6%1.4%
Updated data source
completionagenda.collegeboard.org Recommendation Ten 292

Percentage of Adults Ages 25–34 with No High School Diploma Who Attained a GED by State Rank, 2009Source: U.S. Census Bureau, 2005–2009 American Community Survey Five-Year Estimates; American Council on Education 2009 Annual Statistical Report
10.2d
0 10 20 30 40 50 60 70 80 90 100
4.7%
4.7%
4.4%
3.5%
3.3%
3.3%
3.2%
3.0%
3.0%
3.0%
2.9%
2.8%
2.8%
2.7%
2.7%
2.6%
2.6%
2.4%
2.4%
2.4%
2.3%
2.3%
2.2%
2.2%
2.2%
2.2%
2.2%
2.1%
1.9%
1.9%
1.9%
1.8%
1.8%
1.8%
1.8%
1.8%
1.7%
1.7%
1.7%
1.6%
1.6%
1.6%
1.6%
1.6%
1.6%
1.6%
1.5%
1.2%
1.2%
1.2%
1.1%
0.8%
North Dakota
Maine
Wyoming
Montana
West Virginia
Alaska
Wisconsin
Minnesota
New Hampshire
Iowa
South Dakota
Ohio
Kentucky
Oregon
Idaho
Virginia
Tennessee
Missouri
Washington
Mississippi
Utah
Arkansas
Pennsylvania
Colorado
Oklahoma
Indiana
Nebraska
New Mexico
Georgia
North Carolina
Massachusetts
Hawaii
Alabama
Michigan
New York
Connecticut
Delaware
New Jersey
Illinois
UNITED STATES
Florida
Arizona
Kansas
Vermont
South Carolina
Louisiana
Nevada
Rhode Island
Maryland
District of Columbia
Texas
California
AVG
1.6%
39
U.S. Average
12
States
States
Updated data source
completionagenda.collegeboard.org293

Enrollment of Nontraditional Students in Postsecondary EducationWhat is this measure, and why is this measure important? This measure
examines the percentage of nontraditional students ages 25 to 34 seeking
undergraduate postsecondary education. It provides insight into the immediate
potential for increasing the college-degree attainment outcomes discussed
earlier in this chapter and in the overall goal. Young adults enrolled in
undergraduate postsecondary education may fall into one of several categories:
students who enroll immediately after high school and have not yet completed
their degrees; students who entered higher education at a later, nontraditional
time; or students who are returning to school for additional study after earning a
prior associate or bachelor’s degree.
Alternatively, one could examine the ratio of the number of young adults
enrolled in undergraduate postsecondary education to the number of young
adults without a high school diploma, to the number of young adults with some
college but no degree, or to some combination thereof. These alternatives
cannot be interpreted directly as percentages, since we have no knowledge
of the educational background of the young adults enrolled in undergraduate
studies. The results of the current indicator can be interpreted in a more
straightforward manner.
What are the policy issues associated with this measure? Young adults
ages 25 to 34 are a crucial part of the adult education community. Pursuing
further education in early adulthood affords the learner decades of economic
stability and opportunity. Chances for nontraditional students to train and
retrain are imperative for upward mobility and for meeting the needs of a
changing economy.
Where are we now? As of 2007, 6.9 percent of adults ages 25 to 34 are
enrolled in undergraduate study at postsecondary institutions in the United
States (Figure 10.3a). When disaggregated by state, the percentage of young
adults enrolling in undergraduate study ranges from 4.2 percent in New
Hampshire to 15.7 percent in Arizona (Figure 10.3b). When placed in rank
order, the states with the highest percentage of young adults ages 25 to 34
enrolling in undergraduate study are Arizona, District of Columbia, Iowa, Utah
and New Mexico. The states with the lowest percentage are New Hampshire,
Pennsylvania, South Carolina, Massachusetts and Connecticut.
6.9% As of 2007, 6.9 percent of adults ages 25 to 34 are enrolled in undergraduate study at postsecondary institutions in the United States.
Updated data source
completionagenda.collegeboard.org Recommendation Ten 294

When interpreting this measure, what should be kept in mind? Many students attend college in a state other than their home state. Thus,
the numerator in this indicator may be composed of both in-state and out-
of-state students, while the denominator may refl ect mostly state residents.
It is possible that adult undergraduate students are more likely to be state
residents, but this should be considered when interpreting state-level
outcomes of this measure. In addition, the growth of online educational
programs, which tend to attract nontraditional aged students, may skew the
results for certain states. For example, several large online institutions are
based in Arizona. The proportion of young adults in Arizona’s undergraduate
enrollment who are state residents is unknown.
Some caution is warranted in interpreting trends associated with this measure,
given the margin of error in calculating the 25- to 34-year-old population with the
American Community Survey’s one-year estimates. Figure 10.3a is based on the
one-year ACS population estimates. Figure 10.3b is based on the fi ve-year ACS
estimates in order to reduce the margin of error in the population estimates,
which is of concern in some states. Lastly, institutions are required to report
enrollment by age to IPEDS every other survey year.
National Percentage of Adults Ages 25–34 Enrolled in Postsecondary Education, 2003–2007Source: NCES IPEDS Enrollment Survey, 2003–2007; U.S. Census Bureau, 2003–2007 American Community Survey One-Year-Estimates
10.3a
0
10
20
30
40
50
60
70
80
2003 2005 2007
6.9% 6.9%6.7%
Updated data source
completionagenda.collegeboard.org295

Percentage of Adults Ages 25–34 Enrolled in Postsecondary Education, 2007Source: NCES IPEDS Enrollment Survey, 2007; U.S. Census Bureau, 2005–2009 American Community Survey Five-Year Estimates
10.3b
0 10 20 30 40 50 60 70 80 90 100
15.7%
13.5%
11.2%
10.1%
9.9%
8.4%
8.3%
8.1%
7.9%
7.7%
7.7%
7.6%
7.4%
7.4%
7.2%
7.2%
7.2%
7.2%
7.1%
7.0%
6.9%
6.9%
6.7%
6.7%
6.7%
6.7%
6.6%
6.6%
6.6%
6.4%
6.4%
6.3%
6.2%
6.2%
6.2%
6.1%
6.0%
6.0%
6.0%
5.8%
5.7%
5.6%
5.5%
5.5%
5.3%
5.3%
5.3%
5.1%
4.9%
4.8%
4.8%
4.2%
Arizona
District of Columbia
Iowa
Utah
New Mexico
West Virginia
North Dakota
California
Colorado
Oklahoma
Wyoming
Michigan
Nebraska
South Dakota
Florida
Kansas
Illinois
Kentucky
Oregon
Missouri
Minnesota
UNITED STATES
Wisconsin
Indiana
Idaho
Alabama
Alaska
Ohio
Washington
Arkansas
Nevada
Hawaii
Mississippi
Maryland
Montana
Texas
Virginia
Rhode Island
Maine
Louisiana
North Carolina
Tennessee
Delaware
New York
New Jersey
Georgia
Vermont
Connecticut
Massachusetts
South Carolina
Pennsylvania
New Hampshire
AVG
6.9%
21
U.S. Average
30
States
States
Updated data source
completionagenda.collegeboard.org Recommendation Ten 296
Overall Goal of the CommissionINDICATORS: 25- to 64-Year-Olds, 25- to 34-Year-Olds or 55- to 64-Year-Olds with an Associate Degree or Higher
CalculationAs reported in Table A1.3a.
Sources/LinksOrganisation for Economic Co-operation and Development,
Education at a Glance, 2010.
www.oecd.org/edu/eag2010
http://www.oecd.org/dataoecd/44/30/45931991.pdf
Data Availability/DiscussionData are gathered and reported annually by the OECD, a membership
organization dedicated to global development. Based on the 2010 publication,
OECD’s 31 member countries and fi ve partners, including Brazil, Estonia, Israel,
Russian Federation and Slovenia, are included in the rankings. Since this time,
Estonia, Israel and Slovenia have become OECD members. In addition, OECD
has begun working with China, India, Indonesia and South Africa, which may
lead to membership in future years. Russian Federation data are from 2002,
thus some caution is warranted in interpreting these data.
The International Standard Classifi cation of Education (ISCED-97) is used
to defi ne the levels of education. OECD does not count two-year academic
associate degree programs in the United States’ calculation, as these degrees
are considered intermediate degrees. Data for the United States came from
the March 2009 Current Population Survey.
Data Sources/Related LinksU.S. Census Bureau, Current Population Survey, 2009.
http://www.census.gov/hhes/socdemo/education/data/cps/index.html
AppendixData Book

completionagenda.collegeboard.org
INDICATOR: Percentage of 25- to 34-Year-Olds with an Associate Degree or Higher in the United States, 2000–2009; Projections Through 2025
CalculationNumerator: Number of adults in age range with an associate, bachelor’s,
master’s, doctoral or professional degree, in the nation.
Denominator: Number of adults in age range, in the nation.
2000–2009 values are real values; 2010–2025 Current Path projections
were calculated using linear path projections; (y=0.331x+37.7) with R2=0.796;
2010–2025 are the average gains required to reach 55 percent. The nation would
need to increase 13.9 percent between 2009 and 2025 to hit the goal of 55
percent. This would require an average increase of 0.86875 percent each year.
Sources/LinksU.S. Census Bureau, Current Population Survey, 2000–2009.
http://www.census.gov/hhes/socdemo/education/data/cps/index.html
Data Availability/DiscussionData are gathered and reported annually. These calculations include academic
and vocational/occupational associate degrees.
Data Sources/Related LinksN/A
INDICATOR: Adults with an Associate Degree or Higher in the United States
CalculationNumerator: Number of adults in age range with an associate, bachelor’s,
master’s, doctoral or professional degree, in the nation and by race/ethnicity.
Denominator: Number of adults in the age range, in the nation and by race/
ethnicity.
Sources/LinksU.S. Census Bureau, Current Population Survey, 2000–2009.
http://www.census.gov/hhes/socdemo/education/data/cps/index.html
Data Availability/DiscussionData are gathered and reported annually. These calculations include academic
and vocational/occupational associate degrees.
Data Sources/Related LinksN/A
Appendix 298

completionagenda.collegeboard.org
INDICATOR: Adults with an Associate Degree or Higher by State Rank
CalculationNational data: As reported in Overall Goal (Figure D).
State numerator: Number of male and female adults ages 25 to 34 with an
associate, bachelor’s, graduate or professional degree.
State denominator: Number of male and female adults ages 25 to 34.
Sources/LinksNational data: U.S. Census Bureau, Current Population Survey, 2009.
http://www.census.gov/hhes/socdemo/education/data/cps/2009/tables.html
State data: U.S. Census Bureau, 2009 American Community Survey,
Table B15001
http://factfi nder.census.gov/servlet/DatasetMainPageServlet?_program=ACS&_
submenuId=&_lang=en&_ts=
Data Availability/DiscussionData are gathered and reported annually. State-level data are available only
through the American Community Survey (ACS). National data are from the
Current Population Survey (CPS) and thus refl ect what is presented in previous
indicators. The fact sheet linked below outlines differences between the two
survey estimates.
Data Sources/Related Linkshttp://www.census.gov/hhes/socdemo/education/
http://www.census.gov/hhes/socdemo/education/data/factsheet.html
Recommendation One: Provide a program of voluntary preschool education, universally available to children from low-income families
INDICATOR: 3- and 4-Year-Olds Enrolled in Preschool orKindergarten Programs
CalculationAs reported in the United States Education Dashboard table.
Sources/LinksU.S. Census Bureau, 2006–2008 American Community Survey (ACS) Three-Year
Public Use Microdata Sample (PUMS) Data.
http://dashboard.ed.gov/statecomparison.aspx?i=a&id=0&wt=44
299

completionagenda.collegeboard.org
Data Availability/DiscussionData are gathered and reported annually. ACS three-year estimates are
based on larger sample sizes, which reduce sampling error. The smaller margin
of error results in more stable estimates. Race categories exclude persons of
Hispanic ethnicity.
Data Sources/Related LinksU.S. Census Bureau, 2006–2008 American Community Survey Three-Year
Estimates.
http://factfi nder.census.gov/servlet/DatasetMainPageServlet?_program=ACS&_
submenuId=&_lang=en&_ts=
INDICATOR: 3- and 4-Year-Olds Enrolled in State-Funded Pre-K Programs
CalculationAs reported in Table 2.
Sources/LinksNational Institute for Early Education Research, Rutgers Graduate School of
Education, The State of Preschool, 2009.
http://nieer.org/yearbook2009/
Data Availability/DiscussionAnnual state preschool yearbooks are available from 2003 to the present.
The number enrolled in preschool came from surveys of state preschool
administrators. The number of 3- and 4-year-olds in each state was obtained
from the U.S. Census Bureau’s July Population Estimates.
Data Sources/Related LinksU.S. Census Bureau July Population Estimates, State Population Datasets.
http://www.census.gov/popest/datasets.html
INDICATOR: 3- and 4-Year-Olds Enrolled in Head Start Programs
CalculationNumerator: Number of 3- and/or 4-year-olds enrolled in state-funded federal
Head Start (program year 2008–2009) reported in Appendix B.
Denominator: Number of 3- and/or 4-year-olds reported in Appendix D.
Sources/LinksNational Institute for Early Education Research, Rutgers Graduate School of
Education, The State of Preschool (Appendix B and D), 2009.
http://nieer.org/yearbook2009/
Data Availability/DiscussionState preschool yearbooks are available from 2003 to the present. The number
enrolled in Head Start came from the Administration for Children and Families
(ACF), the Head Start Bureau of the U.S. Department of Health and Human
Services, Head Start State Collaboration Offi ces, and Head Start Program
Information Reports (PIR). The number of 3- and 4-year-olds in each state
was obtained from the U.S. Census Bureau’s July Population Estimates.
Appendix 300

completionagenda.collegeboard.org
Data Sources/Related LinksU.S. Census Bureau July Population Estimates, State Population Datasets.
http://www.census.gov/popest/datasets.html
Recommendation Two: Improve middle and high school counseling
INDICATOR: Student-to-Counselor Ratio
CalculationNumerator: Number of students aggregated by state.
Denominator: Number of school counselors aggregated by state.
Sources/LinksNational Center for Education Statistics, Common Core of Data, State Nonfi scal
Survey of Public Elementary/Secondary Education, 1998–2009.
http://nces.ed.gov/ccd/ccddata.asp
Data Availability/DiscussionData are gathered and reported annually and are available from 1987
to the present.
Data Sources/Related LinksAmerican Counseling Association
http://www.counseling.org/publicpolicy/
INDICATOR: Student-to-College Counselor Ratio by School Type
CalculationMean number of students per college counselor, as reported in “School
Counselors and College Counseling” chapter (e.g., Table 23 in 2010).
Sources/LinksNational Association for College Admission Counseling, State of College
Admission, 2006–2010.
http://www.nacacnet.org/PublicationsResources/Marketplace/research/Pages/
StateofCollegeAdmission.aspx
Data Availability/DiscussionData are gathered and reported annually. The data came from the 2005–2009
Counseling Trends Surveys, NACAC’s Annual Survey of Secondary School
Counselors and counseling departments.
Data Sources/Related LinksN/A
301

completionagenda.collegeboard.org
INDICATOR: States with Comprehensive School Counseling Programs
CalculationNumerator: Number of states listed on Web page, including the District of
Columbia.
Denominator: Count of 50 states plus the District of Columbia.
Sources/LinksAmerican School Counselor Association, 2011.
http://www.schoolcounselor.org/content.asp?pl=325&sl=133&contentid=280
Data Availability/DiscussionThe defi nition of “State Comprehensive School Counseling Program” can
vary from state to state. It generally means that a state has a pre-K–12 plan
or framework in place that provides a structured program and guidelines
for school counselors so they can work with all students on career, academic
and personal/social development.
Data Sources/Related LinksN/A
INDICATOR: Secondary Schools That Require Professional Development or Cover All Professional Development Costs by School Type
CalculationAs reported in “School Counselors and College Counseling” chapter
(e.g., Table 27 in 2010).
Sources/LinksNational Association for College Admission Counseling, State of College
Admission, 2007–2010.
http://www.nacacnet.org/PublicationsResources/Marketplace/research/Pages/
StateofCollegeAdmission.aspx
Data Availability/DiscussionData are gathered and reported annually. The data came from the 2006–2009
Counseling Trends Surveys, NACAC’s Annual Survey of Secondary School
Counselors and counseling departments.
Data Sources/Related LinksN/A
Appendix 302

completionagenda.collegeboard.org
INDICATOR: Counselors’ Time Spent on Postsecondary Admission Counseling or Other Tasks by School Type
CalculationAs reported in “School Counselors and College Counseling” chapter (e.g., Table
26 in 2010).
Sources/LinksNational Association for College Admission Counseling, State of College
Admission, 2005–2010.
http://www.nacacnet.org/PublicationsResources/Marketplace/research/Pages/
StateofCollegeAdmission.aspx
Data Availability/DiscussionData are gathered and reported annually. The data came from the 2004–2009
Counseling Trends Survey, NACAC’s Annual Survey of Secondary School
Counselors and counseling departments.
Data Sources/Related LinksN/A
Recommendation Three: Implement the best research-based dropout prevention programs
INDICATOR: Average Graduation Rates for Public High School Students
CalculationNational average: As reported in Table 3.
By race/ethnicity: As reported in Table 2.
By state rank: As reported in Table 1.
Sources/LinksStillwell, R. (2010). Public School Graduates and Dropouts From the Common
Core of Data: School Year 2007–08 (NCES 2010-341). National Center for
Education Statistics. Washington, D.C.
http://nces.ed.gov/pubs2010/2010341.pdf
Race/ethnicity data for prior years:
http://nces.ed.gov/ccd/tables/2010313_02.asp (2006–07)
http://nces.ed.gov/ccd/tables/2008353_02.asp (2005–06)
303
completionagenda.collegeboard.org
Data Availability/DiscussionData are gathered and reported annually. The Common Core of Data is the
primary national statistical database of public elementary and secondary
schools in the United States.
The Averaged Freshman Graduation Rate is the number of regular diploma
recipients in a given year divided by the average of the membership in grades
eight, nine and 10, reported fi ve, four and three years earlier, respectively.
Data Sources/Related LinksNational Center for Education Statistics, Common Core of Data.
http://nces.ed.gov/ccd/index.asp
INDICATOR: States with Exit Examinations
CalculationStates with exit examinations: Compiled by the College Board.
States where end-of-course exams are used as the exit exam: Compiled
by the College Board.
States with reciprocity with other states’ exit exams: Compiled by the
College Board.
States with substitute assessments: Compiled by the College Board.
States with alternative diploma or certifi cate: Compiled by the College Board.
Sources/LinksEducation Commission of the States, 2010.
http://mb2.ecs.org/reports/Report.aspx?id=1357
Data Availability/DiscussionData are reported annually.
Data Sources/Related LinksEducation Commission of the States, 2010.
http://www.ecs.org
INDICATOR: Status Dropout Rates for the Nation and by Race/Ethnicity, Gender and Age — Excluding Institutional Populations
CalculationNational: As reported in Table A-19-1 in The Condition of Education.
By race/ethnicity, gender and age: As reported in Table 6 (Chapman, Laird, and
KewalRamani, 2010).
Appendix 304

completionagenda.collegeboard.org
Sources/LinksNational Center for Education Statistics, The Condition of Education, 2010.
http://nces.ed.gov/pubs2010/2010028_7.pdf
Chapman, C., Laird, J., and KewalRamani, A. (2010). Trends in High School
Dropout and Completion Rates in the United States: 1972–2008 (NCES 2011–
2012). National Center for Education Statistics. Washington, D.C.
http://nces.ed.gov/pubs2011/2011012.pdf
Data Availability/DiscussionData are gathered and reported annually. Status dropout rates refl ect the
percentage of 16- to 24-year-olds who are not enrolled in high school and who
have not earned a high school credential (either a diploma or GED) at the time
of the survey.
Data Sources/Related LinksU.S. Census Bureau, Current Population Survey, 1999–2008.
http://www.census.gov/hhes/socdemo/education/data/cps/index.html
INDICATOR: Status Dropout Rates for the Nation and by Race/Ethnicity, Gender and Age — Including Institutional Populations
CalculationAs cited in Table A-19-2.
Sources/LinksNational Center for Education Statistics, The Condition of Education, 2010.
http://nces.ed.gov/pubs2010/2010028_7.pdf
Data Availability/DiscussionData are gathered and reported annually. Status dropout rates refl ect the
percentage of 16- to 24-year-olds who are not enrolled in high school and
who have not earned a high school credential (either a diploma or GED).
Institutional populations include incarcerated persons, active duty military
personnel living in barracks and those living in health facilities.
Data Sources/Related LinksU.S. Census Bureau, American Community Survey, 2008.
http://www.census.gov/hhes/socdemo/education/data/cps/index.html
INDICATOR: Event Dropout Rates of Public High School Students in Grades 9–12
CalculationNational: As reported in Table 4 (for 2008) and Table 7 (for 2003–2007).
By race/ethnicity: As reported in Table 6.
By gender: As reported in Table 8.
By state rank: As reported in Table 4.
By grade level: As reported in Table 5.
305
completionagenda.collegeboard.org
Sources/LinksStillwell, R. (2010). Public School Graduates and Dropouts From the Common
Core of Data: School Year 2007–08 (NCES 2010-341). National Center for
Education Statistics. Washington, D.C.
http://nces.ed.gov/pubs2010/2010341.pdf (2008)
http://nces.ed.gov/ccd/tables/2010313_07.asp (2003–2007)
Race/ethnicity data for prior years:
http://nces.ed.gov/ccd/tables/2010313_06.asp (2007)
http://nces.ed.gov/ccd/tables/2008353_06.asp (2006)
Data Availability/DiscussionData are gathered and reported annually. The Common Core of Data is the
primary national statistical database of public elementary and secondary
schools in the United States.
Dropouts are defi ned as individuals who were enrolled in school at some time
during the previous school year, were not enrolled at the beginning of the
following school year, had not graduated from high school or completed an
equivalency program, and did not meet certain exclusionary conditions (e.g.,
transfer, temporary absence due to suspension or death).
Data Sources/Related LinksNational Center for Education Statistics, Common Core of Data.
http://nces.ed.gov/ccd/index.asp
INDICATOR: State Statutory Age When Students Can Legally Drop Out
CalculationState Statutory Age when Students Can Legally Drop Out: As Cited in Table 1.
Sources/LinksEducation Commission of the States, 2010.
http://www.ecs.org/html/educationIssues/StateNotes/2010-StateNotes.pdf
Data Availability/DiscussionData are reported annually.
Data Sources/Related LinksEducation Commission of the States, 2010.
http://www.ecs.org
Appendix 306

completionagenda.collegeboard.org
Recommendation Four: Align the K–12 education system with international standards and college admission expectations
INDICATOR: Public High Schools Offering AP® and/or IB Courses in the Four Core Subject Areas
CalculationNumerator: Number of public high schools in the United States that offer
Advanced Placement Program® courses and/or IB courses in the four core
subject areas: English, mathematics, science and social studies.
Denominator: Number of public high schools in the United States, as
maintained by the College Board.
Sources/LinksThe College Board, 2010.
http://www.collegeboard.com/ap
International Baccalaureate, 2010.
http://www.ibo.org
Data Availability/DiscussionAdvanced Placement data were gathered through the AP course audit and thus
represent the number of schools with approved AP courses in the four subject
areas. The list of IB schools is publicly available on the IBO website, and all
schools that offer the diploma program offer courses in the four subject areas.
Data Sources/Related LinksAP Report to the Nation
CalculationAP Growth: As cited in Figure 1.
Public High School and AP Examinees Student Populations by Race/Ethnicity for
the Class of 2010: As cited in Figure 6.
Public High School AP 3 or Higher Examinee Student Success Rates by Race/
Ethnicity for the Class of 2010: As cited in Figure 9.
Trend AP Participation and Success in STEM by High School Class, 2010: As
cited in Figure 11.
Percentage of Public High School Students Taking an AP Exam, Class of 2010:
As cited in Appendix A.
Percentage of Public High School Students Scoring 3 or Higher on an AP Exam,
Class of 2010: As cited in Appendix A.
AP Equity and Excellence Achieved by African American Students in the Class of
2010: As cited in Figure 10.
307

completionagenda.collegeboard.org
AP Equity and Excellence Achieved by Hispanic Students in the Class of 2010:
As cited in Figure 10.
AP Equity and Excellence Achieved by American Indian or Alaska Native
Students in the Class of 2010: As cited in Figure 10.
Sources/LinksCollege Board, AP Report to the Nation, 2011.
http://apreport.collegeboard.org/
Data Availability/DiscussionData are reported annually.
Data Sources/Related LinksThe College Board
INDICATOR: Schools That Offer and Mean Percentage of Students in Dual Enrollment
CalculationAs reported in Table 19.
Sources/LinksNational Association for College Admission Counseling, State of College
Admission, 2010.
http://www.nacacnet.org/PublicationsResources/Marketplace/research/Pages/
StateofCollegeAdmission.aspx
Data Availability/DiscussionData are gathered and reported annually. The data came from the 2009
Counseling Trends Surveys, NACAC’s Annual Survey of Secondary School
Counselors and counseling departments.
Data Sources/Related LinksN/A
Appendix 308

completionagenda.collegeboard.org
INDICATOR: States with Alignment Between High School Standards or Graduation Requirements and College and Workplace Expectations
CalculationNumerator: Number of states, including the District of Columbia, with alignment
between high school standards or graduation requirements and college and
workplace expectations.
Denominator: Count of 50 states plus the District of Columbia.
Sources/LinksAchieve, Inc., Closing the Expectations Gap — An Annual 50-State Progress
Report on the Alignment of High School Policies with the Demands of College
and Careers, 2010.
http://www.achieve.org/ClosingtheExpectationsGap2010
Data Availability/DiscussionData are gathered and reported annually through Achieve’s Annual Survey of
Policies. The year 2010 marks the fi fth annual Closing the Expectations Gap
report that came out of the American Diploma Project and the 2005 National
Education Summit on High Schools.
Data Sources/Related LinksN/A
INDICATOR: States with College- and Career-Ready Assessment Systems or P–20 Longitudinal Data Systems
CalculationNumerator: Number of states, including the District of Columbia, with college-
and career-ready assessment systems or P–20 longitudinal data systems.
Denominator: Count of 50 states plus the District of Columbia.
Sources/LinksAchieve, Inc., Closing the Expectations Gap — An Annual 50-State Progress
Report on the Alignment of High School Policies with the Demands of College
and Careers, 2010.
http://www.achieve.org/ClosingtheExpectationsGap2010
Data Availability/DiscussionData are gathered and reported annually through Achieve’s Annual Survey of
Policies. The year 2010 marks the fi fth annual Closing the Expectations Gap
report that came out of the American Diploma Project and the 2005 National
Education Summit on High Schools.
Data Sources/Related LinksN/A
309

completionagenda.collegeboard.org
INDICATOR: States That Have Adopted the National Common Core Standards
CalculationNumerator: Number of states that have adopted the National Common
Core Standards.
Denominator: Count of 50 states plus the District of Columbia.
Sources/LinksNational Governors Assocation and Council of Chief State School Offi cers.
http://www.corestandards.org
Data Availability/DiscussionThe National Governors Association Center for Best Practices (NGA Center) and
the Council of Chief State School Offi cers (CCSSO) coordinate the Common
Core State Standards Initiative. The standards are meant to provide a framework
that will prepare children for college and the workforce, and were developed in
collaboration with teachers, school administrators and experts.
Data Sources/Related LinksN/A
INDICATOR: First- and Second-Year Undergraduates in Remedial Courses after High School Graduation by Race/Ethnicity, Gender, Age, Income, Institution Type, Attendance Intensity and Class Level
CalculationAs reported in Table 6.2.
Sources/LinksNational Center for Education Statistics, Profi le of Undergraduate Students:
2007–08, 2010.
http://nces.ed.gov/pubs2010/2010205.pdf
http://nces.ed.gov/das/library/tables_listings/2010205.asp
Data Availability/DiscussionData have been gathered every three to four years since 1986–1987. In
the NPSAS survey, students respond to the question: “Since you completed
high school, have you taken remedial or developmental courses to improve
your basic skills, such as in mathematics, reading, writing or studying?”
This includes courses taken at a current or prior postsecondary institution.
Data Sources/Related LinksNational Center for Education Statistics, 2007–08 National Postsecondary
Student Aid Study (NPSAS:08).
http://nces.ed.gov/surveys/npsas/
Appendix 310

completionagenda.collegeboard.org
Recommendation Five: Improve teacher quality and focus on recruitment and retention
INDICATORS: States with Professional Development Standards; Finance Professional Development for All Districts; Require Districts and/or Schools to Set Aside Time for Professional Development; Require Districts to Align Professional Development with Local Priorities and Goals; Provide Incentives for Teachers to Earn National Board Certifi cation; Require Parental Notifi cation of Out-of-Field Teachers; Have a Ban or Cap on the Number of Out-of-Field Teachers; States in Which Teacher Evaluation Is Tied to Student Achievement; States in Which Teacher and Student Records Can Be Matched by Course/Subject and State Assessment Results; and States in Which Teachers Are Assigned a Unique Identifi cation Number
CalculationNumerator: Number of states listed on Web page, including the District
of Columbia.
Denominator: Count of 50 states plus the District of Columbia.
Sources/LinksEducation Week, Quality Counts: The Teaching Profession, 2010.
http://www.edweek.org/media/ew/qc/2010/17sos.h29.teaching.pdf
Data Availability/DiscussionData are gathered through an annual state survey and reported annually by the
Editorial Projects in Education Research Center. The 2010 report marks the 14th
annual Quality Counts edition of this publication. The teaching profession was
one of several topics focused on in relation to the report’s special theme — the
debate over common academic standards.
Data Sources/Related LinksN/A
INDICATOR: Public School Teachers of Grades Nine Through 12 by Field, Race/Ethnicity and Gender
CalculationAs reported in Table 70.
Sources/LinksNational Center for Education Statistics, Digest of Education Statistics, 2009.
http://nces.ed.gov/Programs/digest/d09/tables/dt09_070.asp
Data Availability/DiscussionData have been gathered semi-regularly since 1987–1988 (generally every three
to four years). The School and Staffi ng Survey collects data from public, private,
and Bureau of Indian Affairs schools. A sample of public charter schools was
311

completionagenda.collegeboard.org
included in the 2003–04 and 2007–08 surveys. It is the largest, most extensive
survey of K–12 school districts, schools, teachers and administrators in the
United States today.
Data Sources/Related LinksNational Center for Education Statistics, 2007–08 School and Staffi ng Survey.
http://nces.ed.gov/surveys/sass/
INDICATOR: Bachelor’s, Master’s or Doctoral Degrees Earned in Education
CalculationNumerator: Number of degrees awarded in education.
Denominator: Total number of degrees awarded.
By education level: As reported in Tables 271 (Bachelor’s), 272 (Master’s) and
273 (Doctoral).
By race/ethnicity: As reported in Tables 286 (Bachelor’s), 289 (Master’s) and
292 (Doctoral).
By gender: As reported in Table 304.
By state: As reported in Tables 322 (Bachelor’s) and 323 (Master’s).
Sources/LinksNational Center for Education Statistics, Digest of Education Statistics, 2009.
http://nces.ed.gov/programs/digest/d09/tables/dt09_271.asp?referrer=list
http://nces.ed.gov/programs/digest/d09/tables/dt09_272.asp?referrer=list
http://nces.ed.gov/programs/digest/d09/tables/dt09_273.asp?referrer=list
http://nces.ed.gov/programs/digest/d09/tables/dt09_286.asp?referrer=list
http://nces.ed.gov/programs/digest/d09/tables/dt09_289.asp?referrer=list
http://nces.ed.gov/programs/digest/d09/tables/dt09_292.asp?referrer=list
http://nces.ed.gov/programs/digest/d09/tables/dt09_304.asp?referrer=list
http://nces.ed.gov/programs/digest/d09/tables/dt09_322.asp?referrer=list
http://nces.ed.gov/programs/digest/d09/tables/dt09_323.asp?referrer=list
Data Availability/DiscussionData are gathered and reported annually. Postsecondary institutions are required
to report degree completions by award level based on the Classifi cation of
Instructional Programs (CIP). Completion of IPEDS surveys is mandated for
institutions that participate in any federal fi nancial assistance program authorized
by Title IV of the Higher Education Act (HEA) of 1965.
Data Sources/Related LinksNational Center for Education Statistics, IPEDS Completion Survey, 2000–2008.
http://nces.ed.gov/ipeds/datacenter/DataFiles.aspx
National Center for Education Statistics, Higher Education General Information
(HEGIS) Degrees and Other Formal Awards Conferred Survey, 1997–1999.
Appendix 312

completionagenda.collegeboard.org
INDICATOR: Teachers Leaving the Profession by School Type, Race/Ethnicity, Gender and Age
CalculationBy school type: As reported in Table 1.
By race/ethnicity, gender and age: As reported in Table 2.
Sources/LinksNational Center for Education Statistics, Teacher Attrition and Mobility: Results
from the 2008-09 Teacher Follow-up Survey, 2010.
http://nces.ed.gov/pubs2010/2010353.pdf
Data Availability/DiscussionData have been gathered semi-regularly since 1987–1988 (generally every three
to four years). The Teacher Follow-Up Survey is part of the School and Staffi ng
Survey (SASS), which collects data from public, private and Bureau of Indian
Affairs schools. A sample of public charter schools were included in the 2003-
04 and 2007-08 surveys. It is the largest, most extensive survey of K–12 school
districts, schools, teachers and administrators in the United States today.
Data Sources/Related LinksNational Center for Education Statistics, 2007–08 School and Staffi ng Survey.
http://nces.ed.gov/surveys/sass/
INDICATOR: Public K–12 Teachers by Years of Teaching Experience by State Rank
CalculationAs reported in Table 67.
Sources/LinksNational Center for Education Statistics, Digest of Education Statistics, 2009.
http://nces.ed.gov/programs/digest/d09/tables/dt09_067.asp
Data Availability/DiscussionData have been gathered semi-regularly since 1987–1988 (generally every three to
four years). The School and Staffi ng Survey collects data from public, private and
Bureau of Indian Affairs schools. A sample of public charter schools were included in
the 2003–04 and 2007–08 surveys. It is the largest, most extensive survey of K–12
school districts, schools, teachers and administrators in the United States today.
Data Sources/Related LinksNational Center for Education Statistics, 2007–08 School and Staffi ng Survey.
http://nces.ed.gov/surveys/sass/
313

completionagenda.collegeboard.org
Recommendation Six: Clarify and simplify the admission process
INDICATOR: Four-Year Colleges with Admission ApplicationsAvailable Online
CalculationNumerator: Number of four-year colleges, in the nation and by state, with
applications available online.
Denominator: Number of four-year colleges in the nation and by state.
Universe: Four-year degree-granting, not-for-profi t, Title IV–participating
institutions located in the 50 states and the District of Columbia.
Sources/LinksThe College Board, Annual Survey of Colleges, 2000–2008.
http://professionals.collegeboard.com/higher-ed/recruitment/annual-survey
National Center for Education Statistics, IPEDS Institutional Characteristics
Survey, 2001–2009.
http://nces.ed.gov/ipeds/datacenter/DataFiles.aspx
Data Availability/DiscussionData are gathered and reported annually. Public and private institutions
are included.
Data Sources/Related LinksN/A
INDICATOR: Four-Year Colleges to Which Students Can Submit Admission Applications Online
CalculationNumerator: Number of four-year colleges, in the nation and by state, to which
students can submit applications online.
Denominator: Number of four-year colleges in the nation and by state.
Universe: Four-year degree-granting, not-for-profi t, Title IV–participating
institutions located in the 50 states and the District of Columbia.
Sources/LinksThe College Board, Annual Survey of Colleges, 2000–2008.
http://professionals.collegeboard.com/higher-ed/recruitment/annual-survey
National Center for Education Statistics, IPEDS Institutional Characteristics
Survey, 2001–2009.
http://nces.ed.gov/ipeds/datacenter/DataFiles.aspx
Appendix 314

completionagenda.collegeboard.org
Data Availability/DiscussionData are gathered and reported annually. Public and private institutions
are included.
Data Sources/Related LinksN/A
INDICATOR: Four-Year Colleges That Use the Common Application, Universal College Application or Common Black College Application
CalculationNumerator: Number of four-year colleges, in the nation and by state, that accept
either the Common Application, Universal College Application or Common Black
College Application.
Denominator: Number of four-year colleges in the nation and by state.
Universe: Four-year degree-granting, not-for-profi t, Title IV–participating
institutions located in the 50 states and the District of Columbia.
Sources/LinksList of institutions retrieved from Common Application, Universal College
Application and Common Black College Application websites in January 2010.
https://www.commonapp.org/CommonApp/Members.aspx
https://www.universalcollegeapp.com/index.cfm?ACT=Display&APP=APPONLI
NE&DSP=StudentCOLLEGEINFO
https://counselorlogin.com/application.asp
National Center for Education Statistics, IPEDS Institutional Characteristics
Survey, 2009.
http://nces.ed.gov/ipeds/datacenter/DataFiles.aspx
Data Availability/DiscussionCommon Application data are available from 1975 to the present. Universal
College Application data are available from 2007 to the present. Common
Black College Application membership history was available only for 2009 to
the present. Member institutions are updated annually and include schools
from both the public and private sectors.
Data Sources/Related LinksN/A
INDICATOR: States that have Statewide Common Application Systems for Public Four-Year Colleges and Universities
CalculationStates that have Statewide Common Application Systems for Public Four-Year
Colleges and Universities: Compiled by the College Board
Sources/LinksThe College Board, Advocacy & Policy Center
http://advocacy.collegeboard.org
315

completionagenda.collegeboard.org
Data Availability/DiscussionData was gathered by surveying each individual state higher education agency.
Data gathered by the College Board Advocacy & Policy Center.
Data Sources/Related LinksThe College Board
http://wwwcollegeboard.org
INDICATOR: High School Completers Enrolled in Two- or Four-Year College Immediately Following High School Completion
CalculationOverall: As reported in Table A-20-1.
By race/ethnicity: As reported in Table A-20-3.
By gender: As reported in Table A-20-4.
By family income: As reported in Table A-20-1.
By parental education: As reported in Table A-20-2.
Sources/LinksNational Center for Education Statistics, The Condition of Education, 2010.
http://nces.ed.gov/pubs2010/2010028_7.pdf
Data Availability/DiscussionData are gathered and reported annually. High school completers include
individuals who earned a high school diploma or equivalency certifi cate
(e.g., GED).
Data Sources/Related LinksU.S. Census Bureau, Current Population Survey, 1998–2008.
http://www.census.gov/hhes/socdemo/education/data/cps/index.html
INDICATOR: Rate of High School Graduates Going to College by State Rank
CalculationAs reported in Table 211.
Sources/LinksNational Center for Education Statistics, Digest of Education Statistics, 2010.
http://nces.ed.gov/programs/digest/d10/tables/dt10_211.asp
Data Availability/DiscussionData are gathered and reported annually.
Data Sources/Related LinksNational Center for Education Statistics, Common Core of Data.
http://nces.ed.gov/ccd/index.asp
Appendix 316

completionagenda.collegeboard.org
Recommendation Seven: Provide more need-based grant aid while simplifying the fi nancial aid process and making it more transparent
INDICATOR: Average Total Grant Aid per Low-Income Dependent Student
CalculationData have been converted into 2008 Constant Dollars using the Consumer Price
Index (CPI), which can be found at http://www.bls.gov/cpi/.
Sources/LinksNational Center for Education Statistics, National Postsecondary Student
Aid Study.
http://nces.ed.gov/surveys/npsas/tables.asp
Data Availability/DiscussionData are gathered and reported every three years. NPSAS data come from
multiple sources, including institutional records, government databases
and student interviews.
Data Sources/Related LinksNational Center for Education Statistics, National Postsecondary Student
Aid Study.
http://nces.ed.gov/surveys/npsas/
INDICATOR: National Average Annual Percentage Increase in Total Grant Aid per Dependent Student by Income
CalculationData have been converted into 2008 Constant Dollars using the Consumer Price
Index (CPI), which can be found at http://www.bls.gov/cpi/.
Sources/LinksNational Center for Education Statistics, National Postsecondary Student
Aid Study.
http://nces.ed.gov/surveys/npsas/tables.asp
Data Availability/DiscussionData are gathered and reported every three years. NPSAS data come from
multiple sources, including institutional records, government databases
and student interviews.
Data Sources/Related LinksNational Center for Education Statistics, National Postsecondary Student
Aid Study.
http://nces.ed.gov/surveys/npsas/
317
completionagenda.collegeboard.org
INDICATOR: National Average Annual Dollar Increase in Total Grant Aid per Dependent Student by Income
CalculationData have been converted into 2008 Constant Dollars using the Consumer Price
Index (CPI), which can be found at http://www.bls.gov/cpi/.
Sources/LinksNational Center for Education Statistics, National Postsecondary Student
Aid Study.
http://nces.ed.gov/surveys/npsas/tables.asp
Data Availability/DiscussionData are gathered and reported every three years. NPSAS data come from
multiple sources, including institutional records, government databases
and student interviews.
Data Sources/Related LinksNational Center for Education Statistics, National Postsecondary Student
Aid Study.
http://nces.ed.gov/surveys/npsas/
INDICATOR: Average Aid per Full-Time Equivalent (FTE)
CalculationAs reported in Table 1.
Sources/LinksThe College Board, Trends in Student Aid, 2011.
http://trends.collegeboard.org/
Data Availability/DiscussionData are gathered and reported annually.
Data Sources/Related LinksThe College Board, Trends in College Pricing, 2011.
The College Board, Trends in Student Aid, 2011.
The College Board, Education Pays, 2010.
http://trends.collegeboard.org/
INDICATOR: Average Aid per Undergraduate FTE
CalculationAs reported in Table 1.
Sources/LinksThe College Board, Trends in Student Aid, 2011.
http://trends.collegeboard.org/
Data Availability/DiscussionData are gathered and reported annually.
Appendix 318
completionagenda.collegeboard.org
Data Sources/Related LinksThe College Board, Trends in College Pricing, 2011.
The College Board, Trends in Student Aid, 2011.
The College Board, Education Pays, 2010.
http://trends.collegeboard.org/
INDICATOR: Average Aid per Graduate FTE
CalculationAs reported in Table 1.
Sources/LinksThe College Board, Trends in Student Aid, 2011.
http://trends.collegeboard.org/
Data Availability/DiscussionData are gathered and reported annually.
Data Sources/Related LinksThe College Board, Trends in College Pricing, 2011.
The College Board, Trends in Student Aid, 2011.
The College Board, Education Pays, 2010.
http://trends.collegeboard.org/
INDICATOR: Total Undergraduate Student Aid by Source (in Billions)
CalculationAs reported in Figure 2a.
Sources/LinksThe College Board, Trends in Student Aid, 2011.
http://trends.collegeboard.org/
Data Availability/DiscussionData are gathered and reported annually. Components may not sum to 100
percent because of rounding. See Notes and Sources for a list of programs
included in other federal grants. Nonfederal loans are not included here since
they involve no subsidy of any kind and are not actually a form of fi nancial aid.
Data Sources/Related LinksThe College Board, Trends in College Pricing, 2011.
The College Board, Trends in Student Aid, 2011.
The College Board, Education Pays, 2010.
http://trends.collegeboard.org/
319

completionagenda.collegeboard.org
INDICATOR: Number of Recipients of Federal Aid by Program (with Average Aid Received)
CalculationAs reported in Figure 2b.
Sources/LinksThe College Board, Trends in Student Aid, 2011.
http://trends.collegeboard.org/
Data Availability/DiscussionData are gathered and reported annually. Both undergraduate and graduate
students are eligible for tax benefi ts, Perkins Loans, and Federal Work-Study
(FWS). Federal Pell Grants, Federal Supplemental Educational Opportunity
Grants (FSEOG), Academic Competitiveness Grants (ACG), and SMART Grants
go to undergraduates only. Estimates for 2009 tax benefi ts are based on data
from 2008 and earlier years.
Data Sources/Related LinksThe College Board, Trends in College Pricing, 2011.
The College Board, Trends in Student Aid, 2011.
The College Board, Education Pays, 2010.
http://trends.collegeboard.org/
INDICATOR: Proportion of Undergraduate Students Borrowing Federal Stafford Loans
CalculationAs reported in Figure 6.
Sources/LinksThe College Board, Trends in Student Aid, 2011.
http://trends.collegeboard.org/
Data Availability/DiscussionData are gathered and reported annually. Based on 12-month unduplicated
head count. Total enrollment for 2009-10 is estimated. Percentages may not
sum to 100 because of rounding. National Student Loan Data System (NSLDS)
calculations by the authors.
Data Sources/Related LinksThe College Board, Trends in College Pricing, 2011.
The College Board, Trends in Student Aid, 2011.
The College Board, Education Pays, 2010.
http://trends.collegeboard.org/
NCES, Enrollment in Postsecondary Institutions and Financial Statistics and
Postsecondary Institutions and Price of Attendance in the United States, 2011,
U.S. Department of Education, Offi ce of Postsecondary Education;
http://nces.ed.gov/pubs2011/2011230.pdf
Appendix 320

completionagenda.collegeboard.org
INDICATOR: Average Total Debt Levels of Bachelor’s Degree Recipients
CalculationAs Reported in Figures 10a and 10b.
Sources/LinksThe College Board, Trends in Student Aid, 2011.
http://trends.collegeboard.org/
Data Availability/DiscussionData are gathered and reported annually. Both undergraduate and graduate
students are eligible for tax benefi ts, Perkins Loans and Federal Work-Study
(FWS). Federal Pell Grants, Federal Supplemental Educational Opportunity
Grants (FSEOG), Academic Competitiveness Grants (ACG) and SMART Grants
go to undergraduates only. Estimates for 2009 tax benefi ts are based on data
from 2008 and earlier years.
Data Sources/Related LinksThe College Board, Trends in College Pricing, 2011.
The College Board, Trends in Student Aid, 2011.
The College Board, Education Pays, 2010.
http://trends.collegeboard.org/
INDICATOR: Distribution of Total Undergraduate Debt by Sector andType of Degree
CalculationAs reported in Figures 9a and 9b.
Sources/LinksThe College Board, Trends in Student Aid, 2011.
http://trends.collegeboard.org/
Data Availability/DiscussionData are gathered and reported annually. Data include federal loans, nonfederal
loans, and loans from states and institutions. Parent PLUS Loans, credit card
debt, and loans from friends and family are not included. Percentages may not
sum to 100 because of rounding. Data include students who attended less than
half time (13 percent of students), and who do not qualify for Stafford loans but
do qualify for some nonfederal loans.
Data Sources/Related LinksThe College Board, Trends in College Pricing, 2011.
The College Board, Trends in Student Aid, 2011.
The College Board, Education Pays, 2010.
http://trends.collegeboard.org/
National Center for Education Statistics, National Postsecondary Student Aid
Study, 2008.
http://nces.ed.gov/surveys/npsas/
321
completionagenda.collegeboard.org
INDICATOR: Simplifying the Federal Student Aid System and the Application Process
CalculationN/A
Sources/LinksN/A
Data Availability/DiscussionN/A
Data Sources/Related LinksN/A
INDICATOR: Implementation of Policies Designed to Provide Incentives for Institutions to Promote Enrollment and Success of Low-Income and First-Generation Students
CalculationN/A
Sources/LinksN/A
Data Availability/DiscussionN/A
Data Sources/Related LinksN/A
Recommendation Eight: Keep college affordable
INDICATOR: Educational Fiscal Support
CalculationAs reported in Figure 10b.
Sources/LinksThe College Board, Trends in College Pricing, 2011.
http://trends.collegeboard.org/
Data Availability/DiscussionData are gathered and reported annually.
Data Sources/Related LinksThe College Board, Trends in College Pricing, 2011.
The College Board, Trends in Student Aid, 2011.
The College Board, Education Pays, 2010.
http://trends.collegeboard.org/
Appendix 322

completionagenda.collegeboard.org
The College Board, Annual Survey of Colleges.
http://professionals.collegeboard.com/higher-ed/recruitment/annual-survey
INDICATOR: Educational Fiscal Support per FTE
CalculationAs reported in Figure 10a.
Sources/LinksThe College Board, Trends in College Pricing, 2011.
http://trends.collegeboard.org/
Data Availability/DiscussionData are gathered and reported annually.
Data Sources/Related LinksThe College Board, Trends in College Pricing, 2011.
The College Board, Trends in Student Aid, 2011.
The College Board, Education Pays, 2010.
http://trends.collegeboard.org/
The College Board, Annual Survey of Colleges.
http://professionals.collegeboard.com/higher-ed/recruitment/annual-survey
INDICATOR: Educational Fiscal Support by State Rank
CalculationAs reported in the Public Postsecondary Enrollment, Net Tuition Revenue and
Educational Appropriations per FTE, 1984–2010 data table.
Sources/LinksState Higher Education Finance, State Higher Education Executive Offi cers
(SHEEO).
http://www.sheeo.org/fi nance/shef/shef_data10.htm
Data Availability/DiscussionData are gathered and reported annually.
Data Sources/Related LinksState Higher Education Finance, State Higher Education Executive Offi cers
(SHEEO).
http://www.sheeo.org
INDICATOR: Educational Fiscal Support per FTE by State Rank
CalculationAs reported in the Public Postsecondary Enrollment, Net Tuition Revenue and
Educational Appropriations per FTE, 1984–2010 data table.
Sources/LinksState Higher Education Finance, State Higher Education Executive Offi cers
(SHEEO).
http://www.sheeo.org/fi nance/shef/shef_data10.htm
323

completionagenda.collegeboard.org
Data Availability/DiscussionData are gathered and reported annually.
Data Sources/Related LinksState Higher Education Finance, State Higher Education Executive Offi cers
(SHEEO).
http://www.sheeo.org
INDICATOR: Average Estimated Undergraduate Budgets by Type and Control of Institution (Enrollment Weighted)
CalculationAs reported in Table 1.
Sources/LinksThe College Board, Trends in College Pricing, 2011.
http://trends.collegeboard.org/
Data Availability/DiscussionData are gathered and reported annually.
Data Sources/Related LinksThe College Board, Trends in College Pricing, 2011.
The College Board, Trends in Student Aid, 2011.
The College Board, Education Pays, 2010.
http://trends.collegeboard.org/
The College Board, Annual Survey of Colleges.
http://professionals.collegeboard.com/higher-ed/recruitment/annual-survey
INDICATOR: Average Published Charges for Undergraduates by Carnegie Classifi cation
CalculationAs reported in Table 1b.
Sources/LinksThe College Board, Trends in College Pricing, 2011.
http://trends.collegeboard.org/
Data Availability/DiscussionData are gathered and reported annually.
Data Sources/Related LinksThe College Board, Trends in College Pricing, 2011.
The College Board, Trends in Student Aid, 2011.
The College Board, Education Pays, 2010.
http://trends.collegeboard.org/
The College Board, Annual Survey of Colleges.
http://professionals.collegeboard.com/higher-ed/recruitment/annual-survey
Appendix 324

completionagenda.collegeboard.org
INDICATOR: Average Annual Percentage Increases in Infl ation-Adjusted Published Prices by Decade
CalculationAs reported in Figure 4.
Sources/LinksThe College Board, Trends in College Pricing, 2011.
http://trends.collegeboard.org/
Data Availability/DiscussionData are gathered and reported annually.
Data Sources/Related LinksThe College Board, Trends in College Pricing, 2011.
The College Board, Trends in Student Aid, 2011.
The College Board, Education Pays, 2010.
http://trends.collegeboard.org/
The College Board, Annual Survey of Colleges.
http://professionals.collegeboard.com/higher-ed/recruitment/annual-survey
NCES, Integrated Postsecondary Education Data System.
http://nces.ed.gov/ipeds/
INDICATOR: National Average Published Tuition and Fees Charges
CalculationAs reported in Tables 1a and 1b.
Sources/LinksThe College Board, Trends in College Pricing, 2011.
http://trends.collegeboard.org/
Data Availability/DiscussionData are gathered and reported annually. For 1987–1988 and after: Annual
Survey of Colleges (The College Board), weighted by full-time undergraduate
enrollment; 1986–87 and prior: Integrated Postsecondary Education Data
System (IPEDS), U.S. Department of Education, National Center for Education
Statistics, weighted by full-time equivalent enrollment.
Data Sources/Related LinksThe College Board, Trends in College Pricing, 2011.
The College Board, Trends in Student Aid, 2011.
The College Board, Education Pays, 2010.
The College Board, Annual Survey of Colleges.
http://professionals.collegeboard.com/higher-ed/recruitment/annual-survey
NCES, Integrated Postsecondary Education Data System.
http://nces.ed.gov/ipeds/
http://trends.collegeboard.org/
325
completionagenda.collegeboard.org
INDICATOR: In-State Published Tuition Prices at Public Two-Year Institutions by State Rank
CalculationAs reported in Table 1a.
Sources/LinksThe College Board, Trends in College Pricing, 2011.
http://trends.collegeboard.org/
Data Availability/DiscussionData are gathered and reported annually.
Data Sources/Related LinksThe College Board, Trends in College Pricing, 2011.
The College Board, Trends in Student Aid, 2011.
The College Board, Education Pays, 2010.
http://trends.collegeboard.org/
The College Board, Annual Survey of Colleges.
http://professionals.collegeboard.com/higher-ed/recruitment/annual-survey
INDICATOR: In-State Published Tuition Prices at Public Four-Year Institutions by State Rank
CalculationAs reported in Table 1a.
Sources/LinksThe College Board, Trends in College Pricing, 2011.
http://trends.collegeboard.org/
Data Availability/DiscussionData are gathered and reported annually.
Data Sources/Related LinksThe College Board, Trends in College Pricing, 2011.
The College Board, Trends in Student Aid, 2011.
The College Board, Education Pays, 2010.
http://trends.collegeboard.org/
The College Board, Annual Survey of Colleges.
http://professionals.collegeboard.com/higher-ed/recruitment/annual-survey
INDICATOR: In-State Published Tuition Prices at Private Four-Year Institutions by State Rank
CalculationAs reported in Table 1a.
Sources/LinksThe College Board, Trends in College Pricing, 2011.
http://trends.collegeboard.org/
Appendix 326

completionagenda.collegeboard.org
Data Availability/DiscussionData are gathered and reported annually.
Data Sources/Related LinksThe College Board, Trends in College Pricing, 2011.
The College Board, Trends in Student Aid, 2011.
The College Board, Education Pays, 2010.
http://trends.collegeboard.org/
The College Board, Annual Survey of Colleges.
http://professionals.collegeboard.com/higher-ed/recruitment/annual-survey
INDICATOR: Published Net Tuition and Fees for Full-Time Undergraduate Students
CalculationAs reported in Table 7.
Sources/LinksThe College Board, Trends in College Pricing, 2011.
http://trends.collegeboard.org/
Data Availability/DiscussionData are gathered and reported annually. Numbers are rounded to the nearest
10s. Net tuition and fees are calculated by subtracting estimated average grant
aid plus tax benefi ts per full-time student in the sector from the published price.
Aggregate aid amounts are from Trends in Student Aid, 2010. Division of total
aid across sectors and between full-time and part-time students is based on the
NPSAS, 1993 through 2008.
Data Sources/Related LinksThe College Board, Trends in College Pricing, 2011.
The College Board, Trends in Student Aid, 2011.
The College Board, Education Pays, 2010.
http://trends.collegeboard.org/
INDICATOR: Growth in Mean Family Income by Quintile
CalculationAs reported in Figure 16a.
Sources/LinksThe College Board, Trends in College Pricing, 2011.
http://trends.collegeboard.org/
Data Availability/DiscussionData are gathered and reported annually.
Data Sources/Related LinksThe College Board, Trends in College Pricing, 2011.
The College Board, Trends in Student Aid, 2011.
327

completionagenda.collegeboard.org
The College Board, Education Pays, 2010.
http://trends.collegeboard.org/
U.S. Census Bureau, Current Population Survey, Table F-1 and Table F-3.
INDICATOR: Average Earnings of Full-Time Workers Ages 25 to 34
CalculationN/A
Sources/LinksU.S. Census Bureau, Current Population Survey, 2009
Data Availability/DiscussionData are gathered and reported annually.
Data Sources/Related LinksN/A
Recommendation Nine: Dramatically increase college completion rates
INDICATOR: Freshman-to-Sophomore Retention Rates
CalculationNumerator: Number of students from the fi rst-time adjusted cohort enrolled in
given fall, aggregated by sector, state and/or attendance status.
Denominator: Number of students from the fi rst-time adjusted cohort enrolled
in previous fall, aggregated by sector, state and/or attendance status.
Universe: Degree-granting, Title IV–participating institutions.
Sources/LinksNational Center for Education Statistics, IPEDS Enrollment and Institutional
Characteristics Surveys, 2007–2008.
http://nces.ed.gov/ipeds/datacenter/DataFiles.aspx
Data Availability/DiscussionData are gathered and reported annually. Postsecondary institutions are required
to report cohort enrollment numbers through which IPEDS computes retention
rates. Completion of IPEDS surveys is mandated for institutions that participate
in any federal fi nancial assistance program authorized by Title IV of the Higher
Education Act (HEA) of 1965.
Although retention data were collected on the 2003–2006 surveys, there were
problems with the data such that institutions were confused about which students
to report on (e.g., full-time versus all, original versus adjusted cohort). This led to
changes in the 2007 survey, where institutions now report the raw numbers as
opposed to a percentage based on a formula outlined in the directions.
Appendix 328
completionagenda.collegeboard.org
Data Sources/Related LinksN/A
INDICATOR: Three-Year Graduation Rates of Degree- and Certifi cate-Seeking Students at Two-Year Colleges
CalculationNumerator: Number of students who completed a degree or certifi cate program
within 150 percent of normal time, aggregated by sector, race/ethnicity and/
or state.
Denominator: Number of degree- and certifi cate-seeking students in the
adjusted cohort (revised fi rst-time, full-time cohort minus exclusions),
aggregated by sector, race/ethnicity and/or state.
Universe: Two-year, degree-granting, Title IV–participating institutions
Sources/LinksNational Center for Education Statistics, IPEDS Graduation Rate and Institutional
Characteristics Surveys, 2002–2008.
http://nces.ed.gov/ipeds/datacenter/DataFiles.aspx
Data Availability/DiscussionData are gathered and reported annually. Postsecondary institutions are required
to report completion data by race/ethnicity and gender but do not separate
certifi cate-seeking from degree-seeking students. Completion of IPEDS surveys
is mandated for institutions that participate in any federal fi nancial assistance
program authorized by Title IV of the Higher Education Act (HEA) of 1965.
The graduation rate survey was developed to help institutions comply with
requirements of the Student Right-to-Know Act of 1990.
The 2008 survey contained signifi cant changes in the reporting of data on race
and ethnicity, and institutions had the option to report under old or new race/
ethnicity categories. This may present challenges in comparing graduation rates
by race/ethnicity from 2008 to prior or subsequent years or rates from prior to
2008 to those from after 2008.
Data Sources/Related LinksN/A
INDICATOR: Four-Year Graduation Rates of Degree- and Certifi cate-Seeking Students at Two-Year Colleges
CalculationNumerator: Number of students who completed a degree or certifi cate program
within 200 percent of normal time, aggregated by sector and/or state.
Denominator: Number of degree- and certifi cate-seeking students in the
adjusted cohort (revised cohort minus exclusions), aggregated by sector and/
or state.
Universe: Two-year, degree-granting, Title IV–participating institutions.
329

completionagenda.collegeboard.org
Sources/LinksNational Center for Education Statistics, IPEDS Graduation Rates 200% and
Institutional Characteristics Surveys, 2008.
http://nces.ed.gov/ipeds/datacenter/DataFiles.aspx
Data Availability/DiscussionData will be gathered and reported annually. Completion of IPEDS surveys
is mandated for institutions that participate in any federal fi nancial assistance
program authorized by Title IV of the Higher Education Act (HEA) of 1965.
This survey was developed to fulfi ll requirements in the Higher Education
Opportunity Act of 2008.
Data Sources/Related LinksN/A
INDICATOR: Six-Year Graduation Rates of Bachelor’s Degree–Seeking Students
CalculationNumerator: Number of students who completed a bachelor’s degree or
equivalent program within 150 percent of normal time, aggregated by sector,
race/ethnicity and/or state.
Denominator: Number of bachelor’s degree–seeking students in the adjusted
cohort (revised fi rst-time, full-time cohort minus exclusions), aggregated by
sector, race/ethnicity and/or state.
Universe: Four-year, degree-granting, Title IV–participating institutions
Sources/LinksNational Center for Education Statistics, IPEDS Graduation Rate and Institutional
Characteristics Surveys, 2002–2008.
http://nces.ed.gov/ipeds/datacenter/DataFiles.aspx
Data Availability/DiscussionData are gathered and reported annually. Postsecondary institutions are required
to report completion data by race/ethnicity and gender. Completion of IPEDS
surveys is mandated for institutions that participate in any federal fi nancial
assistance program authorized by Title IV of the Higher Education Act (HEA) of
1965. The graduation rate survey was developed to help institutions comply with
requirements of the Student Right-to-Know Act of 1990.
The 2008 survey contained signifi cant changes in the reporting of data on race
and ethnicity, and institutions had the option to report under old or new race/
ethnicity categories. This may present challenges in comparing graduation rates
by race/ethnicity from 2008 to prior or subsequent years or rates from prior to
2008 to those from after 2008.
Appendix 330

completionagenda.collegeboard.org
Data Sources/Related LinksN/A
INDICATOR: Six-Year Bachelor’s Degree Attainment Rates of Students
CalculationAs reported in Tables 3 and 6.
Sources/LinksRadford, A.W., Berkner, L., Wheeless, S. C., and Shepherd, B. (2010).
Persistence and Attainment of 2003–04 Beginning Postsecondary Students:
After 6 Years (NCES 2011-151). National Center for Education Statistics:
Washington, D.C.
http://nces.ed.gov/pubs2011/2011151.pdf
Data Availability/DiscussionThe Beginning Postsecondary Student (BPS) surveys fi rst-time beginning
students at three points in time: at the end of their fi rst year (2003–2004),
and then three (2005–2006) and six years (2008–2009) after fi rst starting in
postsecondary education. Roughly 16,700 students were in the fi nal sample.
This is the third cohort of fi rst-time beginners tracked by the National Center
for Education Statistics since 1990.
Data Sources/Related LinksNational Center for Education Statistics, Beginning Postsecondary Student
Survey, BPS:04/09.
http://nces.ed.gov/surveys/bps/
INDICATOR: Eight-Year Graduation Rates of Bachelor’s Degree–Seeking Students
CalculationNumerator: Number of students who completed a bachelor’s degree or
equivalent program within 200 percent of normal time, aggregated by sector
and/or state.
Denominator: Number of bachelor’s degree–seeking students in the adjusted
cohort (revised cohort minus exclusions), aggregated by sector and or state.
Universe: Four-year, degree-granting, Title IV–participating institutions
Sources/LinksNational Center for Education Statistics, IPEDS Graduation Rates 200% and
Institutional Characteristics Surveys, 2008.
http://nces.ed.gov/ipeds/datacenter/DataFiles.aspx
Data Availability/DiscussionData will be gathered and reported annually. Completion of IPEDS surveys
is mandated for institutions that participate in any federal fi nancial assistance
program authorized by Title IV of the Higher Education Act (HEA) of 1965.
This survey was developed to fulfi ll requirements in the Higher Education
Opportunity Act of 2008.
331

completionagenda.collegeboard.org
Data Sources/Related LinksN/A
INDICATOR: Degrees Awarded By Colleges and Universities
CalculationNumber of degrees awarded, aggregated by degree-type, sector, race/ethnicity
and/or state.
Universe: degree-granting, Title IV–participating institutions
Sources/LinksNational Center for Education Statistics, IPEDS Completion and Institutional
Characteristics Surveys, 2002–2008.
http://nces.ed.gov/ipeds/datacenter/DataFiles.aspx
Data Availability/DiscussionData are gathered and reported annually. Postsecondary institutions are required
to report completion data by race/ethnicity and gender. Completion of IPEDS
surveys is mandated for institutions that participate in any federal fi nancial
assistance program authorized by Title IV of the Higher Education Act (HEA) of
1965. The graduation rate survey was developed to help institutions comply with
requirements of the Student Right-to-Know Act of 1990.
The 2008 survey contained signifi cant changes in the reporting of data on race
and ethnicity, and institutions had the option to report under old or new race/
ethnicity categories. This may present challenges in comparing graduation rates
by race/ethnicity from 2008 to prior or subsequent years or rates from prior to
2008 to those from after 2008.
Data Sources/Related LinksN/A
Recommendation Ten: Provide postsecondary opportunities as an essential element of adult education programs
INDICATOR: Educational Attainment of Adults Ages 25 to 34
CalculationNumerator: Number of males and females, ages 25 to 34, in the nation and
aggregated by state in each of the following categories: less than a high school
diploma; high school diploma; some college; associate degree or higher.
Denominator: Number of males and females ages 25 to 34 in the nation and
by state.
Appendix 332
completionagenda.collegeboard.org
Sources/LinksU.S. Census Bureau, 2005–2009 American Community Survey Five-Year
Estimates, Table B15001.
http://factfi nder.census.gov/servlet/DatasetMainPageServlet?_program=ACS&_
submenuId=&_lang=en&_ts=
Data Availability/DiscussionData are gathered and reported annually. The fi ve-year ACS estimates were
selected in order to reduce the margin of error in the population estimates.
Data Sources/Related Linkshttp://www.census.gov/hhes/socdemo/education/
http://www.census.gov/hhes/socdemo/education/data/factsheet.html
INDICATOR: Educational Attainment of Adults Ages 25 to 34 by Race/Ethnicity
CalculationNumerator: Number of adults ages 25 to 34 by race/ethnicity in each of the
following categories: less than a high school diploma; high school diploma;
some college; associate degree or higher.
Denominator: Number of adults ages 25 to 34 by race/ethnicity.
Sources/LinksU.S. Census Bureau, Current Population Survey, 2009.
http://www.census.gov/hhes/socdemo/education/data/cps/2009/tables.html
Data Availability/DiscussionData are gathered and reported annually. These calculations include academic
and vocational/occupational associate degrees.
Data Sources/Related LinksN/A
INDICATOR: Adults Ages 25 to 34 with No High School Diploma Who Are GED Candidates
CalculationNumerator: Number of 25- to 34-year-olds who completed at least one GED test
in the nation and by state, derived from “Percentage of GED Candidates, by Age
Group” table (e.g., Table 2 in 2005, Appendix B in 2009).
Denominator: Number of males and females ages 25 to 34, in the nation and by
state, with less than a ninth-grade education or a ninth- to 12th-grade education
with no diploma, reported in Table B15001.
Sources/LinksAmerican Council on Education 2005–2009 Annual Statistical Reports (Table 2 or
Appendix B).
http://www.acenet.edu/Content/NavigationMenu/ged/pubs/2009ASR.pdf
http://www.acenet.edu/Content/NavigationMenu/ged/pubs/GED_Archived_
Annual_.htm
333

completionagenda.collegeboard.org
U.S. Census Bureau, 2005–2009 American Community Survey Five-Year
Estimates, Table B15001.
http://factfi nder.census.gov/servlet/DatasetMainPageServlet?_program=ACS&_
submenuId=&_lang=en&_ts=
Data Availability/DiscussionGED data are gathered and reported annually. Annual reports are available from
1958 to the present. One-, three- and fi ve-year ACS population estimates are
available. The denominator in this indicator stemmed from the fi ve-year ACS
estimates, as they contain the smallest margin of error.
Data Sources/Related LinksN/A
INDICATOR: Adults Ages 25 to 34 with No High School Diploma Who Attain a GED
CalculationNumerator: Number of 25- to 34-year-olds who earned a GED in the nation
and by state, derived from the “Percentage of GED Passers, by Age Group”
table (e.g., Table 9 in 2005, Appendix L in 2009).
Denominator: Number of males and females ages 25 to 34, in the nation and by
state, with less than a ninth-grade education or a ninth- to 12th-grade education
with no diploma, reported in Table B15001.
Sources/LinksAmerican Council on Education 2005–2009 Annual Statistical Reports (Table 9 or
Appendix L).
http://www.acenet.edu/Content/NavigationMenu/ged/pubs/2009ASR.pdf
http://www.acenet.edu/Content/NavigationMenu/ged/pubs/GED_Archived_
Annual_.htm
U.S. Census Bureau, 2005–2009 American Community Survey Five-Year
Estimates, Table B15001.
http://factfi nder.census.gov/servlet/DatasetMainPageServlet?_program=ACS&_
submenuId=&_lang=en&_ts=
Data Availability/Discussion GED data are gathered and reported annually. Annual reports are available from
1958 to the present. One-, three- and fi ve-year ACS population estimates are
available. The denominator in this indicator stemmed from the fi ve-year ACS
estimates, as they contain the smallest margin of error.
Data Sources/Related LinksN/A
Appendix 334

completionagenda.collegeboard.org
INDICATOR: Adults Ages 25 to 34 Enrolled in Postsecondary Education
CalculationNumerator: Number of 25- to 34-year-olds enrolled in undergraduate study at
postsecondary institutions in the nation and by state.
Denominator: Number of 25- to 34-year-olds in the nation and by state, reported
in Table B15001.
Sources/LinksNational Center for Education Statistics, IPEDS Enrollment Survey, 2003–2007.
http://nces.ed.gov/ipeds/datacenter/DataFiles.aspx
U.S. Census Bureau, 2003, 2005 and 2007 American Community Survey
One-Year Estimates; 2005–2009 American Community Survey Five-Year
Estimates, Table B15001.
http://factfi nder.census.gov/servlet/DatasetMainPageServlet?_program=ACS&_
submenuId=&_lang=en&_ts=
Data Availability/DiscussionData are gathered and reported annually. Postsecondary institutions are required
to report enrollment data annually but only report enrollment by age range
every other year. Completion of IPEDS surveys is mandated for institutions that
participate in any federal fi nancial assistance program authorized by Title IV of
the Higher Education Act (HEA) of 1965.
One-, three- and fi ve-year ACS population estimates are available. The denominators
in Figure 10.3a are from the one-year estimates. The denominators for Figure 10.3b
are from the fi ve-year estimates, as they contain the smallest margin of error.
Data Sources/Related LinksN/A
335
completionagenda.collegeboard.org
A Percentage of 25- to 34-Year-Olds with an Associate Degree
or Higher, 2008
B Percentage of 25- to 64-Year-Olds with an Associate Degree
or Higher, 2008
C Percentage of 55- to 64-Year-Olds with an Associate Degree
or Higher, 2008
D Percentage of 25- to 34-Year-Olds with an Associate Degree
or Higher in the United States, 2000–2009
E Percentage of Adults with an Associate Degree or Higher in the
United States by Race/Ethnicity and Age, 2009
F Percentage of Adults with an Associate Degree or Higher in the
United States by Age, 2009
G Percentage of Adults Ages 25–34 with an Associate Degree
or Higher in the United States by State Rank, 2009
Figure 1.1a National Percentage of 3- and 4-Year-Olds Enrolled in Preschool
or Kindergarten Programs by Age, 2006–2008
Figure 1.1b Percentage of 3- and 4-Year-Olds Enrolled in Preschool or
Kindergarten Programs by Race/Ethnicity, 2006–2008
Figure 1.1c Percentage of 3- and 4-Year-Olds Enrolled in Preschool or
Kindergarten Programs by State Rank, 2006–2008
Figure 1.1d Percentage of 3-Year-Olds Enrolled in Preschool or Kindergarten
Programs by State Rank, 2006–2008
Figure 1.1e Percentage of 4-Year-Olds Enrolled in Preschool or Kindergarten
Programs by State Rank, 2006–2008
Figure 1.1f Percentage of Asian 3- and 4-Year-Olds Enrolled in Preschool
or Kindergarten Programs by State Rank, 2006–2008
List of Figures
Appendix 336
completionagenda.collegeboard.org
Figure 1.1g Percentage of American Indian or Alaska Native 3- and 4-Year-
Olds Enrolled in Preschool or Kindergarten Programs by State
Rank, 2006–2008
Figure 1.1h Percentage of Black 3- and 4-Year Olds Enrolled in Preschool or
Kindergarten Programs by State Rank, 2006–2008
Figure 1.1i Percentage of Hispanic 3- and 4-Year-Olds Enrolled in Preschool
or Kindergarten Programs by State Rank, 2006–2008
Figure 1.1j Percentage of White 3- and 4-Year-Olds Enrolled in Preschool or
Kindergarten Programs by State Rank, 2006–2008
Figure 1.1k Percentage of Two or More Races 3- and 4-Year-Olds Enrolled in
Preschool or Kindergarten Programs by State Rank, 2006–2008
Figure 1.2a Percentage of 3- and 4-Year-Olds Enrolled in State-Funded Pre-K
Programs by State Rank, 2009
Figure 1.2b Percentage of 3-Year-Olds Enrolled in State-Funded Pre-K
Programs by State Rank, 2009
Figure 1.2c Percentage of 4-Year-Olds Enrolled in State-Funded Pre-K
Programs by State Rank, 2009
Figure 1.3a Percentage of 3- and 4-Year-Olds Enrolled in Head Start
Programs by State Rank, 2009
Figure 1.3b Percentage of 3-Year-Olds Enrolled in Head Start Programs
by State Rank, 2009
Figure 1.3c Percentage of 4-Year-Olds Enrolled in Head Start Programs
by State Rank, 2009
Figure 2.1a National Student-to-Counselor Ratio, 1998–2009
Figure 2.1b Student-to-Counselor Ratio by State Rank, 2009
Figure 2.1c National Student-to-College-Counselor Ratio by School Type,
2005–2009
Figure 2.2 States with Comprehensive School Counseling Programs
Figure 2.3a Percentage of Secondary Schools That Require Professional
Development by School Type, 2006–2009
337

completionagenda.collegeboard.org
Figure 2.3b Percentage of Secondary Schools That Cover All Professional
Development Costs by School Type, 2006–2009
Figure 2.4a Percentage of Counselors’ Time Spent on Postsecondary
Admission Counseling by School Type, 2004–2009
Figure 2.4b Percentage of Counselors’ Time Spent on Tasks by School
Type, 2009
Figure 3.1a National Average Graduation Rates for Public High School
Students, 2003–2008
Figure 3.1b National Average Graduation Rates for Public High School
Students by Race/Ethnicity, 2006–2008
Figure 3.1c Average Graduation Rates for Public High School Students
by State Rank, 2008
Figure 3.1d Average Graduation Rates for Asian American or Pacifi c Islander
Public High School Students by State Rank, 2008
Figure 3.1e Average Graduation Rates for American Indian or Alaska Native
Public High School Students by State Rank, 2008
Figure 3.1f Average Graduation Rates for African American Public High
School Students by State Rank, 2008
Figure 3.1g Average Graduation Rates for Hispanic Public High School
Students by State Rank, 2008
Figure 3.1h Average Graduation Rates for White Public High School
Students by State Rank, 2008
Figure 3.1i States with Exit Examinations, 2010
Figure 3.1j States Where End-of-Course Exams Are Used as the Exit
Exam, 2010
Figure 3.1k States That Have Reciprocity with Other States’ Exit
Exams, 2010
Figure 3.1l States with Substitute Assessments, 2010
Figure 3.1m States with Alternative Diploma or Certifi cate, 2010
Figure 3.2a National Status Dropout Rates — Excluding Institutional
Populations, 1999–2008
Appendix 338

completionagenda.collegeboard.org
Figure 3.2b National Status Dropout Rates by Race/Ethnicity — Excluding
Institutional Populations, 2008
Figure 3.2c National Status Dropout Rates by Gender — Excluding
Institutional Populations, 2008
Figure 3.2d National Status Dropout Rates by Age — Excluding Institutional
Populations, 2008
Figure 3.3a National Status Dropout Rates — Including Institutional
Populations, 1999–2008
Figure 3.3b National Status Dropout Rates by Race/Ethnicity — Including
Institutional Populations, 2008
Figure 3.3c National Status Dropout Rates by Gender — Including
Institutional Populations, 2008
Figure 3.3d National Status Dropout Rates by Age — Including Institutional
Populations, 2008
Figure 3.4a National Event Dropout Rates of Public High School Students
in Grades 9–12, 2003–2008
Figure 3.4b National Event Dropout Rates of Public High School Students
in Grades 9–12 by Race/Ethnicity, 2006–2008
Figure 3.4c National Event Dropout Rates of Public High School Students
in Grades 9–12 by Gender, 2008
Figure 3.4d State Statutory Age When Students Can Legally Drop Out, 2010
Figure 3.4e Event Dropout Rates for Public School Students in Grades 9–12
by State Rank, 2008
Figure 3.4f Event Dropout Rates for Asian American or Pacifi c Islander
Public School Students in Grades 9–12 by State Rank, 2008
Figure 3.4g Event Dropout Rates for American Indian or Alaska Native
Public School Students in Grades 9–12 by State Rank, 2008
Figure 3.4h Event Dropout Rates for African American Public School
Students in Grades 9–12 by State Rank, 2008
339

completionagenda.collegeboard.org
Figure 3.4i Event Dropout Rates for White Public School Students
in Grades 9–12 by State Rank, 2008
Figure 3.4j Event Dropout Rates for Hispanic Public School Students
in Grades 9–12 by State Rank, 2008
Figure 3.4k Event Dropout Rates for Public School Students in Ninth Grade
by State Rank, 2008
Figure 3.4l Event Dropout Rates for Public School Students in 10th Grade
by State Rank, 2008
Figure 3.4m Event Dropout Rates for Public School Students in 11th Grade
by State Rank, 2008
Figure 3.4n Event Dropout Rates for Public School Students in 12th Grade
by State Rank, 2008
Figure 4.1a Percentage of Public High Schools Offering AP or IB Courses
in the Four Core Subject Areas, 2010
Figure 4.1b Percentage of Public High Schools Offering Advanced
Placement (AP) in the Four Core Subject Areas, 2010
Figure 4.1c Student Population of Public High School and AP Examinees
by Race/Ethnicity for the Class of 2010
Figure 4.1d Percentage of Public High School Students Taking an AP Exam,
Class of 2010
Figure 4.1e Percentage of Public High School Students Scoring 3 or Higher
on an AP Exam, Class of 2010
Figure 4.1f Percentage of Public High Schools Offering IB Courses in the
Four Core Subject Areas, 2010
Figure 4.2a National Percentage of Schools That Offer Dual Enrollment and
Mean Percentage of Students Enrolled in Dual Enrollment, 2009
Figure 4.2b National Percentage of Schools That Offer Dual Enrollment
and Mean Percentage of Students Enrolled in Dual Enrollment,
by Control of Institution, 2009
Figure 4.2c National Percentage of Schools That Offer Dual Enrollment
and Mean Percentage of Students Enrolled in Dual Enrollment,
by School Enrollment, 2009
Appendix 340

completionagenda.collegeboard.org
Figure 4.2d National Percentage of Schools That Offer Dual Enrollment and
Mean Percentage of Students Enrolled in Dual Enrollment Who
Receive Free or Reduced-Price Lunches, 2009
Figure 4.3a Percentage of States with Alignment Between High School
Standards and College and Workplace Expectations, 2010
Figure 4.3b Percentage of States with Alignment Between High School
Graduation Requirements and College and Workplace
Expectations, 2010
Figure 4.3c Percentage of States with College- and Career-Ready
Assessment Systems, 2010
Figure 4.3d Percentage of States with P–20 Longitudinal Data Systems,
2010
Figure 4.3e Percentage of States That Have Adopted the National Common
Core Standards, 2010
Figure 4.4a Percentage of First- and Second-Year Undergraduates in
Remedial Courses After High School Graduation, 2008
Figure 4.4b Percentage of First- and Second-Year Undergraduates in
Remedial Courses After High School Graduation by Race/
Ethnicity, 2008
Figure 4.4c Percentage of First- and Second-Year Undergraduates in
Remedial Courses After High School Graduation by Gender,
2008
Figure 4.4d Percentage of First- and Second-Year Undergraduates in
Remedial Courses After High School Graduation by Age, 2008
Figure 4.4e Percentage of First- and Second-Year Undergraduates in
Remedial Courses After High School Graduation by Income,
2008
Figure 4.4f Percentage of First- and Second-Year Undergraduates in
Remedial Courses After High School Graduation by Institutional
Type, 2008
Figure 4.4g Percentage of First- and Second-Year Undergraduates in
Remedial Courses After High School Graduation by Attendance
Intensity, 2008
341

completionagenda.collegeboard.org
Figure 4.4h Percentage of First- and Second-Year Undergraduates in
Remedial Courses After High School Graduation by Attendance
Intensity, 2008
Figure 4.4i Percentage of First- and Second-Year Undergraduates in
Remedial Courses After High School Graduation by Class
Level, 2008
Figure 5.1a States with Professional Development Standards, 2010
Figure 5.1b States That Finance Professional Development for All Districts,
2010
Figure 5.1c States That Require Districts/Schools to Set Aside Time for
Professional Development, 2010
Figure 5.1d States That Require Districts to Align Professional Development
with Local Priorities and Goals, 2010
Figure 5.1e States That Provide Incentives for Teachers to Earn National
Board Certifi cation, 2010
Figure 5.2a Percentage of Public School Teachers of Grades 9 Through 12
by Field, 2008
Figure 5.2b Percentage of Public School Teachers of Grades 9 Through 12
in Mathematics and Science Fields by Race/Ethnicity, 2008
Figure 5.2c Percentage of Public School Teachers of Grades 9 Through 12
in Mathematics and Science Fields by Gender, 2008
Figure 5.3a States That Require Parental Notifi cation of Out-of-Field
Teachers, 2010
Figure 5.3b States That Have a Ban or Cap on the Number of Out-of-Field
Teachers, 2010
Figure 5.4a Percentage of Bachelor’s, Master’s or Doctoral Degrees Earned
in Education, 1997–2008
Figure 5.4b Percentage of Bachelor’s, Master’s or Doctoral Degrees Earned
in Education by Race/Ethnicity, 2008
Figure 5.4c Percentage of Bachelor’s, Master’s or Doctoral Degrees Earned
in Education by Gender, 2008
Appendix 342

completionagenda.collegeboard.org
Figure 5.4d Percentage of Bachelor’s and Master’s Degrees Earned in
Education by State Rank, 2008
Figure 5.4e Percentage of Bachelor’s Degrees Earned in Education by State
Rank, 2008
Figure 5.4f Percentage of Master’s Degrees Earned in Education by State
Rank, 2008
Figure 5.5a National Percentage of Teachers Leaving the Profession by
School Type, 1989–2009
Figure 5.5b National Percentage of Teachers Leaving the Profession by
Race/Ethnicity, 2009
Figure 5.5c National Percentage of Teachers Leaving the Profession by
Gender, 2009
Figure 5.5d National Percentage of Teachers Leaving the Profession by
Age, 2009
Figure 5.6a Percentage of States in Which Teacher Evaluation Is Tied to
Student Achievement, 2010
Figure 5.6b Percentage of States in Which Teacher and Student Records
Can Be Matched by Course/Subject and State Assessment
Results, 2010
Figure 5.6c Percentage of States in Which Teachers Are Assigned a Unique
Identifi cation Number, 2010
Figure 5.7 Percentage of Public K–12 Teachers by Years of Teaching
Experience by State, 2008
Figure 6.1a National Percentage of Four-Year Colleges with Admission
Applications Available Online, 2001–2009
Figure 6.1b Percentage of Four-Year Colleges with Admission Applications
Available Online by State Rank, 2009
Figure 6.2a National Percentage of Four-Year Colleges to Which Students
Can Submit Admission Applications Online, 2001–2009
Figure 6.2b Percentage of Four-Year Colleges to Which Students Can
Submit Admission Applications Online by State Rank, 2009
343
completionagenda.collegeboard.org
Figure 6.3a National Percentage of Four-Year Colleges That Use the
Common Application, Universal College Application or Common
Black College Application, 2000–2009
Figure 6.3b Percentage of Four-Year Colleges That Use the Common
Application, Universal College Application or Common Black
College Application by State Rank, 2009
Figure 6.3c States with Statewide Common Applications for Public Four-
Year College and Universities, 2011
Figure 6.4a Percentage of High School Completers Enrolled in Two- or Four-
Year Colleges Immediately Following High School Completion,
1998–2008
Figure 6.4b Percentage of High School Completers Enrolled in Two- or Four-
Year Colleges Immediately Following High School Completion
by Race/Ethnicity, 1998–2008
Figure 6.4c Percentage of High School Completers Enrolled in Two- or Four-
Year Colleges Immediately Following High School Completion
by Gender, 1998–2008
Figure 6.4d Percentage of High School Completers Enrolled in Two- or Four-
Year Colleges Immediately Following High School Completion
by Family Income, 1998–2008
Figure 6.4e Percentage of High School Completers Enrolled in Two- or Four-
Year Colleges Immediately Following High School Completion
by Parental Education, 1998–2008
Figure 6.4f Rate of High School Graduates Going to College by State
Rank, 2008
Figure 6.4g Rate of High School Graduates Going to College In State by
State Rank, 2008
Figure 6.4h Rate of High School Graduates Going to College Out of State
by State Rank, 2008
Figure 7.1a National Total Grant Aid per Low-Income Dependent Student,
1996–2008 (in Constant 2008 Dollars)
Figure 7.1b Average Percentage Change in Total Grant Aid per Dependent
Student by Income, 2004–2008 (in Constant 2008 Dollars)
Appendix 344

completionagenda.collegeboard.org
Figure 7.1c National Average Dollar Increase in Total Grant Aid per
Dependent Student by Income, 2004–2008 (in Constant
2008 Dollars)
Figure 7.1d Average Aid per Full-Time Equivalent (FTE) Student in Constant
2010 Dollars, 1973-74 to 2010-11
Figure 7.1e Average Aid per Undergraduate FTE in Constant 2010 Dollars,
1995-96 to 2010-11
Figure 7.1f Average Aid per Graduate FTE in Constant 2010 Dollars,
1995-96 to 2010-11
Figure 7.1g Total Undergraduate Student Aid by Source (in Billions), 2010-11
Figure 7.1h Number of Recipients of Federal Aid by Program (with Average
Aid Received), 2009-10
Figure 7.1i Proportion of Undergraduate Students Borrowing Federal
Stafford Loans, 2000-01, 2005-06 and 2010-11
Figure 7.2a Public Four Year: Average Total Debt Levels of Bachelor’s Degree
Recipients in Constant 2010 Dollars, 1999–2000 to 2009-10
Figure 7.2b Private Nonprofi t Four Year: Average Total Debt Levels of
Bachelor’s Degree Recipients in Constant 2010 Dollars,
1999–2000 to 2009-10
Figure 7.2c Distribution of Total Undergraduate Debt by Sector and Type of
Degree or Certifi cate, 2007-08
Figure 7.2d Median Debt Levels of 2007-08 Bachelor’s Degree Recipients
at Public Four-Year Institutions Who Borrowed and Percentage
with Debt, by Dependency Status and Family Income
Figure 7.2e Median Debt Levels of 2007-08 Bachelor’s Degree Recipients
at Private Nonprofi t Four-Year Institutions Who Borrowed and
Percentage with Debt, by Dependency Status and Family
Income
Figure 7.2f Median Debt Levels of 2007-08 Bachelor’s Degree Recipients at
For-Profi t Four-Year Institutions Who Borrowed and Percentage
with Debt, by Dependency Status and Family Income
Figure 8.1a Total Appropriations in Constant 2010 Dollars (in Billions),
1980-81 to 2010-11
345

completionagenda.collegeboard.org
Figure 8.1b Appropriations per Public FTE Student in Constant 2010 Dollars
(in Thousands), 1980-81 to 2010-11
Figure 8.1c Educational Fiscal Support by State Rank, FY 2010–2011
Figure 8.1d Educational Fiscal Support per FTE by State Rank,
FY 2010–2011
Figure 8.2a Average Estimated Undergraduate Budgets by Type and Control
of Institution, 2011–12 (Enrollment Weighted)
Figure 8.2b Average Published Charges for Undergraduates by Carnegie
Classifi cation, 2011-12 (Enrollment Weighted)
Figure 8.2c Average Annual Percentage Increases in Infl ation-Adjusted
Published Prices by Decade, 1981-82 to 2011-12
Figure 8.2d Infl ation-Adjusted Published Tuition and Fees Relative to
1981-82, 1981-82 to 2011-12 (1981-82 = 100)
Figure 8.2e In-State Tuition Prices at Public Two-Year Institutions by State
Rank, 2011–2012
Figure 8.2f In-State Tuition Prices at Public Four-Year Institutions by State
Rank, 2011–2012
Figure 8.2g Tuition Prices at Private Four-Year Institutions by State Rank,
2011–2012
Figure 8.3 Average Net Tuition and Fees, and Room and Board in Constant
2011 Dollars for Full-Time Undergraduate Students, 2011-12
(Estimated)
Figure 8.4 Percentage Change in Infl ation-Adjusted Mean Family Income
by Quintile, 1980–1990, 1990–2000 and 2000–2010
Figure 8.5 Average Earnings of Full-Time Workers Ages 25–34, 2009
Figure 9.1a National Full-Time Freshman-to-Sophomore Retention Rates,
2007–2008
Figure 9.1b National Part-Time Freshman-to-Sophomore Retention Rates,
2007–2008
Figure 9.1c Full-Time Freshman-to-Sophomore Retention Rates at Public
Two-Year Colleges by State Rank, 2008
Appendix 346

completionagenda.collegeboard.org
Figure 9.1d Full-Time Freshman-to-Sophomore Retention Rates at Public
Four-Year Colleges by State Rank, 2008
Figure 9.1e Full-Time Freshman-to-Sophomore Retention Rates at Private
Not-for-Profi t Four-Year Colleges by State Rank, 2008
Figure 9.2a National Three-Year Graduation Rates of Degree- and Certifi cate-
Seeking Students at Two-Year Colleges, 2002–2008
Figure 9.2b National Three-Year Graduation Rates of Degree- and Certifi cate-
Seeking Students at Two-Year Colleges by Race/Ethnicity, 2008
Figure 9.2c Three-Year Graduation Rates of Degree- and Certifi cate-Seeking
Students at Two-Year Colleges by State Rank, 2008
Figure 9.2d Three-Year Graduation Rates of Degree- and Certifi cate-Seeking
Students at Public Two-Year Colleges by State Rank, 2008
Figure 9.2e Three-Year Graduation Rates of Degree- and Certifi cate-Seeking
Students at Private Not-for-Profi t Two-Year Colleges by State
Rank, 2008
Figure 9.2f Three-Year Graduation Rates of Degree- and Certifi cate-
Seeking Students at Private For-Profi t Two-Year Colleges by
State Rank, 2008
Figure 9.2g Three-Year Graduation Rates of Asian, Native Hawaiian and
Other Pacifi c Islander Degree- and Certifi cate-Seeking Students
at Two-Year Colleges by State Rank, 2008
Figure 9.2h Three-Year Graduation Rates of American Indian or Alaska
Native Degree- and Certifi cate-Seeking Students at Two-Year
Colleges by State Rank, 2008
Figure 9.2i Three-Year Graduation Rates of African American Degree-
and Certifi cate-Seeking Students at Two-Year Colleges by State
Rank, 2008
Figure 9.2j Three-Year Graduation Rates of Hispanic Degree- and
Certifi cate-Seeking Students at Two-Year Colleges by State
Rank, 2008
Figure 9.2k Three-Year Graduation Rates of White Degree- and Certifi cate-
Seeking Students at Two-Year Colleges by State Rank, 2008
347

completionagenda.collegeboard.org
Figure 9.2l National Four-Year Graduation Rates of Degree- and Certifi cate-
Seeking Students at Two-Year Colleges, 2008
Figure 9.2m Four-Year Graduation Rates of Degree- and Certifi cate-Seeking
Students at Two-Year Colleges by State Rank, 2008
Figure 9.2n Four-Year Graduation Rates of Degree- and Certifi cate-Seeking
Students at Public Two-Year Colleges by State Rank, 2008
Figure 9.2o Four-Year Graduation Rates of Degree- and Certifi cate-Seeking
Students at Private Not-for-Profi t Two-Year Colleges by State
Rank, 2008
Figure 9.2p Four-Year Graduation Rates of Degree- and Certifi cate-Seeking
Students at Private For-Profi t Two-Year Colleges by State
Rank, 2008
Figure 9.3a National Six-Year Graduation Rates of Bachelor’s Degree–
Seeking Students, 2002–2008
Figure 9.3b National Six-Year Graduation Rates of Bachelor’s Degree–
Seeking Students by Race/Ethnicity, 2008
Figure 9.3c Six-Year Bachelor’s Degree Attainment Rates of Students
Beginning at Four-Year Colleges, 2003–2004
Figure 9.3d Six-Year Graduation Rates of Bachelor’s Degree–Seeking
Students at Four-Year Colleges by State Rank, 2008
Figure 9.3e Six-Year Graduation Rates of Bachelor’s Degree–Seeking
Students at Public Four-Year Colleges by State Rank, 2008
Figure 9.3f Six-Year Graduation Rates of Bachelor’s Degree–Seeking
Students at Private Not-for-Profi t Four-Year Colleges by State
Rank, 2008
Figure 9.3g Six-Year Graduation Rates of Bachelor’s Degree–Seeking
Students at Private For-Profi t Four-Year Colleges by State
Rank, 2008
Figure 9.3h Six-Year Graduation Rates of Asian, Native Hawaiian and
Other Pacifi c Islander Bachelor’s Degree–Seeking Students
at Four-Year Colleges by State Rank, 2008
Figure 9.3i Six-Year Graduation Rates of American Indian or Alaska Native
Bachelor’s Degree–Seeking Students at Four-Year Colleges by
State Rank, 2008
Appendix 348

completionagenda.collegeboard.org
Figure 9.3j Six-Year Graduation Rates of Black or African American
Bachelor’s Degree–Seeking Students at Four-Year Colleges
by State Rank, 2008
Figure 9.3k Six-Year Graduation Rates of Hispanic or Latino Bachelor’s
Degree–Seeking Students at Four-Year Colleges by State
Rank, 2008
Figure 9.3l Six-Year Graduation Rates of White Bachelor’s Degree–Seeking
Students at Four-Year Colleges by State Rank, 2008
Figure 9.3m National Eight-Year Graduation Rates of Bachelor’s Degree–
Seeking Students, 2008
Figure 9.3n Eight-Year Graduation Rates of Bachelor’s Degree–Seeking
Students at Four-Year Colleges by State Rank, 2008
Figure 9.3o Eight-Year Graduation Rates of Bachelor’s Degree–Seeking
Students at Public Four-Year Colleges by State Rank, 2008
Figure 9.3p Eight-Year Graduation Rates of Bachelor’s Degree–Seeking
Students at Private Not-for-Profi t Four-Year Colleges by State
Rank, 2008
Figure 9.3q Eight-Year Graduation Rates of Bachelor’s Degree–Seeking
Students at Private For-Profi t Four-Year Colleges by State
Rank, 2008
Figure 9.4a Number of Degrees Awarded by Degree Type for the Nation
from 2001–2009
Figure 9.4b Number of Degrees Granted in the Nation by Sector, 2009
Figure 9.4c Number of Degrees Granted in the Nation by Race/Ethnicity,
2009
Figure 9.4d Number of Degrees Granted by Gender, 2009
Figure 9.4e Total Degrees Awarded by Major CIP Code, 2009
Figure 9.4f Number of Associate Degrees Awarded by State Rank, 2009
Figure 9.4g Number of Bachelor’s Degrees Awarded by State Rank, 2009
Figure 9.4h Number of Master’s Degrees Awarded by State Rank, 2009
Figure 9.4i Number of Doctoral Degrees Awarded by State Rank, 2009
349

completionagenda.collegeboard.org
Figure 9.4j Number of Professional Degrees Awarded by State Rank, 2009
Figure 10.1a National Educational Attainment of Adults Ages 25–34, 2009
Figure 10.1b National Educational Attainment of Adults Ages 25–34 by Race/
Ethnicity, 2009
Figure 10.1c Percentage of Adults Ages 25–34 with Less Than a High School
Diploma by State Rank, 2009
Figure 10.1d Percentage of Adults Ages 25–34 with Only a High School
Diploma but No College by State Rank, 2009
Figure 10.1e Percentage of Adults Ages 25–34 with Some College but No
Degree by State Rank, 2009
Figure 10.2a National Percentage of Adults Ages 25–34 with No High School
Diploma Who Were GED Candidates, 2005–2009
Figure 10.2b Percentage of Adults Ages 25–34 with No High School Diploma
Who Were GED Candidates by State Rank, 2009
Figure 10.2c National Percentage of Adults Ages 25–34 with No High School
Diploma Who Attained a GED, 2005–2009
Figure 10.2d Percentage of Adults Ages 25–34 with No High School Diploma
Who Attained a GED by State Rank, 2009
Figure 10.3a National Percentage of Adults Ages 25–34 Enrolled in
Postsecondary Education, 2003–2007
Figure 10.3b Percentage of Adults Ages 25–34 Enrolled in Postsecondary
Education, 2007
Appendix 350

completionagenda.collegeboard.org
Overview
Fig. Description US Average
A Percentage of 25- to 34-Year-Olds with an Associate Degree or Higher, 2008 41.6%
B Percentage of 25- to 64-Year-Olds with an Associate Degree or Higher, 2008 41.1%
C Percentage of 55- to 64-Year-Olds with an Associate Degree or Higher, 2008 40.0%
D Percentage of 25- to 34-Year-Olds with an Associate Degree or Higher in the United States, 2000–2009 41.1%
Recommendation OneProvide a program of voluntary preschool education, universally available to children from low-income families
Fig. Description US Average
1.1c Percentage of 3- and 4-Year-Olds Enrolled in Preschool or Kindergarten Programs by State Rank, 2006–2008 47.5%
1.1d Percentage of 3-Year-Olds Enrolled in Preschool or Kindergarten Programs by State Rank, 2006–2008 34.4%
1.1e Percentage of 4-Year-Olds Enrolled in Preschool or Kindergarten Programs by State Rank, 2006–2008 60.7%
1.1f Percentage of Asian 3- and 4-Year-Olds Enrolled in Preschool or Kindergarten Programs by State Rank, 2006–2008 53.3%
1.1g Percentage of American Indian and/or Alaska Native 3- and 4-Year-Olds Enrolled in Preschool or Kindergarten Programs by State Rank, 2006–2008 45.0%
1.1h Percentage of Black 3- and 4-Year-Olds Enrolled in Preschool or Kindergarten Programs by State Rank, 2006–2008 52.5%
1.1i Percentage of Hispanic 3- and 4-Year-Olds Enrolled in Preschool or Kindergarten Programs by State Rank, 2006–2008 38.5%
1.1j Percentage of White 3- and 4-Year-Olds Enrolled in Preschool or Kindergarten Programs by State Rank, 2006–2008 49.8%
1.1k Percentage of Two or More Races 3- and 4-Year-Olds Enrolled in Preschool or Kindergarten Programs by State Rank, 2006–2008 49.9%
1.2a Percentage of 3- and 4-Year-Olds Enrolled in State-Funded Pre-K Programs by State Rank, 2009 14.6%
1.2b Percentage of 3-Year-Olds Enrolled in State-Funded Pre-K Programs by State Rank, 2009 3.7%
1.2c Percentage of 4-Year-Olds Enrolled in State Funded Pre-K Programs by State Rank, 2009 25.4%
1.3a Percentage of 3- and 4-Year-Olds Enrolled in Head Start Programs by State Rank, 2009 8.6%
1.3b Percentage of 3-Year-Olds Enrolled in Head Start Programs by State Rank, 2009 7.1%
1.3c Percentage of 4-Year-Olds Enrolled in Head Start Programs by State Rank, 2009 10.0%
Recommendation TwoImprove middle school and high school college counseling
Fig. Description US Average
2.1b Student-to-Counselor Ratio by State Rank, 2009 457
2.1c National Student-to-College Counselor Ratio by School Type, 2005–2009 320
2.2 States with Comprehensive School Counseling Programs, 2008 62.7%
2.3a Percentage of Secondary Schools That Require Professional Development by School Type, 2006–2009 31.3%
2.3b Percentage of Secondary Schools That Cover All Professional Development Costs by School Type, 2006-2009 32.2%
2.4a Percentage of Counselors' Time Spent on Postsecondary Admission Counseling by School Type, 2004–2009 26.0%
National Summary
351

completionagenda.collegeboard.org
Recommendation ThreeImplement the best research-based dropout prevention programs
Fig. Description US Average
3.1c Average Graduation Rates for Public High School Students by State Rank, 2008 74.9%
3.1d Average Graduation Rates for Asian American/Pacifi c Islander Public High School Students by State Rank, 2008 91.4%
3.1e Average Graduation Rates for American Indian/Alaska Native Public High School Students by State Rank, 2008 64.2%
3.1f Average Graduation Rates for African American Public High School Students by State Rank, 2008 61.5%
3.1g Average Graduation Rates for Hispanic Public High School Students by State Rank, 2008 63.5%
3.1h Average Graduation Rates for White Public High School Students by State Rank, 2008 81.0%
3.1i States with Exit Examinations, 2010 49.0%
3.1j States Where End-of-Course Exams Are Used as the Exit Exam, 2010 19.6%
3.1k States That Have Reciprocity with Other States' Exit Exams, 2010 13.7%
3.1l States with Substitute Assessments, 2010 23.5%
3.1m States with Alternative Diploma or Certifi cate, 2010 17.7%
3.2a National Status Dropout Rates — Excluding Institutional Populations, 1999-2008 8.0%
3.3a National Status Dropout Rates — Including Institutional Populations, 1999-2008 9.1%
3.4d State Statutory Age when Students Can Legally Drop Out, 2010 17
3.4e Event Dropout Rates forPublic High School Students in Grades 9-12 by State Rank, 2008 4
3.4f Event Dropout Rates for Asian American or Pacifi c Islander Public High School Students in Grades 9-12 by State Rank, 2008 2.4%
3.4g Event Dropout Rates for American Indian or Alaska Native Public High School Students in Grades 9-12 by State Rank, 2008 7.3%
3.4h Event Dropout Rates for African American Public High School Students in Grades 9-12 by State Rank, 2008 6.7%
3.4i Event Dropout Rates for White Public School Students in Grades 9-12 by State Rank, 2008 2.8%
3.4j Event Dropout Rates for Hispanic Public School Students in Grades 9-12 by State Rank, 2008 6.0%
3.4k Event Dropout Rates for Public School Students in Ninth Grade by State Rank, 2008 3.0%
3.4l Event Dropout Rates for Public School Students in 10th Grade by State Rank, 2008 3.6%
3.4m Event Dropout Rates for Public School Students in 11th Grade by State Rank, 2008 4.0%
3.4n Event Dropout Rates for Public School Students in 12th Grade by State Rank, 2008 6.1%
Recommendation FourAlign the K–12 education system with international standards and college admission expectations
Fig. Description US Average
4.1a Percentage of Public High Schools Offering AP or IB Courses in the Four Core Subject Areas, 2010 33.7%
4.1b Percentage of Public High Schools Offering Advanced Placement (AP) in the Four Core Subject Areas, 2010 32.6%
4.1g Percentage of Public High School Students Taking an AP Exam, Class of 2010 28.3%
4.1h Percentage of Public High School Students Scoring 3 or Higher on an AP Exam, Class of 2010 16.9%
4.1i AP Equity and excellence achieved by African American students in the Class of 2010 26.7%
4.1j AP Equity and excellence achieved by Hispanic Students in the Class of 2010 86.9%
4.1k AP Equity and excellence achieved by American Indian or Alaska Native students in the Class of 2010 36.4%
4.1l Percentage of Public High Schools Offering International Baccalaureate (IB) Courses in the Four Core Subject Areas, 2010 2.9%
4.2a National Percentage of Schools That Offer Dual Enrollment and Mean Percentage of Students enrolled in Dual Enrollment, 2009 83.6%
4.3a Percentage of States with Alignment Between High School Standards and College and Workplace Expectations, 2010 60.8%
4.3b Percentage of States with Alignment Between High School Graduation Requirements and College and Workplace Expectations, 2010 41.2%
4.3c Percentage of States with College- and Career-Ready Assessment Systems, 2010 27.5%
4.3d Percentage of States with P-20 Longitudinal Data Systems, 2010 31.4%
4.3e Percentage of States That Have Adopted the National Common Core Standards, 2010 82.4%
4.4a Percentage of First- and Second-Year Undergraduates in Remedial Courses After High School Graduation, 2008 37.6%
Appendix 352

completionagenda.collegeboard.org
National Summary
Recommendation FiveImprove teacher quality and focus on recruitment and retention
Fig. Description US Average
5.1a States with Professional Development Standards, 2010 78.4%
5.1b States That Finance Professional Development for All Districts, 2010 47.1%
5.1c States That Require Districts/Schools to Set Aside Time for Professional Development, 2010 31.4%
5.1d States That Require Districts to Align Professional Development with Local Priorities and Goals, 2010 60.8%
5.1e States That Provide Incentives for Teachers to Earn National Board Certifi cation, 2010 60.8%
5.3a States That Require Parental Notifi cation of Out-of-Field Teachers, 2010 11.8%
5.3b States That Have a Ban or Cap on the Number of Out-of-Field Teachers, 2010 7.8%
5.4d Percentage of Bachelor's and Master's Degrees Earned in Education by State Rank, 2008 12.7%
5.4e Percentage of Bachelor's Degrees Earned in Education by State Rank, 2008 6.6%
5.4f Percentage of Master's Degrees Earned in Education by State Rank, 2008 28.1%
5.5a National Percentage of Public School Teachers Leaving the Profession by School Type, 2009 8.0%
5.5a National Percentage of Private School Teachers Leaving the Profession by School Type, 2009 15.9%
5.6a Percentage of States in Which Teacher Evaluation Is Tied to Student Achievement, 2010 25.5%
5.6b Percentage of States in Which Teacher and Student Records Can Be Matched by Course/Subject and State Assessment Results, 2010 39.2%
5.6c Percentage of States in Which Teachers Are Assigned a Unique Identifi cation Number, 2010 100.0%
5.7 Percentage of Public K–12 Teachers with Less than three years of Experience 13.4%
5.7 Percentage of Public K–12 Teachers with Three to Nine Years of Experience 33.6%
5.7 Percentage of Public K–12 Teachers with 10 to 20 years of Experience 29.3%
5.7 Percentage of Public K–12 Teachers with Over 20 years of Experience 23.7%
Recommendation SixClarify and simplify the admission process
Fig. Description US Average
6.1b Percentage of Four-Year Colleges with Admission Applications Available Online by State Rank, 2009 82.0%
6.2b Percentage of Four-Year Colleges to Which Students Can Submit Admission Applications Online by State Rank, 2009 75.2%
6.3b Percentage of Four-Year Colleges That Use the Common Application, Universal College Application or Common Black College Application by State Rank, 2009 22.8%
6.3c States with Statewide Common Applications for Public 4-Year College and Universities, 2011 33.3%
6.4a Percentage of High School Completers Enrolled in Two- or Four-Year Colleges Immediately Following High School Completion, 2008 68.6%
6.4f Rate of High School Graduates Going to College by State Rank, 2008 63.8%
6.4g Rate of High School Graduates Going to College In State by State Rank, 2008 51.8%
6.4h Rate of High School Graduates Going to College Out of State by State Rank, 2008 12.0%
353

completionagenda.collegeboard.org
Recommendation SevenProvide more need-based grant aid while simplifying the fi nancial aid system and making it more transparent
Fig. Description US Average
7.1a Average Total Grant Aid per Low-Income Dependent Student at Public Two-Year Institutions, 2011 $3,252
7.1a Average Total Grant Aid per Low-Income Dependent Student at Public Four-Year Institutions, 2011 $7,364
7.1a Average Total Grant Aid per Low-Income Dependent Student at Private Not-for-Profi t Four-Year Institutions, 2011 $14,215
7.1a Average Total Grant Aid per Low-Income Dependent Student at Private For-Profi t Four-Year Institutions, 2011 $3,745
7.1g Total Undergraduate Student Aid by Source (in Billions), 2010-11 $178
7.2a Public Four Year: Average Total Debt Levels of Bachelor’s Degree Recipients in Constant 2010 Dollars, 1999–2000 to 2009-10 $22,000
7.2b Private Nonprofi t Four Year: Average Total Debt Levels of Bachelor’s Degree Recipients in Constant 2010 Dollars, 1999–2000 to 2009-10 $18,300
Recommendation EightKeep college affordable
Fig. Description US Average
8.1a Total Appropriations (in Billions), 1980-81 to 2010-11 $79
8.1b Appropriations per Public FTE Student in Constant 2010 Dollars (in Thousands), 1980-81 to 2010-11 $7,171
8.2e In-State Tuition Prices at Public Two-Year Institutions by State Rank, 2011–2012 $3,387
8.2f In-State Tuition Prices at Public Four-Year Institutions by State Rank, 2011–2012 $8,043
8.2g Tuition Prices at Private Four-Year Institutions by State Rank, 2011–2012 $25,869
8.3 Public Two-Year Net Tuition and Fees for Full-Time Undergraduate Students, 2011-12 -$810
8.3 Public Four-Year Net Tuition and Fees for Full-Time Undergraduate Students, 2011-12 $2,490
8.3 Public Nonprofi t-Year Net Tuition and Fees for Full-Time Undergraduate Students, 2011-12 $12,970
8.4 Percentage Change in Infl ation-Adjusted Mean Family Income by Quintile, 1980–1990, 1990–2000 and 2000–2010 -16.0%
8.5 Average Earnings of Full-Time Workers Ages 25–34 with a High School Diploma $34,594
8.5 Average Earnings of Full-Time Workers Ages 25–34 with an Associate Degree $42,391
8.5 Average Earnings of Full-Time Workers Ages 25–34 with a Bachelor’s Degree $53,483
8.5 Average Earnings of Full-Time Workers Ages 25–34 with a Bachelor’s Degree or Higher $59,690
Appendix 354

completionagenda.collegeboard.org
National Summary
Recommendation NineDramatically increase college completion rates
Fig. Description US Average
9.1c Full-time Freshman-to-Sophomore Retention Rates at Public Two-Year Colleges by State Rank, 2008 60.0%
9.1d Full-time Freshman-to-Sophomore Retention Rates at Public Four-Year Colleges by State Rank, 2008 78.2%
9.1e Full-time Freshman-to-Sophomore Retention Rates at Private Not-for-Profi t Four-Year Colleges by State Rank, 2008 79.1%
9.2d Three-Year Graduation Rates of Degree- and Certifi cate-Seeking Students at Public Two-Year Colleges by State Rank, 2008 20.6%
9.2e Three-Year Graduation Rates of Degree- and Certifi cate-Seeking Students at Private Not-for-Profi t Two-Year Colleges by State Rank, 2008 48.3%
9.2f Three-Year Graduation Rates of Degree- and Certifi cate-Seeking Students at Private For-Profi t Two-Year Colleges by State Rank, 2008 57.7%
9.2g Three-Year Graduation Rates of Asian, Native Hawaiian and Other Pacifi c Islander Degree- and Certifi cate-Seeking Students at Two-Year Colleges by State Rank, 2008 31.5%
9.2h Three-Year Graduation Rates of American Indian or Alaska Native Degree- and Certifi cate-Seeking Students at Two-Year Colleges by State Rank, 2008 24.9%
9.2i Three-Year Graduation Rates of African American Degree- and Certifi cate-Seeking Students at Two-Year Colleges by State Rank, 2008 22.6%
9.2j Three-Year Graduation Rates of Hispanic Degree- and Certifi cate-Seeking Students at Two-Year Colleges by State Rank, 2008 25.7%
9.2k Three-Year Graduation Rates of White Degree- and Certifi cate-Seeking Students at Two-Year Colleges by State Rank, 2008 28.5%
9.2m Four-Year Graduation Rates of Degree- and Certifi cate-Seeking Students at Two-Year Colleges by State Rank, 2008 34.1%
9.2n Four-Year Graduation Rates of Degree- and Certifi cate-Seeking Students at Public Two-Year Colleges by State Rank, 2008 26.7%
9.2o Four-Year Graduation Rates of Degree- and Certifi cate-Seeking Students at Private Not-for-Profi t Two-Year Colleges by State Rank, 2008 54.9%
9.2p Four-Year Graduation Rates of Degree- and Certifi cate-Seeking Students at Private For-Profi t Two-Year Colleges by State Rank, 2008 63.8%
9.3d Six-Year Graduation Rates of Bachelor's Degree–Seeking Students at Four-Year Colleges by State Rank, 2008 57.7%
9.3e Six-Year Graduation Rates of Bachelor's Degree–Seeking Students at Public Four-Year Colleges by State Rank, 2008 55.3%
9.3f Six-Year Graduation Rates of Bachelor's Degree–Seeking Students at Private Not-for-Profi t Four-Year Colleges by State Rank, 2008 65.1%
9.3g Six-Year Graduation Rates of Bachelor's Degree–Seeking Students at Private For-Profi t Four-Year Colleges by State Rank, 2008 23.5%
9.3h Six-Year Graduation Rates of Asian, Native Hawaiian and Other Pacifi c Islander Bachelor's Degree–Seeking Students at Four-Year Colleges by State Rank, 2008 67.5%
9.3i Six-Year Graduation Rates of American Indian or Alaska Native Bachelor's Degree–Seeking Students at Four-Year Colleges by State Rank, 2008 38.5%
9.3j Six-Year Graduation Rates of African American Bachelor's Degree–Seeking Students at Four-Year Colleges by State Rank, 2008 40.5%
9.3k Six-Year Graduation Rates of Hispanic Bachelor's Degree–Seeking Students at Four-Year Colleges by State Rank, 2008 49.4%
9.3l Six-Year Graduation Rates of White Bachelor's Degree–Seeking Students at Four-Year Colleges by State Rank, 2008 60.7%
9.3n Eight-Year Graduation Rates of Bachelor's Degree–Seeking Students at Four-Year Colleges by State Rank, 2008 60.6%
9.3o Eight-Year Graduation Rates of Bachelor's Degree–Seeking Students at Public Four-Year Colleges by State Rank, 2008 58.3%
9.3p Eight-Year Graduation Rates of Bachelor's Degree–Seeking Students at Private Not-for-Profi t Four-Year Colleges by State Rank, 2008 66.4%
9.3q Eight-Year Graduation Rates of Bachelor's Degree–Seeking Students at Private For-Profi t Four-Year Colleges by State Rank, 2008 37.8%
9.4a Number of Associate Degrees Awarded by Degree Type for the Nation, 2009 1,577,136
9.4a Number of Bachelor's Degrees Awarded by Degree Type for the Nation, 2009 3,366,858
9.4a Number of Master's Degrees Awarded by Degree Type for the Nation, 2009 1,326,210
9.4a Number of Doctoral Degrees Awarded by Degree Type for the Nation, 2009 100,002
9.4a Number of Professional Degrees Awarded by Degree Type for the Nation, 2009 74,542
355
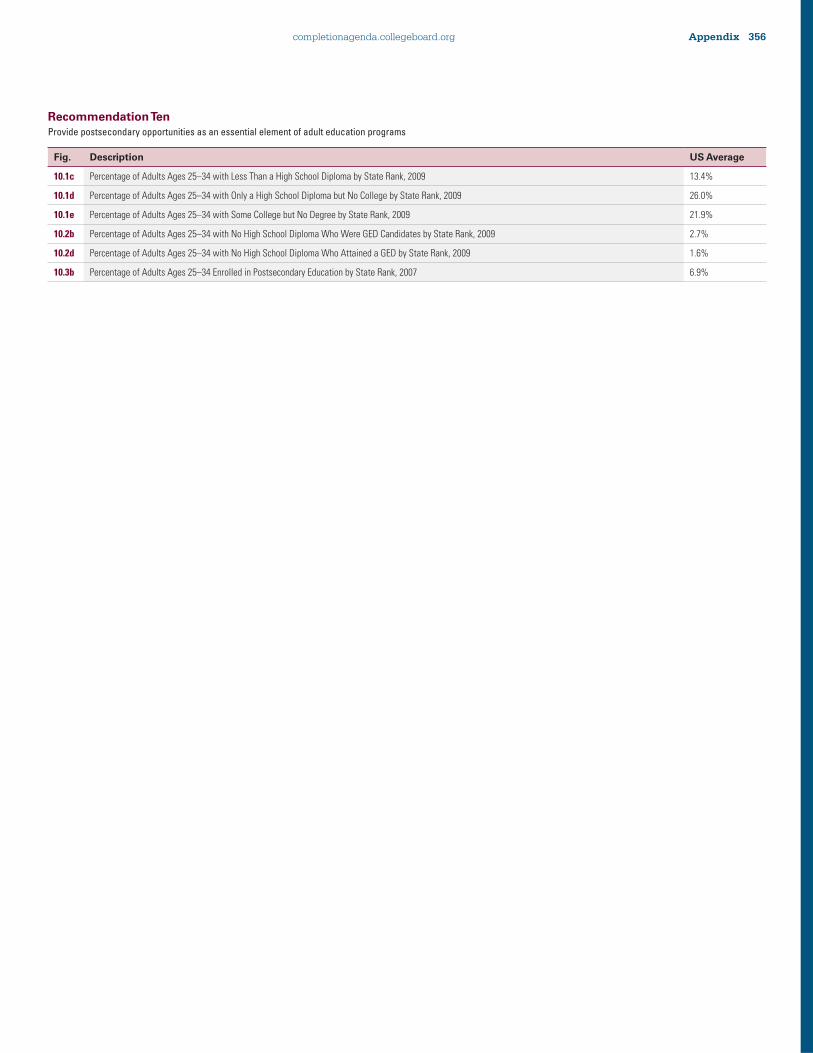
completionagenda.collegeboard.org
Recommendation TenProvide postsecondary opportunities as an essential element of adult education programs
Fig. Description US Average
10.1c Percentage of Adults Ages 25–34 with Less Than a High School Diploma by State Rank, 2009 13.4%
10.1d Percentage of Adults Ages 25–34 with Only a High School Diploma but No College by State Rank, 2009 26.0%
10.1e Percentage of Adults Ages 25–34 with Some College but No Degree by State Rank, 2009 21.9%
10.2b Percentage of Adults Ages 25–34 with No High School Diploma Who Were GED Candidates by State Rank, 2009 2.7%
10.2d Percentage of Adults Ages 25–34 with No High School Diploma Who Attained a GED by State Rank, 2009 1.6%
10.3b Percentage of Adults Ages 25–34 Enrolled in Postsecondary Education by State Rank, 2007 6.9%
Appendix 356

completionagenda.collegeboard.org
INDICATORS
AL
AK
AZ
AR
CA
CO
CT
DE
DC
FL GA
HI
ID IL IN IA KS
KY
LA ME
MD
MA
MI
MN
OverviewG Percentage of Adults Ages 25 to 34 with an Associate Degree or Higher in the United States, 2009
31.2
%
30.6
%
32.3
%
27.9
%
37.5
%
42.3
%
45.7
%
39.4
%
64.0
%
36.4
%
35.9
%
41.0
%
32.2
%
43.8
%
34.8
%
44.5
%
40.3
%
31.9
%
28.8
%
37.7
%
45.3
%
53.9
%
36.1
%
49.6
%
Recommendation OneProvide a program of voluntary preschool education, universally available to children from low-income families
1.1c Percentage of 3- and 4-Year-Olds Enrolled in Preschool or Kindergarten Programs by State Rank, 2006–2008
44.5
40.5
33.3
49.8
49.7
45.6
61.8
47.6
68.5
50.9
50.4
52.8
33.6
53.6
40.1
44.3
45.0
44.7
52.2
37.4
50.1
60.4
47.8
44.4
1.1d Percentage of 3-Year-Olds Enrolled in Preschool or Kindergarten Programs by State Rank, 2006–2008
33.4
30.1
23.4
38.5
35.9
33.2
49.2
35.8
51.5
39.5
36.0
40.7
24.1
39.1
26.1
28.2
31.1
30.1
35.9
27.1
37.0
48.1
31.6
30.7
1.1e Percentage of 4-Year-Olds Enrolled in Preschool or Kindergarten Programs by State Rank, 2006–2008
54.9
51.4
43.2
60.8
63.4
58.2
73.8
60.9
84.7
62.0
65.2
65.5
44.4
67.8
53.8
59.6
58.8
58.0
68.6
48.1
63.2
72.8
63.7
58.5
1.1f Percentage of Asian 3- and 4-Year-Olds Enrolled in Preschool or Kindergarten Programs by State Rank, 2006–2008
29.7
44.4
56.6
41.7
55.6
50.0
50.1
56.5
64.8
51.7
47.2
55.7
42.1
49.0
41.2
57.5
66.5
44.8
1.1g Percentage of American Indian or Alaska Native 3- and 4-Year-Olds Enrolled in Preschool or Kindergarten Programs by State Rank, 2006–2008
55.9
33.7
48.4
57.3
37.6
1.1h Percentage of Black 3- and 4-Year-Olds Enrolled in Preschool or Kindergarten Programs by State Rank, 2006–2008
49.2
31.7
63.0
52.7
40.7
58.5
50.7
62.0
56.7
53.3
57.0
44.5
51.7
43.7
53.8
56.1
48.6
66.1
48.8
41.7
1.1i Percentage of Hispanic 3- and 4-Year-Olds Enrolled in Preschool or Kindergarten Programs by State Rank, 2006–2008
21.8
23.3
37.3
42.0
33.0
50.7
44.6
76.5
42.9
29.9
49.2
21.6
39.7
33.2
36.6
32.2
42.5
44.2
35.3
46.1
44.5
34.5
1.1j Percentage of White 3- and 4-Year-Olds Enrolled in Preschool or Kindergarten Programs by State Rank, 2006–2008
44.6
37.4
43.4
48.4
59.5
53.2
66.7
46.8
79.8
53.2
54.3
46.2
35.0
57.8
40.1
44.8
47.6
44.4
49.9
38.3
55.2
63.2
47.4
45.9
1.1k Percentage of Two or More Races 3- and 4-Year-Olds Enrolled in Preschool or Kindergarten Programs by State Rank, 2006–2008
48.2
34.2
46.7
40.0
59.5
46.1
54.9
52.4
55.6
57.8
53.4
60.4
42.7
42.2
46.5
35.2
54.3
54.0
64.7
47.1
43.9
1.2a Percentage of 3- and 4-Year-Olds Enrolled in State-Funded Pre-K Programs by State Rank, 2009
2.8
2.7
24.6 9.0
13.0 9.6
3.6
33.1
26.7
25.0
14.9
10.6
19.1
15.9 9.6
18.2 7.1
9.6
1.4
1.2b Percentage of 3-Year-Olds Enrolled in State-Funded Pre-K Programs by State Rank, 2009
0.0
0.0
5.9
5.4
6.0
8.2
0.0
0.0
0.0
21.2 1.3
0.0
10.0 0.0
0.0
1.2
2.9
0.0
1.1
1.2c Percentage of 4-Year-Olds Enrolled in State-Funded Pre-K Programs by State Rank, 2009
5.5
5.4
43.7
12.6
20.2
10.9 7.3
66.7
53.4
28.7
28.7
21.2
28.3
31.7
19.0
35.1
11.3
19.1 1.6
1.3a Percentage of 3- and 4-Year-Olds Enrolled in Head Start Programs by State Rank, 2009
12.5 5.9
5.4
12.2 8.4
6.0
6.8
5.3
17.7 7.1
7.4
8.0
5.1
9.5
7.1
8.3
8.0
13.1
15.9 8.9
6.4
7.1
12.4 6.2
1.3b Percentage of 3-Year-Olds Enrolled in Head Start Programs by State Rank, 2009
9.3
4.9
3.4
11.5 5.8
4.8
5.7
3.5
12.9 5.5
8.2
5.7
2.3
8.3
5.3
7.1
7.6
9.9
16.8 7.4
6.6
6.2
10.1 5.0
1.3c Percentage of 4-Year-Olds Enrolled in Head Start Programs by State Rank, 2009
15.7 6.9
7.5
13.0
11.0 7.2
7.8
7.1
22.5 8.8
6.7
10.1 7.8
10.6 8.9
9.5
8.3
16.2
15.0
10.5 6.1
8.0
14.8 7.4
State Summaries
357

completionagenda.collegeboard.org
MS
MO
MT
NE
NV
NH
NJ
NM
NY
NC
ND
OH
OK
OR
PA RI
SC
SD
TN TX UT
VT
VA WA
WV
WI
WY
US
OverviewG
30.7
%
37.6
%
38.5
%
44.0
%
28.1
%
46.2
%
46.4
%
28.7
%
48.9
%
37.8
%
48.5
%
36.8
%
31.1
%
37.1
%
43.3
%
43.3
%
34.6
%
42.2
%
32.3
%
31.4
%
38.2
%
44.7
%
44.1
%
41.7
%
28.9
%
40.7
%
33.7
%
41.1
%
Recommendation OneProvide a program of voluntary preschool education, universally available to children from low-income families
1.1c
51.5
42.7
38.7
39.9
27.6
49.6
65.2
38.5
57.7
47.6
35.8
44.3
43.0
41.0
48.4
47.6
48.6
39.7
39.3
42.0
39.2
53.4
48.8
41.0
37.1
43.0
42.5
47.5
1.1d
39.0
31.2
28.3
25.1
19.7
36.6
53.5
26.7
43.5
36.4
27.2
30.9
26.0
32.3
35.6
34.7
35.1
27.5
28.2
27.7
26.0
43.1
37.1
30.9
21.2
29.3
31.4
34.4
1.1e
64.4
54.3
47.9
54.5
35.6
61.6
77.1
50.2
72.4
58.8
44.6
57.8
59.8
50.0
61.6
61.4
62.1
53.1
50.2
56.5
53.2
62.8
60.3
51.7
51.5
57.0
53.1
60.7
1.1f
62.6
31.7
60.2
49.1
50.0
53.4
59.6
50.9
53.4
40.3
48.7
49.5
33.2
55.8
49.5
40.9
53.3
1.1g
52.8
42.9
48.3
40.7
28.8
47.1
31.3
60.4
51.1
47.7
65.1
45.0
1.1h
65.5
46.5
22.7
30.9
69.4
64.6
50.0
44.8
38.0
43.3
53.8
48.5
51.6
44.9
46.1
44.9
34.1
56.8
49.9
52.5
1.1i
20.8
37.0
32.2
39.7
19.2
36.8
59.6
35.5
48.9
30.4
42.9
32.3
30.9
38.4
27.2
31.0
24.0
36.1
27.6
35.7
26.5
42.4
37.1
38.5
1.1j
42.0
41.9
36.3
40.9
35.7
49.9
67.5
44.4
60.9
51.3
34.5
44.1
45.3
44.4
48.6
55.3
50.0
37.3
39.3
48.3
41.9
49.6
52.4
43.8
35.3
42.2
43.4
49.8
1.1k
50.1
43.2
41.6
23.3
66.8
38.7
62.6
43.8
44.4
42.8
33.9
46.7
40.5
43.7
42.6
45.9
35.6
47.1
50.0
47.7
40.4
49.9
1.2a 2.9
5.1
1.4
22.0 8.1
21.5
12.4 6.7
35.1 6.5
10.6
21.1
11.2
25.0
35.4 7.1
4.8
29.9
24.8
14.6
1.2b 1.9
2.9
0.6
17.3 0.0
0.1
0.0
5.3
0.0
4.8
4.8
4.1
0.8
4.7
17.3 0.0
2.4
8.5
1.0
3.7
1.2c 3.9
7.3
2.3
26.5
16.5
42.6
25.0 8.1
71.0 8.3
16.4
38.1
21.6
45.4
53.0
14.1 7.2
50.1
48.4
25.4
1.3a
29.4 9.6
10.8 8.0
2.4
4.5
6.1
9.8
9.0
6.7
12.8
10.6
12.0 5.8
9.3
7.4
9.8
9.8
9.1
7.7
4.8
8.5
5.8
5.4
16.8 8.2
9.9
8.6
1.3b
23.9 8.5
8.9
6.2
1.4
3.6
5.7
7.7
7.9
5.2
9.7
9.0
11.0 4.4
7.8
5.4
9.8
7.1
6.3
6.9
2.9
7.9
4.9
3.9
10.8 8.2
7.5
7.1
1.3c 8.5
10.8
12.7 9.7
3.3
5.5
6.4
12.0
10.2 8.3
15.9
12.3
13.0 7.3
10.7 9.2
9.8
12.6
11.8 8.6
6.7
9.1
6.8
6.8
22.7 8.1
12.4
10.0
Appendix 358

completionagenda.collegeboard.org
INDICATORS
AL
AK
AZ
AR
CA
CO
CT
DE
DC
FL GA
HI
ID IL IN IA KS
KY
LA ME
MD
MA
MI
MN
Recommendation TwoImprove middle school and high school college counseling
2.1c Student-to-Counselor Ratio by State Rank, 2008
7.5
467
743
333
814
387
507
440
275
434
449
272
434
672
540
354
419
459
238
318
348
432
638
759
2.2 States with Comprehensive School Counseling Programs 13
.0
Yes
Yes
Yes
No
No
Yes
Yes
No
Yes
Yes
No
Yes
Yes
Yes
Yes
Yes
No
Yes
Yes
No
Yes
Yes
No
Recommendation ThreeImplement the best research-based dropout prevention programs
3.1c Average Graduation Rates for Public High School Students by State Rank, 2008
7.2
69.1
70.7
76.4
71.2
75.4
82.2
72.1
56.0
66.9
65.4
76.0
80.1
80.4
74.1
86.4
79.1
74.4
63.5
79.1
80.4
81.5
76.3
86.4
3.1d Average Graduation Rates for Asian American or Pacifi c Islander Public High School Students by State Rank, 2008
7.8
76.6
98.5
100.
0
91.1
92.1
99.0 NA
74.4
91.4
92.9
77.3
91.5
100.
0
100.
0
93.2
93.4
100.
0
86.1
RSN
M
100.
0
89.1
94.8
87.9
3.1e Average Graduation Rates for American Indian or Alaska Native Public High School Students by State Rank, 2008
7.1
51.9
56.3
86.9
65.3
62.0
65.8 NA
100.
0
70.3
72.1
80.3
65.8
95.8
69.8
63.6
63.9
51.0
65.2
RSN
M
73.4
66.8
66.6
55.6
3.1f Average Graduation Rates for African American Public High School Students by State Rank, 2008
22.5
51.8
76.9
70.2
57.4
65.1
71.1 NA
58.8
55.7
57.4
69.6
78.2
61.5
52.6
71.9
64.7
67.8
53.3
RSN
M
73.0
69.6
59.2
66.6
3.1g Average Graduation Rates for Hispanic Public High School Students by State Rank, 2008
8.8
90.7
66.7
77.9
61.2
56.7
65.8 NA
54.2
63.9
55.4
71.3
68.7
69.6
66.6
70.2
62.2
75.6
72.3
RSN
M
75.9
64.7
63.8
62.3
3.1h Average Graduation Rates for White Public High School Students by State Rank, 2008
6.7
70.3
73.6
77.7
80.1
82.9
87.5 NA
88.9
70.1
70.7
72.7
81.7
87.7
75.9
88.0
82.4
74.2
71.9
RSN
M
84.9
84.4
81.6
90.3
3.4d Event Dropout Rates for Public School Students in Grades 9–12 by State Rank, 2008
10.1 7.3
6.7
4.7
5.0
6.4
2.8
6.0
5.5
3.3
4.3
5.4
2.0
5.2
1.7
2.9
2.5
2.8
7.5
4.4
3.6
3.4
6.2
2.8
3.4e Event Dropout Rates for Asian American or Pacifi c Islander Public School Students in Grades 9–12 by State Rank, 2008
7.8
6.9
3.8
2.8
2.3
3.8
1.5
NA
NA
1.1
1.3
5.1
1.2
1.7
0.7
2.6
1.5
1.6
3.4
3.7
NA
2.1
3.6
3.1
3.4f Event Dropout Rates for American Indian or Alaska Native Public School Students in Grades 9–12 by State Rank, 2008
10.6
12.2
11.4 4.9
6.6
11.3 2.5
9.4
NA
2.5
3.6
7.2
2.3
3.8
3.6
9.1
3.9
2.5
7.2
5.8
NA
7.5
8.3
11.6
3.4g Event Dropout Rates for African American Public School Students in Grades 9–12 by State Rank, 2008
8.9
9.6
7.1
6.7
9.0
10.6 5.6
7.7
NA
4.7
4.6
7.3
1.9
9.1
2.8
6.2
3.6
4.8
10.9 5.4
NA
5.9
12.6 7.1
3.4h Event Dropout Rates for White Public School Students in Grades 9–12 by State Rank, 2008
9.5
5.1
5.6
4.0
3.1
3.9
1.6
4.9
NA
2.1
3.6
5.9
1.8
2.2
1.6
2.5
2.1
2.4
4.8
4.3
NA
2.3
4.3
1.8
3.4i Event Dropout Rates for Hispanic Public School Students in Grades 9–12 by State Rank, 2008
8.3
7.5
7.3
5.1
6.0
12.1 6.1
8.2
NA
3.7
4.8
6.7
3.5
7.3
2.4
6.1
3.9
4.6
7.8
7.0
NA
8.3
10.3 7.5
3.4j Event Dropout Rates for Public School Students in Ninth Grade by State Rank, 2008
16.2 4.3
4.2
2.8
2.5
3.9
2.6
6.3
5.7
2.8
4.2
3.7
1.1
3.6
0.2
0.8
1.2
2.2
8.9
1.4
4.0
3.1
4.7
0.9
3.4k Event Dropout Rates for Public School Students in 10th Grade by State Rank, 2008
15.0 5.8
5.1
4.2
3.0
4.8
2.9
6.4
5.9
3.0
4.4
6.2
1.8
4.3
0.8
1.6
2.2
3.3
6.6
2.6
3.7
3.6
6.5
1.6
3.4l Event Dropout Rates for Public School Students in 11th Grade by State Rank, 2008
10.5 9.0
6.8
5.7
4.1
7.2
3.1
5.2
5.2
3.1
4.2
5.8
2.3
4.2
1.9
3.2
3.0
3.2
6.5
4.7
3.3
3.4
6.1
2.7
3.4m Event Dropout Rates for Public School Students in 12th Grade by State Rank, 2008
6.1
10.4
10.8 6.3
11.0
10.2 2.7
6.2
4.7
3.6
3.1
6.4
2.9
5.7
4.4
6.0
3.7
2.5
7.6
8.8
3.4
3.7
7.9
5.9
State Summaries
359

completionagenda.collegeboard.org
MS
MO
MT
NE
NV
NH
NJ
NM
NY
NC
ND
OH
OK
OR
PA RI
SC
SD
TN TX UT
VT
VA WA
WV
WI
WY
US
Recommendation TwoImprove middle school and high school college counseling
2.1c 6.2
372
309
366
511
233
613
391
411
374
335
499
381
522
386
356
383
399
353
435
6.8
209
308
491
387
464
197
457
2.2 1.4
Yes
Yes
Yes
No
Yes
Yes
Yes
Yes
Yes
No
No
Yes
Yes
No
Yes
Yes
Yes
Yes
Yes
6.8
No
Yes
No
Yes
Yes
No
63%
Recommendation ThreeImplement the best research-based dropout prevention programs
3.1c 5.7
82.4
82.0
83.8
51.3
83.4
84.6
66.8
70.8
72.8
83.8
79.0
78.0
76.7
82.7
76.4 NA
84.4
74.9
73.1 8.1
89.3
77.0
71.9
77.3
89.6
76.0
74.9
3.1d 7.7
100.
0
100.
0
97.8 NA
99.2
100.
0
100.
0
84.2
86.9
85.9
95.3
100.
0
91.2
100.
0
74.4 NA
97.4
94.3
98.6
12.4
81.8
99.1
84.4
100.
0
97.5
98.5
91.4
3.1e 7.9
93.2
63.3
55.1 NA
60.0
100.
0
61.0
55.5
60.7
47.0
74.1
76.4
62.8
63.8
78.0 NA
51.3
71.9
80.1
57.6
83.9
55.2
50.6
70.0
73.9
38.5
64.2
3.1f 5.2
68.0
64.6
57.0 NA
100.
0
72.9
71.4
54.7
61.9
95.1
55.5
72.4
65.8
64.5
74.7 NA
88.4
67.4
65.7
54.4
91.2
65.3
58.2
72.3
63.1
61.8
61.5
3.1g 9.7
83.6
69.5
67.2 NA
48.1
76.4
62.3
53.1
63.7
63.7
65.6
73.0
71.0
67.8
70.1 NA
71.0
72.3
65.9
50.6
100.
0
70.5
60.3
87.8
75.0
65.5
63.5
3.1h 9.0
85.2
84.7
88.6 NA
83.3
88.3
74.7
82.7
77.3
87.8
84.4
79.0
77.1
86.9
79.0 NA
88.3
77.3
81.6
77.9
81.1
80.8
73.6
77.3
94.0
78.5
81.0
3.4d
11.0 4.9
5.2
2.5
5.1
3.0
1.7
5.2
3.9
5.2
2.4
4.3
3.1
3.8
2.6
5.3
3.9
2.3
3.9
4.0
4.2
NA
2.7
5.7
4.4
2.3
5.0
4.1
3.4e 4.4
2.7
4.1
1.4
3.4
1.4
0.5
3.2
2.4
2.0
4.5
1.8
2.3
2.7
1.6
4.8
1.8
2.0
2.1
1.3
3.9
NA
1.3
4.0
1.3
2.0
2.0
2.4
3.4f 7.8
3.7
11.7 7.6
4.9
8.3
2.7
9.2
5.7
7.7
7.3
8.2
3.3
6.1
4.1
10.3 0.0
9.9
4.7
3.2
7.5
NA
3.8
11.3 6.5
5.8
11.0 7.3
3.4g 5.4
12.9 6.3
6.0
6.3
9.6
2.8
5.9
6.2
6.2
3.9
10.1 3.5
7.9
5.7
7.8
4.3
2.4
7.7
6.3
6.6
NA
4.0
8.9
5.0
7.8
8.1
6.7
3.4h 9.8
3.2
4.4
1.8
3.9
2.9
1.0
3.5
2.4
4.4
1.8
2.9
2.8
3.1
1.7
4.3
3.5
1.4
2.5
1.8
3.4
NA
1.9
5.0
4.4
1.4
4.5
2.8
3.4i 7.1
7.2
6.5
4.8
6.7
3.1
3.1
5.3
6.1
7.6
4.4
8.5
5.2
6.7
6.9
8.2
5.3
4.0
5.3
5.3
8.0
NA
5.4
8.0
3.8
5.4
8.0
6.0
3.4j 6.3
5.3
3.1
1.3
4.6
0.2
1.3
4.9
3.1
5.4
1.0
4.6
2.7
1.4
1.9
5.0
3.5
1.5
2.8
2.4
1.4
NA
2.1
3.8
3.9
1.4
1.8
3.0
3.4k
11.8 4.6
5.1
2.2
4.7
1.4
1.6
5.6
4.2
5.5
2.3
3.1
3.1
2.4
2.6
5.7
4.2
2.4
3.2
3.6
2.4
NA
2.3
4.6
4.4
1.0
6.0
3.6
3.4l 8.6
5.0
6.2
2.8
4.2
3.7
1.8
5.3
3.9
5.5
3.3
3.6
3.7
4.0
2.7
5.7
4.1
2.4
4.2
3.3
4.6
NA
2.7
6.5
4.8
2.0
5.9
4.0
3.4m 4.0
4.8
6.6
3.6
7.5
7.1
1.9
5.1
4.4
4.3
2.9
5.9
3.2
7.6
3.4
5.0
3.7
2.9
5.8
7.5
8.4
NA
3.7
8.2
4.7
5.0
6.8
6.1
Appendix 360

completionagenda.collegeboard.org
INDICATORS
AL
AK
AZ
AR
CA
CO
CT
DE
DC
FL GA
HI
ID IL IN IA KS
KY
LA ME
MD
MA
MI
MN
Recommendation FourAlign the K–12 education system with international standards and college admission expectations
4.1a Percentage of Public High Schools Offering AP or IB Courses in the Four Core Subject Areas, 2010
14.8 7.9
26.8
84.2
39.3
34.3
59.9
55.8
30.8
46.1
55.1
41.3
16.4
31.3
41.8
12.3 14
53.1
11.6 42
64.2 58
25.2
19.7
4.1b Percentage of Public High Schools Offering Advanced Placement (AP) in the Four Core Subject Areas, 2010
7.4
7.5
25.1
84.2
38.1
32.8
58.9
55.8
30.8
45.4
53.6
41.3
14.8
30.6
40.6
12.3
13.4 52
11.1
41.3
63.5
56.4
23.9
17.3
4.1c Percentage of Public High Schools Offering IB Courses in the Four Core Subject Areas, 2010
2.9
0.8
3.4
1.9
3.6
7.2
1.4
2.3
3.8
7.5
4.9
3.2
1.6 2
4.2
0.3
1.5
1.5
0.8
1.4 8
1.8
2.2
3.7
4.3c Percentage of States with College- and Career-Ready Assessment Systems, 2010
Yes
No
No
No
Yes
Yes
No
No
No
No
Yes
Yes
No
Yes
No
No
No
Yes
Yes
Yes
No
No
Yes
No
4.3d Percentage of States with P–20 Longitudinal Data Systems, 2010
Yes
Yes
No
Yes
No
No
No
Yes
No
Yes
Yes
No
No
No
No
Yes
No
No
Yes
No
No
No
No
No
4.3e Percentage of States with Alignment Between High School Standards and College and Workplace Expectations, 2010
Yes
No
Yes
Yes
Yes
Yes
Yes
Yes
Yes
Yes
Yes
Yes
Yes
Yes
Yes
Yes
Yes
Yes
Yes
No
Yes
Yes
Yes
No
Recommendation FiveImprove teacher quality and focus on recruitment and retention
5.1a States with Professional Development Standards, 2010
Yes
No
Yes
Yes
No
Yes
Yes
Yes
No
Yes
Yes
Yes
No
No
Yes
Yes
Yes
Yes
Yes
Yes
Yes
Yes
Yes
Yes
5.1b States That Finance Professional Development for All Districts, 2010
Yes
No
No
Yes
No
No
No
Yes
No
No
Yes
Yes
No
No
No
Yes
No
Yes
Yes
No
Yes
No
No
Yes
5.1c States That Require Districts/Schools to Set Aside Time for Professional Development, 2010
Yes
No
No
Yes
No
No
Yes
Yes
No
No
Yes
No
No
No
No
No
No
Yes
Yes
No
No
No
Yes
No
5.1d States That Require Districts to Align Professional Development with Local Priorities and Goals, 2010
No
No
No
Yes
No
No
No
No
No
Yes
Yes
Yes
No
No
Yes
Yes
Yes
Yes
Yes
No
Yes
Yes
Yes
Yes
5.1e States That Provide Incentives for Teachers to Earn National Board Certifi cation, 2010
Yes
No
No
Yes
Yes
No
No
Yes
No
Yes
No
Yes
Yes
No
No
Yes
Yes
Yes
Yes
Yes
Yes
Yes
Yes
No
5.3a States That Require Parental Notifi cation of Out-of-Field Teachers, 2010
No
No
No
Yes
No
No
No
No
No
Yes
Yes
Yes
No
No
No
No
No
No
No
No
No
No
No
No
5.3b States That Have a Ban or Cap on the Number of Out-of-Field Teachers, 2010
No
No
No
No
No
No
No
No
No
Yes
No
No
No
No
No
No
No
Yes
No
No
No
No
No
No
5.4d Percentage of Bachelor's and Master's Degrees Earned in Education by State Rank, 2008
16.6
14.5
18.3
17.4 8.1
6.3
11.3
18.1 5.5 11
14.3
11.9
16.1
16.3
13.6
11.6
15.8 19
10.8
16.1
10.7
11.7
13.8
22.4
5.4e Percentage of Bachelor's Degrees Earned in Education by State Rank, 2008
9.6
4.5
6.2
12.4 1.8
0.7
3.8
9.3
0.9
7.3
10.1 6.8
12.5 9.2
10.5 7.9
9.6
11.2 7.6
10.8 4.6
2.7
8.8
8.4
5.4f Percentage of Master's Degrees Earned in Education by State Rank, 2008
32.1
36.1
35.0
34.1
24.9
20.2
27.7
38.5
10.3
21.6
26.9
27.2
34.3
28.9
23.5
28.9
32.7
40.8
22.2
38.9
21.7
26.9
26.9
46.0
5.6a Percentage of States in Which Teacher Evaluation Is Tied to Student Achievement, 2010
No
No
No
No
No
No
No
Yes
No
Yes
Yes
No
No
No
No
Yes
No
No
No
No
No
No
No
No
State Summaries
361

completionagenda.collegeboard.org
MS
MO
MT
NE
NV
NH
NJ
NM
NY
NC
ND
OH
OK
OR
PA RI
SC
SD
TN TX UT
VT
VA WA
WV
WI
WY
US
Recommendation FourAlign the K–12 education system with international standards and college admission expectations
4.1a
20.3 14 9.4
9.6
37.4
55.2
59.2 17
31.9
49.5 5.5
27.5
14.4 22
43.4
40.7
40.3 8.8
29.1
29.5
38.8
53.1
57.2
36.9
32.1
31.8
13.8
33.7
4.1b
19.2
13.1 8.8
9.3
37.4 54 58
16.5
30.5
48.1 5.5
27.2
14.4
17.3 43
40.7
36.6 8.8
29.1 29
38.8
53.1
52.5
33.6
31.4
30.4
12.5
32.6
4.1c 1.4
1.8
0.6
0.7
2.3
1.1
2.1
0.5
2.9
4.5 0 2
0.4 6
1.4 0
10.3 0
2.4
2.1
4.2 0
8.9
3.5
0.7
1.8
2.5
2.9
4.3c No
No
No
No
No
No
No
No
Yes
No
No
No
No
No
No
No
No
No
Yes
Yes
No
No
No
No
No
Yes
No
27.5
%
4.3d No
Yes
No
No
Yes
No
No
No
No
No
No
No
No
Yes
Yes
No
No
No
No
Yes
Yes
No
No
Yes
No
No
Yes
31.4
%
4.3e
Yes
Yes
No
No
Yes
Yes
Yes
Yes
Yes
Yes
No
Yes
Yes
Yes
Yes
Yes
Yes
Yes
Yes
No
Yes
Yes
No
No
Yes
Yes
Yes
82.4
%
Recommendation FiveImprove teacher quality and focus on recruitment and retention
5.1a
Yes
Yes
Yes
No
No
Yes
Yes
Yes
Yes
Yes
Yes
Yes
Yes
Yes
Yes
Yes
Yes
No
Yes
No
Yes
Yes
Yes
Yes
Yes
No
No
78%
5.1b No
Yes
Yes
Yes
Yes
No
No
No
No
Yes
Yes
No
No
No
Yes
Yes
Yes
No
No
No
Yes
No
Yes
Yes
Yes
Yes
No
47%
5.1c No
No
Yes
Yes
No
No
No
No
Yes
No
Yes
No
No
No
No
No
Yes
No
Yes
No
No
Yes
No
No
Yes
No
No
31%
5.1d No
Yes
Yes
No
Yes
No
Yes
Yes
Yes
Yes
No
No
Yes
No
Yes
Yes
Yes
No
Yes
No
Yes
Yes
Yes
No
Yes
Yes
Yes
61%
5.1e
Yes
No
Yes
No
Yes
No
No
No
Yes
Yes
Yes
No
Yes
No
Yes
Yes
Yes
No
No
No
No
Yes
Yes
Yes
Yes
Yes
Yes
61%
5.3a No
No
No
No
No
No
No
Yes
No
No
No
No
No
No
No
No
No
No
No
Yes
No
No
No
No
No
No
No
12%
5.3b No
No
No
Yes
No
No
No
No
No
No
No
No
No
No
No
No
Yes
No
No
No
No
No
No
No
No
No
No
8%
5.4d
19.9
13.1
13.4
16.6
17.8 11
11.4 18
15.7
11.7
12.8
15.4
12.4
13.1
12.9 9.2 15
14.1
12.8 6.8
13.1 10 9.3
9.8
13.6 14
16.4
12.7
5.4e
13.5 8.2
10.3
10.8 7.3
5.6
5.6
12.3 6.2
8.5
11.1 10 9.9 4
7.5
6.7
9.5
9.7
5.4
2.2
10.9 5.1 2
4.9
9.2 9
13.9 6.6
5.4f
39.2
23.1
27.9
34.1
45.7
25.1
26.2
31.2
33.1
21.7
19.8
30.8
21.5
40.6
27.7
20.5
36.3
32.0
35.1
20.4
22.2
21.5
29.4
26.4
26.5
33.1
27.2
28.1
5.6a No
No
No
No
No
No
No
No
Yes
Yes
No
Yes
Yes
No
No
No
Yes
No
Yes
Yes
Yes
No
Yes
No
No
No
No
25%
Appendix 362

completionagenda.collegeboard.org
INDICATORS
AL
AK
AZ
AR
CA
CO
CT
DE
DC
FL GA
HI
ID IL IN IA KS
KY
LA ME
MD
MA
MI
MN
5.6b Percentage of States in Which Teacher and Student Records Can Be Matched by Course/Subject and State Assessment Results, 2010
Yes
No
No
Yes
Yes
No
No
Yes
No
Yes
No
Yes
No
No
No
No
No
No
Yes
No
No
No
No
No
5.6c Percentage of States in Which Teachers Are Assigned a Unique Identifi cation Number, 2010
Yes
Yes
Yes
Yes
Yes
Yes
Yes
Yes
Yes
Yes
Yes
Yes
Yes
Yes
Yes
Yes
Yes
Yes
Yes
Yes
Yes
Yes
Yes
Yes
5.7 Percentage of Public K–12 Teachers by Years of Teaching Experience by State, 2008
Less Than Three Years
14.4
12.0
21.0
10.7
13.5
17.2
12.2
10.6
20.0
14.8
10.3
18.6
12.5
13.4 9.2
11.4
13.0
10.2
12.7
12.3
12.0
11.1 9.4
12.7
Three to Nine Years
31.3
27.5
34.6
25.7
35.9
37.9
29.7
43.3
29.9
35.0
32.4
34.3
31.0
35.6
32.3
30.5
30.2
35.5
33.3
27.0
37.1
39.9
32.5
28.5
10 to 20 Years
36.1
39.7
26.1
32.1
30.3
28.1
31.1
27.9
24.6
27.4
35.9
28.6
33.6
29.3
29.1
29.9
27.2
30.1
27.6
31.5
26.2
27.2
36.3
35.3
Over 20 Years
18.2
20.7
18.4
31.6
20.3
16.8
27.1
18.2
25.5
22.8
21.4
18.6
22.8
21.6
29.4
28.2
29.6
24.2
26.3
29.1
24.8
21.8
21.8
23.6
Recommendation SixClarify and simplify the admission process
6.1b Percentage of Four-Year Colleges with Admission Applications Available Online by State Rank, 2009
Number of Four-Year Colleges 33 4 13 23 126 21 25 6 9 81 57 7 8 72 50 35 29 30 26 20 35 81 59 40
Number with Applications Available Online
26 3 5 18 96 21 22 4 7 57 46 7 7 61 43 33 25 28 21 18 28 68 49 33
Percentage of Four-Year Colleges with Online Applications
78.8 75
38.5
78.3
76.2
100 88
66.7
77.8
70.4
80.7
100
87.5
84.7 86
94.3
86.2
93.3
80.8 90 80 84
83.1
82.5
6.2b Percentage of Four-Year Colleges to Which Students Can Submit Admission Applications Online by State Rank, 2009
Number of Four-Year Colleges 33 4 13 23 126 21 25 6 9 81 57 7 8 72 50 35 29 30 26 20 35 81 59 40
Number That Accept Applications Online
23 4 6 16 79 20 20 4 5 48 42 6 7 54 41 29 21 27 18 17 25 67 46 34
Percentage of Four-Year Colleges to Which Students Can Submit Applications Online
69.7
100
46.2
69.6
62.7
95.2 80
66.7
55.6
59.3
73.7
85.7
87.5 75 82
82.9
72.4 90
69.2 85
71.4
82.7 78 85
6.3b Percentage of Four-Year Colleges That Use the Common Application, Universal College Application or Common Black College Application by State Rank, 2009
Number of Four-Year Colleges 33 4 13 23 126 21 25 6 9 81 57 7 8 72 50 35 29 30 26 20 35 81 59 40
Number of Unique Colleges Participating
5 0 1 2 25 5 8 2 3 14 11 1 1 10 8 5 0 3 4 11 9 40 5 9
Percentage of Four-Year Colleges Participating 15
.2 0
7.7
8.7
19.8
23.8 32
33.3
33.3
17.3
19.3
14.3
12.5
13.9 16
14.3 0 10
15.4 55
25.7
49.4 8.5
22.5
6.4f Rate of High School Graduates Going to College by State Rank, 2008
66.7
45.7
51.4
62.5
65.4
62.6 68
66.1
53.5
58.8
69.6
62.3
49.1
57.4
65.7
64.3
65.4
60.9
65.3
57.1
62.9
74.7
59.9
69.2
6.4g Rate of High School Graduates Going to College In State by State Rank, 2008
60.4
26.4
45.9
55.6
59.9
47.7
37.4
44.7
11.2 52 58
41.8
34.4
40.9
57.7 55
55.7 54 59
38.7
39.2
50.6
53.3 50
6.4h Rate of High School Graduates Going to College Out of State by State Rank, 2008
6.3
19.3 5.5
6.9
5.6
14.9
30.6
21.5
42.3 6.8
11.6
20.5
14.6
16.5 7.9
9.3
9.7 7
6.3
18.4
23.7 24 6.7
19.2
State Summaries
363
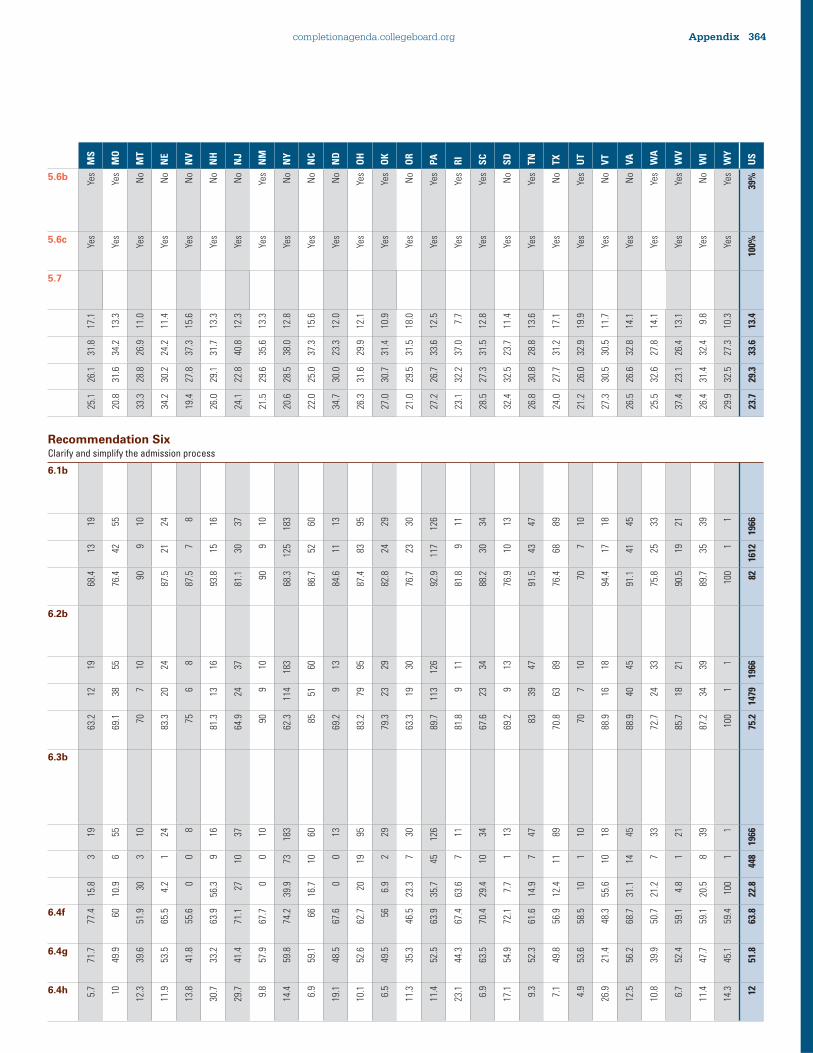
completionagenda.collegeboard.org
MS
MO
MT
NE
NV
NH
NJ
NM
NY
NC
ND
OH
OK
OR
PA RI
SC
SD
TN TX UT
VT
VA WA
WV
WI
WY
US
5.6b
Yes
Yes
No
No
No
No
No
Yes
No
No
No
Yes
Yes
No
Yes
Yes
Yes
No
Yes
No
Yes
No
No
Yes
Yes
No
Yes
39%
5.6c
Yes
Yes
Yes
Yes
Yes
Yes
Yes
Yes
Yes
Yes
Yes
Yes
Yes
Yes
Yes
Yes
Yes
Yes
Yes
Yes
Yes
Yes
Yes
Yes
Yes
Yes
Yes
100%
5.7
17.1
13.3
11.0
11.4
15.6
13.3
12.3
13.3
12.8
15.6
12.0
12.1
10.9
18.0
12.5 7.7
12.8
11.4
13.6
17.1
19.9
11.7
14.1
14.1
13.1 9.8
10.3
13.4
31.8
34.2
26.9
24.2
37.3
31.7
40.8
35.6
38.0
37.3
23.3
29.9
31.4
31.5
33.6
37.0
31.5
23.7
28.8
31.2
32.9
30.5
32.8
27.8
26.4
32.4
27.3
33.6
26.1
31.6
28.8
30.2
27.8
29.1
22.8
29.6
28.5
25.0
30.0
31.6
30.7
29.5
26.7
32.2
27.3
32.5
30.8
27.7
26.0
30.5
26.6
32.6
23.1
31.4
32.5
29.3
25.1
20.8
33.3
34.2
19.4
26.0
24.1
21.5
20.6
22.0
34.7
26.3
27.0
21.0
27.2
23.1
28.5
32.4
26.8
24.0
21.2
27.3
26.5
25.5
37.4
26.4
29.9
23.7
Recommendation SixClarify and simplify the admission process
6.1b
19 55 10 24 8 16 37 10 183 60 13 95 29 30 126 11 34 13 47 89 10 18 45 33 21 39 1
1966
13 42 9 21 7 15 30 9
125 52 11 83 24 23 117 9 30 10 43 68 7 17 41 25 19 35 1
1612
68.4
76.4 90
87.5
87.5
93.8
81.1 90
68.3
86.7
84.6
87.4
82.8
76.7
92.9
81.8
88.2
76.9
91.5
76.4 70
94.4
91.1
75.8
90.5
89.7
100 82
6.2b
19 55 10 24 8 16 37 10 183 60 13 95 29 30 126 11 34 13 47 89 10 18 45 33 21 39 1
1966
12 38 7 20 6 13 24 9
114 51 9 79 23 19 113 9 23 9 39 63 7 16 40 24 18 34 1
1479
63.2
69.1 70
83.3 75
81.3
64.9 90
62.3 85
69.2
83.2
79.3
63.3
89.7
81.8
67.6
69.2 83
70.8 70
88.9
88.9
72.7
85.7
87.2
100
75.2
6.3b
19 55 10 24 8 16 37 10 183 60 13 95 29 30 126 11 34 13 47 89 10 18 45 33 21 39 1
1966
3 6 3 1 0 9 10 0 73 10 0 19 2 7 45 7 10 1 7 11 1 10 14 7 1 8 1
448
15.8
10.9 30 4.2 0
56.3 27 0
39.9
16.7 0 20 6.9
23.3
35.7
63.6
29.4 7.7
14.9
12.4 10
55.6
31.1
21.2 4.8
20.5
100
22.8
6.4f
77.4 60
51.9
65.5
55.6
63.9
71.1
67.7
74.2 66
67.6
62.7 56
46.5
63.9
67.4
70.4
72.1
61.6
56.9
58.5
48.3
68.7
50.7
59.1
59.1
59.4
63.8
6.4g
71.7
49.9
39.6
53.5
41.8
33.2
41.4
57.9
59.8
59.1
48.5
52.6
49.5
35.3
52.5
44.3
63.5
54.9
52.3
49.8
53.6
21.4
56.2
39.9
52.4
47.7
45.1
51.8
6.4h 5.7 10
12.3
11.9
13.8
30.7
29.7 9.8
14.4 6.9
19.1
10.1 6.5
11.3
11.4
23.1 6.9
17.1 9.3
7.1
4.9
26.9
12.5
10.8 6.7
11.4
14.3 12
Appendix 364

completionagenda.collegeboard.org
INDICATORS
AL
AK
AZ
AR
CA
CO
CT
DE
DC
FL GA
HI
ID IL IN IA KS
KY
LA ME
MD
MA
MI
MN
Recommendation EightKeep college affordable
8.1c Educational Fiscal Support by State Rank, FY 2010–2011
$1,1
37,0
10,5
62
$302
,853
,868
$1,6
73,8
04,8
00
$705
,599
,663
$11,
683,
824,
350
$825
,096
,369
$889
,346
,452
$228
,167
,650
$3,4
08,5
49,0
94
$2,5
58,4
04,1
98
$461
,116
,903
$354
,996
,631
$3,3
25,8
37,5
82
$1,3
13,2
70,7
56
$741
,743
,209
$785
,116
,448
$1,0
40,0
87,1
84
$1,1
74,9
64,9
09
$237
,532
,814
$1,6
58,2
53,1
34
$1,1
96,4
03,2
46
$2,2
91,9
48,3
91
$1,2
80,8
57,0
00
8.1d Educational Fiscal Support per FTE by State Rank, FY 2010–2011
$6,3
61
$12,
606
$6,3
22
$7,1
44
$5,9
41
$3,7
81
$8,4
50
$5,6
43
$5,9
22
$7,3
19
$7,4
51
$7,7
46
$8,1
20
$4,3
25
$5,2
76
$5,1
91
$7,5
32
$6,9
95
$6,2
15
$7,1
63
$6,0
06
$4,8
22
$5,6
45
8.2e In-State Tuition Prices at Public Two-Year Institutions by State Rank, 2011–2012
$4,1
24
$3,8
31
$2,1
24
$2,6
61
$1,1
19
$3,3
97
$3,4
90
$3,0
86
$3,0
06
$3,0
78
$2,9
67
$2,6
66
$3,1
50
$3,5
21
$4,1
77
$2,4
26
$4,0
51
$2,4
52
$3,3
27
$3,7
00
$4,8
23
$2,8
63
$5,1
62
8.2f In-State Tuition Prices at Public Four-Year Institutions by State Rank, 2011–2012
$7,9
93
$5,4
56
$9,4
28
$6,6
46
$9,0
22
$7,8
49
$9,1
97
$10,
496
$7,0
00
$5,6
26
$6,8
08
$8,3
52
$5,6
81
$11,
600
$8,3
34
$7,5
62
$6,9
60
$7,9
63
$5,1
23
$9,3
54
$7,9
93
$10,
173
$10,
837
$9,9
66
8.2g Tuition Prices at Private Four-Year Institutions by State Rank, 2011–2012 $1
8,71
9
$25,
406
$26,
712
$18,
250
$35,
766
$33,
129
$35,
991
$13,
888
$35,
581
$26,
494
$26,
029
$12,
610
$6,6
14
$28,
903
$29,
578
$26,
551
$21,
042
$22,
171
$30,
024
$31,
414
$34,
269
$36,
724
$19,
414
$31,
462
Recommendation NineDramatically increase college completion rates
9.1c Full-Time Freshman-to-Sophomore Retention Rates at Public Two-Year Colleges by State Rank, 2008
55.1
48.3
57.2
56.5
68.6
53.6
56.7
54.4 NA
67.0
55.0
61.3
56.1
58.3
57.0
56.2
57.0
58.7
47.7
54.6
61.8
57.1
60.6
56.6
9.1d Full-Time Freshman-to-Sophomore Retention Rates at Public Four-Year Colleges by State Rank, 2008
76.4
70.7
77.7
68.2
84.2
76.3
83.0
85.1
39.5
79.1
76.1
73.6
63.5
80.2
77.0
83.3
74.3
72.3
71.3
72.4
82.3
79.2
80.3
78.5
9.1e Full-Time Freshman-to-Sophomore Retention Rates at Private Not-for-Profi t Four-Year Colleges by State Rank, 2008
68.5
78.6
76.3
70.9
85.8
83.2
84.6
57.2
87.3
72.4
74.8
66.7
70.9
77.4
81.0
76.1
66.7
70.1
76.9
81.3
83.1
85.4
63.9
84.7
9.2c Three-Year Graduation Rates of Degree- and Certifi cate-Seeking Students at Two-Year Colleges by State Rank, 2008
19.9
18.6
40.7
24.4
31.1
40.2
11.6 9.0
NA
39.9
26.4
19.0
34.4
24.5
27.1
34.0
32.3
25.5
30.3
26.4
19.2
18.4
14.9
30.9
9.2d Three-Year Graduation Rates of Degree- and Certifi cate-Seeking Students at Public Two-Year Colleges by State Rank, 2008
18.2
18.6
18.9
22.6
24.2
23.2
10.3 7.4
NA
32.9
22.9
14.3
19.5
20.6
10.3
33.6
29.5
21.8
15.1
26.5
12.8
15.7
14.7
28.6
9.2e Three-Year Graduation Rates of Degree- and Certifi cate-Seeking Students at Private Not-for-Profi t Two-Year Colleges by State Rank, 2008
NA
NA
NA
NA
67.9
85.7
43.9
38.5 NA
50.0
32.4 NA
NA
46.7
21.0
85.0
64.8 NA
NA
50.0 NA
43.8 NA
25.0
9.2f Three-Year Graduation Rates of Degree- and Certifi cate-Seeking Students at Private For-Profi t Two-Year Colleges by State Rank, 2008
53.8 NA
62.1
42.6
61.4
58.5
38.7 NA
NA
58.1
54.8
46.2
71.4
59.2
51.6
92.6
54.4
54.6
49.7
25.6
54.2
47.7
30.0
59.6
9.2g Three-Year Graduation Rates of Asian, Native Hawaiian and Other Pacifi c Islander Degree- and Certifi cate-Seeking Students at Two-Year Colleges by State Rank, 2008
25.0 0.0
46.9
30.8
38.7
36.3
11.8 5.1
NA
46.1
20.5
19.7
33.3
14.9
17.8
25.5
20.0
22.6
33.8
24.1
14.1
15.9
14.3
28.3
9.2h Three-Year Graduation Rates of American Indian or Alaska Native Degree- and Certifi cate-Seeking Students at Two-Year Colleges by State Rank, 2008
21.7
16.1
37.4
18.6
26.9
33.6 6.7
0.0
NA
29.6
23.4
27.3
28.9
17.2
14.3
22.4
25.2
13.0
27.3
18.2 7.2
23.1
11.4
15.4
State Summaries
365

completionagenda.collegeboard.org
MS
MO
MT
NE
NV
NH
NJ
NM
NY
NC
ND
OH
OK
OR
PA RI
SC
SD
TN TX UT
VT
VA WA
WV
WI
WY
US
Recommendation EightKeep college affordable
8.1c
$796
,728
,225
$1,1
74,9
59,2
06
$190
,346
,889
$607
,145
,616
$516
,471
,637
$127
,897
,496
$1,9
29,7
69,0
00
$747
,161
,865
$4,8
17,4
73,3
65
$3,5
41,4
51,1
14
$246
,221
,389
$2,0
41,1
42,0
65
$981
,978
,880
$750
,948
,945
$1,9
77,6
41,2
15
$168
,351
,962
$834
,817
,353
$155
,341
,395
$1,3
17,5
99,3
57
$6,5
81,7
85,7
58
$672
,510
,100
$66,
931,
354
$1,5
83,1
89,7
11
$1,5
55,8
46,7
01
$386
,020
,036
$1,6
07,9
66,1
88
$298
,261
,301
$1,4
99,0
14,8
67
8.1d
$7,9
42
$6,0
74
$4,2
93
$6,7
31
$7,8
00
$2,8
84
$7,1
36
$7,5
89
$7,7
83
$9,0
07
$6,5
20
$4,2
93
$8,4
00
$4,5
38
$5,1
59
$4,8
17
$5,4
77
$4,8
09
$7,4
77
$8,8
97
$5,3
28
$2,7
54
$5,0
96
$5,8
31
$6,1
55
$6,4
99
$13,
090
$6,
451
8.2e
$2,2
08
$2,7
56
$3,0
87
$2,5
14
$2,5
13
$6,7
41
$4,1
11
$1,4
98
$4,2
53
$2,0
75
$3,9
26
$3,6
08
$3,0
43
$4,0
29
$3,6
63
$3,6
76
$3,7
31
$4,9
45
$3,5
51
$2,0
49
$3,0
09
$6,5
20
$3,9
68
$3,8
05
$2,7
00
$3,8
40
$2,3
25
$3,3
87
8.2f
$5,6
68
$7,6
68
$5,8
74
$6,9
34
$6,0
44
$13,
507
$12,
041
$5,4
57
$6,2
13
$5,6
85
$6,8
47
$8,9
04
$6,0
59
$7,9
88
$12,
079
$10,
007
$10,
300
$6,8
73
$7,2
09
$8,0
78
$5,2
92
$13,
078
$9,6
18
$9,4
84
$5,5
32
$8,1
93
$4,1
25
$8,0
43
8.2g
$14,
635
$24,
476
$22,
987
$20,
213
$25,
370
$33,
761
$32,
447
$31,
656
$33,
151
$27,
015
$14,
700
$28,
376
$22,
415
$31,
827
$32,
559
$33,
943
$21,
951
$22,
926
$23,
485
$26,
828
$6,1
98
$33,
643
$24,
683
$31,
618
$18,
606
$27,
239
$25,
869
Recommendation NineDramatically increase college completion rates
9.1c
55.9
57.9
47.8
61.0
61.3
61.0
62.6
55.2
62.7
59.3
68.2
57.3
50.7
57.2
56.9
60.9
52.1
68.2
52.9
56.9
59.3
53.6
60.2
57.8
48.7
57.5
57.9
60.0
9.1d
75.2
76.0
69.3
77.1
75.0
83.9
84.7
71.1
82.3
81.2
76.5
77.1
67.6
76.7
80.9
79.2
78.4
72.3
72.0
73.8
70.1
78.7
86.1
81.7
71.3
79.3
72.5
78.2
9.1e
67.2
75.4
73.8
74.9
63.4
79.8
81.3
75.4
82.4
75.3
76.1
77.7
70.8
79.4
83.5
82.8
68.8
77.2
76.1
75.3
77.6
79.2
72.0
84.2
66.8
80.0 NA
79.1
9.2c
24.7
33.7
29.7
32.9
36.6
27.0
15.7
18.3
22.2
20.9
35.1
25.2
27.9
25.1
39.3
14.1
14.2
56.7
29.6
18.6
39.6
18.2
25.6
29.0
20.9
33.6
60.0
27.5
9.2d
24.2
22.5
30.5
32.0
11.1
22.1
14.6
14.2
19.9
19.9
37.5
13.4
17.0
15.4
14.7
10.3
11.5
57.2
11.1
11.1
38.9
14.6
14.6
27.7
16.2
33.0
32.1
20.6
9.2e NA
70.5
17.2 NA
NA
69.6 NA
NA
35.4
15.7
15.0
44.9 NA
NA
54.7 NA
39.7
11.5
64.5
34.8
40.2
36.0 NA
NA
NA
43.6 NA
48.3
9.2f
48.1
57.9 NA
49.3
43.2
52.0
56.7
77.1
40.0
57.7 NA
52.6
58.1
55.2
62.1
46.3
54.2 NA
56.2
57.5
59.1 NA
57.3
63.9
53.7
48.5
85.5
57.7
9.2g
25.3
31.3
25.0
28.1
43.0
33.3
12.9
20.0
20.7
20.6
16.7
21.6
33.3
28.2
35.1
22.6 7.8
20.0
23.5
14.4
35.1 0.0
19.7
30.3
21.1
27.4
61.4
31.5
9.2h
36.6
25.2
21.1
12.1
42.1 0.0
10.8
26.8
14.4
16.5
18.9
17.8
24.4
15.8
39.2 7.1
14.3
17.4
22.9
14.8
25.3
33.3
26.0
18.6 0.0
15.4
38.7
24.9
Appendix 366
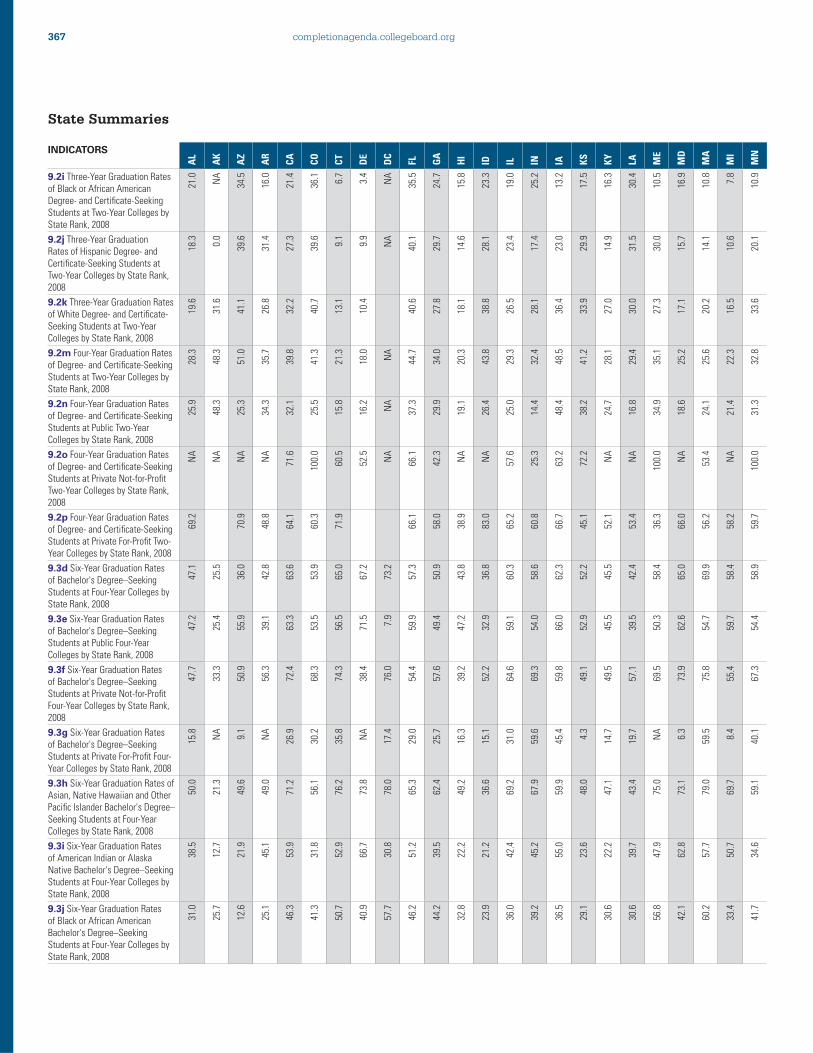
completionagenda.collegeboard.org
INDICATORS
AL
AK
AZ
AR
CA
CO
CT
DE
DC
FL GA
HI
ID IL IN IA KS
KY
LA ME
MD
MA
MI
MN
9.2i Three-Year Graduation Rates of Black or African American Degree- and Certifi cate-Seeking Students at Two-Year Colleges by State Rank, 2008
21.0 NA
34.5
16.0
21.4
36.1 6.7
3.4
NA
35.5
24.7
15.8
23.3
19.0
25.2
13.2
17.5
16.3
30.4
10.5
16.9
10.8 7.8
10.9
9.2j Three-Year Graduation Rates of Hispanic Degree- and Certifi cate-Seeking Students at Two-Year Colleges by State Rank, 2008
18.3 0.0
39.6
31.4
27.3
39.6 9.1
9.9
NA
40.1
29.7
14.6
28.1
23.4
17.4
23.0
29.9
14.9
31.5
30.0
15.7
14.1
10.6
20.1
9.2k Three-Year Graduation Rates of White Degree- and Certifi cate-Seeking Students at Two-Year Colleges by State Rank, 2008
19.6
31.6
41.1
26.8
32.2
40.7
13.1
10.4
40.6
27.8
18.1
38.8
26.5
28.1
36.4
33.9
27.0
30.0
27.3
17.1
20.2
16.5
33.6
9.2m Four-Year Graduation Rates of Degree- and Certifi cate-Seeking Students at Two-Year Colleges by State Rank, 2008
28.3
48.3
51.0
35.7
39.8
41.3
21.3
18.0 NA
44.7
34.0
20.3
43.8
29.3
32.4
48.5
41.2
28.1
29.4
35.1
25.2
25.6
22.3
32.8
9.2n Four-Year Graduation Rates of Degree- and Certifi cate-Seeking Students at Public Two-Year Colleges by State Rank, 2008
25.9
48.3
25.3
34.3
32.1
25.5
15.8
16.2 NA
37.3
29.9
19.1
26.4
25.0
14.4
48.4
38.2
24.7
16.8
34.9
18.6
24.1
21.4
31.3
9.2o Four-Year Graduation Rates of Degree- and Certifi cate-Seeking Students at Private Not-for-Profi t Two-Year Colleges by State Rank, 2008
NA
NA
NA
NA
71.6
100.
0
60.5
52.5 NA
66.1
42.3 NA
NA
57.6
25.3
63.2
72.2 NA
NA
100.
0
NA
53.4 NA
100.
0
9.2p Four-Year Graduation Rates of Degree- and Certifi cate-Seeking Students at Private For-Profi t Two-Year Colleges by State Rank, 2008
69.2
70.9
48.8
64.1
60.3
71.9
66.1
58.0
38.9
83.0
65.2
60.8
66.7
45.1
52.1
53.4
36.3
66.0
56.2
58.2
59.7
9.3d Six-Year Graduation Rates of Bachelor's Degree–Seeking Students at Four-Year Colleges by State Rank, 2008
47.1
25.5
36.0
42.8
63.6
53.9
65.0
67.2
73.2
57.3
50.9
43.8
36.8
60.3
58.6
62.3
52.2
45.5
42.4
58.4
65.0
69.9
58.4
58.9
9.3e Six-Year Graduation Rates of Bachelor's Degree–Seeking Students at Public Four-Year Colleges by State Rank, 2008
47.2
25.4
55.9
39.1
63.3
53.5
56.5
71.5 7.9
59.9
49.4
47.2
32.9
59.1
54.0
66.0
52.9
45.5
39.5
50.3
62.6
54.7
59.7
54.4
9.3f Six-Year Graduation Rates of Bachelor's Degree–Seeking Students at Private Not-for-Profi t Four-Year Colleges by State Rank, 2008
47.7
33.3
50.9
56.3
72.4
68.3
74.3
38.4
76.0
54.4
57.6
39.2
52.2
64.6
69.3
59.8
49.1
49.5
57.1
69.5
73.9
75.8
55.4
67.3
9.3g Six-Year Graduation Rates of Bachelor's Degree–Seeking Students at Private For-Profi t Four-Year Colleges by State Rank, 2008
15.8 NA
9.1
NA
26.9
30.2
35.8 NA
17.4
29.0
25.7
16.3
15.1
31.0
59.6
45.4 4.3
14.7
19.7 NA
6.3
59.5 8.4
40.1
9.3h Six-Year Graduation Rates of Asian, Native Hawaiian and Other Pacifi c Islander Bachelor's Degree–Seeking Students at Four-Year Colleges by State Rank, 2008
50.0
21.3
49.6
49.0
71.2
56.1
76.2
73.8
78.0
65.3
62.4
49.2
36.6
69.2
67.9
59.9
48.0
47.1
43.4
75.0
73.1
79.0
69.7
59.1
9.3i Six-Year Graduation Rates of American Indian or Alaska Native Bachelor's Degree–Seeking Students at Four-Year Colleges by State Rank, 2008
38.5
12.7
21.9
45.1
53.9
31.8
52.9
66.7
30.8
51.2
39.5
22.2
21.2
42.4
45.2
55.0
23.6
22.2
39.7
47.9
62.8
57.7
50.7
34.6
9.3j Six-Year Graduation Rates of Black or African American Bachelor's Degree–Seeking Students at Four-Year Colleges by State Rank, 2008
31.0
25.7
12.6
25.1
46.3
41.3
50.7
40.9
57.7
46.2
44.2
32.8
23.9
36.0
39.2
36.5
29.1
30.6
30.6
56.8
42.1
60.2
33.4
41.7
State Summaries
367
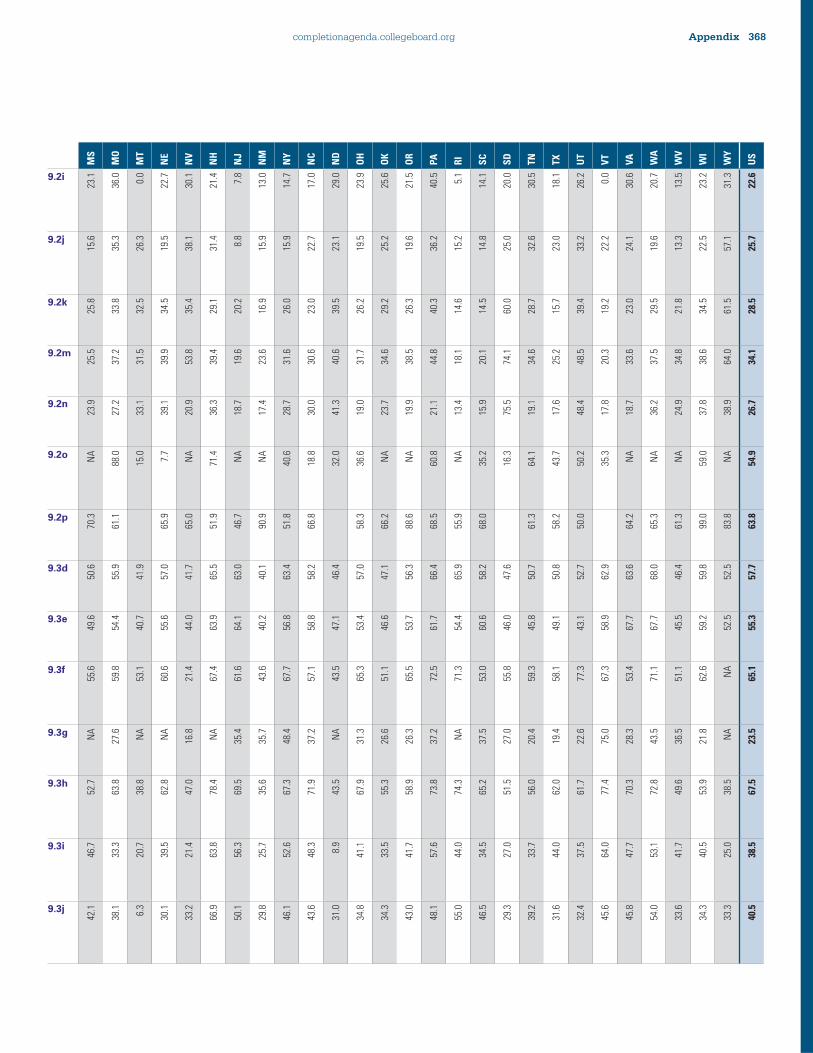
completionagenda.collegeboard.org
MS
MO
MT
NE
NV
NH
NJ
NM
NY
NC
ND
OH
OK
OR
PA RI
SC
SD
TN TX UT
VT
VA WA
WV
WI
WY
US
9.2i
23.1
36.0 0.0
22.7
30.1
21.4 7.8
13.0
14.7
17.0
29.0
23.9
25.6
21.5
40.5 5.1
14.1
20.0
30.5
18.1
26.2 0.0
30.6
20.7
13.5
23.2
31.3
22.6
9.2j
15.6
35.3
26.3
19.5
38.1
31.4 8.8
15.9
15.9
22.7
23.1
19.5
25.2
19.6
36.2
15.2
14.8
25.0
32.6
23.0
33.2
22.2
24.1
19.6
13.3
22.5
57.1
25.7
9.2k
25.8
33.8
32.5
34.5
35.4
29.1
20.2
16.9
26.0
23.0
39.5
26.2
29.2
26.3
40.3
14.6
14.5
60.0
28.7
15.7
39.4
19.2
23.0
29.5
21.8
34.5
61.5
28.5
9.2m
25.5
37.2
31.5
39.9
53.8
39.4
19.6
23.6
31.6
30.6
40.6
31.7
34.6
38.5
44.8
18.1
20.1
74.1
34.6
25.2
48.5
20.3
33.6
37.5
34.8
38.6
64.0
34.1
9.2n
23.9
27.2
33.1
39.1
20.9
36.3
18.7
17.4
28.7
30.0
41.3
19.0
23.7
19.9
21.1
13.4
15.9
75.5
19.1
17.6
48.4
17.8
18.7
36.2
24.9
37.8
38.9
26.7
9.2o NA
88.0
15.0 7.7
NA
71.4 NA
NA
40.6
18.8
32.0
36.6 NA
NA
60.8 NA
35.2
16.3
64.1
43.7
50.2
35.3 NA
NA
NA
59.0 NA
54.9
9.2p
70.3
61.1
65.9
65.0
51.9
46.7
90.9
51.8
66.8
58.3
66.2
88.6
68.5
55.9
68.0
61.3
58.2
50.0
64.2
65.3
61.3
99.0
83.8
63.8
9.3d
50.6
55.9
41.9
57.0
41.7
65.5
63.0
40.1
63.4
58.2
46.4
57.0
47.1
56.3
66.4
65.9
58.2
47.6
50.7
50.8
52.7
62.9
63.6
68.0
46.4
59.8
52.5
57.7
9.3e
49.6
54.4
40.7
55.6
44.0
63.9
64.1
40.2
56.8
58.8
47.1
53.4
46.6
53.7
61.7
54.4
60.6
46.0
45.8
49.1
43.1
58.9
67.7
67.7
45.5
59.2
52.5
55.3
9.3f
55.6
59.8
53.1
60.6
21.4
67.4
61.6
43.6
67.7
57.1
43.5
65.3
51.1
65.5
72.5
71.3
53.0
55.8
59.3
58.1
77.3
67.3
53.4
71.1
51.1
62.6 NA
65.1
9.3g NA
27.6 NA
NA
16.8 NA
35.4
35.7
48.4
37.2 NA
31.3
26.6
26.3
37.2 NA
37.5
27.0
20.4
19.4
22.6
75.0
28.3
43.5
36.5
21.8 NA
23.5
9.3h
52.7
63.8
38.8
62.8
47.0
78.4
69.5
35.6
67.3
71.9
43.5
67.9
55.3
58.9
73.8
74.3
65.2
51.5
56.0
62.0
61.7
77.4
70.3
72.8
49.6
53.9
38.5
67.5
9.3i
46.7
33.3
20.7
39.5
21.4
63.8
56.3
25.7
52.6
48.3 8.9
41.1
33.5
41.7
57.6
44.0
34.5
27.0
33.7
44.0
37.5
64.0
47.7
53.1
41.7
40.5
25.0
38.5
9.3j
42.1
38.1 6.3
30.1
33.2
66.9
50.1
29.8
46.1
43.6
31.0
34.8
34.3
43.0
48.1
55.0
46.5
29.3
39.2
31.6
32.4
45.6
45.8
54.0
33.6
34.3
33.3
40.5
Appendix 368

completionagenda.collegeboard.org
INDICATORS
AL
AK
AZ
AR
CA
CO
CT
DE
DC
FL GA
HI
ID IL IN IA KS
KY
LA ME
MD
MA
MI
MN
9.3k Six-Year Graduation Rates of Hispanic or Latino Bachelor's Degree–Seeking Students at Four-Year Colleges by State Rank, 2008
41.7
17.9
38.7
38.2
53.6
44.2
59.7
62.5
68.7
56.2
52.4
33.3
29.0
46.9
53.2
43.6
43.7
38.5
45.8
67.0
70.5
64.4
54.1
55.5
9.3l Six-Year Graduation Rates of White Bachelor's Degree–Seeking Students at Four-Year Colleges by State Rank, 2008
55.4
29.2
42.7
47.1
67.6
56.0
65.4
74.9
79.9
61.1
52.2
35.3
37.5
65.3
59.6
64.6
55.4
47.0
47.4
57.7
73.6
70.1
61.3
61.1
9.3n Eight-Year Graduation Rates of Bachelor's Degree–Seeking Students at Four-Year Colleges by State Rank, 2008
53.2
30.6
47.7
46.9
66.9
56.7
64.4
67.7
75.4
59.8
53.9
49.3
43.1
62.4
59.8
65.4
55.6
52.1
45.5
60.1
67.4
70.4
62.5
59.9
9.3o Eight-Year Graduation Rates of Bachelor's Degree–Seeking Students at Public Four-Year Colleges by State Rank, 2008
53.4
30.6
58.3
43.3
67.2
55.8
55.5
70.4
28.8
62.7
52.9
52.9
41.5
61.0
55.4
67.9
57.2
49.2
43.0
50.1
65.5
56.4
63.7
54.3
9.3p Eight-Year Graduation Rates of Bachelor's Degree–Seeking Students at Private Not-for-Profi t Four-Year Colleges by State Rank, 2008
52.2
29.5
54.0
60.3
72.6
72.9
74.2
47.7
76.4
54.6
59.1
45.0
58.6
66.7
69.9
62.6
47.8
50.3
58.1
74.9
73.1
75.6
59.1
69.8
9.3q Eight-Year Graduation Rates of Bachelor's Degree–Seeking Students at Private For-Profi t Four-Year Colleges by State Rank, 2008
68.4 NA
16.4 NA
37.0
31.3
31.8 NA
NA
52.1
37.1 7.5
NA
42.5
58.8
29.5 NA
96.0
23.1 NA
15.3
58.7
11.9
34.5
Recommendation TenProvide postsecondary opportunities as an essential element of adult education programs
10.1c Percentage of Adults Ages 25–34 with Less Than a High School Diploma by State Rank, 2009
16.1 7.7
17.6
14.2
18.4
13.1 9.2
11.3 8.3
13.6
15.2 5.1
11.8
11.8
12.6 8.2
10.9
12.8
15.2 6.1
10.5 7.8
10.7 7.2
10.1d Percentage of Adults Ages 25–34 with Only a High School Diploma but No College by State Rank, 2009
28.4
30.2
25.9
33.3
22.6
22.5
25.9
28.0
15.6
28.7
27.2
29.3
28.0
23.5
29.0
24.2
24.3
31.7
32.0
32.4
23.1
21.9
27.1
20.8
10.1e Percentage of Adults Ages 25–34 with Some College but No Degree by State Rank, 2009
24.3
31.5
24.2
24.6
21.6
22.1
19.2
21.3
12.1
21.3
21.7
24.6
28.0
20.9
23.5
23.0
24.5
23.6
23.9
23.8
21.1
16.4
26.2
22.4
10.2b Percentage of Adults Ages 25–34 with No High School Diploma Who Were GED Candidates by State Rank, 2009
3.1
6.4
2.7
3.0
1.4
4.2
3.8
1.9
2.2
2.7
3.7
2.9
4.9
3.2
3.0
5.0
1.8
3.6
2.3
8.8
2.2
3.7
3.7
5.7
10.2d Percentage of Adults Ages 25–34 with No High School Diploma Who Attained a GED by State Rank, 2009
1.8
3.3
1.6
2.3
0.8
2.2
1.8
1.7
1.2
1.6
1.9
1.8
2.7
1.7
2.2
3.0
1.6
2.8
1.6
4.7
1.2
1.9
1.8
3.0
10.3b Percentage of Adults Ages 25–34 Enrolled in Postsecondary Education by State Rank, 2007
6.7%
6.6%
15.7
%
6.4%
8.1%
7.9%
5.0%
5.5%
13.5
%
7.2%
5.3%
6.3%
6.7%
7.2%
6.7%
11.2
%
7.2%
7.2%
5.8%
6.0%
6.2%
4.9%
7.6%
6.9%
State Summaries
369
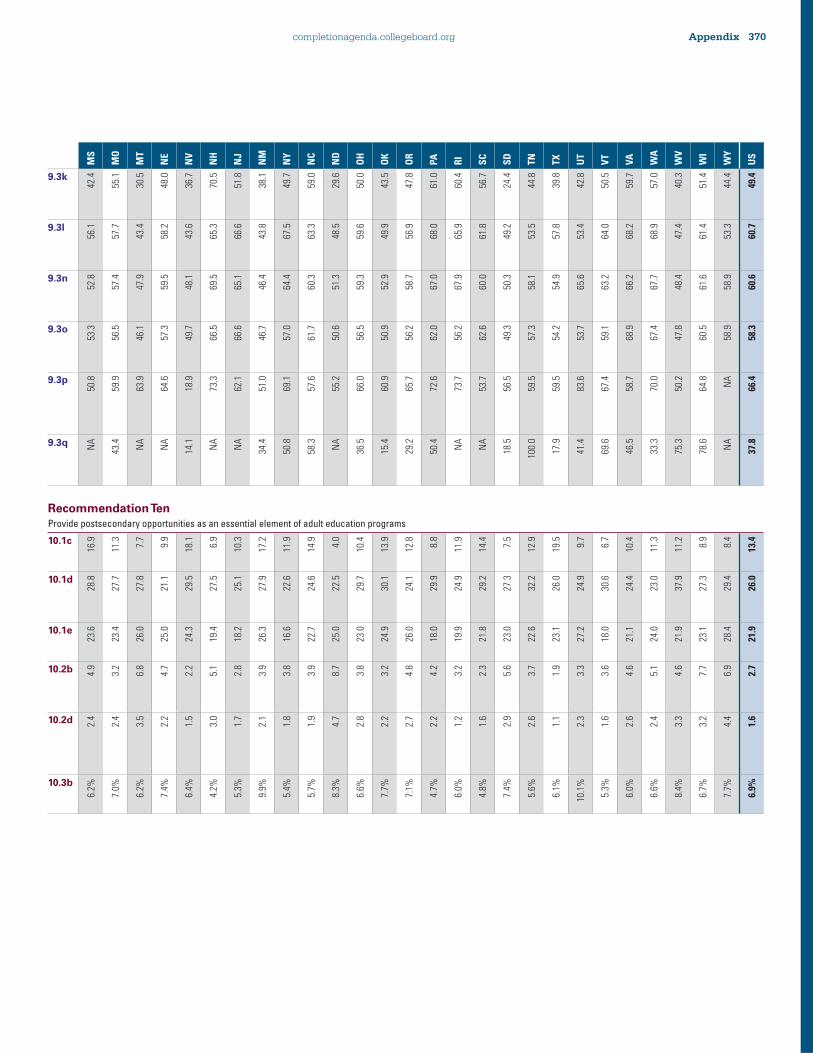
completionagenda.collegeboard.org
MS
MO
MT
NE
NV
NH
NJ
NM
NY
NC
ND
OH
OK
OR
PA RI
SC
SD
TN TX UT
VT
VA WA
WV
WI
WY
US
9.3k
42.4
55.1
30.5
48.0
36.7
70.5
51.8
38.1
49.7
59.0
29.6
50.0
43.5
47.8
61.0
60.4
56.7
24.4
44.8
39.8
42.8
50.5
59.7
57.0
40.3
51.4
44.4
49.4
9.3l
56.1
57.7
43.4
58.2
43.6
65.3
66.6
43.8
67.5
63.3
48.5
59.6
49.9
56.9
68.0
65.9
61.8
49.2
53.5
57.8
53.4
64.0
68.2
68.9
47.4
61.4
53.3
60.7
9.3n
52.8
57.4
47.9
59.5
48.1
69.5
65.1
46.4
64.4
60.3
51.3
59.3
52.9
58.7
67.0
67.9
60.0
50.3
58.1
54.9
65.6
63.2
66.2
67.7
48.4
61.6
58.9
60.6
9.3o
53.3
56.5
46.1
57.3
49.7
66.5
66.6
46.7
57.0
61.7
50.6
56.5
50.9
56.2
62.0
56.2
62.6
49.3
57.3
54.2
53.7
59.1
68.9
67.4
47.8
60.5
58.9
58.3
9.3p
50.8
59.9
63.9
64.6
18.9
73.3
62.1
51.0
69.1
57.6
55.2
66.0
60.9
65.7
72.6
73.7
53.7
56.5
59.5
59.5
83.6
67.4
58.7
70.0
50.2
64.8 NA
66.4
9.3q NA
43.4 NA
NA
14.1 NA
NA
34.4
50.8
58.3 NA
36.5
15.4
29.2
50.4 NA
NA
18.5
100.
0
17.9
41.4
69.6
46.5
33.3
75.3
78.6 NA
37.8
Recommendation TenProvide postsecondary opportunities as an essential element of adult education programs
10.1c
16.9
11.3 7.7
9.9
18.1 6.9
10.3
17.2
11.9
14.9 4.0
10.4
13.9
12.8 8.8
11.9
14.4 7.5
12.9
19.5 9.7
6.7
10.4
11.3
11.2 8.9
8.4
13.4
10.1d
28.8
27.7
27.8
21.1
29.5
27.5
25.1
27.9
22.6
24.6
22.5
29.7
30.1
24.1
29.9
24.9
29.2
27.3
32.2
26.0
24.9
30.6
24.4
23.0
37.9
27.3
29.4
26.0
10.1e
23.6
23.4
26.0
25.0
24.3
19.4
18.2
26.3
16.6
22.7
25.0
23.0
24.9
26.0
18.0
19.9
21.8
23.0
22.6
23.1
27.2
18.0
21.1
24.0
21.9
23.1
28.4
21.9
10.2b 4.9
3.2
6.8
4.7
2.2
5.1
2.8
3.9
3.8
3.9
8.7
3.8
3.2
4.8
4.2
3.2
2.3
5.6
3.7
1.9
3.3
3.6
4.6
5.1
4.6
7.7
6.9
2.7
10.2d 2.4
2.4
3.5
2.2
1.5
3.0
1.7
2.1
1.8
1.9
4.7
2.8
2.2
2.7
2.2
1.2
1.6
2.9
2.6
1.1
2.3
1.6
2.6
2.4
3.3
3.2
4.4
1.6
10.3b
6.2%
7.0%
6.2%
7.4%
6.4%
4.2%
5.3%
9.9%
5.4%
5.7%
8.3%
6.6%
7.7%
7.1%
4.7%
6.0%
4.8%
7.4%
5.6%
6.1%
10.1
%
5.3%
6.0%
6.6%
8.4%
6.7%
7.7%
6.9%
Appendix 370

TheCollege Completion Agenda2011Progress Report
The College Board is a mission-driven not-for-profit organization that connects students to college success and opportunity. Founded in 1900, the College Board was created to expand access to higher education. Today, the membership association is made up of more than 5,900 of the world’s leading educational institutions and is dedicated to promoting excellence and equity in education. Each year, the College Board helps more than seven million students prepare for a successful transition to college through programs and services in college readiness and college success — including the SAT® and the Advanced Placement Program®. The organization also serves the education community through research and advocacy on behalf of students, educators and schools.
For further information, visit www.collegeboard.org.
The College Board Advocacy & Policy Center was established to help transform education in America. Guided by the College Board’s principles of excellence and equity in education, we work to ensure that students from all backgrounds have the opportunity to succeed in college and beyond. We make critical connections between policy, research and real-world practice to develop innovative solutions to the most pressing challenges in education today. This report can be downloaded at completionagenda.collegeboard.org. Hard copies may be ordered by contacting [email protected].
advocacy.collegeboard.org
© 2011 The College Board. College Board, Advanced Placement, Advanced Placement Program, AP, SAT and the acorn logo are registered trademarks of the College Board. PSAT/NMSQT is a registered trademark of the College Board and National Merit Scholarship Corporation. All other products and services may be trademarks of their respective owners. Visit the College Board on the Web: www.collegeboard.org.
110854705 11b-3269
Th
e College
Co
mp
letion A
gend
a2011 Prog
ress Rep
ort