THE COLLECTION OF AQUATIC ORGANISMS: LICENSE AND …
12
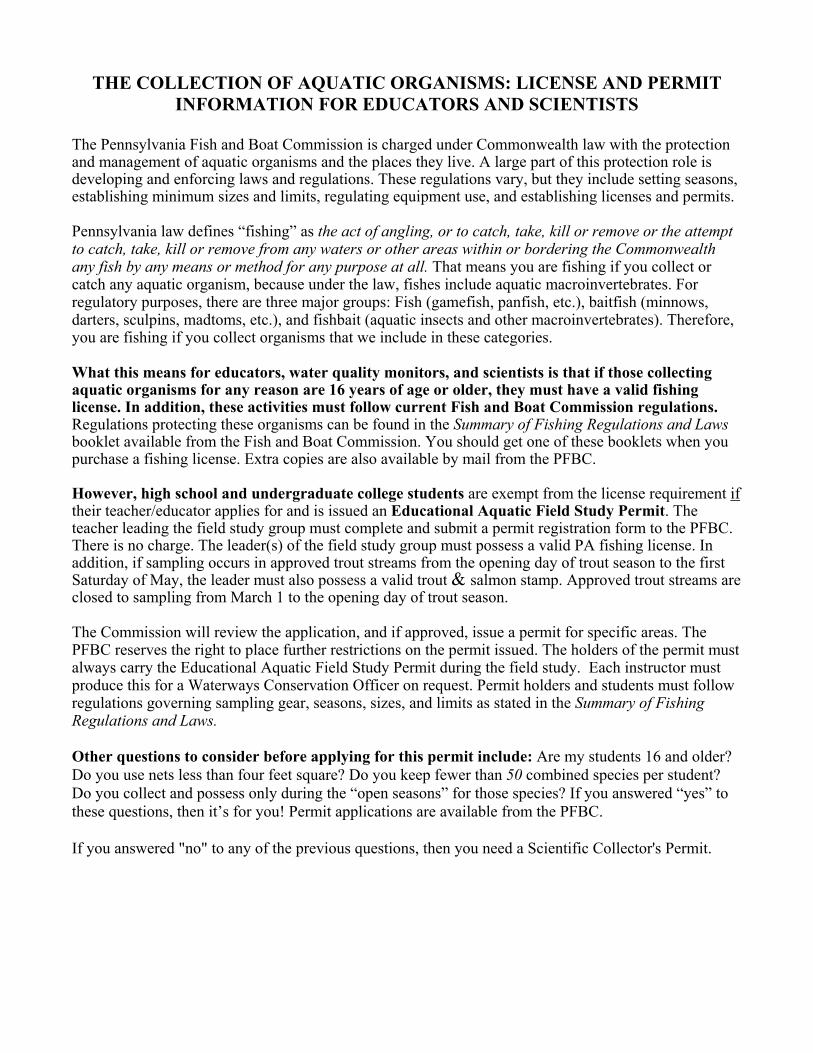
THE COLLECTION OF AQUATIC ORGANISMS: LICENSE AND PERMIT INFORMATION FOR EDUCATORS AND SCIENTISTS The Pennsylvania Fish and Boat Commission is charged under Commonwealth law with the protection and management of aquatic organisms and the places they live. A large part of this protection role is developing and enforcing laws and regulations. These regulations vary, but they include setting seasons, establishing minimum sizes and limits, regulating equipment use, and establishing licenses and permits. Pennsylvania law defines “fishing” as the act of angling, or to catch, take, kill or remove or the attempt to catch, take, kill or remove from any waters or other areas within or bordering the Commonwealth any fish by any means or method for any purpose at all. That means you are fishing if you collect or catch any aquatic organism, because under the law, fishes include aquatic macroinvertebrates. For regulatory purposes, there are three major groups: Fish (gamefish, panfish, etc.), baitfish (minnows, darters, sculpins, madtoms, etc.), and fishbait (aquatic insects and other macroinvertebrates). Therefore, you are fishing if you collect organisms that we include in these categories. What this means for educators, water quality monitors, and scientists is that if those collecting aquatic organisms for any reason are 16 years of age or older, they must have a valid fishing license. In addition, these activities must follow current Fish and Boat Commission regulations. Regulations protecting these organisms can be found in the Summary of Fishing Regulations and Laws booklet available from the Fish and Boat Commission. You should get one of these booklets when you purchase a fishing license. Extra copies are also available by mail from the PFBC. However, high school and undergraduate college students are exempt from the license requirement if their teacher/educator applies for and is issued an Educational Aquatic Field Study Permit. The teacher leading the field study group must complete and submit a permit registration form to the PFBC. There is no charge. The leader(s) of the field study group must possess a valid PA fishing license. In addition, if sampling occurs in approved trout streams from the opening day of trout season to the first Saturday of May, the leader must also possess a valid trout & salmon stamp. Approved trout streams are closed to sampling from March 1 to the opening day of trout season. The Commission will review the application, and if approved, issue a permit for specific areas. The PFBC reserves the right to place further restrictions on the permit issued. The holders of the permit must always carry the Educational Aquatic Field Study Permit during the field study. Each instructor must produce this for a Waterways Conservation Officer on request. Permit holders and students must follow regulations governing sampling gear, seasons, sizes, and limits as stated in the Summary of Fishing Regulations and Laws. Other questions to consider before applying for this permit include: Are my students 16 and older? Do you use nets less than four feet square? Do you keep fewer than 50 combined species per student? Do you collect and possess only during the “open seasons” for those species? If you answered “yes” to these questions, then it’s for you! Permit applications are available from the PFBC. If you answered "no" to any of the previous questions, then you need a Scientific Collector's Permit.
Transcript of THE COLLECTION OF AQUATIC ORGANISMS: LICENSE AND …
THE COLLECTION OF AQUATIC ORGANISMS: LICENSE AND PERMIT INFORMATION FOR EDUCATORS AND SCIENTISTS
The Pennsylvania Fish and Boat Commission is charged under Commonwealth law with the protection and management of aquatic organisms and the places they live. A large part of this protection role is developing and enforcing laws and regulations. These regulations vary, but they include setting seasons, establishing minimum sizes and limits, regulating equipment use, and establishing licenses and permits. Pennsylvania law defines “fishing” as the act of angling, or to catch, take, kill or remove or the attempt to catch, take, kill or remove from any waters or other areas within or bordering the Commonwealth any fish by any means or method for any purpose at all. That means you are fishing if you collect or catch any aquatic organism, because under the law, fishes include aquatic macroinvertebrates. For regulatory purposes, there are three major groups: Fish (gamefish, panfish, etc.), baitfish (minnows, darters, sculpins, madtoms, etc.), and fishbait (aquatic insects and other macroinvertebrates). Therefore, you are fishing if you collect organisms that we include in these categories. What this means for educators, water quality monitors, and scientists is that if those collecting aquatic organisms for any reason are 16 years of age or older, they must have a valid fishing license. In addition, these activities must follow current Fish and Boat Commission regulations. Regulations protecting these organisms can be found in the Summary of Fishing Regulations and Laws booklet available from the Fish and Boat Commission. You should get one of these booklets when you purchase a fishing license. Extra copies are also available by mail from the PFBC. However, high school and undergraduate college students are exempt from the license requirement if their teacher/educator applies for and is issued an Educational Aquatic Field Study Permit. The teacher leading the field study group must complete and submit a permit registration form to the PFBC. There is no charge. The leader(s) of the field study group must possess a valid PA fishing license. In addition, if sampling occurs in approved trout streams from the opening day of trout season to the first Saturday of May, the leader must also possess a valid trout & salmon stamp. Approved trout streams are closed to sampling from March 1 to the opening day of trout season. The Commission will review the application, and if approved, issue a permit for specific areas. The PFBC reserves the right to place further restrictions on the permit issued. The holders of the permit must always carry the Educational Aquatic Field Study Permit during the field study. Each instructor must produce this for a Waterways Conservation Officer on request. Permit holders and students must follow regulations governing sampling gear, seasons, sizes, and limits as stated in the Summary of Fishing Regulations and Laws. Other questions to consider before applying for this permit include: Are my students 16 and older? Do you use nets less than four feet square? Do you keep fewer than 50 combined species per student? Do you collect and possess only during the “open seasons” for those species? If you answered “yes” to these questions, then it’s for you! Permit applications are available from the PFBC. If you answered "no" to any of the previous questions, then you need a Scientific Collector's Permit.

Scientific Collector’s Permits. The Commission recognizes that the methods of collection, normally permissible under statewide rules and regulations for fishing, and the Aquatic Field Study Permit are sometimes inadequate for technical and scientific studies. In recognition of this need, the PFBC issues Scientific Collector’s Permits to qualified persons engaged in research, higher education, or scientific studies in which collecting specimens is necessary. These permits are valid only for the locations and equipment specifically authorized on the permit. Scientific collector’s permit holders and their assistants must possess valid fishing licenses in addition to the collector’s permit. The permit holder must give 24-hour notice of any collecting activities to the appropriate Regional Law Enforcement Manager, and the permit holder (not an assistant) must be present on-site when any collecting takes place. These permits may allow for collecting and possession during closed seasons and without regard -to minimum sizes and daily limits. In addition, the Commission may permit you to use nets larger than four feet square and electrofishing gear.
Type I (Nonprofit and Education). We normally issue these permits to museums, universities, and other nonprofit organizations. They cover the permit holder and no more than five assistants. All assistants must have a valid Pennsylvania fishing license. A Type I permit is normally limited to a specific area (that is, a county or specific water area). There is a $10 fee for a Type I Scientific Collector’s Permit.
Type II (Governmental). A Type II permit is a free permit issued to state and federal employees engaged in scientific collecting as a part of their required duties. This type of permit may be statewide or regional depending on-the individual application. All applicants must have a valid Pennsylvania fishing license. Type III (Consulting). We issue a Type III permit to individuals engaged in Private consulting for profit, that is, a commercial venture. The fee for this permit is $50. A Type III permit is limited to coverage, of the permit holder and five assistants. All applicants and assistants must have a valid Pennsylvania fishing license. We issue this permit to individuals deemed by the PFBC to be qualified to engage in scientific collecting. We will not issue the permit in the name of a company or corporation. Collecting under a Type III permit is limited to a specific area, or sites, as described on the permit conditions.
For more information, contact:
Pennsylvania Fish & Boat Commission P.O. Box 67000 Harrisburg, PA 17 106-7000 (717) 657-4540 www.fish.state.pa.us

Watershed Snapshot Complete as much of the requested information as possible.
GET LANDOWNER PERMISSION BEFORE ENTERING PRIVATE PROPERTY 1. COLLECTOR’S NAME(S) E-MAIL ADDRESS
2. 3. NAME OF SCHOOL, COMPANY, OR ORGANIZATION PHONE NUMBER
4. COMPLETE MAILING ADDRESS: STREET CITY STATE ZIP
5. SITE INFORMATION: NAME OF STREAM, POND OR LAKE MUNICIPALITY of site COUNTY of site
6. In which Volunteer Monitoring Network Region is your site located? (PUT AN ‘X’ ON THE MAP NEAR YOUR SITE AND CIRCLE NAME BELOW)
A- Lake Erie B- Ohio River C- Upper Allegheny/Genesee, D- Low Allegheny/Mon E- W Br Susquehanna F- Juniata G- Potomac H- Upper Susquehanna I- Lower Susquehanna J- Upper Delaware K- Lower Delaware
7. ° ' " LATITUDE degrees minutes seconds ° ' " LONGITUDE degrees minutes seconds
8. LATITUDE & LONGITUDE Were determined by using: GPS unit Map & Grid Guess
9. Date and hour this data was collected (YYYY/MM/DD) (HOUR):
10. Describe site location using landmarks:
WEATHER CONDITIONS
11. Precipitation within the past 48 hour? NONE TRACE LIGHT HEAVY 12. Present Air Temp? °C
13. Present weather? SUNNY PARTLY CLOUDY OVERCAST RAIN FROZEN PRECIPITATION
14. Weather within the past 48 hours? SUNNY PARTLY CLOUDY OVERCAST RAIN FROZEN PRECIPITATION

WATER CHEMISTRY
15. 16. 17. 18. 19. 20. WATER TEMPERATURE pH DISSOLVED OXYGEN CONDUCTIVITY ALKALINITY ACIDITY °C mg/l umhos/cm mg CaCO3/l mg CaCO3/l
21. 22. 23. 24. 25. NITRATE (NO3) PHOSPHATE (PO4) IRON (Fe) SULFATE (SO4) SECCHI DEPTH mg/l mg/l mg/l mg/l meters 26. OTHER
RECORD AND EXPLAIN ANY “OTHER” WATER CHEMISTRY TEST DATA THAT YOU COLLECTED AT THIS SITE. USE SPACE ON NEXT PAGE IF NEEDED. PHYSICAL CHARACTERISTICS
27. Is the water cloudy? NO SOMEWHAT VERY 28. Sediment odor? NORMAL SEWAGE OIL
29. Which fish do you think live in this water? TROUT CREEK CHUB PERCH SUCKER BASS
CARP SUNFISH CATFISH PIKE MINNOWS NONE OTHER 30. Flow of stream or capacity of impoundment: LESS THAN NORMAL NORMAL GREATER THAN NORMAL
31. Surrounding Land Uses Affecting the Site (also see Visual Assess Sheet #44 and Riparian Assess #7):
RESIDENTIAL % COMMERCIAL % CROPLAND % PASTURE %
FOREST % INDUSTRIAL % OTHER ( ) ______%
32. Aquatic life observed ( 0= absent, 1= not much/few, 2= some/common, 3= many/abundant):
ALGAE 0 – 1 – 2 – 3 ROOTED AQUATIC OR WETLAND PLANTS 0 – 1 – 2 – 3 FISH 0 – 1 – 2 – 3
AMPHIBIANS 0 – 1 – 2 – 3 REPTILES 0 – 1 – 2 – 3 BUGS / INVERTEBRATES 0 – 1 – 2 – 3 List kinds if known:
33.) *Litter (also see Visual Assess Sheet #45) ( 0= absent, 1= not much/few, 2= some/common, 3= many/abundant):
PAPER 0 – 1 – 2 – 3 PLASTICS 0 – 1 – 2 – 3 METAL 0 – 1 – 2 – 3 TIRES 0 – 1 – 2 – 3 GLASS 0 – 1 – 2 – 3 BIG STUFF (APPLIANCES, MATTRESS, BARRELS, CAR) 0 – 1 – 2 – 3 OTHER 0 – 1 – 2 – 3 LIST BELOW:
Stream Categories and Characteristics If you don’t have a topographic map of your area take your best guess at 34 and 35. If you have a map, you can do these two problems back at your home or school. Read the explanations BEFORE doing the next two problems. Then try to figure out the best choice. Figuring out ‘Stream Order’ Streams within watersheds (or basins) are often classified in a ranked (or hierarchical) system. Knowledge of Stream Order is often tied in with other things such as Basin area, Stream gradient (how steep it is. see Question 35), Basin relief, and Life forms in the stream, including kinds of fish, amphibians, and macroinvertebrate organisms. To figure out problem 33, you will want to find your worksite on a map showing streams. It is best to use a 1:24000 topographic map if one is available. Trace the tributaries to your stream up to their sources and using the drawing (next page) as an aid, try to figure out the ‘order’ of the stream you are working on.
a. Smallest, permanently flowing streams are termed first order or (1) (These are usually very small headwater streams.) b. The union of two streams, each of order 1 creates a stream of order 2 (These are usually small streams.) c. The union of two streams, each of order 2 creates a stream of order 3 (These are usually medium sized streams.) d. The union of two streams, each of order 3 creates a stream of order 4 (These are usually big streams.) e. Two 4’s creates an order 5 (These are V. big streams / rivers.) f. Two 5’s creates an order 6 (These are big rivers.)
34. On what “order” stream are you working ? order 1 order 2 order 3 order 4 order 5 order 6 I’m not working on a stream I have no idea what you’re talking about and need help
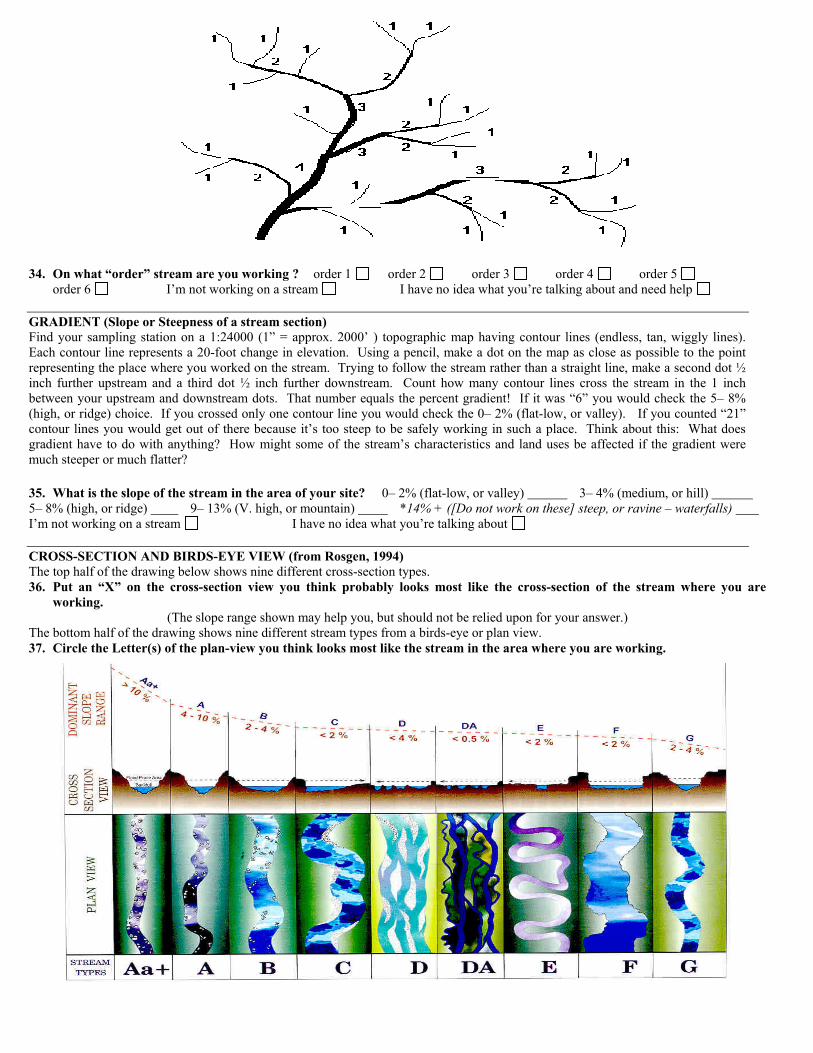
GRADIENT (Slope or Steepness of a stream section) Find your sampling station on a 1:24000 (1” = approx. 2000’ ) topographic map having contour lines (endless, tan, wiggly lines). Each contour line represents a 20-foot change in elevation. Using a pencil, make a dot on the map as close as possible to the point representing the place where you worked on the stream. Trying to follow the stream rather than a straight line, make a second dot ½ inch further upstream and a third dot ½ inch further downstream. Count how many contour lines cross the stream in the 1 inch between your upstream and downstream dots. That number equals the percent gradient! If it was “6” you would check the 5– 8% (high, or ridge) choice. If you crossed only one contour line you would check the 0– 2% (flat-low, or valley). If you counted “21” contour lines you would get out of there because it’s too steep to be safely working in such a place. Think about this: What does gradient have to do with anything? How might some of the stream’s characteristics and land uses be affected if the gradient were much steeper or much flatter? 35. What is the slope of the stream in the area of your site? 0– 2% (flat-low, or valley) 3– 4% (medium, or hill) 5– 8% (high, or ridge) 9– 13% (V. high, or mountain) *14% + ([Do not work on these] steep, or ravine – waterfalls) I’m not working on a stream I have no idea what you’re talking about CROSS-SECTION AND BIRDS-EYE VIEW (from Rosgen, 1994) The top half of the drawing below shows nine different cross-section types. 36. Put an “X” on the cross-section view you think probably looks most like the cross-section of the stream where you are
working. (The slope range shown may help you, but should not be relied upon for your answer.)
The bottom half of the drawing shows nine different stream types from a birds-eye or plan view. 37. Circle the Letter(s) of the plan-view you think looks most like the stream in the area where you are working.

VISUAL ASSESSMENT OF STREAMS AND SURROUNDING AREA Look at the creek and surrounding area for 50 yds. upstream and 50 yds. downstream of your site.
Put an “X” directly over the best response to each assessment factor. RESPONSE
ASSESSMENT FACTOR EXCELLENT GOOD MARGINAL POOR 38. Instream cover (fish &
aquatic bugs) The stream contains lots of boulders (over 10”), cobble (2-10”), submerged logs, undercut banks or other stable habitat
There is adequate habitat of both rock & wood for maintenance of diverse populations of fish & bugs
Some rock and wood or other stable habitat but much less than desirable
Not much stable habitat; lack of habitat is obvious
39. Fine particle sediments: (sand, silt, mud)
The rocks in the stream are not surrounded by fine sediments; I see very little sand, silt or mud on the bottom
Rocks are partly surrounded by fine sediments. I could easily flip over the rocks on the bottom
Rocks are more than half surrounded by fine sediments; Rocks are firmly stuck into sediments
Rocks are deeply stuck into fine sediments; bottom is mostly sand, silt or mud
40. “Flow patterns”: How many does the stream have....
All 4 of these velocity/depth patterns are present within 50 yards upstream or downstream of this site: slow/deep, slow/shallow, fast/deep, fast/shallow
Only 3 of 4 regimes (flow patterns) are present
Only 2 of the 4 regimes present
Dominated by 1 velocity/depth regime
41. Condition of banks and coverage?
The banks are stable; no evidence of erosion or bank failure; the whole bank is covered with vegetation or rock
Moderately stable; some small areas of erosion mostly healed over; most of the bank is covered by vegetation or rock
Largely unstable; almost half of the bank has areas of erosion or is NOT covered by vegetation or rock
Unstable; eroded areas; "raw" areas occur frequently; less than half of the bank is covered by vegetation or rock
42. Disruptive pressures to the “riparian” (land bordering streambanks) area?
Trees, shrubs, or grasses have not been disturbed through forestry, grazing or mowing; almost all plants are growing naturally. Mature trees, understory, and vegetation are present
Some disruption but not affecting full plant growth potential to any great extent. Trees, woody plants, and soft green plants are dominant
Disruption is obvious; some patches of bare soil, cultivated fields or closely cropped vegetation are the norm
There is not much natural vegetation left or it has been removed to 3 inches or less in average stubble height
43. Riparian (land bordering streambanks) vegetative zone width
Riparian zone is more than 35 yards wide; human activities (parking lots, roads, clearcuts, lawns, or crops) have not impacted zone
Riparian zone 12-35 yards wide; human activities have impacted zone only minimally
Width of riparian zone 6-12 yards; human activities impacting zone are commonly evident
Width of riparian zone is less than 6 yards; lots of nearby human activities
44. Human Land Use in the watershed (estimating is easier if you have a topographic map of the watershed.) Also, be sure to answer question 31 on previous page.
Nearly all the land is unmodified. A total of 0 – 25% is farmed, residential, commercial and industrial AND impervious, hard surfaces such as blacktop parking, roofs, and highway cover less than 2 % of the watershed
The watershed is slightly modified. 25 – 50% of the land is used for ‘human uses’ OR impervious, hard surfaces cover 2 - 10 % of the watershed.
The watershed is modified. 50 – 75% of the land is used for ‘human uses’ OR impervious surfaces cover 10 - 20% of the watershed.
Nearly all the land is modified. 75 – 100% of the land in ‘human uses’ OR impervious surfaces cover more than 20% of the watershed.
45. Litter (If litter is present, complete question 33 on previous page)
There is no litter in the area There is very little litter in the area; probably some degradable paper accidentally dropped by fishermen or hikers
Litter is fairly common and includes metal or plastic, obviously purposely dropped.
Area is a candidate for a clean-up project. Lots of litter, dumping, tires, or barrels present
46. Overall I Rate the VISUAL ASSESSMENT of this site
EXCELLENT GOOD MARGINAL POOR
DEFINITIONS: Disruptive pressure - any activities which interfere with the natural unity of a system. In the case of riparian assessment, this usually refers to land use practices such as mowing, grazing, logging, paving, building construction, heavily worn paths, etc. Habitat - the “places” where a plant or animal normally lives and grows throughout all the phases of its various life cycles. Riparian zone - the land connected with or immediately adjacent to the banks of a stream or other body of water. Stable Habitat - the condition in which places used for hiding, resting, reproducing, living, and growing are not undergoing rapid or constant change. In the case of stream assessment this is usually referring to large rocks, logs, and undercut banks which are more or less permanently in place.
THANK YOU FOR PARTICIPATING IN SNAPSHOT! WE WOULD LIKE TO RECEIVE YOUR WRITTEN THOUGHTS, POETRY, ESSAYS AND COPIES OF YOUR DRAWINGS AND PHOTOGRAPHS (PRINTS, DISCS OR SLIDES) FOR POSSIBLE USE IN DISPLAYS AND REPORT. Please identify all people, give the location where the photo was taken, and note the activity taking place. SEND ITEMS TO: PADEP - CVMP - SNAPSHOT, P.O. BOX 8555, HARRISBURG, PA 17105-8555
3950-FM-WM0013 Rev. 11/2004

MACROINVERTEBRATE STUDY Have your instructor show you how to use a fine mesh net to collect aquatic bugs and other invertebrates. Disturb the streambed for an area of about 1 square meter or yard (that's a square about 3 ft. long by 3 ft. wide). Try to catch all the organisms. If you don't have a net, you can carefully turn over rocks and look for organisms on and under the rocks and in the stream. Use the key you received with this packet to try to identify all the organisms you find. Scoring the invertebrates and determining a "WATER QUALITY RATING" can be done on the KEY sheet.
All the invertebrates on the key are marked with a "T", "F", or "S"
"T" = "tolerant," meaning they are not very sensitive to pollution and usually don't require a lot of dissolved oxygen. Each taxon (each kind, not each individual) you find in the "T" group scores 1 point.
"F" = "facultative," meaning that they are somewhat sensitive to pollution and require water of good quality. Each kind you find with an "F" rating scores 2 points.
"S" = "sensitive," meaning these macroinvertebrate organisms are very sensitive and require water of very good quality. These organisms are often referred to as "indicator organisms" because their presence indicates that the water is of good quality and probably not polluted with organic wastes. Each kind you find in this group scores 3 points.
You can rate the water quality based on both score and presence of sensitive bugs. See example and rating scale below:
Scoring and Water Quality Rating (revised 5/00) Excellent (score of 27+ or 5 or more "S" taxa) Fair (score of 11 - 16 or only 1 "S" taxon) V. Good (score of 22 - 26 or 4 "S" taxa) Poor (score of less than 11 and no "S" taxa) Good (score of 17 - 21 or 2 or 3 "S" taxa) Example: if you found 8 pouch snails, 6 orb snails, 4 leeches, 6 water pennies, 3 riffle beetles, and 9 stoneflies Your score would be: +1 +1 +1 +2 +2 +3 =10 Note that one of your finds (stoneflies) was a Sensitive family! A score of 10 would normally indicate .poor. quality, however, since one of your bugs was an "S" (3 pointer), you would rate the water quality as "fair." Use this space for reporting any additional information:

Pres
ence
/ A
bsen
ce r
atin
g ba
se o
n 1
M2 sa
mpl
ed
# of
kin
ds o
f "S"
X 3
.0 =
# of
kin
ds o
f "F"
X 2
.0 =
# of
kin
ds o
f "T"
X 1
.0 =
Tota
l N
o "S
" ta
xa o
r < p
oint
s =
Poor
1
"S" t
axon
or 1
1 - 1
6 po
ints
=
Fair
2 or
3 "S
" ta
xa o
r 17
- 21
poin
ts =
G
ood
4 "S
" tax
a or
22
- 26
poin
ts =
V
. Goo
d 5+
"S"
taxa
or 2
7+ p
oint
s =
Exce
llent

3950-FM-WM0013a Rev. 11/2004
Watershed Snapshot Riparian Zone Survey Before going onto private property, make sure you have permission from the landowner!
------------------------------------------------------------------------------------------------------------------------------------- A riparian zone is defined as, “lands next to streams, rivers, lakes, or other bodies of water where plants are strongly influenced by the presence of water.” This area may include wetlands and floodplains. Riparian zones are the places where ecosystems change from aquatic habitat to dry land environments. Healthy riparian zones help prevent pollution from washing off the dry land into the water, and so they are sometimes called “Buffer Zones”. Many of the problems in streams come from the surrounding land and the activities that take place there. A healthy and wide riparian zone helps to:
• trap sediments, nutrients and chemicals, • keep stream banks stabilized, • improve habitat and biodiversity, • keep the stream cooler in the summer, • reduce flood potential, • aid in replenishing groundwater, • create wildlife pathways
---------------------------------------------------------------------------------------------------------------------------------------- Materials:
• 6” or 12” ruler or use ruler printed on the top of the answer sheet • 100 foot tape measure • Ribbon or surveyor’s flagging tape or similar material to mark the corners of your plot for question #5.
Note: Be sure to remove the flagging tape or other marking material from the vegetation when you are finished. All other questions will require only your observation skills and a pencil to answer. The 100 foot tape measure will also help to answer questions #2a and #2b more accurately, but you can step-off the distances if you don’t have a tape measure. Instructions for Riparian questions: Questions 1., 3., 7., 8. Use your best judgment and observation skills, then check or fill-in the best answer.
2a. Measure the width of the riparian zone (streamside area containing wild plants) starting from the edge of the
stream bank and going directly away from the stream. Keep going until there is a very noticeable change in the type of vegetation or the land use changes. For example, perhaps the land use changes suddenly from trees and shrubs to a cornfield or highway. Stop measuring at the point where the change occurs. If the streamside area containing wild plants is greater than 100 feet wide, you can stop measuring and simply enter“> 100 feet” or continue to measure or estimate the actual distance and enter it on the survey sheet.
2b. Measure the length of the riparian zone you are studying. Use a tape measure or pace off the distance. If
the length appears to be very long (greater than you can walk or see in order to get an accurate estimated distance), you can guess the length from what you and the landowner know about your watershed. Circle whether you measured or guessed the distance on the form.
3. Use your best judgment and observation skills, then check or fill-in the best answer. 4. Observe the area you are working in. Do you see any disturbed soil, new trees or tree tubes. Look for
young or newly planted trees and shrubs. For this exercise you can assume trees are in this category if they are less than 12 feet high, have trunks that are less than 2 inches across, or are wrapped in protective material. If so, this might be a recently established riparian zone, however, this is not always easy to tell. Use your best judgment to answer the question.

3950-FM-WM0013a Rev. 11/2004 5. It is time to use your ruler, tape measure and flagging. You will be making a rectangle 100 feet long by 20
feet across to determine the tree population density of your riparian zone. (If you don’t have a tape measure, 33 big steps is about 100 feet long and 7 big steps is 20 feet wide). Pick a random spot in the riparian area by tossing a stone anywhere into the riparian area. This will be your starting point. Mark this point with your flagging material or some object. Fasten one end of your tape measure at this starting point and walk 100 feet straight away from your starting point. Walk in the same general direction that the stream flows (or parallel to the shoreline). Keep the tape measure as straight as possible and measure a 100 foot length. This is your ending point. You will want to count every tree that is within 10 feet to the right and to the left (In other words, on both sides) of this straight line. It may help to measure 10 feet on each side of your starting point and ending point and marking the four corners with flags. This will give you the four corners of the rectangle in which you will be working. You now have marked off an area that measures 100 feet by 20 feet. Count all of the living and dead trees and woody shrubs (but not vines) that are as fat as a pencil or fatter within the rectangular plot (touching the edge counts!). 5a. Count all woody plants that are between ¼” and 2” and record the number counted in the appropriate space on the answer sheet. 5b. Do the same thing for plants in the 2”-12” range and 5c. Do the same thing for trees more than 12’ across. Multiply the numbers for each group you counted by 22. This is the estimated tree density per acre of the riparian zone. (The 100 foot x 20 foot plot is approximately1/22 of an acre.) Find the estimated tree density per acre for each size category on the table and see how many RIPARIAN POINTS it scores.
OPTIONAL: One way to increase the accuracy of your answer is to do this exercise more than once in the same riparian zone, and use the average number of trees from several plots for your calculations.
Tree Population Table: RIPARIAN
POINTS # SMALL TREES
(1/4” – 2” ACROSS) # MEDIUM TREES (2”– 12” ACROSS)
# MATURE TREES (>12” ACROSS)
5 points More than5000 (5 pts) More than 600 (5 pts) More than 135(5 pts) 2 points 3000 – 6000 (2 pts) 200 – 600 (2 pts) 45 - 135(2 pts) 1 point 2000 – 3000 (1 pt) 50 – 200 (1 pt) 10 – 45 (1 pt) 0 points Less than 2000 (0 pts) Less than 50 (0 pts) Less than 10 (0 pts)
5d. Add up the number of points you get from each of the three categories. This is your Total Score. 5e. RIPARIAN POINT TOTALS: 12–15 points is Excellent; 9-11 points is V. Good; 7-8 points is Good;
4-6 points is Fair; 2-3 points is Undesirable; 0-1 point is Poor
6a and 6b. While standing on the shoreline or stream bank, look straight up toward the sky. Try to visualize the tall and overhanging treetops (canopy) as they will look when they have their leaves this summer. Then use your best judgment and the scale on the back of the answer sheet to answer the questions. 7., 8. Use your best judgment and observation skills, then check or fill-in the best answer. 9. Riparian Zones that lack vegetated cover or show signs of erosion may benefit water quality and wildlife
habitat if restoration occurs. On smaller streams, this may be accomplished by planting a riparian forest buffer.

3950-FM-WM0013b 11/2004
0---------------1---------------2----------------3---------------4---------------5---------------6--------------7-----INCHES
WATERSHED SNAPSHOT RIPARIAN ZONE SURVEY
Check or fill in the best answer. 1. The riparian zone I am studying is beside a:
River Stream Lake or Pond Wetland Small unnamed tributary 2a. The riparian zone I am studying is about ______________ feet wide. (Measured / Estimated) 2b. The riparian zone I am studying is about ______________ feet/yards/miles long. (Measured / Guessed) 3. The riparian zone I am studying is made up of (check all that apply):
Pavement Exposed Ground Grass Pasture Shrubs Mature trees A Mixture of trees, shrubs and weeds Other:
Describe or give details:
4. Do you see any disturbed soil, new trees or tree tubes indicating the zone was recently planted? Yes No Unsure
5. (See instructions before figuring out this answer.) 5a. Number of trees ¼” - 2” across in the 100’ x 20’ rectangle is __________ X 22 = ___________ per acre 5b. Number of trees 2-12”across in the 100’ x 20’ rectangle is ____________ X 22 = ___________ per acre 5c. Number of trees >12” across in the 100’ x 20’ rectangle is ____________ X 22 = ___________ per acre 5d. Using the Tree Population Table in the instructions, this riparian zone scores a total of __________ points. 5e. This gives it a rating of Excellent(12-15 pts) Very Good(9-11 pts) Good(7-8 pts) Fair(4-6 pts) Undesirable(2-3 pts) Poor(0-1 pts) 6a. Do tall trees and vegetation provide shading to most of the water? Yes No 6b. My guess is that in the summer the water is about __________% shaded by tall trees providing canopy cover.
(Use the scale on the back of this paper to help you guess the best % of shade.) 7. Moving further away from the water, the next type of Land Use adjacent to the riparian area I am studying is:
Mature trees Shrubs Crops Grass Pasture Paved Other:
8. Is the riparian zone on the other side of the water similar to the one on this side? Yes No Unsure 9. Does this site appear to be a potential site for a riparian zone “buffer” improvement project, such as a tree-
planting project? (The area lacks vegetation, shows bare earth or shows signs of bank erosion.) Yes No, I think it looks like a good riparian zone Unsure

3950
-FM
-WM
0013
b
11/2
004
6a &
6b.
Vis
ual (
ocul
ar) m
etho
d fo
r es
timat
ing
cano
py c
over
W
hile
sta
ndin
g on
the
shor
elin
e or
stre
am b
ank,
look
stra
ight
up
tow
ard
the
sky.
Try
to v
isua
lize
the
tall
and
over
hang
ing
treet
ops
(can
opy)
as
they
will
look
w
hen
they
hav
e th
eir l
eave
s th
is s
umm
er.
Then
use
you
r bes
t jud
gmen
t and
the
scal
e be
low
to a
nsw
er th
e qu
estio
n. F
or q
uest
ion
6b m
ake
a vi
sual
est
imat
e of
the
tree
cove
r ove
r the
stre
am (i
mag
ine
that
it is
sum
mer
and
the
trees
hav
e al
l the
ir le
aves
).