The Clinical Characteristics of Medicare Beneficiaries 2-0.
26
The Clinical Characteristics of Medicare Beneficiaries and Implications for Medicare Reform Robert A. Berenson, M.D. Senior Advisor Academy for Health Services Research and Health Policy Jane Horvath Deputy Director Partnership for Solutions Prepared for The Center for Medicare Advocacy, Inc. March 2002 Conference on Medicare Coordinated Care, Washington DC.
Transcript of The Clinical Characteristics of Medicare Beneficiaries 2-0.

The Clinical Characteristics of Medicare Beneficiaries and Implications for Medicare Reform
Robert A. Berenson, M.D.
Senior Advisor Academy for Health Services Research and Health Policy
Jane Horvath
Deputy Director Partnership for Solutions
Prepared for The Center for Medicare Advocacy, Inc.
March 2002 Conference on Medicare Coordinated Care, Washington DC.

2
Introduction
The Medicare program was originally designed in 1965 to mirror the standard health
insurance of the times, Blue Cross/Blue Shield which meant coverage for major medical
(inpatient hospital coverage) and basic outpatient coverage (doctors and related services).
While there have been many changes in health care and the Medicare population in the
years since 1965, there are a few important changes in the population that affect how well
the program serves its target population.
Advances in medical science and technology – new diagnostic and treatment procedures,
new equipment and new pharmaceuticals -- allow people to live longer with medical
conditions that require on-going care and treatment. Taken together, these facts mean
that the fact of the Medicare population has changed. We have a Medicare population
that is more elderly and typically has multiple chronic conditions that require on-going
care. Unlike its beginnings, the Medicare program now covers people with End Stage
Renal Disease and most recently, Amyotropic Lateral Sclerosis (ALS) . There is also a
younger, disabled population entitled to the program, making up about 13% of the
program population. The changed nature of the program population may indicate that the
acute, episodic care orientation may no longer be sufficient to address some critical needs
of the population.
This paper provides a profile of today’s Medicare beneficiaries using the Standard
Analytic File for 1999 and the Household Component of the Medical Expenditure Panel
Survey (MEPS) from 1996. The focus of the analysis is clinical; we examine medical

3
service use and diagnosis for chronic conditions rather that functional limitation and long
term care needs. 1 The analysis of SAF service utilization data excludes persons who
died during the survey year in an attempt to extract the effect of end of life care on
service utilization and costs. This can only be considered a crude adjustment since
clearly there were people at the end of life during the survey year who died after the
survey year.
To conduct this analysis, we looked at the SAF and MEPS data in two ways. First we
broke out utilization by Medicare eligibility status and age. To do this, we broke out and
analyzed separately the under 65 year old ESRD, under 65 disabled, and under 65 ESRD
with disability, and also examined the 65 and older plus population in increments of 5
years beginning at 65 and grouped the 85 years and over population together. We then
looked at the population by number of chronic conditions – all those in each data set with
no chronic conditions, one chronic condition, two such conditions, etc. (as determined by
claims or self-reported conditions in the case of MEPS). People with five or more
conditions were grouped together.
In order to think about care of Medicare beneficiaries with chronic conditions, it is
helpful to define, or at least distinguish, among terms. Acute care, most people would
agree, is care delivered on an episodic basis to treat or cure acute illness, or to treat acute
exacerbations of a chronic condition. The need for long term care arises from a need for
human or technological assistance in Activities of Daily Living (ADLs) or Instrumental
Activities of Daily Living (IADLs). Often, debilitation stemming from the effect of one,
or more than one, chronic condition results in the need for long term care services.

4
Chronic care is often thought of as the array of services represented by the acute and long
term care systems brought together to treat and serve frail elders with chronic conditions.
However, chronic care can have a more clinical focus and can be thought of as a gray
area between acute and long term care services. This approach may be more appropriate
for thinking about design of health coverage programs such as Medicare that are
medically oriented and are likely to remain so for the immediate future. Chronic care
then, can be clinically-oriented, ongoing medical care, management and prevention for
people with (multiple) chronic conditions organized to maintain health status, slow
disease progression and maintain functional status of the individual.
Chronic Conditions The top five chronic conditions in the Medicare population overall are: hypertension,
diseases of the heart, diseases of the lipid metabolism, eye disorders, and diabetes.2
There is not a great deal of variability by age or eligibility status in the top disease
rankings although some of the variability highlights include the following.
• There is little variability in disease rankings in the 65 to 85 year old populations but some variability in the ESRD and disabled populations relative to the aged population.
• Senility and organic mental disorders are most prevalent in the 85 years and older population but begin appearing among the top 15 conditions in the 75 – 79 year old group.
• Affective disorders are the fifth most prevalent group of conditions for the disabled population but rank 13th for the general Medicare population. Other conditions related to mental health appear more prevalent in the disabled population than in the aged Medicare population.
• Asthma is one of the top 15 most common conditions among disabled Medicare beneficiaries but asthma is not otherwise very prevalent in the Medicare population.

5
General Prevalence and Cost
About 78% of the Medicare population has at least one chronic condition while almost
63% have two or more. Of this group with two or more conditions, almost one-third
(20% of the total Medicare population) has five or more chronic conditions, or co-
morbidities.
Aged beneficiaries make up at 87% of the program population, 13% are eligible due to
disability and under .4% have end stage renal disease. Spending on people with ESRD
constitutes just over 3% of program expenditures and spending on the under-65 disabled
equals about 11% of program costs.
Within the disabled population, the SAF data indicates that 38% do not have a chronic
illness (two claims in the year for a condition defined as chronic).3 In general, the
prevalence of chronic conditions increases with age – 74% of the 65 to 69 year old group
have a least one chronic condition, while 86% of the 85 years and older group have at
least one chronic condition. Similarly, just 14% of the 65-69 year olds have five or more
Percent Cases by Number of Chronic Conditions
0 CC22.1%
1 CC15.1%
2 CC16.3%
3 CC14.8%
4 CC11.3%
5+ CC20.3%
Source: Medicare SAF 1999
Total Medicare Population
Percent Cases by Age
<65, Disabled 13.0%
<65, ESRD 0.2%
65-6922.3%
75-7918.8%
80-8412.6%
85+10.1%
70-7422.8%
<65, Disabled/
ESRD 0.2%
Total Medicare Population
Source: Medicare SAF 1999

6
chronic conditions, but 28% of the 85 years and older group have five or more. (Fourteen
percent of the people with disability-related eligibility have five or more chronic
conditions but 46% of the ESRD patients have five or more.)
Of the Medicare beneficiaries with a chronic condition (78% of all beneficiaries), those
aged 70-74 make up the largest proportion of those with one or more chronic conditions –
23%. Those 85 and over are 11% of the total Medicare population with any chronic
condition. People with disability-related eligibility are 10% of the chronically ill
population. Of total beneficiaries without a chronic condition, the largest segment is the
65-69 year old population, who make up 27% of all those without a chronic condition,
followed by the people with disabilities who constitute 23% of the non-chronically ill
group. Prevalence of multiple chronic conditions increases with age. Among
beneficiaries with five or more chronic conditions, those 80 years and older are 31% of
cases whereas they are only 19% of cases with one chronic condition.
Average per beneficiary spending does not vary all that much by age, when viewed
against number of chronic conditions. For example, among age-entitled beneficiaries
with five or more chronic conditions, average per beneficiary spending is $13,300 for
people aged 65 – 69, and $13,400 for those 85 and over. For aged beneficiaries with one
chronic condition, average per beneficiary spending for those 65 – 69 years old is $870
while it is $1,100 for those over 85 years.

7
In contrast, there is significant variation in costs when viewed by number of chronic
conditions without regard to beneficiary age. Average per person costs for people with
no chronic conditions was $160 (including the under 65 entitled), while the average per
person cost jumps to $13,700 for people with five or more chronic conditions. The
average per beneficiary spending across all ages and eligibility groups is $4,200. Per
beneficiary spending increases more than 2 ½ times between two and four chronic
conditions, and nearly triples again from four to five chronic conditions.
People with one chronic condition are 15% of the Medicare population but only 3.5% of
the spending. People with 3 chronic conditions are also 15% of the population but 10%
of the spending. People with 5 chronic conditions are 20% of the population but 66% of
program spending. (This analysis remains essentially unchanged when the ESRD and
disability groups are removed from the calculations. Because they are about 13% of the
total beneficiary population but the bulk of this group, those with disabilities, have
Average Per Person Cost by Number of Chronic Conditions
$163
$982
$1,764
$2,944
$4,755
$13,730
$0 $2,500 $5,000 $7,500 $10,000 $12,500 $15,000
0
1
2
3
4
5+
Num
ber
of C
hron
ic C
ondi
tions
Average Per Person CostSource: Medicare SAF 1999
Average Per Person Cost by Age Group/ Eligibility Group
$39,003
$27,140
$3,450
$3,130
$3,902
$4,586
$5,117
5,464
$0 $10,000 $20,000 $30,000 $40,000 $50,000
<65, Disabled/ ESRD
<65, ESRD
<65, Disabled
65-69
70-74
75-79
80-84
85+
Age
Gro
up
Average Per Person Cost
Source: Medicare SAF 1999

8
average utilization and spending that tracks the younger segments of the age-related
eligibility group.)
Average per person spending for the age-entitled beneficiaries varies very little within
among those with one chronic condition. This is true in each grouping of people by
number of chronic conditions. In general there is an increase in average per beneficiary
spending as age increases.
Inpatient Utilization
Inpatient utilization does not vary all that much by age although it does vary significantly
for groups not eligible by age. The average length of stay (LOS) for all beneficiaries is
10.3 days and 19% of the population has an inpatient stay. ESRD beneficiaries have
much higher rates of hospitalization and longer lengths of stay than aged beneficiaries.
When we examined the service utilization by number of chronic conditions, a strong
pattern emerged of increasing costs and utilization as the number of conditions increase.
Fifty-five percent of beneficiaries with five or more conditions experienced an inpatient
Spending by Number of Chronic Conditions
1 CC3.5% of $$0 CC
0.9% of $$2 CC
6.8% of $$
3 CC10.3% of $$
4 CC12.7% of $$
5+ CC65.8% of $$
Medicare Expenditures
Source: Medicare SAF 1999
Spending by Age Group/ Eligibility
8 5 +1 3 .1 % o f
$$
8 0 - 8 41 5 .2 % o f
$$
7 5 - 7 92 0 .4 % o f
$$
7 0 - 7 42 1 .0 % o f
$$
6 5 - 6 91 6 .5 % o f
$$
<6 5 , ESR D
1 .4 % o f $$
<6 5 , D isab led 1 0 .6 % o f
$$
<6 5 , D isab led /
ESR D 1 .8 % o f
$$
Medicare Expenditures
Source: Medicare SAF 1999

9
hospital stay compared to 5% for those with one condition or 9% for those with two
conditions. Inpatient days per thousand beneficiaries jumps from 335 days for those with
one condition to over 7000 days per thousand among those with 5 or more conditions.
The average days per thousand across all beneficiaries was 1944 (1833 if the under-65
are excluded).
Physician Services
In terms of physician visits, the average beneficiary has just over 15 visits annually and
sees 6.4 unique physicians in a year.4 ESRD-eligible beneficiaries see 13 unique
physician and have almost 38 visits annually while disability-related eligibles average 5
unique physicians and have an average of 13 visits annually. In contrast, people who are
85 years and older have almost 18 visits in a year and see 6.9 different doctors. Like
inpatient services, physician service use is highest for those aged 80 – 84 years old; they
have just over 18 visits with just over 7 different unique doctors.
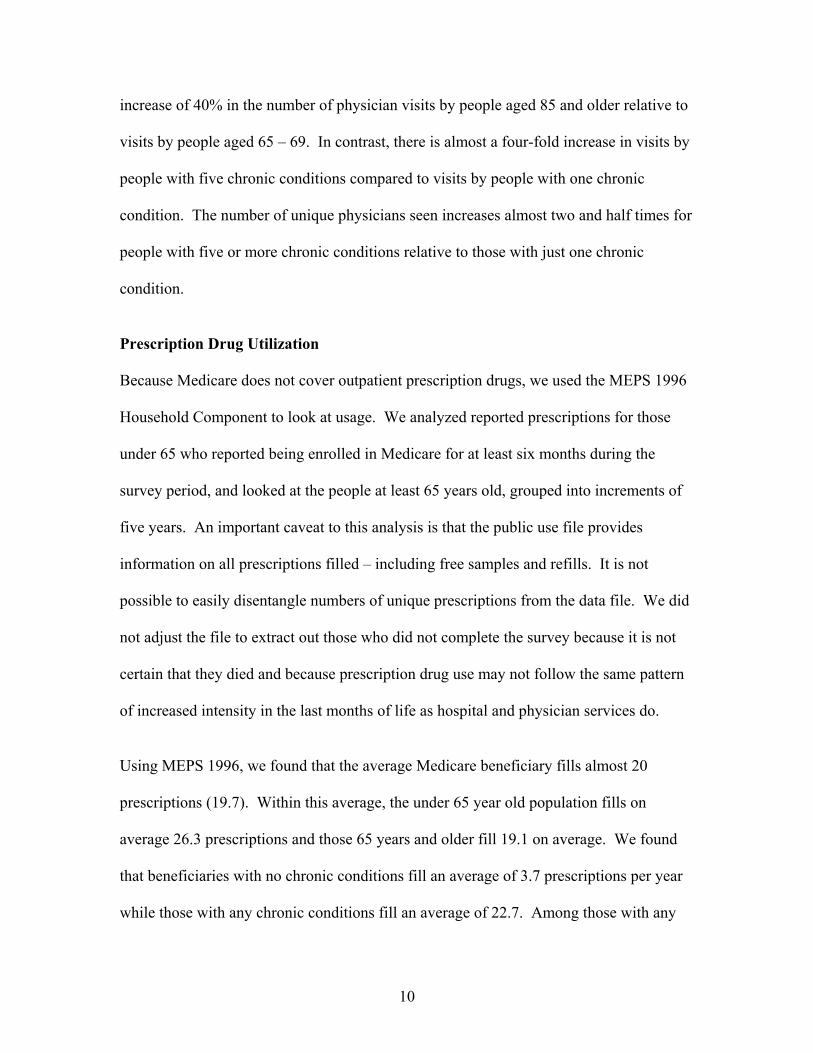
Once again, a more compelling pattern becomes apparent when physician service is
evaluated against numbers of chronic conditions. Comparing usage by age, there is an
Physician Services by Number of Chronic Conditions
1.34 5.2 6.5 8.1
13.8
2
7.811.3
14.919.5
37.1
0
5
10
15
20
25
30
35
40
0 1 2 3 4 5+Number of Conditions
Am
ount
Ser
vice
Util
ized
Average Unique Physicians Average Number of Physician VisitsSource: Medicare SAF 1999
10
increase of 40% in the number of physician visits by people aged 85 and older relative to
visits by people aged 65 – 69. In contrast, there is almost a four-fold increase in visits by
people with five chronic conditions compared to visits by people with one chronic
condition. The number of unique physicians seen increases almost two and half times for
people with five or more chronic conditions relative to those with just one chronic
condition.
Prescription Drug Utilization
Because Medicare does not cover outpatient prescription drugs, we used the MEPS 1996
Household Component to look at usage. We analyzed reported prescriptions for those
under 65 who reported being enrolled in Medicare for at least six months during the
survey period, and looked at the people at least 65 years old, grouped into increments of
five years. An important caveat to this analysis is that the public use file provides
information on all prescriptions filled – including free samples and refills. It is not
possible to easily disentangle numbers of unique prescriptions from the data file. We did
not adjust the file to extract out those who did not complete the survey because it is not
certain that they died and because prescription drug use may not follow the same pattern
of increased intensity in the last months of life as hospital and physician services do.
Using MEPS 1996, we found that the average Medicare beneficiary fills almost 20
prescriptions (19.7). Within this average, the under 65 year old population fills on
average 26.3 prescriptions and those 65 years and older fill 19.1 on average. We found
that beneficiaries with no chronic conditions fill an average of 3.7 prescriptions per year
while those with any chronic conditions fill an average of 22.7. Among those with any

11
chronic conditions, there is a relatively small difference between the under 65 and over
65 groups – 28.2 prescriptions versus 22.1 prescriptions respectively.
The utilization among the under 65 year old population generally slightly exceeds the
utilization of the 85 year old and over population. This is true in all categories but the
differential is greatest among those with either one or five chronic conditions. It is also
interesting to note that, in contrast to service utilization patterns, prescription drug
utilization is higher for those 65 – 69 with two or more chronic conditions than it is for
those 85 years old and older. The data do not provide many clues as to why this may be
the case.
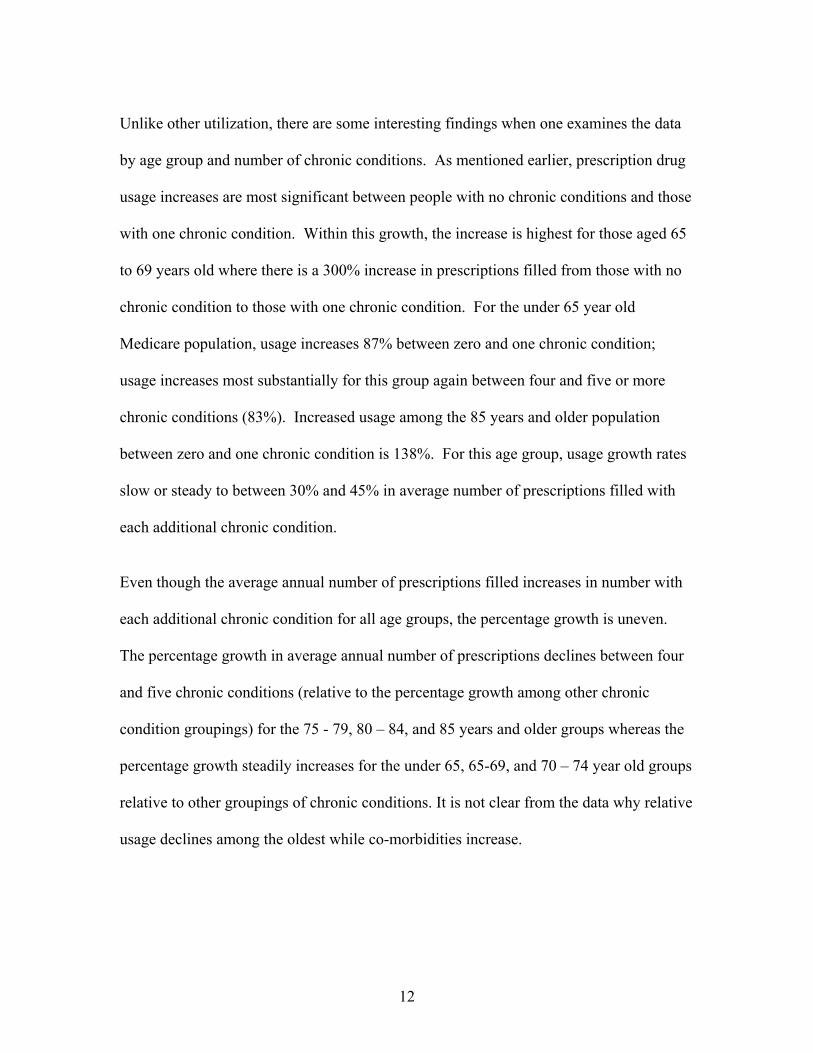
While there are some interesting highlights in the age-related analysis, once again the
stronger trends become obvious when the data are viewed through the lens of number of
chronic conditions.
• Average annual prescriptions filled jumps from 3.7 for all people studied with no chronic condition to 49.2 for people with five or more chronic conditions.
• Growth in usage between those with no chronic conditions and those with one chronic condition is over 180 percent – from 3.7 to 10.4 prescriptions filled.
• Usage grows 72% between one and two chronic conditions, from 10.4 to 17.9 prescriptions filled.
• There is a 48% growth in average annual usage between four and five chronic conditions (33.3 to 49.2).
Average Annual Prescriptions by Number of Chronic Conditions
3.710.4
17.924.1
33.3
49.2
0102030405060
0 1 2 3 4 5+
Number of Chronic Conditions
Ave
rage
Num
ber
Pres
crip
tion
(incl
udin
g re
fill)
Source: Medicare SAF 1999
12
Unlike other utilization, there are some interesting findings when one examines the data
by age group and number of chronic conditions. As mentioned earlier, prescription drug
usage increases are most significant between people with no chronic conditions and those
with one chronic condition. Within this growth, the increase is highest for those aged 65
to 69 years old where there is a 300% increase in prescriptions filled from those with no
chronic condition to those with one chronic condition. For the under 65 year old
Medicare population, usage increases 87% between zero and one chronic condition;
usage increases most substantially for this group again between four and five or more
chronic conditions (83%). Increased usage among the 85 years and older population
between zero and one chronic condition is 138%. For this age group, usage growth rates
slow or steady to between 30% and 45% in average number of prescriptions filled with
each additional chronic condition.
Even though the average annual number of prescriptions filled increases in number with
each additional chronic condition for all age groups, the percentage growth is uneven.
The percentage growth in average annual number of prescriptions declines between four
and five chronic conditions (relative to the percentage growth among other chronic
condition groupings) for the 75 - 79, 80 – 84, and 85 years and older groups whereas the
percentage growth steadily increases for the under 65, 65-69, and 70 – 74 year old groups
relative to other groupings of chronic conditions. It is not clear from the data why relative
usage declines among the oldest while co-morbidities increase.

13
Utilization and Care Coordination
So what does all this information mean for beneficiaries and for the program that serves
them? There are indications in the data that there is a lot of care provided to beneficiaries
with chronic conditions – particularly those with multiple chronic conditions. There are
also indications that the care may not be well-coordinated and that for beneficiaries with
multiple chronic conditions there are adverse outcomes.
Researchers at Johns Hopkins (Wolff and Starfield, unpublished) have found that as the
number of chronic conditions increase, so too do the number of inappropriate
hospitalizations for illnesses that could have received effective outpatient treatment
(Ambulatory Care Sensitive Conditions). Per 1000 beneficiaries, these hospitalizations
increase from seven for people with one chronic condition to 95 for beneficiaries with
five chronic conditions, and jumps again to 261 for people with 10 or more chronic
conditions.5
Given that beneficiaries are receiving many medical services, it may be reasonable to
speculate that greater coordination is needed particularly for those with multiple or co-
morbid, conditions. It may be that different providers are recommending conflicting
treatments that result in poor outcomes including adverse drug events. It could be that
one condition is receiving treatment while other chronic conditions go unattended and
then flare up into acute episodes. The work of Wolff and Starfield seems to indicate that
people with multiple chronic conditions careen from one acute exacerbation to another, a
result of a series of unattended co-morbidities.
14
Implications for Medicare Program Reform
The data compellingly document that Medicare is a program for people with one or more
chronic conditions. Yet, the structure of Medicare was modeled after indemnity insurance
programs in existence when Medicare was enacted into law in 1965 and was not designed to
care for people with chronic conditions.
In his seminal article, “Uncertainty and the Welfare Economics of Medical Care,” Nobel
laureate Kenneth Arrow, writing in 1963, discussed the issue of “moral hazard” in
insurance. (Arrow) That is, “what is desired in the case of insurance is that the event against
which insurance is taken be out of the control of the individual.” Otherwise, “moral hazard.”
Arrow emphasized that insurance is more valuable the greater the uncertainty of the risk
being insured against, the reason, he explains, for putting greater emphasis on insurance
against hospitalization and surgery than other forms of medical care.
In this context, Arrow commented specifically on the merits of insurance against chronic
illness. “On a lifetime insurance basis, insurance against chronic illness makes sense, since
this is both highly unpredictable and highly significant in costs. Among people who already
have chronic illness, or symptoms which reliably indicate it, insurance in the strict sense is
probably pointless.”
Passed less than two years after Arrow’s article, Medicare reflected the indemnity insurance
model of covering unanticipated and unwanted events and not aspects of care that are
predictable and desirable for patient and provider. Over time, of course, the traditional

15
Medicare program has evolved somewhat to better reflect the growing reality that the
program in many ways provides a social insurance-based pooling mechanism for prepaying
for predictable medical services and is not just an insurance program in the “strict sense.”
Nevertheless, despite coverage for specific prevention services in statute, limited coverage
for patient education, such as for diabetes, and a modest reorientation of the physician fee
schedule to better compensate so-called evaluation and management services, the program
maintains an indemnity insurance orientation that does not support improved forms of care
for the large majority of beneficiaries who have chronic conditions.
In the fee for service environment, care for beneficiaries with chronic conditions can be
characterized “as fragmented and poorly coordinated across multiple health care providers
and multiple sites of care. Evidence-based practice guidelines have not always been
followed, nor have patients been taught how best to care for themselves. These
shortcomings are particularly true for patients served under reimbursement systems in which
providers lack incentives for controlling the frequency, mix, and intensity of services, and in
which providers have limited accountability for the outcomes of care.” (CMS web site)
Wagner and colleagues have identified a number of elements of a Chronic Care Model.
(Wagner) The new interventions cluster in six areas: health care organization, community
resources, self-management support, delivery system design, decision support, and clinical
information systems. Some of these elements are not directly related to Medicare payment
policy, but a few depend crucially on the ability to achieve adequate compensation. For
example, in the area of patient self-management, the acquisition of patient self-management

16
skills occurs outside of clinical encounters and involves personnel who are not reimbursed
under Medicare payment rules. Similarly, delivery system design requires the coordinated
actions of multiple caregivers, including clinical case manager functions, performed by
chronic disease nurses or pharmacists, again, non-reimbursable activities under current
rules.
Even straight-forward and desirable use of telephone contact – or email -- to enhance
appropriate patient follow-up to treatment regimen cannot easily be covered in an indemnity
insurance context because of concerns about relatively high administrative costs to process
telephone call claims, potential fraud and abuse, and potentially high use patterns for such
an easily assessed and desired intervention, i.e., the results of moral hazard.
The Potential of Capitation
Even in 1965, when Medicare was enacted, there were alternative financing and
organizational approaches that combined service delivery and insurance, the so-called
prepaid group practices, such as Kaiser-Permanente and Group Health Cooperative of Puget
Sound. In some ways, these organizations are better positioned to administer services for
patients with chronic conditions than the traditional fee for service program. One of the
main reasons is that they rely on capitation as a financing mechanism, rather than piece-
meal payments to each individual provider that might be involved in the care of patients. “In
a capitated environment, organizations bearing financial risk have strong financial
incentives to identify their high-risk members early and to provide them with special care
designed to optimize their health and avert health-related crises. They have longer-range

17
incentives to promote continued good health among older enrollees who are not chronically
ill.” (Boult, 1999)
Capitated plans can be much more flexible than the traditional Medicare program in
establishing innovative services, and many of the innovative programs for patients with
chronic disease have been based in health maintenance organizations. Unfortunately,
capitated risk-contracting in Medicare is not doing well at this time – for reasons that go
well beyond the scope of this paper. One of the basic problems is that the Section 1876 risk-
program and its successor, Medicare + Choice, were designed to reward plans caring for
relatively healthy beneficiaries who were attracted to plans offering additional benefits
beyond the statutory Medicare benefits. Although theoretically, development and
implementation of a powerful, health status-based, risk adjustment method would give
health plans incentives to actively market to beneficiaries with chronic diseases, currently,
difficult implementation issues makes the future of risk adjusted payment to health plans
uncertain. Indeed, the future of the Medicare+Choice program is uncertain, and the logic of
capitation as a primary vehicle for stimulating innovation in care for the chronically ill
unproved in Medicare
Within the traditional fee for service program, two sets of demonstrations targeted to
beneficiaries with chronic disease are getting started. On January 19, 2001 CMS announced
selection of 15 demonstration sites under the Medicare Coordinated Care Demonstration,
authorized by the Balanced Budget Act of 1997. Providing case management and disease
management services, organizations will provide “comprehensive planning, patient

18
education, and ongoing monitoring between doctor visits to improve self-care… In addition,
some of the projects will offer participating beneficiaries additional benefits aimed at
removing barriers to prompt medical care, such as coordinating with community-based
services, transportation, assistance with medications, non-covered home visits, and medical
equipment.” (CMS website)
The Medicare, Medicaid and State Child Health Insurance Program Benefits Improvement
and Protection Act of 2000 (BIPA) set up an additional demonstration program testing
disease management programs for beneficiaries with advanced-stage congestive heart
failure, diabetes, and coronary heart disease. CMS recently solicited applications under this
program, which could result in three awards covering up to 30,000 beneficiaries at a time.
Prescription drugs would be covered under these demonstrations and the demonstrations
would be required to meet strict budget neutrality requirements.
The coordinated care and disease management demonstrations importantly focus on
organizational accountability for caring for beneficiaries with chronic conditions, trying to
achieve in the fee for service program the kind of program innovation that some prepaid
group practices have accomplished.
Incremental Improvements in the Traditional Program
There may be opportunities for some program enhancements that would represent
incremental improvements in the traditional indemnity-oriented Medicare program. As
documented earlier, the majority of beneficiaries have one or more chronic diseases. Some

19
have called for a range of services to be available to beneficiaries who have a certain
number of ADL or IADL limitations. Although reflective of functional status, basing
eligibility on ADLs has certain drawbacks. First is the fact that ADLs and IADLs are
typically measures of the need for personal assistance, i.e., measures of the need for long-
term care. But Medicare does not provide long term care services, but rather medical
services. It would be difficult for a program with an acute/subacute care statutory basis to
adopt and implement a long-term care eligibility standard. Second, consistent with the need
to assure equitable access to covered benefits, eligibility should not be predicated on an
assessment conducted by specialists, in this case, geriatricians, or institutions that are not
generally and widely available. Rather, eligibility should be determined by commonly
accessible physicians who may well lack specialized expertise. The general physician would
not be able to assess or authorize services based on ADL/IADLs and might be even less able
to document clearly a decision that would withstand review.
Rather than using ADLs, we would recommend considering eligibility for additional
benefits based on clinical status, as is done in the current program. For purposes of
discussion, beneficiaries with four or more serious chronic conditions could be the target
group. It might well be that further analysis would permit creation of a subset of chronic
conditions that are associated with higher costs and would become the conditions that
determine eligibility for additional payment or services. Consistent with planned
implementation of health status based risk adjustment in the M+C program, physicians
would be expected to identify patient diagnoses through assessment and documentation,
within their scopes of practice.

20
A clinical condition based approach could more readily predict the numbers of eligible and
better anticipate program costs than one based on measures of functional status.
For beneficiaries who qualify based on the presence of the requisite number of serious
conditions, higher payments for office based care would be made. This enhanced payment
could be billed by any and all unique physicians who see the patient for each office visit.
The higher payment would more generously compensate physicians for the greater amount
of time they and their staffs need to care for patients with serious chronic conditions and to
coordinate with other treating physicians and other professionals who are caring for the
patient.
Unlike a broad based payment available to all physicians, a more targeted approach might
be a clinical case management model whereby a treating physician accepts added
responsibility to coordinate the clinical care provided by all treating physicians. In the
managed care environment, this approach has received the pejorative appellation of a
“gatekeeper,” because of the emphasis on requiring the designated physician to approve all
referrals to specialists and for many ancillary tests and procedures.
Medicaid has a parallel mechanism called the Primary Care Case Manager (PCCM) model.
In Medicaid, a beneficiary selects or is otherwise assigned to a primary care doctor who acts
as a care coordinator and primary care provider. The model has changed somewhat since it
was first implemented in Medicaid and in some cases the care management aspect has been
weakened over time, but it may still have relevance for needs in the Medicare program.
21
Physicians in this role are paid in one of two ways: a monthly per head management fee
which is separate and apart from billing for specific services rendered, or a monthly
capitation to the physician for a range of primary care services and the care coordination
activities.
A number of design issues would have to be considered in applying a PCCM-type approach
to Medicare. Whereas these programs are typically required in managed care and in
Medicaid applications, the strong Medicare tradition would be to make it voluntary for the
beneficiary, perhaps in exchange for reduction of some cost-sharing obligations or discount
off of the part B premium. Although the desirability of having a single physician coordinate
care might be relevant for all Medicare beneficiaries and might be promoted in program
guidance and educational materials, specific reductions in cost-sharing requirements might
be limited to those with a certain number of chronic conditions, as discussed above.
For their part, physicians could participate to the extent that they agreed to follow certain
administrative procedures to track and monitor all aspects of a beneficiary’s care, act as a
referral, receive and coordinate clinical reports from others involved in the patient’s care,
maintain a robust medical record and be available to provide greater consultation time
surrounding a qualified beneficiary’s care. An outstanding issue is whether specialists who
agree to these requirements would be designated as the case managing physician for
Medicare beneficiaries, given the prevalence of certain chronic conditions that are
commonly cared for by specialists, e.g., cardiologists. Inserting another physician – a
primary care physician – into the mix of specialists already caring for a beneficiary with
22
multiple chronic conditions may not be warranted if one of the specialists is willing and able
to carry out the coordination functions this model requires.
A logical payment approach for Medicare would be a monthly capitation fee for care
management services, in addition to standard fee for service reimbursements for discrete
physician services that are reimbursed under the Medicare fee schedule. An alternative
would be to bundle standard primary care services into a much larger monthly capitation
amount. Medicare actually has experience with monthly capitated payments for covered
physician services in the payment system for renal physicians under the ESRD program. As
alluded to above, capitation provides greater flexibility than fee for service payment and
may be more conducive to implementing delivery system innovation, along the lines of the
Chronic Care Model, outlined above. However, primary care capitation can have untoward
incentives to stint on care and, depending upon whether capitated physicians are at risk for
referrals and hospitalizations, may have an incentive for inappropriate referrals.
One approach would be to pay a monthly capitation care management fee to designated
physicians while maintaining fee for service reimbursement for discrete physician services
for physicians practicing in solo and small group practice, while encouraging the expanded
capitation option for physicians practicing in large, multispecialty group practices that have
the administrative infrastructure and financial wherewithal to manage larger capitation
amounts.

23
Under either payment structure, the model would require some sort of provider designation
such that participants would have to meet certain standards for care, quality, and
administrative capabilities. Because only one provider can be paid for the clinical care
management of a particular patient, more administrative capabilities may be required of the
carriers, although the precedent already exists in limiting services under the traditional
program for those enrolled in M+C.
Beyond administrative structures that can facilitate greater coordination of clinical care, it
may be appropriate specifically to consider benefit design that can facilitate greater clinical
care coordination and management. One such approach would be a modified, home visit
type of benefit. The current home health benefit is for people in need of extended home
nursing and personal care services and who meet a technical definition of “homebound.”
The current 60-day episode of care payment reflects the extended nature of the benefit.
There may be need, however, for another type of benefit that is not as extensive or intensive
as the current home health benefit. Although current rules require direct physician
supervision of ancillary personnel seeing Medicare patients, such direct supervision is not
practical in some circumstances. Physicians have said it would be helpful to clinical care if
they could authorize their office nurses or physician assistants to periodically conduct home
visits to check on patients. This benefit, then, would be limited in scope to infrequent
medical monitoring when a patient is not able to come to the office due to temporary or
otherwise acute health conditions but allows the physician more direct knowledge of health
status and functioning than a service delivered through a separate agency.
24
Limitations might need to be placed on the benefit, perhaps by allowing a limited number of
visits per beneficiary times per year, by defining the qualifications of practitioners who
might make such home visits, and by restricting services, perhaps to medical assessment,
medical monitoring, and medication management. Further, the visits might be limited to
follow-up associated with acute exacerbations of chronic conditions, or to periods when a
patient’s treatments have been altered due to a change in health status.
This benefit is not intended to replace the home health benefit but rather is intended to be a
limited tool by which physicians can better coordinate care. The benefit needs to be crafted
in such a way that it provides a useful tool for greater clinical care coordination and so that it
does not spawn a new cottage industry. In addition, payment for any such benefit would
need to recognize differential costs and efficiencies between rural and urban areas. Although
the coordinated care and disease management demonstrations correctly are designed to
implement broad-based coordination, it is likely that information gained in the
demonstrations would assist in crafting specific specifications for this narrow expansion
permitted home visits.
Summary
The paper attempts to show that there is a current mismatch between the chronic care
related needs of the majority of Medicare beneficiaries and the historical structure of the
Medicare program that is grounded in a model of indemnity insurance. Although the
more innovative changes in the program would involve moving toward organizational

25
accountability for caring for beneficiaries with chronic conditions, through capitated
payments -- either for all covered services or for the services specifically related to care
coordination activities -- such changes will depend upon results of demonstrations, some
of which have recently been initiated. In the meantime, we recommend incremental
changes within the structure of the current program that would better recognize the needs
of beneficiaries with multiple chronic conditions.
1 Chronic conditions are defined as conditions that are expected to last a year or more, limit what one can do and/or require ongoing medical care. To operationalize this definition, Johns Hopkins University convened two physician panels to determine which ICD-9 codes met the definition. SAF and MEPS data were then analyzed with the designations of conditions. People were generally counted as having a chronic condition if there were at least two claims in the year for the same diagnosis, where the diagnosis met the definition. Our claims analysis tracks chronic illnesses more accurately than it tracks all chronic conditions because chronic conditions in our definition can include those that result in activity limitations but do not necessarily require on-going medical care (defined as two claims in a year). 2 The top 15 most common chronic conditions in Medicare are: hypertension; diseases of the heart (including coronary atherosclerosis and congestive heart failure, cardiac disrhythmia,among others); disorders of the lipid metabolism (including hyperlipidemia and pure hypercholesterolemia among others); eye disorders (including senile nuclear sclerosis, senile cataract, glaucoma among others); diabetes mellitus; non-traumatic joint disorders (including osteoarthritis and rheumatoid arthritis among others); thyroid disorders (including hypothyroidism and thyrotoxicosis among others); COPD and bronchiectasis (including chronic airway obstruction and chronic bronchitis among others); diseases of the male genital organs; diseases of arteries, arterioles, and capillaries (including peripheral vascular disease, atherosclerosis of extremities or aorta, among others); senility and organic mental disorders (including Alzheimer’s and senile dementia among others); spondylosis, intervertebral disc disorders, and other back problems; affective disorders (including neurotic depression, major depressive disorder among others); osteoporisis; diseases of the urinary system; viral infection (chronic); chronic ulcer of the skin; other connective tissue disease; other nutritional, endocrine, and metabolic disorders; other endocrine disorders; nutritional deficiencies; anemia, schizophrenia and related disorders; anxiety, somatoform, dissociative, and personality disorders; other nervous system disorders; cerebrovascular disease (including cerebral atherosclerosis among others); asthma. 3 Claims analysis based on ICD-9 codes does not count as having a chronic illness, people with disabilities or activity limitations who do not require on-going medical care. There are people with disabilities who do not require on-going medical care as defined in our research parameter of having two claims in a year for the same chronic condition. 4 This number of unique physician visits is 6.7 when people who died are included and is 4.6 when only outpatient settings among the age-entitled are included in the analysis. 5 This analysis includes only age-eligible beneficiaries.

26
References
Arrow, KJ, “Uncertainty and the Welfare Economics of Medical Care,” The American Economic Review, vol. LIII (5) 941-973, Dec. 1963. Boult C, Kane RL, Pacala JT and Wagner EH, “Innovative Healthcare for Chronically Ill Older Persons: Results of a National Survey,” The American Journal of Managed Care, vol. 5(9), 1163-1172, Sept, 1999. Centers for Medicare and Medicaid Services website. www.HCFA.gov/research/projdfs.htm (assessed 4 March 2002) Wagner EH, Austin BT, Davis C, et. al. “Improving Chronic Illness Care: Translating Evidence into Action,” Health Affairs vol 20 (6), 64-78, Nov-Dec 2001.