
THE CITY OF NAPLES, FLORIDA - Florida Auditor General rpts/2014 naples.pdf · Naples continues to...
207
THE CITY OF NAPLES, FLORIDA Comprehensive Annual Financial Report For the Year Ended September 30, 2014 (With Independent Auditor's Report Thereon) Prepared By: FINANCE DEPARTMENT
Transcript of THE CITY OF NAPLES, FLORIDA - Florida Auditor General rpts/2014 naples.pdf · Naples continues to...

THE CITY OF NAPLES, FLORIDA
Comprehensive Annual Financial Report
For the Year Ended September 30, 2014
(With Independent Auditor's Report Thereon)
Prepared By: FINANCE DEPARTMENT

City of Naples
Principal Officers September 30, 2014
Bottom row pictured left to right: City Clerk Pat Rambosk, Mayor John F. Sorey III,
Councilwoman Teresa Heitmann, Vice-Mayor Margaret "Dee" Sulick, and Councilman Sam J. Saad III.
Top row pictured left to right: City Attorney Robert Pritt, Councilman Doug Finlay,
Councilwoman Linda Penniman, City Manager A. William Moss, and Councilman Bill Barnett.
Department Directors Assistant City Manager Roger Reinke Building Director/Building Official Craig Mole’ Community Services Director David M. Lykins Finance Director Ann Marie S. Ricardi Fire Chief Stephen R. McInerny II Human Resources Director Denise K. Perez Planning Director Robin D. Singer Police Chief Thomas Weschler Streets and Stormwater Director Gregg Strakaluse Technology Services Director Selpan Inc./Mark Jackson

CITY OF NAPLES, FLORIDA
COMPREHENSIVE ANNUAL FINANCIAL REPORT FOR THE FISCAL YEAR ENDED SEPTEMBER 30, 2014
i
TABLE OF CONTENTS
Page
I. Introductory Section
Title Page List of Principal Officials Table of Contents i Letter of Transmittal v Certificate of Achievement for Excellence in Financial Reporting xiv City of Naples Organization Chart xv
II. Financial Section
Independent Auditors’ Report on the Financial Statements 1 Management’s Discussion and Analysis (Unaudited) 5
Basic Financial Statements:
Government-wide Financial Statements: Statement of Net Position 18 Statement of Activities 20 Fund Financial Statements: Balance Sheet–Governmental Funds 22 Reconciliation of the Balance Sheet–Governmental Funds to the Statement of Net Position 25 Statement of Revenues, Expenditures, and Changes in Fund Balances–Governmental Funds 26 Reconciliation of the Statement of Revenues, Expenditures and Changes in Fund Balances of Governmental Funds to the Statement of Activities 29 Statement of Net Position–Proprietary Funds 30 Statement of Revenues, Expenses, and Changes in Fund Net Position–Proprietary Funds 34 Statement of Cash Flows–Proprietary Funds 36 Statement of Fiduciary Net Position–Fiduciary Funds 38 Statement of Changes in Fiduciary Net Position–Fiduciary Funds 39 Notes to Financial Statements 41
Required Supplementary Information (Unaudited): Schedule of Revenues, Expenditures and Changes in Fund Balances–
Budget and Actual–General Fund 100 Budget and Actual–Community Redevelopment Fund 102 Budget and Actual–Streets and Traffic Fund 103 Notes to Required Supplementary Information 104

ii
TABLE OF CONTENTS
Page
Required Supplementary Information (Unaudited) (Continued): Schedule of Changes in Net Pension Liability and Related Ratios General Pension Plan 105 Schedule of Contributions - General Pension Plan 106 Schedules of Pension Investment Returns - General Pension Plan, Police and Fire 107 Schedule of Changes in Net Pension Liability and Related Ratios Police Officers’ Pension 108 Schedule of Contributions – Police Officers’ Pension 109 Schedule of Changes in Net Pension Liability and Related Ratios Fire Fighters’ Pension 110 Schedule of Contributions - Fire Fighters’ Pension 111 Schedule of Funding Progress and Contributions General Pension Plan 112 Police Officers’ Pension Plan 112 Fire Pension Plan 113 Other Post-Employment Benefits 113
Other Supplementary Information Combining and Individual Fund Financial Statements and Schedules:
Combining Balance Sheet–Nonmajor Governmental Funds 117 Combining Statement of Revenues, Expenditures and Changes in Fund Balances–
Nonmajor Governmental Funds 119 Combining Balance Sheet–Nonmajor Governmental Special Revenue Funds 120 Combining Statement of Revenues, Expenditures and Changes in Fund Balances– Nonmajor Governmental Special Revenue Funds 122 Combining Balance Sheet–Nonmajor Governmental Capital Projects Fund 124 Combining Statement of Revenues, Expenditures and Changes in Fund Balances– Nonmajor Governmental Capital Projects Funds 125 Schedules of Revenues, Expenditures and Changes in Fund Balances– Budget and Actual: Nonmajor Special Revenue Funds 126 Debt Service Fund 133 Major and Nonmajor Capital Projects Funds 134 Combining Statement of Net Position–Nonmajor Enterprise Funds 136 Combining Statement of Revenues, Expenses and Changes in Fund Net Position–
Nonmajor Enterprise Funds 138 Combining Statement of Cash Flows–Nonmajor Enterprise Funds 139 Combining Statement of Net Position–Internal Service Funds 142 Combining Statement of Revenues, Expenses, and Changes in Fund Net Position–
Internal Service Funds 143 Combining Statement of Cash Flows–Internal Service Funds 144 Combining Statement of Fiduciary Net Position–Fiduciary Funds 146 Combining Statement of Changes in Fiduciary Net Position–Fiduciary Funds 148 Statement of Changes in Assets and Liabilities–Agency Funds 150

iii
TABLE OF CONTENTS
Page
III.Statistical Section (Unaudited)
Schedule 1 Net Position by Component, Last Ten Fiscal Years 152 Schedule 2 Changes in Net Position, Last Ten Fiscal Years 154 Schedule 3 Fund Balances, Governmental Funds, Last Ten Fiscal Years 158 Schedule 4 Changes in Fund Balances, Governmental Funds, Last Ten Fiscal Years 160 Schedule 5 Tax Revenues by Source, Governmental Funds, Last Ten Fiscal Years 163 Schedule 6 Assessed Value and Estimated Actual Value of Taxable Property, Last Ten Fiscal Years 164 Schedule 7 Direct and Overlapping Property Tax Rates, Last Ten Fiscal Years 166 Schedule 8 Principal Property Tax Payers, Current Year and Nine Years Ago 168 Schedule 9 Property Tax Levies and Collections, Last Ten Fiscal Years 169 Schedule 10 Ratios of Outstanding Debt by Type, Last Ten Fiscal Years 170 Schedule 11 Ratios of General Bonded Debt Outstanding, Last Ten Fiscal Years 172 Schedule 12 Direct and Overlapping Governmental Activities Debt, As of September 30, 2013 173 Schedule 13 Pledged-Revenue Coverage, Last Ten Fiscal Years 174 Schedule 14 Demographic and Economic Statistics, Last Ten Calendar Years 176 Schedule 15 Principal Employers, Current Year and Nine Years Ago 177 Schedule 16 Full-time Equivalent City Government Employees by Function/Program, Last Ten Fiscal Years 178 Schedule 17 Operating Indicators by Function/Program, Last Ten Fiscal Years 180 Schedule 18 Capital Asset Statistics by Function/Program, Last Ten Fiscal Years 182
IV. Other Independent Auditor Reports and Schedules
Independent Auditors’ Report on Internal Control Over Financial Reporting and on Compliance and Other Matters Based on an Audit of Financial Statements Performed in Accordance With Government Auditing Standards 185
V. Management Letter
Independent Auditor’s Management Letter 187 Current Year Findings and Recommendations 189 Independent Auditor’s Report – Investment Funds 191

iv
This page intentionally left blank.

v
City of Naples
FINANCE DEPARTMENT TELEPHONE (239) 213-1820 ● FACSIMILE (239) 213-1805
735 EIGHTH STREET SOUTH ● NAPLES, FLORIDA 34102-6796 March 31, 2015 Honorable Mayor and Members of City Council City of Naples, Florida The Comprehensive Annual Financial Report (CAFR) of the City of Naples, Florida (the “City”), for the fiscal year ended September 30, 2014, is hereby submitted. This Annual Report was prepared by the Finance Department, and is in compliance with Florida Statutes Chapter 218.39, Chapter 10.550 of the Rules of the Auditor General of the State of Florida, and Section 2-601 of the City Code of Ordinances. Responsibility for both the accuracy of the presented data and the completeness and fairness of the presentation, including all disclosures, rests with the City Management. We believe the data, as presented, is accurate in all material aspects, that it is presented in a manner designed to fairly set forth the financial position and results of operations of the City as measured by the financial activity of its various funds, and that all disclosures necessary to enable the reader to gain the maximum understanding of the City’s financial activities have been included. The City’s basic financial statements have been audited by Maudlin & Jenkins, LLC, a firm of licensed certified public accountants. The goal of the independent audit was to provide reasonable assurance that the financial statements of the City for the fiscal year ended September 30, 2014, were free of material misstatement. The independent audit involved examining, on a test basis, evidence supporting the amounts and disclosures in the financial statements; assessing the accounting principles used and significant estimates made by management; and evaluating the overall financial statement presentation. The independent auditor concluded, based upon the audit, that there was reasonable basis for rendering an unqualified opinion that the City’s financial statements for the fiscal year ended September 30, 2014, are fairly presented in conformity with Generally Accepted Accounting Principles (GAAP). The independent auditor’s report is presented as the first component of the financial section of this report. The Governmental Accounting Standards Board (GASB) and GAAP require that management provide a narrative introduction, overview and analysis to accompany the financial statements in the form of “Management’s Discussion and Analysis” (MD&A). This letter of transmittal is designed to complement the MD&A and should be read in conjunction with it. The MD&A can be found just preceding the basic financial statements in the CAFR’s financial section.

vi
City Profile The City is considered by many to be the crown jewel of Southwest Florida. With its subtropical climate tempered by the soft breezes from the Gulf of Mexico, people are struck by its natural beach beauty, well designed streets and structures, and the flora and fauna that are unparalleled in any community. With a history dating back to the late 1800’s, Naples was incorporated on December 1, 1923. It is approximately 16 square miles in size and has 108 miles of streets. Originally developed as a winter retreat for people with permanent homes in the north, Naples grew from a small frontier-style fishing camp in the 1920s to its current status as a premier city. Naples continues to attract a retirement population that is among the most affluent and well educated in the State. The City is located on the Gulf of Mexico in Southwest Florida, and it is the cultural and activity center of Collier County. The City has a permanent population of approximately 19,500, increasing to 33,000 during the peak winter season. In addition to its natural features, the City is known for its world-class shopping and exceptional dining opportunities. Naples continues to enjoy the results of proper planning. Parks and open space are abundant and most roadway medians are wide and well landscaped. Naples is one of the few Florida communities that offer adequate public access to beaches. Beachfront property is almost exclusively residential zoning; commercial uses are focused along U.S. 41 and in a number of upscale shopping districts within the community. Still, the City is less than 20 miles away from the tropical wilderness of the Florida Everglades, with its alligators, natural orchids, Florida panther, wood storks, West Indian manatee, cypress forests and mangrove forests. Naples is managed under a Council-City Manager form of government. The legislative and governing body of the City consists of a Mayor and six Council Members. Each Council Member is elected to a four-year staggered term. There is a limit of two consecutive terms that any elected City official may serve. The Members of the City Council for the period represented by this report are as follows:
Member Term Ends John F. Sorey III, Mayor February 2016 Linda Penniman February 2018 Bill Barnett February 2016 Doug Finlay February 2018 Teresa Heitmann February 2016 Sam Saad III February 2018 Margaret “Dee” Sulick February 2016
The City Council appoints the City Manager, who is the chief administrative officer of the City. As Chief Executive Officer, the City Manager hires all other City employees, except the City Clerk and the Deputy City Clerk, who are appointed by the City Council. City Manager A. William Moss was selected by the City Council to be the City Manager as of January 1, 2008.
vii
The Reporting Entity and its Services
The City provides a full range of municipal services authorized by statute and local charter. These include police and fire services, streets, sidewalks and stormwater systems, parks and parkways, recreation, planning, water, sewer, solid waste, and general administrative services. Schools are provided by Collier County School District, while ambulance, jail, animal control, judicial, library, and human services are provided by Collier County government. Moorings Bay Special Taxing District, East Naples Bay Special Taxing District and the Community Redevelopment Agency are blended component units of this reporting entity, because these Districts are governed by Naples City Council. The two Special Taxing Districts were created and established by Ordinances #87-5328 and #87-5330, respectively, for providing maintenance dredging in the channels and waterways within the area or boundary of the respective District, and to maintain necessary aids to navigation. Funds for the taxing districts are provided through an ad valorem tax that is levied only within these specified districts. Ordinance #94-7099 created the Community Redevelopment Agency for the rehabilitation, conservation or redevelopment of the designated district. The tax increment from Collier County and the City provides the source of revenue for the Community Redevelopment Agency. The Naples Airport Authority, although governed by board members who are directly appointed by the City Council, is not a part of this report, as it does not meet the criteria of Statement Number 14 of the Governmental Accounting Standards Board. The Collier County school system is an independent special district and not part of the City. Its financial data is not included in the financial statements in this report. Naples Community Hospital is a private nonprofit corporation providing quality medical care to the community. It is not part of the City’s municipal government and its financial data is not included in the financial statements in this report. Accounting System and Budgetary Control
In developing and evaluating the City’s accounting system, consideration is given to the adequacy of internal accounting controls. Internal accounting controls are designed to provide reasonable, but not absolute assurance regarding: (1) the safeguarding of assets against loss from unauthorized use or disposition; and (2) the reliability of financial records for preparing financial statements and maintaining accountability for assets. The concept of reasonable assurance recognizes that: a) the cost of a control should not exceed the benefits likely to be derived therefrom; and b) the evaluation of costs and benefits requires estimates and judgments by management. We believe all internal control evaluations occur within the above framework and that the City’s internal accounting controls adequately safeguard assets and provide reasonable assurance of proper recording of financial transactions. As a recipient of Federal, State and County financial assistance, the government is responsible for ensuring that an adequate internal control structure is in place to ensure compliance with applicable laws and regulations related to those programs. This internal control structure is subject to periodic evaluation by management.

viii
The City’s fiscal year begins October 1. In February, staff develops preliminary future revenue and expenditure estimates and identifies areas of need and concern. During February, the Five Year General Fund Sustainability Report is developed for a March presentation. Concurrently, staff begins working with boards, committees, and the City Council to gather goals for the upcoming fiscal year. In March, Departments start preparing their Five-Year Capital Improvement Program requests. During April, departments will begin preparing their budget requests using line-item budget formats. At the same time, Finance will begin assessing available and potential revenue sources. The Five-Year Capital Improvement Program is presented to City Council by June 1, in accordance with the City Code of Ordinances. The proposed budget is presented to Council in July then discussed during August and September, and the budget is adopted in September. The adopted budget may be amended in two ways. 1. The budget ordinance authorizes the City Manager to transfer money within a fund, except that he cannot
increase regular staffing levels or modify the intent of the Capital Improvement Budget. 2. Changes that would increase the total budget of a fund, increase staffing levels, or modify the intent of the
Capital Improvement Budget must have City Council approval by ordinance for Fiscal Year 2013-14. The City has established standard procedures for budget amendments to control the integrity of the budget system. Budget amendments are prepared and entered at the department level, approved by the Department head, identifying both the object of expenditure requiring the budget amendment and source of funds for the amendment. Budget amendments are reviewed by the Director of Finance and may be forwarded to the City Manager for approval. If needed, an ordinance is prepared for City Council approval as well. The City utilizes the State of Florida’s uniform chart of accounts for account names, numbers, and reporting purposes. During the course of the year, budgetary control was maintained over appropriations by use of on demand and quarterly revenue and expenditure reports that compare budgeted appropriations with actual expenditures and encumbrances and estimated revenues with actual revenues. In the integrated automated financial system, a purchase order is required prior to committing funds, although minor purchases may be made with a purchasing card. Purchasing cards have individually set limits, typically between $1,000 and $5,000. The City’s automated enterprise software system verifies the availability of funds prior to issuance of a purchase order. Although the budget is adopted by Fund, practical budget control is maintained at the department level in the General Fund and the fund level in all other funds. Factors Affecting Financial Condition Local Economy For many years, the City enjoyed a stable, sometimes booming, economic environment. The economic challenges that began to affect the nation in 2007-2008 also presented economic challenges to the City, as income and property values declined, while unemployment rates rose. Naples has a relatively undiversified trade and industry base that depends on tourism as well as retail, construction and health care. Despite the economic slide, the charm that brought people to the City during the good times kept many coming back in the economic downturn. The City felt the financial pinches of the economic downturn, including declining property values, but still needed to provide the levels of service to residents and visitors. The city was resilient in the face of the downward trends and is showing signs of recovery.

ix
With the City near build-out, the major challenge is to preserve and maintain the City’s infrastructure and services in the manner in which the citizens and guests have become accustomed. This quality of life attracted considerable growth to our community in years past, and has become the definition of the City. High quality support systems such as transportation, stormwater management, potable (drinking) water, wastewater treatment, and solid waste collection must be balanced carefully with the quality of life amenities, such as parks, recreation, entertainment, and cultural opportunities. Naples, between the dramatic Everglades to the east and the grandeur of the Gulf of Mexico to the west, provides an atmosphere of resort living in the middle of nature. Fiscal year 2013-14 represented continued growth in the overall economy, as the property values ticked upwards, again. The September 2013 modest increase of 5.6% in taxable value on the wake of the prior year’s 2.9% growth showed the resilience of Naples’ property. The subsequent growth for FY 14-15 (September 2014) of 6.9% confirmed the return of some stability. The City is limited by the Constitution of the State of Florida to an ad valorem tax levy of ten mills on each dollar of assessed valuation for operating expenditures. At 1.1800 mills, Naples’ ad valorem tax remains significantly below the maximum allowed and has been steady for several years. The City continues to be a destination point for Collier County residents and visitors, in part due to its 40 public beach access points, attractive active and passive parks, the Naples Pier, and the multitude of vibrant mixed-use retail/dining areas. During Fiscal Year 2013-14, the City continued its journey to enhance the quality of life for its residents. Some of the events include:
Baker Park Development – after last year’s purchase of 6.7 acres of land adjacent to 8 acres of city property, the design of Baker Park began, with the conceptual master plan approved on March 5, 2014.
Artificial Reef creation- The City collaborated with Collier County and the City of Marco Island, using a BP Grant and other donations to create multiple reefs offshore to establish marine life habitat.
Cambier Park playground received a much needed facelift, updating the original pirate and ocean them with new equipment and planks, a pyramid rope climber and a new spray feature on the pirate ship.
A pilot decorative stop sign replacement program was initiated, with 70 signs installed at high traffic intersections.
In February, 2014, construction began on the $1.3 million Port Royal Dredge project, which will enhance the water transportation for the affected neighborhood
The trends in the Southwest Florida economy continue to experience a moderate recovery. According to a report by the Florida Gulf Coast University, taxable sales for the region were up 10% in August 2014 over August 2013. Tourist tax revenues in Collier County increased by 19% from September 2013 to September 2014. Activity for the three Southwest Florida airports grew 11% over September 2013. Collier County issued 202 single family building permits in October 2014, an increase of 52 percent over October 2013.

x
Long-term Financial Planning
The City has several long-term financial and operating planning processes in place, all of which eventually integrate into the budget. In June 2007, the City established a Ten-Year Vision Plan, which was created by the citizens and adopted by the City Council. This vision has been incorporated into each subsequent budget with goals and objectives to achieve the vision. The City’s Five-Year Capital Improvement Program (CIP) is used to plan for current and future financial needs. Developed during the spring and presented to City Council in June, fundable projects from this document are incorporated into the adopted budget while establishing a needs assessment for future years. Annually, shortly after each fiscal year end, the Finance Department prepares a General Fund Five-Year Sustainability Report. This report, which combines fact with projections, identifies the potential fiscal shortfalls in the next five years. This report helps guide City policy relating to tax rates and budgets and aid the City in sound long-term planning. Relevant Financial Policies In September 2009, the City Council passed Resolution #09-12512, which amended and updated the City’s financial policies. These policies covered five major areas: Budgetary and Financial Planning; Financial Reporting; Capital Improvement; Debt Management; Investments and Fund Balance. These were subsequently amended in 2012, retroactively to September 30, 2011, to have the Fund Balance Policy reflect the requirements of GASB 54. The financial policies exist to demonstrate that the City is committed to strong financial operations and to provide a strong precedent for future policy makers and financial managers regarding the City’s financial goals. Major Initiatives The Ten-Year Vision Plan adopted in 2007 provided a framework for many of the City’s programs and projects. Major initiatives of the City typically are aimed at achieving the major goals of the vision plan. Listed below are a few of the initiatives taken to address some of the visions: Vision Goal: Preserve the City’s Distinctive Character and Culture Residents and visitors alike recognize the ambiance created by the tree-lined streets of Naples. For the seventeenth consecutive year, the City of Naples received the Tree City U.S.A. designation and, for the seventh consecutive year, the City received a Tree City U.S.A. Growth Award. The City of Naples urban forest consists of 20,336 managed hardwood trees and palms on streets, rights-of-way, parks and other public property within the City. Staff planted 233 palms along Gulf Shore Blvd. North as part of the annual Tree Fill-in Program, continuing to 1) Protect and enrich the environment; 2) Maintain and improve neighborhood character; 3) Enhance the appearance of streets within the City; 4) Improve the appearance and urban design of commercial corridors while protecting the residential character and charm of the City.

xi
Vision Goal: Make Naples the green jewel of Southwest Florida In a community visioning process, the goal of making Naples the green jewel of Southwest Florida was a critical element determined by the community and adopted by City Council. This goal included three objectives: restore Naples Bay, promote sustainability, and establish more green space. Throughout the year, staff made over 20 presentations to service organizations, homeowner associations, and other groups regarding the environment. Staff provided information in the form of brochures to the public on subjects that include wetlands, sea turtles, mangroves, and rain gardens. The City collaborated with Collier County and the City of Marco Island in an effort to create artificial reefs in the Gulf of Mexico. The reefs will improve the environment by establishing habitat for marine life, and provide a positive economic impact on the local economy. Funding for the project was obtained from BP grants totaling $1.3 million. In 2014, Aquifer Storage and Recovery (ASR) Well 3 was completed. The ASR system at the Wastewater Treatment Plant provides underground storage for excess effluent water from the treatment plant and surface water from the Golden Gate Canal. The use of the Golden Gate Canal surface water reduces the amount of pollutant laden stormwater runoff discharging into the Gordon River by sending it to ASR system for future treatment and re-use for irrigation. Water stored in the ASR wells is recovered to supplement the reclaimed water irrigation system during the dry season. Vision Goal: Maintain an extraordinary quality of life for residents The Community Services Department - Recreation Division provides a wide variety of recreational opportunities for residents of all ages, integrating social and cultural pursuits. The Norris Center at Cambier Park remains known for the variety of cultural programs that are offered such as the Bluewater Bluegrass & Acoustic Series, Paradise Coastmen Barbershop Chorus, Tribute to Patsy Cline, and nationally known comedians, all performing on stage during the winter season. The Norris Center offers a mix of programs for adults and children throughout the year. For adults, programs such as art, foreign language, computer skills, and a sit and stretch program are offered. In the summer months, the building is full of children’s specialty camps that focus on cultural arts and science. The Center continued a partnership with the United Arts Council to use the Art Gallery for monthly art exhibits during season. During off-season, the gallery is reserved by other local artists. The Norris Center is also the home of Gulfshore Playhouse. This past season, Gulfshore Playhouse welcomed 19,032 patrons, an increase of 29.7% over the previous year. The 2013-14 season was Gulfshore Playhouse’s highest-grossing ticket year, breaking all previous box office records. Fleischmann Park was the headquarters for over 150 summer specialty camps (adding a dozen new ones from last year) with over 1,000 registered campers. River Park Aquatic Center offered 81 programs, 7 camps, and held 37 rentals. Included were lifeguard training, lifeguard and water safety instructor training, learn to swim classes, swim central classes, swim & snorkel camps, recreational swim team programs, Arthritis Foundation classes, and other water exercise classes. The River Park Aquatic Center was the home pool for Naples High School for the third consecutive season, with two meets hosted. Seacrest Country Day School and The Village School had ongoing rentals, with swim practices for their own swim teams throughout the 2013-14 season.

xii
Independent Audit The City Charter requires an annual audit of the books of accounts, financial records and transactions of all administrative departments of the City by an independent certified public accountant selected by the City Council. The City staff has complied with this requirement, and the independent auditors’ report has been included in this report. Distinguished Budget The City’s budget for 2013-14 received the GFOA’s Distinguished Budget Presentation Award for the ninth time. In order to qualify for the Distinguished Budget Presentation Award, the budget had to be judged proficient as a policy document, a financial plan, an operations guide and a communications device. Certificate of Achievement The Government Finance Officers’ Association of the United States and Canada (GFOA) awarded a Certificate of Achievement for Excellence in Financial Reporting to Naples, Florida, for the Annual Financial Report for the fiscal year ended September 30, 2013. In order to be awarded a Certificate of Achievement, a governmental unit must publish an easily readable and efficiently organized Comprehensive Annual Financial Report, whose contents conform to industry standards. Such reports must satisfy both generally accepted accounting principles and applicable legal requirements. A Certificate of Achievement is valid for a period of one year only. We believe our current report continues to conform to the Certificate of Achievement program requirements, and we will submit it to the GFOA to determine its eligibility for another certificate. Acknowledgements The timely preparation of the Comprehensive Annual Financial Report was made possible by the efficient and dedicated service and teamwork of the Accounting Division of the Finance Department and we express our appreciation to them. We also thank the Mayor and City Council for their interest and support in planning and conducting the financial operations of the City in a responsible and progressive manner. In addition, we wish to express our appreciation to our audit firm, Maudlin & Jenkins, LLC for their examination of our accounts. Respectfully submitted,
A. William Moss Ann Marie S. Ricardi City Manager Finance Director

Certificate of
Presented to
City of Naples
For its Comprehensive Annual
September 30, 2013
Executive Director/CEO
Financial Reportfor the Fiscal Year Ended
Reportingin Financial
for ExcellenceAchievement
Text38: Florida
Government Finance Officers Association

Utilities
Water and Sew-er Utility
City of Naples
Organizational Chart
Citizens of the City of Naples
Streets and Stormwater
Stormwater Management
Traffic and Lighting
Street Maintenance
Technology Services
Network and Application Services
Television Production
Solid Waste
Equipment Services
Police
Geographical Information Services (GIS)
Planning
Comprehensive Planning
Land Development Regulations
Design Review
Human Resources
Risk Management
Recruitment, Retention and Policies
Finance
Budget,Debt and Investments
Customer Service / Billings
Accounting
Community Services
Recreation
Purchasing
Facilities Maintenance
Parks and Parkways
City Clerk City Manager City Attorney
Community Redevelopment Agency (CRA)
Building
Building Permits
Construction Inspections
Construction Site Compliance
Patrol
Investigations
Support Services
Employee Benefits
Assistant City Manager
Dock/Code Enforcement
City Council Appointed Boards and Committees
Records Mgt. Center
Fire - Rescue
Operations
Prevention
Training
CRA Administration
Public Art Flood Plain Management
Natural Resources
Labor Relations
xi

1301 SIXTH AVENUE WEST, SUITE 600 • NAPLES, FLORIDA 34205-7440 • 941-747-4483 • 855-891-0070 • FAX 941-747-6035 1900 MAIN STREET, SUITE 750 • SARASOTA, FLORIDA 34236 • 941-955-1095 • FAX 941-747-6035
MEMBERS OF THE AMERICAN INSTITUTE OF CERTIFIED PUBLIC ACCOUNTANTS • WWW.MJCPA.COM
INDEPENDENT AUDITOR’S REPORT
To the Honorable Mayor, City Council and City Manager City of Naples, Florida Report on the Financial Statements We have audited the accompanying financial statements of the governmental activities, the business-type activities, each major fund, and the aggregate remaining fund information of the City of Naples, Florida (the “City”), as of and for the year ended September 30, 2014, and the related notes to the financial statements, which collectively comprise the City's basic financial statements as listed in the table of contents. Management’s Responsibility for the Financial Statements Management is responsible for the preparation and fair presentation of these financial statements in accordance with accounting principles generally accepted in the United States of America; this includes the design, implementation and maintenance of internal control relevant to the preparation and fair presentation of financial statements that are free from material misstatement, whether due to fraud or error. Auditor’s Responsibility Our responsibility is to express opinions on these financial statements based on our audit. We conducted our audit in accordance with auditing standards generally accepted in the United States of America and the standards applicable to financial audits contained in Government Auditing Standards, issued by the Comptroller General of the United States. Those standards require that we plan and perform the audit to obtain reasonable assurance about whether the financial statements are free from material misstatement. An audit involves performing procedures to obtain audit evidence about the amounts and disclosures in the financial statements. The procedures selected depend on the auditor’s judgment, including the assessment of the risks of material misstatement of the financial statements, whether due to fraud or error. In making those risk assessments, the auditor considers internal control relevant to the entity’s preparation and fair presentation of the financial statements in order to design audit procedures that are appropriate in the circumstances, but not for the purpose of expressing an opinion on the effectiveness of the entity’s internal control. Accordingly, we express no such opinion. An audit also includes evaluating the appropriateness of accounting policies used and the reasonableness of significant accounting estimates made by management, as well as evaluating the overall presentation of the financial statements. We believe that the audit evidence we have obtained is sufficient and appropriate to provide a basis for our audit opinions.

2
Opinions In our opinion, the financial statements referred to above present fairly, in all material respects, the respective financial position of the governmental activities, the business-type activities, each major fund, and the aggregate remaining fund information of the City as of September 30, 2014, and the respective changes in financial position and, where applicable, cash flows thereof, for the year then ended in accordance with accounting principles generally accepted in the United States of America. Emphasis of Matter As discussed in Note 1, the City’s pension trust funds implemented Governmental Accounting Standards Board (GASB) Statement No. 67, Financial Reporting for Pension Plans – an amendment of GASB Statement No. 25 as of October 1, 2013. This standard modified the reporting requirements for financial statements of defined benefit pension plans. Our opinion is not modified with respect to this matter. Other Matters Required Supplementary Information Accounting principles generally accepted in the United States of America require that the management’s discussion and analysis, budgetary comparison information and pension and other post-employment benefit schedules on pages 5-15 and 110-113, respectively, be presented to supplement the basic financial statements. Such information, although not a part of the basic financial statements, is required by the Governmental Accounting Standards Board, who considers it to be an essential part of financial reporting for placing the basic financial statements in an appropriate operational, economic or historical context. We have applied certain limited procedures to the required supplementary information in accordance with auditing standards generally accepted in the United States of America, which consisted of inquiries of management about the methods of preparing the information and comparing the information for consistency with management’s responses to our inquiries, the basic financial statements and other knowledge we obtained during our audit of the basic financial statements. We do not express an opinion or provide any assurance on the information because the limited procedures do not provide us with sufficient evidence to express an opinion or provide any assurance. Other Information Our audit was conducted for the purpose of forming opinions on the financial statements that collectively comprise the City's basic financial statements. The introductory section, other supplementary information and statistical section are presented for purposes of additional analysis and are not a required part of the financial statements. The other supplementary information is the responsibility of management and was derived from and relates directly to the underlying accounting and other records used to prepare the basic financial statements. Such information has been subjected to the auditing procedures applied in the audit of the basic financial statements and certain additional procedures, including comparing and reconciling such information directly to the underlying accounting and other records used to prepare the basic financial statements or to the basic financial statements themselves, and other additional procedures in accordance with auditing standards generally accepted in the United States of America. In our opinion, the other supplementary information is fairly stated, in all material respects, in relation to the basic financial statements as a whole.

3
The introductory section and statistical section have not been subjected to the auditing procedures applied in the audit of the basic financial statements and, accordingly, we do not express an opinion or provide any assurance on them. Other Reporting Required by Government Auditing Standards In accordance with Government Auditing Standards, we have also issued our report dated March 31, 2015, on our consideration of the City’s internal control over financial reporting and on our tests of its compliance with certain provisions of laws, regulations, contracts and grant agreements, and other matters. The purpose of that report is to describe the scope of our testing of internal control over financial reporting and compliance and the results of that testing, and not to provide an opinion on internal control over financial reporting or on compliance. That report is an integral part of an audit performed in accordance with Government Auditing Standards in considering the City’s internal control over financial reporting and compliance. Bradenton, Florida March 31, 2015

This page intentionally left blank
4
5
The City of Naples, Florida Management’s Discussion and Analysis
September 30, 2014 (Unaudited)
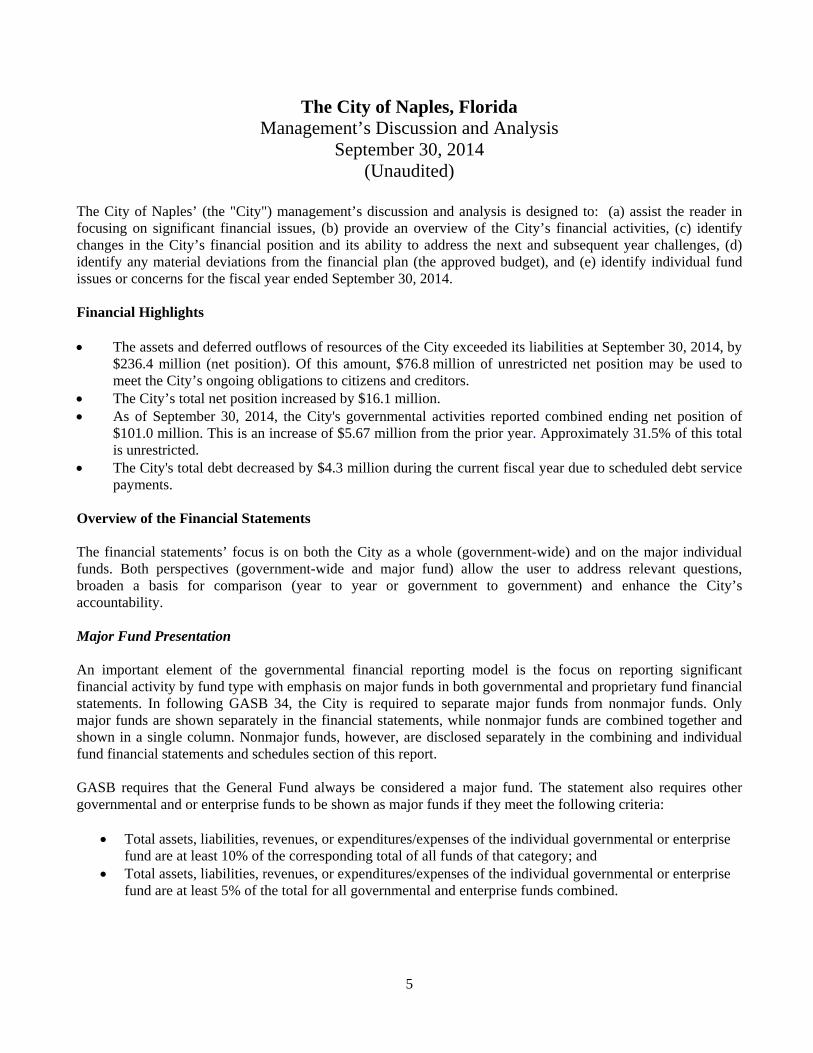
The City of Naples’ (the "City") management’s discussion and analysis is designed to: (a) assist the reader in focusing on significant financial issues, (b) provide an overview of the City’s financial activities, (c) identify changes in the City’s financial position and its ability to address the next and subsequent year challenges, (d) identify any material deviations from the financial plan (the approved budget), and (e) identify individual fund issues or concerns for the fiscal year ended September 30, 2014. Financial Highlights The assets and deferred outflows of resources of the City exceeded its liabilities at September 30, 2014, by
$236.4 million (net position). Of this amount, $76.8 million of unrestricted net position may be used to meet the City’s ongoing obligations to citizens and creditors.
The City’s total net position increased by $16.1 million. As of September 30, 2014, the City's governmental activities reported combined ending net position of
$101.0 million. This is an increase of $5.67 million from the prior year. Approximately 31.5% of this total is unrestricted.
The City's total debt decreased by $4.3 million during the current fiscal year due to scheduled debt service payments.
Overview of the Financial Statements The financial statements’ focus is on both the City as a whole (government-wide) and on the major individual funds. Both perspectives (government-wide and major fund) allow the user to address relevant questions, broaden a basis for comparison (year to year or government to government) and enhance the City’s accountability. Major Fund Presentation
An important element of the governmental financial reporting model is the focus on reporting significant financial activity by fund type with emphasis on major funds in both governmental and proprietary fund financial statements. In following GASB 34, the City is required to separate major funds from nonmajor funds. Only major funds are shown separately in the financial statements, while nonmajor funds are combined together and shown in a single column. Nonmajor funds, however, are disclosed separately in the combining and individual fund financial statements and schedules section of this report. GASB requires that the General Fund always be considered a major fund. The statement also requires other governmental and or enterprise funds to be shown as major funds if they meet the following criteria:
Total assets, liabilities, revenues, or expenditures/expenses of the individual governmental or enterprise fund are at least 10% of the corresponding total of all funds of that category; and
Total assets, liabilities, revenues, or expenditures/expenses of the individual governmental or enterprise fund are at least 5% of the total for all governmental and enterprise funds combined.

6
The statement also allows management the flexibility to report funds that do not meet the above criteria but believe the funds have a significant impact on the City. Management determined that three additional funds, the Capital Projects Fund, Community Redevelopment Fund, and Streets and Traffic Fund, were to be included as major funds even though they did not meet the above criteria. The Government-wide Financial Statements
Government-wide financial statements are designed to be corporate-like in structure, showing and combining governmental and business-type activities. They are intended to allow the reader to assess the government’s operational accountability. Operational accountability is defined as the extent to which the government has met its operating objectives efficiently and effectively, using all resources available for that purpose, and whether it can continue to meet its objectives for the foreseeable future. For the purpose of these statements, both governmental and business-type activities are measured and reported using the economic resources measurement focus and the full accrual basis of accounting. The Statement of Net Position (page 18) presents information on all the City’s assets and liabilities, with the difference being reported as net position. Over time, increases or decreases in net position may serve as a useful indicator of whether the financial position of the City is improving or not. The Statement of Activities (page 20) is focused on the gross and net cost of various functions supported by the City’s taxes and other revenues and shows how the City’s net position changed during the fiscal year. This statement is intended to summarize and simplify the costs of various governmental services. Changes in net position are reported as soon as the underlying event giving rise to the change occurs, regardless of the timing of the related cash flow. Therefore, some revenues and expenditures, such as uncollected taxes and earned but unused vacation leave, may be reported but will result in cash flows in future fiscal periods. Both of these financial statements distinguish the primary types of functions of the City as defined below: Governmental Activities–Most of the City’s basic services are reported here, including police, fire, street
maintenance, planning, parks and recreation, building and code enforcement, and general administration. Major revenues supporting these activities are ad valorem taxes, sales and gas taxes, franchise fees, utility and communications service taxes, as well as revenues from building permits, fees, grants and investments.
Business-type Activities–The City’s utilities (Water and Sewer, Solid Waste, Stormwater) and “Other Nonmajor” proprietary fund types such as Naples Beach, City Dock and Tennis are reported here. These services are supported primarily from user fees. Financing of major capital is sometimes necessary. Both user fees and impact fees support debt service.
Fund Financial Statements
The Fund Financial Statements, which report by individual fund, begin on page 22. A fund is a grouping of related accounts that is used to maintain financial control over resources that have been segregated for specific activities or objectives. The City, like other state and local governments, uses fund accounting to ensure and demonstrate compliance with finance-related legal requirements. In a highly regulatory environment, fund accounting serves a very important purpose, in that funds received for specific purposes are identified as such. All of the funds of the City can be divided into three categories: Governmental Funds–account for the City’s tax-supported activities and those supported by other special
revenues. These governmental funds include the General Fund, the Debt Service Fund, the Capital Projects Fund, the Community Redevelopment Fund, the Streets and Traffic Fund and other Nonmajor Funds consisting of the Building and Zoning Fund, the Community Development Block Grant Fund, the Improvement Fund, the Public Arts Fund, the Grants Fund, the Confiscated Properties Fund, the Business

7
Improvement District, the 41-10 Public Open Space Fund, the Parking Trust Fund, the Impact Fee Fund, the Land Contribution Fund, and the Maintenance Dredging Funds for the East Naples Bay District, Port Royal and Moorings Bay District. The accounting method used is called modified accrual basis of accounting, which measures cash and all other financial assets that can readily be converted to cash (usually 60 day focus). The two criteria used are that the revenue is measurable and available. Examples of the difference between this and the economic resources measurement focus are that debt financing is considered current revenue, and purchases of capital assets are considered expenditures whereas depreciation is not since there is no outlay of cash.
Proprietary Funds–are used to account for the business-type activities of the City. There are two types: Enterprise Funds and Internal Service Funds. The City’s Major Enterprise Funds are the Water and Sewer Fund, the Solid Waste Fund, the Stormwater Fund, and Nonmajor Enterprise Funds consist of the Naples Beach Fund, the City Dock Fund and the Tennis Fund. The Internal Service Funds include the Equipment Services Fund, Risk Management Fund, Health Benefits Fund, and the Technology Services Fund. All Proprietary Funds use the full accrual basis of accounting and the economic resources measurement focus. Fees or charges for services are the primary revenue sources for Proprietary Funds.
Fiduciary Funds–are used to account for resources held for the benefit of parties outside the government. Fiduciary Funds are not reflected in the government-wide financial statements because the resources of those funds are not available to support the City’s own programs. The accounting method used for Fiduciary Funds is similar to proprietary funds.
The fund financial statements present information in more detail than the government-wide financial statements. Major funds are reflected separately and nonmajor funds are combined into “other funds” and are reflected in detail in the combining and individual fund financial statements and schedules section of this report. Governmental Accounting Standards Board (GASB) Statement No. 34 provides the authoritative guidance on the governmental financial reporting model. The governmental funds measure and report activities using the current financial resources measurement focus and the modified accrual basis of accounting. The reconciliations on page 25 and 29 convert this data to an economic resources measurement focus and the accrual basis of accounting for use in the government-wide financial statements. The total column on the Proprietary Fund financial statements is reconciled to the business-type activities column in the government-wide statements on pages 30–37. Notes to the Financial Statements
The notes provide additional information that is essential to a full understanding of the data provided in the government-wide and fund financial statements. The notes can be found beginning on page 41. Required Supplementary Information
Generally accepted accounting principles (GAAP) call for certain unaudited information to accompany the audited basic financial statements and accompanying footnotes. This information is called required supplementary information (RSI) and includes this analysis (the MD&A), the budgetary comparison schedules for the General Fund, Community Redevelopment Fund, and Streets and Traffic Fund, and trend data on pension funding and other post-employment benefits.

8
Government-wide Financial Analysis The City’s combined net position as of September 30, 2014, was $236.4 million. Table 1 reflects the summary Statement of Net Position (in thousands) for the current and prior year.
Table 1Statement of Net Position
(In Thousands)
2014 2013 2014 2013 2014 2013Current and other Assets 57,855 50,518 53,018 48,897 110,873 99,415 Capital Assets 66,417 66,983 111,095 104,684 177,512 171,667
Total Assets 124,272 117,501 164,113 153,581 288,385 271,082 Total deferred outflow of resources 365 415 100 108 465 523 Longterm Liabilities outstanding 19,125 20,024 22,269 24,682 41,394 44,706 Other Liabilites 4,507 2,563 6,527 3,999 11,034 6,562
Total Liabilities 23,632 22,587 28,796 28,681 52,428 51,268 Net Position - -
Net investment in Capital Assets 55,246 54,373 90,440 81,292 145,686 135,665 Restricted 13,909 13,908 - - 13,909 13,908 Unrestricted 31,850 27,048 44,977 43,716 76,827 70,764
Total Net Position 101,005 95,329 135,417 125,008 236,422 220,337
Governmental Activities Business Type ActivitiesTotal Primary Government
The largest portion of the City’s net position (62%) reflects its investment in capital assets (land, buildings, plants, and equipment) less outstanding debt used to acquire those assets. The City uses these assets to provide services to citizens; consequently, these assets are not available for future spending. It is also important to recognize that other resources will be required to repay the outstanding debt on capital assets. Restricted net position (representing 6% of the total net position) is subject to external restrictions on how it may be used. The remaining 32% of unrestricted net position, $76.8 million, may be used to meet the City’s ongoing obligations to the citizens and creditors. The City’s combined revenues, including contributions, grants, charges for services and taxes were $100.2 million. Total expenses, City-wide were $84.1 million. For the total primary government, including both governmental and business-type activities, net position increased $16.1 million. Net position for Governmental activities increased by $5.7 million. Net position for Business-type activities increased by $10.4 million.

9
Table 2 reflects the summary Statement of Activities (in thousands) for the current year compared with the prior year.
Table 2Changes in Net Position
(In thousands)
2014 2013 2014 2013 2014 2013Revenues
Program revenuesCharges for services 11,973 6,230 46,787 42,486 58,760 48,716 Operating grants and contributions 4,140 2,803 784 557 4,924 3,360 Capital grants and contributions 779 353 1,836 1,388 2,615 1,741
General revenuesProperty taxes 18,540 17,331 - - 18,540 17,331 Other taxes 8,114 8,925 - - 8,114 8,925 Franchise fees 3,580 3,300 - - 3,580 3,300 Intergovernmental revenues 3,158 2,953 - - 3,158 2,953 Unrestricted investment earnings 233 175 201 90 434 265 Other 77 50 - - 77 50
Total revenues 50,594 42,120 49,608 44,521 100,202 86,641
ExpensesGeneral government 7,715 5,301 - - 7,715 5,301 Public safety 25,970 24,885 - - 25,970 24,885 Physical and economic environment 2,701 2,793 - - 2,701 2,793 Transportation 3,089 3,450 - - 3,089 3,450 Cultural and recreation 7,094 6,942 - - 7,094 6,942 Interest and fiscal charges 228 397 - - 228 397 Water and sewer - - 24,397 23,833 24,397 23,833 Solid waste - - 6,012 5,489 6,012 5,489 Stormwater - - 3,088 3,064 3,088 3,064 Other - - 3,823 3,474 3,823 3,474
Total expenses 46,797 43,768 37,320 35,860 84,117 79,628
Increase (decrease) in net positionbefore transfers 3,797 (1,648) 12,288 8,661 16,085 7,013 Transfers 1,879 2,054 (1,879) (2,054) - -
Change in net position 5,676 406 10,409 6,607 16,085 7,013 Net position, beginning 95,329 94,923 125,008 118,401 220,337 213,324 Net position, ending 101,005 95,329 135,417 125,008 236,422 220,337
Governmental Activities Business Type ActivitiesTotal Primary Government
The total primary government revenues reported a $13.5 million or 15% increase over last year’s total revenues. The total business-type activities’ revenue increased $5 million. Revenue from governmental activities show a $8.4 million increase. The primary reasons for the increase in governmental activity revenue are as follows:
An increase in charges for services of $5.7 million is related to increased permit fees and impact fees ($1 million) and Special Assessment payments (Port Royal of $1.5 million).
An increase in grants and donations of $1.3 million (Baker Park donations were $2.2 million). Property taxes increased $1.2 million due to taxable value growth.

10
Business-type activities showed an increase in revenues in the amount of $5.1 million or 11% over the revenues of 2013. Charges for services provided the most significant part of that increase. Revenue in the three non major enterprise funds (which are recreational based funds), increased $.3 million due to the improved economy. The balance of the increases can be attributed to the three utilities, Water/Sewer, Solid Waste and Stormwater. The total primary government’s expenses increased $4.5 million or 6%. Governmental activities reported a 7% increase in expenses, with business-type activities reporting a 4% increase. Governmental Activities
Table 3 presents the cost of each of the City’s four largest programs as well as each program’s net cost (total cost less revenues, excluding taxes, generated by the activities). The net cost represents the portion of each program that is supported by various taxes. The cost of all governmental activities this year was $46.8 million. As shown in the Statement of Activities on page 20, the net cost that was ultimately paid through taxes was $29.9 million. The $16.9 million of costs for governmental activities not covered by general revenues was provided by: $11.97 million in charges for services, made of $3.2 million in building/permit fees, $.88 million in police
and fire services, $.76 million for recreation fees, and the balance from various fees related to transportation, economic environment and general government services.
$4.14 million in operating grants and contributions, including $1.4 million from Collier County’s share of the Community Redevelopment tax increment financing, 2.2 million in Baker Park donations, and the remaining from other grants.
$0.78 million in capital grants and contributions, which includes $.44 million from impact fees, and the balance from other grants.
The total cost of all governmental activities this year increased 7%, due primarily to public safety cost increases and general government (all other) increases.
Table 3Governmental Activities
(In Thousands)
Total Cost of Service Net Cost of Service2014 2013 2014 2013
Public safety 25,970 24,885 20,700 20,305 Physical and economic environment 2,701 2,793 (1,368) 170 Transportation 3,089 3,450 2,492 3,087 Cultural and recreation 7,094 6,942 3,863 6,047 All others 7,943 5,698 4,218 4,773
46,797 43,768 29,905 34,382
Business-type Activities
Revenues of the City’s business-type activities (see Table 2) totaled $49.6 million. The Water and Sewer Fund represents 65% of the business-type activities’ expenses. Total water and sewer operating revenues were $3.3 million higher than last year, while operating expenses were up $.6 million over last year.

11
City Code allows for Water Sewer Fees and Stormwater Fees to be adjusted automatically, based on the Public Services Commission Deflator Index and the Consumers Price Index, respectively. These scheduled annual increases (which were 1.63% and 1.06%, respectively for fiscal year 2013-2014) help prevent any major rate jumps in any single year. There were no increases in Solid Waste Fees. Financial Analysis of the City’s Funds The City uses fund accounting to ensure and demonstrate compliance with finance-related legal requirements. Governmental Funds The fund financial statements for the governmental funds start on page 22. The focus of the City’s governmental funds is to provide information on near-term inflows, outflows and balances of spendable resources. Such information is useful in assessing the City's financing requirements. In particular, unassigned fund balance may serve as a useful measurement of a government’s net resources for spending at the end of the fiscal year. As of September 30, 2014, the City’s governmental funds reported combined ending fund balances of $41.678 million, an increase of $4.23 million in comparison with the prior year. Approximately 28% of this total (or $11.7 million) constitutes unassigned fund balance, which is available for spending at the City’s discretion. The remainder of fund balance is restricted, committed or assigned to indicate that it is not available for new spending. Major restrictions, commitments or assignments include funds: (1) restricted for capital projects ($5.5 million); (2) restricted for building and zoning ($6.0 million); (3) restricted for transportation ($3.4 million); (4) restricted for economic development ($2.45 million); (5) committed for City-wide emergencies ($3.4 million); (6) assigned to meet debt service requirements ($2.1 million); and (7) for a variety of other restricted, committed and other assignments. The General Fund is the chief operating fund of the City. At the end of the current fiscal year, unassigned fund balance of the general fund was $11.44 million, while the total fund balance was $16.07 million. As a measure of the General Fund’s liquidity, it may be useful to compare both unassigned fund balance and total fund balance to total fund expenditures. Unassigned fund balance represents 33% of the total fiscal year 2014 General Fund expenditures, while total fund balance represents 46% of that same amount. General Fund expenditures were $.785 million under the amended budget. Most variances in general government areas were minor and due to short periods of vacancies or minor cost under-runs in operating expenses. The fund balance in the General Fund increased by $1.6 million during the fiscal year. There were no extraordinary items contributing to this, simply revenues higher than budgeted and expenditures lower than budgeted. The Debt Service Fund reports a total fund balance of $2.15 million which is totally assigned for the payment of debt service. The increase in fund balance during the current year in the Debt Service Fund was $.46 million, due to utility tax on electricity being higher than expected. Taxes received in this fund first pay for the general government debt, and the balance may be used to provide funds for general government capital projects. This year the amount transferred to fund capital projects was $2.212 million. The Capital Projects Fund reports a total fund balance of $5.5 million , $5.2 million is assigned for future capital projects, and $332 thousand is nonspendable as advances or loans. Fund balance decreased by $591 thousand. The fund balance in the Community Redevelopment Fund decreased $24 thousand in 2014 with an ending fund balance of $2.4 million. As a fund with major capital goals, the fund balance will be directed toward future capital projects identified in the Redevelopment Plan, specifically the Central Avenue project.

12
The fund balance in the Streets and Traffic Fund decreased $170 thousand in 2014 with an ending fund balance of $3.49 million. The key factor was the appropriation of some prior year reserves for ongoing annual overlay program and capital purchase. The combined fund balances for all governmental (major and non-major) funds increased by $4.23 million for fiscal year 2014 or 12%. Proprietary Funds Like the fund financial statements of governmental funds, the fund financial statements for the City’s Proprietary Funds provide the same type of information in the government-wide financial statements, but in more detail. The fund statements of the Proprietary Funds start on page 30. Unrestricted net position of the proprietary funds at the end of the fiscal year amounted to $25.5 million in the Water and Sewer Fund, $2.7 million in the Solid Waste Fund, $12.1 million in the Stormwater Fund, $3.07 million in the Naples Beach Fund, $679 thousand in the City Dock Fund and $247 thousand in the Tennis Fund. General Fund Budgetary Highlights The adopted budget for Fiscal Year 2013-14 was $34,889,493 in expenditures and other financing uses and $34,986,636 in revenues and other financing sources, with the difference of $97,143 being a planned increase in fund balance. The amended budget for FY 2013-14 is $35,496,776 in expenditures, and $35,048,964 in revenues with a variance of $447,812 being a planned use of fund balance. Contingency was budgeted at $350,000. Of that, $103,700 was appropriated by Council for Blue Ribbon Committee recommendations ($19,200), HVAC improvements ($66,500), and forms upgrades ($18,000). The increase between the General Fund’s original budgeted revenue and the final budgeted revenue is $62,328. This includes an increase of $3,374 for a Police Grant and $58,954 for the Insurance Premium Taxes, which were under budgeted. The increase between the General Fund’s original budgeted expenditures and the amended budgeted expenditures is $503,583. This includes (a) an increase of $3,374 for a Turtle Grant; (b) $58,954 for the Insurance Premium Taxes, (c) $299,000 was to increase funds related to the negotiated IAFF contract, (d) $7,620 for a prior year commitment, and (e) $134,635 was for prior year encumbrances.

13
Capital Assets and Debt Administration Capital Assets
The City as of year-end had $177.4 million invested in a variety of capital assets, as reflected in the following table, which represents a net increase (additions less retirements and depreciation) of $5.79 million or 3.4% over last year.
Table 4Capital Assets at Year-End
(In Thousands)
2014 2013 2014 2013 2014 2013Land 16,418 16,377 3,142 3,141 19,560 19,518 Buildings 38,173 37,996 61,545 61,515 99,718 99,511 Improvements other than buildings 36,963 35,332 51,535 47,547 88,498 82,879 Infrastructure 31,736 31,993 99,940 94,313 131,676 126,306 Machinery and equipment 19,529 17,542 20,012 18,080 39,541 35,622 Construction in progress 434 518 6,530 3,991 6,964 4,509 Less accumulated depreciation (76,836) (72,775) (131,610) (123,903) (208,446) (196,678)
Total 66,417 66,983 111,094 104,684 177,511 171,667
Governmental Activities Business Type ActivitiesTotal Primary Government
This year’s major additions are in the Business type activities and include:
Reclaimed Water Distribution Expansion $4.2 million Royal Harbor Water System Improvements $.8 million Golden Gate Raw Water Main $.6 million Water Reuse Facility Instrumentation $.3 million
Additional information regarding the City’s capital assets is included in the Note 5 (D) to the financial statements. Debt Outstanding
As of year-end, the City had $32.291 million in debt (bonds, notes, etc.) outstanding compared to $36.525 million in 2013, a $4.2 million decrease. This decrease is due to regular amortization in accordance with the payment schedules.

14
Table 5Outstanding Debt at Year-end
2014 2013Governmental
General obligation bonds - - Capital improvement refunding revenue note 11,536,000 13,025,000 Unamortized discount - -
Subtotal 11,536,000 13,025,000 Business-type
Public Utilities refunding revenue bonds 20,675,431 23,360,227 Capital improvement refunding revenue note 80,000 140,000
Subtotal 20,755,431 23,500,227 Total 32,291,431 36,525,227
Additional information regarding the City’s outstanding debt is included in the Note 5 (G) to the financial statements. Economic Factors and Next Year Budget and Rates In September 2014, the City Council approved a $132.4 million budget for fiscal year 2014-15, approximately $10.4 million more than the fiscal year 2013-14 budget. The budget includes $97.1 million for operations and transfers and $35.3 million for capital improvements. The adopted fiscal year 2014-15 budget continues the City’s fiscally conservative approach to budget development, while providing quality services to the citizens. The budget for fiscal year 2014-15 was developed with an emphasis on:
The City’s 10-year vision plan Reasonable revenue projections Maintenance of levels of service desired by the community Maintenance of fiscally responsible reserves
The City’s 2014-15 budget was balanced using a millage rate of 1.1800, which is 5.37% greater than the rolled back rate of 1.1199. The millage rate has remained the same since 2009-2010. The following economic and operating factors were considered in developing the budget for fiscal year 2014-15.
The City showed the second year of increase in taxable value (after four consecutive years of decline) as values increased 6.9% over fiscal year 2013-14 to $16.914 billion.
Flat growth rates are expected for most other revenue sources, including investment earnings. The City has five union contracts for its employees. A 2% raise was approved for employees. The budget has a net increase of 2.2 positions over fiscal year 2014-15. There are no debt issues planned in fiscal year 2014-15 Capital includes $14.6 million for the development of the new Baker Park, $7.3 million of water/sewer
projects, $2.9 million in stormwater projects, $1.35 million for beach related improvements, including a $305,000 for parking meters and $892,000 for pier decking. Other capital improvements include $625,000 for the air conditioning at the Police Department, $400,000 to design the new fire station and $250,000 for a Fire Quick Response vehicle.

15
Requests for Information This financial report is designed to provide a general overview of the City of Naples finances to all users (citizens, taxpayers, customers, investors and creditors). If you have questions regarding this report or need additional financial information, contact the Finance Director at City Hall, 735 8th Street South, Naples, Florida 34102, or at (239) 213-1820, or by email at [email protected]. Additional information about the City, including email addresses for the various departments, can be obtained at the City’s website www.naplesgov.com.

16
This page intentionally left blank.

17
BASIC FINANCIAL STATEMENTS

CITY OF NAPLES, FLORIDAStatement of Net Position
September 30, 2014
Primary GovernmentGovernmental Business-type
Assets Activities Activities TotalCash and investments 53,568,707$ 39,923,735 93,492,442 Receivables (net, where applicable,
of allowance for uncollectible) Accounts 1,916,315 9,023,260 10,939,575 Special assessments 34,432 71,201 105,633 Utility taxes 284,348 - 284,348 Miscellaneous 2,955 - 2,955
Accrued interest 108,786 44,999 153,785 Internal balances (1,195,001) 1,195,001 - Due from other governments 525,073 1,387,803 1,912,876 Inventories 133,234 913,468 1,046,702 Prepaid items 356,990 - 356,990 Restricted assets
Cash and investments - 457,888 457,888 Net pension assets 2,119,314 - 2,119,314 Capital assets
Land and land improvements 16,418,277 3,141,603 19,559,880 Buildings and utility plants 38,172,910 61,545,217 99,718,127 Improvements other than buildings 36,962,908 51,535,339 88,498,247 Infrastructure 31,735,904 99,940,177 131,676,081 Equipment 19,529,459 20,011,834 39,541,293 Accumulated depreciation (76,836,301) (131,609,690) (208,445,991) Construction in progress 434,245 6,530,108 6,964,353
Net capital assets 66,417,402 111,094,588 177,511,990 Total assets 124,272,555 164,111,943 288,384,498
Deferred Outflows of ResourcesDeferred charge on refunding 364,654 100,443 465,097
The accompanying notes to financial statements are an integral part of this statement.18

CITY OF NAPLES, FLORIDAStatement of Net Position
September 30, 2014
Primary GovernmentGovernmental Business-type
Liabilities Activities Activities TotalAccounts payable and other current liabilities 3,910,367$ 4,213,226 8,123,593 Due to other governments 314,162 1,646,716 1,960,878 Unearned revenue 177,510 333,003 510,513 Customer deposits 89,787 39,069 128,856 Accrued interest payable 15,392 - 15,392 Liabilities payable from restricted assets
Customer deposits - 294,676 294,676 Total current liabilities 4,507,218 6,526,690 11,033,908
Noncurrent liabilitiesRevenue bonds payable, net of unamortized
discounts and premiumsDue within one year 1,489,000 2,790,194 4,279,194 Due in more than one year 10,047,000 17,965,235 28,012,235
Compensated absencesDue within one year 387,326 185,000 572,326 Due in more than one year 2,150,508 674,805 2,825,313
Other post-employment benefits 1,469,946 653,805 2,123,751 Claims payable
Due within one year 1,058,203 - 1,058,203 Due in more than one year 2,523,200 - 2,523,200
Total noncurrent liabilities 19,125,183 22,269,039 41,394,222 Total liabilities 23,632,401 28,795,729 52,428,130
Net PositionNet investment in capital assets 55,246,056 90,439,602 145,685,658 Restricted for
Building and zoning 5,694,323 - 5,694,323 Capital projects 684,527 - 684,527 Streets and infrastructure 3,588,736 - 3,588,736 Economic development 2,478,963 - 2,478,963 Police programs 528,062 - 528,062 Other governmental projects 933,533 - 933,533
Unrestricted 31,850,608 44,977,055 76,827,663 Total net position 101,004,808$ 135,416,657 236,421,465
The accompanying notes to financial statements are an integral part of this statement.19

CITY OF NAPLES, FLORIDAStatement of Activities
Year Ended September 30, 2014
IndirectExpenses
Expenses AllocationFunctions/programs
Governmental activitiesGeneral government 10,452,225$ (2,736,970) Public safety 25,593,584 375,920Physical and economic environment 2,604,718 96,720Transportation 2,984,484 104,750Culture and recreation 7,093,524 - Interest 227,976 -
Total governmental activities 48,956,511 (2,159,580) Business-type activities
Water and sewer 23,016,647 1,380,700 Solid waste 5,648,617 363,020 Stormwater 2,875,179 212,960 Beach 1,453,385 118,180 Dock 1,607,850 46,630 Tennis 558,708 38,090
Total business-type activities 35,160,386 2,159,580 Total primary government 84,116,897$ -
The accompanying notes to finacial statements are an integral part of this statement.20

Net (Expense) Revenue andProgram Revenues Change In Net Position
Charges Operating Capitalfor Grants and Grants and Governmental Business-type
Services Contributions Contributions Activities Activities Totals
3,724,592 - - (3,990,663) - (3,990,663) 4,940,975 - 328,945 (20,699,584) - (20,699,584)
17,616 3,976,384 75,682 1,368,244 - 1,368,244 104,501 153,994 339,032 (2,491,707) - (2,491,707)
3,185,180 9,628 35,444 (3,863,272) - (3,863,272) - - - (227,976) - (227,976)
11,972,864 4,140,006 779,103 (29,904,958) - (29,904,958)
32,117,638 - 1,835,613 - 9,555,904 9,555,904 6,102,494 - - - 90,857 90,857 5,039,675 250,000 - - 2,201,536 2,201,536 1,209,986 534,245 - - 172,666 172,666 1,785,141 - - - 130,661 130,661
531,792 - - - (65,006) (65,006) 46,786,726 784,245 1,835,613 - 12,086,618 12,086,618 58,759,590 4,924,251 2,614,716 (29,904,958) 12,086,618 (17,818,340)
General revenuesProperty taxes 18,539,883 - 18,539,883 Local communication and utility taxes 5,241,319 - 5,241,319 Insurance premium tax 1,412,980 - 1,412,980 Motor fuel taxes 1,190,133 - 1,190,133 Business tax 269,562 - 269,562 Franchise fees 3,579,771 - 3,579,771 Intergovernmental revenues–unrestricted 3,158,266 - 3,158,266 Unrestricted investment earnings 232,811 200,556 433,367 Gain on sale of capital assets 1,655 - 1,655 Miscellaneous revenues 75,086 - 75,086
Transfers 1,878,880 (1,878,880) - Total general revenues and transfers 35,580,346 (1,678,324) 33,902,022
Change in net position 5,675,388 10,408,294 16,083,682 Net position, beginning 95,329,420 125,008,363 220,337,783 Net position, ending 101,004,808$ 135,416,657 236,421,465
The accompanying notes to finacial statements are an integral part of this statement.21

CITY OF NAPLES, FLORIDABalance Sheet
Governmental FundsSeptember 30, 2014
GeneralDebt
ServiceCapitalProjects
Fund Fund FundAssets
Cash and investments 15,734,753$ 1,871,574 5,588,960Receivables (net, where applicable,
of allowance for uncollectible)Accounts 1,910,040 - - Special assessments - - 34,432 Utility taxes - 284,348 - Accrued interest 49,384 - 15,211
Advances due from other funds 386,986 - 332,004 Due from other governments 374,826 - - Inventories - - - Prepaid items 338,402 - -
Total assets 18,794,391$ 2,155,922$ 5,970,607$
LiabilitiesAccounts payable 1,845,157$ 8,336 402,292Accrued payroll 678,419 - - Due to other governments 12,244 - - Advances payable to other funds - - - Unearned revenue 177,022 - - Customer deposits - - -
Total liabilities 2,712,842 8,336 402,292
Deferred inflows of resourcesUnavailable revenue 12,678 - 34,432
Fund balancesNonspendable 725,388 - 332,004 Restricted 13,791 - - Committed 3,597,298 - 1,442,104 Assigned 293,132 2,147,586 3,759,775 Unassigned 11,439,262 - -
Total fund balances 16,068,871 2,147,586 5,533,883 Total liabilities, deferred inflows of
resources and fund balances 18,794,391$ 2,155,922 5,970,607
The accompanying notes to financial statements are an integral part of this statement.22

CommunityRedevelopment
Streets andTraffic
Other NonmajorGovernmental
Fund Fund Fund Total
2,655,835 3,625,562 14,019,848 43,496,532
- - 6,275 1,916,315 - - - 34,432 - - - 284,348
11,773 7,846 17,113 101,327 - 28,026 - 747,016 - 86,757 61,061 522,644 - 30,241 - 30,241 - - - 338,402
2,667,608$ 3,778,432$ 14,104,297$ 47,471,257$
110,950 279,233 202,535 2,848,503 19,120 11,646 74,287 783,472
- - 301,918 314,162 83,008 - 1,328,016 1,411,024
- - - 177,022 - - 89,787 89,787
213,078 290,879 1,996,543 5,623,970
- - 121,930 169,040
- 58,267 - 1,115,659 2,454,530 3,429,286 9,934,697 15,832,304
- - 1,754,767 6,794,169 - - 55,591 6,256,084 - - 240,769 11,680,031
2,454,530 3,487,553 11,985,824 41,678,247
2,667,608 3,778,432 14,104,297 47,471,257
The accompanying notes to financial statements are an integral part of this statement.23

This page intentionally left blank
24

CITY OF NAPLES, FLORIDAReconciliation of the Balance Sheet–Governmental Funds
to the Statement of Net PositionSeptember 30, 2014
Total fund balances governmental funds (page 23) 41,678,247$ Total net position reported for governmental activities in the Statement of Net Position
is different because:
65,432,552
Some deferred inflows of resources are not available to pay for current period expendituresand, therefore, are reported as unavailable revenue in the funds. 169,040
The net pension assets and deferred outflows of resources are not available and, therefore,are not reported in the governmental funds. 2,483,968
Accrued long term debt interest expense is not a financial use and, therefore, is notreported in the funds. (15,392)
(15,316,028)
Internal service funds are used by management to charge the costs of certain activities,
6,572,421 Net position of governmental activities (page 21) 101,004,808$
not reported in the funds. Total capital assets ($66,363,688) less amounts included in theinternal service funds ($984,850).
Capital assets used in governmental activities are not financial resources and, therefore are
employment benefits are not due and payable in the current period and, therefore, are notreported in the funds. Total long term liabilities ($19,125,183) less amounts reported in theinternal service funds ($3,809,155).
Long term liabilities, including bonds payable, compensated absences, and other post-
such as fleet management, insurance and information services to individual funds. This is thenet position included in the governmental activities in the Statement of Net Position.
The accompanying notes to financial statements are an integral part of this statement.
25

CITY OF NAPLES, FLORIDAStatement of Revenues, Expenditures and Changes in Fund Balances
Governmental FundsYear Ended September 30, 2014
GeneralDebt
ServiceCapitalProjects
Fund Fund FundRevenues
Taxes 21,005,562$ 3,415,906 - Permits, fees and assessments 3,692,334 - 45,072 Intergovernmental 3,564,434 - - Charges for services 1,779,310 - - Charges to other funds 3,358,100 - - Fines and forfeitures 183,258 - - Interest 85,038 (13) 38,333 Donations - - - Miscellaneous 16,614 - 269
Total revenues 33,684,650 3,415,893 83,674
ExpendituresCurrent
General government 8,097,101 62,700 72,311 Public safety 20,803,431 - 40,578 Physical and economic environment - - - Transportation - - - Culture and recreation 5,703,448 - 16,420
Capital outlayGeneral government - - 1,259,310 Public safety 31,894 - 868,756 Physical and economic environment - - - Transportation - - - Culture and recreation - - 958,013
Debt servicePrincipal - 1,489,000 - Interest and fiscal charges - 174,969 -
Total expenditures 34,635,874 1,726,669 3,215,388 Excess (deficiency) of revenues over
(under) expenditures (951,224) 1,689,224 (3,131,714)
Other financing sources (uses)Transfers in 2,149,480 982,770 2,687,456 Transfers out (47,500) (2,212,000) (150,000) Proceeds from sale of capital assets 5,904 - 3,756
Total other financing sources (uses) 2,107,884 (1,229,230) 2,541,212
Change in fund balances 1,156,660 459,994 (590,502)
Fund balances, beginning of year 14,912,211 1,687,592 6,124,385 Fund balances, end of year 16,068,871$ 2,147,586 5,533,883
The accompanying notes to financial statements are an integral part of this statement.26
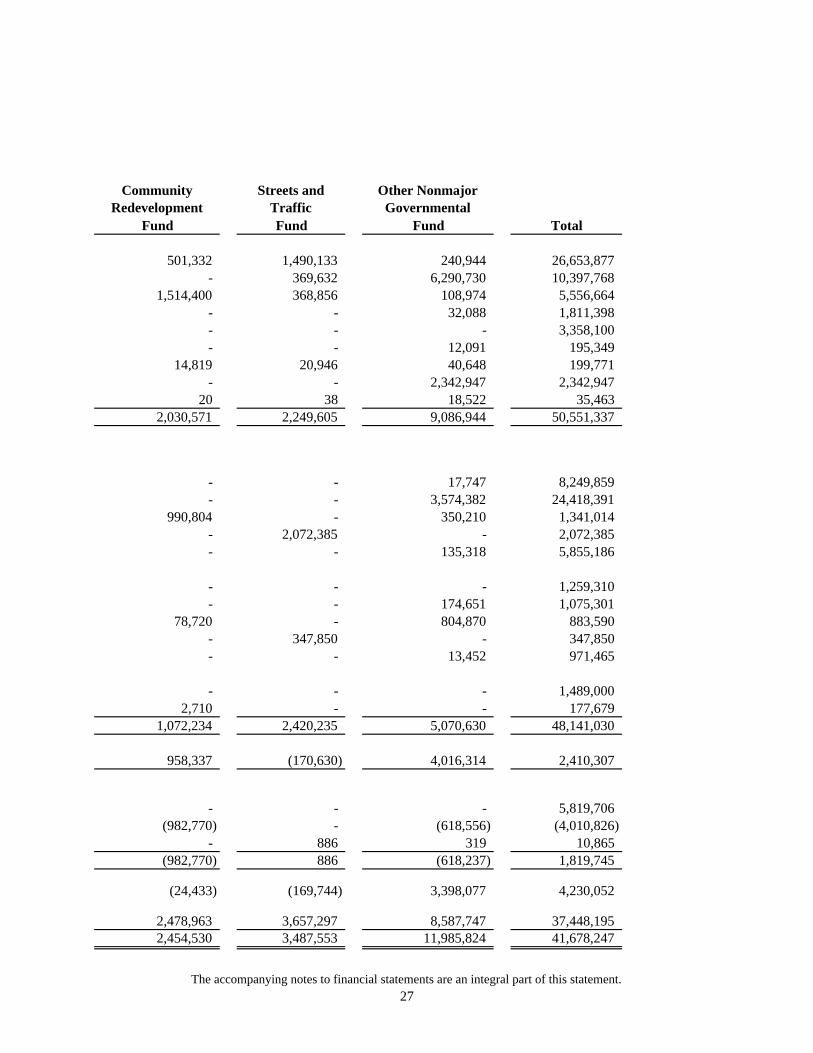
CommunityRedevelopment
Streets andTraffic
Other NonmajorGovernmental
Fund Fund Fund Total
501,332 1,490,133 240,944 26,653,877 - 369,632 6,290,730 10,397,768
1,514,400 368,856 108,974 5,556,664 - - 32,088 1,811,398 - - - 3,358,100 - - 12,091 195,349
14,819 20,946 40,648 199,771 - - 2,342,947 2,342,947
20 38 18,522 35,463 2,030,571 2,249,605 9,086,944 50,551,337
- - 17,747 8,249,859 - - 3,574,382 24,418,391
990,804 - 350,210 1,341,014 - 2,072,385 - 2,072,385 - - 135,318 5,855,186
- - - 1,259,310 - - 174,651 1,075,301
78,720 - 804,870 883,590 - 347,850 - 347,850 - - 13,452 971,465
- - - 1,489,000 2,710 - - 177,679
1,072,234 2,420,235 5,070,630 48,141,030
958,337 (170,630) 4,016,314 2,410,307
- - - 5,819,706 (982,770) - (618,556) (4,010,826)
- 886 319 10,865 (982,770) 886 (618,237) 1,819,745
(24,433) (169,744) 3,398,077 4,230,052
2,478,963 3,657,297 8,587,747 37,448,195 2,454,530 3,487,553 11,985,824 41,678,247
The accompanying notes to financial statements are an integral part of this statement.27

This page intentionally left blank
28

CITY OF NAPLES, FLORIDAReconciliation of the Statement of Revenues,
Expenditures and Changes in Fund Balances of Governmental Fundsto the Statement of Activities
Year Ended September 30, 2014
Net change in fund balances–total governmental funds (page 27) 4,230,052$ Amounts reported for governmental activities in the Statement of Activities are
different because:
Governmental funds report capital outlays as expenditures. However, in the Statement
(674,480)
The net effect of various miscellaneous transactions involving capital assets(i.e., sales, trade-ins, and donations) is to increase net position. 26,675
1,489,000
Some revenues reported in the Statement of Activities do not provide current financial(44,389)
Some expenses reported in the Statement of Activities do not require the use of
(446,936)
1,095,466 Change in net position of governmental activities (page 21) 5,675,388$
of Activities the cost of those assets is allocated over their estimated useful lives andreported as depreciation expense. This is the amount by which depreciation expenseexceeded capital outlays in the current period.
repayment reduces long-term liabilities in the Statement of Net Position. This is theamount of debt payments made in the current period.
resources and, therefore, are not reported as revenues in governmental funds.
current financial resources and, therefore, are not reported as expenditures ingovernmental funds.
activities, such as fleet management, insurances and information systems. This is thenet revenue(expense) of the internal service funds reported within governmentalactiviteis.
Internal service funds are used by management to charge the costs of certain
Repayment of debt principal is an expenditure in governmental funds, but the
The accompanying notes to financial statements are an integral part of this statement.29

CITY OF NAPLES, FLORIDAStatement of Net Position
Proprietary FundsSeptember 30, 2014
Business-type Activities–Enterprise FundsWater and Solid Waste Stormwater
Assets Sewer Fund Fund FundCurrent assets
Cash and investments 22,122,098$ 2,109,105 11,596,036 Restricted cash and investments 269,306 - 163,212 Receivables (net, where applicable,
of allowance for uncollectible)Accounts 6,733,218 1,146,478 1,092,687 Special assessments 71,201 - -
Accrued interest 20,419 8,168 7,922 Advances due from other funds 332,004 - 332,004 Due from other governments 1,243,400 5,383 3,000 Prepaid items - - - Inventories 888,276 - -
Total current assets 31,679,922 3,269,134 13,194,861
Capital assetsLand 1,761,684 1,145,053 234,866 Buildings and utility plants 59,101,253 528,790 - Improvements other than buildings 40,249,136 4,401,066 - Infrastructure 75,310,644 - 24,629,533 Equipment 14,101,432 4,024,731 541,753 Accumulated depreciation (105,863,970) (4,174,512) (12,427,481) Construction in progress 5,252,376 - 1,277,732
Net capital assets 89,912,555 5,925,128 14,256,403 Total assets 121,592,477 9,194,262 27,451,264
Deferred Outflow of ResourcesDeferred charge on refunding 100,443 - -
The accompanying notes to financial statements are an integral part of this statement.30

GovernmentalActivities–
Nonmajor InternalFunds Total Service Funds
4,096,496 39,923,735 10,072,175 25,370 457,888 -
50,877 9,023,260 2,955 - 71,201 -
8,490 44,999 7,459 - 664,008 -
136,020 1,387,803 2,429 - - 18,588
25,192 913,468 102,993 4,342,445 52,486,362 10,206,599
- 3,141,603 - 1,915,174 61,545,217 831,246 6,885,137 51,535,339 -
- 99,940,177 - 1,343,918 20,011,834 2,402,453
(9,143,727) (131,609,690) (2,248,849) - 6,530,108 -
1,000,502 111,094,588 984,850 5,342,947 163,580,950 11,191,449
- 100,443 - (Continued)
The accompanying notes to financial statements are an integral part of this statement.31

CITY OF NAPLES, FLORIDAStatement of Net Position
Proprietary FundsSeptember 30, 2014
Business-type Activities–Enterprise FundsWater and Solid Waste Stormwater
Liabilities Sewer Fund Fund FundCurrent liabilities
Accounts payable 2,729,487$ 195,131 902,279 Accrued payroll 203,565 58,585 24,887 Due to other funds - - - Due to other governments 1,646,716 - - Unearned revenue 244,678 - - Accrued interest payable 36,901 - 1,981 Current portion of compensated absences 100,000 50,000 10,000 Current maturities of long-term debt 2,417,763 - 312,431 Insurance claims payable - - -
Total payable from current assets 7,379,110 303,716 1,251,578
Current liabilities (payable from restricted assets)Customer deposits 269,306 - -
Total current liabilities 7,648,416 303,716 1,251,578
Noncurrent liabilitiesDue in more than one year
Revenue bonds payable, net of unamortized discounts and premiums 16,792,466 - 1,152,769
Compensated absences 505,115 81,292 36,591 Other post-employment benefits 451,958 113,599 36,060 Insurance claims payable - - -
Total noncurrent liabilities 17,749,539 194,891 1,225,420 Total liabilities 25,397,955 498,607 2,476,998
Net PositionNet investment in capital assets 70,802,769 5,925,128 12,791,203 Restricted for flexible benefits - - - Unrestricted 25,492,196 2,770,527 12,183,063
Net assets of business-type activities 96,294,965$ 8,695,655 24,974,266
Adjustment to report cumulative internal balance for the
Net position of business-type activities
net effect of the activity between the internal service and the enterprise funds.
The accompanying notes to financial statements are an integral part of this statement.32

GovernmentalActivities–
Nonmajor InternalFunds Total Service Funds
70,127 3,897,024 245,174 29,165 316,202 33,218
- - - - 1,646,716 -
88,325 333,003 488 187 39,069 -
25,000 185,000 25,266 60,000 2,790,194 -
- - 1,058,203 272,804 9,207,208 1,362,349
25,370 294,676 - 298,174 9,501,884 1,362,349
20,000 17,965,235 - 51,807 674,805 117,709 52,188 653,805 84,777
- - 2,523,200 123,995 19,293,845 2,725,686 422,169 28,795,729 4,088,035
920,502 90,439,602 847,377 - - 309,506
4,000,276 44,446,062 5,946,531 4,920,778 134,885,664 7,103,414
530,993 135,416,657$
The accompanying notes to financial statements are an integral part of this statement.33

CITY OF NAPLES, FLORIDAProprietary Funds
Statement of Revenues, Expenses and Changes in Fund Net PositionYear Ended September 30, 2014
Water and Solid Waste StormwaterSewer Fund Fund Fund
Operating revenuesCharges for services
Water revenues 17,668,979$ - - Sewer revenues 14,018,179 - - Other 430,480 6,102,494 5,039,675
Total operating revenues 32,117,638 6,102,494 5,039,675
Operating expensesPersonal services 7,561,378 1,873,560 1,014,124Supplies, services and claims 4,376,311 3,232,066 433,662Materials 2,032,667 - - Utilities 1,917,263 8,060 21,306Depreciation and amortization 6,416,582 506,557 1,361,055General administration 1,380,700 363,020 212,960Other 381,280 58,925 26,342
Total operating expenses 24,066,181 6,042,188 3,069,449 Operating income (loss) 8,051,457 60,306 1,970,226
Nonoperating revenues (expenses)Operating grants - - 250,000Interest income 108,002 27,706 43,723Interest expense (440,472) - (21,529)Gain (loss) on sale of capital assets 9,285 16,685 -
Total nonoperating revenues (expenses) (323,185) 44,391 272,194
Income (loss) before contributions and transfers 7,728,272 104,697 2,242,420
Capital contributions 1,835,613 - - Transfers in 47,700 - 47,700Transfers out (1,743,340) (358,440) -
Change in net position 7,868,245 (253,743) 2,290,120
Net position, beginning of year (restated) 88,426,720 8,949,398 22,684,146Net position, end of year 96,294,965$ 8,695,655 24,974,266
Adjustment for the net effect of the current year activity between the internal service funds and the enterprise funds.
Business-type Activities–Enterprise Funds
The accompanying notes to financial statements are an integral part of this statement.34

GovernmentalActivities–
Nonmajor InternalFunds Totals Service Funds
- 17,668,979 - - 14,018,179 -
3,526,919 15,099,568 14,144,117 3,526,919 46,786,726 14,144,117
1,218,932 11,667,994 1,532,506 1,945,758 9,987,797 10,741,885
- 2,032,667 - 169,549 2,116,178 24,742 213,926 8,498,120 331,573 202,900 2,159,580 388,172
82,477 549,024 5,320 3,833,542 37,011,360 13,024,198 (306,623) 9,775,366 1,119,919
534,245 784,245 - 21,125 200,556 33,041 (1,640) (463,641) -
(85) 25,885 1,655 553,645 547,045 34,696
247,022 10,322,411 1,154,615
- 1,835,613 - 127,500 222,900 70,000
- (2,101,780) - 374,522 10,279,144 1,224,615
4,546,256 5,878,799 4,920,778 7,103,414
129,150 10,408,294$
The accompanying notes to financial statements are an integral part of this statement.35

Water and Solid Waste StormwaterSewer Fund Fund Fund
Cash flows from operating activitiesCash received from customers 27,186,686$ 5,558,631 4,700,601 Cash payments to suppliers (6,658,501) (3,709,566) 241,372 Cash payments to employees for services (7,285,736) (1,801,013) (966,322) Cash payments for interfund services (1,380,700) (363,020) (212,960)
Net cash provided by operating activities 11,861,749 (314,968) 3,762,691
Cash flows from noncapital financing activitiesTransfers in (out) (1,695,640) (358,440) 47,700 Operating grants - - 250,000
Net cash provided by (used in) noncapitalfinancing activities (1,695,640) (358,440) 297,700
Cash flows from capital and related financing activitiesPrincipal paid on long-term debt (2,376,176) - (308,621) Interest paid on long-term debt (433,032) - (21,529) Capital contributions 1,835,613 - - Proceeds from sale of capital assets 12,239 71,071 - Acquisition and construction of capital assets (10,629,322) (1,937,321) (2,203,383)
Net cash used in capital and relatedfinancing activities (11,590,678) (1,866,250) (2,533,533)
Cash flows from investing activitiesInterest and investment earnings 101,312 26,806 39,766
Net cash provided by investing activities 101,312 26,806 39,766
Net increase in cash and cash equivalents (1,323,257) (2,512,852) 1,566,624
Cash and cash equivalents, beginning of year 23,714,661 4,621,957 10,192,624 Cash and cash equivalents, end of year 22,391,404$ 2,109,105 11,759,248
Reconciliation of operating income (loss) to net cash provided(used) by operating activities
Operating income (loss) 8,051,457$ 60,306 1,970,226 Adjustments to reconcile operating income (loss) to net cash
provided (used) by operating activitiesDepreciation and amortization 6,416,582 506,557 1,361,055 Changes in assets and liabilities
(Increase) decrease in accounts receivable, net (3,615,972) (539,206) (597,232) (Increase) decrease in miscellaneous receivables - - - (Increase) decrease in due from other governments (1,243,400) (4,657) 258,158 (Increase) decrease in inventories (154,143) - - (Increase) decrease in prepaid items 10,000 3,402 - Increase (decrease) in accounts payable 1,117,448 (413,917) 722,682 Increase (decrease) in accrued payroll 44,696 21,204 3,731 Increase (decrease) in due to other governments 1,075,715 - - Increase (decrease) in unearned revenue (26,908) - - Increase (decrease) in customer deposits (44,672) - - Increase (decrease) in insurance claims payable - - - Increase (decrease) in other post-employment benefits 113,653 28,354 12,342 Increase (decrease) in compensated absences 117,293 22,989 31,729
Net cash provided (used) by operating activities 11,861,749$ (314,968) 3,762,691
Noncash investing, capital, and financing activitiesAmortization of loss on revenue refunding bonds 7,440$ - -
CITY OF NAPLES, FLORIDAStatement of Cash Flows
Proprietary FundsYear Ended September 30, 2014
Business-type Activities–Enterprise Funds
The accompanying notes to financial statements are an integral part of this statement.36

GovernmentalActivities–
Nonmajor InternalFunds Total Service Funds
3,552,760 40,998,678 14,144,595 (2,175,124) (12,301,819) (10,645,020) (1,212,524) (11,265,595) (1,454,511)
(202,900) (2,159,580) (388,172) (37,788) 15,271,684 1,656,892
127,500 (1,878,880) 70,000 534,245 784,245 -
661,745 (1,094,635) 70,000
(60,000) (2,744,797) - (1,640) (456,201) -
- 1,835,613 - 306 83,616 1,655
(196,048) (14,966,074) (414,034)
(257,382) (16,247,843) (412,379)
19,386 187,270 30,168 19,386 187,270 30,168
385,961 (1,883,524) 1,344,681
3,735,905 42,265,147 8,727,494 4,121,866 40,381,623 10,072,175
(306,623) 9,775,366 1,119,919
213,926 8,498,120 331,573
(4,608) (4,757,018) - - - (2,197)
25,720 (964,179) 2,675 442 (153,701) 20,040
- 13,402 23,691 22,216 1,448,429 18,476
578 70,209 570 - 1,075,715 -
5,554 (21,354) 383 (825) (45,497) -
- - 64,337 12,596 166,945 18,476 (6,766) 165,245 58,949
(37,790) 15,271,682 1,656,892
- 7,440 -
The accompanying notes to financial statements are an integral part of this statement.37

CITY OF NAPLES, FLORIDAStatement of Fiduciary Net Position
Fiduciary FundsSeptember 30, 2014
Pension AgencyTrust Funds Funds
AssetsCash and cash equivalents 3,351,614$ 4,744 Contributions receivable 1,468,733 - Investments, at fair value
U.S. Treasury securities 3,304,943 - U.S. Government agency securities 4,799,280 - Municipal obligations 663,889 - Asset-backed securities 4,546,188 - Corporate bonds 12,779,212 - Common stock/equity funds 89,270,862 - Real estate investment trusts 5,855,465 - Mutual funds 8,230,358 - Alternative investments 12,758,795
Total investments 142,208,992 - Total assets 147,029,339 4,744
LiabilitiesAccounts payable 351,806 4,744
Total liabilities 351,806 4,744 Net position
Restricted for pension benefits 146,677,533$ -
The accompanying notes to financial statements are an integral part of this statement.38

CITY OF NAPLES, FLORIDAStatement of Changes in Fiduciary Net Position
Fiduciary FundsYear Ended September 30, 2014
PensionTrust Funds
AdditionsContributions
Employee contributions 1,497,461$ Employer contributions 5,207,376 State contributions 1,412,980
Total contributions 8,117,817
Investment earningsInterest and dividend income 2,718,185 Net change in fair value of investments 14,368,399 Less investment expense (737,662)
Net investment earnings 16,348,922 Total additions 24,466,739
DeductionsBenefits paid 7,830,550 Refunds of contributions 1,122,323 General administration 283,553
Total deductions 9,236,426 Change in net position 15,230,313
Net position, beginning of year 131,447,220 Net position, end of year 146,677,533$
The accompanying notes to financial statements are an integral part of this statement.39

This page intentionally left blank
40

THE CITY OF NAPLES, FLORIDA
Notes to Financial Statements
September 30, 2014
41
I. Summary of Significant Accounting Policies and Practices
The accounting policies and practices and the presentation of the financial report of the City of Naples, Florida (the "City"), have been designed to conform to generally accepted accounting principles as applicable to governmental units, in accordance with the Governmental Accounting Standards Board (GASB). The following is a summary of the more significant accounting policies and practices:
A. Reporting Entity
The City is a political subdivision of the State of Florida, located in Collier County along the lower southwest coast of the State. Naples was incorporated in December 1923. The City operates under a Council Manager form of government. The governing body of the City is comprised of an elected City Council (six members) and an elected Mayor. In addition to the public safety, general government, recreation, sanitation, and public works services provided to its residents, the City operates water and sewer enterprises and maintains various pension and agency funds in a fiduciary capacity.
The accompanying financial statements present the government and its blended component units, entities for which the government is considered to be financially accountable. Blended component units, although legally separate entities, are, in substance, part of the government’s operations. The City has no discretely presented component units to report.
Blended Component Units. Moorings Bay Special Taxing District, East Naples Bay Special Taxing District and the Community Redevelopment Agency are blended component units of this reporting entity, as management of the primary government has operational responsibility for the component units. The two Special Taxing Districts were created and established by Ordinances No. 87-5328 and No. 87-5330, respectively, for the purpose of providing maintenance dredging in the channels and waterways within the area or boundary of the respective District, and to maintain necessary aids to navigation. Funds for the taxing districts are provided through an ad valorem tax that is levied only within these specified districts. Ordinance No. 94-7099 created the Community Redevelopment Agency for the rehabilitation, conservation or redevelopment of the designated district. The tax increment from both Collier County and the City provides the source of revenue for the Community Redevelopment Agency.
Separate financial statements for the blended component units are not prepared.
Entities that benefit residents of the City but are excluded from this report are the Naples Community Hospital and the Naples Airport Authority. They are excluded because they do not meet the criteria of component units.
B. Government-wide and Fund Financial Statements
The government-wide financial statements (i.e., the Statement of Net Position and the Statement of Activities) report information on all of the nonfiduciary activities of the primary government and its component units. For the most part, the effect of interfund activity has been removed from these statements. Governmental activities, which principally are supported by taxes and intergovernmental

THE CITY OF NAPLES, FLORIDA
Notes to Financial Statements
September 30, 2014
42
revenues, are reported separately from business-type activities, which rely to a significant extent on fees and charges for support.
The Statement of Activities demonstrates the degree to which the direct expenses of a given function or segment, are offset by program revenues. Direct expenses are those that are clearly identifiable with a specific function or segment. Program revenues include: (1) charges to customers or applicants who purchase, use or directly benefit from goods, services or privileges provided by a given function or segment, and (2) grants and contributions that are restricted to meeting the operational or capital requirements of a particular function or segment. Taxes and other items not included among program revenues are reported instead as general revenues.
Separate financial statements are provided for governmental funds, proprietary funds and fiduciary funds, even though the latter are excluded from the government-wide financial statements. Major individual governmental funds and major individual enterprise funds are reported as separate columns in the fund financial statements.
C. Measurement Focus, Basis of Accounting and Financial Statement Presentation
The government-wide financial statements are reported using the economic resources measurement focus and the accrual basis of accounting, as are the proprietary fund and fiduciary fund financial statements. Agency funds do not have a measurement focus and only report assets and liabilities. Revenues are recorded when earned and expenses are recorded when a liability is incurred, regardless of the timing of related cash flows. Property taxes are recognized as revenues in the year for which they are levied. Grants and similar items are recognized as revenue as soon as all eligibility requirements have been met.
Governmental fund financial statements are reported using the current financial resources measurement focus and the modified accrual basis of accounting. Revenues are recognized as soon as they are both measurable and available. Revenues are considered to be available when they are collectible within the current period or soon enough thereafter to pay liabilities of the current period. For this purpose, the government considers revenues to be available if they are collected within 60 days of the end of the current fiscal period, with the exception of grant revenues as they are considered available when eligible expenditures have occurred even though they may be collected for up to one year after the current fiscal year end. Property taxes, gas taxes, utility taxes, franchise fees, licenses, intergovernmental revenues and interest associated with the current fiscal period are all considered to be susceptible to accrual and therefore have been recognized as revenues of the current period. All other revenue items are considered to be measurable and available only when cash is received by the City. Expenditures generally are recorded when a liability is incurred, as under accrual accounting. However, debt service expenditures, as well as expenditures related to compensated absences and claims and judgments, are recorded only when the liability has matured.
The City reports the following major governmental funds:
General Fund is the general operating fund of the City. All general tax revenue and other receipts that are not required either legally or by generally accepted accounting principles to be accounted for in other funds are accounted for in the General Fund.

THE CITY OF NAPLES, FLORIDA
Notes to Financial Statements
September 30, 2014
43
Debt Service Fund is used to account for the accumulation of resources for the payment of principal, interest and other expenditures on long-term debt, other than notes and bonds payable from the operation of Proprietary Funds.
Capital Projects Fund is used to account for financial resources segregated for the acquisition or construction of major capital facilities as designated by City Council.
Community Redevelopment Fund, a blended component unit, is used to account for the receipt and disbursement of tax increment financing resources received for the redevelopment program and to finance capital improvements in the redevelopment area of the City.
Streets and Traffic Fund is used to account for the City’s share of the local option fuel taxes, State revenue sharing and road impact fees for the purpose of improving streets and traffic within the City.
The City reports the following major proprietary funds:
Water and Sewer Fund is used to account for all of the activities of providing customers with potable water and wastewater disposal services.
Solid Waste Fund is used to account for all of the activities of the collection and disposal of solid waste.
Stormwater Fund is used to account for funds used in the construction of storm sewers and subsequent operations of the system.
Additionally the City reports the following fund types:
Internal Service Funds account for technology management, equipment services, health insurance, and risk management services provided to other departments or agencies of the City.
Fiduciary Funds account for the activities of the City’s retirement systems, which accumulate resources for pension benefit payments made to qualified general and public safety employees, and account for the activities of the City’s internal payroll clearing account.
As a general rule the effect of interfund activity has been eliminated from the government-wide financial statements. Exceptions to this general rule are payments in lieu of taxes and other charges between the government’s water and sewer functions and various other functions of the government. Elimination of these charges would distort the direct costs and program revenues reported for the various functions concerned.
Amounts reported as program revenues include: (1) charges to customers or applicants for goods, services or privileges provided, (2) operating grants and contributions, and (3) capital grants and contributions, including special assessments. Internally dedicated resources are reported as general revenues rather than as program revenues. Likewise, general revenues include all taxes.

THE CITY OF NAPLES, FLORIDA
Notes to Financial Statements
September 30, 2014
44
Proprietary funds distinguish operating revenues and expenses from nonoperating items. Operating revenues and expenses generally result from providing services, producing and delivering goods in connection with a proprietary fund’s principal ongoing operations. The principal operating revenues of the Water and Sewer Enterprise Fund, Solid Waste Enterprise Fund, Stormwater Enterprise Fund, other Nonmajor Enterprise Funds, and the City’s Internal Service Funds are charges to customers for sales and services. The Water and Sewer Fund also recognizes as operating revenue the portion of tap fees intended to recover the cost of connecting new customers to the system. Operating expenses for enterprise funds and internal service funds include the cost of sales and services, administrative expenses, and depreciation on capital assets. All revenues and expenses not meeting this definition are reported as nonoperating revenues and expenses. When both restricted and unrestricted resources are available for use, it is the City’s policy to use restricted resources first, then unrestricted resources as they are needed.
D. Assets, Liabilities and Fund Balance/Net Position
1. Deposits and Investments
a. Cash and Cash Equivalents
Cash and cash equivalents are defined as highly liquid investments with original maturities of three months or less and consist of cash on hand, cash on deposit with financial institutions, and funds on deposit in the Local Government Surplus Trust Fund Investment Pool administered by the Florida State Board of Administration.
b. Investments
The City follows the provisions of Statement No. 31 of the Governmental Accounting Standards Board, Accounting and Financial Reporting for Certain Investments and for External Investment Pools, in which all investments are reported at fair value based on quoted market prices.
The City maintains a centralized bank account to maximize investment yields. Investment income resulting from pooling of investments is allocated to participating funds based on average monthly invested balances.
2. Receivables and Payables
Activity between funds that are representative of lending/borrowing arrangements outstanding at the end of the fiscal year are referred to as either “due to/from other funds” (i.e., the current portion of interfund loans) or “advances to/from other funds” (i.e., the noncurrent portion of interfund loans). All other outstanding balances between funds are reported as “due to/from other funds.” Any residual balances outstanding between the governmental activities and business-type activities are reported in the government-wide financial statements as “internal balances.”
a. Advances to Other Funds
In governmental fund types, noncurrent portions of long-term interfund loan receivables are reported as advances and are offset equally by nonspendable fund balance, which

THE CITY OF NAPLES, FLORIDA
Notes to Financial Statements
September 30, 2014
45
indicates that they do not constitute expendable available financial resources, and therefore, are not available for appropriation.
b. Short-Term Interfund Receivables/Payables
During the course of operations, numerous transactions occur between individual funds for goods provided or services rendered and the cash used/generated in those transactions is recorded in a general cash clearing fund. Each operating fund maintains a positive cash equity position (receivable balance) or a negative cash deficit position (payable balance) in the cash clearing fund. These receivables and payables are classified as “due from other funds” or “due to other funds” on the balance sheet. The net receivable balance is allocated as cash to the individual funds based on their percentage of positive equity to total positive equity. Interfund receivables and payables are liquidated on a monthly basis.
3. Inventories
Inventories are valued at cost (first-in, first-out method) in the Streets Fund and consist of expendable supplies held for consumption. Inventories are reported using the “Consumption Method” and are reported as an asset in governmental funds (rather than as an expenditure) until consumed, at which time expenditure is reported. Reported inventories are equally offset by nonspendable fund balance which indicates that they do not constitute “available spendable resources” even though they are a component of net current assets.
Inventories are valued at the lower of cost (first-in, first-out method) or market in the Enterprise and Internal Service Funds. They consist of water meters, supplies, maintenance parts, tires, and fuel held for consumption. Allowances have been recorded for obsolete and surplus items, when appropriate. Inventories of proprietary funds are reported as an expense when consumed.
4. Restricted Assets
Restricted cash and investments are reported for amounts held as deposits in the enterprise funds.
5. Capital Assets
Capital assets which include property, plant, equipment, and infrastructure assets (e.g., roads, bridges, sidewalks, and similar items) are reported in the applicable City or business-type activities columns in the government-wide financial statements. Capital assets are defined by the City as assets with an initial, individual cost of more than $1,000 and an estimated useful life in excess of two years. Such assets are recorded at historical cost or estimated historical cost if purchased or constructed. Donated capital assets are recorded at estimated fair market value at the date of donation.
The costs of normal maintenance and repairs that do not add to the value of the asset or materially extend assets lives are not capitalized.

THE CITY OF NAPLES, FLORIDA
Notes to Financial Statements
September 30, 2014
46
Major outlays for capital assets and improvements are capitalized as projects are constructed. Interest incurred during the construction phase of capital assets of business-type activities is included as part of the capitalized value of the assets constructed.
Capital assets of the primary government, as well as the component units, are depreciated using the straight line method over the following estimated useful lives:
Buildings 10-50 yearsUtility plants 40-50 yearsImprovements other than buildings 5-20 yearsInfrastructure 10-50 yearsEquipment 2-10 years
6. Compensated Absences
It is the City’s policy to allow employees to accumulate personal leave (sick and vacation) benefits. The liability relating to such unused leave, to the extent of certain vested maximum hours, is recorded in the accompanying Statement of Net Position. Expenditures for compensated absences in governmental funds are those paid during the current fiscal year and the amount unpaid at the end of the reporting period that has matured. For proprietary funds, the liability relating to vested personal leave is reflected on the accrual basis.
7. Long-term Obligations
In the government-wide financial statements and proprietary fund types in the fund financial statements, long-term debt and other long-term obligations are reported as liabilities in the applicable governmental activities, business-type activities, or proprietary fund type Statement of Net Position. Bond premiums and discounts are deferred and amortized over the life of the bonds using the effective interest method. Bonds payable are reported net of the applicable bond premium or discount. Bond issuance costs are reported as deferred charges and amortized over the term of the related debt. In the fund financial statements, governmental fund types recognize bond premiums and discounts, as well as bond issuance costs, during the current period. The face amount of debt issued is reported as other financing sources. Premiums received on debt issuances are reported as other financing sources while discounts on debt issuances are reported as other financing uses. Issuance costs, whether or not withheld from the actual debt proceeds received, are reported as debt service expenditures/expenses.
8. Net Position
The government-wide and business-type fund financial statements utilize a net position presentation. Net position is presented in three components–invested in capital assets (net of related debt), restricted and unrestricted.
Net investment in Capital Assets –This component of net position consists of capital assets, net of accumulated depreciation reduced by the outstanding balances of any bonds, notes or other

THE CITY OF NAPLES, FLORIDA
Notes to Financial Statements
September 30, 2014
47
borrowings attributable to the acquisition, construction, or improvement of those assets. This component does not include the portion of debt attributable to the unspent proceeds.
Restricted–This component of net position consists of funds that have constraints placed on them either externally by third-parties (creditors, grantors, contributors, or laws or regulations of other governments) or by law through constitutional provisions or enabling legislation. The City would typically use restricted assets first, as appropriate opportunities arise, but reserves the right to selectively defer the use of these funds.
Unrestricted–This component consists of net position that does not meet the definition of “net investment in capital assets” or “restricted.”
When both restricted and unrestricted resources are available for use, it is the City’s policy to use restricted resources first, then unrestricted resources as they are needed.
Fund Balance In the fund financial statements, fund balance for governmental funds is reported in classifications that comprise a hierarchy based primarily on the extent to which the City is bound to honor constraints on the specific purpose for which amounts in the funds can be spent. Fund balance is reported in five components–nonspendable, restricted, committed, assigned and unassigned. Nonspendable–This component includes amounts that cannot be spent because they are either (a) not in spendable form or, (b) legally or contractually required to be maintained intact.
Restricted–This component consists of amounts that have constraints placed on them either externally by third-parties (creditors, grantors, contributors, or laws or regulations of other governments) or by law through constitutional provisions or enabling legislation. Enabling legislation authorizes the City to assess, levy, charge or otherwise mandate payment of resources (from external resource providers) and includes a legally enforceable requirement (compelled by external parties) that those resources be used only for the specific purposes stipulated in the legislation.
Committed–This component consists of amounts that can only be used for specific purposes pursuant to constraints imposed by formal action of the City Council through the adoption of an ordinance. Those committed amounts cannot be used for any other purpose unless the City Council removes or changes the specified use by taking the same type of action it employed previously to commit those amounts.
Assigned–This component consists of amounts that are constrained by the City’s intent to be used for specific purposes, but are neither restricted nor committed. The City Manager and City Council are designated the authorities for assigning fund balance.
Unassigned–This classification represents amounts that have not been restricted, committed or assigned to specific purposes within the General Fund. The General Fund is the only fund that

THE CITY OF NAPLES, FLORIDA
Notes to Financial Statements
September 30, 2014
48
reports a positive unassigned fund balance amount. Other governmental funds besides the general fund can only report a negative unassigned fund balance amount.
See Section 5 (H) for a detail of restricted, committed and assigned fund balances.
When both restricted and unrestricted resources are available for use, it is the City’s policy to use restricted resources first, then unrestricted resources (committed, assigned and unassigned) as they are needed. When unrestricted resources (committed, assigned and unassigned) are available for use, it is the City’s policy to use committed resources first, then assigned, and then unassigned as they are needed.
Fund Balance/Net Position Policy
A fund balance/net position policy has been adopted by the City Council to protect against unanticipated events that would adversely affect the financial condition of the City and jeopardize the continuation of necessary public services. This policy ensures the City maintains an adequate fund balance/net position in the City’s various operating funds to provide the capacity to: (1) provide sufficient cash flow for daily financial needs, (2) secure and maintain investment grade bond ratings, (3) offset significant economic downturns and revenue shortfalls, and (4) provide funds for unforeseen expenditures related to emergencies.
In the General Fund, there is committed fund balance equal to 10% of the prior year adopted General Fund operating budget as an emergency reserve for recovery after catastrophic events such as a hurricane. In addition, the General Fund shall retain an unassigned fund balance of 16% to 30% of the prior year General Fund operating budget. In any fiscal year where the City is unable to fund the unassigned fund balance as required in this section, the City shall not budget an amount of unassigned fund balance for the purpose of balancing the budget.
Enterprise Funds–The City maintains a Solid Waste Fund, a Water and Sewer Fund, a Stormwater Fund, a City Dock Fund, a Tennis Fund and a Naples Beach Fund. With the exclusion of the City Dock and Tennis Funds the City’s policy requires a balance of unrestricted net position equal to 8% to 16% of the annual budget for that fund plus 10% of the net capital assets from the most recent audit. For the purposes of this calculation, the current year shall be the budget as originally adopted by resolution on or before September 30, for the subsequent fiscal year. The unrestricted amount shall be in addition to all other required restrictions of net position.
Utilization of Surplus Reserve–In the event that the unassigned fund balance or unrestricted net position exceeds the amounts set forth above, the excess may be utilized for any lawful purpose.
9. Administrative Fees
Certain administrative expenses are incurred by the General Fund on behalf of other funds of the City. The General Fund collects for these services based on a percentage of operating costs and personnel costs. The related reimbursements for these services are recorded as either an operating expense in the proprietary funds or as expenditure in the governmental funds. Such

THE CITY OF NAPLES, FLORIDA
Notes to Financial Statements
September 30, 2014
49
fees amounted to $3,358,100 for fiscal year 2014, and included $2,159,580 charged to enterprise funds, $494,000 charged to internal service and fiduciary funds, and $704,520 charged to the debt service fund, building and zoning, streets and traffic and CRA special revenue funds, and capital projects funds.
E. Implementation of Governmental Accounting Standards Statements
Effective October 1, 2013, the City’s three pension plans (General Employees’ Pension Plan, Police Officers’ Pension Plan and the Fire Fighters’ Pension Plan) implemented the provisions of GASB Statement No. 67, Financial Reporting for Pension Plans – an amendment of GASB Statement No. 25, which significantly changed the disclosures required related to the plans.
II. Reconciliation of Government-wide and Fund Financial Statements
A. Explanation of Certain Differences Between the Governmental Fund Balance Sheet and the Government-wide Statement of Net Position
The governmental funds balance sheet includes reconciliation between total fund balances—governmental funds and net position—governmental activities as reported in the government-wide Statement of Net Position.
One element of that reconciliation explains that “net pension assets and deferred outflows of resources are not available to pay for current period expenditures and, therefore are not recorded in the funds.” The details of this difference are as follows:
Net pension assets $ 2,119,314 Deferred outflows of resources 364,654
Net adjustment to increase fund balance–governmental funds to arrive at net assets–governmental activities. $ 2,483,968
Another element of that reconciliation explains that “long-term liabilities, including bonds payable, compensated absences, and other post-employment benefits are not due and payable in the current period, and therefore are not reported in the funds.” The details of this difference are as follows:
Debt payable $ (11,536,000) Other post-employment benefits (1,385,169) Compensated absences (2,394,859)
Net adjustment to reduce total fund balance–governmental funds to arrive at net position–governmental activities. $ (15,316,028)
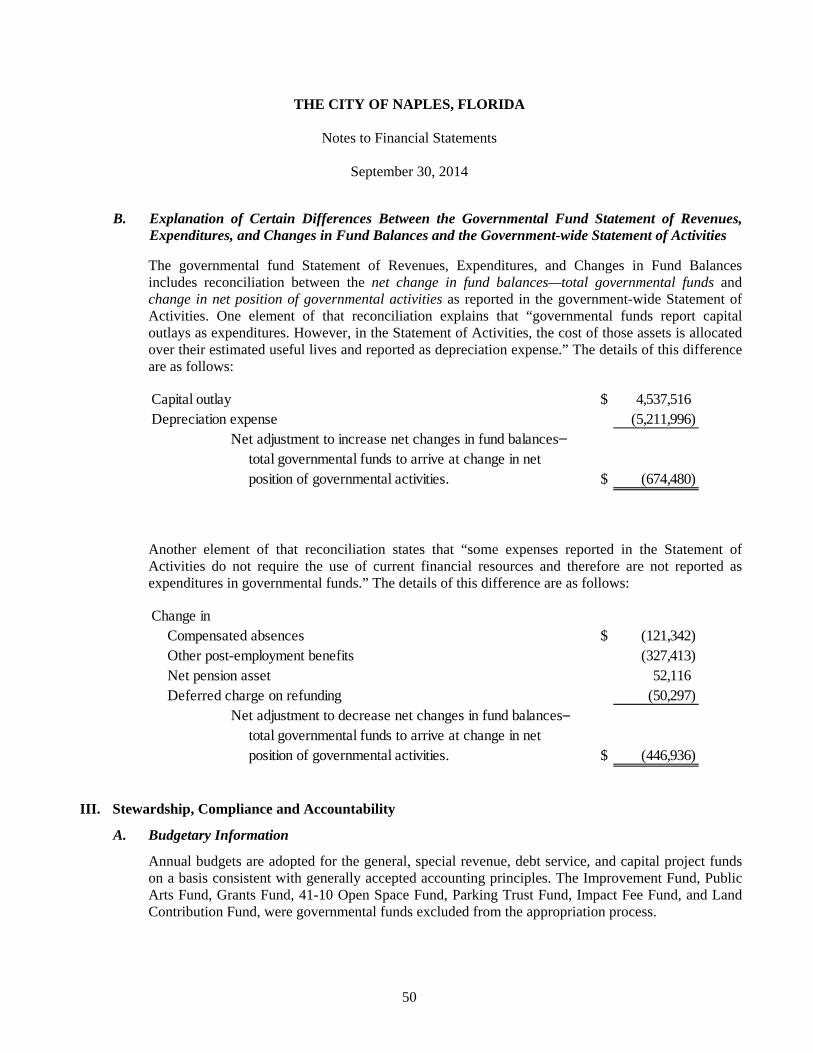
THE CITY OF NAPLES, FLORIDA
Notes to Financial Statements
September 30, 2014
50
B. Explanation of Certain Differences Between the Governmental Fund Statement of Revenues, Expenditures, and Changes in Fund Balances and the Government-wide Statement of Activities
The governmental fund Statement of Revenues, Expenditures, and Changes in Fund Balances includes reconciliation between the net change in fund balances—total governmental funds and change in net position of governmental activities as reported in the government-wide Statement of Activities. One element of that reconciliation explains that “governmental funds report capital outlays as expenditures. However, in the Statement of Activities, the cost of those assets is allocated over their estimated useful lives and reported as depreciation expense.” The details of this difference are as follows:
Capital outlay $ 4,537,516 Depreciation expense (5,211,996)
Net adjustment to increase net changes in fund balances– total governmental funds to arrive at change in net position of governmental activities. $ (674,480)
Another element of that reconciliation states that “some expenses reported in the Statement of Activities do not require the use of current financial resources and therefore are not reported as expenditures in governmental funds.” The details of this difference are as follows:
Change inCompensated absences $ (121,342) Other post-employment benefits (327,413) Net pension asset 52,116 Deferred charge on refunding (50,297)
Net adjustment to decrease net changes in fund balances–total governmental funds to arrive at change in net position of governmental activities. $ (446,936)
III. Stewardship, Compliance and Accountability
A. Budgetary Information
Annual budgets are adopted for the general, special revenue, debt service, and capital project funds on a basis consistent with generally accepted accounting principles. The Improvement Fund, Public Arts Fund, Grants Fund, 41-10 Open Space Fund, Parking Trust Fund, Impact Fee Fund, and Land Contribution Fund, were governmental funds excluded from the appropriation process.
THE CITY OF NAPLES, FLORIDA
Notes to Financial Statements
September 30, 2014
51
The City follows these procedures in establishing the budgetary data reflected in the financial statements:
1. The budget process begins in March, with the development of the Capital Improvement Program and the operating budgets.
2. The Five Year Capital Improvement Program document is presented to Council in June.
3. The Preliminary Budget document is presented to Council in July.
4. A workshop on the proposed budget is conducted in August.
5. In September, two public hearings are conducted to obtain taxpayer comments.
6. The budget is legally enacted through passage of an ordinance, effective October 1.
7 The appropriated budget is prepared by fund, function, department, activity, and object. The appropriations ordinance is enacted on an annual basis. The legal level of budgetary control is maintained at the fund level in accordance with the adopted annual budget ordinance. Total expenditures may not legally exceed appropriations for each budgeted fund.
8. Within a single fund or department, budget amendments may be made by the department head with the City Manager’s approval. All other changes, including increasing the budget, transfers, capital amendments and addition of employees require City Council approval via resolution.
9. Unused appropriations lapse at the end of the year.
Budgeted amounts in the accompanying financial statements are as originally adopted, or as amended by the appropriate authority. Significant budget amendments made during the year include an increase in appropriations in the Community Redevelopment Fund for $2.3 million and $1.5 million in the Port Royal Dredging Fund, for the purchase of capital assets, respectively.
Encumbrance accounting, under which purchase orders, contracts and other commitments for the expenditure of monies are recorded in order to restrict that portion of the applicable appropriation, is employed throughout the fiscal year as an operating tool for budgeted funds. Encumbrances outstanding at year-end are reported as restricted, committed or assigned fund balance since they do not constitute expenditures or liabilities.

THE CITY OF NAPLES, FLORIDA
Notes to Financial Statements
September 30, 2014
52
B. Deficit Fund Balance/Net Position
The East Naples Bay District Fund is reporting negative unassigned fund balances of $525,191. Funds have been advanced to this fund to cover costs for dredging. A positive fund balance will be restored through future ad valorem assessments.
IV. Detailed Notes on All Funds A. Cash and Investments
On March 5, 2008, the City Council formally adopted a revised comprehensive investment policy pursuant to Section 218.415, Florida Statutes that established permitted investments, asset allocation limits and issuer limits, credit ratings requirements and maturity limits to protect the City’s cash and investment assets. The City maintains a common cash and investment pool for the use of all funds. In addition, several separate accounts are maintained for specialty purposes including debt service, capital projects and trust funds. Cash and Cash Equivalents Cash and cash equivalents in the general investment portfolio and pension portfolio consist of cash and money market accounts held by banks that qualify as public depositories under the Florida Security for Public Deposits Act as required by Chapter 280, Florida Statutes in the amount of $22,161,051 and amounts placed with the State Board of Administration for participation in the Local Government Surplus Funds Trust Fund investment pool created by Section 218.405, Florida Statutes. This investment pool operates under investment guidelines established by Section 215.47, Florida Statutes.
Governmental activitiesGeneral Fund $ 324,291 Capital Projects Fund 355,813 Community Redevelopment Fund 99,865 Streets and Traffic Fund 279,233 Nonmajor governmental funds 164,645 Internal service funds 212,396
Business-type activitiesWater and Sewer Fund 2,192,406 Solid Waste Fund 178,578 Stormwater Fund 859,957 Nonmajor Business-type funds 45,124
$ 4,712,308
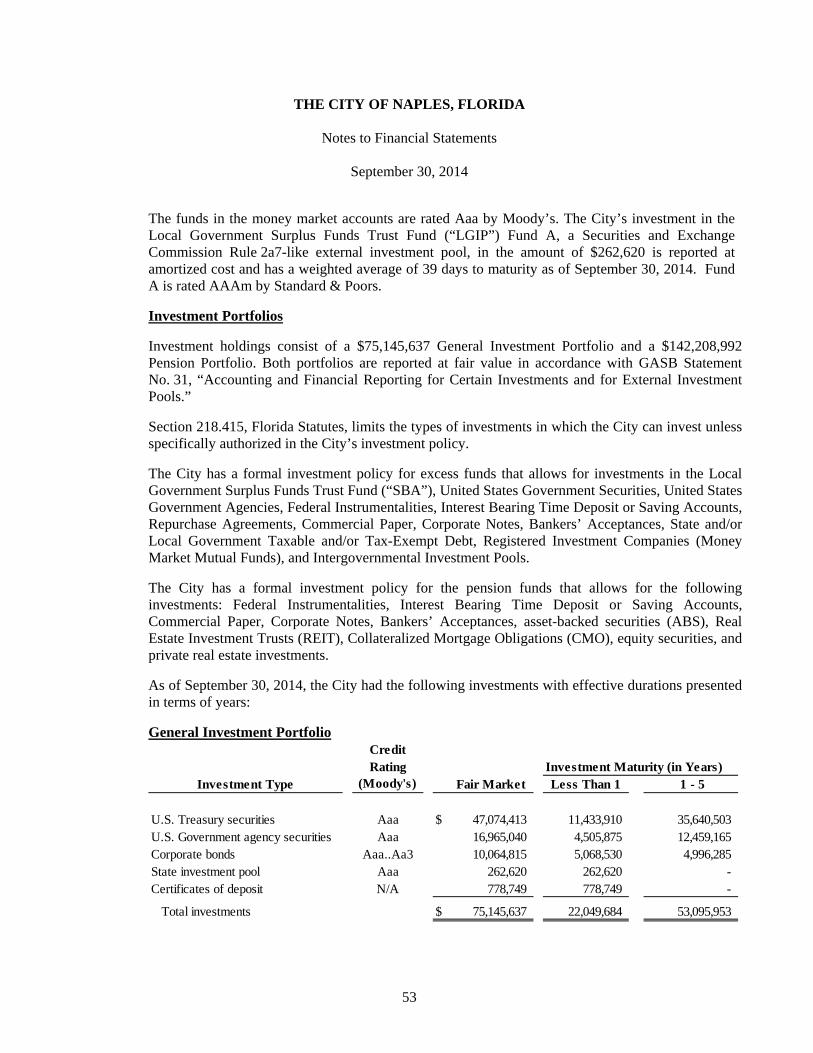
THE CITY OF NAPLES, FLORIDA
Notes to Financial Statements
September 30, 2014
53
The funds in the money market accounts are rated Aaa by Moody’s. The City’s investment in the Local Government Surplus Funds Trust Fund (“LGIP”) Fund A, a Securities and Exchange Commission Rule 2a7-like external investment pool, in the amount of $262,620 is reported at amortized cost and has a weighted average of 39 days to maturity as of September 30, 2014. Fund A is rated AAAm by Standard & Poors.
Investment Portfolios
Investment holdings consist of a $75,145,637 General Investment Portfolio and a $142,208,992 Pension Portfolio. Both portfolios are reported at fair value in accordance with GASB Statement No. 31, “Accounting and Financial Reporting for Certain Investments and for External Investment Pools.”
Section 218.415, Florida Statutes, limits the types of investments in which the City can invest unless specifically authorized in the City’s investment policy.
The City has a formal investment policy for excess funds that allows for investments in the Local Government Surplus Funds Trust Fund (“SBA”), United States Government Securities, United States Government Agencies, Federal Instrumentalities, Interest Bearing Time Deposit or Saving Accounts, Repurchase Agreements, Commercial Paper, Corporate Notes, Bankers’ Acceptances, State and/or Local Government Taxable and/or Tax-Exempt Debt, Registered Investment Companies (Money Market Mutual Funds), and Intergovernmental Investment Pools.
The City has a formal investment policy for the pension funds that allows for the following investments: Federal Instrumentalities, Interest Bearing Time Deposit or Saving Accounts, Commercial Paper, Corporate Notes, Bankers’ Acceptances, asset-backed securities (ABS), Real Estate Investment Trusts (REIT), Collateralized Mortgage Obligations (CMO), equity securities, and private real estate investments.
As of September 30, 2014, the City had the following investments with effective durations presented in terms of years:
General Investment Portfolio
CreditRating Investment Maturity (in Years)
Investment Type (Moody's) Fair Market Less Than 1 1 - 5
U.S. Treasury securities Aaa $ 47,074,413 11,433,910 35,640,503 U.S. Government agency securities Aaa 16,965,040 4,505,875 12,459,165 Corporate bonds Aaa..Aa3 10,064,815 5,068,530 4,996,285 State investment pool Aaa 262,620 262,620 - Certificates of deposit N/A 778,749 778,749 -
Total investments $ 75,145,637 22,049,684 53,095,953

THE CITY OF NAPLES, FLORIDA
Notes to Financial Statements
September 30, 2014
54
Pension Portfolio
Credit
Rating Investment Maturity (in Years)
Investment Type (Moody's) Fair Market Less Than 1 1 - 5 6 - 10 More than 10
U.S. Treasury securities Aaa $ 3,304,943 59,986 2,225,183 1,019,774 - U.S. Government agency securities Aaa..A3 4,799,280 - 1,028,410 1,344,564 2,426,306 Municipal obligations Aaa 663,889 - - - 663,889 Asset-backed securities Aaa..Baa3 4,546,188 12,706 1,665,608 855,699 2,012,175 Corporate bonds Aaa..Ba3 12,779,212 540,439 5,846,417 4,721,542 1,670,814
26,093,512 613,131$ 10,765,618$ 7,941,579$ 6,773,184$
Common stock/equity funds Not rated 89,270,862 Real estate investment trusts Not rated 5,855,465 Mutual funds Not rated 8,230,358 Alternative investements Not rated 12,758,795
Total investments $ 142,208,992
Interest Rate Risk In accordance with the City’s investment policy, the City has purchased investments with maturities that are less than or equal to three years in length. This policy reduces the City’s exposure to fluctuations in interest rates over the life of the investments. Also, although it is not the City’s policy to hold investments to maturity, most investments are purchased with the intent to do so. Liquidity Rate Risk
The City’s investment policy limits interest rate risk by attempting to match investment maturities with known cash needs and anticipated cash flow requirements. Unless matched to a specific cash flow requirement, such as a bond requirement, the City will not directly invest in securities maturing more than three years from the date of purchase.
Credit Risk
The City’s investment policy permits investments which are limited to credit quality ratings from nationally recognized rating agencies as follows:
State and/or local government taxable and/or tax-exempt debt, general obligation and/or revenue bonds, rated at least “A” by Moody’s and “A” by Standard & Poor’s for long-term debt.
Bankers’ acceptances issued by a domestic bank or a federally chartered domestic office of a foreign bank, which are eligible for purchase by the Federal Reserve System, at the time of purchase, the short-term paper is rated, at a minimum, “P-1” by Moody’s Investors Services and “A-1” by Standard & Poor’s. Additionally, the bank shall not be listed with any recognized credit watch information service.

THE CITY OF NAPLES, FLORIDA
Notes to Financial Statements
September 30, 2014
55
Custodial Credit Risk
The City’s investment policy pursuant to Section 218.415(18), Florida Statutes requires securities, with the exception of certificates of deposits, to be held with a third party custodian; and all securities purchased by, and all collateral obtained by the City should be properly designated as an asset of the City. The securities must be held in an account separate and apart from the assets of the financial institution. A third party custodian is defined as any bank depository chartered by the Federal Government, the State of Florida, or any other state or territory of the United States which has a branch or principal place of business in the State of Florida, or by a national association organized and existing under the laws of the United States which is authorized to accept and execute trusts and which is doing business in the State of Florida. Certificates of deposits will be placed in the provider’s safekeeping department for the term of the deposit.
As of September 30, 2014, the City’s investment portfolio was held with a third-party custodian as required by the City’s investment policy.
Concentration of Credit Risk
The City’s investment policy has established asset allocation limits on the following investments which are designed to reduce concentration of credit risk of the City’s investment portfolio.
All or 100% of available funds may be invested in United States Government Securities with the exception of Treasury Strips, which are limited to 10% of available funds, 50% of available funds may be invested in U.S. Government Agencies and Federal Instrumentalities, 25% of available funds may be invested in the SBA, prime commercial paper, bankers’ acceptances, State and Local Government debts or intergovernmental investment pools, 20% of available funds may be invested in repurchase agreements or money market mutual funds, 15% of available funds may be invested in corporate notes, and 10% of available funds may be invested in non-negotiable interest-bearing time certificates of deposit.

THE CITY OF NAPLES, FLORIDA
Notes to Financial Statements
September 30, 2014
56
As of September 30, 2014, the City’s General Investment Portfolio had the following issuer concentration based on fair value: General Concentration
Fair PercentageIssuer Value of Portfolio
Cash $ 9,429,299 10.04%Money Market 9,380,138 9.98%Local Government Surplus Funds Trust Fund ("SBA"), Fund A 262,620 0.28%Certificates of deposit 778,749 0.83%United States Treasury securities 47,074,413 50.10%United States Agency securities 16,965,040 18.07%Corporate bonds 10,064,815 10.71%
Total $ 93,955,074 The
City’s Pension Investment Policy has established asset allocation limits on the following investments which are designed to reduce concentration of credit risk of the City’s pension investment portfolio.
The pension investment policies target an asset allocation of 65% in equities, 30% in fixed income securities, and 5% in private real estate.
As of September 30, 2014, the City’s Pension Portfolio had the following issuer concentration based on fair value:
Pension Concentration
Fair PercentageIssuer Value of Portfolio
Cash $ 1,622 0.00%Money Market 3,349,992 2.30%U.S. Treasury securities 3,304,943 2.27%U.S. Government agency securities 4,799,280 3.30%Municipal obligations 663,889 0.47%Asset-backed securities 4,546,188 3.12%Corporate bonds 12,779,212 8.78%Common stock/equity funds 89,270,862 61.32%Real estate investment trusts 5,855,465 4.02%Mutual funds 8,230,358 5.65%Alternative investments 12,758,795 8.77%
Total $ 145,560,606

THE CITY OF NAPLES, FLORIDA
Notes to Financial Statements
September 30, 2014
57
Foreign Currency Risk
The City’s investment policy does not allow for investments in foreign currency; therefore, the City has no exposure foreign currency risk.
B. Property Taxes
The City’s property tax is levied each November 1, on the assessed value for all property located within the City. Assessed values are established by the Collier County Property Appraiser at fair values. At January 1, 2013, the assessed value of the principal taxing authority’s property upon which the 2013-2014 tax levy was based was $15.8 billion. The millage rate to finance general government services for the fiscal year ended September 30, 2014, was 1.1800 ($1.18 per $1,000 of assessed value). The assessed values at January 1, 2013, of the dependent special districts, East Naples Bay and Moorings Bay, were $423 million, and $1,477 million, respectively. In addition to the City’s millage rate and the voted debt service millage rate, 0.5000 ($0.5000 per $1,000 of assessed value) is added to the East Naples Bay dependent special district and 0.0252 ($0.0252 per $1,000 of assessed value) is added to the Moorings Bay dependent special district to finance capital projects for the fiscal year ended September 30, 2014.
Total ad valorem taxes collected for the year ended September 30, 2014, aggregated $17,568,817, net of cash discounts, of which $17,497,522 was designated for general government services, $501,332 for the Community Redevelopment Agency, $205,139 for East Naples Bay Taxing District, and $35,805 for the Moorings Bay Taxing District.
Taxes in the City are levied by the City Council. The millage levies are determined on the basis of estimates of revenue needs and the total taxable valuations within the jurisdiction of the City. As specified in Florida Statute 200.081, no aggregate ad valorem tax millage in excess of 10 mills on the dollar is levied against property of the City.
Each year on July 1, the total taxable valuation is established by the Collier County Property Appraiser for City property.
The property owners’ tax calendar is as follows:
Assessment date (date of property ownership) January 1Levy date November 1Due date March 31Delinquent date April 1Lien date June 1
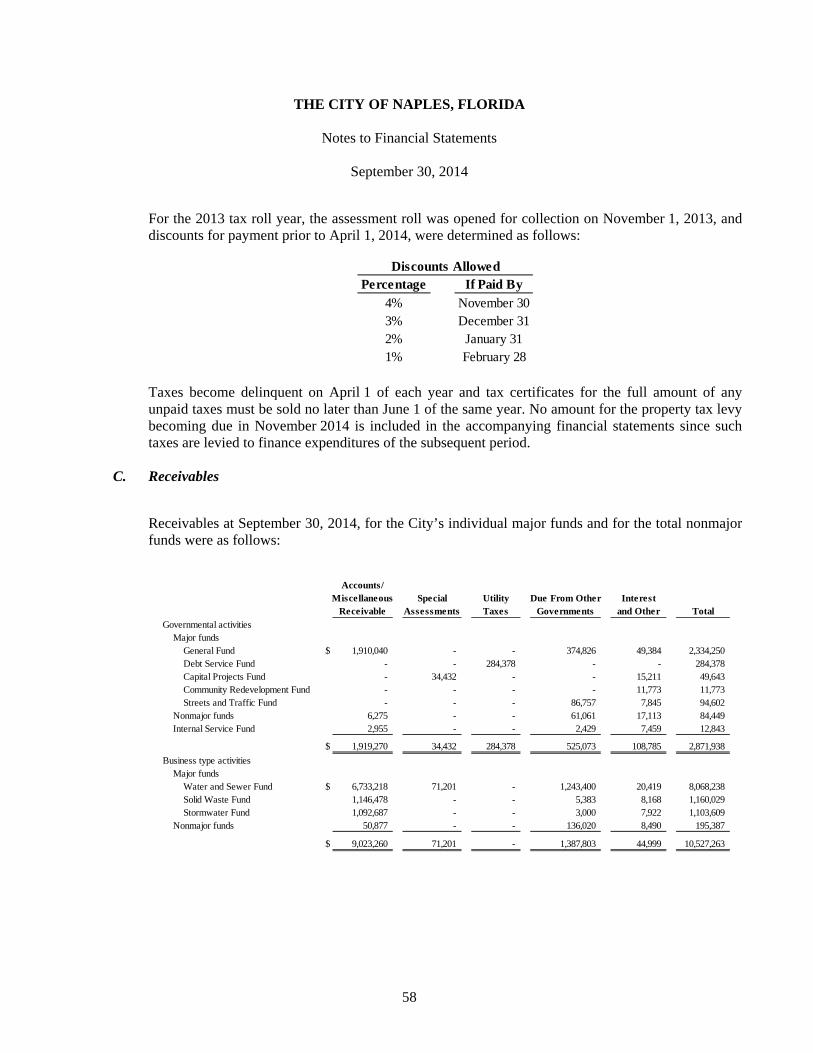
THE CITY OF NAPLES, FLORIDA
Notes to Financial Statements
September 30, 2014
58
For the 2013 tax roll year, the assessment roll was opened for collection on November 1, 2013, and discounts for payment prior to April 1, 2014, were determined as follows:
Percentage If Paid By4% November 303% December 312% January 311% February 28
Discounts Allowed
Taxes become delinquent on April 1 of each year and tax certificates for the full amount of any unpaid taxes must be sold no later than June 1 of the same year. No amount for the property tax levy becoming due in November 2014 is included in the accompanying financial statements since such taxes are levied to finance expenditures of the subsequent period.
C. Receivables
Receivables at September 30, 2014, for the City’s individual major funds and for the total nonmajor funds were as follows:
Accounts/Miscellaneous Special Utility Due From Other Interest
Receivable Assessments Taxes Governments and Other TotalGovernmental activities
Major fundsGeneral Fund $ 1,910,040 - - 374,826 49,384 2,334,250 Debt Service Fund - - 284,378 - - 284,378 Capital Projects Fund - 34,432 - - 15,211 49,643 Community Redevelopment Fund - - - - 11,773 11,773 Streets and Traffic Fund - - - 86,757 7,845 94,602
Nonmajor funds 6,275 - - 61,061 17,113 84,449 Internal Service Fund 2,955 - - 2,429 7,459 12,843
$ 1,919,270 34,432 284,378 525,073 108,785 2,871,938
Business type activitiesMajor funds
Water and Sewer Fund $ 6,733,218 71,201 - 1,243,400 20,419 8,068,238 Solid Waste Fund 1,146,478 - - 5,383 8,168 1,160,029 Stormwater Fund 1,092,687 - - 3,000 7,922 1,103,609
Nonmajor funds 50,877 - - 136,020 8,490 195,387
$ 9,023,260 71,201 - 1,387,803 44,999 10,527,263

THE CITY OF NAPLES, FLORIDA
Notes to Financial Statements
September 30, 2014
59
The above receivables are net of an allowance for uncollectible accounts which is based on historical trends and/or the age of the receivable. The allowances at September 30, 2014, are as follows:
Water and Sewer Fund $ 17,095Solid Waste Fund 2,646Stormwater Fund 6,813
$ 26,554
D. Capital Assets
Governmental Activities
A summary of changes in the capital assets of governmental activities for the year ended September 30, 2014, is as follows:
Balance Transfers/ BalanceGovernmental Activities October 1 Additions Retirements September 30
Capital assets not being depreciatedLand $ 16,377,103 41,174 - 16,418,277 Construction in progress 517,749 434,245 (517,749) 434,245
Total capital assets not being depreciated 16,894,852 475,419 (517,749) 16,852,522 Capital assets being depreciated
Buildings 37,995,529 200,291 (22,910) 38,172,910 Improvements other than buildings 35,331,800 1,935,653 (304,545) 36,962,908 Infrastructure 31,993,449 412,630 (670,175) 31,735,904 Equipment 17,542,278 2,486,236 (499,055) 19,529,459
Total capital assets being depreciated 122,863,056 5,034,810 (1,496,685) 126,401,181 Less accumulated depreciation for
Buildings (15,505,812) (1,182,891) 22,730 (16,665,973) Improvements other than buildings (22,322,075) (1,940,495) 303,187 (23,959,383) Infrastructure (22,075,955) (840,639) 670,175 (22,246,419) Equipment (12,871,319) (1,579,544) 486,337 (13,964,526)
Total accumulated depreciation (72,775,161) (5,543,569) 1,482,429 (76,836,301) Total capital assets being depreciated, net 50,087,895 (508,759) (14,256) 49,564,880
Total governmental capital assets, net $ 66,982,747 (33,340) (532,005) 66,417,402

THE CITY OF NAPLES, FLORIDA
Notes to Financial Statements
September 30, 2014
60
Depreciation expense was charged to the governmental activities as follows:
Governmental activitiesGeneral government $ 397,258 Public safety 1,159,917 Physical and economic environment 1,361,215 Transportation 1,072,492 Cultural and recreation 1,221,114 Internal service 331,573
Total depreciation expense, governmental activities $ 5,543,569
Business-type Activities
A summary of changes in capital assets of business-type activities for the year ended September 30, 2014, is as follows:
Balance Transfers/ BalanceWater and Sewer Fund October 1 Additions Retirements September 30
Capital assets not being depreciatedLand and easements $ 1,761,684 - - 1,761,684 Construction in progress 1,847,327 5,210,171 (1,805,122) 5,252,376
Total capital assets not being depreciated 3,609,011 5,210,171 (1,805,122) 7,014,060 Capital assets being depreciated
Buildings and utility plants 59,067,777 35,825 (2,349) 59,101,253 Improvements other than buildings 39,643,761 647,795 (42,420) 40,249,136 Infrastructure 70,467,978 4,847,065 (4,399) 75,310,644 Equipment 12,970,658 1,693,590 (562,816) 14,101,432
Total capital assets being depreciated 182,150,174 7,224,275 (611,984) 188,762,465 Less accumulated depreciation for
Buildings (28,464,901) (1,359,852) 2,349 (29,822,404) Improvements other than buildings (20,379,784) (1,927,265) 42,420 (22,264,629) Infrastructure (41,001,787) (2,054,565) 4,399 (43,051,953) Equipment (10,209,947) (1,069,639) 554,602 (10,724,984)
Total accumulated depreciation (100,056,419) (6,411,321) 603,770 (105,863,970) Total capital assets being depreciated, net 82,093,755 812,954 (8,214) 82,898,495
Water and sewer fund capital assets, net $ 85,702,766 6,023,125 (1,813,336) 89,912,555

THE CITY OF NAPLES, FLORIDA
Notes to Financial Statements
September 30, 2014
61
Balance Transfers/ BalanceSolid Waste Fund October 1 Additions Retirements September 30
Capital assets not being depreciatedLand $ 1,145,053 - - 1,145,053
Construction in progress 2,143,378 - (2,143,378) - Total capital assets not being depreciated 3,288,431 - (2,143,378) 1,145,053
Capital assets being depreciatedBuildings and utility plants 528,790 - - 528,790 Improvements other than buildings 1,159,833 3,241,233 - 4,401,066 Equipment 3,396,548 839,421 (211,238) 4,024,731
Total capital assets being depreciated 5,085,171 4,080,654 (211,238) 8,954,587 Less accumulated depreciation for
Buildings (338,390) (25,544) - (363,934) Improvements other than buildings (872,753) (45,469) - (918,222) Equipment (2,613,709) (421,444) 142,797 (2,892,356)
Total accumulated depreciation (3,824,852) (492,457) 142,797 (4,174,512) Total capital assets being depreciated, net 1,260,319 3,588,197 (68,441) 4,780,075
Solid waste fund capital assets, net $ 4,548,750 3,588,197 (2,211,819) 5,925,128
Balance Transfers/ BalanceStormwater Fund October 1 Additions retirements September 30
Capital assets not being depreciatedLand $ 234,866 - - 234,866 Construction in progress - 1,277,732 - 1,277,732
Total capital assets not being depreciated 234,866 1,277,732 - 1,512,598 Capital assets being depreciated
Infrastructure 23,844,986 784,547 - 24,629,533 Equipment 408,391 141,104 (7,742) 541,753
Total capital assets being depreciated 24,253,377 925,651 (7,742) 25,171,286 Less accumulated depreciation for
Infrastructure (10,948,970) (1,295,049) - (12,244,019) Equipment (125,198) (66,006) 7,742 (183,462)
Total accumulated depreciation (11,074,168) (1,361,055) 7,742 (12,427,481) Total capital assets being depreciated, net 13,179,209 (435,404) - 12,743,805
Stormwater fund capital assets, net $ 13,414,075 842,328 - 14,256,403

THE CITY OF NAPLES, FLORIDA
Notes to Financial Statements
September 30, 2014
62
Balance Transfers/ BalanceNonmajor Funds October 1 Additions Retirements September 30
Capital assets being depreciatedBuildings and utility plants $ 1,918,946 - (3,772) 1,915,174 Improvements other than buildings 6,743,277 141,860 - 6,885,137 Equipment 1,304,343 53,798 (14,223) 1,343,918
Total capital assets being depreciated 9,966,566 195,658 (17,995) 10,144,229 Less accumulated depreciation for
Buildings (1,433,637) (56,505) 3,772 (1,486,370) Improvements other than buildings (6,438,235) (75,894) - (6,514,129) Equipment (1,075,924) (81,527) 14,223 (1,143,228)
Total accumulated depreciation (8,947,796) (213,926) 17,995 (9,143,727) Total capital assets being depreciated, net 1,018,770 (18,268) - 1,000,502
Nonmajor fund capital assets, net $ 1,018,770 (18,268) - 1,000,502
Total business-type capital assets, net $ 104,684,361 10,435,382 (4,025,155) 111,094,588
Depreciation expense was charged to the business-type activities as follows:
Business-type activitiesWater and sewer $ 6,411,322 Solid waste 492,457 Stormwater 1,361,055 Other 213,926
Total depreciation expense, business-type activities $ 8,478,760

THE CITY OF NAPLES, FLORIDA
Notes to Financial Statements
September 30, 2014
63
E. Interfund Transactions
Advances from/to other funds are as follows:
Advances AdvancesReceivable Payable
Governmental activitiesMajor funds
General Fund $ 386,986 - Capital Projects Fund 332,004 - Community Redevelopment Fund - 83,008 Streets and Traffic Fund 28,026 -
Nonmajor FundEast Naples Bay District - 1,328,016
Business-type activitiesMajor funds
Water and Sewer Fund 332,004 - Stormwater Fund 332,004 -
$ 1,411,024 1,411,024
Advances to other funds represent funds provided to the Community Redevelopment Fund and the East Naples Bay District Fund used to construct certain infrastructure and dredging improvements and will be repaid according to set schedules. Advances expected to be repaid within one year are $40,168 and $148,174, respectively.
Transfers during the year consisted of the following:
Transfers In Transfers Out
Governmental activitiesMajor funds
General Fund $ 2,149,480 47,500 Debt Service Fund 982,770 2,212,000 Capital Projects Fund 2,687,456 150,000 Community Redevelopment Fund - 982,770
Nonmajor funds - 618,556 Internal service fund
Technology Services Fund 70,000 - Business-type activities
Major fundsWater and Sewer Fund 47,700 1,743,340 Solid Waste Fund - 358,440 Stormwater Fund 47,700 -
Nonmajor fundTennis Fund 127,500 -
$ 6,112,606 6,112,606

THE CITY OF NAPLES, FLORIDA
Notes to Financial Statements
September 30, 2014
64
Transfers into the General Fund in the amount of $2,101,780 were payments in-lieu of taxes from the Water and Sewer Fund and Solid Waste Fund and $47,700 from the East Naples Bay Fund for an interfund loan. The transfer into the Debt Service Fund from the Community Redevelopment Fund in the amount of $982,770 was for debt service payments. The transfer into the Capital Projects Fund included utility tax revenues from the Debt Service Fund in the amount of $2,212,000 used for capital expenditures. The transfer from the Capital Projects Fund into the Technology Services Fund in the amount of $70,000 and into the Tennis Fund in the amount of $80,000 was for capital expenditures. The transfer from the General Fund into the Tennis Fund in the amount of $47,500 was to help defer costs when members could not use the facility due to tournaments and public events.
F. Accounts Payable and Accrued Expenses
Accounts payable and accrued expenses at September 30, 2014, for the City’s individual major funds and for the total nonmajor funds were as follows:
Accounts AccruedPayable Payroll Total
Governmental activitiesMajor funds
General Fund $ 1,845,157 678,419 2,523,576 Debt Service Fund 8,336 - 8,336 Capital Projects Fund 402,292 - 402,292 Community Redevelopment Fund 110,950 19,120 130,070 Streets and Traffic Fund 279,233 11,646 290,879
Nonmajor funds 202,535 74,287 276,822 Internal Service Fund 245,174 33,218 278,392
$ 3,093,677 816,690 3,910,367
Business-type activitiesMajor funds
Water and Sewer Fund $ 2,729,487 203,565 2,933,052 Solid Waste Fund 195,131 58,585 253,716 Stormwater Fund 902,279 24,887 927,166
Nonmajor funds 70,127 29,165 99,292
$ 3,897,024 316,202 4,213,226

THE CITY OF NAPLES, FLORIDA
Notes to Financial Statements
September 30, 2014
65
G. Long-Term Obligations
Long-term liabilities of the governmental activities at September 30, 2014, are comprised of the following:
$ 11,536,000
Claims payable 3,581,403
Other post-employment benefits payable 1,469,946
Compensated absences payable 2,537,834
$ 19,125,183
Capital Improvement Refunding Revenue Note, Series 2013, issued in theamount of $13,830,000 (total note was $14,000,000) to currently refundthe outstanding principal amount of the Capital Improvement RefundingRevenue Note, Series 2010; monthly principal and interest paymentsrange from $137,340 to $156,096 through December 1, 2021. Non-advalorem revenues are pledged to secure this issue. Interest rate is 1.42%.
Changes in long-term obligations for governmental activities for the year ended September 30, 2014, are as follows:
Balance Balance Due in Governmental Activities October 1 Additions Retired September 30 One Year
Debt payable2013 Capital Improvement Refunding Revenue Note $ 13,025,000 - (1,489,000) 11,536,000 1,468,000
Total debt payable 13,025,000 - (1,489,000) 11,536,000 1,468,000
Claims payable 3,517,066 6,485,349 (6,421,012) 3,581,403 1,058,203 Other post-employment benefits payable 1,124,057 600,993 (255,104) 1,469,946 - Compensated absences payable 2,357,543 567,527 (387,236) 2,537,834 387,326
Total $ 20,023,666 7,653,869 (8,552,352) 19,125,183 2,913,529
Internal service funds predominantly serve the governmental funds. Accordingly, long-term liabilities for them are included as part of the above totals for governmental activities. At year-end $142,975 in compensated absences, $3,581,403 in claims payable, and $84,777 in other post-employment benefits reported in the internal service funds are included in the above amounts and will be liquidated by the internal service funds. The remaining compensated absences balances are made up by the following funds: General Fund $2,076,322, Building and Zoning Fund $179,967, Community Redevelopment Fund $10,872, Streets and Traffic Fund $127,697. These funds will be used to liquidate the compensated absences liability. The remaining other post-employment benefits payable will generally be liquidated by the General Fund.
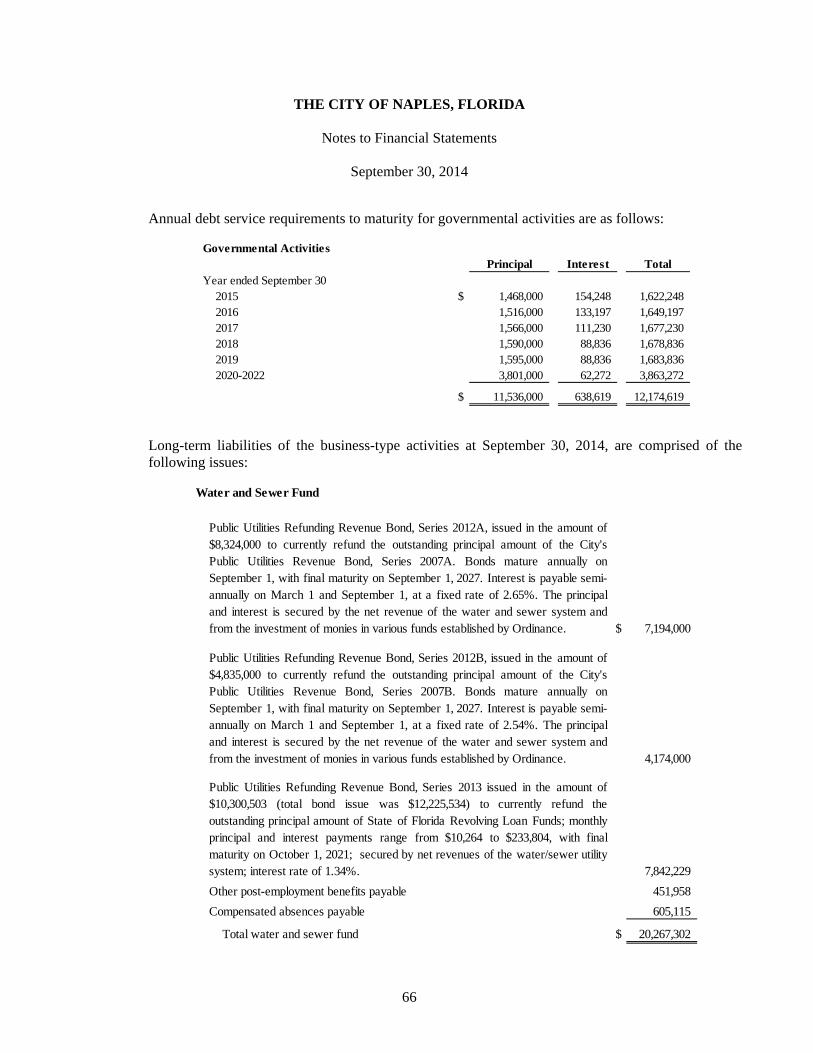
THE CITY OF NAPLES, FLORIDA
Notes to Financial Statements
September 30, 2014
66
Annual debt service requirements to maturity for governmental activities are as follows:
Governmental ActivitiesPrincipal Interest Total
Year ended September 302015 $ 1,468,000 154,248 1,622,248 2016 1,516,000 133,197 1,649,197 2017 1,566,000 111,230 1,677,230 2018 1,590,000 88,836 1,678,836 2019 1,595,000 88,836 1,683,836 2020-2022 3,801,000 62,272 3,863,272
$ 11,536,000 638,619 12,174,619
Long-term liabilities of the business-type activities at September 30, 2014, are comprised of the following issues:
Water and Sewer Fund
$ 7,194,000
4,174,000
7,842,229
Other post-employment benefits payable 451,958
Compensated absences payable 605,115
Total water and sewer fund $ 20,267,302
Public Utilities Refunding Revenue Bond, Series 2012B, issued in the amount of$4,835,000 to currently refund the outstanding principal amount of the City'sPublic Utilities Revenue Bond, Series 2007B. Bonds mature annually onSeptember 1, with final maturity on September 1, 2027. Interest is payable semi-annually on March 1 and September 1, at a fixed rate of 2.54%. The principaland interest is secured by the net revenue of the water and sewer system andfrom the investment of monies in various funds established by Ordinance.
Public Utilities Refunding Revenue Bond, Series 2013 issued in the amount of$10,300,503 (total bond issue was $12,225,534) to currently refund theoutstanding principal amount of State of Florida Revolving Loan Funds; monthlyprincipal and interest payments range from $10,264 to $233,804, with finalmaturity on October 1, 2021; secured by net revenues of the water/sewer utilitysystem; interest rate of 1.34%.
Public Utilities Refunding Revenue Bond, Series 2012A, issued in the amount of$8,324,000 to currently refund the outstanding principal amount of the City'sPublic Utilities Revenue Bond, Series 2007A. Bonds mature annually onSeptember 1, with final maturity on September 1, 2027. Interest is payable semi-annually on March 1 and September 1, at a fixed rate of 2.65%. The principaland interest is secured by the net revenue of the water and sewer system andfrom the investment of monies in various funds established by Ordinance.

THE CITY OF NAPLES, FLORIDA
Notes to Financial Statements
September 30, 2014
67
Solid Waste Fund
Other post-employment benefits payable $ 81,292
Compensated absences payable 163,599
Total solid waste fund $ 244,891
Stormwater Fund
$ 1,465,200
Other post-employment benefits payable 36,060
Compensated absences payable 46,591
Total stormwater fund $ 1,547,851
Public Utilities Refunding Revenue Bond, Series 2013 issued in the amount of$1,925,031 (total bond issue was $12,225,534) to currently refund the outstandingprincipal amount of State of Florida Revolving Loan Funds; monthly principal andinterest payments range from $1,918 to $43,695 with final maturity on October 1,2021; secured by net revenues of the stormwater utility system; interest rate is1.34%.
Nonmajor funds
$ 80,000
Other post-employment benefits payable 52,188
Compensated absences payable 76,807
Total nonmajor funds $ 208,995
Capital Improvement Refunding Revenue Note, Series 2013, issued in the amountof $170,000 for refunding the Capital Improvement Refunding Revenue Note,Series 2010, due in monthly installments of $5,000 through January 1, 2016. Non-ad valorem revenues are pledged to secure this issue. Interest rate is 1.42%.

THE CITY OF NAPLES, FLORIDA
Notes to Financial Statements
September 30, 2014
68
Changes in long-term obligations for business-type activities for the year ended September 30, 2014, are as follows:
Balance Balance Due in Business-Type Activities October 1 Additions Retired September 30 One Year
Debt payablePublic Utilities Refunding Revenue Bond, Series 2012A $ 7,653,000 - (459,000) 7,194,000 471,000 Public Utilities Refunding Revenue Bond, Series 2012B 4,442,000 - (268,000) 4,174,000 275,000 Public Utilities Refunding Revenue Bond, Series 2013 11,265,227 - (1,957,798) 9,307,429 1,984,194 2013 Capital Improvement Refunding Revenue Note 140,000 - (60,000) 80,000 60,000
Total debt payable 23,500,227 - (2,744,798) 20,755,429 2,790,194
Other post-employment benefits payable 486,860 267,310 (100,365) 653,805 - Compensated absences payable 694,560 336,575 (171,330) 859,805 185,000
Total $ 24,681,647 603,885 (3,016,493) 22,269,039 2,975,194
In accordance with bond covenants and Section 148 of the Internal Revenue Code, the City is required to rebate to the U.S. Treasury, every five years, arbitrage earnings on bond proceeds in excess of the bond yield. For the fiscal year ending September 30, 2014, no amounts were earned that will have to be rebated.
Annual debt service requirements to maturity for Water and Sewer Fund business-type activities are as follows:
Water and Sewer Fund
Principal Interest TotalYear ended September 30
2015 $ 2,417,762 391,475 2,809,237 2016 2,459,386 349,467 2,808,853 2017 2,502,073 306,661 2,808,734 2018 2,549,328 258,997 2,808,325 2019 1,141,761 227,401 1,369,162 2020-2024 5,169,919 753,748 5,923,667 2025-2027 2,970,000 156,376 3,126,376
$ 19,210,229 2,444,125 21,654,354
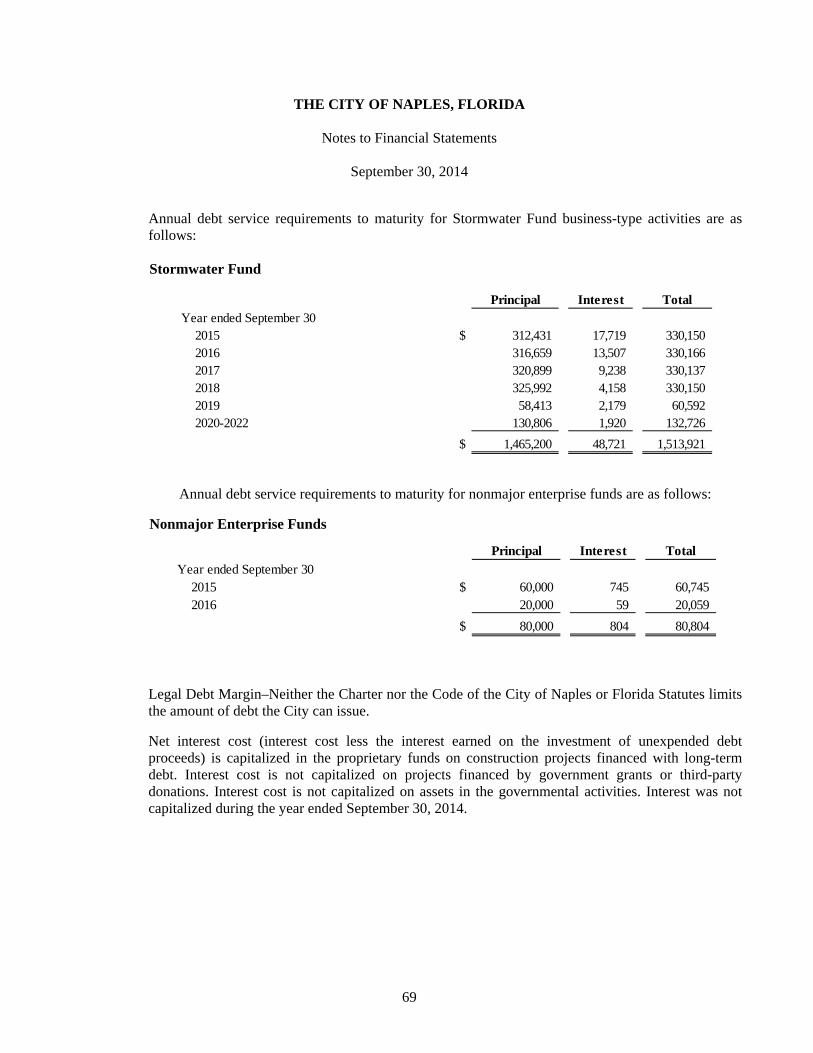
THE CITY OF NAPLES, FLORIDA
Notes to Financial Statements
September 30, 2014
69
Annual debt service requirements to maturity for Stormwater Fund business-type activities are as follows: Stormwater Fund
Principal Interest TotalYear ended September 30
2015 $ 312,431 17,719 330,150 2016 316,659 13,507 330,166 2017 320,899 9,238 330,137 2018 325,992 4,158 330,150 2019 58,413 2,179 60,592 2020-2022 130,806 1,920 132,726
$ 1,465,200 48,721 1,513,921
Annual debt service requirements to maturity for nonmajor enterprise funds are as follows:
Nonmajor Enterprise Funds
Principal Interest TotalYear ended September 30
2015 $ 60,000 745 60,745 2016 20,000 59 20,059
$ 80,000 804 80,804
Legal Debt Margin–Neither the Charter nor the Code of the City of Naples or Florida Statutes limits the amount of debt the City can issue.
Net interest cost (interest cost less the interest earned on the investment of unexpended debt proceeds) is capitalized in the proprietary funds on construction projects financed with long-term debt. Interest cost is not capitalized on projects financed by government grants or third-party donations. Interest cost is not capitalized on assets in the governmental activities. Interest was not capitalized during the year ended September 30, 2014.

THE CITY OF NAPLES, FLORIDA
Notes to Financial Statements
September 30, 2014
70
Defeased Debt On February 27, 2013, the City issued Public Utilities Refunding Revenue Bond, Series 2013 in the amount of $12,225,535 to currently refund all outstanding State Revolving Fund loans in the Water and Sewer Fund and Stormwater Fund. The proceeds were used to pay off these debt obligations and costs of issuance. The City completed the refunding to reduce its total debt service payments $502,973 and to obtain an economic gain (difference between the present value of the old debt and new debt service payments) of $499,144. The following issue has been defeased by refunding issues and remains outstanding:
Defeased BondsOutstanding
Water and Sewer Refunding Revenue Bonds, Series 2002 $ 1,290,000

THE CITY OF NAPLES, FLORIDA
Notes to Financial Statements
September 30, 2014
71
H. Fund Equity
The following is a summary of fund balances that were nonspendable, restricted, committed or assigned as of September 30, 2014:
Debt Capital Community Streets and OtherGeneral Service Projects Redevelopment Traffic Nonmajor
Fund Fund Fund Fund Fund Governmental Total
Fund balancesNonspendable
Inventory $ - - - - 30,241 - 30,241 Prepaid items 338,402 - - - - - 338,402 Advances to other funds 386,986 - 332,004 - 28,026 - 747,016
725,388 - 332,004 - 58,267 - 1,115,659 Restricted
Donations, various - - - - - 2,608,798 2,608,798 Capital projects - impact fees - - - - - 589,242 589,242 Sabal Bay litigation 13,791 - - - - - 13,791 Transportation - - - - 3,429,286 - 3,429,286 Police programs - - - - - 451,915 451,915 Economic development - - - 2,454,530 - - 2,454,530 Coral reef construction - - - - - 235,215 235,215 Building and zoning operations - - - - - 6,049,527 6,049,527
13,791 - - 2,454,530 3,429,286 9,934,697 15,832,304 Committed
Public arts program - - - - - 123,867 123,867 Emergency reserve 3,419,823 - - - - - 3,419,823 Capital projects - - 1,442,104 - - - 1,442,104 Contracts 124,612 - - - - - 124,612 Handicap accessibility 52,863 - - - - - 52,863 Economic development - - - - - 523,615 523,615 Land conservation - - - - - 9,183 9,183 Dredging projects - - - - - 1,098,102 1,098,102
3,597,298 - 1,442,104 - - 1,754,767 6,794,169 Assigned
Subsequent year's expenditures 252,857 - - - - - 252,857 Debt service - 2,147,586 - - - - 2,147,586 Encumbrances 40,275 - - - - - 40,275 Economic development - - - - - 55,591 55,591 Capital projects - - 3,759,775 - - - 3,759,775
293,132 2,147,586 3,759,775 - - 55,591 6,256,084
Unassigned 11,439,262 - - - - 240,769 11,680,031
Total fund balance $ 16,068,871 2,147,586 5,533,883 2,454,530 3,487,553 11,985,824 41,678,247
I. Employee Pension Plans
The City maintains three single-employer, defined benefit pension plans that cover its general, police, and fire employees, which represent substantially all of the City’s employees. The City also has two defined contribution 401(a) plans that cover management and serve as a supplement to all full time City employees except persons covered by the International Association of Firefighters (IAFF) or the Fraternal Order of Police (FOP).

THE CITY OF NAPLES, FLORIDA
Notes to Financial Statements
September 30, 2014
72
General Pension Plan (the “Plan”)
The Plan provides benefits for all full-time American Federation of State and Municipal Employees (AFSME) Union, Government Supervisor Association of Florida Office and Professional Employees International Union (OPEIU), and non-bargaining employees of the City. All retirement plan provisions, including benefits, eligibility, vesting, etc., are established by City Ordinance, the most recent of which is Ordinance 12-13142 which reinstated benefits for certain members previously reduced by the provisions of Ordinance 11-12951. The Plan Ordinance may be amended by City Council after public notice has been made, two public readings are conducted, and one public hearing is held. The Plan does not issue a stand-alone financial report and is not included in any other retirement system or entity’s financial report.
The current membership as of October 1, 2014, the date of the most recent actuarial valuation, is as follows:
Retirees and beneficiaries currently receiving benefits 239 Vested terminated employees 27 Active employees
Fully vested 142 Nonvested 159
Benefits are determined by category and length of service as follows:
The Plan is accounted for as a pension trust fund; therefore it is accounted for in substantially the same manner as a proprietary fund using the “economic resources” measurement focus and the accrual basis of accounting. Plan member contributions and employer contributions are recognized in the period in which contributions are due. Benefits and refunds are recognized when due and payable in accordance with terms of the Plan. Plan assets are valued at fair value for financial statement purposes.
Benefits Vesting
Normal retirement is at age 60 with 5 years of service or therule of 85 (when age plus service equals 85). For membershired after September 30, 2011, normal retirement is theearlier of age 65 with 8 years of credited service or thecompletion of 33 years of credited service regardless of age.Benefits are 2.50% of average final compensation (AFC)times years of service for each year of service prior toSeptember 30, 2011, plus 1.6% of AFC for each year ofcredited service after September 30, 2011. The earlyretirement benefit is reduced by 3% for each year that theearly retirement date precedes age 60, or for members hiredafter September 30, 2011, the early retirement benefit isreduced by 5% for each year that the early retirement dateprecedes age 65.
If hired prior to September 30, 2011 vesting is 100%. Ifhired after September 30, 2011 vesting is 100% aftereight years of creditable service; 0% prior to that.General pension employees hired after February 28,1995, have an effective start date six months afteremployment.

THE CITY OF NAPLES, FLORIDA
Notes to Financial Statements
September 30, 2014
73
As of September 30, 2014, there were no investments (other than U.S. Government or U.S. Government guaranteed obligations) in any one organization comprising 5% or more of the net position available for benefits. As of September 30, 2014, there was no investment type or similar relationships with any related party, including officers and employees of the Pension Plan, the sponsoring City of Naples, and organizations included in the reporting entity.
The City Council has established contribution requirements for the City and participating employees. These requirements may be amended by the City Council at any time by ordinance.
The Plan’s funding policy requires employees to contribute no less than 5% of compensation to the Plan on a pre-tax basis, or 3% for employees hired after September 30, 2011. This amount is fixed unless changed by ordinance. The City is required to make annual contributions that fluctuate according to the most recent actuarial valuation report, after deducting estimated contributions by members, investment earnings and all Plan expenses. Significant actuarial assumptions used to compute actuarially determined contribution requirements are the same as those used to compute the net pension obligation. The Plan prepares a valuation report annually, and the City’s contribution is adjusted accordingly. All costs of administering the Plan are paid from Plan assets.
Plan Disclosures Effective October 1, 2013, the Plan implemented the provisions of GASB Statement No. 67, Financial Reporting for Pension Plans – an amendment of GASB Statement No. 25, which significantly changed the disclosures required related to the Plans. The information disclosed below is presented in accordance with this new standard. The Plans do not issue separate financial statements.
Net Pension Liability of the City
The components of the net pension liability of the City at September 30, 2014, were as follows:
The required schedule of changes in the City’s net pension liability and related ratios immediately following the notes to the financial statements presents multiyear trend information about whether the value of plan assets is increasing or decreasing over time relative to the total pension liability.
Total pension liability 61,384,920$ Plan fiduciary net position (51,236,145) City's net pension liability 10,148,775$
Plan fiduciary net position as a percentage ofTotal pension liability 83.47%

THE CITY OF NAPLES, FLORIDA
Notes to Financial Statements
September 30, 2014
74
Actuarial assumptions. The total pension liability was determined by an actuarial valuation as of October 1, 2013 updated to September 30, 2014 using the following actuarial assumptions applied to all measurement periods. Inflation 3.0% Salary increases 4.0% to 6.0% Investment rate of return 7.5 % RP-2000 Sex-Distinct Healthy Mortality Table, projected to Valuation Date using Scale AA. Disabled lives are set forward 5 years. The long-term expected rate of return on pension plan investments was determined using a building-block method in which best-estimate ranges of expected future real rates of return (expected returns, net of pension plan investment expense and inflation) are developed for each major asset class. These ranges are combined to produce the long-term expected rate of return by weighting the expected future real rates of return by the target asset allocation percentage and by adding expected inflation. Best estimates of arithmetic real rates of return for each major asset class included in the pension plan's target asset allocation as of September 30, 2014 are summarized in the following table:
Long Term ExpectedAsset Class Real Rate of Return
Domestic Equity 7.80%International Equity 7.70%
Fixed Income 2.30%
Real Estate 6.90%Hedge Funds 5.10%
Discount rate. The discount rate used to measure the total pension liability was 7.50 percent. The projection of cash flows used to determine the discount rate assumed that plan member contributions will be made at the current contribution rate and that City contributions will be made at rates equal to the difference between actuarially determined contribution rates and the member rate. Based on those assumptions, the pension plan’s fiduciary net position was projected to be available to make all projected future benefit payments of current plan members. Therefore, the long-term expected rate of return on pension plan investments was applied to all periods of projected benefit payments to determine the total pension liability. Sensitivity of the net pension liability to changes in the discount rate. The following presents the net pension liability of the City, calculated using the discount rate of 7.50 percent, as well as what the City's net pension liability would be if it were calculated using a discount rate that is 1-percentage-point lower (6.50 percent) or 1-percentage-point higher (8.50 percent) than the current rate:

THE CITY OF NAPLES, FLORIDA
Notes to Financial Statements
September 30, 2014
75
Current1% Decrease Discount Rate 1% Increase
6.50% 7.50% 8.50%
City's net pension liability 16,470,722$ 10,148,775$ 5,263,245$ Actuarial valuations involve estimates of the value of reported amounts and assumptions about the probability of events far into the future, and actuarially determined amounts are subject to continual revision as results are compared to past expectations and new estimates are made about the future. Actuarial calculations reflect a long-term perspective. Calculations are based on the substantive plan in effect as October 1, 2013. Employer Disclosures Until the City implements the provisions of GASB Statement No. 68, Accounting and Financial Reporting for Pensions - an amendment of GASB Statement No. 27, effective July 1, 2014, the provisions of GASB Statement No. 27 continue to be followed in the financial statements from the employer perspective. The information disclosed below is presented in accordance with GASB Statement No. 27 and these measures and disclosed amounts differ from those used by the Plan under GASB Statement No. 67 as previously discussed. Annual Pension Cost and Net Pension Obligation: The annual required contribution, annual pension cost, and net pension obligation for fiscal year 2014 was determined as part of October 1, 2013 actuarial valuation. The chart below shows the components of the annual pension cost for the current year along with the percentage actually contributed by the City.
2014
Annual Required Contributions (ARC) $ 1,924,183
Interest on Net Pension Obligation (NPO) (76,433)
Adjustment to ARC 51,492
Annual Pension Cost (APC) 1,899,242
Contributions made 1,924,183
Increase (decrease) in NPO (24,941)
NPO at beginning of year (1,019,104)
NPO at end of year $ (1,044,045) The annual pension cost, actual contributions, and the net pension obligation for the current and previous two years are presented in the table below.

THE CITY OF NAPLES, FLORIDA
Notes to Financial Statements
September 30, 2014
76
Annual % of Net
Pension APC Pension
Year ending Cost (APC) Contributed Obligation
09/30/14 $ 1,899,242 101.3% (1,044,045)
09/30/13 1,854,472 101.6% (1,019,104)
09/30/12 1,638,218 101.7% (990,314)
As of the most recent valuation date, October 1, 2014, the funded status of the Plan was as follows:
The required schedule of funding progress immediately following the notes to the financial statements presents multiyear trend information about whether the actuarial value of plan assets is increasing or decreasing over time relative to the actuarial accrued liability. Actuarial valuations involve estimates of the value of reported amounts and assumptions about the probability of events far into the future, and actuarially determined amounts are subject to continual revision as results are compared to past expectations and new estimates are made about the future. Actuarial calculations reflect a long-term perspective. Calculations above are based on the substantive plan in effect as of October 1, 2014. The assumptions used in the October 1, 2014 actuarial valuation are as follows.
Actuarial Assumptions Funding Method Entry Age Actuarial Cost Method. Amortization Method Level Percentage of Pay, closed Remaining Amortization Period 30 years Actuarial Asset Valuation Method All assets are valued at market value with an
adjustment made to uniformly spread actuarial investment gains and losses (as measured by actual market value investment return against expected market value investment return) over a five-year period.
(6)(1) (2) (3) (5) UAAL as a
Actuarial Actuarial Actuarial Funded (4) Annual Percentage ofValuation Value Accrued Ratio Unfunded Covered Covered
Date of Assets Liability (AAL) (1)/(2) (1)-(2) Payroll Payroll
10/1/2014 46,476,025$ 63,417,479 73.29% 16,941,454$ 15,835,700 106.98%

THE CITY OF NAPLES, FLORIDA
Notes to Financial Statements
September 30, 2014
77
Inflation 3.00% Interest rate 7.50% per year, compounded annually, net of
investment related expenses. Projected Salary Increases 4.50% to 10.0% based on service There have been no plan changes since the prior actuarial valuation. Actuarial assumption/method changes since prior actuarial valuation include the following:
Mortality rates are based on the RP 2000 Sex-Distinct Healthy Mortality Table, projected to October 1, 2014, using Scale AA. The prior valuation projected rates to October 1, 2013, using Scale AA.
In conjunction with this valuation, the Board approved modifying the individual salary increase assumption to 6.0% for one to two years of service, 5.5% for three through nine years of service, 5.0% for 10-19 years of service, and 4% for greater than 20 years of service.
Police Officers’ Pension Plan (the “Plan”)
The Plan provides benefits for all full-time sworn police personnel of the City. All retirement plan provisions, including benefits, eligibility, vesting, etc., are established by City Ordinance, the most recent of which is Ordinance 12-13063. The Plan Ordinance may be amended by City Council after public notice has been made, two public readings are conducted, and one public hearing is held. The Plan does not issue a stand-alone financial report and is not included in any other retirement system or entity’s financial report.
The current membership as of October 1, 2014, the date of the most recent actuarial valuation, is as follows:
Retirees and beneficiaries currently receiving benefits 64 Vested terminated employees 16 DROP employees 5 Active employees
Fully vested 50 Nonvested 12
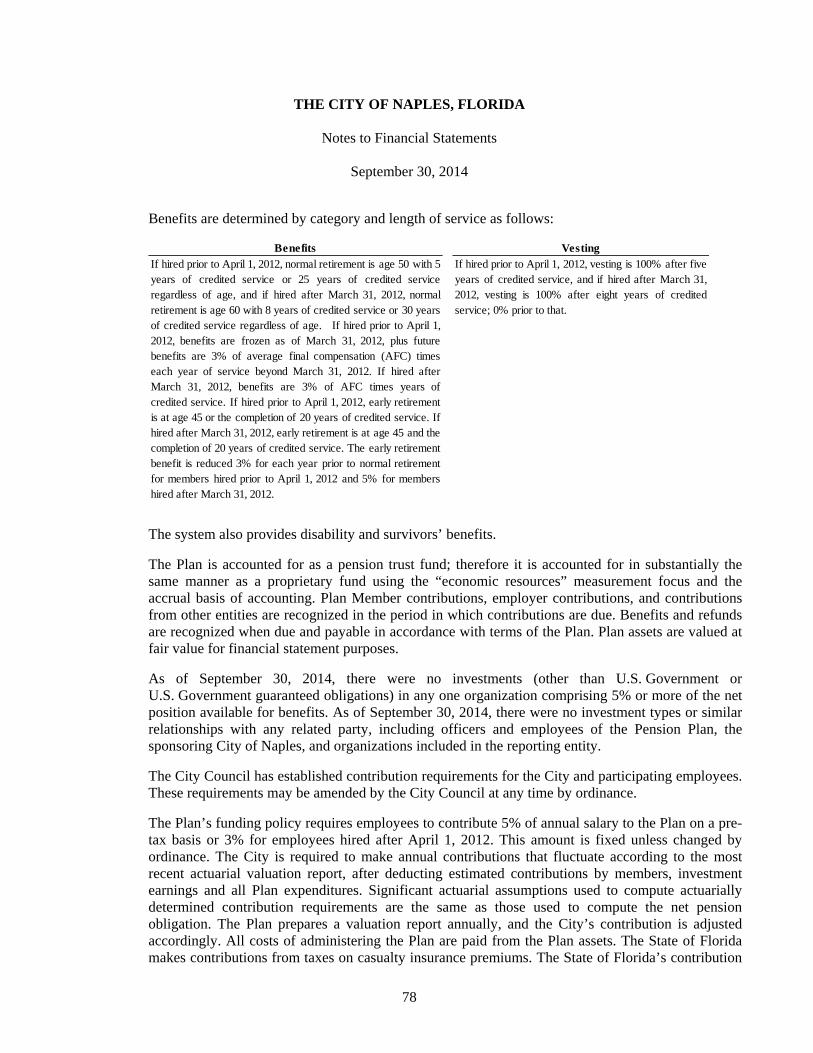
THE CITY OF NAPLES, FLORIDA
Notes to Financial Statements
September 30, 2014
78
Benefits are determined by category and length of service as follows:
Benefits VestingIf hired prior to April 1, 2012, normal retirement is age 50 with 5years of credited service or 25 years of credited serviceregardless of age, and if hired after March 31, 2012, normalretirement is age 60 with 8 years of credited service or 30 yearsof credited service regardless of age. If hired prior to April 1,2012, benefits are frozen as of March 31, 2012, plus futurebenefits are 3% of average final compensation (AFC) timeseach year of service beyond March 31, 2012. If hired afterMarch 31, 2012, benefits are 3% of AFC times years ofcredited service. If hired prior to April 1, 2012, early retirementis at age 45 or the completion of 20 years of credited service. Ifhired after March 31, 2012, early retirement is at age 45 and thecompletion of 20 years of credited service. The early retirementbenefit is reduced 3% for each year prior to normal retirementfor members hired prior to April 1, 2012 and 5% for membershired after March 31, 2012.
If hired prior to April 1, 2012, vesting is 100% after fiveyears of credited service, and if hired after March 31,2012, vesting is 100% after eight years of creditedservice; 0% prior to that.
The system also provides disability and survivors’ benefits.
The Plan is accounted for as a pension trust fund; therefore it is accounted for in substantially the same manner as a proprietary fund using the “economic resources” measurement focus and the accrual basis of accounting. Plan Member contributions, employer contributions, and contributions from other entities are recognized in the period in which contributions are due. Benefits and refunds are recognized when due and payable in accordance with terms of the Plan. Plan assets are valued at fair value for financial statement purposes.
As of September 30, 2014, there were no investments (other than U.S. Government or U.S. Government guaranteed obligations) in any one organization comprising 5% or more of the net position available for benefits. As of September 30, 2014, there were no investment types or similar relationships with any related party, including officers and employees of the Pension Plan, the sponsoring City of Naples, and organizations included in the reporting entity.
The City Council has established contribution requirements for the City and participating employees. These requirements may be amended by the City Council at any time by ordinance.
The Plan’s funding policy requires employees to contribute 5% of annual salary to the Plan on a pre-tax basis or 3% for employees hired after April 1, 2012. This amount is fixed unless changed by ordinance. The City is required to make annual contributions that fluctuate according to the most recent actuarial valuation report, after deducting estimated contributions by members, investment earnings and all Plan expenditures. Significant actuarial assumptions used to compute actuarially determined contribution requirements are the same as those used to compute the net pension obligation. The Plan prepares a valuation report annually, and the City’s contribution is adjusted accordingly. All costs of administering the Plan are paid from the Plan assets. The State of Florida makes contributions from taxes on casualty insurance premiums. The State of Florida’s contribution

THE CITY OF NAPLES, FLORIDA
Notes to Financial Statements
September 30, 2014
79
to the Police Officers’ Pension Plan for the year ended was $540,981. The City recognized these on-behalf payments from the State as revenues and expenditures in the governmental fund financial statements.
Plan Disclosures Effective October 1, 2013, the Plan implemented the provisions of GASB Statement No. 67, Financial Reporting for Pension Plans – an amendment of GASB Statement No. 25, which significantly changed the disclosures required related to the Plans. The information disclosed below is presented in accordance with this new standard. The Plans do not issue separate financial statements. Net Pension Liability of the City The components of the net pension liability of the City at September 30, 2014, were as follows:
The required schedule of changes in the City’s net pension liability and related ratios immediately following the notes to the financial statements presents multiyear trend information about whether the value of plan assets is increasing or decreasing over time relative to the total pension liability.
Total pension liability 59,661,030$ Plan fiduciary net position (42,468,243) City's net pension liability 17,192,787$
Plan fiduciary net position as a percentage ofTotal pension liability 71.18%

THE CITY OF NAPLES, FLORIDA
Notes to Financial Statements
September 30, 2014
80
Actuarial assumptions. The total pension liability was determined by an actuarial valuation as of October 1, 2013 updated to September 30, 2014 using the following actuarial assumptions applied to all measurement periods. Inflation 3.0% Salary increases 4.0% to 6.0% Investment rate of return 7.5 % RP-2000 Sex-Distinct Healthy Mortality Table, projected to Valuation Date using Scale AA. Disabled lives are set forward 5 years. The long-term expected rate of return on pension plan investments was determined using a building-block method in which best-estimate ranges of expected future real rates of return (expected returns, net of pension plan investment expense and inflation) are developed for each major asset class. These ranges are combined to produce the long-term expected rate of return by weighting the expected future real rates of return by the target asset allocation percentage and by adding expected inflation. Best estimates of arithmetic real rates of return for each major asset class included in the pension plan's target asset allocation as of September 30, 2014 are summarized in the following table:
Long Term ExpectedAsset Class Real Rate of Return
Domestic Equity 7.80%International Equity 7.70%
Fixed Income 2.30%
Real Estate 6.90%Hedge Funds 5.10%
Discount rate. The discount rate used to measure the total pension liability was 7.50 percent. The projection of cash flows used to determine the discount rate assumed that plan member contributions will be made at the current contribution rate and that City contributions will be made at rates equal to the difference between actuarially determined contribution rates and the member rate. Based on those assumptions, the pension plan’s fiduciary net position was projected to be available to make all projected future benefit payments of current plan members. Therefore, the long-term expected rate of return on pension plan investments was applied to all periods of projected benefit payments to determine the total pension liability.

THE CITY OF NAPLES, FLORIDA
Notes to Financial Statements
September 30, 2014
81
Sensitivity of the net pension liability to changes in the discount rate. The following presents the net pension liability of the City, calculated using the discount rate of 7.50 percent, as well as what the City's net pension liability would be if it were calculated using a discount rate that is 1-percentage-point lower (6.50 percent) or 1-percentage-point higher (8.50 percent) than the current rate:
Current1% Decrease Discount Rate 1% Increase
6.50% 7.50% 8.50%
City's net pension liability 24,255,006$ 17,192,787$ 11,657,177$ Actuarial valuations involve estimates of the value of reported amounts and assumptions about the probability of events far into the future, and actuarially determined amounts are subject to continual revision as results are compared to past expectations and new estimates are made about the future. Actuarial calculations reflect a long-term perspective. Calculations are based on the substantive plan in effect as October 1, 2013. Employer Disclosures Until the City implements the provisions of GASB Statement No. 68, Accounting and Financial Reporting for Pensions - an amendment of GASB Statement No. 27, effective July 1, 2014, the provisions of GASB Statement No. 27 continue to be followed in the financial statements from the employer perspective. The information disclosed below is presented in accordance with GASB Statement No. 27 and these measures and disclosed amounts differ from those used by the Plan under GASB Statement No. 67 as previously discussed. Annual Pension Cost and Net Pension Obligation: The annual required contribution, annual pension cost, and net pension obligation for fiscal year 2014 was determined as part of October 1, 2013 actuarial valuation. The chart below shows the components of the annual pension cost for the current year along with the percentage actually contributed by the City.

THE CITY OF NAPLES, FLORIDA
Notes to Financial Statements
September 30, 2014
82
2014
Annual Required Contributions (ARC) $ 2,213,443
Interest on Net Pension Obligation (NPO) (46,031)
Adjustment to ARC 29,228
Annual Pension Cost (APC) 2,196,640
Contributions made 2,213,443
Increase (decrease) in NPO (16,803)
NPO at beginning of year (613,749)
NPO at end of year $ (630,552)
The annual pension cost, actual contributions, and the net pension obligation for the current and previous two years are presented in the table below.
Annual % of Net
Pension APC Pension
Year ending Cost (APC) Contributed Obligation
09/30/14 $ 2,196,640 100.8% (630,552)
09/30/13 2,093,120 100.8% (613,749)
09/30/12 2,193,068 100.8% (596,410)
As of the most recent valuation date, October 1, 2014, the funded status of the Plan was as follows:
The required schedule of funding progress immediately following the notes to the financial statements presents multiyear trend information about whether the actuarial value of plan assets is increasing or decreasing over time relative to the actuarial accrued liability.
(6)(1) (2) (3) (5) UAAL as a
Actuarial Actuarial Actuarial Funded (4) Annual Percentage ofValuation Value Accrued Ratio Unfunded Covered Covered
Date of Assets Liability (AAL) (1)/(2) (1)-(2) Payroll Payroll
10/1/2014 38,734,162$ 59,913,480 64.65% 21,179,318$ 4,406,901 480.59%

THE CITY OF NAPLES, FLORIDA
Notes to Financial Statements
September 30, 2014
83
Actuarial valuations involve estimates of the value of reported amounts and assumptions about the probability of events far into the future, and actuarially determined amounts are subject to continual revision as results are compared to past expectations and new estimates are made about the future. Actuarial calculations reflect a long-term perspective. Calculations above are based on the substantive plan in effect as of October 1, 2014.
The assumptions used in the October 1, 2014 actuarial valuation are as follows.
Actuarial Assumptions Funding Method Entry Age Actuarial Cost Method. Amortization Method Level Percentage of Pay, closed Remaining Amortization Period 30 years Actuarial Asset Valuation Method All assets are valued at market value with an
adjustment made to uniformly spread actuarial investment gains and losses (as measured by actual market value investment return against expected market value investment return) over a five-year period.
Inflation 3.00% Interest rate 7.50% per year, compounded annually, net of
investment related expenses. Projected Salary Increases 4.50% to 10.0% based on service There have been no plan changes since the prior actuarial valuation. Actuarial assumption/method changes since prior actuarial valuation include the following:
Mortality rates are based on the RP 2000 Sex-Distinct Healthy Mortality Table, projected to October 1, 2014, using Scale AA. The prior valuation projected rates to October 1, 2013, using Scale AA.
The payroll growth assumption, utilized for purposes of amortizing the Unfunded Actuarial Accrued Liability, was lowered from 2.7% to 1.2% per year. This reduction complies with the requirements of Part VII of Chapter 112, Florida Statutes, whereby the use of a payroll growth assumption is limited to the Plan’s actual ten-year payroll growth average, determined as of the valuation date.
Firefighters’ Pension Plan (the “Plan”)
The Plan provides benefits for all full-time sworn fire personnel of the City. All retirement plan provisions, including benefits, eligibility, vesting, etc., are established by City Ordinance, the most recent of which is Ordinance 13-13283. The Plan Ordinance may be amended by City Council after public notice has been made, two public readings are conducted, and one public hearing is held. The Plan does not issue a stand-alone financial report and is not included in any other retirement system or entity’s financial report.

THE CITY OF NAPLES, FLORIDA
Notes to Financial Statements
September 30, 2014
84
The current membership as of October 1, 2014, the date of the most recent actuarial valuation, is as follows:
Retirees and beneficiaries currently receiving benefits 37 Vested terminated employees 5 DROP employees 6 Active employees
Fully vested 35 Nonvested 13
Benefits are determined by category and length of service as follows:
The system also provides disability and survivors’ benefits.
The Plan is accounted for as a pension trust fund; therefore it is accounted for in substantially the same manner as a proprietary fund using the “economic resources” measurement focus and the accrual basis of accounting. Plan member contributions, employer contributions, and contributions from other entities are recognized in the period in which contributions are due. Benefits and refunds are recognized when due and payable in accordance with terms of the Plan. Plan assets are valued at fair value for financial statement purposes.
As of September 30, 2014, there were no investments (other than U.S. Government or U.S. Government guaranteed obligations) in any one organization comprising 5% or more of the net position available for benefits. As of September 30, 2014, there were no investment types or similar
Benefits Vesting100% after 5 years of credited service for membershired prior to May 31, 2013, and 100% after 8 yearsof credited service for members hired after May 31,2013; 0% prior to that.
Normal retirement at age 55 with 5 years of creditedservice, age 50 with 20 years of credited service, or thecompletion of 25 years of credited service regardless ofage. For members hired after May 31, 2013, the normalretirement date is the earlier of age 55 with 8 years ofcredited service, or the completion of 25 years of creditedservice, regardless of age. Benefits are 4% of average final compensation (AFC) times years of service for each yearprior to May 31, 2013, plus 3% of AFC times years ofservice for each year of credited service after May 31,2013. The early retirement benefit is reduced 3% for eachyear prior to age 55 or the completion of 20 years ofcredited service for members hired prior to May 31, 2013,and for all other members early retirement is reduced foreach year early retirement precedes the earlier of age 55and 8 years of credited service, or the completion of 25years of credited of service, regardless of age.

THE CITY OF NAPLES, FLORIDA
Notes to Financial Statements
September 30, 2014
85
relationships with any related party, including officers and employees of the Pension Plan, the sponsoring City of Naples, and organizations included in the reporting entity.
The City Council has established contribution requirements for the City and participating employees. These requirements may be amended by the City Council at any time by ordinance.
The Plan’s funding policy requires employees to contribute 5% of annual salary to the Plan on a pre-tax basis or 3% for employees hired after May 31, 2014. This amount is fixed unless changed by ordinance. The City is required to make annual contributions that fluctuate according to the most recent actuarial valuation report, after deducting estimated contributions by members, investment earnings and all plan expenditures. Significant actuarial assumptions used to compute actuarially determined contribution requirements are the same as those used to compute the net pension obligation. The Plan prepares a valuation report annually, and the City’s contribution is adjusted accordingly. All costs of administering the Plan are paid from Plan assets. The State of Florida makes contributions from taxes on casualty insurance premiums. The State of Florida’s contribution to the Firefighters’ Pension Plan for the year ended September 30, 2014, was $871,999. The City recognized these on-behalf payments from the State as revenues and expenditures in the governmental fund financial statements.
Plan Disclosures Effective October 1, 2013, the Plan implemented the provisions of GASB Statement No. 67, Financial Reporting for Pension Plans – an amendment of GASB Statement No. 25, which significantly changed the disclosures required related to the Plans. The information disclosed below is presented in accordance with this new standard. The Plans do not issue separate financial statements.
Net Pension Liability of the City
The components of the net pension liability of the City at September 30, 2014, were as follows:
The required schedule of changes in the City’s net pension liability and related ratios immediately following the notes to the financial statements presents multiyear trend information about whether the value of plan assets is increasing or decreasing over time relative to the total pension liability.
Total pension liability 54,892,212$ Plan fiduciary net position (44,704,902) City's net pension liability 10,187,310$
Plan fiduciary net position as a percentage ofTotal pension liability 81.44%

THE CITY OF NAPLES, FLORIDA
Notes to Financial Statements
September 30, 2014
86
Actuarial assumptions. The total pension liability was determined by an actuarial valuation as of October 1, 2013 updated to September 30, 2014 using the following actuarial assumptions applied to all measurement periods. Inflation 3.0% Salary increases 4.0% to 6.0% Investment rate of return 7.5 % RP-2000 Sex-Distinct Healthy Mortality Table, projected to Valuation Date using Scale AA. Disabled lives are set forward 5 years. The long-term expected rate of return on pension plan investments was determined using a building-block method in which best-estimate ranges of expected future real rates of return (expected returns, net of pension plan investment expense and inflation) are developed for each major asset class. These ranges are combined to produce the long-term expected rate of return by weighting the expected future real rates of return by the target asset allocation percentage and by adding expected inflation. Best estimates of arithmetic real rates of return for each major asset class included in the pension plan's target asset allocation as of September 30, 2014 are summarized in the following table:
Long Term ExpectedAsset Class Real Rate of Return
Domestic Equity 7.80%International Equity 7.70%
Fixed Income 2.30%
Real Estate 6.90%Hedge Funds 5.10%
Discount rate. The discount rate used to measure the total pension liability was 7.50 percent. The projection of cash flows used to determine the discount rate assumed that plan member contributions will be made at the current contribution rate and that City contributions will be made at rates equal to the difference between actuarially determined contribution rates and the member rate. Based on those assumptions, the pension plan’s fiduciary net position was projected to be available to make all projected future benefit payments of current plan members. Therefore, the long-term expected rate of return on pension plan investments was applied to all periods of projected benefit payments to determine the total pension liability.

THE CITY OF NAPLES, FLORIDA
Notes to Financial Statements
September 30, 2014
87
Sensitivity of the net pension liability to changes in the discount rate. The following presents the net pension liability of the City, calculated using the discount rate of 7.50 percent, as well as what the City's net pension liability would be if it were calculated using a discount rate that is 1-percentage-point lower (6.50 percent) or 1-percentage-point higher (8.50 percent) than the current rate:
Current1% Decrease Discount Rate 1% Increase
6.50% 7.50% 8.50%
City's net pension liability 17,636,467$ 10,187,310$ 4,318,984$ Actuarial valuations involve estimates of the value of reported amounts and assumptions about the probability of events far into the future, and actuarially determined amounts are subject to continual revision as results are compared to past expectations and new estimates are made about the future. Actuarial calculations reflect a long-term perspective. Calculations are based on the substantive plan in effect as October 1, 2013. Employer Disclosures Until the City implements the provisions of GASB Statement No. 68, Accounting and Financial Reporting for Pensions - an amendment of GASB Statement No. 27, effective July 1, 2014, the provisions of GASB Statement No. 27 continue to be followed in the financial statements from the employer perspective. The information disclosed below is presented in accordance with GASB Statement No. 27 and these measures and disclosed amounts differ from those used by the Plan under GASB Statement No. 67 as previously discussed. Annual Pension Cost and Net Pension Obligation: The annual required contribution, annual pension cost, and net pension obligation for fiscal year 2014 was determined as part of October 1, 2013 actuarial valuation. The chart below shows the components of the annual pension cost for the current year along with the percentage actually contributed by the City.

THE CITY OF NAPLES, FLORIDA
Notes to Financial Statements
September 30, 2014
88
2014
Annual Required Contributions (ARC) $ 2,214,378
Interest on Net Pension Obligation (NPO) (32,576)
Adjustment to ARC 22,204
Annual Pension Cost (APC) 2,204,006
Contributions made 2,214,378
Increase (decrease) in NPO (10,372)
NPO at beginning of year (434,345)
NPO at end of year $ (444,717)
The annual pension cost, actual contributions, and the net pension obligation for the current and previous two years are presented in the table below.
Annual % of Net
Pension APC Pension
Year ending Cost (APC) Contributed Obligation
09/30/14 $ 2,204,006 100.5% (444,717)
09/30/13 2,699,020 100.5% (434,345)
09/30/12 2,434,516 100.5% (422,074)
As of the most recent valuation date, October 1, 2014, the funded status of the Plan was as follows:
The required schedule of funding progress immediately following the notes to the financial statements presents multiyear trend information about whether the actuarial value of plan assets is increasing or decreasing over time relative to the actuarial accrued liability.
(6)(1) (2) (3) (5) UAAL as a
Actuarial Actuarial Actuarial Funded (4) Annual Percentage ofValuation Value Accrued Ratio Unfunded Covered Covered
Date of Assets Liability (AAL) (1)/(2) (1)-(2) Payroll Payroll
10/1/2014 40,930,065$ 54,809,329 74.68% 13,879,264$ 3,055,169 454.29%

THE CITY OF NAPLES, FLORIDA
Notes to Financial Statements
September 30, 2014
89
Actuarial valuations involve estimates of the value of reported amounts and assumptions about the probability of events far into the future, and actuarially determined amounts are subject to continual revision as results are compared to past expectations and new estimates are made about the future. Actuarial calculations reflect a long-term perspective. Calculations above are based on the substantive plan in effect as of October 1, 2014.
The assumptions used in the October 1, 2014 actuarial valuation are as follows.
Actuarial Assumptions Funding Method Entry Age Actuarial Cost Method. Amortization Method Level Percentage of Pay, closed Remaining Amortization Period 30 years Actuarial Asset Valuation Method All assets are valued at market value with an
adjustment made to uniformly spread actuarial investment gains and losses (as measured by actual market value investment return against expected market value investment return) over a five-year period.
Inflation 3.00% Interest rate 7.50% per year, compounded annually, net of
investment related expenses. Projected Salary Increases 4.50% to 10.0% based on service There have been no plan changes since the prior actuarial valuation. Actuarial assumption/method changes since prior actuarial valuation include the following:
Mortality rates are based on the RP 2000 Sex-Distinct Health Mortality Table, projected to October 1, 2014, using Scale AA. The prior valuation projected rates to October 1, 2013, using Scale AA.
In conjunction with this valuation, the Board approved modifying the individual salary increase assumption to 6.0% for one to two years of service, 5.5% for three through nine years of service, 5.0% for 10-19 years of service, and 4% for greater than 20 years of service.
The “share plan” supplemental retirement benefit, effective October 1, 2009, created an individual share account for each active firefighter as of that date. This supplemental benefit is funded solely by the premium tax revenues received by the City. The initial amount allocated to the active members’ share accounts was $663,717. For all years beginning on and after October 1, 2009, all premium tax revenues received by the City in excess of $1,668,662 are allocated to the members’ individual share accounts. Effective January 1, 2011, and each January following, the individual share accounts for each active firefighter is credited or debited with earnings or losses at a rate equal to the Plan’s actual net rate of investment return for the preceding Plan year. A firefighter must attain 5 complete years of credited service to be entitled to receive a distribution of their accumulated account. At September 30, 2014, there was $795,104 in the share plan.

THE CITY OF NAPLES, FLORIDA
Notes to Financial Statements
September 30, 2014
90
Statements of Fiduciary Net Position and Statements of Changes in Fiduciary Net Position for the City’s defined benefit pension plans are as follows, as of and for the year ended September 30, 2014:
Statements of Fiduciary Net Position
General Police Officers' Firefighters’Pension Fund Pension Fund Pension Fund
AssetsCash and investments $ 1,240,447 1,079,516 1,031,651 Contributions receivable 22,191 558,225 888,317 Accrued interest - Investments, at fair value 50,018,833 40,980,519 42,979,282
Total assets 51,281,471 42,618,260 44,899,250 Liabilities
Accounts payable 30,201 138,257 183,348 Deferred contribution - - -
Total liabilities 30,201 138,257 183,348 Net position
Restricted for pension benefits $ 51,251,270 42,480,003 44,715,902

THE CITY OF NAPLES, FLORIDA
Notes to Financial Statements
September 30, 2014
91
Statements of Changes in Fiduciary Net Position
General Police Officers' Firefighters’Pension Fund Pension Fund Pension Fund
AdditionsContributions
Employee contributions $ 715,072 229,089 177,737 Employer contributions 1,945,282 1,672,462 1,342,378 Direct state contributions - 540,981 871,999
Total contributions 2,660,354 2,442,532 2,392,114 Investment earnings
Interest and dividend income 987,301 790,428 825,695 Net change in fair value of investments 5,140,879 4,232,721 4,396,674 Less investment expense (271,108) (218,263) (225,846)
Net investment earnings 5,857,072 4,804,886 4,996,523 Total additions 8,517,426 7,247,418 7,388,637
DeductionsBenefits paid 3,351,714 2,613,218 1,865,618 Refunds of contributions 536,142 9,763 45,874 General administration 142,904 75,114 65,535
Total deductions 4,030,760 2,698,095 1,977,027 Changes in net position 4,486,666 4,549,323 5,411,610
Net position, beginning of year 46,764,604 37,930,680 39,304,292
Net position, end of year $ 51,251,270 42,480,003 44,715,902
J. Employee Retirement Savings Plans
Supplemental Retirement Savings Plan
All Retirement Plan provisions, including benefits, eligibility, vesting, etc., are established by City Ordinance, the most recent of which is Ordinance 99-8642. The Plan Ordinance may be amended by the City Council after public notice has been made, two public readings are conducted and one public hearing held. The Supplemental Plan does not issue a stand-alone financial report and is not included in any other retirement system or entity’s financial report. Membership is voluntary and includes all full-time employees who have completed 6 months employment with the City. Persons rendering services on a contractual basis are excluded from participation in this plan, as well as temporary and seasonal employees and persons covered by the International Association of Firefighters (IAFF) or the Fraternal Order of Police (FOP).
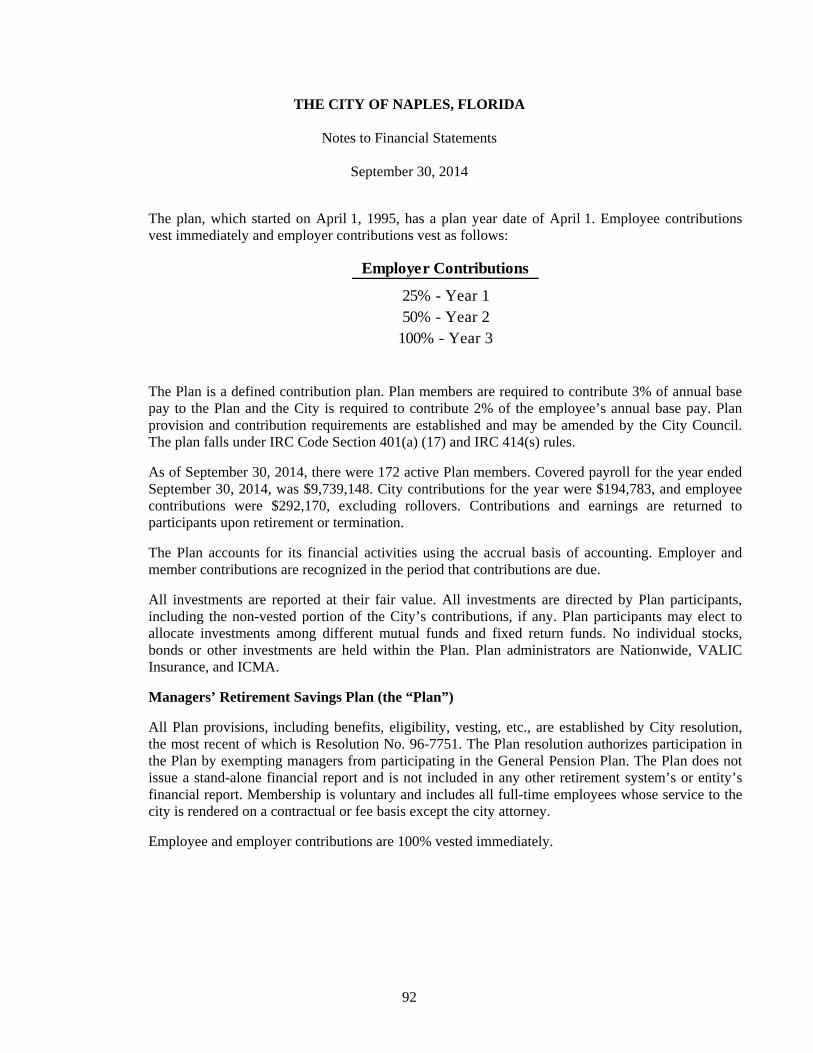
THE CITY OF NAPLES, FLORIDA
Notes to Financial Statements
September 30, 2014
92
The plan, which started on April 1, 1995, has a plan year date of April 1. Employee contributions vest immediately and employer contributions vest as follows:
Employer Contributions
25% - Year 150% - Year 2
100% - Year 3
The Plan is a defined contribution plan. Plan members are required to contribute 3% of annual base pay to the Plan and the City is required to contribute 2% of the employee’s annual base pay. Plan provision and contribution requirements are established and may be amended by the City Council. The plan falls under IRC Code Section 401(a) (17) and IRC 414(s) rules.
As of September 30, 2014, there were 172 active Plan members. Covered payroll for the year ended September 30, 2014, was $9,739,148. City contributions for the year were $194,783, and employee contributions were $292,170, excluding rollovers. Contributions and earnings are returned to participants upon retirement or termination.
The Plan accounts for its financial activities using the accrual basis of accounting. Employer and member contributions are recognized in the period that contributions are due.
All investments are reported at their fair value. All investments are directed by Plan participants, including the non-vested portion of the City’s contributions, if any. Plan participants may elect to allocate investments among different mutual funds and fixed return funds. No individual stocks, bonds or other investments are held within the Plan. Plan administrators are Nationwide, VALIC Insurance, and ICMA.
Managers’ Retirement Savings Plan (the “Plan”)
All Plan provisions, including benefits, eligibility, vesting, etc., are established by City resolution, the most recent of which is Resolution No. 96-7751. The Plan resolution authorizes participation in the Plan by exempting managers from participating in the General Pension Plan. The Plan does not issue a stand-alone financial report and is not included in any other retirement system’s or entity’s financial report. Membership is voluntary and includes all full-time employees whose service to the city is rendered on a contractual or fee basis except the city attorney.
Employee and employer contributions are 100% vested immediately.

THE CITY OF NAPLES, FLORIDA
Notes to Financial Statements
September 30, 2014
93
The Plan is a defined contribution plan. Plan members are required to contribute 3% of annual base pay to the Plan and the City is required to contribute 7% of the employee’s annual base pay. Plan provision and contribution requirements are established and may be amended by the City Council. The plan falls under IRC Code Section 401(a) (17) and IRC 414(s) rules. The City contributes 25% of the City Manager’s salary.
As of September 30, 2014, there were six active Plan members and four retired and terminated members who have maintained account balances. Covered payroll for the year ended September 30, 2014, was $943,274. City contributions for the year were $52,471, and employee contributions were $70,645.
The Plan accounts for its financial activities using the accrual basis of accounting. Employer and all member contributions are recognized in the period that the contributions are due.
All investments are reported at their fair value. All investments are directed by Plan participants, including the City’s contributions. Plan participants may elect to allocate investments among a variety of mutual funds holding U.S. Government and Agency securities, corporate and asset-backed bonds, common stocks and a variety of money market-type instruments. No individual stocks, bonds or other investments are held within the Plan. Plan administrators are ICMA Retirement Corporation and VALIC Insurance.
Statements of Fiduciary Net Position and Statements of Changes in Fiduciary Net Position for the City’s defined contribution pension plans are as follows, as of and for the year ended September 30, 2014:
Statements of Fiduciary Net Position
Supplemental Managers’General 401Pension Pension
AssetsInvestments, at fair value $ 7,049,238 1,181,120
Total assets 7,049,238 1,181,120 Net position
Restricted for pension benefits $ 7,049,238 1,181,120

THE CITY OF NAPLES, FLORIDA
Notes to Financial Statements
September 30, 2014
94
Statements of Changes in Fiduciary Net Position
Supplemental Managers’General 401Pension Pension
AdditionsContributions
Employee contributions $ 304,918 70,645 Employer contributions 194,783 52,471
Total contributions 499,701 123,116 Investment earnings
Interest and dividend income 110,637 4,124 Net change in fair value of investments 517,773 80,352 Less investment expense (21,441) (1,004)
Net investment earnings 606,969 83,472 Total additions 1,106,670 206,588
DeductionsRefunds of contributions 530,544 -
Total deductions 530,544 - Changes in net position 576,126 206,588
Net position, beginning of year 6,473,112 974,532
Net position, end of year $ 7,049,238 1,181,120
K. Other Post-Employment Benefits
Plan Description. The post-employment Health Care Benefits Plan (the “Plan”) is a single-employer defined benefit plan administered by the City. Pursuant to the provisions of Section 112.0801, Florida Statutes, former employees and eligible dependents who retire from the City may continue to participate in the City’s self-funded health and hospitalization plans for medical and prescription drug coverage, as well as participate in the life insurance group plan. The City subsidizes the premium rates paid by retirees by allowing them to participate in the plans at reduced or blended group (implicitly subsidized) premium rates for both active and retired employees. These rates provide an implicit subsidy for retirees because, on an actuarial basis, their current and future claims are expected to result in higher costs to the plan on average than those of active employees. Retirees who are eligible for Medicare are in a stand-alone plan with no cost to the employer. The Plan does not issue a stand-alone financial report.
As of October 1, 2013, the date of the most recent actuarial valuation, there were 30 retirees and eligible dependents receiving post-employment health care benefits along with 184 retirees participating in life insurance benefits.
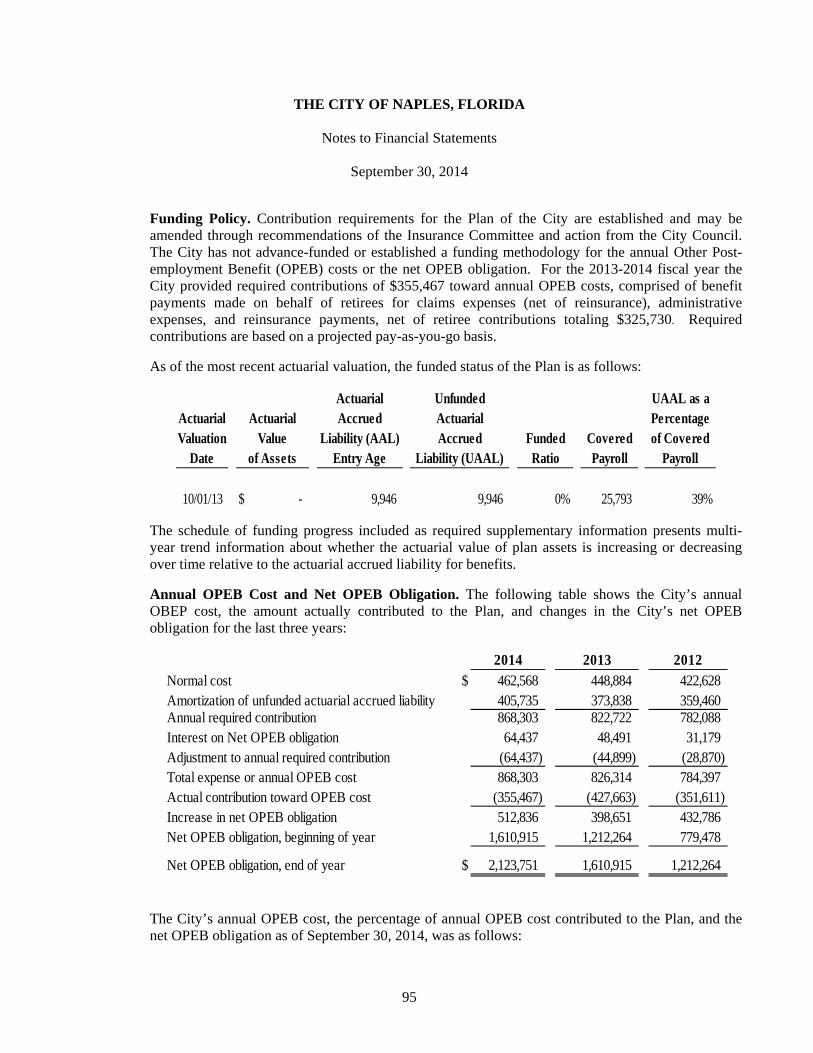
THE CITY OF NAPLES, FLORIDA
Notes to Financial Statements
September 30, 2014
95
Funding Policy. Contribution requirements for the Plan of the City are established and may be amended through recommendations of the Insurance Committee and action from the City Council. The City has not advance-funded or established a funding methodology for the annual Other Post-employment Benefit (OPEB) costs or the net OPEB obligation. For the 2013-2014 fiscal year the City provided required contributions of $355,467 toward annual OPEB costs, comprised of benefit payments made on behalf of retirees for claims expenses (net of reinsurance), administrative expenses, and reinsurance payments, net of retiree contributions totaling $325,730. Required contributions are based on a projected pay-as-you-go basis.
As of the most recent actuarial valuation, the funded status of the Plan is as follows:
Actuarial Unfunded UAAL as aActuarial Accrued Actuarial PercentageValuation Liability (AAL) Accrued Funded Covered of Covered
Date Entry Age Liability (UAAL) Ratio Payroll Payroll
10/01/13 $ - 9,946 9,946 0% 25,793 39%
Valueof Assets
Actuarial
The schedule of funding progress included as required supplementary information presents multi-year trend information about whether the actuarial value of plan assets is increasing or decreasing over time relative to the actuarial accrued liability for benefits.
Annual OPEB Cost and Net OPEB Obligation. The following table shows the City’s annual OBEP cost, the amount actually contributed to the Plan, and changes in the City’s net OPEB obligation for the last three years:
2014 2013 2012Normal cost $ 462,568 448,884 422,628 Amortization of unfunded actuarial accrued liability 405,735 373,838 359,460 Annual required contribution 868,303 822,722 782,088 Interest on Net OPEB obligation 64,437 48,491 31,179 Adjustment to annual required contribution (64,437) (44,899) (28,870) Total expense or annual OPEB cost 868,303 826,314 784,397 Actual contribution toward OPEB cost (355,467) (427,663) (351,611) Increase in net OPEB obligation 512,836 398,651 432,786 Net OPEB obligation, beginning of year 1,610,915 1,212,264 779,478
Net OPEB obligation, end of year $ 2,123,751 1,610,915 1,212,264
The City’s annual OPEB cost, the percentage of annual OPEB cost contributed to the Plan, and the net OPEB obligation as of September 30, 2014, was as follows:

THE CITY OF NAPLES, FLORIDA
Notes to Financial Statements
September 30, 2014
96
Annual % of NetOPEB AOC OPEB
Fiscal Year Ended Cost (AOC) Contributed Obligation
09/30/14 $ 868,303 40.94% 2,123,751 09/30/13 826,314 51.76% 1,610,915 09/30/12 784,397 44.83% 1,212,264
Other Post-employment BenefitsThree Year Trend Information
Actuarial Methods and Assumptions. Actuarial valuations of an ongoing plan involve estimates of the value of reported amounts and assumptions about the probability of occurrence of events far into the future. Examples include assumptions about future employment and termination, mortality, and the healthcare cost trends. Amounts determined regarding the funded status of the plan and the annual required contributions of the employer are subject to continual revision as actual results are compared with past expectations and new estimates are made about the future. Projections of benefits for financial reporting purposes are based on the substantive plan provisions, as understood by the employer and participating members, and include the types of benefits provided at the time of each valuation and the historical pattern of sharing of benefit costs between the employer and participating members. The actuarial methods and assumptions used include techniques that are designed to reduce the effects of short-term volatility in actuarial accrued liabilities and the actuarial value of assets, consistent with the long-term perspective of the calculations.
The City’s OPEB actuarial valuation for the 2013-2014 fiscal year used the entry age normal cost actuarial method to estimate the unfunded actuarial liability and to determine the annual required contribution. The amortization method is a level percentage, closed with a 26 year remaining amortization period. Although the OPEB liability is currently unfunded, the actuarial assumptions included a 4.0% rate of return on invested assets (including inflation at 3%), which is the City’s long-term expectation of investment returns under its investment policy. The actuarial assumptions included projected salary increases ranging from 4.5% to 10% per year (including inflation at 3%), and a 4% payroll growth assumption. The initial trend rate was 5% for the first year, 8% for the second year, and 5.35% for the ultimate trend rate.
L. Contingencies
1. Litigation
The City is a defendant in various lawsuits. Although the outcome of these lawsuits is not presently determinable, it is the opinion of the City that the resolution of these matters will not have a material adverse effect to the financial condition of the City.

THE CITY OF NAPLES, FLORIDA
Notes to Financial Statements
September 30, 2014
97
2. Federal and State Assistance Programs
Amounts received or receivable from grantor agencies are subject to audit and adjustment by grantor agencies, principally the federal government. Any disallowed claims, including amounts already collected, may constitute a liability of the applicable funds. The amount, if any, of expenditures which may be disallowed by the granting agencies cannot be determined at this time, although the City expects such amounts, if any, to be immaterial.
3. Self-insurance Funds
Since 1981, the City has been self-insured for workers’ compensation, general liability, automobile liability, and the deductible portion of all insured risks. The insurance program established by the City has not changed from fiscal year 2004 with the exception of increases in premiums.
The City is responsible up to specified limits for the self-insurance retention amounts and purchases excess insurance against catastrophic losses. Policies are maintained to provide coverage for all individual claims in excess of the amounts shown:
Property damage $ 25,000 Third party liability 200,000 Excess workers' compensation 350,000 Blanket bond and money and securities 25,000 Employee medical 125,000 Aggregate losses 2,000,000
The liability for unpaid claims is estimated based upon historical actual results adjusted for current economic trends. The estimated claims liability for all self-insured risks are reported as claims payable in the Risk Management Fund and Health Benefits Fund which include an estimate for incurred but not reported claims. In addition, reimbursements from excess loss reinsurers are netted against claims expenses, as applicable, in the Risk Management and Health Benefits Internal Service funds. During the current year, $80,377 and $911,219 of excess loss reimbursements were recorded in the Risk Management Fund and Health Benefits Fund, respectively.
Estimated liabilities for unpaid claims are based on estimates of pending claims and claims incurred but not reported at September 30, 2013. Estimates were based on an evaluation of claims pending and past experience. At September 30, 2014, $3,581,403 was accrued for estimated self-insurance claims. For the past three fiscal years, the City's insurance settlements have not exceeded the insurance coverage and there were no significant reductions in insurance coverage from the previous year.

THE CITY OF NAPLES, FLORIDA
Notes to Financial Statements
September 30, 2014
98
A reconciliation of estimated claims liabilities is as follows:
Risk HealthManagement Benefits Total
Balance September 30, 2012 $ 2,918,000 391,882 3,309,882 Current year claims incurred
and change in estimates 1,975,611 4,288,817 6,264,428 Claim payments (1,818,611) (4,238,633) (6,057,244) Balance September 30, 2013 3,075,000 442,066 3,517,066 Current year claims incurred
and change in estimates 2,293,700 4,191,649 6,485,349 Claim payments (2,214,700) (4,206,312) (6,421,012)
Balance September 30, 2014 $ 3,154,000 427,403 3,581,403
4. Construction Projects
At September 30, 2014, the City had the following commitments:
M. Subsequent Events
Events and transactions that occur after fiscal year-end but prior to issuance of the CAFR are subsequent events. The City has evaluated all subsequent events through the date the financial statements were available to be issued.
Contract CompletedProject Amount to Date Balance
Reclaimed Water Distribution System Expansion $ 3,356,917 1,468,137 1,888,780 Port Royal Dredging Project 1,308,973 465,384 843,589 Port Royal Pump Station Improvements 668,571 208,279 460,292 ASR Well No. 3 and monitoring Well No. 3 1,196,810 1,150,570 46,240 Royal Harbor Fire Flow Improvements 2,122,950 611,073 1,511,877 Public Works Pump Station Improvements 3,289,450 842,425 2,447,025 Waste Water Treatment Plant Reuse Pump Replacem 828,457 - 828,457 Replace Sewer Pump Station 6 302,938 116,039 186,899

99
REQUIRED SUPPLEMENTARY INFORMATION

CITY OF NAPLES, FLORIDAGeneral Fund
Schedule of Revenues, Expenditures and Changes in Fund Balances–Budget and ActualYear Ended September 30, 2014
VarianceOriginal Final With FinalBudget Budget Actual Budget
RevenuesTaxes
Ad valorem 17,211,650$ 17,211,650 17,497,522 285,872 Local communication and business 2,468,815 2,468,815 2,095,060 (373,755) Insurance premium tax 1,354,027 1,412,981 1,412,980 (1)
Permits, fees and assessments 3,462,600 3,462,600 3,692,334 229,734 Intergovernmental 3,254,300 3,257,674 3,564,434 306,760 Charges for services 1,608,793 1,608,793 1,779,310 170,517 Charges to other funds 3,112,270 3,112,270 3,358,100 245,830 Fines and forfeitures 179,300 179,300 183,258 3,958 Interest 138,000 138,000 85,038 (52,962) Miscellaneous 15,000 15,000 16,614 1,614
Total revenues 32,804,755 32,867,083 33,684,650 817,567
ExpendituresCurrent
General governmentMayor and City Council 369,888 386,990 370,407 16,583 City Attorney 524,567 524,567 485,691 38,876 City Clerk 538,981 538,981 556,126 (17,145) City Manager 575,506 575,506 553,134 22,372 Human resources 495,878 495,878 479,688 16,190 Planning 423,266 441,266 381,192 60,074 Finance 1,295,326 1,295,326 1,285,772 9,554 Nondepartmental 4,023,342 4,213,952 3,985,091 228,861
Total general government 8,246,754 8,472,466 8,097,101 375,365
Public safetyFire 8,564,366 8,907,233 9,028,710 (121,477) Police 11,781,942 11,814,508 11,620,714 193,794 Code inspections 153,670 153,670 154,007 (337)
Total public safety 20,499,978 20,875,411 20,803,431 71,980
Culture and recreationCommunity services 6,086,061 6,067,182 5,703,448 363,734
Total culture and recreation 6,086,061 6,067,182 5,703,448 363,734
(Continued)100

CITY OF NAPLES, FLORIDAGeneral Fund
Schedule of Revenues, Expenditures and Changes in Fund Balances–Budget and ActualYear Ended September 30, 2014
VarianceOriginal Final With FinalBudget Budget Actual Budget
Capital outlayGeneral government
Nondepartmental 9,200$ 34,217 31,894 2,323 Total capital outlay 9,200 34,217 31,894 2,323
Total expenditures 34,841,993 35,449,276 34,635,874 813,402
Deficiency of revenuesunder expenditures (2,037,238) (2,582,193) (951,224) 1,630,969
Other financing sources (uses)Transfers in 2,177,881 2,177,881 2,149,480 (28,401) Transfers out (47,500) (47,500) (47,500) - Proceeds from sale of capital assets 4,000 4,000 5,904 1,904
Total other financingsources 2,134,381 2,134,381 2,107,884 (26,497)
Change in fund balance 97,143 (447,812) 1,156,660 1,604,472
Fund balance, beginning of year 14,912,211 14,912,211 14,912,211 - Fund balance, end of year 15,009,354$ 14,464,399 16,068,871 1,604,472
101

CITY OF NAPLES, FLORIDACommunity Redevelopment Fund
Schedule of Revenues, Expenditures and Changes in Fund BalanceBudget and Actual
Year Ended September 30, 2014
VarianceOriginal Final With FinalBudget Budget Actual Budget
RevenuesTaxes
Ad valorem 527,720$ 527,720 501,332 (26,388) Intergovernmental 1,594,105 1,594,105 1,514,400 (79,705) Interest 18,000 18,000 14,819 (3,181) Miscellaneous - - 20 20
Total revenues 2,139,825 2,139,825 2,030,571 (109,254)
ExpendituresCurrent
Economic development 1,035,727 1,061,642 990,804 70,838 Capital outlay
Economic development - 2,356,000 78,720 2,277,280 Debt service
Interest - - 2,710 (2,710) Total expenditures 1,035,727 3,417,642 1,072,234 2,345,408
Excess of revenuesover expenditures 1,104,098 (1,277,817) 958,337 2,236,154
Other financing sources (uses)Transfers out (1,025,648) (1,025,648) (982,770) 42,878
Total other financing sources (uses) (1,025,648) (1,025,648) (982,770) 42,878
Changes in fund balance 78,450 (2,303,465) (24,433) 2,279,032
Fund balances, beginning of year 2,478,963 2,478,963 2,478,963 - Fund balances, end of year 2,557,413$ 175,498 2,454,530 2,279,032
102
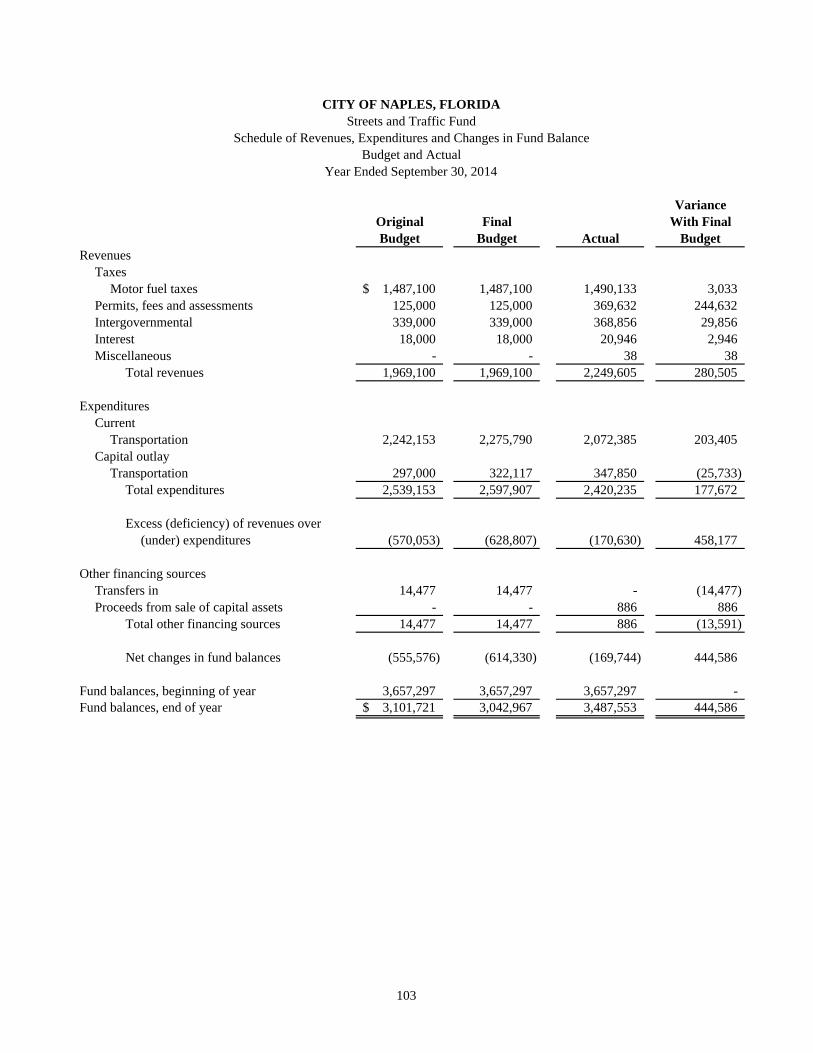
CITY OF NAPLES, FLORIDAStreets and Traffic Fund
Schedule of Revenues, Expenditures and Changes in Fund BalanceBudget and Actual
Year Ended September 30, 2014
VarianceOriginal Final With FinalBudget Budget Actual Budget
RevenuesTaxes
Motor fuel taxes 1,487,100$ 1,487,100 1,490,133 3,033 Permits, fees and assessments 125,000 125,000 369,632 244,632 Intergovernmental 339,000 339,000 368,856 29,856 Interest 18,000 18,000 20,946 2,946 Miscellaneous - - 38 38
Total revenues 1,969,100 1,969,100 2,249,605 280,505
ExpendituresCurrent
Transportation 2,242,153 2,275,790 2,072,385 203,405 Capital outlay
Transportation 297,000 322,117 347,850 (25,733) Total expenditures 2,539,153 2,597,907 2,420,235 177,672
Excess (deficiency) of revenues over(under) expenditures (570,053) (628,807) (170,630) 458,177
Other financing sourcesTransfers in 14,477 14,477 - (14,477) Proceeds from sale of capital assets - - 886 886
Total other financing sources 14,477 14,477 886 (13,591)
Net changes in fund balances (555,576) (614,330) (169,744) 444,586
Fund balances, beginning of year 3,657,297 3,657,297 3,657,297 - Fund balances, end of year 3,101,721$ 3,042,967 3,487,553 444,586
103

THE CITY OF NAPLES, FLORIDA
Notes to Required Supplementary Information
September 30, 2014
104
Basis of Presentation
The budget was adopted on a basis consistent with generally accepted accounting principles using the modified accrual basis of accounting. Expenditures were controlled at the fund level.
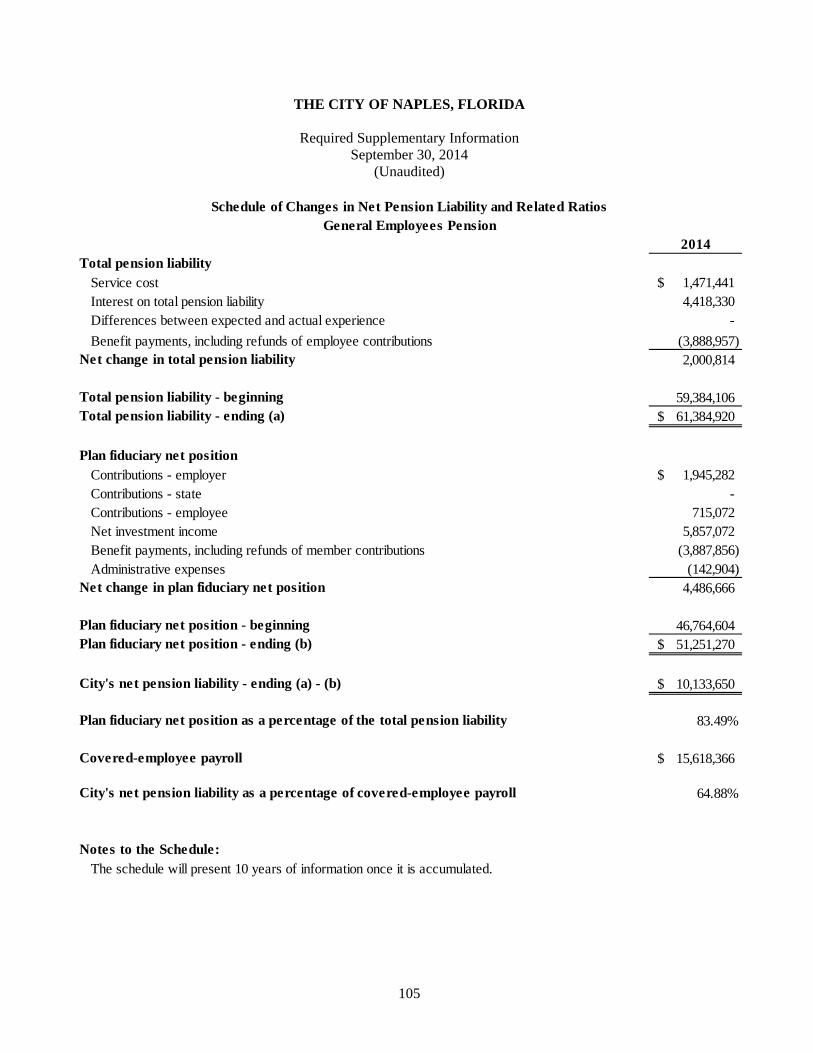
THE CITY OF NAPLES, FLORIDA
Required Supplementary Information September 30, 2014
(Unaudited)
105
Schedule of Changes in Net Pension Liability and Related RatiosGeneral Employees Pension
2014Total pension liability
Service cost 1,471,441$ Interest on total pension liability 4,418,330 Differences between expected and actual experience -
Benefit payments, including refunds of employee contributions (3,888,957) Net change in total pension liability 2,000,814
Total pension liability - beginning 59,384,106 Total pension liability - ending (a) 61,384,920$
Plan fiduciary net positionContributions - employer 1,945,282$ Contributions - state - Contributions - employee 715,072 Net investment income 5,857,072 Benefit payments, including refunds of member contributions (3,887,856) Administrative expenses (142,904)
Net change in plan fiduciary net position 4,486,666
Plan fiduciary net position - beginning 46,764,604 Plan fiduciary net position - ending (b) 51,251,270$
City's net pension liability - ending (a) - (b) 10,133,650$
Plan fiduciary net position as a percentage of the total pension liability 83.49%
Covered-employee payroll 15,618,366$
City's net pension liability as a percentage of covered-employee payroll 64.88%
Notes to the Schedule:The schedule will present 10 years of information once it is accumulated.

THE CITY OF NAPLES, FLORIDA
Required Supplementary Information September 30, 2014
(Unaudited)
106
Schedule of ContributionsGeneral Employees Pension
2014Actuarially determined contribution 1,924,183$ Contributions in relation to the actuarially determined contribution 1,945,282 Contribution deficiency (excess) (21,099)$
Covered employee payroll 15,618,366$ Contributions as a percentage of covered-employee payroll 12.46%
Notes to the Schedule:
Valuation Date October 1, 2012
Methods and assumptions used to determine contribution rates:Funding method: Entry age normal actuarial cost methodAmortization method: Level percentage of pay, closedRemaining amortization period: 30 yearsAsset valuation method:
Inflation: 3.0% per yearSalary increases: Years of Service Increase
1 to 3 10%
4 9%5 to 6 8%7 to 8 7%
9 to 19 6%20+ 5%
Interest Rate:
Payroll growth:
Retirement age:
Early retirement
The schedule will present 10 years of information once it is accumulated.
Actuarially determined contribution rates are calculated as of October 1, two years prior to the end of the fiscal year in which contributions are reported.
All assets are valued at market value with an adjustment made touniformly spread actuarial investment gains and losses over a five-year period.
7.5% per year, compounded annually, net of investment-related expenses4.2% per year for amortization of the Unfunded Actuarial Accrued Liability. The prior valuation utilized a 5% payroll growth assumption.For Members hired after September 30, 2011, 100% retirement isassumed at the earlier of 1) Age 65 with 8 years of CreditedService, and 2) the completion of 33 years of Credit Service,regardless of Age.Members are assumed to retire with an immediate subsidizedbenefit at the rate of 5% per year.

THE CITY OF NAPLES, FLORIDA
Required Supplementary Information September 30, 2014
(Unaudited)
107
Schedules of Pension Investment Returns
2014General Employees:Annual money-weighted rate of return, net of investment expenses 12.72%
Police:Annual money-weighted rate of return, net of investment expenses 12.60%
Fire:Annual money-weighted rate of return, net of investment expenses 12.67%
Notes to the Schedules:The schedules will present 10 years of information once it is accumulated.
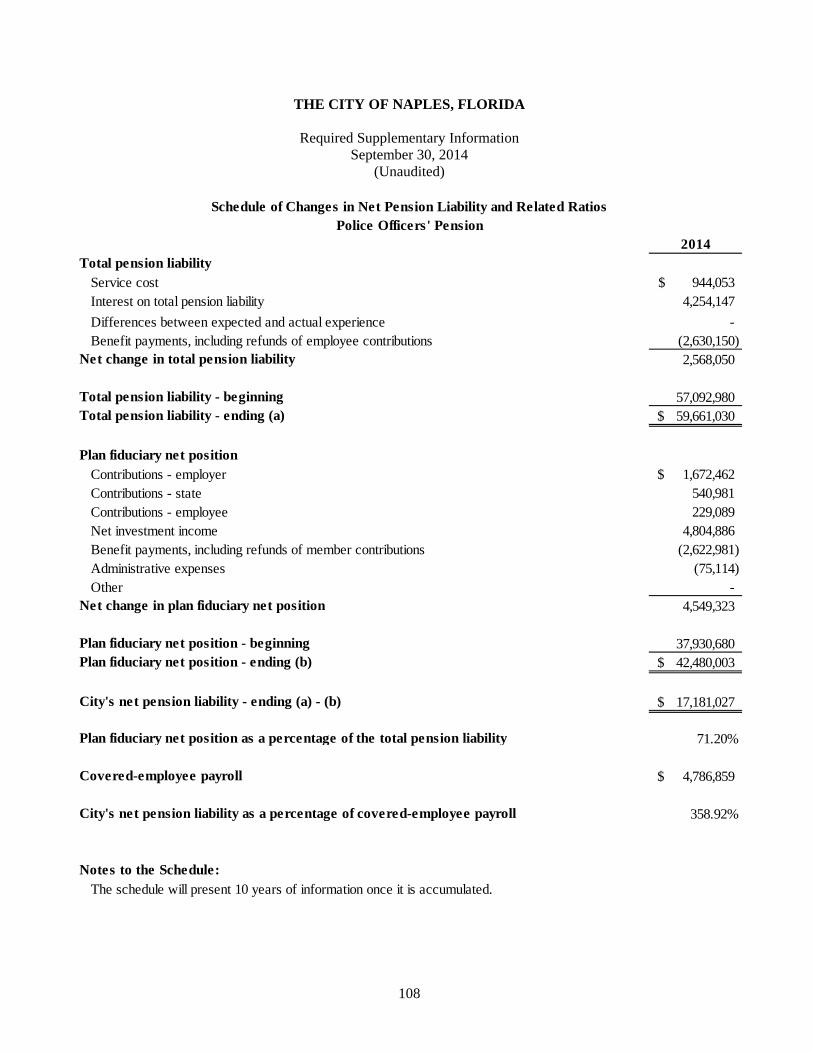
THE CITY OF NAPLES, FLORIDA
Required Supplementary Information September 30, 2014
(Unaudited)
108
Schedule of Changes in Net Pension Liability and Related RatiosPolice Officers' Pension
2014Total pension liability
Service cost 944,053$ Interest on total pension liability 4,254,147
Differences between expected and actual experience - Benefit payments, including refunds of employee contributions (2,630,150)
Net change in total pension liability 2,568,050
Total pension liability - beginning 57,092,980 Total pension liability - ending (a) 59,661,030$
Plan fiduciary net positionContributions - employer 1,672,462$ Contributions - state 540,981 Contributions - employee 229,089 Net investment income 4,804,886 Benefit payments, including refunds of member contributions (2,622,981) Administrative expenses (75,114) Other -
Net change in plan fiduciary net position 4,549,323
Plan fiduciary net position - beginning 37,930,680 Plan fiduciary net position - ending (b) 42,480,003$
City's net pension liability - ending (a) - (b) 17,181,027$
Plan fiduciary net position as a percentage of the total pension liability 71.20%
Covered-employee payroll 4,786,859$
City's net pension liability as a percentage of covered-employee payroll 358.92%
Notes to the Schedule:The schedule will present 10 years of information once it is accumulated.

THE CITY OF NAPLES, FLORIDA
Required Supplementary Information September 30, 2014
(Unaudited)
109
Schedule of ContributionsPolice Officers' Pension
2014Actuarially determined contribution 2,213,443$ Contributions in relation to the actuarially determined contribution 2,213,443 Contribution deficiency (excess) -$
Covered employee payroll 4,786,859$ Contributions as a percentage of covered-employee payroll 46.24%
Notes to the Schedule:Valuation Date October 1, 2012
Methods and assumptions used to determine contribution rates:
Funding method: Entry age normal actuarial cost methodAmortization method: Level percentage of pay, closedRemaining amortization period: 30 yearsAsset valuation method:
Inflation: 3.0% per year
Salary increases: Years of Service Increase1 10.0%
2-9 7.5%10-14 6.0%15-19 5.5%20+ 4.5%
Interest Rate:
Payroll growth:
Retirement age:
Early retirement
The schedules will present 10 years of information once it is accumulated.
All assets are valued at market value with an adjustment made touniformly spread actuarial investment gains and losses over a five-year period.
7.5% per year, compounded annually, net of investment-related expenses
Actuarially determined contribution rates are calculated as of October 1, two years prior to the end of the fiscal year in which contributions are reported.
4.7% per year for amortization of Unfunded Actuarial Accrued LiabilityThe earlier of age 60, age 55 with 10 years of credited service, or25 years of credited service, regardless of age. Also, anymember who has reached normal retirement is assumed tocontinue employement for one additional year. Hired prior to 4/1/2012: Earlier of 1) age 45 or 2) the completion of 20 years of credited service. Members are assumed to retire with an immediate subsidized benefit at the rate of 5% per year.

THE CITY OF NAPLES, FLORIDA
Required Supplementary Information September 30, 2014
(Unaudited)
110
Schedule of Changes in Net Pension Liability and Related RatiosFire Fighters' Pension
2014Total pension liability
Service cost 981,492$ Interest on total pension liability 3,896,369 Change in assumptions -
Benefit payments, including refunds of employee contributions (1,911,491) Net change in total pension liability 2,966,370
Total pension liability - beginning 51,925,842 Total pension liability - ending (a) 54,892,212$
Plan fiduciary net positionContributions - employer 1,342,378$ Contributions - state 871,999 Contributions - employee 177,737 Net investment income 4,996,523 Benefit payments, including refunds of member contributions (1,911,492) Administrative expenses (65,535)
Net change in plan fiduciary net position 5,411,610
Plan fiduciary net position - beginning 39,304,292 Plan fiduciary net position - ending (b) 44,715,902$
City's net pension liability - ending (a) - (b) 10,176,310$
Plan fiduciary net position as a percentage of the total pension liability 81.46%
Covered-employee payroll 3,573,306$
City's net pension liability as a percentage of covered-employee payroll 284.79%
Notes to the Schedule:The schedule will present 10 years of information once it is accumulated.

THE CITY OF NAPLES, FLORIDA
Required Supplementary Information September 30, 2014
(Unaudited)
111
Schedule of ContributionsFire Fighters' Pension
2014
Actuarially determined contribution 2,214,377$ Contributions in relation to the actuarially determined contribution 2,214,377 Contribution deficiency (excess) -$
Covered employee payroll 3,573,306$ Contributions as a percentage of covered-employee payroll 61.97%
Notes to the Schedule:Valuation Date October 1, 2012
Methods and assumptions used to determine contribution rates:Funding method: Entry age normal actuarial cost methodAmortization method: Level percentage of pay, closedRemaining amortization period: 30 years Asset valuation method:
Inflation: 3.0% per yearSalary increases: Years of Service Increase
1 10.0%2-9 7.5%
10-14 6.0%15-19 5.5%20+ 4.5%
Interest Rate:
Payroll growth:
Post Retirement COLA:
Retirement age:
Early retirement
The schedules will present 10 years of information once it is accumulated.
4.1% per year for amortization of the Unfunded Actuarial Accrued Liability.
Actuarially determined contribution rates are calculated as of October 1, two years prior to the end of the fiscal year in which contributions are reported.
The Actuarial Value of Assets utilizes a five-year smoothingmethodology. The annual difference between expected and actualinvestment earnings (Market Value, net of investment-relatedexpenses), is phased-in over a five-year period.
3% per year at beginning at age 50 for Service Retirees and surviving Beneficiaries. No COLA for Disability or Vested, Terminated Members.Earlier of 1) age 55, or 2) the completion of 25 years of creditedservice, regardless of age, or 3) the attainment of age 50 with 20years of credited service.Attainment of age 50, regardless of years of credited service. Members are assumed to retire with an immediate subsidized benefit at the rate of 5% per year.
7.5% per year, compounded annually, net of investment-related expenses
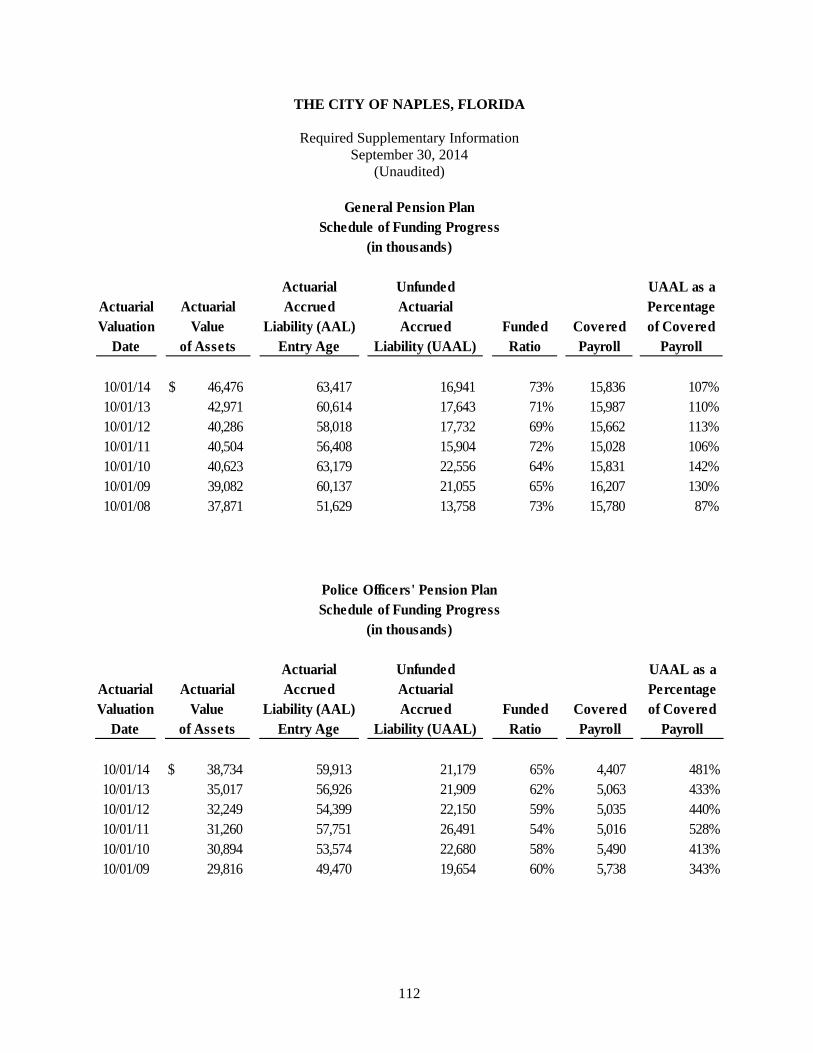
THE CITY OF NAPLES, FLORIDA
Required Supplementary Information September 30, 2014
(Unaudited)
112
Actuarial Unfunded UAAL as aActuarial Accrued Actuarial PercentageValuation Liability (AAL) Accrued Funded Covered of Covered
Date Entry Age Liability (UAAL) Ratio Payroll Payroll
10/01/14 $ 46,476 63,417 16,941 73% 15,836 107%10/01/13 42,971 60,614 17,643 71% 15,987 110%10/01/12 40,286 58,018 17,732 69% 15,662 113%10/01/11 40,504 56,408 15,904 72% 15,028 106%10/01/10 40,623 63,179 22,556 64% 15,831 142%10/01/09 39,082 60,137 21,055 65% 16,207 130%10/01/08 37,871 51,629 13,758 73% 15,780 87%
General Pension PlanSchedule of Funding Progress
(in thousands)
ActuarialValue
of Assets
Actuarial Unfunded UAAL as aActuarial Accrued Actuarial PercentageValuation Liability (AAL) Accrued Funded Covered of Covered
Date Entry Age Liability (UAAL) Ratio Payroll Payroll
10/01/14 $ 38,734 59,913 21,179 65% 4,407 481%10/01/13 35,017 56,926 21,909 62% 5,063 433%10/01/12 32,249 54,399 22,150 59% 5,035 440%10/01/11 31,260 57,751 26,491 54% 5,016 528%10/01/10 30,894 53,574 22,680 58% 5,490 413%10/01/09 29,816 49,470 19,654 60% 5,738 343%
of AssetsValue
Actuarial
(in thousands)Schedule of Funding ProgressPolice Officers' Pension Plan

THE CITY OF NAPLES, FLORIDA
Required Supplementary Information September 30, 2014
(Unaudited)
113
Actuarial Unfunded UAAL as aActuarial Accrued Actuarial PercentageValuation Liability (AAL) Accrued Funded Covered of Covered
Date Entry Age Liability (UAAL) Ratio Payroll Payroll
10/01/14 $ 40,930 54,809 13,879 75% 3,055 454%10/01/13 36,452 51,832 15,380 70% 3,601 427%10/01/12 32,388 53,780 21,392 60% 3,545 603%10/01/11 29,408 51,166 21,758 57% 3,640 598%10/01/10 28,280 48,047 19,767 59% 3,890 508%
Valueof Assets
Fire Pension PlanSchedule of Funding Progress
(in thousands)
Actuarial
Actuarial Unfunded UAAL as aActuarial Accrued Actuarial PercentageValuation Liability (AAL) Accrued Funded Covered of Covered
Date Entry Age Liability (UAAL) Ratio Payroll Payroll
10/01/13 $ - 9,946 9,946 0% 25,793 39%10/01/11 - 9,517 9,517 0% 24,449 39%10/01/09 - 6,690 6,690 0% 23,317 29%
Valueof Assets
Other Post-employment BenefitsSchedule of Funding Progress
(in thousands)
Actuarial

114
This page intentionally left blank.
115
Nonmajor Governmental Funds
Special Revenue Funds
Special revenue funds are used to account for the proceeds of specific revenue sources that are legally restricted to expenditure for specified purposes. Building and Zoning Fund–To account for the activities related to the construction industry in the City. Community Development Block Grant–To account for Federal grants received from the U.S. Department of Housing and Urban Development for home improvement grants for qualified recipients, and other community improvement projects in qualifying areas of the City. Baker Park Fund–To account for receipts and disbursements related to the design and construction of the new park located on the Gordon River. Improvement Fund–To account for donations from private individuals for specific City projects. Public Arts Fund–To account for donations from private individuals for specific art in public places. Grants Fund–To account for various grant activity. Confiscated Properties Fund–To account for monies received pursuant to sales of confiscated properties. Business Improvement District Fund–To account for receipt and disbursement of monies used for the purpose of stabilizing and improving retail businesses within the Fifth Avenue South assessment area. 41-10 Public Open Space Fund–To account for the receipt and disbursement of monies used for the purpose of acquiring land and or the construction or reconstruction of public open space in the Downtown District. Parking Trust Fund–To account for the receipt and disbursement of monies used for the purpose of construction or reconstruction of parking spaces in the Downtown District. Port Royal Dredging District–To account for the receipt and disbursement of monies used for the purpose of maintenance dredging in the canals and waterways within the area or boundary of the district of Port Royal. East Naples Bay District–To account for the receipt and disbursement of monies used for the purpose of maintenance dredging in the canals and waterways within the area or boundary of the district of East Naples Bay. Moorings Bay District–To account for the receipt and disbursement of monies used for the purpose of maintenance dredging in the canals and waterways within the area or boundary of the district of Moorings Bay and Park Shore Units 2 and 5.
Capital Projects Funds Capital projects funds are used to account for the acquisition and construction of major capital facilities other than those financed by proprietary funds and trust funds.

116
Impact Fee Fund–To account for the receipt and disbursement of monies used for the acquisition of capital from impact fees. Land Contribution Fund–To account for the receipt and disbursement of monies used for the acquisition of park land.

Special CapitalRevenue Project
Funds Funds TotalAssets
Cash and investments 13,424,395$ 595,453 14,019,848 Accounts receivable 6,275 - 6,275 Accrued interest 14,141 2,972 17,113 Due from other governments 61,061 - 61,061
Total assets 13,505,872$ 598,425 14,104,297
LiabilitiesAccounts payable 202,535$ - 202,535 Accrued payroll 74,287 - 74,287 Due to other governments 301,918 - 301,918 Advances payable to other funds 1,328,016 - 1,328,016 Customer deposits 89,787 - 89,787
Total liabilities 1,996,543 - 1,996,543
Deferred inflows of resourcesUnavailable revenue 121,930 - 121,930
Fund balancesRestricted 9,345,455 589,242 9,934,697 Committed 1,745,584 9,183 1,754,767 Assigned 55,591 - 55,591 Unassigned 240,769 - 240,769
Total fund balances 11,387,399 598,425 11,985,824 Total liabilities, deferred inflows of
resources, and fund balances 13,505,872$ 598,425 14,104,297
September 30, 2014
CITY OF NAPLES, FLORIDA
Nonmajor Governmental FundsCombining Balance Sheet
117

This page intentionally left blank
118

Special CapitalRevenue Project
Funds Funds TotalRevenues
Taxes–property 240,944$ - 240,944 Permits, fees and assessments 5,961,785 328,945 6,290,730 Intergovernmental 108,974 - 108,974 Charges for services 32,088 - 32,088 Fines and forfeitures 12,091 - 12,091 Interest 37,052 3,596 40,648 Donations 2,342,947 - 2,342,947 Miscellaneous 18,522 - 18,522
Total revenues 8,754,403 332,541 9,086,944
ExpendituresCurrent
General government 17,747 - 17,747 Public safety 3,574,382 - 3,574,382 Economic and physical development 350,210 - 350,210 Culture and recreation 135,318 - 135,318
Capital outlayPublic safety 174,651 - 174,651 Economic and physical development 804,870 - 804,870 Culture and recreation 13,452 13,452
Total expenditures 5,070,630 - 5,070,630
Excess of revenuesover expenditures 3,683,773 332,541 4,016,314
Other financing sources (uses)Transfers out (190,800) (427,756) (618,556) Proceeds from sale of capital assets 319 - 319
Total other financing sources (uses) (190,481) (427,756) (618,237)
Change in fund balances 3,493,292 (95,215) 3,398,077
Fund balances, beginning of year 7,894,107 693,640 8,587,747 Fund balances, end of year 11,387,399$ 598,425 11,985,824
CITY OF NAPLES, FLORIDACombining Statement of Revenues, Expenditures and Changes in Fund Balances
Nonmajor Governmental FundsYear Ended September 30, 2014
119

CITY OF NAPLES, FLORIDACombining Balance Sheet
Nonmajor Governmental Special Revenue FundsSeptember 30, 2014
CommunityBuilding and Development Public
Zoning Block Baker Park Improvement Arts GrantsFund Grant Fund Fund Fund Fund Fund
AssetsCash and investments 6,426,829$ 47,326 2,305,385 304,637 213,441 235,215Accounts receivable - - 3,000 3,275 - - Accrued interest 7,851 - - - 213 - Due from other governments - 61,061 - - -
Total assets 6,434,680$ 108,387 2,308,385 307,912 213,654 235,215
LiabilitiesAccounts payable 8,951$ 52,796 7,222 - - Accrued payroll 74,287 - - - - - Due to other governments 301,918 - - - - Advances payable to other funds - - - - - - Customer deposits - - - - 89,787 -
Total liabilities 385,156 52,796 - 7,222 89,787 -
Deferred inflows of resourcesUnavailable revenue - - - 274 - -
Fund balancesRestricted 6,049,524 - 2,308,385 300,416 - 235,215 Committed - - - - 123,867 - Assigned - 55,591 - - - - Unassigned - - - - - -
Total fund balances 6,049,524 55,591 2,308,385 300,416 123,867 235,215 Total liabilities, deferred inflows of
resources, and fund balances 6,434,680$ 108,387 2,308,385 307,912 213,654 235,215
120

Business Port Royal East Moorings TotalConfiscated Improvement 41-10 Public Parking Dredging Naples Bay Bay NonmajorProperties District Open Space Trust District District District Special
Fund Fund Fund Fund Fund Fund Fund Revenue
456,519 4,545 157,847 359,320 1,015,160 801,844 1,096,327 13,424,395 - - - - - - - 6,275
183 - 1,139 764 - 2,216 1,775 14,141 - - - - - - - 61,061
456,702 4,545 158,986 360,084 1,015,160 804,060 1,098,102 13,505,872
4,787 - - - 127,544 1,235 - 202,535 - - - - - - - 74,287 - - - - - - - 301,918 - - - - - 1,328,016 - 1,328,016 - - - - - - - 89,787
4,787 - - - 127,544 1,329,251 - 1,996,543
- - - - 121,656 - - 121,930
451,915 - - - - - - 9,345,455 - 4,545 158,986 360,084 - - 1,098,102 1,745,584 - - - - - - - 55,591 - - - - 765,960 (525,191) - 240,769
451,915 4,545 158,986 360,084 765,960 (525,191) 1,098,102 11,387,399
456,702 4,545 158,986 360,084 1,015,160 804,060 1,098,102 13,505,872
121

CITY OF NAPLES, FLORIDACombining Statement of Revenues, Expenditures and Changes in Fund Balances
Nonmajor Governmental Special Revenue FundsYear Ended September 30, 2014
CommunityBuilding and Development Public
Zoning Block Baker Park Improvement Arts GrantsFund Grant Fund Fund Fund Fund Fund
RevenuesTaxes–property -$ - - - - - Permits, fees and assessments 3,953,501 - 146,300 - - - Intergovernmental - 108,974 - - - - Charges for services 22,088 10,000 - - - - Fines and forfeitures - - - - - - Investment income 24,310 - - - - - Donations - - 2,265,633 77,314 - - Miscellaneous 6,349 - - - 12,173 -
Total revenues 4,006,248 118,974 2,411,933 77,314 12,173 -
ExpendituresCurrent
General government - - - 17,747 - - Public safety 3,531,998 - - 5,084 - - Economic and physical development - - - - - - Culture and recreation - - 103,548 31,770 - -
Capital outlayPublic safety 119,049 - - - - - Economic and physical development - 109,172 - - - - Culture and recreation - - - - 13,452 -
Total expenditures 3,651,047 109,172 103,548 54,601 13,452 -
Excess (deficiency) of revenuesover (under) expenditures 355,201 9,802 2,308,385 22,713 (1,279) -
Other financing sources Transfers out - - - - - -
Proceeds from sale of capital assets - - - - - - Total other financing sources - - - - - -
Change in fund balances 355,201 9,802 2,308,385 22,713 (1,279) -
Fund balances, beginning of year 5,694,323 45,789 - 277,703 125,146 235,215 Fund balances, end of year 6,049,524$ 55,591 2,308,385 300,416 123,867 235,215
122

Business Port Royal East Moorings TotalConfiscated Improvement 41-10 Public Parking Dredging Naples Bay Bay NonmajorProperties District Open Space Trust District District District Special
Fund Fund Fund Fund Fund Fund Fund Revenue
- - - - - 205,139 35,805 240,944 - 328,487 - - 1,533,497 - - 5,961,785 - - - - - - - 108,974 - - - - - - - 32,088
12,091 - - - - - - 12,091 4,345 - 997 2,258 (5,206) 4,536 5,812 37,052
- - - - - - - 2,342,947 - - - - - - - 18,522
16,436 328,487 997 2,258 1,528,291 209,675 41,617 8,754,403
- - - - - - - 17,747 37,300 - - - - - - 3,574,382
- 327,986 - - 7,430 208 14,586 350,210 - - - - - - - 135,318
55,602 - - - - - - 174,651 - - - - 688,812 6,886 - 804,870 - - - - - - - 13,452
92,902 327,986 - - 696,242 7,094 14,586 5,070,630
(76,466) 501 997 2,258 832,049 202,581 27,031 3,683,773
- - - - - (190,800) - (190,800) 319 - - - - - - 319 319 - - - - (190,800) - (190,481)
(76,147) 501 997 2,258 832,049 11,781 27,031 3,493,292
528,062 4,044 157,989 357,826 (66,089) (536,972) 1,071,071 7,894,107 451,915 4,545 158,986 360,084 765,960 (525,191) 1,098,102 11,387,399
123
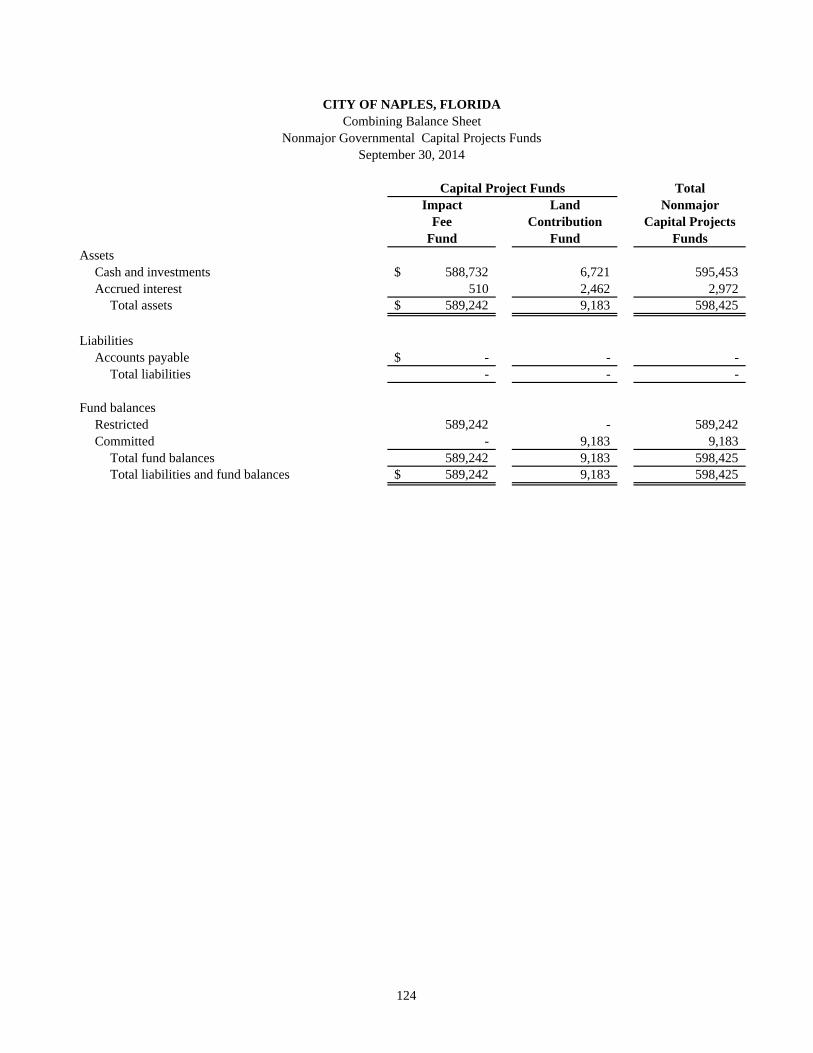
CITY OF NAPLES, FLORIDACombining Balance Sheet
Nonmajor Governmental Capital Projects FundsSeptember 30, 2014
TotalImpact Land Nonmajor
Fee Contribution Capital ProjectsFund Fund Funds
AssetsCash and investments 588,732$ 6,721 595,453 Accrued interest 510 2,462 2,972
Total assets 589,242$ 9,183 598,425
LiabilitiesAccounts payable -$ - -
Total liabilities - - -
Fund balancesRestricted 589,242 - 589,242 Committed - 9,183 9,183
Total fund balances 589,242 9,183 598,425 Total liabilities and fund balances 589,242$ 9,183 598,425
Capital Project Funds
124

CITY OF NAPLES, FLORIDACombining Statement of Revenues, Expenditures and Changes in Fund Balances
Nonmajor Governmental Capital Projects FundsYear Ended September 30, 2014
TotalImpact Land Nonmajor
Fee Contribution Capital ProjectsFund Fund Funds
RevenuesPermits, fees and assessments 328,945$ - 328,945 Interest 3,526 70 3,596
Total revenues 332,471 70 332,541
ExpendituresCapital outlay
General government - - - Economic and physical development - - -
Total expenditures - - -
Excess (deficiency) of revenuesover (under) expenditures 332,471 70 332,541
Other financing uses Transfers out (427,756) - (427,756)
Total other financing uses (427,756) - (427,756)
Change in fund balances (95,285) 70 (95,215)
Fund balances, beginning of year 684,527 9,113 693,640 Fund balances, end of year 589,242$ 9,183 598,425
Capital Project Funds
125

CITY OF NAPLES, FLORIDANonmajor Special Revenue Funds
Schedule of Revenues, Expenditures and Changes in Fund BalancesBudget and Actual
Year Ended September 30, 2014
Building and Zoning FundVariance
Original Final With FinalBudget Budget Actual Budget
RevenuesPermits, fees and assessments 3,029,000$ 3,029,000 3,953,501 924,501 Intergovernmental - - - - Charges for services 21,300 21,300 22,088 788 Interest 33,000 33,000 24,310 (8,690) Donations - - - - Miscellaneous 3,500 3,500 6,349 2,849
Total revenues 3,086,800 3,086,800 4,006,248 919,448
ExpendituresCurrent
Public safety 3,628,037 3,689,037 3,531,998 157,039 Culture and recreation - - - -
Capital outlayPublic safety 60,000 85,000 119,049 (34,049) Economic and physical development - - - -
Total expenditures 3,688,037 3,774,037 3,651,047 122,990
Excess (deficiency) of revenuesover expenditures (601,237) (687,237) 355,201 1,042,438
Change in fund balances (601,237) (687,237) 355,201 1,042,438
Fund balances, beginning of year 5,694,323 5,694,323 5,694,323 - Fund balances, end of year 5,093,086$ 5,007,086 6,049,524 1,042,438
126
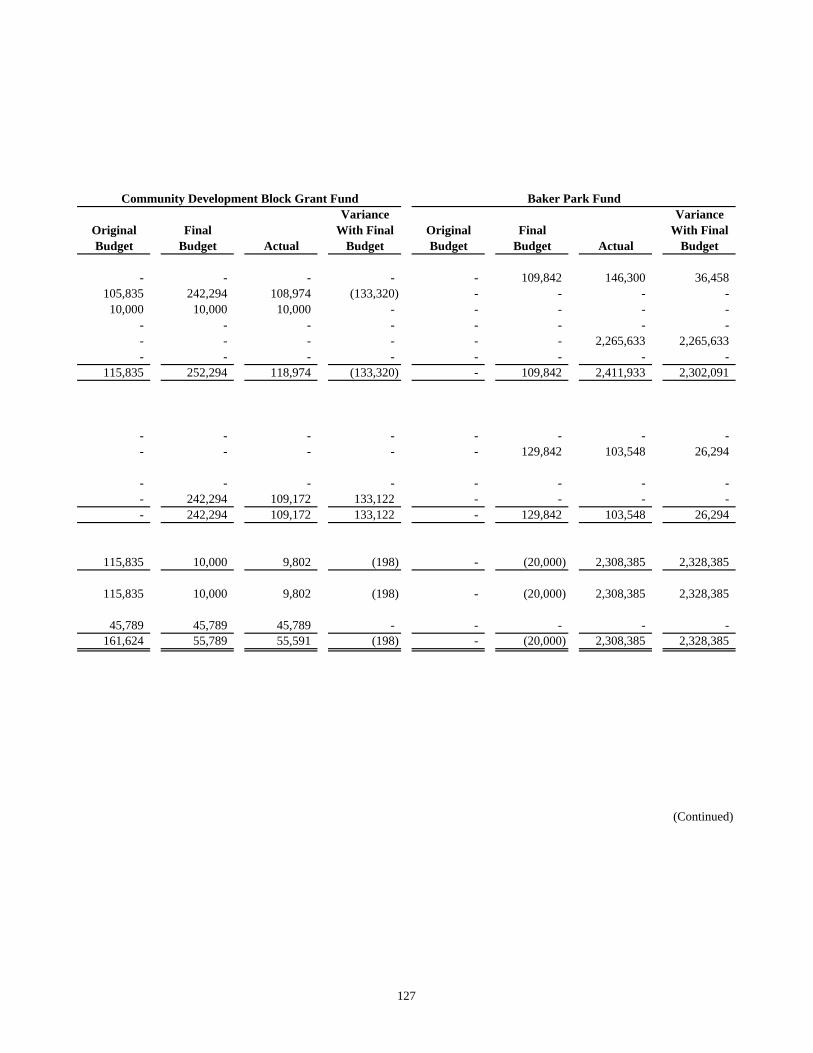
Variance VarianceOriginal Final With Final Original Final With FinalBudget Budget Actual Budget Budget Budget Actual Budget
- - - - - 109,842 146,300 36,458 105,835 242,294 108,974 (133,320) - - - - 10,000 10,000 10,000 - - - - -
- - - - - - - - - - - - - - 2,265,633 2,265,633 - - - - - - - -
115,835 252,294 118,974 (133,320) - 109,842 2,411,933 2,302,091
- - - - - - - - - - - - - 129,842 103,548 26,294
- - - - - - - - - 242,294 109,172 133,122 - - - - - 242,294 109,172 133,122 - 129,842 103,548 26,294
115,835 10,000 9,802 (198) - (20,000) 2,308,385 2,328,385
115,835 10,000 9,802 (198) - (20,000) 2,308,385 2,328,385
45,789 45,789 45,789 - - - - - 161,624 55,789 55,591 (198) - (20,000) 2,308,385 2,328,385
(Continued)
Community Development Block Grant Fund Baker Park Fund
127

Confiscated Properties FundVariance
Original Final With FinalBudget Budget Actual Budget
RevenuesPermits, fees and assessments -$ - - - Fines and forfeitures - - 12,091 12,091 Interest - - 4,345 4,345
Total revenues - - 16,436 16,436
ExpendituresCurrent
Public safety - - 37,300 (37,300) Economic and physical development - - - -
Capital outlay Public safety - 37,536 55,602 (18,066)
Total expenditures - 37,536 92,902 (55,366)
Excess of revenuesover expenditures - (37,536) (76,466) (38,930)
Other financing sourcesProceeds from sale of capital assets - - 319 (319)
Change in fund balances - (37,536) (76,147) (38,611)
Fund balances, beginning of year 528,062 528,062 528,062 - Fund balances, end of year 528,062$ 490,526 451,915 (38,611)
CITY OF NAPLES, FLORIDANonmajor Special Revenue Funds
Schedule of Revenues, Expenditures and Changes in Fund BalancesBudget and Actual
Year Ended September 30, 2014
128

Business Improvement DistrictVariance
Original Final With FinalBudget Budget Actual Budget
328,500 328,500 328,487 (13) - - - - - - - -
328,500 328,500 328,487 (13)
- - - - 328,500 328,500 327,986 514
- - - - 328,500 328,500 327,986 514
- - 501 501
- - - -
- - 501 501
4,044 4,044 4,044 - 4,044 4,044 4,545 501
129
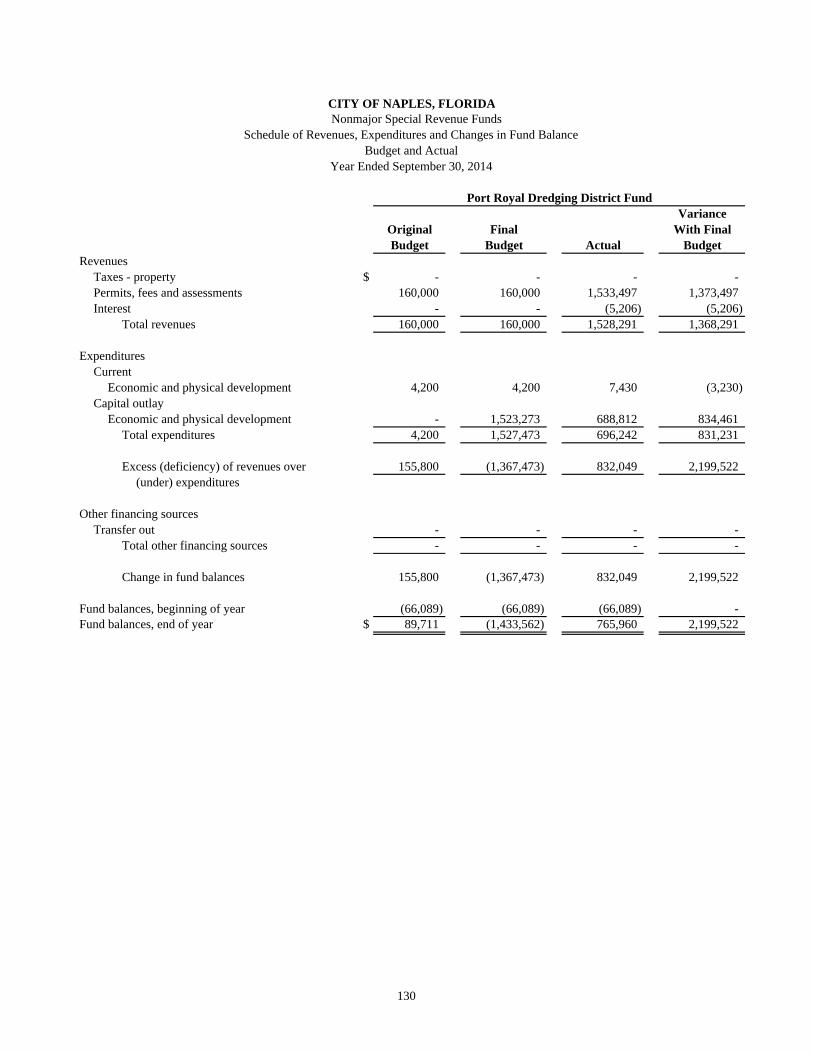
Port Royal Dredging District FundVariance
Original Final With FinalBudget Budget Actual Budget
RevenuesTaxes - property $ - - - - Permits, fees and assessments 160,000 160,000 1,533,497 1,373,497 Interest - - (5,206) (5,206)
Total revenues 160,000 160,000 1,528,291 1,368,291
ExpendituresCurrent
Economic and physical development 4,200 4,200 7,430 (3,230) Capital outlay
Economic and physical development - 1,523,273 688,812 834,461 Total expenditures 4,200 1,527,473 696,242 831,231
Excess (deficiency) of revenues over 155,800 (1,367,473) 832,049 2,199,522 (under) expenditures
Other financing sourcesTransfer out - - - -
Total other financing sources - - - -
Change in fund balances 155,800 (1,367,473) 832,049 2,199,522
Fund balances, beginning of year (66,089) (66,089) (66,089) - Fund balances, end of year $ 89,711 (1,433,562) 765,960 2,199,522
Year Ended September 30, 2014
CITY OF NAPLES, FLORIDA
Schedule of Revenues, Expenditures and Changes in Fund BalanceBudget and Actual
Nonmajor Special Revenue Funds
130

East Naples Bay District Fund Moorings Bay District FundVariance Variance
Original Final With Final Original Final With FinalBudget Budget Actual Budget Budget Budget Actual Budget
201,000 201,000 205,139 4,139 35,400 35,400 35,805 405 - - - - - - - -
2,000 2,000 4,536 2,536 5,600 5,600 5,812 212 203,000 203,000 209,675 6,675 41,000 41,000 41,617 617
11,350 11,350 208 11,142 24,250 24,250 14,586 9,664
800,000 800,000 6,886 793,114 - - - - 811,350 811,350 7,094 804,256 24,250 24,250 14,586 9,664
(608,350) (608,350) 202,581 810,931 16,750 16,750 27,031 10,281
(190,800) (190,800) (190,800) - - - - - (190,800) (190,800) (190,800) - - - - -
(799,150) (799,150) 11,781 810,931 16,750 16,750 27,031 10,281
(571,667) (571,667) (536,972) 34,695 1,071,071 1,071,071 1,071,071 - (1,370,817) (1,370,817) (525,191) 845,626 1,087,821 1,087,821 1,098,102 10,281
131

This page intentionally left blank
132

CITY OF NAPLES, FLORIDADebt Service Fund
Schedule of Revenues, Expenditures and Changes in Fund Balances–Budget and ActualYear Ended September 30, 2014
VarianceOriginal Final With FinalBudget Budget Actual Budget
RevenuesTaxes 3,032,585$ 3,032,585 3,415,906 383,321 Interest 50 50 (13) (63)
Total revenues 3,032,635 3,032,635 3,415,893 383,258
ExpendituresCurrent
General government 62,700 62,700 62,700 - Debt service
Principal 1,489,000 1,489,000 1,489,000 - Interest and fiscal charges 175,109 175,109 174,969 140
Total debt service 1,664,109 1,664,109 1,663,969 140 Total expenditures 1,726,809 1,726,809 1,726,669 140
Excess (deficiency) of revenuesover (under) expenditures 1,305,826 1,305,826 1,689,224 383,398
Other financing sources (uses)Transfers in 982,770 982,770 982,770 - Transfers out (2,212,000) (2,212,000) (2,212,000) -
Total other financing sources (uses) (1,229,230) (1,229,230) (1,229,230) -
Change in fund balance 76,596 76,596 459,994 383,398
Fund balances, beginning of year 1,687,592 1,687,592 1,687,592 - Fund balances, end of year 1,764,188$ 1,764,188 2,147,586 383,398
133

CITY OF NAPLES, FLORIDACapital Projects Funds
Schedule of Revenues, Expenditures and Changes in Fund BalanceBudget and Actual
Year Ended September 30, 2014
VarianceOriginal Final With FinalBudget Budget Actual Budget
RevenuesPermits, fees and assessments 51,850$ 51,850 45,072 (6,778) Investment income 30,000 30,000 38,333 8,333 Miscellaneous 428,125 10,000 269 (9,731)
Total revenues 509,975 91,850 83,674 (8,176)
ExpendituresCurrent
General government 64,430 69,430 72,311 (2,881) Public safety - 32,326 40,578 (8,252) Culture and recreation - 4,148 16,420 (12,272)
Capital projectsFinance 34,000 338,000 288,538 49,462 Fire 575,500 575,500 216,447 359,053 Police 605,395 665,071 652,309 12,762 Culture and recreation 3,065,681 3,064,064 958,013 2,106,051 Nondepartmental 205,000 1,088,972 970,772 118,200
Total expenditures 4,550,006 5,837,511 3,215,388 2,622,123
Excess (deficiency) of revenuesover (under) expenditures (4,040,031) (5,745,661) (3,131,714) 2,613,947
Other financing sources (uses)Transfers in 2,259,700 2,677,825 2,687,456 9,631 Transfers out (570,000) (570,000) (150,000) 420,000 Proceeds from sale of capital assets 15,000 15,000 3,756 (11,244)
Total other financing sources (uses) 1,704,700 2,122,825 2,541,212 418,387
Changes in fund balance (2,335,331) (3,622,836) (590,502) 3,032,334
Fund balances, beginning of year 6,124,385 6,124,385 6,124,385 - Fund balances, end of year 3,789,054$ 2,501,549 5,533,883 3,032,334
Capital Projects Fund - Major Fund
134

135
Nonmajor Enterprise Funds
Enterprise Funds are used to account for operations that are financed and operated in a manner similar to private business enterprise, where the intent of the City Council is that the costs of providing goods or services to the general public on a continuing basis be financed or recovered primarily through user charges, or where the City Council has decided that periodic determination of net income is appropriate for accountability purposes. Naples Beach Fund–To account for funds used in the construction of City beach improvements and beach maintenance; financed mostly through parking meter revenue at the City’s beach and related fines. City Dock Fund–To account for funds used in the construction of the City’s dock and the subsequent operations of the dock. Repayment of any funding will be provided through user charges. Tennis Fund–To account for funds used in the construction of the City’s tennis courts and subsequent operations of the tennis facility. All activities necessary to provide such services are accounted for in this fund, including but not limited to, administration, operations, maintenance, billings and collections.

CITY OF NAPLES, FLORIDACombining Statement of Net Position
Nonmajor Enterprise FundsSeptember 30, 2014
Naples Beach City Dock TennisAssets Fund Fund Fund Total
Current assetsCash and investments 3,069,548$ 743,385 283,563 4,096,496 Restricted cash and investments - 25,370 - 25,370 Receivables (net, where applicable,
of allowance for uncollectible)Accounts 35,008 15,869 - 50,877
Accrued interest 7,210 436 844 8,490 Due from other governments 132,945 3,075 - 136,020 Inventories - 23,016 2,176 25,192
Total current assets 3,244,711 811,151 286,583 4,342,445 Capital assets
Buildings and utility plants 1,126,190 85,715 703,269 1,915,174 Improvements other than buildings 4,371,083 2,413,880 100,174 6,885,137 Equipment 861,289 412,266 70,363 1,343,918 Accumulated depreciation (5,721,331) (2,795,428) (626,968) (9,143,727)
Net capital assets 637,231 116,433 246,838 1,000,502 Total assets 3,881,942$ 927,584 533,421 5,342,947
136

CITY OF NAPLES, FLORIDACombining Statement of Net Position
Nonmajor Enterprise FundsSeptember 30, 2014
Naples Beach City Dock TennisLiabilities Fund Fund Fund Total
Current liabilitiesAccounts payable 27,932$ 35,603 6,592 70,127 Accrued payroll 18,037 5,390 5,738 29,165 Accrued interest payable - - 187 187 Unearned revenue 36,624 51,701 - 88,325 Current portion of compensated absences 20,000 2,000 3,000 25,000 Current maturities of long-term debt - - 60,000 60,000
Total current liabilities 102,593 94,694 75,517 272,804
Current liabilities (payable from restricted assets)Customer deposits - 25,370 - 25,370
Total current liabilities 102,593 120,064 75,517 298,174
Noncurrent liabilitiesRevenue bonds payable, less current maturities
net of unamortized discounts and premiums - - 20,000 20,000 Other post-employment benefits 37,520 6,447 8,221 52,188 Compensated absences 31,170 5,434 15,203 51,807
Total noncurrent liabilities 68,690 11,881 43,424 123,995 Total liabilities 171,283 131,945 118,941 422,169
Net PositionNet investment in capital assets 637,231 116,433 166,838 920,502 Unrestricted 3,073,428 679,206 247,642 4,000,276
Total net position 3,710,659$ 795,639 414,480 4,920,778
137
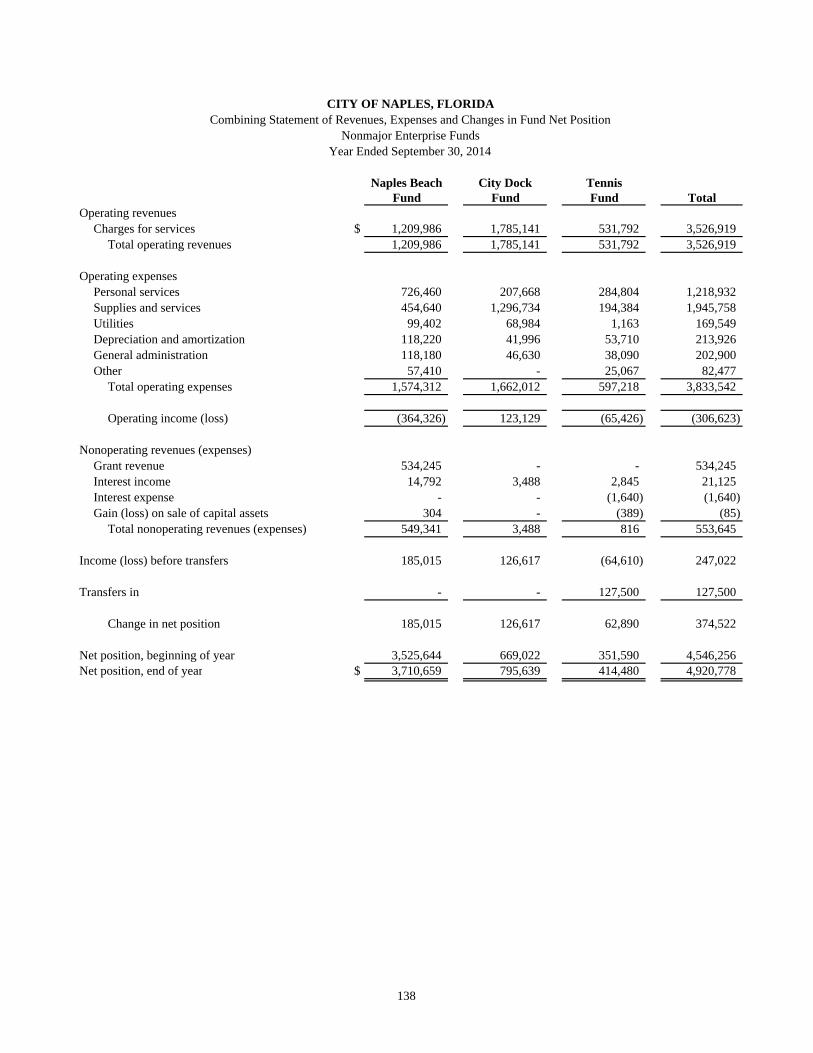
CITY OF NAPLES, FLORIDACombining Statement of Revenues, Expenses and Changes in Fund Net Position
Nonmajor Enterprise FundsYear Ended September 30, 2014
Naples Beach City Dock TennisFund Fund Fund Total
Operating revenuesCharges for services $ 1,209,986 1,785,141 531,792 3,526,919
Total operating revenues 1,209,986 1,785,141 531,792 3,526,919
Operating expensesPersonal services 726,460 207,668 284,804 1,218,932 Supplies and services 454,640 1,296,734 194,384 1,945,758 Utilities 99,402 68,984 1,163 169,549 Depreciation and amortization 118,220 41,996 53,710 213,926 General administration 118,180 46,630 38,090 202,900 Other 57,410 - 25,067 82,477
Total operating expenses 1,574,312 1,662,012 597,218 3,833,542
Operating income (loss) (364,326) 123,129 (65,426) (306,623)
Nonoperating revenues (expenses)Grant revenue 534,245 - - 534,245 Interest income 14,792 3,488 2,845 21,125 Interest expense - - (1,640) (1,640) Gain (loss) on sale of capital assets 304 - (389) (85)
Total nonoperating revenues (expenses) 549,341 3,488 816 553,645
Income (loss) before transfers 185,015 126,617 (64,610) 247,022
Transfers in - - 127,500 127,500
Change in net position 185,015 126,617 62,890 374,522
Net position, beginning of year 3,525,644 669,022 351,590 4,546,256 Net position, end of year $ 3,710,659 795,639 414,480 4,920,778
138
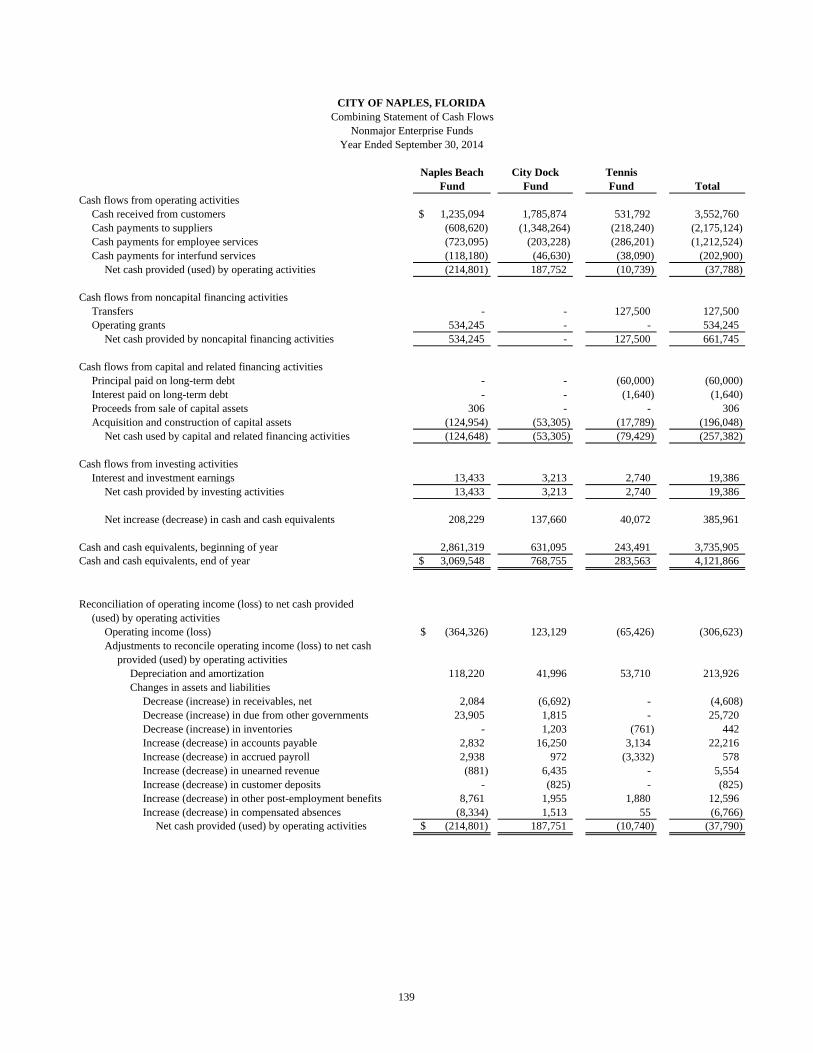
Naples Beach City Dock TennisFund Fund Fund Total
Cash flows from operating activitiesCash received from customers 1,235,094$ 1,785,874 531,792 3,552,760 Cash payments to suppliers (608,620) (1,348,264) (218,240) (2,175,124) Cash payments for employee services (723,095) (203,228) (286,201) (1,212,524) Cash payments for interfund services (118,180) (46,630) (38,090) (202,900)
Net cash provided (used) by operating activities (214,801) 187,752 (10,739) (37,788)
Cash flows from noncapital financing activitiesTransfers - - 127,500 127,500 Operating grants 534,245 - - 534,245
Net cash provided by noncapital financing activities 534,245 - 127,500 661,745
Cash flows from capital and related financing activitiesPrincipal paid on long-term debt - - (60,000) (60,000) Interest paid on long-term debt - - (1,640) (1,640) Proceeds from sale of capital assets 306 - - 306 Acquisition and construction of capital assets (124,954) (53,305) (17,789) (196,048)
Net cash used by capital and related financing activities (124,648) (53,305) (79,429) (257,382)
Cash flows from investing activitiesInterest and investment earnings 13,433 3,213 2,740 19,386
Net cash provided by investing activities 13,433 3,213 2,740 19,386
Net increase (decrease) in cash and cash equivalents 208,229 137,660 40,072 385,961
Cash and cash equivalents, beginning of year 2,861,319 631,095 243,491 3,735,905 Cash and cash equivalents, end of year 3,069,548$ 768,755 283,563 4,121,866
Reconciliation of operating income (loss) to net cash provided(used) by operating activities
Operating income (loss) (364,326)$ 123,129 (65,426) (306,623) Adjustments to reconcile operating income (loss) to net cash
provided (used) by operating activitiesDepreciation and amortization 118,220 41,996 53,710 213,926 Changes in assets and liabilities
Decrease (increase) in receivables, net 2,084 (6,692) - (4,608) Decrease (increase) in due from other governments 23,905 1,815 - 25,720 Decrease (increase) in inventories - 1,203 (761) 442 Increase (decrease) in accounts payable 2,832 16,250 3,134 22,216 Increase (decrease) in accrued payroll 2,938 972 (3,332) 578 Increase (decrease) in unearned revenue (881) 6,435 - 5,554 Increase (decrease) in customer deposits - (825) - (825) Increase (decrease) in other post-employment benefits 8,761 1,955 1,880 12,596 Increase (decrease) in compensated absences (8,334) 1,513 55 (6,766)
Net cash provided (used) by operating activities (214,801)$ 187,751 (10,740) (37,790)
CITY OF NAPLES, FLORIDACombining Statement of Cash Flows
Nonmajor Enterprise FundsYear Ended September 30, 2014
139

This page intentionally left blank
140

141
Internal Service Funds Internal Service Funds are used to account for the financing of goods or services provided by one department or agency to other departments or agencies of the City on a cost reimbursement basis. Equipment Services Fund–To account for the costs of operating a maintenance facility for automotive equipment used by other City departments. Such costs are billed to the other departments at actual cost. Actual costs include depreciation of the garage building, improvements, and machinery and equipment used to provide the service. Risk Management Fund–To account for the costs of operating a risk management self-insurance fund. Health Benefits Fund–To account for the costs of operating a health benefits self-insurance fund. Technology Services–To account for the costs of operating a computer facility used by other City departments. All activities necessary to provide such services are accounted for in this fund.

Equipment Risk Health TechnologyAssets Services Management Benefits Services Total
Current assetsCash and investments 230,299$ 6,963,654 1,891,094 987,128 10,072,175 Receivables, miscellaneous - - 2,955 - 2,955 Accrued interest 278 5,006 1,600 575 7,459 Due from other governments 2,429 - - - 2,429 Inventories 102,993 - - - 102,993 Prepaids - - - 18,588 18,588
Total current assets 335,999 6,968,660 1,895,649 1,006,291 10,206,599
Capital assetsBuildings 779,289 - - 51,957 831,246 Equipment 335,368 25,788 - 2,041,297 2,402,453 Accumulated depreciation (761,988) (25,788) - (1,461,073) (2,248,849)
Net capital assets 352,669 - - 632,181 984,850 Total assets 688,668 6,968,660 1,895,649 1,638,472 11,191,449
LiabilitiesCurrent liabilities
Accounts payable 57,211 20,013 492 167,458 245,174 Accrued payroll 18,972 3,582 - 10,664 33,218 Due to other funds - - - - - Unearned revenue - 105 383 - 488
Total current liabilities 76,183 23,700 875 178,122 278,880
Noncurrent liabilitiesDue within one year
Compensated absences 12,000 1,266 - 12,000 25,266 Insurance claims payable - 630,800 427,403 - 1,058,203
Due in more than one yearCompensated absences 88,768 6,747 - 22,194 117,709 Other post-employment benefits 36,653 5,050 - 43,074 84,777 Insurance claims payable - 2,523,200 - - 2,523,200
Total noncurrent liabilities 137,421 3,167,063 427,403 77,268 3,809,155 Total liabilities 213,604 3,190,763 428,278 255,390 4,088,035
Net PositionNet investment in capital assets 352,669 - - 494,708 847,377 Restricted, flexible benefits - - 309,506 - 309,506 Unrestricted 122,395 3,777,897 1,157,865 888,374 5,946,531
Total net position 475,064$ 3,777,897 1,467,371 1,383,082 7,103,414
CITY OF NAPLES, FLORIDACombining Statement of Net Position
Internal Service FundsSeptember 30, 2014
142

Equipment Risk Health TechnologyServices Management Benefits Services Total
Operating revenuesCharges for services 2,457,781$ 3,032,600 6,899,026 1,754,710 14,144,117
Operating expensesPersonal services 782,746 135,279 - 614,481 1,532,506 Supplies, services and claims 1,467,651 2,388,700 6,015,686 869,848 10,741,885 Materials - - - - - Utilities 24,742 - - - 24,742 Depreciation and amortization 69,527 - - 262,046 331,573 General administration 106,980 66,710 111,100 103,382 388,172 Other 2,687 2,633 - - 5,320
Total operating expenses 2,454,333 2,593,322 6,126,786 1,849,757 13,024,198
Operating income (loss) 3,448 439,278 772,240 (95,047) 1,119,919
Nonoperating revenues (expenses)Interest income 731 25,546 2,403 4,361 33,041 Gain (loss) on sale of capital assets - 1,655 - - 1,655
Total nonoperating revenues (expenses) 731 27,201 2,403 4,361 34,696
Income (loss) before transfers 4,179 466,479 774,643 (90,686) 1,154,615
Transfers in - - - 70,000 70,000 Change in net position 4,179 466,479 774,643 (20,686) 1,224,615
Net position, beginning of year 470,885 3,311,418 692,728 1,403,768 5,878,799 Net position, end of year 475,064$ 3,777,897 1,467,371 1,383,082 7,103,414
CITY OF NAPLES, FLORIDACombining Statement of Revenues, Expenses and Changes in Fund Net Position
Internal Service FundsYear Ended September 30, 2014
143

Equipment Risk Health TechnologyServices Management Benefits Services Total
Cash flows from operating activitiesCash received from customers 2,460,992$ 3,032,600 6,896,293 1,754,710 14,144,595 Cash payments to suppliers for goods and services (1,485,796) (2,329,575) (6,029,986) (799,663) (10,645,020) Cash payments for employee services (713,289) (134,077) - (607,145) (1,454,511) Cash payments for interfund services (106,980) (66,710) (111,100) (103,382) (388,172)
Net cash provided (used) by operating activities 154,927 502,238 755,207 244,520 1,656,892
Cash flows from noncapital and related financing activitiesTransfers in (out) - - - 70,000 70,000
Net cash provided by noncapital and related financing activities - - - 70,000 70,000
Cash flows from capital and related financing activitiesProceeds from the sale of capital assets - 1,655 - - 1,655 Acquisition and construction of capital assets (14,515) - - (399,519) (414,034)
Net cash provided (used) by capital and related financing activities (14,515) 1,655 - (399,519) (412,379)
Cash flows from investing activitiesInterest on pooled cash and investments 710 23,326 1,955 4,177 30,168
Net cash provided by investing activities 710 23,326 1,955 4,177 30,168
Net increase in cash and cash equivalents 141,122 527,219 757,162 (80,822) 1,344,681
Cash and cash equivalents, beginning of year 89,177 6,436,435 1,133,932 1,067,950 8,727,494 Cash and cash equivalents, end of year 230,299$ 6,963,654 1,891,094 987,128 10,072,175
Reconciliation of operating income (loss) to net cash provided(used) by operating activities
Operating income (loss) 3,448$ 439,278 772,240 (95,047) 1,119,919 Adjustments to reconcile operating income (loss) to net cash
provided (used) by operating activitiesDepreciation and amortization 69,527 - - 262,046 331,573 Changes in assets and liabilities
(Increase) decrease in miscellaneous receivables 536 - (2,733) - (2,197) (Increase) decrease in due from other governments 2,675 - - - 2,675 (Increase) decrease in inventories 20,040 - - - 20,040 (Increase) decrease in prepaids - - - 23,691 23,691 Increase (decrease) in accounts payable (10,756) (17,242) (20) 46,494 18,476 Increase (decrease) in accrued payroll 3,790 599 - (3,819) 570 Increase (decrease) in unearned revenue - - 383 - 383 Increase (decrease) in insurance claims payable - 79,000 (14,663) - 64,337 Increase (decrease) in other post-employment benefits 8,831 1,241 - 8,404 18,476 Increase (decrease) in compensated absences 56,836 (638) - 2,751 58,949
Net cash provided (used) by operating activities 154,927$ 502,238 755,207 244,520 1,656,892
CITY OF NAPLES, FLORIDACombining Statement of Cash Flows
Internal Service FundsYear Ended September 30, 2014
144
145
Fiduciary Funds Fiduciary Funds are used to account for the activities of funds held in a trustee or agency capacity for others that cannot be used to support the City’s own programs. The City reports pension trust funds which are to account for the activities of the City’s retirement systems, which accumulate resources for pension benefit payments made to employees. General Pension Fund–To account for the activities of the City’s defined benefit retirement plan for all full-time non-bargaining employees and employees of the American Federation of State and Municipal Employees (AFSCME) Union and Government Supervisor Association of Florida Office and Professional Employees International Union (OPEIU). Supplemental General Pension Fund–To account for the activities of the City’s supplemental defined contribution retirement plan available to all full-time employees except those covered by the International Association of Firefighters (IAFF) or Fraternal Order of Police (FOP) unions. Managers’ 401 Pension Fund–To account for the activities of the City’s defined contribution retirement plan available to all employees whose service to the City is rendered on a contractual or fee basis. Police Officers’ Pension Fund–To account for the activities of the City’s defined benefit retirement plan for all full-time sworn police personnel. Firefighters’ Pension Fund–To account for the activities of the City’s defined benefit retirement plan for all full-time sworn fire personnel. Agency Fund–To account for the activities of the City’s internal payroll clearing account.

CITY OF NAPLES, FLORIDACombining Statement of Fiduciary Net Position
Fiduciary FundsSeptember 30, 2014
General Supplemental Managers’Pension General 401
Fund Pension PensionAssets
Cash and cash equivalents 1,240,447$ - - Receivables
Contributions 22,191 - - Investments, at fair value
U.S. Treasury securities 1,049,727 - - U.S. Government agency securities 1,834,980 - - Municipal obligations 253,713 - - Asset-backed securities 1,636,810 - - Corporate bonds 4,812,203 - - Common stock/equity funds 33,238,763 - - Real estate investment trusts 2,342,186 - - Mutual funds - 7,049,238 1,181,120Alternative investments 4,850,451
Total investments 50,018,833 7,049,238 1,181,120 Total assets 51,281,471 7,049,238 1,181,120
LiabilitiesAccounts payable 30,201 - -
Total liabilities 30,201 - -
Net positionRestricted for pension benefits 51,251,270$ 7,049,238 1,181,120
Pension Trust
146

Police Officers’ Firefighters’Pension Pension
Fund Fund Total
1,079,516 1,031,651 3,351,614
558,225 888,317 1,468,733
1,062,153 1,193,063 3,304,943 1,477,735 1,486,565 4,799,280
209,842 200,334 663,889 1,379,461 1,529,917 4,546,188 3,916,814 4,050,195 12,779,212
27,217,870 28,814,229 89,270,862 1,815,194 1,698,085 5,855,465
- - 8,230,358 3,901,450 4,006,894 12,758,795
40,980,519 42,979,282 142,208,992 42,618,260 44,899,250 147,029,339
138,257 183,348 351,806 138,257 183,348 351,806
42,480,003 44,715,902 146,677,533
Pension Trust
147

CITY OF NAPLES, FLORIDACombining Statement of Changes in Fiduciary Net Position
Fiduciary FundsYear Ended September 30, 2014
General Supplemental Managers’Pension General 401
Fund Pension PensionAdditions
ContributionsEmployee contributions 715,072$ 304,918 70,645Employer contributions 1,945,282 194,783 52,471State contributions - - -
Total contributions 2,660,354 499,701 123,116
Investment earningsInterest and dividend income 987,301 110,637 4,124Net change in fair value of investments 5,140,879 517,773 80,352Less investment expense (271,108) (21,441) (1,004)
Net investment earnings 5,857,072 606,969 83,472 Total additions 8,517,426 1,106,670 206,588
DeductionsBenefits paid 3,351,714 - - Refunds of contributions 536,142 530,544 - General administration 142,904 - -
Total deductions 4,030,760 530,544 -
Changes in net position 4,486,666 576,126 206,588
Net position, beginning of year 46,764,604 6,473,112 974,532 Net position, end of year 51,251,270$ 7,049,238 1,181,120
Pension Trust
148

Police Officers’ Firefighters’Pension Pension
Fund Fund Total
229,089 177,737 1,497,461 1,672,462 1,342,378 5,207,376
540,981 871,999 1,412,980 2,442,532 2,392,114 8,117,817
790,428 825,695 2,718,185 4,232,721 4,396,674 14,368,399 (218,263) (225,846) (737,662)
4,804,886 4,996,523 16,348,922 7,247,418 7,388,637 24,466,739
2,613,218 1,865,618 7,830,550 9,763 45,874 1,122,323
75,114 65,535 283,553 2,698,095 1,977,027 9,236,426
4,549,323 5,411,610 15,230,313
37,930,680 39,304,292 131,447,220 42,480,003 44,715,902 146,677,533
Pension Trust
149

Balance BalanceOctober 1, September 30,
2013 Additions Deductions 2014Assets
Cash 2,489$ 12,081,067 (12,078,812) 4,744Total assets 2,489 12,081,067 (12,078,812) 4,744
LiabilitiesAccounts payable 2,489 12,081,067 (12,078,812) 4,744Total liabilities 2,489$ 12,081,067 (12,078,812) 4,744
CITY OF NAPLES, FLORIDAStatement of Changes in Assets and Liabilities–Agency Funds
Year Ended September 30, 2014
150

(Unaudited)
Contents Page
Financial Trends
These schedules contain trend information to help the reader understand how the City'sfinancial performance and well-being have changed over time.
152
Revenue Capacity
These schedules contain information to help the reader assess the factors affecting the City'smost significant local revenue source, the property tax.
163
Debt Capacity
These schedules present information to help the reader assess the affordability of the City'scurrent levels of outstanding debt and the City's ability to issue additional debt in the future.The City has no legal debt margin and therefore it is not reported in these schedules.
170
Demographic and Economic Information
These schedules offer demographic and economic indicators to help the reader understand theenvironment within which the City's financial activities take place and to help makecomparisons over time and with other governments.
176
Operating Information
These schedules contain information about the City's operations and resources to help thereader understand how the City's financial information relates to the services the City providesand the activities it performs.
178
Sources: Unless otherwise noted, the information in these schedules is derived from the comprehensiveannual financial reports for the relevant year.
STATISTICAL SECTION
This part of the City of Naples, Florida's comprehensive annual financial report presents detailed information as acontext for understanding what the information in the financial statements, note disclosures, and requiredsupplementary information says about the city's overall financial health.
151

Schedule 1City of NaplesNet Position by ComponentLast Ten Fiscal Years(accrual basis of accounting)
2005 2006 2007 2008 2009Governmental activities
Net investment in capital assets $ 36,375,444 44,278,263 47,347,136 52,934,188 48,868,221 Restricted 3,033,223 2,989,709 2,640,493 3,004,060 3,781,152 Unrestricted 34,885,629 36,871,259 42,830,226 39,230,791 42,765,131
Total governmental activities net assets $ 74,294,296 84,139,231 92,817,855 95,169,039 95,414,504
Business-type activitiesNet investment in capital assets $ 48,443,815 50,606,313 55,460,038 60,313,029 65,279,797 Restricted 5,956,252 5,702,201 3,218,517 2,566,664 2,693,838 Unrestricted 19,428,925 22,676,063 23,418,439 23,979,666 25,931,780
Total business-type activities net assets $ 73,828,992 78,984,577 82,096,994 86,859,359 93,905,415
Primary governmentNet investment in capital assets $ 84,819,259 94,884,576 102,807,174 113,247,217 114,148,018 Restricted 8,989,475 8,691,910 5,859,010 5,570,724 6,474,990 Unrestricted 54,314,554 59,547,322 66,248,665 63,210,457 68,696,911
Total primary government net assets $ 148,123,288 163,123,808 174,914,849 182,028,398 189,319,919
152

2010 2011 2012 2013 2014
47,101,732 47,910,235 49,368,390 54,372,698 55,192,342983,750 12,987,575 13,460,387 13,908,144 13,908,144
45,710,635 33,134,491 32,162,681 27,048,578 31,850,607
93,796,117 94,032,301 94,991,458 95,329,420 100,951,093
70,342,384 72,488,908 77,344,733 81,292,017 90,439,6023,122,630 4,070,440 1,645,528 - -
28,569,892 32,963,324 39,489,625 43,716,346 44,977,055
102,034,906 109,522,672 118,479,886 125,008,363 135,416,657
117,444,116 120,399,143 126,713,123 135,664,715 145,631,944 4,106,380 17,058,015 15,105,915 13,908,144 13,908,144
74,280,527 66,097,815 71,652,306 70,764,924 76,827,662
195,831,023 203,554,973 213,471,344 220,337,783 236,367,750
Fiscal Year
153

Schedule 2City of NaplesChanges in Net PositionLast Ten Fiscal Years(accrual basis of accounting)
2005 2006 2007 2008 2009
ExpensesGovernmental activities
General government $ 4,628,899 12,926,588 (a) 6,811,501 (a) 8,140,789 6,668,512 Public safety 18,423,475 20,692,720 22,691,091 24,409,251 25,633,909 Physical and economic environment 1,726,724 2,292,246 2,194,855 2,588,477 2,925,902 Transportation 2,347,916 2,364,917 4,010,530 3,394,912 3,520,363 Culture and recreation 6,103,599 6,488,868 7,978,079 8,584,195 7,733,570 Interest 997,829 939,738 904,623 830,822 1,033,650
Total governmental activities expenses 34,228,442 45,705,077 44,590,679 47,948,446 47,515,906
Business-type activitiesWater and sewer 20,052,724 20,283,437 22,354,201 23,625,071 24,816,306 Solid waste 4,858,461 5,126,911 5,652,827 5,835,401 5,501,931 Stormwater 1,301,876 1,289,960 1,431,858 1,833,201 2,088,938 Other enterprises 3,850,775 4,169,201 4,464,879 4,177,236 3,505,193
Total business-type activities 30,063,836 30,869,509 33,903,765 35,470,909 35,912,368 Total primary governmental expenses $ 64,292,278 76,574,586 78,494,444 83,419,355 83,428,274
Program Revenues (see Schedule 3)Governmental activities
Charges for servicesGeneral government $ 1,150,161 1,207,823 1,180,983 1,310,847 1,043,665 Public safety 4,162,944 5,001,465 4,424,734 4,492,028 3,571,827 Physical and economic environment 81,385 11,982 581,638 387,922 12,397 Transportation 258,621 65,681 69,719 74,884 - Culture and recreation 822,085 766,409 1,028,100 881,822 819,228
Operating grants and contributions 4,294,679 11,017,352 (a) 3,041,688 (a) 2,633,209 2,978,768 Capital grants and contributions 793,780 2,821,571 1,830,543 2,350,214 1,202,496
Total governmental activities revenues 11,563,655 20,892,283 12,157,405 12,130,926 9,628,381
Business-type activitiesWater and sewer 21,437,118 22,736,438 22,933,821 25,299,408 28,219,062 Solid waste 5,560,064 6,175,311 6,046,768 6,369,866 6,294,650 Stormwater 1,419,256 1,500,320 1,418,188 2,890,146 4,467,178 Beach 896,446 830,339 916,767 917,236 1,071,798 Dock 1,872,307 1,880,153 2,003,808 1,767,944 1,078,547 Tennis 455,108 547,122 559,561 575,121 548,984 Operating grants and contributions 430,347 408,819 465,865 646,891 501,525 Capital grants and contributions 659,482 2,508,003 3,071,791 3,358,210 2,057,101
Total business-type activities 32,730,128 36,586,505 37,416,569 41,824,822 44,238,845 Total primary governmental revenues $ 44,293,783 57,478,788 49,573,974 53,955,748 53,867,226
Net Expense/RevenueGovernmental activities $ (22,664,787) (24,812,794) (32,433,274) (35,817,520) (37,887,525) Business-type activities 2,666,292 5,716,996 3,512,804 6,353,913 8,326,477 Total primary government net expense $ (19,998,495) (19,095,798) (28,920,470) (29,463,607) (29,561,048)
154

Fiscal Year2010 2011 2012 2013 2014
6,394,914 5,622,677 5,457,866 5,301,030 7,715,25525,616,678 23,957,097 24,400,324 24,885,076 25,969,504
3,207,529 3,239,638 3,128,378 2,792,363 2,714,2223,715,335 3,553,288 3,355,650 3,450,265 3,089,2347,243,542 6,850,817 6,609,114 6,942,141 7,093,524
955,784 443,739 493,896 397,292 227,97647,133,782 43,667,256 43,445,228 43,768,167 46,809,715
24,334,032 24,300,280 23,915,729 23,833,110 24,397,3475,366,770 5,497,576 5,275,918 5,489,089 6,011,6372,458,129 2,642,191 2,463,801 3,064,173 3,088,1393,094,200 3,117,045 3,377,075 3,474,163 3,822,843
35,253,131 35,557,092 35,032,523 35,860,535 37,319,966 82,386,913 79,224,348 78,477,751 79,628,702 84,129,681
1,139,439 1,238,135 837,202 874,008 3,724,5923,631,525 3,803,409 4,792,576 4,506,478 4,940,975
12,064 15,372 15,788 16,009 17,6166,618 3,942 31,210 104,501
840,364 751,480 751,862 802,130 3,185,1803,190,239 2,909,353 2,631,903 2,803,204 4,140,006
425,002 294,062 927,761 352,732 779,1039,245,251 9,015,753 9,957,092 9,385,771 16,891,973
28,303,440 29,055,653 28,262,634 28,747,954 32,117,6386,089,265 5,974,018 5,827,277 5,876,369 6,102,4944,422,225 4,538,097 4,563,918 4,651,910 5,039,6751,046,660 1,125,781 1,117,695 1,086,099 1,209,9861,067,358 1,298,741 1,512,844 1,649,255 1,785,141
534,095 452,109 417,161 474,559 531,792637,810 621,838 635,642 556,850 784,245
2,991,732 1,726,470 3,507,039 1,388,630 1,835,61345,092,585 44,792,707 45,844,210 44,431,626 49,406,584 54,337,836 53,808,460 55,801,302 53,817,397 66,298,557
(37,888,531) (34,651,503) (33,488,136) (34,382,396) (29,917,742) 9,839,454 9,235,615 10,811,687 8,571,091 12,086,618
(28,049,077) (25,415,888) (22,676,449) (25,811,305) (17,831,124)
(Continued)
155

Schedule 2City of NaplesChanges in Net Position (Continued)Last Ten Fiscal Years(accrual basis of accounting)
Fiscal Year2004 2005 2006 2007 2008 2009
General Revenues and OtherChanges in Net Position
Governmental activitiesTaxes
Property taxes $ 13,029,256 14,404,764 15,926,721 20,779,629 19,415,799 19,729,516 Local communication and utility taxes 3,904,133 4,149,829 4,269,042 4,218,208 4,170,227 4,476,921 Insurance premium tax (a) - - 1,751,337 1,769,045 1,949,641 2,016,132 Motor fuel taxes 1,731,941 1,585,816 1,579,996 1,532,580 1,404,690 1,393,025 Business taxes 251,051 291,426 269,389 278,694 274,487 247,021
Franchise fees 2,977,388 3,165,215 3,825,979 3,877,556 3,740,236 3,971,657 Intergovernmental revenues, unrestricted 3,431,686 3,628,176 3,658,867 3,449,606 3,160,311 2,863,565 Unrestricted investment earnings 683,727 1,087,659 2,068,237 2,858,980 2,043,294 1,345,826 Miscellaneous revenues 48,428 105,030 54,863 129,518 45,489 17,461 Gain on sale of capital assets 1,986,363 - - - - 88,496 Transfers 1,917,577 1,676,358 1,708,000 1,763,380 1,964,530 1,983,370
Total governmental activities 29,961,550 30,094,273 35,112,431 40,657,196 38,168,704 38,132,990
Business-type activitiesInvestment earnings 311,790 511,054 1,111,333 1,333,466 831,090 566,730 Gain on sale of capital assets 84,807 530 35,256 29,527 - 136,219 Special item - - - - (458,108) - Transfers (1,917,577) (1,676,358) (1,708,000) (1,763,380) (1,964,530) (1,983,370)
Total business-type activities (1,520,980) (1,164,774) (561,411) (400,387) (1,591,548) (1,280,421)
Total primary government $ 28,440,570 28,929,499 34,551,020 40,256,809 36,577,156 36,852,569
Change in Net PositionGovernmental activities $ 7,640,412 7,429,486 10,299,637 8,223,922 2,351,184 245,465 Business-type activities 1,550,111 1,501,518 5,155,585 3,112,417 4,762,365 7,046,056
Total primary government $ 9,190,523 8,931,004 15,455,222 11,336,339 7,113,549 7,291,521
(a) Prior years had these amounts recorded only in the Police/Fire Pension Funds
156
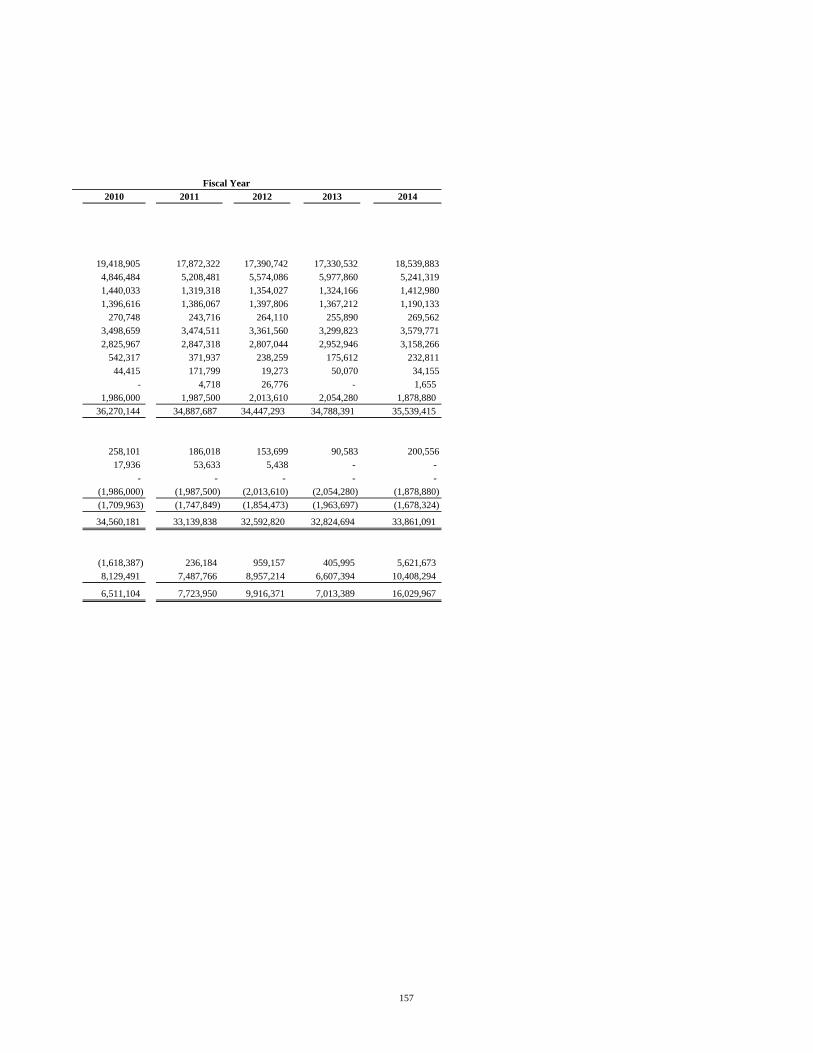
Fiscal Year2010 2011 2012 2013 2014
19,418,905 17,872,322 17,390,742 17,330,532 18,539,8834,846,484 5,208,481 5,574,086 5,977,860 5,241,3191,440,033 1,319,318 1,354,027 1,324,166 1,412,9801,396,616 1,386,067 1,397,806 1,367,212 1,190,133
270,748 243,716 264,110 255,890 269,5623,498,659 3,474,511 3,361,560 3,299,823 3,579,7712,825,967 2,847,318 2,807,044 2,952,946 3,158,266
542,317 371,937 238,259 175,612 232,81144,415 171,799 19,273 50,070 34,155
- 4,718 26,776 - 1,655 1,986,000 1,987,500 2,013,610 2,054,280 1,878,880
36,270,144 34,887,687 34,447,293 34,788,391 35,539,415
258,101 186,018 153,699 90,583 200,55617,936 53,633 5,438 - -
- - - - - (1,986,000) (1,987,500) (2,013,610) (2,054,280) (1,878,880)(1,709,963) (1,747,849) (1,854,473) (1,963,697) (1,678,324)
34,560,181 33,139,838 32,592,820 32,824,694 33,861,091
(1,618,387) 236,184 959,157 405,995 5,621,673 8,129,491 7,487,766 8,957,214 6,607,394 10,408,294
6,511,104 7,723,950 9,916,371 7,013,389 16,029,967
157

Schedule 3City of NaplesFund Balances, Governmental FundsLast Ten Fiscal Years(modified accrual basis of accounting)
2005 2006 2007 2008 2009
General Fund
Reserved $ 3,851,388 817,651 882,906 535,922 442,112
Unreserved 5,561,460 12,119,520 15,454,863 14,774,120 16,151,990
Non-spendable N/A N/A N/A N/A N/A
Restricted N/A N/A N/A N/A N/A
Committed N/A N/A N/A N/A N/A
Assigned N/A N/A N/A N/A N/A
Unassigned N/A N/A N/A N/A N/A
Total General Fund $ 9,412,848 12,937,171 16,337,769 15,310,042 16,594,102
All other governmental funds
Reserved
Special revenue funds $ 179,187 18,625 89,364 215,821 29,839
Capital projects funds 19,890,914 4,645,715 5,999,449 6,720,843 1,145,643
Debt service funds 1,420,125 1,707,311 1,725,940 1,486,456 1,420,125
Unreserved
Special revenue funds 3,594,431 5,226,704 5,578,047 5,616,572 5,086,904
Capital projects funds (362,701) 12,533,664 12,088,406 8,192,774 16,308,321
Debt service funds 457,518 494,714 737,263 978,483 1,282,620
Non-spendable N/A N/A N/A N/A N/A
Restricted N/A N/A N/A N/A N/A
Committed N/A N/A N/A N/A N/A
Assigned N/A N/A N/A N/A N/A
Unassigned N/A N/A N/A N/A N/A
Total other governmental funds $ 25,179,474 24,626,733 26,218,469 23,210,949 25,273,452
158

2010 2011 2012 2013 2014
420,844 N/A N/A N/A N/A
17,052,805 N/A N/A N/A N/A
N/A 150,464 487,435 425,592 725,388
N/A 13,791 13,791 13,791 13,791
N/A 3,528,888 3,515,091 3,597,298 3,597,298
N/A 46,284 11,765 293,132 293,132
N/A 15,508,265 15,541,877 10,582,398 11,439,262
17,473,649 19,247,692 19,569,959 14,912,211 16,068,871
10,731 N/A N/A N/A N/A
1,225,757 N/A N/A N/A N/A
1,560,104 N/A N/A N/A N/A
5,317,018 N/A N/A N/A N/A
15,809,889 N/A N/A N/A N/A
1,884,501 N/A N/A N/A N/A
N/A 121,462 455,198 400,565 390,271
N/A 12,973,784 13,446,596 13,487,529 15,818,513
N/A 3,928,985 2,927,725 3,167,293 3,196,870
N/A 6,715,447 6,758,559 6,083,658 5,962,952
N/A N/A (571,667) (603,061) 240,769
25,808,000 23,739,678 23,016,411 22,535,984 25,609,375
Fiscal Year
159

Schedule 4City of NaplesChanges in Fund Balances, Governmental FundsLast Ten Fiscal Years(modified accrual basis of accounting)
2005 2006 2007 2008 2009Revenues
Taxes $ 23,305,625 25,601,739 32,177,018 (a) 27,214,844 27,862,615 Licenses, permits, fees and assessments 2,931,552 3,787,831 3,717,384 (a) 6,953,495 (b) 6,856,060 Intergovernmental 8,015,980 16,974,405 7,883,654 7,761,199 5,856,457 Charges for services 2,009,871 1,824,433 2,373,059 2,327,605 2,020,389 Charges to other funds 3,748,880 3,806,515 3,966,100 4,165,504 4,093,450 Fines and forfeitures 553,888 578,562 374,950 405,342 338,037 Impact fees/special assessments 368,576 710,951 424,364 366,627 (b) - Interest 971,187 1,833,114 2,603,304 1,806,496 1,216,224 Contributions 263,988 70,505 59,716 62,715 83,101 Miscellaneous 432,022 1,159,105 153,338 73,568 115,701
Total revenues 42,601,569 56,347,160 53,732,887 51,137,395 48,442,034
ExpendituresGeneral government 7,516,247 15,131,257 9,591,067 11,377,879 9,688,213 Public safety 17,606,607 18,988,238 21,481,323 23,479,974 24,792,638 Physical and economic environment 1,333,438 1,734,495 1,579,013 1,813,934 1,775,115 Transportation 1,351,547 1,421,391 2,820,205 2,046,296 2,116,889 Culture and recreation 5,289,131 5,352,049 6,313,097 6,920,107 5,996,861 Capital outlay 6,621,225 11,043,085 6,768,798 9,542,548 7,053,867 Debt service
Principal 978,603 994,107 1,070,000 1,125,000 1,497,000 Interest and fiscal charges 995,570 933,536 907,878 831,434 1,066,519
Total expenditures 41,692,368 55,598,158 50,531,381 57,137,172 53,987,102
Excess (deficit) of revenues over (under) expenditures 909,201 749,002 3,201,506 (5,999,777) (5,545,068)
Other Financing Sources (Uses)
Debt issued - - - - 6,860,000
Payments to escrow agents - - - - -
Payments to current refund debt - - - - - Transfers in 4,906,256 4,797,603 5,944,576 4,720,949 12,714,292 Transfers out (3,229,898) (3,068,828) (4,181,196) (2,756,419) (10,818,965) Sale of capital assets 25 39,102 27,448 - 136,304 Total other financing sources (uses) 1,676,383 1,767,877 1,790,828 1,964,530 8,891,631
Net change in fund balance $ 2,585,584 2,516,879 4,992,334 (4,035,247) 3,346,563
Debt service as a percentage of noncapital expenditures 5.6% 4.3% 4.5% 4.1% 5.5%
Note:
(b) In 2009, impact fees and special assessments were reclassified to permits, fees and assessments.(c) The City refunded the 2010 Capital Improvement Refunding Revenue Notes.
were reclassified from licenses, permits and fees to taxes.
(a) In 2008, franchise fees were reclassified from taxes to licenses, permits and fees. Business licenses
160
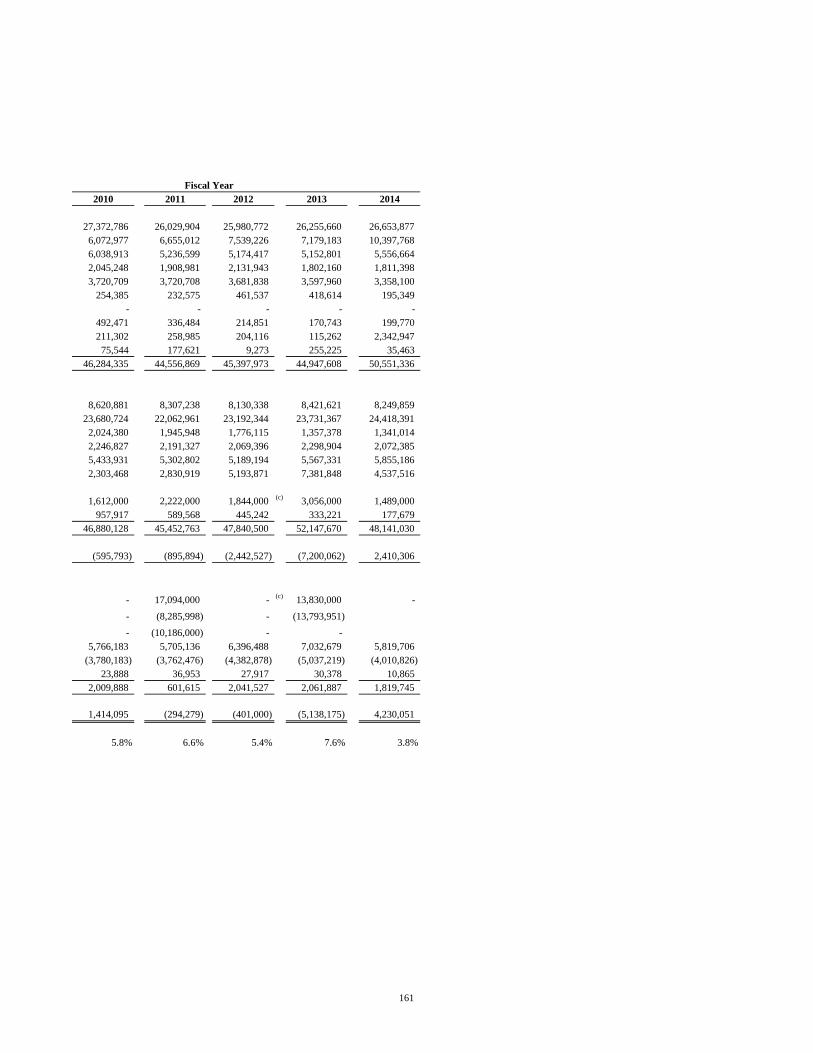
Fiscal Year2010 2011 2012 2013 2014
27,372,786 26,029,904 25,980,772 26,255,660 26,653,877 6,072,977 6,655,012 7,539,226 7,179,183 10,397,768 6,038,913 5,236,599 5,174,417 5,152,801 5,556,664 2,045,248 1,908,981 2,131,943 1,802,160 1,811,398 3,720,709 3,720,708 3,681,838 3,597,960 3,358,100
254,385 232,575 461,537 418,614 195,349 - - - - -
492,471 336,484 214,851 170,743 199,770 211,302 258,985 204,116 115,262 2,342,947
75,544 177,621 9,273 255,225 35,463 46,284,335 44,556,869 45,397,973 44,947,608 50,551,336
8,620,881 8,307,238 8,130,338 8,421,621 8,249,859 23,680,724 22,062,961 23,192,344 23,731,367 24,418,391
2,024,380 1,945,948 1,776,115 1,357,378 1,341,014 2,246,827 2,191,327 2,069,396 2,298,904 2,072,385 5,433,931 5,302,802 5,189,194 5,567,331 5,855,186 2,303,468 2,830,919 5,193,871 7,381,848 4,537,516
1,612,000 2,222,000 1,844,000 (c) 3,056,000 1,489,000
957,917 589,568 445,242 333,221 177,679 46,880,128 45,452,763 47,840,500 52,147,670 48,141,030
(595,793) (895,894) (2,442,527) (7,200,062) 2,410,306
- 17,094,000 - (c) 13,830,000 -
- (8,285,998) - (13,793,951)
- (10,186,000) - - 5,766,183 5,705,136 6,396,488 7,032,679 5,819,706
(3,780,183) (3,762,476) (4,382,878) (5,037,219) (4,010,826) 23,888 36,953 27,917 30,378 10,865
2,009,888 601,615 2,041,527 2,061,887 1,819,745
1,414,095 (294,279) (401,000) (5,138,175) 4,230,051
5.8% 6.6% 5.4% 7.6% 3.8%
161

This page intentionally left blank
162

Schedule 5City of NaplesTax Revenues by Source, Governmental FundsLast Ten Fiscal Years(modified accrual basis of accounting)
Fiscal Utility and FranchiseYear Property Communication Fees Fuel Taxes Sales and Use Other Total
2005 $ 14,404,764 4,149,829 3,141,721 1,585,816 2,624,802 1,003,374 26,910,306 2006 15,926,721 4,269,042 3,792,489 1,579,996 2,651,227 2,758,977 (a) 30,978,452 2007 20,779,629 4,218,209 3,877,556 1,532,580 2,455,218 2,763,432 35,626,624 2008 19,415,799 4,170,227 3,740,236 1,404,690 2,196,319 2,913,633 33,840,904 2009 19,729,516 4,476,921 3,971,657 1,393,025 1,927,205 2,263,153 33,761,477 2010 19,418,905 4,846,484 3,498,659 1,396,616 1,896,824 2,535,655 33,593,143 2011 17,872,322 5,208,481 3,474,511 1,386,067 1,911,574 2,487,454 32,340,409 2012 17,390,742 5,574,086 3,361,560 1,397,806 1,875,396 1,618,137 31,217,727 2013 17,330,532 5,977,860 3,299,823 1,367,212 2,006,377 1,580,056 31,561,860 2014 18,239,883 5,541,318 3,579,771 1,190,133 2,204,960 1,682,542 32,438,607
Change2005-2014 26.6% 33.5% 13.9% -25.0% -16.0% 67.7% 20.5%
Source: City of Naples Finance Department
Notes:
(a) In fiscal year 2006, the City began recording the Premium Fire and Casualty Insurance Tax in theGeneral Fund. In prior years, those amounts were deposited directly into the Police and Fire
163

Schedule 6City of NaplesAssessed Value and Estimated Actual Value of Taxable PropertyLast Ten Fiscal Years
AdjustedLess Net New Total Taxable Final
Fiscal Real Personal Taxable Value TaxableYear Property Property Value (for roll back) Value
2004-05 11,909,720,094 301,738,680 271,725,048 11,939,733,726 12,168,966,197 2005-06 13,412,338,003 345,957,486 192,180,825 13,566,114,664 13,746,713,411 2006-07 16,264,603,707 376,100,345 275,696,496 16,365,007,556 16,533,125,948 2007-08 17,086,194,348 386,182,053 410,638,803 17,061,737,598 17,456,888,406 2008-09 16,903,766,419 400,795,472 342,706,664 16,961,855,227 17,246,749,629 2009-10 15,962,605,246 421,136,474 311,015,976 16,072,725,744 16,287,802,409 2010-11 14,627,069,353 419,030,702 185,960,906 14,860,139,149 14,976,570,653 2011-12 14,232,284,825 356,269,561 106,264,047 14,482,290,339 14,557,352,859 2012-13 14,642,097,786 354,038,345 127,383,048 14,868,753,083 14,982,785,178 2013-14 15,469,458,476 355,090,471 185,411,425 15,639,137,522 15,813,172,702
Source: Collier County Tax Appraiser
Notes:
Market/Just Value as defined in F.S. 193.011
A constitutional revision took effect January 1, 1995, known as "Save our Homes." Itannually limits the increase in the assessment of Homestead properties at 3% or theConsumer Price Index (CPI), whichever is less. Tax rates are per $1,000 of assessedvalue.
Adjusted Taxable Value is the number upon which the state required Truth In Millage(TRIM) data is submitted. Adjusted taxable values are presented to the City by July 1, onForm DR420. The Final Taxable Values are the taxable values as of the start of the fiscalyear and are presented to the City in October on Form DR422.
Net New Taxable Value consists of new construction + additions + rehabilitativeimprovements increasing assessed value by at least 100% + annexations - deletions.
164

Actual Taxable Total Value as aDirect Market/Just Percentage of
Tax Rate Value Market/Just Value
1.2098 15,427,299,073 77.4%1.1839 17,371,133,725 78.1%1.2815 21,802,038,544 75.1%1.1347 22,486,719,099 75.9%1.1663 21,642,182,442 78.4%1.2175 19,738,257,718 81.4%1.2195 17,719,816,637 83.9%1.2226 17,046,390,756 85.0%1.1800 17,730,212,166 83.9%1.1800 18,964,343,443 82.5%
165

Schedule 7City of NaplesDirect and Overlapping Property Tax RatesLast Ten Fiscal Years(rate per $1,000 of assessed value)
City Millage Rates Overlapping Rates*General
Obligation WaterFiscal Operating Debt Mosquito Collier PollutionYear Rate Service City Total Control County Control
2005 1.1600 0.0498 1.2098 0.0962 3.8772 0.03472006 1.1400 0.0439 1.1839 0.0830 3.5790 0.03472007 1.2450 0.0365 1.2815 0.0680 3.5790 0.03202008 1.0997 0.0350 1.1347 0.0635 3.1469 0.02802009 1.1315 0.0348 1.1663 0.0635 3.4221 0.02932010 1.1800 0.0375 1.2175 0.0720 3.5938 0.02932011 1.1800 0.0395 1.2195 0.0826 3.5645 0.02932012 1.1800 0.0426 1.2226 0.0934 3.5645 0.02932013 1.1800 0.0000 1.1800 0.1102 3.5645 0.02932014 1.1800 0.0000 1.1800 0.1050 3.5645 0.0293
Source: Mosquito Control, Collier County, Collier County School Board, South Florida Water Management.
Note: The City's Operating and Debt service rates are not limited and are established by City Ordinances,Bond Resolutions and/or referendums in full compliance with Florida Statutes.
* Overlapping rates are those of local and County governments that apply to property owners within theCity of Naples.
166

Overlapping Rates*
SouthConservation School Water Combined
Collier Board Management Total
0.2500 6.2200 0.5265 12.21440.2500 5.9730 0.5265 11.78010.2500 5.5250 0.5266 11.41210.2242 5.3510 0.4814 10.57970.2500 4.9090 0.4814 10.47160.2500 5.2390 0.4814 10.88300.2500 5.6990 0.4814 11.32630.2500 5.5270 0.3418 11.02860.2500 5.5760 0.3390 11.04900.0000 5.6900 0.3278 10.8966
167

Schedule 8City of NaplesPrincipal Property Tax Payers,As of September 30, 2014(in thousands)
Property Percentage Property PercentageTaxes of Total Taxes of Total
Top 10 City of Naples Taxpayers Levied Rank Taxes Levied Levied Rank Taxes LeviedFlorida Power & Light $ 157,074 1 0.83%The Moorings, Inc. 113,657 2 0.60%Coastland Center, LLC 75,144 3 0.40% 80,649 1 0.54%Sandra Gerry 53,628 4 0.28% 58,002 2 0.39%Westbury Properties, Inc. 50,052 5 0.26% 37,047 6 0.25%Randal D Bellestri Trust 49,901 6 0.26%Harold Square Land Trust 40,636 7 0.21%Montana Realty Company LLC 35,019 8 0.19%Linda Buonanno Trust 31,303 9 0.17%Arthur L Allen Jr. 30,963 10 0.16%Lutgert Trust, Raymond L 46,504 3 0.31%Comax Partners 41,319 4 0.28%Estuary at Grey Oaks 37,772 5 0.25%Panthers 27,497 7 0.18%Larned, Gardner B 27,389 8 0.18%Bergman Trust, Bruce J 24,376 9 0.16%Tobin Trust 23,075 10 0.15%
$ 637,376 3.37% 403,630 2.71%
Total property taxes levied $ 18,921,717.00 14,911,539.00 .
Sources: Collier County Property Appraiser and 2005 CAFR
2014 2005
168
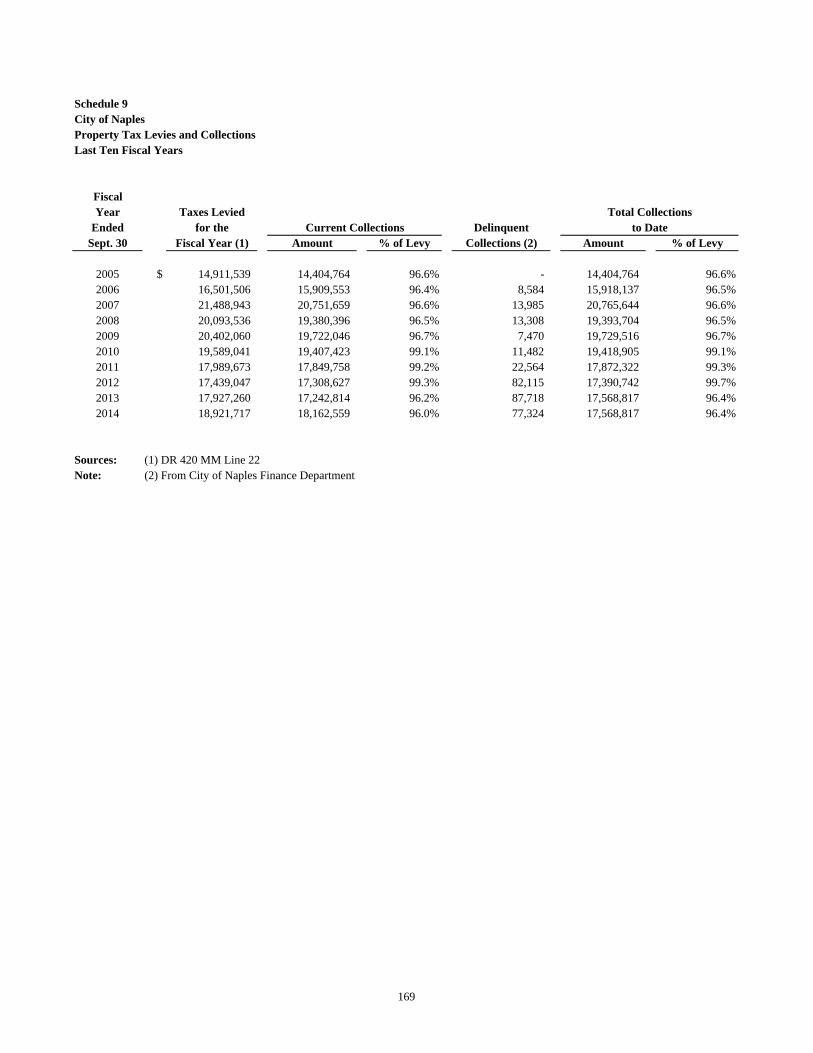
Schedule 9City of NaplesProperty Tax Levies and CollectionsLast Ten Fiscal Years
FiscalYear Taxes Levied
Ended for the DelinquentSept. 30 Fiscal Year (1) Amount % of Levy Collections (2) Amount % of Levy
2005 $ 14,911,539 14,404,764 96.6% - 14,404,764 96.6%2006 16,501,506 15,909,553 96.4% 8,584 15,918,137 96.5%2007 21,488,943 20,751,659 96.6% 13,985 20,765,644 96.6%2008 20,093,536 19,380,396 96.5% 13,308 19,393,704 96.5%2009 20,402,060 19,722,046 96.7% 7,470 19,729,516 96.7%2010 19,589,041 19,407,423 99.1% 11,482 19,418,905 99.1%2011 17,989,673 17,849,758 99.2% 22,564 17,872,322 99.3%2012 17,439,047 17,308,627 99.3% 82,115 17,390,742 99.7%2013 17,927,260 17,242,814 96.2% 87,718 17,568,817 96.4%2014 18,921,717 18,162,559 96.0% 77,324 17,568,817 96.4%
Sources: (1) DR 420 MM Line 22Note: (2) From City of Naples Finance Department
Current CollectionsTotal Collections
to Date
169
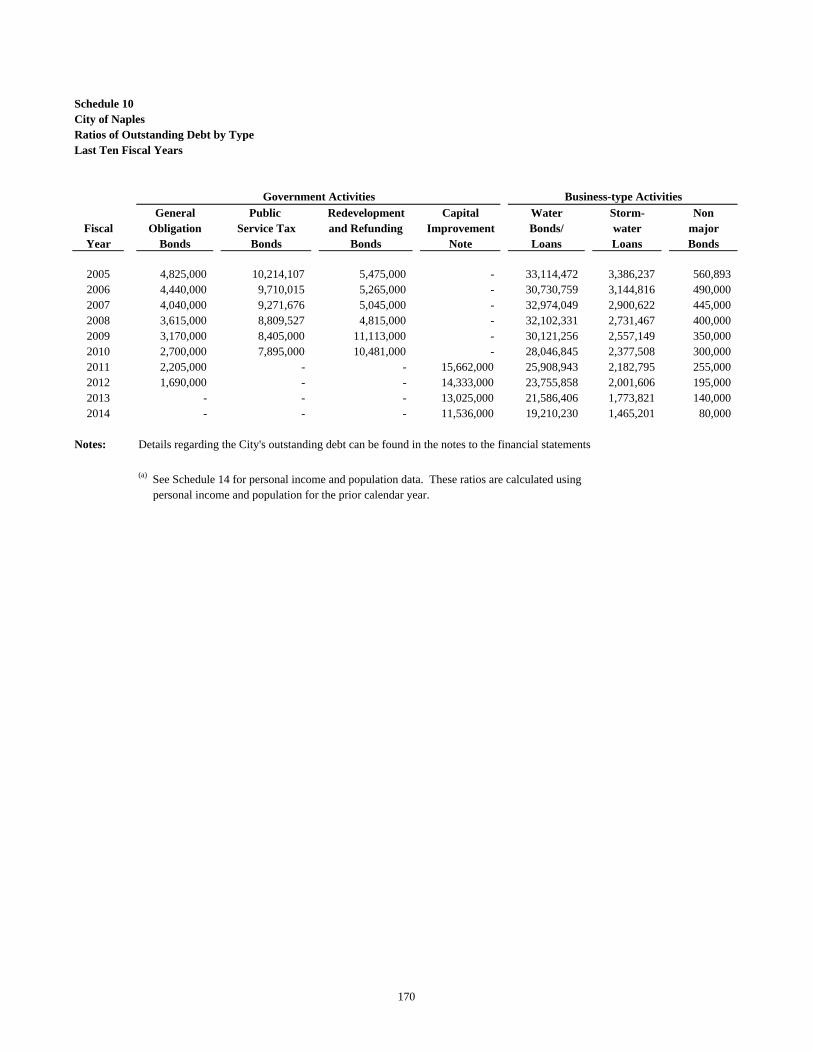
Schedule 10City of NaplesRatios of Outstanding Debt by TypeLast Ten Fiscal Years
General Public Redevelopment Capital Water Storm- NonFiscal Obligation Service Tax and Refunding Improvement Bonds/ water majorYear Bonds Bonds Bonds Note Loans Loans Bonds
2005 4,825,000 10,214,107 5,475,000 - 33,114,472 3,386,237 560,893 2006 4,440,000 9,710,015 5,265,000 - 30,730,759 3,144,816 490,000 2007 4,040,000 9,271,676 5,045,000 - 32,974,049 2,900,622 445,000 2008 3,615,000 8,809,527 4,815,000 - 32,102,331 2,731,467 400,000 2009 3,170,000 8,405,000 11,113,000 - 30,121,256 2,557,149 350,000 2010 2,700,000 7,895,000 10,481,000 - 28,046,845 2,377,508 300,000 2011 2,205,000 - - 15,662,000 25,908,943 2,182,795 255,000 2012 1,690,000 - - 14,333,000 23,755,858 2,001,606 195,000 2013 - - - 13,025,000 21,586,406 1,773,821 140,000 2014 - - - 11,536,000 19,210,230 1,465,201 80,000
Notes: Details regarding the City's outstanding debt can be found in the notes to the financial statements
personal income and population for the prior calendar year.
Business-type ActivitiesGovernment Activities
(a) See Schedule 14 for personal income and population data. These ratios are calculated using
170

Total PercentagePrimary of Personal Per
Government Income (a) Capita (a)
57,575,709 5.10% 1,147 53,780,590 4.31% 990 54,676,347 4.12% 770 52,473,325 3.77% 662 55,716,405 4.07% 726 51,800,353 3.78% 682 46,213,738 3.16% 617 41,975,464 2.56% 510 36,525,227 2.17% 436 32,291,431 1.96% 403
171

Schedule 11City of NaplesRatios of General Bonded Debt OutstandingLast Ten Fiscal Years
General Percentage ofObligation Actual Taxable
Fiscal Bonds Value ofYear Outstanding Property (a) Per Capita (b)
2005 4,825,000 0.04% 214.54$ 2006 4,440,000 0.03% 193.30$ 2007 4,040,000 0.02% 174.88$ 2008 3,615,000 0.02% 160.27$ 2009 3,170,000 0.02% 146.41$ 2010 2,700,000 0.02% 120.59$ 2011 2,205,000 0.01% 112.86$ 2012 1,690,000 0.01% 84.76$ 2013 0 0.00% -$ 2014 0 0.00% -$
Notes:
The only general obligation debt was paid off in 2013.
Details regarding the City's outstanding debt can be found in the notes to the financial statements.
172

Schedule 12City of NaplesDirect and Overlapping Governmental Activities DebtAs of September 30, 2014
EstimatedEstimated Share of
Debt Percentage Direct and
Outstanding Applicable (c)Overlapping Debt
City of Naples Direct Debt
Capital Improvement Note 11,536,000 100% 11,536,000
Total direct debt 11,536,000
Overlapping debt (a)
Collier County 360,920,536 25% 90,230,134 -
Total direct and overlapping debt 90,230,134
$ 101,766,134
Sources:
Notes(a)
Collier County Comprehensive Annual Finanical Report Schedules
The City of Naples is not responsible for the Overlapping Debt. The applicable percentage was estimated using assessed property values.
Overlapping governments are those that coincide, at least in part with the geographic boundaries of the City
173

Schedule 13City of NaplesPledged-Revenue CoverageLast Ten Fiscal Years
Less NetFiscal Utility Service Operating Available Debt ServiceYear Charges Expenses Revenue Requirement Coverage
2005 $ 21,437,118 11,711,345 9,725,773 2,962,385 3.282006 22,736,438 12,414,794 10,321,644 2,962,385 3.482007 22,933,820 14,633,548 8,300,272 1,355,985 6.122008 25,299,408 15,407,221 9,892,187 1,357,735 7.292009 28,219,062 17,995,779 10,223,283 1,127,899 9.062010 28,303,440 17,224,710 11,078,730 1,127,899 9.822011 29,055,653 23,415,659 5,639,994 1,127,899 5.002012 28,262,634 23,195,559 5,067,075 1,127,899 4.492013 28,747,954 23,462,275 5,285,679 1,043,132 5.072014 28,747,954 23,462,275 5,285,679 1,043,132 5.07
Notes:Operating expenses do not include interest, depreciation or amortization expenses.
(1) These issues were refunded by the 2010 Capital Improvement Refunding Revenue Note,which was subsequently refunded by the 2013 Capital Improvement Refunding Revenue Note
Water Revenue Bonds
Details regarding the City's outstanding debt can be found in the notes to the financial statements.
174
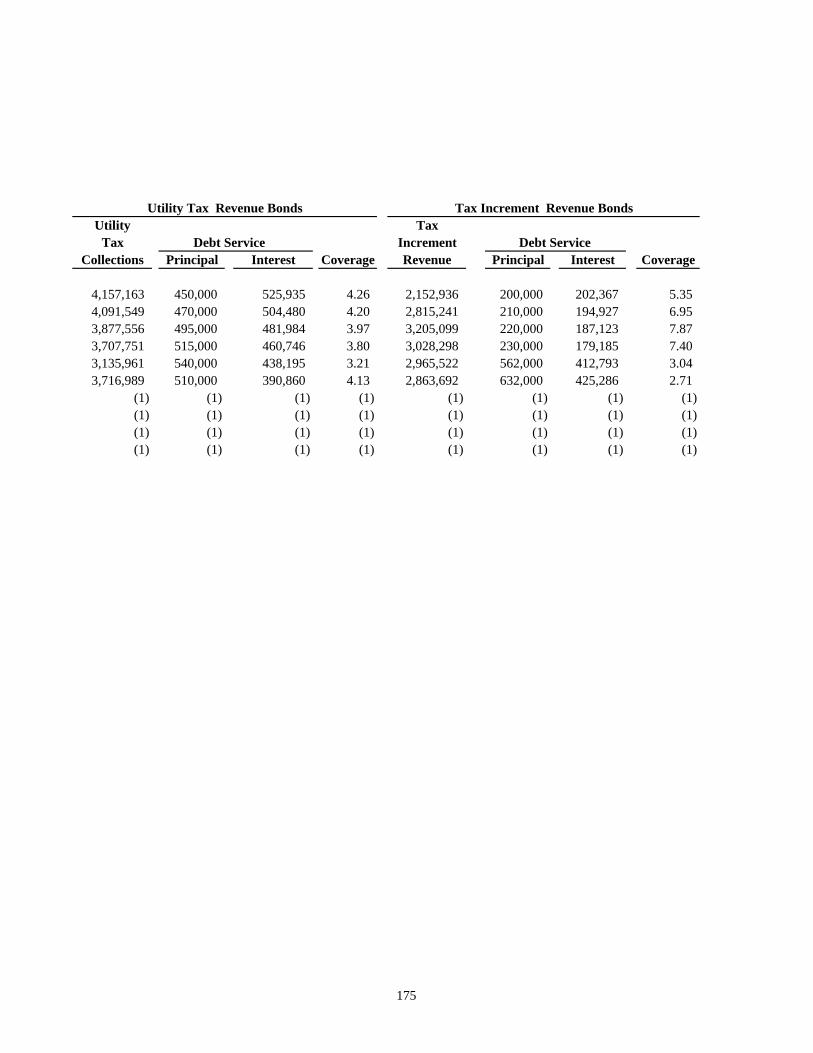
Utility TaxTax Debt Service Increment Debt Service
Collections Principal Interest Coverage Revenue Principal Interest Coverage
4,157,163 450,000 525,935 4.26 2,152,936 200,000 202,367 5.35 4,091,549 470,000 504,480 4.20 2,815,241 210,000 194,927 6.95 3,877,556 495,000 481,984 3.97 3,205,099 220,000 187,123 7.87 3,707,751 515,000 460,746 3.80 3,028,298 230,000 179,185 7.40 3,135,961 540,000 438,195 3.21 2,965,522 562,000 412,793 3.04 3,716,989 510,000 390,860 4.13 2,863,692 632,000 425,286 2.71
(1) (1) (1) (1) (1) (1) (1) (1) (1) (1) (1) (1) (1) (1) (1) (1) (1) (1) (1) (1) (1) (1) (1) (1) (1) (1) (1) (1) (1) (1) (1) (1)
Utility Tax Revenue Bonds Tax Increment Revenue Bonds
175

Schedule 14City of NaplesDemographic and Economic StatisticsLast Ten Calendar Years
PersonalIncome Per County
Calendar (thousands Capita Median School UnemploymentYear Population of dollars) Income Age Enrollment Rate (June)
2005 22,490 1,128,908 50,196 62.4 41,588 3.7%2006 22,970 1,248,117 54,337 62.4 42,775 3.2%2007 23,101 1,327,060 71,033 62.4 42,062 4.3%2008 22,556 1,393,690 79,315 63.0 41,666 8.2%2009 21,651 1,369,989 76,708 62.5 42,786 11.5%2010 22,390 1,368,953 75,910 63.8 42,098 11.7%2011 19,537 1,462,579 74,862 63.9 42,430 11.0%2012 19,939 1,641,299 82,316 64.2 43,238 9.0%2013 20,115 1,685,597 83,798 64.3 43,789 7.5%2014 20,537 1,646,164 80,156 64.0 44,415 5.9%
Sources:
Population provided by the U.S. Census Bureau; Per Capita Personal Income by the Census Bureau (*), Bureauof Economic and Business Research; Median Age by Florida Statistical Abstract (Table 1.51); County schoolenrollment data provided by the Collier County Public Schools Finance Department.
*Prior to 2007, information on per capita income and median age was not available specifically for the City. Formedian age, 3 year estimates were provided by the American Community Survey Office. Prior to 2007, percapita income was an estimate based on various information from Collier County and the Bureau of Economicand Business Research.
176

Schedule 15City of NaplesPrincipal Employers,Current Year and Nine Years Ago
Percentage Percentageof Total City of Total City
Employer Employees Rank Employment Employees Rank Employment
Collier County Public Schools 5,365 1 21.1% 5,335 1 19.9%NCH Healthcare System 4,000 2 15.7% 3,500 2 13.0%Publix Supermarkets 2,214 3 8.7% 2,226 3 8.3%Collier County Government 1,946 4 7.7% 1,179 5 4.4%Collier County Sheriff 1,367 5 5.4% - - Allen Systems Group 1,200 6 4.7% 1,500 4 5.6%Marriott Corporation, Inc. (Ritz Carlton) 800 7 3.1% - - Waldorf Astoria (Naples Grande) 760 8 3.0% 830 6 3.1%Fifth-Third Bank 733 9 2.9% - - The Moorings 730 10 2.8% - - City of Naples - - 493 7 1.8%Naples Beach and Tennis - - 491 8 1.8%Bentley Resort - - 475 9 1.8%Estimated other employers - - 186 10 0.7%Estimated Total 6,325 24.9% 10,605 39.6%
25,419 100.0% 26,820 100.0%
Sources: U.S. Bureau of Labor StatisticsEmployer Historical RecordsCollier County Clerk of Courts
Note: No 2005 data available, used 2004 data
2014 2005
177

Schedule 16City of NaplesFull-time-Equivalent City Government Employees by Function/Program,Last Ten Fiscal Years
Fiscal Year
Function/Program 2005 2006 2007 2008 2009 2010General Fund
Mayor and Council 1.0 1.0 1.0 1.0 1.0 1.0City Clerk 8.0 8.0 8.0 8.0 8.0 6.0City Attorney 1.0 1.0 1.0 1.0 1.0 1.0City Manager 4.0 4.0 4.0 4.0 7.0 6.7Human Resources 7.0 7.0 7.0 7.0 6.0 5.0Planning and Code Enforcement 10.0 10.0 10.0 10.0 5.0 5.0Finance 20.8 21.8 21.8 21.8 21.8 19.8Community Services 42.0 42.0 47.5 45.5 36.0 30.0Police 111.7 111.7 111.7 111.7 109.7 104.4Fire 59.0 59.0 61.0 61.0 61.0 61.0
Non-departmental 10.0 10.0 12.0 12.0 12.0 11.0
Water and Sewer Fund 99.5 99.5 96.0 100.0 95.0 98.0Solid Waste Fund 25.0 25.0 29.0 29.0 28.0 24.0Streets and Traffic Fund 5.5 5.5 5.5 5.5 7.5 7.5Stormwater Fund 5.5 5.5 5.5 6.0 5.5 6.0City Dock Fund 5.0 5.0 5.0 5.0 4.0 3.0Tennis Fund 4.0 4.0 4.0 4.0 4.0 4.0Beach Fund 14.1 14.1 14.3 13.8 12.8 12.8Technology Services Fund 11.0 11.0 11.0 11.0 10.0 10.0Equipment Services Fund 11.0 11.0 11.0 11.0 10.0 8.5Risk Management Fund 2.0 2.0 2.0 2.0 1.0 1.0Building Permit Fund 26.0 26.0 28.0 27.0 26.0 17.5Community Redevelopment 6.0 6.0 9.0 9.0 9.0 8.3
Construction Management 8.0 8.0 8.0 8.0 (a) (a)
TOTAL EMPLOYEES 497.1 498.1 513.3 514.3 481.3 451.5
Source: City of Naples Budget Document
Notes: (a) Fund eliminated in 2009.(b) Reclassified from Nonoperating to Community Services in the General Fund.
178

2011 2012 2013 2014
1.0 1.0 1.0 1.06.0 6.0 6.0 6.01.0 1.0 1.0 1.08.9 8.9 5.9 5.94.0 4.0 4.0 4.04.0 3.5 3.5 3.5
19.8 18.8 17.8 13.841.0 40.0 40.5 40.598.4 98.4 98.4 98.463.0 63.0 63.0 63.0
(b) (b) (b) (b)
97.0 98.0 99.0 103.025.5 25.5 25.5 25.5
7.5 7.5 6.1 5.56.0 6.0 10.4 10.02.6 3.6 3.6 3.64.0 4.0 4.0 4.0
13.0 12.0 12.0 13.010.0 10.0 10.0 8.0
8.5 8.5 8.5 8.51.0 1.0 1.0 1.0
17.5 18.0 23.8 28.08.3 6.3 6.3 6.3(a) (a) (a) (a)
448.0 445.0 451.3 453.5
179
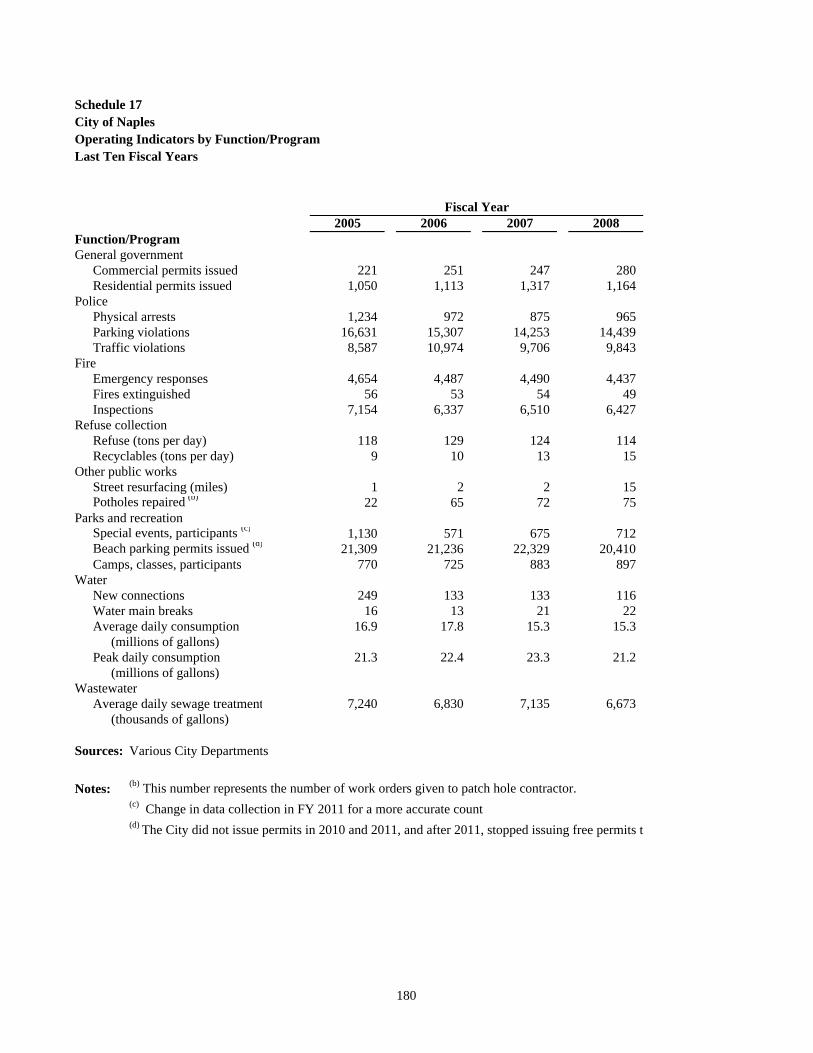
Schedule 17City of NaplesOperating Indicators by Function/ProgramLast Ten Fiscal Years
2005 2006 2007 2008Function/ProgramGeneral government
Commercial permits issued 221 251 247 280Residential permits issued 1,050 1,113 1,317 1,164
PolicePhysical arrests 1,234 972 875 965Parking violations 16,631 15,307 14,253 14,439Traffic violations 8,587 10,974 9,706 9,843
FireEmergency responses 4,654 4,487 4,490 4,437Fires extinguished 56 53 54 49Inspections 7,154 6,337 6,510 6,427
Refuse collectionRefuse (tons per day) 118 129 124 114Recyclables (tons per day) 9 10 13 15
Other public worksStreet resurfacing (miles) 1 2 2 15Potholes repaired (b) 22 65 72 75
Parks and recreationSpecial events, participants (c) 1,130 571 675 712Beach parking permits issued (d) 21,309 21,236 22,329 20,410Camps, classes, participants 770 725 883 897
WaterNew connections 249 133 133 116Water main breaks 16 13 21 22Average daily consumption 16.9 17.8 15.3 15.3
(millions of gallons)Peak daily consumption 21.3 22.4 23.3 21.2
(millions of gallons)Wastewater
Average daily sewage treatment 7,240 6,830 7,135 6,673(thousands of gallons)
Sources: Various City Departments
Notes: (b) This number represents the number of work orders given to patch hole contractor.(c) Change in data collection in FY 2011 for a more accurate count(d) The City did not issue permits in 2010 and 2011, and after 2011, stopped issuing free permits to
Fiscal Year
180

2009 2010 2011 2012 2013 2014
268 237 182 285 225 1441,994 828 961 1,267 1,229 1,133
3,164 658 465 1,111 758 63415,105 15,985 14,351 15,107 12,906 12,77811,087 7,601 5,641 8,168 6,767 5,489
4,810 4,423 4,812 4,839 4,901 5,21770 61 97 96 69 98
5,200 8,412 6,557 7,882 7,761 7,299
119 101 103 153 131 11914 10 12 17 19 21
11 9 9 5 5 4.2559 73 98 77 72 63
759 980 3,501 3,550 3,640 3,81215,921 N/A N/A 5,560 6,590 6,802
943 850 876 4,510 5,350 5,531
109 70 93 172 171 22668 16 12 16 21 14
16.0 14.7 15 14 13.5 14.3
20.4 19.2 18 19 17.8 19
6,720 6,330 5,852 5,688 5,680 5,225
o non-city residents
Fiscal Year
181
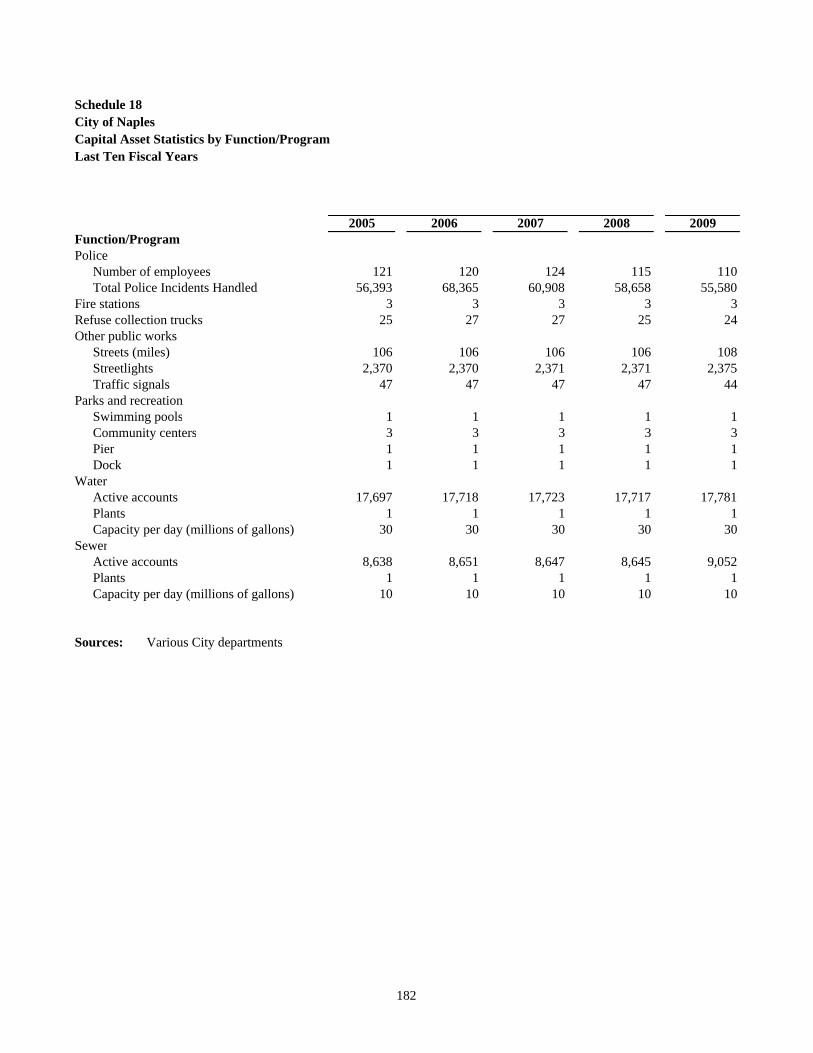
Schedule 18City of NaplesCapital Asset Statistics by Function/ProgramLast Ten Fiscal Years
2005 2006 2007 2008 2009Function/ProgramPolice
Number of employees 121 120 124 115 110Total Police Incidents Handled 56,393 68,365 60,908 58,658 55,580
Fire stations 3 3 3 3 3Refuse collection trucks 25 27 27 25 24Other public works
Streets (miles) 106 106 106 106 108Streetlights 2,370 2,370 2,371 2,371 2,375Traffic signals 47 47 47 47 44
Parks and recreationSwimming pools 1 1 1 1 1Community centers 3 3 3 3 3Pier 1 1 1 1 1Dock 1 1 1 1 1
WaterActive accounts 17,697 17,718 17,723 17,717 17,781Plants 1 1 1 1 1Capacity per day (millions of gallons) 30 30 30 30 30
SewerActive accounts 8,638 8,651 8,647 8,645 9,052Plants 1 1 1 1 1Capacity per day (millions of gallons) 10 10 10 10 10
Sources: Various City departments
182

Fiscal Year2010 2011 2012 2013 2014
104 98 104 103 10348,192 57,602 66,622 68,988 65,968
3 3 3 3 325 25 25 25 25
108 108 110 112 1122,390 2,390 3,006 1,388 1,170
44 44 42 42 42
1 1 1 1 13 3 3 3 31 1 1 1 11 1 1 1 1
16,495 16,545 16,684 16,791 16,9431 1 1 1 1
30 30 30 30 30
8,814 9,253 8,951 8,895 8,8121 1 1 1 1
10 10 10 10 10
183

This page intentionally left blank
184

1301 SIXTH AVENUE WEST, SUITE 600 • NAPLES, FLORIDA 34205-7440 • 941-747-4483 • 855-891-0070 • FAX 941-747-6035 1900 MAIN STREET, SUITE 750 • SARASOTA, FLORIDA 34236 • 941-955-1095 • FAX 941-747-6035
MEMBERS OF THE AMERICAN INSTITUTE OF CERTIFIED PUBLIC ACCOUNTANTS • WWW.MJCPA.COM
INDEPENDENT AUDITOR’S REPORT ON INTERNAL CONTROL OVER FINANCIAL REPORTING AND ON COMPLIANCE AND OTHER MATTERS BASED ON AN AUDIT OF
FINANCIAL STATEMENTS PERFORMED IN ACCORDANCE WITH GOVERNMENT AUDITING STANDARDS
To the Honorable Mayor, City Council and City Manager City of Naples, Florida We have audited, in accordance with the auditing standards generally accepted in the United States of America and the standards applicable to financial audits contained in Government Auditing Standards issued by the Comptroller General of the United States, the financial statements of the governmental activities, the business-type activities, each major fund, and the aggregate remaining fund information of the City of Naples, Florida (the “City”), as of and for the year ended September 30, 2014, and the related notes to the financial statements, which collectively comprise the City’s basic financial statements and have issued our report thereon dated March 31, 2015. Our report includes a reference to the changes in accounting principal resulting from the implementation of Governmental Accounting Standards Board (GASB) Statement No. 67, Financial Reporting for Pension Plans – an amendment to GASB No. 25 as of October 1, 2013. Internal Control Over Financial Reporting In planning and performing our audit of the financial statements, we considered the City’s internal control over financial reporting (internal control) to determine the audit procedures that are appropriate in the circumstances for the purpose of expressing our opinions on the financial statements, but not for the purpose of expressing an opinion on the effectiveness of the City’s internal control. Accordingly, we do not express an opinion on the effectiveness of the City’s internal control. Our consideration of internal control was for the limited purpose described in the preceding paragraph and was not designed to identify all deficiencies in internal control that might be material weaknesses or significant deficiencies and therefore, material weaknesses or significant deficiencies may exist that were not identified. However, as described in the accompanying schedule of findings and responses, we identified a certain deficiency in internal control that we consider to be a material weakness. A deficiency in internal control exists when the design or operation of a control does not allow management or employees, in the normal course of performing their assigned functions, to prevent, or detect and correct, misstatements on a timely basis. A material weakness is a deficiency, or a combination of deficiencies, in internal control such that there is a reasonable possibility that a material misstatement of the entity’s financial statements will not be prevented, or detected and corrected on a timely basis. A significant deficiency is a deficiency, or a combination of deficiencies, in internal control that is less severe than a material weakness, yet important enough to merit attention by those charged with governance. We consider the deficiency described in the accompanying Management Letter as Finding 2014-01 to be a material weakness.

186
Compliance and Other Matters As part of obtaining reasonable assurance about whether the City’s financial statements are free of material misstatement, we performed tests of its compliance with certain provisions of laws, regulations, contracts, and grant agreements, noncompliance with which could have a direct and material effect on the determination of financial statement amounts. However, providing an opinion on compliance with those provisions was not an objective of our audit, and accordingly, we do not express such an opinion. The results of our tests disclosed no instances of noncompliance or other matters that are required to be reported under Government Auditing Standards. City’s Response to Findings The City’s response to the finding identified in our audit is described in the accompanying Management Letter. The City’s response was not subjected to the auditing procedures applied in the audit of the financial statements and, accordingly, we express no opinion on it. Purpose of this Report The purpose of this report is solely to describe the scope of our testing of internal control and compliance and the results of that testing, and not to provide an opinion on the effectiveness of the entity’s internal control or on compliance. This report is an integral part of an audit performed in accordance with Government Auditing Standards in considering the entity’s internal control and compliance. Accordingly, this communication is not suitable for any other purpose. Bradenton, Florida March 31, 2015

1301 SIXTH AVENUE WEST, SUITE 600 • NAPLES, FLORIDA 34205-7440 • 941-747-4483 • 855-891-0070 • FAX 941-747-6035 1900 MAIN STREET, SUITE 750 • SARASOTA, FLORIDA 34236 • 941-955-1095 • FAX 941-747-6035
MEMBERS OF THE AMERICAN INSTITUTE OF CERTIFIED PUBLIC ACCOUNTANTS • WWW.MJCPA.COM
INDEPENDENT AUDITOR'S MANAGEMENT LETTER
To the Honorable Mayor, City Council and City Manager City of Naples, Florida Report on the Financial Statements We have audited the financial statements of the City of Naples, Florida (the "City"), as of and for the fiscal year ended September 30, 2014, and have issued our report thereon dated March 31, 2015. Auditor’s Responsibility
We conducted our audit in accordance with auditing standards generally accepted in the United States of America; the standards applicable to financial audits contained in Government Auditing Standards, issued by the Comptroller General of the United States; and Chapter 10.550, Rules of the Auditor General. Other Reports and Schedule We have issued our Independent Auditor’s Report on Internal Control over Financial Reporting and On Compliance and Other Matters Based on an Audit of Financial Statements Performed in Accordance with Government Auditing Standards. Disclosures in that report, which is dated March 31, 2015, should be considered in conjunction with this management letter. Prior Audit Findings Section 10.554(1)(i)1., Rules of the Auditor General, requires that we determine whether or not corrective actions have been taken to address findings and recommendations made in the preceding annual financial audit report. Corrective actions have been taken to address findings and recommendations made in the preceding annual financial audit report as findings 2013-01 and 2013-02 were corrected during the current year and are not repeated in this year’s report. Official Title and Legal Authority Section 10.554(1)(i)4., Rules of the Auditor General, requires that the name or official title and legal authority for the primary government and each component unit of the reporting entity be disclosed in this management letter, unless disclosed in the notes to the financial statements. The City of Naples, Florida was incorporated in 1923. Additional information on the City’s creation and the City’s component units is disclosed within the City’s footnotes. Financial Condition Section 10.554(1)(i)5.a., Rules of the Auditor General, requires that we report the results of our determination as to whether or not the City has met one or more of the conditions described in Section 218.503(1), Florida Statutes, and identification of the specific condition(s) met. In connection with our audit, we determined that the City did not meet any of the conditions described in Section 218.503(1), Florida Statutes.
188
Pursuant to Sections 10.554(1)(i)5.c. and 10.556(8), Rules of the Auditor General, we applied financial condition assessment procedures. It is management’s responsibility to monitor the City’s financial condition, and our financial condition assessment was based in part on representations made by management and the review of financial information provided by same. Annual Financial Report Section 10.554(1)(i)5.b., Rules of the Auditor General, requires that we report the results of our determination as to whether the annual financial report for the City for the fiscal year ended September 30, 2014, filed with the Florida Department of Financial Services pursuant to Section 218.32(1)(a), Florida Statutes, is in agreement with the annual financial audit report for the fiscal year ended September 30, 2014. In connection with our audit, we determined that these two reports were in agreement. Special District Component Units Section 10.554(1)(i)5.d, Rules of the Auditor General, requires that we determine whether or not a special district that is a component unit of a county, municipality, or special district, provided the financial information necessary for proper reporting of the component unit, within the audited financial statements of the county, municipality, or special district in accordance with Section 218.39(3)(b), Florida Statutes. In connection with our audit, we determined that all special district component units provided the necessary information for proper reporting in accordance with Section 218.39(3)(b), Florida Statutes. Other Matters Section 10.554(1)(i)2., Rules of the Auditor General, requires that we address in the management letter any recommendations to improve financial management. In connection with our audit, we did not have any such recommendations. Section 10.554(1)(i)3., Rules of the Auditor General, requires that we address noncompliance with provisions of contracts or grant agreements, or abuse, that have occurred, or are likely to have occurred, that have an effect on the financial statements that is less than material but which warrants the attention of those charged with governance. In connection with our audit, we did not have any such findings. Purpose of this Letter Our management letter is intended solely for the information and use of the Legislative Auditing Committee, members of the Florida Senate and the Florida House of Representatives, the Florida Auditor General, Federal and other granting agencies, the Mayor and Members of the City Council, and applicable management, and is not intended to be and should not be used by anyone other than these specified parties. Bradenton, Florida March 31, 2015

189
Current Year Audit Findings and Recommendations
2014 – 01. Audit Adjustments
The City is responsible for accurate financial reporting which includes detecting and preventing misstatements in the financial statements, as well as within the underlying financial records. As a result of this year’s audit, significant audit adjustments were necessary for the fair presentation of the financial statements in accordance with generally accepted accounting principles. These entries related to a material adjustment for the recognition of unbilled accounts receivable in the Water and Sewer Fund, Sanitation Fund, and Stormwater Fund. Additionally, various entries were made to recognize transactions in the proper fiscal year. Therefore, we recommend that the City implement procedures to ensure all reconciliations are performed and closing entries are recorded to ensure the preparation of financial statements in accordance with generally accepted accounting principles. Management’s Response The City booked accounts receivable (for utility bills not mailed until after 9/30) in the three enterprise funds in a timely manner, and used the same method used in prior years, which was an average of all bills for two months, divided by two. This resulted in a similar amount being recorded as an Accounts Receivable in FY 14 as in prior years. However, after review with the auditors, the City and the Auditors determined it was more accurate to prorate each billed route for October and November based on the number of days billed, which resulted in a much higher Accounts Receivable booked at year end. This method should be used in the future. The recognition of transactions in the proper fiscal year was not a major issue in FY 13-14 but there were several large payments made in November and December FY14-15 that should have been booked in FY 13-14 as an Accounts Payable. Staff will continue to work with each department to get vendor payments made within a reasonable time after year-end. Large payments will always have a Senior Accountant review for proper year recognition.

190
This page intentionally left blank

191
INDEPENDENT AUDITOR’S REPORT
To the Honorable Mayor, City Council and City Manager City of Naples, Florida We have examined the City of Naples, Florida’s (the “City”) compliance with Section 218.415, Florida Statutes, regarding the investment of public funds during the year ended September 30, 2014. Management is responsible for the City’s compliance with those requirements. Our responsibility is to express an opinion on the City’s compliance based on our examination. Our examination was conducted in accordance with attestation standards established by the American Institute of Certified Public Accountants and, accordingly, included examining, on a test basis, evidence about the City’s compliance with those requirements and performing such other procedures as we considered necessary in the circumstances. We believe that our examination provides a reasonable basis for our opinion. Our examination does not provide a legal determination on the City’s compliance with specified requirements. In our opinion, the City complied, in all material respects, with the aforementioned requirements for the year ended September 30, 2014. This report is intended solely for the information and use of the City and the Auditor General, State of Florida, and is not intended to be and should not be used by anyone other than these specified parties. Bradenton, Florida March 31, 2015