The Circular Relationship between Inequality, … · linkage between inequality and credit, one has...
75
Highlights The financial crisis of 2007-2008 renewed interest around the finance-nexus inequality, when some, like Rajan (2010), pointed at growing inequality as the main determinant of the credit bubble. Various, intertwined influences underlie the two-way relationship between inequality and finance. The literature finds evidence of a positive causal relationship from inequality to credit, but cofounding factors are also certainly at play. Credit booms appear to be the main determinant of financial crises. Distributional impact of financial dynamics are less clear, but a majority of studies conclude to an increase of inequality following a financial crisis. The Circular Relationship between Inequality, Leverage, and Financial Crises: Intertwined Mechanisms and Competing Evidence No 2014-22 – December Working Paper Rémi Bazillier & Jérôme Héricourt
Transcript of The Circular Relationship between Inequality, … · linkage between inequality and credit, one has...

Highlights
The financial crisis of 2007-2008 renewed interest around the finance-nexus inequality, when some, like Rajan (2010), pointed at growing inequality as the main determinant of the credit bubble.
Various, intertwined influences underlie the two-way relationship between inequality and finance.
The literature finds evidence of a positive causal relationship from inequality to credit, but cofounding factors are also certainly at play.
Credit booms appear to be the main determinant of financial crises.
Distributional impact of financial dynamics are less clear, but a majority of studies conclude to an increase of inequality following a financial crisis.
The Circular Relationship between Inequality, Leverage, and Financial Crises:
Intertwined Mechanisms and Competing Evidence
No 2014-22 – December Working Paper
Rémi Bazillier & Jérôme Héricourt

CEPII Working Paper Inequality, Leverage and Financial Crises
Abstract The academic interest around the well-known inequality-finance nexus has recently been the subject of a renewed attention. A recent, yet flourishing literature started pointing inequality as a possible cause credit bubbles, leading to financial crises. Based on the existing literature, this paper aims at disentangling the various influences underlying the two-way relationship between inequality and finance, by focusing on a causality chain made of three main links: inequality, credit, and financial crises. The literature finds evidence of a positive causal relationship from inequality to credit, both direct (a rise of credit demand as a result of high inequalities) and indirect (inequality incites governments to support credit supply in order to maintain aggregate consumption); coincident factors are not to be excluded either (financial deregulation increasing simultaneously both inequalities and leverage). As credit booms appear to be the main determinant of financial crises, the possible direct and indirect impact of inequalities on such booms is a fundamental dimension to be taken into account by policymakers. Finally, the literature does not provide decisive conclusions concerning the sign of the distributional impact of financial development, financial deregulation and financial crises. It is fair to say however, that a majority of studies conclude to an increase of inequality following a financial crisis. The gaps identified in the literature allow pointing at several avenues for future research.
KeywordsFinance, Inequality, financial crises, household debt.
JELD31, D33, E25, E50, G18.
CEPII (Centre d’Etudes Prospectives et d’Informations Internationales) is a French institute dedicated to producing independent, policy-oriented economic research helpful to understand the international economic environment and challenges in the areas of trade policy, competitiveness, macroeconomics, international finance and growth.
CEPII Working PaperContributing to research in international economics
© CEPII, PARIS, 2014
All rights reserved. Opinions expressed in this publication are those of the author(s) alone.
Editorial Director: Sébastien Jean
Production: Laure Boivin
No ISSN: 1293-2574
CEPII113, rue de Grenelle75007 Paris+33 1 53 68 55 00
www.cepii.frPress contact: [email protected]
Working Paper

CEPII Working Paper ou Document de travail du CEPII Inequality, Leverage and Financial Crises
3
The Circular Relationship between Inequality, Leverage, and Financial Crises:
Intertwined Mechanisms and Competing Evidence Rémi Bazillier
1 and Jérôme Hericourt
2
1. Introduction
Triggered by the exchange and interest rates instability produced by the collapse of the International Monetary System of the Bretton-Woods agreements and the deregulation reforms initiated in developed countries, the development of financial sphere since the end of the 1970s has been first presented as the relevant tool to increase efficiency in the allocation of capital and therefore economic growth. But almost exactly at the same moment, financial instability, a phenomenon forgotten since the early 1930s, came out of oblivion. Indeed, financial crises are a recurrent phenomenon in both developed and developing economies, with an increasing frequency since the mid-1970s. Financial instability became a part of the macroeconomic picture since then, with regular episodes of more or less massive asset depreciation. However, the most recent one in 2007-2008, often referred to as the “subprime crisis”, is distinguishable from the other in two important aspects. Firstly, the consequences on the real sector have been brutal, massive and long-lasting, with decreases of GDP standing between 3 and 5% and skyrocketing unemployment in most developed countries. It appeared very quickly that the “Great Recession”, could only be compared to the 1930s’ Great Depression. Secondly, the very name of this crisis (subprimes) pointed to a specific origin: excess mortgage credit to low-income/low-asset/low credit score households.
It is only quite recently that academic attention was drawn on the simultaneous rise in both income and wealth inequalities occurring in parallel to the development of financial sphere. On that ground, the works by Thomas Piketty (see, among many others, Piketty, 2003; Atkinson, Piketty and Saez, 2011), and more specifically his book “Capital in the 21st century”, made decisive contributions by emphasizing the rise in top 1% income and the concentration of wealth over the past thirty years. Even less expected was the direct, causal relationship made between those rising inequalities, excess leverage of poor households and financial crisis which became increasingly advocated by academic economists at the beginning of the year 2010s. The debate entered the public sphere with the book by Rajan (2010), ‘Fault Lines’, where the author argues that rising income inequality constrained low and middle-income households to increase their indebtedness in order to maintain their consumption level, buffering temporarily the impact on GDP growth.
1 Univ.Orléans, LEO, CNRS UMR 7322, [email protected] 2 Univ. Bretagne Occidentale, EQUIPPE and CEPII, [email protected]

CEPII Working Paper ou Document de travail du CEPII Inequality, Leverage and Financial Crises
4
Claessens and Perotti (2007) authored an extensive review of cross-country and case evidence on the circular dynamics between finance an inequality, with a focus on the causal impact from the former to the latter. They point to a decisive impact of a country’s institutional environment in shaping the very direction of this relationship, the influence of political and economic elites being decisive. Inequality affects the distribution of political influence, so financial regulation is often easily captured by established interests in unequal countries. If one wants the expansion of financial sphere to really benefit the most people, a key condition is therefore to prevent insiders to capture financial regulation to preserve their own, established interests. Claessens and Perotti (2007) provide evidence that captured reforms in developing countries deepen rather than broaden access to credit, and produce concentrated benefits while risks become socialized. Therefore, financial liberalization motivated to increase access may in practice increase fragility and inequality. To reduce effectively inequality, in addition to a buildup in oversight institutions, liberalization reforms should aim explicitly at reducing inequality of access and maintaining competition.
Focusing more exclusively on the reverse relationship (i.e., from inequality to finance), Van Treeck (2014) recently provided an extensive review of the various arguments supporting that rising inequalities did cause the 2007-2008 US financial crisis. The starting point is that easy credit helped lower and middle income households to keep up with the higher consumption levels of top income households since income inequality started to soar in the United States in the early 1980s. This has contributed to the emergence of a credit bubble, which eventually burst and triggered the Great Recession. Van Treeck (2014) proposes different rationalizations of these macroeconomic trends in the context of competing theories of consumption. On the one hand, supply-side arguments emphasize the role of government in promoting credit to those households with declining relative incomes. On the other hand, demand-side arguments put emphasis on the proactive will of low/middle income households to maintain their consumption level relatively to the one of top income households. As emphasized by Van Treeck (2014) himself, the current state of the literature does not provide clear quantitative assessments of the contributions of each type of factors in the surge of household indebtedness.
Starting from these contributions, our goal in this paper is to take several steps further, first by reviewing consistently this two-way relationship between inequality and finance. In other words, beyond a simple inventory of the papers supporting one causal relationship (from inequality to finance) or the other (from finance to inequality), our purpose here is to disentangle the various influences underlying this two-way-causality. A second, important objective of this paper is to put emphasis on several, potentially confounding factors acting behind these reciprocal influences. Finally, an additional contribution, more specifically focused on the causal relationship from inequality to finance, is to enlarge the scope beyond the US case to other financial crises and other countries with different institutions.
CEPII Working Paper ou Document de travail du CEPII Inequality, Leverage and Financial Crises
5
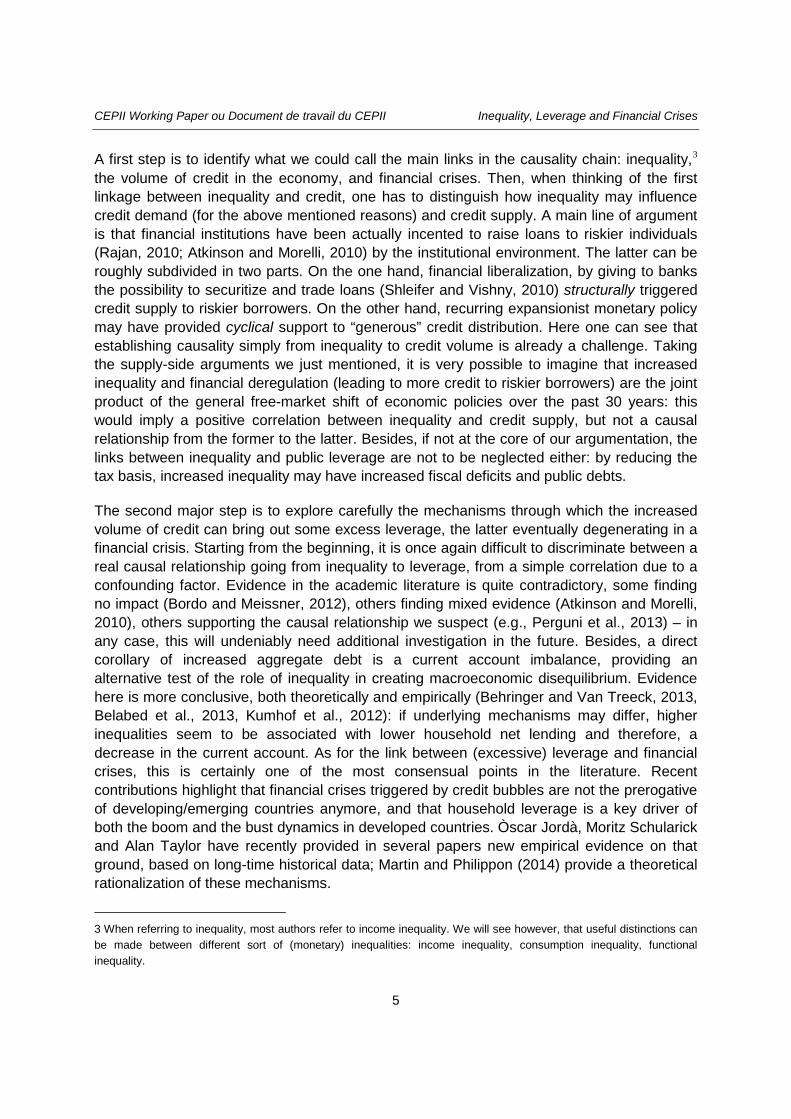
A first step is to identify what we could call the main links in the causality chain: inequality,3 the volume of credit in the economy, and financial crises. Then, when thinking of the first linkage between inequality and credit, one has to distinguish how inequality may influence credit demand (for the above mentioned reasons) and credit supply. A main line of argument is that financial institutions have been actually incented to raise loans to riskier individuals (Rajan, 2010; Atkinson and Morelli, 2010) by the institutional environment. The latter can be roughly subdivided in two parts. On the one hand, financial liberalization, by giving to banks the possibility to securitize and trade loans (Shleifer and Vishny, 2010) structurally triggered credit supply to riskier borrowers. On the other hand, recurring expansionist monetary policy may have provided cyclical support to “generous” credit distribution. Here one can see that establishing causality simply from inequality to credit volume is already a challenge. Taking the supply-side arguments we just mentioned, it is very possible to imagine that increased inequality and financial deregulation (leading to more credit to riskier borrowers) are the joint product of the general free-market shift of economic policies over the past 30 years: this would imply a positive correlation between inequality and credit supply, but not a causal relationship from the former to the latter. Besides, if not at the core of our argumentation, the links between inequality and public leverage are not to be neglected either: by reducing the tax basis, increased inequality may have increased fiscal deficits and public debts.
The second major step is to explore carefully the mechanisms through which the increased volume of credit can bring out some excess leverage, the latter eventually degenerating in a financial crisis. Starting from the beginning, it is once again difficult to discriminate between a real causal relationship going from inequality to leverage, from a simple correlation due to a confounding factor. Evidence in the academic literature is quite contradictory, some finding no impact (Bordo and Meissner, 2012), others finding mixed evidence (Atkinson and Morelli, 2010), others supporting the causal relationship we suspect (e.g., Perguni et al., 2013) – in any case, this will undeniably need additional investigation in the future. Besides, a direct corollary of increased aggregate debt is a current account imbalance, providing an alternative test of the role of inequality in creating macroeconomic disequilibrium. Evidence here is more conclusive, both theoretically and empirically (Behringer and Van Treeck, 2013, Belabed et al., 2013, Kumhof et al., 2012): if underlying mechanisms may differ, higher inequalities seem to be associated with lower household net lending and therefore, a decrease in the current account. As for the link between (excessive) leverage and financial crises, this is certainly one of the most consensual points in the literature. Recent contributions highlight that financial crises triggered by credit bubbles are not the prerogative of developing/emerging countries anymore, and that household leverage is a key driver of both the boom and the bust dynamics in developed countries. Òscar Jordà, Moritz Schularick and Alan Taylor have recently provided in several papers new empirical evidence on that ground, based on long-time historical data; Martin and Philippon (2014) provide a theoretical rationalization of these mechanisms.
3 When referring to inequality, most authors refer to income inequality. We will see however, that useful distinctions can be made between different sort of (monetary) inequalities: income inequality, consumption inequality, functional inequality.

CEPII Working Paper ou Document de travail du CEPII Inequality, Leverage and Financial Crises
6
The third and final step focuses on the reverse relationship, namely, the distributional consequences of finance. Here one must be very careful what lies behind the word “finance”, and distinguish explicitly between the behavior of the financial sphere in “normal times” (ie, outside the periods of financial turmoil) and what happens in periods of massive financial instability. The first dimension relates to the expected impact of the dynamics (both quantitative and qualitative) of the financial sector on inequality. Until recently, the conventional academic wisdom (strongly supported, among others, by Ross Levine) was that the quantitative enlargement of the financial sphere (involving more credit and financial services) would systematically reduces income inequality, by allowing the more constrained individuals (mostly, the poor) to access external finance. This belief is nevertheless challenged by studies (e.g., Greenwood and Jovanovic, 1990) pointing a not-so-linear relationship: depending on the level of overall economic development and the existence of rent-capturing behavior of elites, quantitative financial development may as well increase overall inequality. As for the qualitative aspect of financial dynamics, conclusions are much firmer: most studies find that financial liberalization and deregulation actually increase inequalities. Poor institutions favoring rent-capturing behaviors (Claessens and Perotti, 2007) and inability of the financial sector to promote transparency and to allocate resources optimally are the main explanations. The second dimension relates to the specific, distributional impact of financial crises. If the overall impact on output seems negative, it is strongly heterogeneous across the type of crisis (banking, currency, or both), the time and geographical coverage of the studies. As for the distributional impacts themselves, they are quite debated and there is no consensus on the sign of the relationship. It is fair to say however, that a majority of studies conclude to an increase of both income and functional inequality (i.e., a decrease in the labor share) following a financial crisis. In this respect, fiscal consolidation may play a non-negligible role in this negative distributional impact (see, among others, Ball et al., 2013).
All these various and intertwined mechanisms potentially underlying the two-way relationship between finance and inequality are summarized in Figure 1 (arrows point the direction of potential causality).
In a few words, evidence presented in this paper about the inequality-finance nexus may appear mixed for some channels in the main causation chain inequality-leverage-crises. The causal impact of inequality on leverage appears to be a first strand calling for additional research. On the macro side, stronger empirical evidence should be based, among other things, on appropriate measures of household leverage (real estate and if possible, short-term finance) and take a careful account of endogeneity problems. On the micro side, households survey data may be used to assess the relevance of certain behavioral hypotheses for households (in case of a permanent negative income shock, do they borrow too much because they anticipate incorrectly that the decrease in their income is temporary? Or are they aware that this decrease is permanent, and borrow in order to support their consumption level relatively to top income households?). Secondly, while it appears clearly that financial sphere does have an impact on inequality, the direction of this impact is not entirely clear. While the results seem to fluctuate with the database used for measuring

CEPII Working Paper ou Document de travail du CEPII Inequality, Leverage and Financial Crises
7
inequality, future studies should also carefully take into account the quality of institutions, which seems key to resolve the apparent contradictions of the literature on that ground (see again Claessens and Perotti, 2007).
The remaining of the paper is organized as follows. The following section introduces some descriptive evidence pointing at a positive correlation between income inequality and the growth of financial sphere, before presenting several mechanisms linking inequality and both credit supply and demand. Section 3 splits the complex linkages between inequality, leverage and financial crises up, starting with the links between inequality and leverage; a complementary channel going through the current account balance is then investigated, before showing evidence concerning the link between leverage and financial crises. Section 4 looks into the possible reverse causations between finance and inequality, discriminating between the dynamics of the financial sphere in “normal times” and the periods of financial crises. Section 5 concludes and suggests future avenues of research.
Figure 1: a complex tangle of mechanisms

CEPII Working Paper ou Document de travail du CEPII Inequality, Leverage and Financial Crises
8
2. Is there an Inequality effect on indebtedness?
2.1. Inequality and Finance: some intriguing anecdotal evidence
Most industrialized countries faced an increase in their public and private indebtedness in the last decades. This increase in leverage raised some concerns both about financial instability and the sustainability of current account imbalances. This process has been well documented for the US (Greenwood and Scharfstein 2013), for which the credit boom has been seen as a major determinant of the financial crisis. This credit boom has also been observed for other countries, including a significant number of European countries, but also some emerging economies such as China or Korea. Figure 2 represents the evolution of private credit by banks and other financial Institutions (in percentage of GDP) between 1995 and 2010. In countries like Spain, the share of credit has multiplied by 3 (from 70 % in 1995 to 210 % in 2010).
Figure 2: Private Credit (1995-2010) – Selected countries
Source: Financial Development and Structure Dataset (Beck et al. 2000, 2009; Cihak et al. 2012), Base 1 in 1995
Meanwhile, there has been a renewed interest in the topic of inequalities. “Bringing income distribution in from the cold”: in his 1997 presidential address to the Royal Economic Society, Atkinson (1997) calls for new researches related to income distribution. Since then, several studies have focused on the long-run changes in the distribution of income and wealth. Piketty (2003) documented the long-run evolutions of inequalities in France, while Piketty and Saez (2003) did it for the US. They showed that level of inequalities was relatively stable in the long-run while the decrease in inequalities observed during the century was mainly the result of negative shocks due to the first and the second World Wars. Piketty and Saez

CEPII Working Paper ou Document de travail du CEPII Inequality, Leverage and Financial Crises
9
(2006) and Atkinson, Piketty and Saez (2011) show how top incomes have dramatically increased since the eighties, mostly in developed, English-speaking countries but also in emerging ones like India or China. This increasing share of top incomes has been driven by the rise of top wages, comprising a larger fraction of top incomes than in the past. Figure 3 from Piketty and Saez (2013) shows the evolution of the top decile income share in the US, the UK, Germany and France. We clearly see a breakdown in the downward tendency occurring at the end of the seventies – beginning of eighties.
Figure 3: Top Decile Income Shares, 1910-2010
Source: World Top Income Database 2012, in Piketty and Saez (2013)
For illustrative purpose, we describe the evolutions of the top percentile income share and private credit based on the World Top Income Database and the Financial Structure Dataset. The strong correlation between the two dynamics is striking, not only for the US and UK but also for European Continental countries (such as Spain but also France) and China (see Figure 4). This convergence trend is particularly strong after 1990 and even more after 1995 – 2000. Of course, at this stage, we just present correlations. As emphasized by Atkinson and Morelli (2011), there is a distinction to make between analyses focusing on a causal impact of inequality on debt and crisis, and the ones focusing on possible common cause of both phenomenon. Also, if there is a causal impact, it is worthwhile to analyze if it comes from an overall inequality effect, or from inequality at the top, and/or from inequality at the bottom.
Before studying the consequences of credit boom on financial instability and financial crises, we propose to review the main explanations of such booms, focusing on the potential causal

CEPII Working Paper ou Document de travail du CEPII Inequality, Leverage and Financial Crises
10
impact or coincidental role of inequalities. The literature has focused so far on credit demand and credit supply channels to explain such leverage. We will follow this distinction in the next section, focusing firstly on the explanations of private indebtedness. Afterwards, we will also review papers focusing on inequalities and public debt, as it can also be a factor of crisis.
2.2. Credit Demand: the role of inequalities
Three possible channels inducing a causal impact of inequalities on private indebtedness are commonly studied. The first two ones relate to consumption behavior, the third one goes back to the level of aggregate demand. A critical point is that the theoretical mechanisms will be very different if the rise of inequality is explained by a higher dispersion of transitory income or by a shift of permanent income between social groups. According to the permanent income theory, leverage may be seen as a rational answer to a higher dispersion of transitory income. But if the shift of income is permanent, alternative theories should be mobilized to explain why households decide to increase their borrowings in response to stagnant incomes. The last two subsections will focus on such theories.
2.2.1. A higher dispersion of transitory income?
The first explanation comes from a higher dispersion of the transitory component of income. Using Italian data, Krueger and Perri (2011) show how credit can be used to smooth consumption when facing income shocks. Krueger and Perri (2006) find that the increase in US income inequalities observed in the last 25 years has not been followed by an increase in consumption inequalities. They argue that income distribution may be not a good proxy of allocation of welfare since a significant share of income variations is transitory and does not affect permanent income. Then, if the volatility of transitory income is increasing (reflecting higher income inequalities in the short run), the smoothing of consumption through credit may be a rational answer of consumers facing a negative income shock. They develop a theoretical model with endogenous debt constraints to explain such dynamics. Their main result is that the structure of credit markets in an economy is endogenous and may evolve in response to higher income volatility. This gap between income and consumption inequalities may have kept widening during the crisis. In a recent paper, Meyer and Sullivan (2013) show that income inequality have risen by 19 % between 2000 and 2011 in the US. In contrast, consumption inequalities increased until 2005, then they decreased to reach in 2011 a lower level than the one observed in 2000.
Iacoviello (2008) proposes a quantitative dynamic model to replicate the observed simultaneity between evolutions of inequalities and household debt. He explains the rise in debt after 1980 by the increased level of income volatility. The model shows that the permanent increase in income volatility after 1980 has been the main driver of credit boom. By focusing on income volatility, he focuses also on the transitory component of income.

CEPII Working Paper ou Document de travail du CEPII Inequality, Leverage and Financial Crises
11
Figure 4. Top 1% Income Share and Private Credit (% GDP)

CEPII Working Paper ou Document de travail du CEPII Inequality, Leverage and Financial Crises
12
Note that the Krueger and Perri (2006) argument relates only to within-groups and not to between-groups inequalities. It is very important as within-group inequalities are more likely to be transitory and explained by higher income volatility for individuals. Between-group inequalities are more likely to reflect a permanent or uninsurable income transfer, explained by other factors. According to their estimations, there were no differences between consumption and income inequalities, as far as between-groups inequalities are concerned. In order to make such distinction between within and between groups inequalities, they regress income and consumption inequalities on sex, race, years of education, experience, interaction terms between experience and education, dummies for managerial/professional occupation and region of residence. The cross-sectional variance explained by these characteristics is interpreted as between-group inequality while the residual variance is seen as the within-group inequality.
If expectations of consumers are correct (in particular regarding the transitory feature of the income shocks they are facing) and if income shocks are indeed transitory, the relation between inequality and leverage may not be a factor of crisis. Such increase in leverage would be a direct answer to higher risks (volatility) and better risk-sharing among groups. As mentioned by Kopczuk et al. (2010), “market economies also generate substantial mobility in earnings over a working lifetime. As a result, annual earnings inequality might substantially exaggerate the extent of true economic disparity among individuals” (p.91). If it the case, the consequences of such rise of inequalities would be less severe. It is therefore very important to understand the dynamics explaining the evolution of inequalities. Krueger and Peri (2006) main argument is based on the idea that increased inequalities are explained by higher idiosyncratic labor income shocks and reflect higher variations of transitory income.
This assumption is challenged by several authors. First, Van Treeck (2014) argues that the distinction, made by Krueger and Peri (2006), between within-group inequalities (assumed to be transitory) and between-group inequalities (assumed to be permanent) may be conceptually problematic. He argues that the set of individual characteristics used to define between-group inequality may be too limited and therefore the estimation of between-group inequality may be underestimated. Second, Kopczuk et al. (2010) show that income mobility has slightly decreased since the 1950s in the US. This result contradicts the hypothesis that the rise of inequalities was explained by a higher income mobility and volatility. Moffitt and Gottschalk (2002, 2008) also find that the variance of transitory income declined or remained constant after 1980, contrary to the variance of permanent income (see also Sablehaus and Song 2009).
As argued by Piketty and Saez (2013), if households perceive the income shock to be permanent, they should adjust their consumption accordingly and no changes of liabilities or assets should be observed. But if increased inequalities are explained by a permanent income shock and not by an increase of income mobility, it would mean that the growing gap between income inequality and consumption inequality may have led to unsustainable increases in leverage. We therefore need to understand why households did not adjust their consumption accordingly.

CEPII Working Paper ou Document de travail du CEPII Inequality, Leverage and Financial Crises
13
2.2.2. “Keeping-up with the Joneses” and the Relative Income Hypothesis
Piketty and Saez (2013) insist on the massive income shift observed in the US since the early 80s: « the bottom 90 percent has become poorer, the top 10 percent has become richer, with an income transfer over 15 percent of US national income. This was a permanent income transfer.» If the transfer was really permanent, the only way to explain such increase in leverage, in the permanent consumption theory framework, is that households did not perceive immediately the income shock to be permanent (i.e., they made errors of expectations), or tried to resist it. Bertrand and Morse (2013) argues that households may not adjust totally their consumption to their income if the welfare loss induced by such consumption cut is too large in the short run. Piketty and Saez (2013) compute that if the bottom 90 percent cuts its consumption level by the half of the negative income shock they faced (7.5% of GDP instead of 15%), it will be sufficient to explain an increase by the equivalent of 75% of households' debt, which is roughly what was observed.
Since Veblen (1899), it is well-known that the overall level of satisfaction derived from a given level of consumption depends not only on the current consumption level itself, but also on how it compares with some benchmark levels. In microeconomic theoretical terms, one will speak of ''time non-separable'' preference functions, with two types of reference consumption. The first is based on an external criterion, expressed in terms of the past consumption of some outside reference group, typically the average consumption of the overall economy. This is often referred to as ''keeping up with the Joneses'', and the agent being described as ''outward-looking''. The second criterion is an internal one based on the individual's own past consumption levels. It is often referred to as characterizing ''habit-formation'', and the agent being described as ''inward-looking''.
Relative income hypothesis use very similar arguments. This theory initially proposed by Duesenberry (1949) suggests that households' consumption is a function of the household position in the income distribution and past levels of consumptions. Van Treeck (2014) argues that it is one of the main explanation of a relatively high consumption path of lower and middle-class households despite the stagnation of their income.
Franck et al. (2014) propose a theory of ''expenditure cascade'' which is in line with the relative income theory hypothesis. Here the rise of the top incomes may have a direct impact on the consumption of the poorest households through this ''expenditure cascade''. More precisely, ''Changes in one group’s spending shift the frame of reference that defines consumption standards for others just below them on the income scale, giving rise to expenditure cascades.'' (Franck et al.2014, p. 55). Here, the driving force is the income boom of the richest and its consequences on consumption behaviors of low income.
These arguments closely relate to the so-called ''Stiglitz hypothesis'' (as referred by Atkinson and Morelly, 2011). According to Stiglitz (2009), increase in leverage is explained by the willingness of poorest households to maintain their living standards in a context of income stagnation. Here, the driving force is not anymore the income boom of the richest but rather

CEPII Working Paper ou Document de travail du CEPII Inequality, Leverage and Financial Crises
14
the comparison with past living standards for households facing a relative worsening of their income. A similar argument is used by Kumhof and Ranciere (2010), and is consistent with the structure of household debt by income level. As noted by these authors, the top 5% households had a higher level of debt (by 15%) than the bottom 95% in 1983. In 2007, situation has reversed: the debt-to-income ratio of the bottom 95% was twice as high as the one of the top 5%.
Contrary to the explanation related to the higher level of transitory income, these hypothesis are consistent with empirical studies showing a permanent shift of income from the bottom 95% to the top 5%. However, Coibion, Gorodnichenko, Kudlyak, and Mondragon (2014) challenge this hypothesis using US household data. They propose to test the “keeping up with the Joneses” hypothesis by studying the impact of local inequality on household indebtedness. In their view, it is the most relevant metric for “keeping up with the Joneses”. They also claim that most of the rise in income inequality in the US since the 1970s is explained by a rise in within-regions inequalities rather that inequalities across regions. They find that low-income households in high-inequality regions borrowed relatively less than similar households in low-inequality regions. They argue that it invalidates the credit-demand channel and that supply side factors “are being at the root of the differential debt accumulation patterns” (see the following section). However, they do find a significant impact of the level of income on debt accumulation. If the poorest tend to borrow more, an overall, identical, increase in inequality (both in low and high inequality regions), will lead to an increase in debt.
2.2.3. Under-consumption theories and the level of aggregate demand
The two previous explanation relies on consumer behaviors. Another set of theories focus on the insufficient aggregate level of demand resulting from an increased level of inequalities. Atkinson and Morelli (2011) labeled it the ''under-consumption theories''. This argument is far to be new, going back to both Marx and Galbraith. The former focusing on the ''poverty and restricted consumption of the masses'' to explain crises (Marx, Capital Vol. III, ch. 30 quoted by Atkinson and Morelli 2011). The latter identified the ''distribution of income'' as the first ''weaknesses'' of the US economy before the 1929 Great Depression (Galbraith, 1954). When income distribution is very unequal, a high level of demand relies on investment and luxury consumption which may not be enough. This idea is supported by Fitoussi and Saraceno (2010) : ''at the outset there is an increase in inequalities which depressed aggregate demand and prompted monetary policy to react by maintaining a low level of interest rate which itself allowed private debt to increase beyond sustainable levels”(p. 4).
All these possible theoretical channels imply a causal link from inequalities to leverage. Kumhof and Ranciere (2010) propose a theoretical model including such mechanisms related to the credit demand. Workers borrow to ''limit their drop in consumption following their loss of income'' (p. 3) which in turns lead to financial fragility. Contrary to Krueger and Peri (2006), they relies on inequalities between households groups and not within groups. The goal is to model the consequence of the permanent and massive shift of income

CEPII Working Paper ou Document de travail du CEPII Inequality, Leverage and Financial Crises
15
described by Piketty and Saez (2013). It is not clear in their model why households borrow to sustain their living standards if they are aware that this loss of income is likely to be permanent. As we saw, relative income theory, habit formations and a ''keeping up with the Joneses'' phenomenon may explain such behavior. In their model, loans are releasing the budget constraints and can therefore be used to maximize utility in each period. The consequence is that it also increases the risk of default, leading to a higher level of financial instability. Lastly, we have to notice that the increase in inequalities is explained in this model by an exogenous fall of bargaining power of workers.
4
In comparison with Iacoviello (2008), the main contribution of the paper is to explain a mechanism where permanent income transfers have strong impact on indebtedness and financial crises. Iacoviello (2008) models the consequence of increased income volatility. The main limitation is that it is not consistent with the findings of Kopczuk, Saez and Song (2010) who show that the rise of inequalities was mainly explained by between-groups income shifts.
If the recent rise of inequalities is likely to be explained by a permanent income shock, the theory should explain why households did not adjust their consumption accordingly. As we just saw, different theories such as the relative income hypothesis, the expenditure cascade and the need to sustain living standards may explain such apparent paradox. In this respect, all these approaches, regardless of their differences and their sometimes conflicting results, rely on the same hypothesis, namely, that households can freely and always access credit to support their consumption level, whatever their income or risk level. While it is certainly true that financial development, deregulation and abundant liquidity provided by expansionary monetary policies (see below) considerably eased credit access to low-income and/or risky households, it is also true that the latter can be discriminated in their access to basic, retail financial services, and may disproportionately suffer from credit rationing during business downturns. Based on the UK experience French, Leyshon and Meek (2013) provide some interesting descriptive evidence of this kind of phenomenon of “financial exclusion”/“financial precarity”, and insist also on the geographic dimension (e.g., the disproportionate decrease in the number of bank branches in poorer areas between 1989 and 2012) of this issue. In any case, this is clearly an underinvestigated topic in the literature, deserving additional research.
In any case, there is undeniably a solid theoretical background to explain how inequalities may have increased leverage through an increased demand for credit. We will see in the next section how an increase of credit supply may have played a role and what are the potential relations with growing inequalities.
4 However, in Kumhof, Ranciere and Winant (2015), the rise of inequalities is not explained by this fall of workers bargaining power anymore. It is just assume to be exogenous and permanent or near-permanent.

CEPII Working Paper ou Document de travail du CEPII Inequality, Leverage and Financial Crises
16
2.3. Credit Supply: Correlation or (reverse) causality? The ambiguous role of the macroeconomic environment
In his recent survey on the relationship between inequality and the US financial crisis, Van Treeck (2014) highlights that disentangling demand-side and supply-side influences on the total amount of credit distributed in the economy is not an easy task. Besides, the literature focusing on the supply-side is herself both heterogeneous and inconclusive on the key issue of the causal impact of inequality on the distribution of credit.
The first causal link that can be identified is explained by the rise of income for the richest. If it leads to a rise of saving for this group, it will also increase the rise of credit supply. It is exactly the mechanism developed in Kumhof and Ranciere (2010) and Kumhof et al. (2015). Lysandrou (2011) starts from a similar basis: the rise in global savings made possible a huge accumulation of private wealth, which in turn triggered a global excess demand for securities driving credit supply up. This rising supply of capital needs to be invested, even to riskier borrowers, and eventually, this type of investment is made easier by structured credit products.
5 Here the causal argument seems to be firmly established, at least at first sight.
Coibion, Gorodnichenko, Kudlyak, and Mondragon (2014) also raise explicitly the question of a causal link from inequality to credit, based on an empirical analysis using household level data on debt accumulation during 2001-2012. They reject a demand-sided explanation of the credit bubble, i.e. that low-income households increased their demand for credit to finance higher consumption expenditures in order to “keep up” with higher income households (see section 2.2. above). Coibion, Gorodnichenko, Kudlyak, and Mondragon (2014) are therefore in favor of a supply-side interpretation of debt accumulation patterns during the 2000s. They build a model in which banks use applicants’ incomes, combined with local income inequality, to infer the underlying type of the applicant, so that banks ultimately channel more credit toward lower-income applicants in low-inequality regions than high-inequality regions. Models’ predictions are confirmed by data on individual mortgage applications in high- and low-inequality regions over this time period.
Another common view is that financial institutions have been actually incented to raise loans to riskier individuals, with the paroxysm reached with the development of subprime loans massively distributed to (sometimes very) low income individuals, with a high risk of default.
6
Rajan (2010, page 43, quoted by Atkinson and Morelli, 2010), is supporting this kind of political economy analysis when he states that “growing income inequality in the United 5 An alternative, political economy approach can be found in Atkinson and Morelli (2010, page 60): the decrease of
welfare incomes in general, and pensions from public-funded schemes in particular, implies loss of income for beneficiaries and consequently, a rise in inequality. Households respond by saving more in private pension schemes (and by purchases of housing). In turn, private pension schemes need to invest the additional funds, even with an increased risk. 6 Charles R. Morris, in his book “The Two Trillion Dollar Meltdown” (2008), nicknamed the very low quality subprimes
NINJA loans - No Income, No Job, (and) no Assets loans, because the only thing an applicant had to show was his/her credit rating, which was presumed to reflect willingness and ability to pay.

CEPII Working Paper ou Document de travail du CEPII Inequality, Leverage and Financial Crises
17
States (…) led to political pressures for more housing credit. This pressure created a serious fault line that distorted lending in the financial sector”. This argument completes the one by Krugman (2010), Acemoglu (2011) and Atkinson and Morelli (2010) themselves at the beginning of their contribution (p. 3): the empirical association between increasing inequality and the boom of credit does not imply necessarily causality. Both phenomena may also well be the joint by-products of a general political shift towards a more free-market stance.
At this step emerges what seems to be a crucial point: the role of public/government policies in favoring the supply of loans to low income/low wealth individuals. Indeed, the latter could not have happened without a favorable macroeconomic and regulatory environment, related to the dynamics of financial transformation and monetary policy.
2.3.1. Financial development and deregulation
The fact that the empirical association between increasing inequality and the boom of credit does not imply necessarily causality does not need either to contradict the various approaches we mentioned earlier: it just simply means that it is unlikely that a single story explains the joint rise in inequality and credit, a fact already highlighted by Atkinson and Morelli (2010) on their table 7 (page 60) where they list some of the alternative underlying theoretical mechanisms. Here, we adopt a macroeconomic perspective by focusing on two aspects which may have favored a simultaneous increase in inequality and credit supply, without necessarily implying a causal relationship from the first to the second: the various aspects of financial dynamics over the past decades on the one hand, and monetary policy on the other hand.
The academic literature studying the impact of finance on real outcomes often focuses on the concept of financial development. Defining the latter may prove to be an uneasy task. In the chapter 12 of the Handbook of Economic Growth (2005), which has been authoritative on the question for several years, Ross Levine provides substantial developments on the functions of “financial systems [which]:
• Produce information ex ante about possible investments and allocate capital.
• Monitor investments and exert corporate governance after providing finance.
• Facilitate the trading, diversification, and management of risk.
• Mobilize and pool savings.
• Ease the exchange of goods and services.”
Beyond these functions, Levine (2005) also details the main elements of the “debate bank-based vs. market-based systems”. Going into the details of this controversy is beyond the scope of this paper, not mentioning the fact that the distinction seems quite blurred

CEPII Working Paper ou Document de travail du CEPII Inequality, Leverage and Financial Crises
18
nowadays, banks being major financial market actors. To that extent, it is not surprising that the standard financial development proxy in the financial development literature is the ratio of private credit over GDP, where by construction the origin of credit does not matter.
What is important here is that, if financial development is tightly associated with the rise in credit supply, financial dynamics as a whole over the past two or three decades do not restrict to it theoretically. Deregulation and liberalization have been the other prominent features of the evolution of financial systems. Macro prudential policy gave progressively more freedom for banks to operate on financial markets. It is frequently emphasized that banks progressively externalized their core function of balancing risks and profitability of projects by potential borrowers. Indeed, securitization allows banks removing loans from their balance-sheets by transforming them into securities traded on financial markets. Shleifer and Vishny (2010) formalize explicitly this behavior of banks in a model where banks make, securitize, distribute and trade loans – as an alternative to holding cash. Banks also borrow money, using their security holdings as collateral, and they operate on markets influenced by investor sentiment. Insofar as mortgage and other loans could easily be securitized, and that there was a huge demand for these securities, banks were incented to take on greater risks: “Banks were intimately involved in both underwriting these securities and holding large inventories on their own books, financing them in large part through short-term borrowing” (Shleifer and Vishny, 2010, p. 316). On the other hand, housing bubble triggered subprime loans (easy to securitize) to low-income households: inequality had therefore a magnifying effect on the risk-taking behavior of banks. Here, the distribution of incomes appears to have had a causal impact on credit supply.
That said, and without anticipating the developments in section 4 below, studies establishing causality from financial development to inequality have direct consequences here. For example, Levine concludes (2005) to a positive impact of financial development on inequality. From that perspective, the increase in credit supply and the decrease in income inequalities are both simultaneous corollaries of financial development, but with no necessary causal link from one to the other. Conversely, Jauch and Watzka (2011) conclude to the exact opposite relationship (i.e., financial development increases inequalities), meaning that we may have the opposite correlation to the one implied by Levine 2005). In other terms, financial development may bring a simultaneous increase in credit supply and inequality, reflecting a correlation seemingly consistent with our story, but once again, with no real possibility of establishing causality from one variable to the other.
2.3.2. Monetary Policy
A second key aspect much more often (but not always) neglected by the literature on the finance-inequality nexus relates to the potential part of monetary policy. Here also, the existence and direction of causality is a significant puzzle mainly unsolved. An exception is the work by Fitoussi and Saraceno (2010) who support that “an increase in inequalities (…)

CEPII Working Paper ou Document de travail du CEPII Inequality, Leverage and Financial Crises
19
depressed aggregate demand and prompted monetary policy to react by maintaining a low level of interest rates which itself allowed private debt to increase beyond sustainable levels”, using an argument similar to Rajan (2010). Here there is a clear causal relationship from inequality towards monetary policy, which in turn triggered the credit bubble – but once more, it is not absolutely clear that the authors are thinking of a supply rather than a demand-side story for credit.
That said, most other analyses focus on demonstrating the existence of a causal relationship from monetary policy to inequality. The relationship between the total volume of credit distributed and inequality may (as we did before with financial development) be analyzed as the joint product of monetary policy actions, i.e. as a correlation with no a priori independent causal relationship going from one to the other.
Outside mainstream economics, a clear opposition arises between Austrian economists and Post-Keynesian ones. Austrian economists believe inflationary surprises lower real wages in the presence of sticky prices and thereby raise profits, leading to a reallocation of income from workers to capitalists. In that case, an expansionary monetary policy leads to a joint increase in credit and inequality, generating a positive correlation between the two variables. Conversely, post-Keynesians emphasize the disinflationary policies of the Federal Reserve had disproportionate effects on employment and wages of those at the bottom end of the income distribution (see e.g. Galbraith, Giovannoni and Russo, 2007). In that case, an expansionary monetary policy should increase credit and reduce inequality, generating a negative correlation between the two variables.
Based on micro-level data, Coibion, Gorodnichenko, Kueng, and Silvia (2012) assess the effects of monetary policy shocks on consumption and income inequality in the U.S. Contractionary monetary policy shocks appear to have significant long-run effects on inequality, leading to higher levels of income, labor earnings, consumption and total expenditures inequality across households. This contrast the Austrian view and also the results by Romer and Romer (1998), who find, based on a large cross-country analysis, that, over the long-run, the low-inflation, stable environment favored by contractionary monetary policy actions was associated with improved well-being of the poor. Note, however, that Romer and Romer (1998) find opposite results on the short-run: the cyclical boom created by expansionary monetary policy is associated with improved conditions for the poor in the short-run. At that point, it seems therefore tricky to settle definitely if the correlation between credit and inequality is positive or negative. Over the long-run however, the research by Coibion, Gorodnichenko, Kueng, and Silvia (2012) seem to suggest a negative causality: contractionary monetary policy decreases credit supplied and increases inequality.
Gorneman, Kuester and Nakajima (2014) find similar result within a DSGE framework featuring asset market incompleteness, a frictional labor market, as well as nominal frictions. On the whole, they find substantial distributional effects of both systematic monetary policy and monetary surprises. A key result is that, while households in the top 5 percent of the wealth distribution benefit slightly from a contractionary monetary policy shock, the bottom 5

CEPII Working Paper ou Document de travail du CEPII Inequality, Leverage and Financial Crises
20
percent lose. This means that “a monetary tightening of 1 percentage point (annualized) induces a loss equivalent to a permanent 0.1 percent cut in life-time consumption for the lowest 5 percent of the wealth distribution”. Once again, this result seems to suggest a negative correlation between credit and inequality. However, Gorneman, Kuester and Nakajima (2014) do not advocate either a permanent accommodating monetary policy, because the latter is likely as well to increase inequality. The underlying mechanism is as follows: by dampening economic fluctuations, the need for precautionary savings falls. The decline in aggregate savings induces a lower capital stock in the economy. This reduces wages, on which the poor rely in particular as a source of income. In that particular context, we may well have a positive correlation between the volume of credit and inequality.
2.3.3. Credit supply vs. credit demand: the difficulties for disentangling their respective influences
It is clear from the overview of papers presented above that is irrelevant to try to point a single type of explanation (either demand or supply-sided) for the causal nexus inequality-debt increase. If some of the above-mentioned papers are based on anecdotal or descriptive evidence, most are based on rigorous theoretical or empirical frameworks delivering more systematic evidence in favor of both channels. It seems more than plausible that both were activated simultaneously. This is corroborated by some other studies that present arguments encompassing both types of explanations. Fitoussi and Saraceno (2010) that we already mentioned in section 2.2, also support, in addition to their demand-sided argument that “On the other hand the search for high-return investment by those who benefited from the increase in inequalities led to the emergence of bubbles. Net wealth became overvalued, and high asset prices gave the false impression that high levels of debt were sustainable. The crisis revealed itself when the bubbles exploded, and net wealth returned to normal level. So although the crisis may have emerged in the financial sector, its roots are much deeper and lie in a structural change in income distribution that had been going on for twenty-five years.'' (p. 4).
7 Here, the underlying rationale clearly refers to the credit supply channel: inequalities
had a causal impact on monetary policy which in turns leads to higher level of leverage. A similar argument is made more formally by Tridico (2012) who see the finance-led model of growth as a main factor explaining the current crisis. In his view, labor market flexibility and wage moderation have diminished workers' bargaining power which was partly compensated by increased borrowing opportunities due to financial liberalization. According to this view, the policy package which includes both labor market and financial liberalization has two consequences: an increase of the demand for credit due to the fall of workers' bargaining power, and an increase in credit supply explained by financial liberalization.
7And when it comes to the part of monetary policy, Fitoussi and Saraceno (2010) are not more specific on which side of
the credit market (supply, demand or both at the same time) bears the responsibility of the increase in debt – see above.

CEPII Working Paper ou Document de travail du CEPII Inequality, Leverage and Financial Crises
21
Among the references we already mentioned, Iacoviello (2008) does conclude to the preeminence of credit demand dynamics, but the model he designs is actually a mixture of credit supply and credit demand mechanisms. Symmetrically, Coibion, Gorodnichenko, Kudlyak, and Mondragon (2014) support a supply-sided analysis of the credit increase, without discarding totally the existence of factors on the demand side. Rajan (2010, p.43) clearly advocates a causal link from inequality to credit, but it is not clear from his analysis if inequality influenced only credit supply or credit demand and supply at the same time.
Besides, it is also clear that, if many analysis are consistent with a causal link from inequality to credit, we cannot ignore either that the macroeconomic background may have generated additional simultaneous increases in inequality and credit, with no causal link involved here - though the sign of the correlation is really not that clear for monetary policy, essentially because the effect of systematic monetary policy and monetary policy surprises are not the same. Disentangling what really comes from a causal relationship from inequality to finance from what is a simple correlation due to an omitted macro factor is one of the major challenge for research in the future years.
2.4. Inequality and Public Debt
If we focus mainly on the potential role of private debt in the surge of financial crises, another important dimension is the possible role of public indebtedness. If the role of public debt in the recent financial crises is controversial (see recent arguments around Reinhart and Rogoff, 2010), some papers have tried to establish a link between the level of inequalities, public debt and financial crisis. Aizenman and Jinjarak (2012) focus on the potential impact of income inequality on the tax base and sovereign spreads. Using data from 50 countries in 2007, 2009 and 2011, they found a negative correlation between income inequality and the tax base, and a positive correlation with sovereign debt. For 2011, they estimate that a one point Gini coefficient's increase is associated with a lower tax base of 2% of the GPD and a higher sovereign spread of 45 basis points. They argue that “as long as the income inequality does not have a direct effect on the sovereign risk”, the potential endogeneity between the fiscal space and inequality does impact the final estimations of the sovereign risk spread. In other words, they assume that the only impact of inequality on sovereign spread goes through its impact on the tax base and that the GINI coefficient can be used as a potential relevant and exogenous instrumental variable for the sovereign spread. This result is consistent with Milasi (2012), who finds a positive correlation between the top 1% income share and public deficit, using a panel of 17 OECD countries between 1974 and 2005.
Finally, Azzimonti, de Francisco and Quadrini (2014) build a theoretical model to explain the dynamics of public debt, in which public debt responds positively to income inequality because of a link with uninsurable income risk. Here, entrepreneurs face idiosyncratic risks and they benefit from public debt because it may be used to smooth consumption. Workers also benefit from public debt if they cannot borrow directly in private markets. An increase in

CEPII Working Paper ou Document de travail du CEPII Inequality, Leverage and Financial Crises
22
uninsurable income risk leads to higher government borrowing. Because of financial market integration, the rise of inequalities in some countries may also have an effect on public indebtedness in countries not affected by this rise of inequalities. This model relies on both credit demand and credit supply channels for explaining the increase of credit volume. First, inequalities in one country may increase public debt in such country. But because of financial globalization, it may also affect countries where this credit demand channel does not occur.
In this section, we saw that the relations between inequalities and leverage are numerous but not of all them imply a causal relation from inequality to leverage. The causality may also be indirect if growing inequalities push Governments and Central Banks to implement policies aiming at increasing credit supply. The empirical challenge is therefore to disentangle direct and indirect causal relations and possible coincident factors. In the next section, we will review papers (mostly empirical) that attempt to address such a challenge.
3. Inequality, Leverage and Financial Crises
We will review empirical studies focusing on the linkages between inequality, leverage and financial crises in three steps. First, we will focus on the links between inequality and leverage. Second, we will investigate a complementary channel going through the current account balance. Finally, we will show evidence concerning the link between leverage and financial crises.
3.1. Inequality and Leverage: some empirical evidence with various explanations
Bordo and Meissner (2012) propose to analyze empirically the linkages between the income share of the 1% top income, credit booms and financial crises. They use a panel of 14 mainly advanced countries from 1920 to 2008. They study the determinants of credit growth using macroeconomic variables and the level of inequality measured the 1% top income share. The goal is to see if the positive correlation observed between credit growth and the 1% top income share is still valid once controlling for traditional determinants of credit growth (the business cycle and other macroeconomic aggregates). They firstly analyze the determinants of credit growth using five-years period, and find that the cumulative change in the log of real GDP is the only significant determinant of credit growth. They also do not find any significant relation between inequality and credit growth when using the share of the top 0.01%, the top 5% and the top 10%. Then they use annual data and find that both the growth of GDP and the short-term nominal interest rate are significant determinant of credit growth. They still do not find any impact of income inequality.
We see three major drawbacks in their analysis calling for complementary empirical researches on the topic. First, they completely neglect the potential endogeneity between inequality and credit growth but also between credit growth and other macroeconomic variables. There is a strong literature on the impact of financial development on inequality

CEPII Working Paper ou Document de travail du CEPII Inequality, Leverage and Financial Crises
23
(see section 4 below). Therefore, a two-way relationship has to be considered. Second, they only focus on the potential influence of top income share. In the theoretical analysis proposed by Kumhof and Rancière (2010), for instance, the causal impact of inequality on credit growth may come from two sources: the income increase of the richest (which increases the supply of credit) and the decrease (or stagnation) of the poorest's income (which increases the demand of credit). They do not test the latter. Finally, and probably the most important, they consider an overall private credit aggregate, without discriminating between household and firms' credit – section 3.3 below will emphasize how crucial this distinction is.
Atkinson and Morelli (2010) study the evolutions of inequality prior to 37 systemic banking crises over the period 1911-2010 (73% in OECD countries). More precisely, they observe the variations in the distributional variables taking a 5-year “window” either side of the crisis date. They find that inequalities have increased before the crisis in 10 cases out of 25 that could be identified. In 8 cases, they do not observe significant change in income distribution before the crisis and in 7 cases, they observe a decrease of inequality prior to the crisis. Evidence is therefore very mixed and it is very difficult to get a conclusive answer on the possible causality but also on the sign of the relation. Globally, they tend to find that the relatively most predominant scenario is an inverted U-curve (increasing inequality before the crisis, decreasing inequality after the crisis) in 5 out 25 cases.
Then, they compare the situation of countries where a systemic banking crisis has been identified in 2007-2008 and countries without such crises. When using the Gini coefficient, they find a similar share of countries where inequalities have increased during the ten years preceding 2007 in the two groups. When focusing on the 1% top income share, there is slightly higher share of inequality-increasing countries in the group that faced a systematic banking crisis in 2007.
In their conclusion, they emphasize the potential heterogeneous role of income distribution changes: “Different parts of the income distribution react differently, and the conclusions drawn regarding the origins and the impact of the crisis may depend which part of the parade we are watching. The top and the bottom may be the most affected; depending on the theoretical model adopted, either the top or the bottom may be more relevant to understanding the origins of the crisis”. As already mentioned, it is therefore important to have a closer look to the potential impact of the whole distribution of income and not only the top income share, as in Bordo and Meissner (2012).
Box 1: Measuring Inequality: which data, and which index?
Results and insights from the empirical literature on inequalities can be affected by the choice for both data and index measuring inequalities. For many years, macro studies used the dataset provided by Deininger and Squire (1996), which was updated afterwards, but as pointed by Gimet and Lagoarde-Segot (2009), it was plagued by inconsistencies due to the mixing of several data types: gross versus net income data, household versus individual

CEPII Working Paper ou Document de travail du CEPII Inequality, Leverage and Financial Crises
24
income data and income versus expenditure data, not mentioning the low frequency and some unexplained jumps. That is why some researchers choose to use an alternative inequality indicator named Estimated Household Income Inequality (EHII), originally developed by Galbraith and Kum (2003) under the University of Texas Inequality Project (UTIP). It is based on the inequality of manufacturing wages obtained from the data collected by the United Nations Industrial Development Organization (UNIDO). Nevertheless, this dataset is by construction more restrictive, since in some developing countries, the manufacturing sector may represent only a small share of the working population. Other papers prefer consequently to rely on Standardized World Income Inequality Database (SWIID) created by Solt (2009), which uses the World Income Inequality Database by the United Nations University. This data set takes stock simultaneously of Deininger and Squire’s (1996) database, data from the Luxembourg Income Studies (LIS), Branko Milanovic’s World Income Distribution data, the Socio-Economic Database for Latin America, the ILO’s Household Income and Expenditure Statistics and the UTIP; it appears therefore as the most “comprehensive cross-nationally comparable database of Gini indices across time” (Ortiz and Cummins, 2011). Some papers do use several data sets to check the robustness of their results to data building and coverage, and it appears often that conclusions are qualitatively identical. But one must keep in mind that the very data used is not innocuous on the conclusions of empirical studies.
Besides the database used, the issue of the measurement of inequality must also be taken seriously. As stated by Atkinson and Morelli (2011), the linkage between inequality and financial crises can come from the distribution of income at the bottom, at the top or both. Bordo and Meissner (2012) choose to focus on the top 1% income share (proposing robustness checks using 0.01%, 5% and 1% top income share) but this choice is not really justified and may be constrained by availability of data.
As stated in Leigh (2007), top income shares satisfy three basic principles of the axioms of inequality set out in Cowell (1995): income scale independence, principle of population and anonymity. But it only weakly satisfy the Pigou-Dalton transfer principle: a transfer between two individuals who are both within the top group will not affect the income share measure. Besides, top income share cannot be split into within-group and between group-inequality. Another issue is top income shares are based on pre-tax income.
Leigh (2007) further investigates the relationship between top income measures and broader measures of inequality such as the Gini. He finds strong positive correlation between the series, robust to the inclusion of country and year fixed effects. He suggests that “within-country changes in top income shares can be a useful proxy for changes in other inequality measures.” However, one condition should be satisfied. On a theoretical level, factors affecting inequality should have an impact on both the top and the bottom of the distribution. Here we get back to the initial point of Atkinson and Morelli (2011). A careful study on finance and inequality should identify which dimension of inequality is affected and explains the underlying dynamics. As stated by Berhinger and Van Treeck (2013), if we follow the expenditure cascade theory, “increase in the Gini coefficient, which is relatively insensitive to

CEPII Working Paper ou Document de travail du CEPII Inequality, Leverage and Financial Crises
25
changes at the tails of the distribution, will have very different (less strongly negative) effects on household saving than a rise in top income shares”. In such case, the use of top income share would be more appropriate than the Gini coefficient. But if dynamics of leverage is explained by a shift of income from the poorest to, say, the middle-class (or anyone which is not at the top of income distribution), the use of top income share will be inappropriate. To be short, the use of different inequality measures is not neutral, as it already was the case for different inequality data sets.
Other papers find more decisive evidence supporting the idea of a causal link between inequality, leverage and financial crisis. The first one uses a statistical methodology similar to Atkinson and Morelli (Belletini and Delbono 2013). The second one is closer to Bordo and Meissner but find opposite results (Perugini and al. 2013). Another one uses time-series on the US (Christel and Morgan 2005).
Belletini and Delbono (2013) checked how many countries that experienced banking crises fell above or below the relevant OECD average inequality level, used as a benchmark. As in Atkison and Morelli (2010), this analysis can be interesting but is not sufficient to claim any causal relationship between inequalities and financial crises as they do not account for the potential impact of confounding factors. However, based on a sample of banking crises over the period 1980-2010, they find opposite conclusions than Atkinson and Morelli (2010): they find that a large majority of banking crises has been preceded by persistently high levels of GINI coefficients. “9 banking crises out of 14 have been preceded by persistently high levels of high (disposable) income inequality” (Belletini and Delbono, 2013, p. 8). The main reason is that they focus on the level and not on the evolutions of inequalities as in Atkinson and Morelli (2010).
Perguni et al. (2013) perform an econometric analysis of the determinants of credit growth. Contrary to Bordo and Meissner (2012), they do find a positive link between income inequality and credit growth. They use a panel of 18 OECD countries over the period 1970-2007.
8 Two main options may explain such differences. First, they consider the problem of
endogeneity and reverse causation. Second, they also explicitly take into account institutional drivers such as financial deregulation. They also use alternative measure of credit (the ratio credit/GDP instead of the log of real bank loans to the private sector) and propose to estimate the model in levels rather than in variations. Concerning this last choice, the authors argue that “the literature emphasizes how it is the excessive credit available in the economy that leads to financial crisis. On the contrary, whether higher rates of credit
8The time-dimension of their analysis is therefore more limited than Bordo and Meissner (2012). They argue that it is not
a major drawback “since it corresponds to the period in which credit started to remarkably decouple from broad money as a result of increased leverage and augmented funding via the non-monetary liabilities of banks. A period in which most developed economies entered an age of unprecedented financial innovation, risk and leverage, which eventually undermined their stability” (Perguni and al. 2013, p. 4).

CEPII Working Paper ou Document de travail du CEPII Inequality, Leverage and Financial Crises
26
growth lead to a financial crisis or not depends on the initial level of credit available in the economy, since the same growth rate might translate into very different levels of credit and risk”. (Perugini and al., 2013, pp. 12-13). To address potential endogeneity, they use GMM estimators (in level and in difference) using both internal (lagged values of the endogenous variables) and external instruments. As external instruments, they use institutional indicators related to labor and product markets, to the rule of law and trade openness. The authors assume that such variables are correlated with both inequalities, investment and growth but without direct impact on credit. All in all, they find a positive impact of inequalities on credit, “suggesting that higher inequality directly drives higher credit, once its conventional determinants are controlled for” (Perguni and al. 2013, p. 24). However, the interaction term between inequality and financial deregulation is not significant. The authors do not find that financial deregulation magnifies the effect of income inequality on credit. However, as deregulation is found to have a strong and positive impact on credit growth, the authors conclude that “the two effects acted separately on credit expansion, without self-reinforcing patterns” (p. 25).
Using time-series data, Christen and Morgan (2005) do find a “strong positive effect of income inequality on household debt relative to disposable income as well as the components of the household debt (mortgage debt, revolving debt, e.g. credit cards, and non-revolving debts, e.g. car loans” (p. 148). More precisely, they analyze the determinants of the total household debt using quarterly U.S. data covering all years from 1980 to 2003. They find that the income inequality effect is strongest for non-revolving debt and weakest for mortgage debt, but positive in all cases. They argue that this effect is likely to be driven by conspicuous consumption (and therefore a credit demand channel), and has increased over time. If they acknowledge that their data does not allow them to directly test this conspicuous consumption hypothesis, they show that alternative interpretations cannot rule out their main explanations. In particular, they add variables related to life-cycle models (such as the age distribution) as additional controls of the determinants of household debt. Their main results remain valid. They also try to account for credit supply-side changes by instrumenting the interest rate using an aggregate measure of credit supply. Finally, they estimate the impact of income inequality on consumption of cars (considered as a conspicuous consumption good) and food (considered as a non-conspicuous consumption good). They find a positive correlation between income inequality and consumptions of cars while the effect on food consumption is not significant. They acknowledge that they cannot provide “direct evidence for a causal link between conspicuous consumption and household indebtedness” but all their estimates are consistent with this interpretation.
To conclude this section, we can say that existing empirical pieces of evidence focusing on the link from inequality to leverage are still scarce and their conclusions are diverse. We identify several dimensions that may explain such divergence, calling for future researches in this area. First, we should identify if it is the level or the evolution of inequality that matters. The two hypotheses make sense but imply different empirical strategies. Second, the main challenge is to properly address the potential problem of endogeneity: financial development as an obvious effect on inequalities as we will see in section 4. Perguni et al. (2013) propose

CEPII Working Paper ou Document de travail du CEPII Inequality, Leverage and Financial Crises
27
a first way to address this problem but the validity of external instruments they use (labor and market products regulations, the rule of law and trade openness) can be challenged. Third, both the use of a given index of inequality and the choice for the database underlying the coverage of the study are not neutral. Future researches should identify if it the distribution of income at the top, at the bottom or the whole distribution of income that matter.
Box 2: The role of housing price bubbles and mortgage credit
An alternative explanation of credit boom focuses on the dynamics in the housing sector. In an influential book, Mian & Sufi (2014) argues that the Great Recession was caused by a “debt-fueled housing boom” which led to a strong increase in household spending from 2000 and 2006. Jordà, Schularick and Taylor (2014) analyze the link between monetary conditions, credit growth and house prices using a panel of 14 advanced countries over 140 years. They observed a strong increase of mortgage credit in the second half of the 20th century. On average, Figure 5 shows that mortgage and non-mortgage lending follow similar tends, except in the last decade where the boom of mortgage credit has been higher than the boom of non-mortgage credit. They also provide evidence proving that monetary policy has a causal impact on housing prices and mortgage credit. More precisely, cheaper financing leads to a higher demand for houses which explains the upward pressure on home prices. Finally, they show that mortgage booms and house price bubbles have been closely associated with a higher likelihood of a financial crisis. Nevertheless, this last result does not imply that non-mortgage credits have no impact on the probability of a crisis (see section 3.3). For instance, Mian & Sufi (2010) show that household dependence on credit card borrowing was a strong predictor of households default (among the broader effect of household leverage).
Adelino, Schoar and Severino (2014) also find a causal impact of cheaper credit on housing prices, using exogenous changes in the conforming loan limit in the US to measure the causal effect. An interesting feature of the study is that they show that this effect is stronger for particularly constrained households, suggesting an indirect effect of inequality. Favara & Imbs (2014) also emphasize that the housing price bubble is rather a consequence than a cause of credit boom. Using US branching deregulation between 1994 and 1998 as instruments for credit, they show that credit boom (induced by the deregulation) had a causal impact on housing prices.
All in all, all these papers agree to refute the idea that the housing price bubble was the main driver of the boom of leverage. On contrary, it seems that it is rather a consequence of credit increase.
A related debate has emerged on the consequences of housing price boom on inequalities, around the famous book of Piketty (2014). Bonnet et al. (2014) observed that most of the rise of the capital-income ratio described in the Piketty's book was explained by the rise of

CEPII Working Paper ou Document de travail du CEPII Inequality, Leverage and Financial Crises
28
housing prices and the methodology used to estimate capital (using housing prices and not rents). They argue that the housing price has little impact on inequalities dynamics as soon as the level of rents does not follow the same path. In their view, it has little impact on consumption and inequality. This conclusion is challenged by Allegre and Timbaud (2014) who support that housing capital contributes strongly to inequality.
Figure 5: Bank mortgage and non-mortgage lending to GDP, 1870-2011, average for 17 countries
Source: Jorda, Schularick and Taylor (2014), p. 6.
The link with the study of a potential impact of inequality on leverage and financial instability is indirect, although important. If the rise of capital income is mainly explained by the increase of housing prices, the cause of leverage increase would not be the need from the poor and middle-class households to sustain their living standards. But even in that case, one cannot neglect the role of inequalities. In a context of growing inequalities, a rise of housing prices would theoretically exclude the poorest from the housing market. But financial innovations can counter-balance this effect as in the case of subprime loans. The impact on financial instability can be stronger, even if the boom of credit is mainly a boom of mortgage credit. Also, as stated above, the causality is likely to go the other way: it seems that credit boom is a driver of housing price increases, rather than the contrary. For all these reasons, we argue that the role of inequalities cannot be neglected, even when the boom of credit is mainly explained by the dynamics in the housing sector.

CEPII Working Paper ou Document de travail du CEPII Inequality, Leverage and Financial Crises
29
3.2. Inequality and current account imbalances
Wondering about the impact of inequalities on leverage and debt immediately raises a related issue concerning the external equilibrium of the economy. If there is indeed an impact of inequality on overall leverage, one should consequently expect a modification of aggregate net savings, and therefore of current account – this is due to the well-known accounting identity: X-M = S-I, i.e., net exports must be equal to net savings. However, even if we take the impact of inequality on credit and leverage as granted, the sense of the consecutive impact on net savings is not straightforward. All papers mentioning a credit demand channel (see section 2.2. above) implicitly or explicitly assume that any increase of inequality should lead to a decrease of savings (and more precisely to an increase of borrowing) from the bottom of the income distribution. But the increase in income of the richest may also increase their level of savings (allowing more credit supply, as in the Kumhof and Ranciere's framework, 2010). The latter may or may not increase sufficiently at the aggregate level to offset the decrease in the net savings (equivalent to an increase of their indebtedness) of the poorest. The net effect of inequality on national savings is therefore ambiguous. This ambiguity has been confirmed by Schmidt-Hebbel and Serve (2000) or Leigh and Posso (2009) who found no systematic link between inequality and aggregate savings. Therefore, the impact on the external equilibrium is a priori undetermined. In any case, there is an increasing number of papers trying to deal with this issue. Figure 6 summarizes the possible linkages between inequalities and current account balance.
Figure 6: Inequalities and the Current Account
Behringer and van Treeck (2013) propose to analyze such relation for a sample of 20 countries over the period 1982-2007. They make a distinction between personal inequalities
Inequalities
Poorest: Decrease Savings and Increase Borrowings
Richest: Increase Savings
Net effects on Aggregate Savings?
Deficit / Surplus of the Current Account
Credit Demand
Credit Supply

CEPII Working Paper ou Document de travail du CEPII Inequality, Leverage and Financial Crises
30
(inequality of income basically) and functional inequalities (inequality between labor and capital income mainly). They find that higher inequalities are associated with lower household net lending, which has a negative impact on current account balances. They also find stronger effect when considering the top income share than when using the Gini coefficient. On contrary, increased functional inequalities, through declining labor income are associated with higher current account balances (through the corporate financial balance).
Some recent dynamics are consistent with this result. As argued in their paper, the United States or the United Kingdom have faced very strong increase of their top income share while the shares of labor and capital have remained constant. These countries have observed a strong decline of household saving and a strong increase in their current account deficit. On contrary, income inequalities in countries such as Germany have not changed fundamentally while their labor share has declined strongly. According to the authors, it is consistent with an increase in their current account surplus.
The key element in their analysis is the impact of both personal and functional inequalities on national saving. Behringer and Van Treeck (2013) find a negative impact of income inequality (personal inequality) on aggregate savings. It means the decrease of savings (or an increase in borrowing) from the poorest overcomes the increase in savings of the richest. In their view, this result can be explained by the expenditure cascade theories (Frank, 2014) which explains how consumption increase of the richest has a trickle-down effect on consumption of the poorest (see also Bertrand and Morse, 2012). This idea is supported by the fact they observe a stronger effect for the top income share than for the Gini coefficient. The top of the distribution would shape the consumption behavior of the whole population, explaining a negative impact on aggregate savings. Alvarez-Cadrado and El-Attar Vilalta (2012) also support this idea arguing that “individual saving rates decrease with reference income while aggregate saving decreases with income inequality, when households care about their consumption relative to others”.
However, Berhinger and Van Treeck (2013) do find an opposite result as far as functional (profits vs. wages) inequalities are concerned. More precisely, they find a positive link between the corporate financial balance and the current account. Their main assumption is that household consumption is more sensitive to current income than capital gains. The consequence of that is “aggregate personal saving declines much more strongly when the corporate sector distributes income to rich households in the form of salaries, bonus or dividends, than when it accumulates net financial assets, even if they are ultimately owned by the same households.” (p. 8).
9 Corporate gains are more likely to be saved, thus
increasing the current account.
9We should note that the distinction between different types of functional income is ambiguous. The first definition given
by the authors is based on a distinction between profits and wages, which is equivalent to a distinction between labor income and capital income. However, they aggregate dividends with other wage income and quote several papers on the corporate veil, studying how investor consumption is affected by the type of returns. For instance, Baker et al. (2007) show that dividends have much stronger effects on consumptions that capital gains.

CEPII Working Paper ou Document de travail du CEPII Inequality, Leverage and Financial Crises
31
This distinction may explain the heterogeneous effects of inequality on the current account. In countries such as the UK or the US, it is mainly personal inequalities which have increased, explaining a worsening of the current account through decreased levels of savings. On the contrary, in Germany or China, the authors support that the increase of inequalities was mainly functional with a fall of the labor share. Increase in corporate gains has explained a boom of aggregate savings and therefore an improvement of the current account. Following the same idea, Belabed et al. (2013) build a stock-flow macroeconomic model where each country has a household and a non-household (corporate) sector. The household sector is divided into deciles and characterized by upward-status looking comparisons (in line with the relative income hypothesis and the expenditure cascade described by Frank, 2014). Country-specific institutions explain the dynamics of consumption. The model is then calibrated for the US, Germany and China and explains the dynamics of the current account by the worsening of personal inequality in the US and by a transfer from household to the corporate sector in Germany and China.
This distinction between personal and functional inequality is not possible in the Kumhof et al. (2012) theoretical framework as they assimilates the rich to the investors and the poor to the workers. Income and functional distribution are therefore equivalent in their framework, following the tradition of Kalecki (1954). They build a DSGE model where investors' income share increases at the expense of workers. Workers borrow to national and foreign investors to offset the drop of their income share. It supports aggregate demand but has a negative impact on the current account. They have a different interpretation than Behringer and Van Treeck (2013) concerning the heterogeneous effects on inequality on the current account. In their view, it is financial market imperfections and the incapacity for workers to borrow from investors that explain why increased inequalities lead to an improvement of the current account in emerging economies. In these countries, only investors have an access to financial markets. They deploy their capital abroad (as national workers cannot borrow), leading to a surplus of current account. If this framework is convincing to rationalize current account evolutions in the UK, the US and in emerging economies, it is difficult to explain the case of Germany
10. Using a panel of 18 OECD countries over the period 1960-2006, and
when controlling for the traditional determinants of the current account, Kumhof et al. (2012) find a negative correlation of -0.1 with the 5% top income share and -0.3 with the 1% top income share. Taking into account the medium-term dynamics, the effect of a 1% increase of the top 5% income share is about -0.25%/-0.3% and the effect of a 1% increase of the top 1% income share is about -0.6%. One interesting feature of their empirical analysis is they include the impact of financial development / financial liberalization, echoing the debate on the demand versus supply credit channel developed in the previous section of this paper. Kumhof et al. (2012) find that a 1% increase of the ratio of credit to GDP leads to a 5% deterioration of the current account. That is why they conclude that “if financial liberalization 10
But as they only consider the case of income inequalities and more precisely top income shares, they do not take into account or try to explain the fall of the labor share observed in Germany. In their view, Germany is part of a group of countries where “no or small increase [of inequalities]” were observed.

CEPII Working Paper ou Document de travail du CEPII Inequality, Leverage and Financial Crises
32
is an endogenous response to an increase in inequality, as Rajan (2010) claims for the United States, estimated coefficients for top income shares may capture part of the effect of financial liberalization” (Kumhof et al. 2012, p. 10). However, they do not quantify the relative importance of such indirect channel. Their theoretical model shows that financial liberalization can be a rational answer to a shift of income from workers to investors as it can finance an increase in aggregate demand. But it also makes investors steer a larger share of their additional income to financial rather than real investments. It restrains aggregate supply by slowing down capital accumulation and leads to a higher increase of the rate of return to capital. Because of a higher increase of aggregate demand and a lower increase of aggregate supply, financial liberalization magnifies the effect of inequalities on the current account. “Furthermore, the compression in spreads results in a combination of lower loan interest rates and higher deposit interest rates. Higher deposit rates raise the attractiveness of domestic deposits relative to foreign bonds for domestic investors, given that the interest rate on foreign loans does not change significantly because of the small size of Home relative to the rest of the world. This creates an incentive to invest in domestic deposits financed by foreign loans, which fuels the stronger growth in aggregate demand”. (Kumhof et al, 2012, p. 16).
Al-Hussami and Martin Remesal (2012) found very similar results, using a simple model of current account with heterogeneous agents. Relative income hypothesis explains why the poorest increase their borrowing after an increase in inequality. As in Kumhof et al. (2012), financial liberalization magnifies the effect as it increases the capacity of borrowing. Finally, when Kumhof et al. (2012) state that “global current account imbalances were a major source of financial sector fragility in the run-up to the 2007 worldwide financial crisis”, they highlight that current account is just the other side of the coin, and focus on an issue symmetric to the one we examine in the next section, namely the link between leverage and financial crisis.
3.3. From leverage to financial crisis.
The causal role of excessive private debt in triggering the global financial crisis is a quite ancient idea in the literature, going back to Fisher (1932, 1933) or Minsky (1977), and certainly one of the most consensual points in the literature. Even if some authors point out alternatively the role of sovereign debt (see Reinhart and Rogoff, 2010; Reinhart, Reinhart and Rogoff, 2012), almost all of recent academic researches emphasize the unstable dynamics resulting from private debt accumulation as the first trigger of the financial crisis.
11
In a very recent paper focusing on the euro area, Martin and Philippon (2014) develop a model of open economies within a monetary union where macroeconomic dynamics are driven by private leverage, fiscal policy, interest rate spreads and foreign demand. Their 11
This does not mean of course that public debt is exempt from all responsibility: Jordà, Schularick and Taylor (2013b) show that the level of sovereign debt magnifies the negative impact coming from massive private deleveraging following financial crisis.

CEPII Working Paper ou Document de travail du CEPII Inequality, Leverage and Financial Crises
33
analysis confirms that household leverage is a key driver of both the boom and the bust dynamics. Excess sovereign leverage seems to be the smoking gun only in the case of Greece, where fiscal policy appears as the main driver of macroeconomic dynamics.
As emphasized by Schularick and Taylor (2012) however, systematic statistical evidence is not overabundant, and seems mainly focused on emerging countries (McKinnon and Pill, 1997; Kaminsky and Reinhart, 1999; Gourinchas, Valdes, and Landerretche, 2001). Regarding developed countries, the idea that systemic financial crises tend to be preceded by rapid expansions of credit has of course been pointed out for the 2007/08 crisis (Hume and Sentance 2009; Reinhart and Rogoff 2009), as well as in the Great Depression (Eichengreen and Mitchener, 2003). But until very recently, systematic evidence allowing a fine identification of crisis episodes was missing for developed countries. This gap is currently been filled by researchers who assembled long-run data for some industrialized countries.
Using a dataset very close to the one used in the works by Jordà, Schularick and Taylor (see below), Bordo and Meissner (2012) find a strong positive relationship between the probability of having a banking crisis and real credit growth, with a somewhat lagged effect: their downward benchmark implies that a regular 10% rise in real bank loans over a five year period leads to an increase by 5% of the probability of a banking crisis. Perugini, Holscher and Collie (2013) find very similar result on a dataset of 18 OECD countries, over the period 1970-2007: depending on specifications, a 10% increase in the ratio of credit to GDP raises the probability of a banking crisis by 3.5/4.5%.
Those results are consistent with those of Schularick and Taylor (2012), to whom Bordo and Meissner (2012) borrow their data on credit growth. In this paper, Schularick and Taylor (2012) highlight the divergence between monetary aggregates and credit dynamics in the 2nd part of the 20th century, and that the recurrent episodes of financial instability have more often been the consequences of credit booms gone bust.
Based on an original, very long (1870-2008) dataset for 14 developed countries, Moritz Schularick and Alan Taylor originated a consistent research program, together with Oscar Jordà, on the relationship between credit booms and financial crises. In Jordà, Schularick and Taylor (2011), crisis of 2007/08 is identified as one of the five big synchronized global financial crises over the considered sample, together with two crises in the 19th century (1873, and the early 1890s), 1907 and the one of the Great Depression,1930/31.They show that the global crises are typically characterized by booms and bust dynamics (as measured by growth and investment) strongest than in the case of national crises, low short-term rates compared to real growth rates, and deeper recessions
12 than in normal times. More
12
This point is developed in Jordà, Schularick and Taylor (2013a), who find that financial crisis recessions are costlier than typical recession, and that more credit-intensive expansions tend to be followed by deeper recessions and slower recoveries. Mian and Sufi (2010) find similar evidence in the case of the USA for the most recent crisis: based on cross-sectional data for household credit reliance at the county level, they show that household leverage as of 2006 is a powerful statistical predictor of the severity of the 2007–09 recession

CEPII Working Paper ou Document de travail du CEPII Inequality, Leverage and Financial Crises
34
importantly in our case, they find that credit trends are a strong predictor of financial crises, in any case stronger than external imbalances.
Additional (but somewhat more moderate) evidence is displayed in Jordà, Schularick and Taylor (2014), which we already mentioned before (see box 2 above). Over 5-year windows (short business cycles), rises in mortgage lending and house prices clearly delivers information on the likelihood of financial crises, but cannot predict them perfectly. However, this predictive power becomes stronger in the post-World War II period, with the rapid rise of real estate lending. This raises indirectly another key issue, related to the distinction between household and firm credit. Based on a panel of 37 developed and emerging countries over the 1990 to 2007 period, Büyükkarabacak and Valev (2010) do find that a boom of the credit to the private sector as a whole is associated with subsequent banking crises. However, they also provide evidence that the household component have been the driving factor of that effect, whereas firm credit growth do not display such a robust and significant impact. The underlying intuition is that firm debt has a much more significant impact on long-term income than household debt. The result is that the growth in household credit is much more likely to raise the debt to GDP ratio over the long-run and therefore, the probability of a banking crisis.
When pointing the specific importance of household debt, one may be tempted to focus mainly on real estate bubbles: after all, the 2007-2008 subprime crisis was directly rooted in the huge amount of bad loans to people with low or moderate credit scores to buy homes. Relying on data for US counties over 2002-2009, Mian and Sufi (2010) emphasize that short-term finance also played a major role in the deepening and the persistence of the 2007-2009 recession.
13 The first step of the analysis focuses on the timing of the recession, and shows
that counties experiencing the largest increase in household leverage from 2002 to 2006 exhibited the sharpest relative decline in durable consumption as soon as the end 2006 (almost a year before the official start of the recession). The second step shows that counties with households more exposed to short-term credit (as proxied by credit card utilization rate as of 2006) experienced an acceleration of the recession from the fourth quarter of 2008 through the second quarter of 2009. Household leverage as a whole (i.e., including housing credit and short-term finance) appears as a powerful predictor of both the occurrence and the severity of the 2007-2009 recession across US counties.
Mendoza and Terrones (2008) complete the previous analyses by distinguishing between credit booms in advanced and emerging countries, and by relating macro developments to micro, firm-level measures of leverage and financial constraints. Based on data spanning the 1960-2006 period, they use event study methods to identify 27 credit booms in industrial
13
Note that Mian and Sufi (2010)'s approach is slightly different from the one consisting in assessing the impact of the dynamics of credit on the probability of banking crisis. Their focus is more general, in the sense that they study the impact of household leverage on several outcomes, including house prices, new housing building permits, default rates, unemployment and auto sales.

CEPII Working Paper ou Document de travail du CEPII Inequality, Leverage and Financial Crises
35
countries, and 22 in emerging economies. Therefore, they do not discriminate, as Jordà, Schularick and Taylor (2011) do, between credit booms simultaneous to big global financial crises and the others. Mendoza and Terrones (2008) find that credit booms are associated with periods of economic expansion, rising asset prices, real appreciation and widening external deficits, followed by the opposite dynamics when the credit boom goes bust. Credit booms are also associated with procyclical movements in firm-level indicators of leverage, firm values, and use of external financing. When distinguishing between industrialized and emerging economies, they find that these movements are exacerbated for emerging countries. In particular, they find that credit booms are more likely to end in a financial crisis in emerging countries.
To make a long story short, a major insight from section 3 is that the type of leverage considered is probably crucial: it seems to be the major predictor of financial crises, and more widely recessions. Failure to examine the specificity of household leverage (compared to total leverage, or firm leverage) may also explain the mixed evidence found regarding the relationship between inequality and leverage. The clarification of this relationship, based on different measures of credit aggregates, seems therefore a priority avenue for future research.
4. The impact of Finance on Inequalities
The identification of a causal link from inequality to financial crises is a difficult task. As we saw in section 2, the theoretical mechanisms are numerous but the main challenge is to disentangle direct causal impact, indirect causal impact and coincident factors. In section 3, we saw that there was no consensus in the empirical literature and we identified several challenges that must be addressed in future researches. One obvious dimension is the reverse causality. As we will see in the following section, both financial development and financial crises have strong effects on the distribution of income. Here also, we have to be sharp on what we need to identify as the effect of financial development (the growth of credit), financial deregulation and financial crises may have contradictory effects
4.1. The impact of financial development in “normal times” on inequality
Why should capital markets imperfections have a persistent significant impact on income distribution in the economy? When informational asymmetries and transaction costs are strong, credit constrains are likely to be disproportionately more binding for those like the poor and small businesses who do not have collateral and/or long run relationships with credit suppliers. The development (both quantitative and qualitative) of the financial sector relaxes these credit constraints, and allows more constrained individuals accessing external finance. This, in turn, should improve the allocation of capital and alleviate income inequality.
At the beginning of the nineties, however, the theoretical relationship between finance and inequalities does not appear to be straightforward. The approach by Greenwood and

CEPII Working Paper ou Document de travail du CEPII Inequality, Leverage and Financial Crises
36
Jovanovic (1990) predicts a Kuznets curve (an inverted U, i.e. a hump-shaped relationship) between financial development and inequality. In the early stages of development, when the financial sector is underdeveloped and the economy grows slowly, financial superstructure (i.e., all institutions designed to pool risks and increase the efficiency of capital allocation) begins to emerge as the economy approaches the intermediate stage of the growth cycle. Here the economy's growth and savings rates both increase, but poor individuals save less and thus accumulate wealth more slowly: income differences between high-income individuals and low-income ones will widen, resulting in an increase in income inequality. By maturity, the economy has developed an extensive structure for financial intermediation, and more agents see their income increase as they gain access to the financial intermediary sector. In the final stage of development the distribution of income across agents stabilizes, the savings rate falls, and income inequality will shrink.
However, the idea of a linear, positive relationship between financial development and inequality became quickly widespread in economic research. It is underlying, for example, Banerjee and Newman (1993)'s approach of the interactions between occupational choices and development. In their framework, financial market imperfections are mainly binding on the poor, who cannot support the high levels of investment required by entrepreneurial activities, and choose instead to work for other, wealthier, employers. The main conclusion of the model is to show that the initial distribution of wealth is crucial for determining the ultimate path of the economy – if initial inequality (the ratio of poor to wealthy people) is too high, the economy will get trapped in a low employment and wages equilibrium. One can see immediately, however, that a reduction in financial imperfections (that is, an increase in financial development), allowing more poor people to become entrepreneurs, will make this outcome less likely. A very similar argument is made in Galor and Zeira (1993), who also conclude to an impact of the initial distribution of wealth on aggregate output and investment both in the short and in the long run. One of the key underlying hypotheses is once again the presence of capital market imperfections, which hampers (indivisible) investment in human capital for those who do not inherit an initial large enough wealth – in other words, the poor. A better access to well-functioning credit markets should therefore reduce inequalities in individual investments in human capital, and therefore the impact of initial inequality on aggregate outcomes, if not inequality itself.
This now long-standing conventional wisdom about financial development and inequality (also shared, among many other, by Aghion and Bolton, 1992, 1997, or Piketty, 1997) was summarized in Levine’s Chapter of the Handbook of Economic Growth (2005). He was unambiguous on the subject: quoting the study by Beck, Demirgüç-Kunt and Levine (2004)
14,
Levine (2005, page 920) concludes: “the results indicate that finance exerts a 14 In a revised version of the paper, Beck, Demirgüç-Kunt and Levine (2007) confirm those conclusions: “Financial development disproportionately boosts incomes of the poorest quintile and reduces income inequality. About 40% of the long-run impact of financial development on the income growth of the poorest quintile is the result of reductions in income inequality, while 60% is due to the impact of financial development on aggregate economic growth. Furthermore, financial development is associated with a drop in the fraction of the population living on less than $ 1 a day, a result which holds conditioning on average growth.”

CEPII Working Paper ou Document de travail du CEPII Inequality, Leverage and Financial Crises
37
disproportionately large, positive impact on the poor and hence reduces income inequality.” Levine acknowledges “the methodological weaknesses associated with cross-country regression”, but even in his most recent works (e.g. Beck, Levine and Levkov, 2010, see below), Levine never doubts the positive impact of financial development on inequalities.
15
However, reviewing the literature over very recent years tends to question this consensual view. As we already pointed out in section 2.3., a crucial point is what one puts behind the idea of financial development. If the focus is on a restricted view of financial development, mainly based on the size of available credit and liquidity, most (but not all) papers conclude to a positive impact on inequality. When the perspective is widened to qualitative dimensions of financial dynamics of the past decades, like deregulation and liberalization, the sign of the relationship becomes much less clear, to say the least. Besides, a crucial methodological point relates to the way endogeneity issues are handled, insofar as reverse causality between financial development and inequality may arise for a number of reasons – in addition to the ones listed in section 2, Kim and Lin (2011) detail some other possible channels, many of them related to weak institutions (e. g., inequality affects de facto political power, which determines strongly the ability of the financial sector to develop and play efficiently its part, see Acemoglu et al., 2005).
4.1.1. The “quantitative” view: financial development as the size of the financial sector
Regarding the literature focusing on the quantitative aspects of financial development (size of credit and liquidity supplied to the economy), many papers, mostly empirical, support a positive, causal impact on inequality. Based on standard and Instrumental Variables (IV, designed to account for endogeneity issues) estimations for a dataset of 83 countries between 1960 and 1995, Clarke et al. (2006) strongly support that financial development (private credit and bank assets) decreases income inequality. With an almost identical empirical methodology and definition of key variables, Kappel (2010) also concludes to a reduction of income inequality when financial development increases for a panel of 78 developing and developed countries for the period 1960-2006. Enowbi Batuo et al. (2010) reach identical conclusions with a dynamic panel estimation (GMM) of a dataset covering 22 African countries for the period between 1990 to 2004: income inequality shrinks as the size of the financial sector increases. Mookerjee and Kalipioni (2010) use an original indicator of financial development, namely the number of bank branches per 100,000 populations.
16
Based on standard and IV, cross-sectional17
regressions for 70 developing and developed countries over the period 2000-2005, results show that greater access to bank branches
15 In his Vox-Eu column published the 25th of October 2011, Levine states: “Research also shows that bank development disproportionately helps the poor.” 16
In that sense, this definition of financial development may seem close to the idea of financial superstructure used in Greenwood and Jovanovic (1990). 17
Most variables are averaged over the period 2000-2005.

CEPII Working Paper ou Document de travail du CEPII Inequality, Leverage and Financial Crises
38
robustly reduces income inequality across countries. Consistently with these outcomes, the study also documents that barriers to bank access significantly increase income inequality.
However, there are other studies, while sticking to quantitative aspects of financial development, which do not reach so unambiguous conclusions regarding the positive impact of financial development on inequality. Law and Tan (2009) rely on a pure time-series approach by performing bounds tests (Pesaran et al., 2001) for Malaysia on quarterly data covering the period 1980-2000. While financial development is apprehended through various measures of financial sector size, income inequality is based on data from the University of Texas Inequality Project (UTIP, see box 1 above), which provides income inequality measures based on manufacturing wage data from the United Nations Industrial Development Organization (UNIDO, id.). The main outcome of the study is that financial development is, at best, very weak and statistically insignificant determinant of income inequality. Arora (2012) uses a sub-national, state-level dataset (discriminating between rural and urban areas) for India, relying on grouped national household sample survey data on monthly household consumption expenditure at the sub-national level for the years 1999–2000 to 2006–2007. Financial development is proxied with well-known quantitative variables, transposed at the state-level (private credit as a proportion of state product is the main one). Inequality is measured in terms of monthly household expenditure in each state. The results indicate that financial development is associated with a reduction in inequality, but only in the urban areas. Further, inequality is found to be higher in the richer states compared to less developed and low income states. A last, intriguing result is that increase in population per bank branch (decrease in the number of bank branches, in other words, a reduction in financial infrastructure) leads to higher inequality in urban areas but decline in rural areas.
One could legitimately argue that those studies are flawed due to their limited geographical coverage (a single country). However, there are some papers providing cross-sectional or panel evidence of a not-so-straightforward positive impact of financial development on inequality. Kim and Lin (2011) use an IV threshold regression over a cross-section of up to 65 countries over the period 1960-2005
18, with the idea of testing the existence of a financial
depth threshold such that the effect of financial development on income inequality changes. Financial development is measured through standard liquidity and stock market indicators, and inequality is the annual growth rate of the Gini coefficient of income inequality. Kim and Lin (2011) do find evidence of a non-linear effect of financial development on inequality. More specifically, financial development of both banks and stock markets reduces income inequality if the country has reached a threshold level of financial development. Below this critical value, however, financial development hurts the poor more and exacerbates income inequality. This evidence is consistent with the inverted U-shaped, Kuznets type approach of Greenwood and Jovanovic (1990). Law and Tan (2012) also find evidence of non-linearities in the relationship between financial development and inequality, but quite opposite to the
18
The methodology used in their paper do not allow the use of panel data, as a consequence, the data are averaged over the sample period.

CEPII Working Paper ou Document de travail du CEPII Inequality, Leverage and Financial Crises
39
one pointed in Kim and Lin (2011). Based on dynamic panel data model estimated with Generalized Method of Moments (GMM) over the period 1980-2000, they find that, when at early stages, financial development reduces income inequality. But above a certain threshold level, further deepening will lead to a reverse effect, which deteriorates income inequality. This U-shaped profile is exactly opposite to the one advocated theoretically by Greenwood and Jovanovic (1990) and empirically by Kim and Lin (2011). However, Law and Tan (2012) acknowledge that this result is highly dependent on the selected income inequality dataset. Finally, Jauch and Watzka (2011) perform an empirical analysis based on a very broad dataset (138 developed and developing countries over the period 1960 to 2008), using standard panel methods and performing robustness using IV. To our knowledge, this is the sole paper with such a wide data to reach the conclusion that financial development increases income inequality, even if the effect is quantitatively small: an increase in the provision of credit by 10% leads to an increase in the Gini coefficient by 0.23 for the within estimation. The authors also emphasize that this does not exclude the possibility that all income groups within a country benefit from more financial development, but those who are already better off benefit more because income inequality is increasing. Interestingly, the dataset they use for computing income inequality is the one by Solt (2009). This data set is also the one allowing Law and Tan (2012) to support their result of a U-shaped relationship between finance and inequality.
This emphasizes that, in addition to the choice for the measure of financial development, the way income inequality is measured raises another key methodological issue (see box 1). More generally, this overview of the (quantitative) financial development literature exhibited a great heterogeneity of approaches, with different geographic and time coverages, econometric options, treatments for endogeneity and data sets. With no doubt, those discrepancies play a non-negligible part in the quite contrasted results we summarized.
4.1.2. Broadening the picture: deregulation and liberalization as key features of financial dynamics
In theory, financial liberalization and deregulation are implemented to simultaneously increase the volume of available capital, efficiency in its allocation and improve access to external finance for credit constrained individuals. However, Claessens and Perotti (2007) review evidence supporting the idea that the quality of institutions play a decisive part in determining the way financial reforms designed to increase access to external finance will effectively allow reducing inequality. A key condition is to prevent insiders to capture financial regulation to preserve their own, established interests. Claessens and Perotti (2007) provide evidence that captured reforms in developing countries deepen rather than broaden access to credit, and produce concentrated benefits while risks become socialized. Therefore, financial liberalization presented as increasing access may in practice increase fragility and inequality. In addition to a buildup in oversight institutions, Claessens and Perotti (2007) suggest that liberalization reforms should be gradual, aimed explicitly at reducing inequality of access and maintaining support competition.

CEPII Working Paper ou Document de travail du CEPII Inequality, Leverage and Financial Crises
40
Focusing on the case of India, Ang (2010) seeks to discriminate explicitly between the impact of financial development and the one of financial liberalization on the evolution of income inequality. The analysis relies on an error-correction model (ECM) estimated with annual data over the 1951-2004 period. Income inequality is a Gini coefficient, based on standard aggregate income data, and financial development is proxied with the same quantitative variables than previously (the ratio of claims on the private sector to GDP, the ratio of broad money M3 minus Ml to GDP etc.). Financial liberalization is a synthetic variable provided by Demetriades and Luintel (1996, 1997), based on nine indicators of financial repressionist policies, related to government control of lending and deposit rates, directed credit programs and a couple of statutory prudential ratios.
19 The main results indicate that, while financial
development can help reduce income inequality, financial liberalization seems to exacerbate it. Regarding financial development, Ang (2010) support the idea of a linear impact on income inequality, rejecting all the arguments in favor of non-linearity we presented before (Greenwood and Jovanovic, 1990; Law and Tan, 2012). Besides, Ang (2010) attribute the magnifying impact of financial liberalization on inequality to a rent-capturing attitude form well-connected elite, in line with the analysis by Claessens and Perotti (2007).
Beck, Levine and Levkov (2010) also perform an analysis on a single country, but with a very different approach and dataset. They assess the impact of bank deregulation (defined as the suppression of restrictions on intrastate branching), in the US over the period 1976-2006 based on a dataset for 48 States and the District of Columbia. The empirical strategy relies on a difference-in-differences approach, and uses several definitions on income inequality (logarithm vs. logistic Gini coefficient, gap between the 90th and 10th decile of income) on the left-hand side. The conclusions are unambiguous: branching deregulation induced a reduction in inequality between 3 and 7% (10% when considering the 90th decile/10th decile ratio). This conclusion does not need to be necessary incompatible with the ones by Ang (2010): the institutional frame is very different in the US and India, not accounting the difference in levels of development. It seems sensible to think that US institutions were strong enough in the 1970s and the 1980s, when the deregulation occurred, to prevent the rent-capturing behaviors that may have been harmful in the Indian case. This is again consistent with Claessens and Perotti (2007)'s story.
In a way, Gimet and Lagoarde-Segot (2011) rationalize those findings in a cross-country analysis. They provide a detailed analysis of the impact of financial development on income inequality, focusing on the characteristics of the financial sector (banking and capital market size, robustness, efficiency and international integration). The empirics rely on an unbalanced panel Bayesian structural vector autoregressive (SVAR) model, for a set of 49 countries over the 1994–2002 period. Income distribution data come from Estimated Household Income Inequality (EHII, see box 1 above). Regarding financial variables, several indicators of size and efficiency of both banking sector and capital market are computed, in addition to proxies of financial integration and transaction costs. Main results indicate that increased banking credit and credit market imperfections tend to raise inequalities, while 19
Results seem robust to the use of alternative measures of financial liberalization.

CEPII Working Paper ou Document de travail du CEPII Inequality, Leverage and Financial Crises
41
bigger and more efficient capital markets tend to reduce inequalities. Quantitatively, the empirical analysis support that the banking sector exerts a stronger distributional impact on inequality than capital markets, and that the relationship depends on the characteristics (transparency and ability to allocate resources optimally) of the financial sector, more than its size. Once again, the qualitative features of financial institutions seem to be crucial in determining in which direction financial liberalization will effectively impact inequality: transparency is the key against rent-capturing behaviors, and competition is essential for a good allocation of resources.
Two main lessons can be drawn from this section. First, effects of financial development (and more specifically, of the growth of credit) and financial deregulation on income distribution are very likely to differ. Financial development itself has ambiguous effects on inequality and many studies find non-linear (sometimes deeply diverging) relationships between the two. The level of development and other factors such as the quality of institutions preventing rent-capturing behaviors should also matter. On the contrary, financial deregulation itself is more likely to increase inequalities if institutions are not strong enough to prevent rent-capturing behaviors. The second conclusion is that finance has an obvious impact on income distribution, whatever dimension we are focusing on. It is therefore absolutely necessary to keep this two-way causality in mind when trying to identify empirically the causal impact of inequality on leverage.
4.2. The impact of financial crises on inequality
If financial development and leverage have an impact on income distribution, financial crises also have additional and specific effects. The link with the development of the financial sector is obvious. The larger is the financial sector, the higher will be the probability of a financial crisis, all other things being equal. Besides, the consequences of financial crises will also depend on the size of the financial sector, as the larger the financial sector, the more severe the crisis.
Surprisingly, there seem to be only very few papers focusing specifically on the distributional impact of financial crises. In order to assess this distributional impact, we first need to think on the effect on the output. Fortunately, the literature is richer concerning this aspect. It is important because financial crises are very diverse, and so are their consequences.
4.2.1. The output impact of financial crises
The first distinction to make is between banking crises, currency crises and a combination of the two (twin crises). A banking crisis is defined as a “financial distress resulting in the erosion of most or all of aggregate banking system capital” (Bordo et al. 2001, p. 55). A currency crisis is more difficult to define. It can either be a “forced change in parity, abandonment of a pegged exchange rate, or an international rescue” (Bordo et al, ibid). But

CEPII Working Paper ou Document de travail du CEPII Inequality, Leverage and Financial Crises
42
sharp falls of the exchange rate can also be characterized as currency crises. According to Milesi-Ferretti and Razin (2000), a crisis occurs when the nominal depreciation of the currency is at least 25%, which at least doubles the previous year's depreciation, and the latter is below 40%; or when the nominal depreciation of the currency is at least 15%, at least 10% higher than the previous year's depreciation, with the latter below 10%. According to Frankel and Rose (1996), a currency crisis occurs when there is a nominal depreciation of 25% of the exchange rate. Others use some indexes of speculative pressure (Berg & Patillo 1999, Goldstein et al. 2000, Bordo et al. 2001).
Using a panel of 120 years, Bordo et al. (2001) show that the output loss is 20% of the GDP approximately and on average (taking into account both currency and banking crises). The average recovery time lies between 3 and 4 years. Focusing on emerging market economies over the period 1975-1997, Hutchinson and Noy (2005) find that currency crises reduce output by about 5 to 8% over a 2 to 4 years period, and banking crises by about 8 to 10%. The combined effect of a twin crisis is estimated between 13 and 18% of the output. There is no additional negative impact on output growth above the combined effect of the two crises.
The negative impact of banking crises is rather consensual in the literature. Reinhart and Rogoff (2009b) find very similar impact in developed and emerging countries. On average, output falls an average of over 9% and the duration of the downturn is two years. The associated rise in unemployment is about 7 percentage point and the duration is longer (over four years). Hutchinson and McDill (1999) find an average output loss of 7% and an average duration of 3.3 years and Demirgüc-Kunt et al. (2006) a 4% of output loss over the period 1980-1998. Reinhart and Rogoff (2014) argue that a significant part of the cost “lies in the protracted and halting nature of the recovery”. Out a sample of 100 banking crisis, they find that 43% of the post-crisis episodes experienced double dips.
Evidence concerning the effect of currency crises are much more mixed. This is not surprising as a fall of the exchange rate have two effects. It increases the price of imported goods and may lead to a contraction of credit because of a balance sheet deterioration of firms and financial institutions which have extensive foreign currency liabilities. It may also be contractionary in case of sudden stop in capital inflows. On the other side, it increases the price-competitiveness of exporting firms which may have a positive effect on the trade balance in the medium run. Because of this latter effect, many authors find an expansionary effect in some cases (or no clear effect on the output). Aziz et al. (2000) find an average GDP loss of 4.25% but they observe no negative effect on the output in 40% of cases. Milesi & Razin (2000) note that “reversal events seem to entail substantial changes in macroeconomic performances but are not systematically associated with a growth slowdown” (p. 20). They find a similar median growth before and after the currency crisis. It may be the case that the effects of such crises largely differ from one country to another because of structural differences. For instance, Hutchinson and Noy (2002) find a large cost in terms of output (5 to 8% over a three year period) for a sample of emerging economies. They argue that the output costs are larger than for other developing countries because of their dependence on private capital markets. Ahmed et al. (2002) also make a distinction

CEPII Working Paper ou Document de travail du CEPII Inequality, Leverage and Financial Crises
43
between the effect of a devaluation in developed and developing countries. Devaluations are more likely to be contractionary in the latter. Using a sample of developing countries over the period 1970-2000, Gupta et al. (2007) find that currency crises are associated with a deceleration of growth in 60% of the crisis episodes while it rises in the 40 other percent. In emerging market economies, the effect is one and half times more contractionary than in other developing countries. One factor that may explain such difference is that countries which receive substantial capital flows in the years prior to the crisis are more likely to experience a contraction during the crises. Hutchinson & Noy (2006) also argue that most of the cost of a currency crisis is indeed explained by Sudden Stops (6-8% the year of the crisis) while the “pure” cost of the currency crisis itself is much lower (2-3%).
The heterogeneity of effects highlights the need to make a clear distinction between different type of crises when considering the distributional impact.
4.2.2. The distributional impact of financial crises
The output impact of financial crises is likely to have direct consequences in terms of income distribution. As any change in growth level, it will have various (and ambiguous effect) on both income distribution and poverty (Bourguignon, 2004). But the effect on employment will also have an impact on income distribution. Especially in developing countries, a financial crisis may lead to job losses in the formal sector and reduces demand for services in the informal sector. Entry of unemployed formal-sector workers creates a pressure on informal labor market (Baldacci et al. 2002).
In addition to the impact of a slowdown in economic activity, Baldacci et al. (2002) identify three other channels through which financial crises affect poverty and income distribution: relative price changes, fiscal retrenchment and changes in assets. A devaluation leads to a fall in earnings of those employed in the non-tradable sector while it increases the demand for exports and therefore leads to an increase in employment and earnings in this sector. The poor may also be affected by the price increase of imported goods, especially food prices. As a crisis is generally followed by fiscal retrenchment and public spending cuts, it may affect social assistance outlays, which amplifies the consequences of the crisis on the poor. Lastly, changes in the value of assets have an impact on income distribution as changes in interest rates, asset and real estate prices are more likely to affect the wealth of the better off.
Baldacci et al. (2002) propose to analyze empirically the impact of financial crises on poverty and inequality using two types of data. First, they use cross-country macroeconomic data in a quasi-experiment setting, with a special interest in currency crashes. Then, they focus on the Mexican case and the impact of the 1994-1995 crisis using micro-data. As we have seen above, contrary to banking crises, they have ambiguous effect on the output, making the study of their distributional impact more difficult. On the whole, they find a positive impact on poverty headcount ratios and on Gini coefficients. However, the poor in the lowest income

CEPII Working Paper ou Document de travail du CEPII Inequality, Leverage and Financial Crises
44
quintile are not the most affected. The most affected are those in the second lowest income quintile. The paper argues that it is explained by the capacity of the poorest to find income opportunities in the informal sector. Another result is that the association between income distribution and poverty is stronger when crises are associated with a fall of income. This fall of income accounts for 15 to 30 % of the variations in the poverty and inequality indicators. They do not find significant impact on formal unemployment. The rise in inflation is associated with an increase in the income share of the middle-income quintile while fiscal retrenchment is associated with a deterioration in the distribution of income.
The micro-analysis shows a very different picture. If they also found a positive impact on poverty, they observe a decrease in inequality, explained by a stronger fall of income of the richest. They find that households that were already poor before the crisis were not necessarily the hardest hit. It shows that crises are indeed likely to have massive distributional impact that can be hidden when looking at macroeconomic aggregates.
The empirical analysis have several drawbacks. First, the macroeconomic analysis focuses only on currency crises. The effects of a banking crises are likely to be very different. Second, the possible influence of other factors is not addressed. Concerning the micro-analysis, the authors acknowledges that the changes observed between 1994 and 1996 can be explained by other factors, the first one is the adoption of NAFTA which also had strong distributional impact.
Galbraith and Jiaquing (1999) also propose to study the impact of financial crises on inequality. They also focus on currency crises, using the data set of Kaminsky and Reinhart (1996) in which financial crisis is defined as a weighted average of exchange rate changes and reserve changes. They find that the mean increase in inequality in the two-year period immediately following a crisis is 16.2%, against 3.2% in years without crises, the difference between the two being statistically significant. However, this analysis does not take into account possible confounding factors that may affect both the probability of a crisis and inequality. They also note that crises raise inequalities “more in the most deregulated labor markets and less in more highly regulated ones” (p. 7). They note that financial crises have had “worse effects on Latin America workforces than on Asians, and worse on Asians than on the organized and politically powerful workers of the North” (p. 7). If this possible interaction between labor market institutions and the effect of a crisis is interesting, this should be confirmed by more detailed empirical studies, focusing on the identification of a causal link.
Another paper is about the impact of systemic banking crises on the top income share in the US. Morelli (2014) shows that these crises had only little impact on the income of the top decile. He identifies three possible theoretical channels and takes into account the possible reverse causality (e.g. the impact of inequality on financial crises). The three channels are (1) Stock and Real Estate markets dynamics, (2) the Economic Recession and unemployment and (3) the effect of government interventions and fiscal policies. He estimates a total short-run effect, taking into all these possible channels. He uses gross income distribution data, in
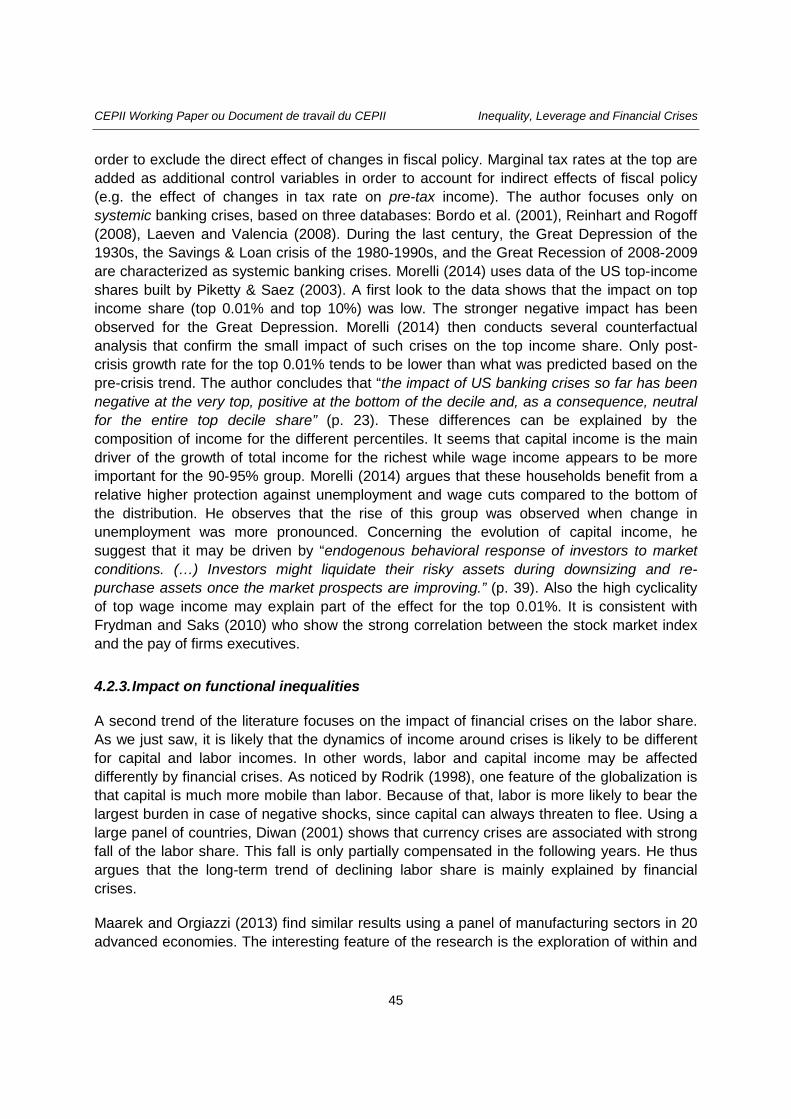
CEPII Working Paper ou Document de travail du CEPII Inequality, Leverage and Financial Crises
45
order to exclude the direct effect of changes in fiscal policy. Marginal tax rates at the top are added as additional control variables in order to account for indirect effects of fiscal policy (e.g. the effect of changes in tax rate on pre-tax income). The author focuses only on systemic banking crises, based on three databases: Bordo et al. (2001), Reinhart and Rogoff (2008), Laeven and Valencia (2008). During the last century, the Great Depression of the 1930s, the Savings & Loan crisis of the 1980-1990s, and the Great Recession of 2008-2009 are characterized as systemic banking crises. Morelli (2014) uses data of the US top-income shares built by Piketty & Saez (2003). A first look to the data shows that the impact on top income share (top 0.01% and top 10%) was low. The stronger negative impact has been observed for the Great Depression. Morelli (2014) then conducts several counterfactual analysis that confirm the small impact of such crises on the top income share. Only post-crisis growth rate for the top 0.01% tends to be lower than what was predicted based on the pre-crisis trend. The author concludes that “the impact of US banking crises so far has been negative at the very top, positive at the bottom of the decile and, as a consequence, neutral for the entire top decile share” (p. 23). These differences can be explained by the composition of income for the different percentiles. It seems that capital income is the main driver of the growth of total income for the richest while wage income appears to be more important for the 90-95% group. Morelli (2014) argues that these households benefit from a relative higher protection against unemployment and wage cuts compared to the bottom of the distribution. He observes that the rise of this group was observed when change in unemployment was more pronounced. Concerning the evolution of capital income, he suggest that it may be driven by “endogenous behavioral response of investors to market conditions. (…) Investors might liquidate their risky assets during downsizing and re-purchase assets once the market prospects are improving.” (p. 39). Also the high cyclicality of top wage income may explain part of the effect for the top 0.01%. It is consistent with Frydman and Saks (2010) who show the strong correlation between the stock market index and the pay of firms executives.
4.2.3. Impact on functional inequalities
A second trend of the literature focuses on the impact of financial crises on the labor share. As we just saw, it is likely that the dynamics of income around crises is likely to be different for capital and labor incomes. In other words, labor and capital income may be affected differently by financial crises. As noticed by Rodrik (1998), one feature of the globalization is that capital is much more mobile than labor. Because of that, labor is more likely to bear the largest burden in case of negative shocks, since capital can always threaten to flee. Using a large panel of countries, Diwan (2001) shows that currency crises are associated with strong fall of the labor share. This fall is only partially compensated in the following years. He thus argues that the long-term trend of declining labor share is mainly explained by financial crises.
Maarek and Orgiazzi (2013) find similar results using a panel of manufacturing sectors in 20 advanced economies. The interesting feature of the research is the exploration of within and

CEPII Working Paper ou Document de travail du CEPII Inequality, Leverage and Financial Crises
46
across sector effects. By eroding the bargaining power of workers, financial crises may reduce the labor share within sectors. But it can also lead to structural changes with various effects among sectors. On average, they find that currency crises reduce the labor share by 2 percentage points and this effect comes mainly from within manufacturing sectors changes.
This last result is consistent with Bazillier and Najman (2012) who use a panel of developing and developed countries and aggregate data. This paper also extends the analysis to banking crises and find very different results. If currency crises are also found to reduce the labor share by 2 percentage points in the three years following a crisis, banking crises affect primarily capital returns, at least the year of the crisis. They also find a stronger effect of banking crises in OECD countries with a more positive impact the year of the crisis but also with significant fall of the labor share in the following years. These results confirm the potential heterogeneity of financial crises' impact, depending on the type of crisis.
4.2.4. The distributional impact of the Great Recession
As it is done in Morelli (2014), it is possible to characterize the current crisis as a systemic banking crisis. Therefore, all previous studies focusing on currency crises have little predictive power on the potential impact of such crisis, as we saw that the distributional impact is more likely to differ for banking crises. At the cross-country level, the most comprehensive study on the distributional impact of the Great Recession (GR) is certainly the one of Jenkins et al. (2013) focusing on 21 OECD countries. Globally, they found little change in household distribution of income in the two years following the crisis (2007-2009). Over the first years of the crisis, it seems that social protection plays a role in supporting income households. As a result of this, the gross household disposable income rose in 12 countries. The most notable case is Ireland where the GDP fall by 11 per cent while the total household income rise by over 3.5 percent. As stated by the authors, “In general, the household sector appears to have been well protected over 2007–9 from the impact of the downturn – in aggregate. The data cannot tell us about differences within that aggregate, but warn us that it would be misleading to infer the short-term impact of the GR on living conditions from looking only at GDP change” (p.49). Building a counterfactual based on social spending prior to the crisis, they found that total household sector incomes would have fallen without the support of governments through the tax and benefit system in most countries. However, they think that consolidation policies, implemented after 2010 are likely to have a greater effect on income distribution.
Meyer and Sullivan (2013) analyze the evolution of income and consumption inequality in the US over the period 2000-2011. Using the 90/10 ratio as a proxy of inequality, they found that income inequalities have risen by 11% between 2007 and 2011, while consumption inequalities have decreased after 2005. During the Great Recession, one explanation is that the fall in asset prices had a strong effect on those with higher consumption levels. It leads to

CEPII Working Paper ou Document de travail du CEPII Inequality, Leverage and Financial Crises
47
a negative wealth effect that could have a stronger impact on the richest households (De Nardi et al. 2012).
Cho and Newhouse (2013) do not directly study the impact of the crisis on income inequality but indirectly address the issue by studying the impact on different categories of workers using a sample of 17 middle-income countries. Female workers or low-skilled workers are not necessarily the most affected by the crisis. On the contrary, “better educated and urban residents, to a lesser extent, also suffered disproportionate employment losses. The decline in wage employment was also slightly larger for more educated workers” (p. 37). These results suggest little impact of the crisis on inequality, at least in middle-income countries.
This last result contradicts other studies in emerging countries such as South Africa (Leung et al. 2009) or China (Park et al. 2012) where low-skilled workers are found to be more affected by the crisis. In the US, Elsby et al. (2010) find that vulnerable groups, including low-skilled workers, were more affected by the crisis, suggesting a possible positive impact on inequalities. Hoyes et al. (2012) find similar results: “the impacts of the Great Recession have been felt most strongly for men, black and Hispanic workers, youth, and low-education workers”. They also note that the cyclicality across demographic groups is very similar than in previous recessionary periods.
4.2.5. The distributional impact of fiscal consolidation
Financial crises may have direct effect on the distribution of income but also indirect effect through the effect related to policy responses. In most countries, the crisis has been followed by fiscal consolidation which may also have strong distributional impact. Using a panel of 17 OECD countries over the period 1978-2009, Ball et al. (2013) show that fiscal consolidation are usually associated with a rise of inequalities, a fall of the labor share and a rise of long-term unemployment. This result is confirmed by Woo et al. (2013). Using a panel of emerging and advanced economies over the last three decades, they find that, on average, a fiscal consolidation of 1 percentage point of GDP is associated with an increase in the Gini coefficient of around 0.4-0.7 percent over the first two years. As unemployment is found to increase inequalities and that fiscal consolidation increases unemployment, they show that 15-20% of the inequality increase following a fiscal consolidation is explained by the rise of unemployment.
Fiscal consolidation may also have adverse effects on inequality if governments decide to cut social spending. Woo et al. (2013) show that a 1 percent decrease in social spending is associated with a rise of 0.2 to 0.7% in inequality. Lewis & Verhoeven (2010) show that crises have strong effect on social spending. If most governments try to protect investment in education, lowest income countries are more likely to cut social spending during crises. Bonnet et al. (2010) confirms that the Great Recession has been followed by cuts in social security spending. Concerning the pension system, they note that “the current crisis has produced financial constraints leading to cuts or restrictions in benefit levels— specifically for pre-funded defined-contribution pensions — and negative rates of return on pension fund

CEPII Working Paper ou Document de travail du CEPII Inequality, Leverage and Financial Crises
48
investments, undermining the benefit levels of those already retired, those close to retirement and those who will retire in future” (p. 48).
Overall, the distributional impacts of crises are debated and there is no consensus on the sign of the relationship. However, it is clear that there is an impact. It highlights the need to address seriously the problem of reverse causality when dealing about the causal impact of inequality on leverage and financial crises. One additional remark is that the impact of financial crises on inequalities will also depends on the size of the financial sector. In other words, financial crises will have a stronger impact on the output and therefore on the distribution of income if financial development is strong. Therefore, in addition to the direct impact of financial development on inequalities (section 4.1.), the size of the financial sector has an impact on (i) the probability of a crisis (section 3.3), but also on (ii) the magnitude of the financial crises' impact. This last dimension should be considered when analyzing the two-way relationship between financial crises and inequality.
5. Conclusion
Linkages between inequalities, leverage and financial crises are numerous and complex. Based on the existing literature, we present in this paper an extensive overview of the potential, intertwined relationships, surveying both theoretical and empirical evidence related to the various aspects of that subject.
The first conclusion we can draw is that there is strong evidence already supporting the idea that inequalities do play a role in the dynamics of credit, finance and possibly financial crises. The exact extent and direction of the causal relation is much more difficult to establish per se, mainly because of the obvious, reverse impact of both finance and financial crises on the distribution of income. But overall, even if some links in the causation chain do deserve serious additional investigation, the presumptions for a circular causality between the dynamics of inequality and various aspects of the financial sphere evolution over the past decades are very strong.
Overall, we emphasize that inequalities are likely to affect both credit demand and credit supply directly and indirectly. Once again, the disentanglement of the two channels proves to be quite challenging; however, we have presented a wide range of theoretical studies explaining why households may increase their borrowings in response to rising inequalities, consistently with the dynamics observed in developed countries prior to the Great Recession. An alternative explanation relies on an increase in credit supply related to both an accommodative monetary policy and financial liberalization. Even in that case, it is very likely that inequalities have played a role. Stagnant income of the poorest households (but also more generally the middle-class) may have pushed Central Banks and Governments to implement policies aiming at supporting aggregate demand through increased borrowings for these households. As credit booms appear to be the main determinant of financial crises, the

CEPII Working Paper ou Document de travail du CEPII Inequality, Leverage and Financial Crises
49
possible direct and indirect impact of inequalities on such booms is a fundamental dimension to be taken into account by policymakers.
One cannot completely exclude that the relation between inequalities and credit boom has been more coincident than causal, as financial deregulation tends to increase inequalities and aims also at increasing directly credit. Banking deregulation and policies promoting the development of finance have been a common trend of economic policies in most countries since three decades. Some papers surveyed here support that inequalities may be both a cause and a consequence of such deregulation. As already mentioned, it is likely that policymakers were pushed to increase the access to credit in response to stagnant income. But it seems also pretty clear from most papers on that topic that deregulation has played a role in the huge rise in inequalities observed in the 1990s and 2000s. To summarize our view, the links between inequalities and leverage are likely to be a mixture of direct and indirect causal relations, as well as coincident factors. The remaining challenge is to empirically measure the relative weight of each channel.
We identified several promising avenues for future research. First, there is a need, at the macro level, to reassess the empirical relationship between inequalities and leverage. The current literature gives contradictory results mainly because of perfectible identification strategies. Because of the two-way relationship between finance and inequality, endogeneity is a major issue, and an adequate empirical treatment calls for finding relevant instruments. The second challenge is to determine what really matters. Is it the level or the evolution of inequalities that is likely to get an effect on credit? Besides, the choice for the measure of inequality is also not neutral. For credit demand, the distribution at the bottom of the income distribution is more likely to matter. For credit supply, it is the distribution at the top. Empirical studies should test the influence of different inequality measures to assess the reliability of their results. The last dimension is the measure of credit. Some studies are using the aggregate level of credit, which is not consistent with the underlying theoretical background: inequalities are likely to affect household debt primarily. It would also be probably worth studying the disaggregated impact on different types of household credit.
A second, promising direction would build on the micro literature on the determinants of credit, based on household microdata. If the rise of inequalities is explained by a permanent income shock, households should adjust their consumption accordingly. Studies finding differences between income inequality and consumption inequality have shown it was not the case. It would be interesting if it is explained by a phenomenon of “Keeping Up with Joneses” or more basically by expectations errors.
The last two dimension relate to the other direction of the relationship. Concerning the effect of financial development and financial deregulation on inequalities, we show that results were very sensitive to the choice of the inequality measure and databases. A meta-analysis taking into account all differences would be useful to bring back together very diverse results.
Lastly, researches on distributional impact of financial crises are very scarce, surprisingly. First there is a need to develop further researches concerning the impact of the Great Recession, but also fiscal consolidation policies that have followed the crisis. More generally, more systematic analyses of the possible distributional trends occurring after a financial crisis are needed: it appears from the existing studies that effects are very heterogeneous across the different type of crises, pointing at different channels of transmissions that require to be more precisely identified.

CEPII Working Paper ou Document de travail du CEPII Inequality, Leverage and Financial Crises
50
The topic on Finance and Inequality has been since recently the subject of a growing interest. The various intertwined, complex mechanisms surveyed in this paper need some additional investigations, to precisely gauge the direction of causalities and the relative importance of each channel. This, we believe, opens promising paths research for the future.
References
Acemoglu, D. & Zilibotti, F. (1997), “Was Prometheus unbound by chance? Risk, diversification, and growth”, Journal of Political Economy 105, 709–751.
Acemoglu, D. (2011), “Thoughts on inequality and the financial crisis”, AEA meeting, Denver. Adelino, M., Schoar, A. and Severino, F. (2014), “Credit Supply and House Prices: Evidence
from Mortgage Market Segmentation”. Available at SSRN: http://ssrn.com/abstract=1787252
Aghion, P., Bolton, P. (1992), “Distribution and growth in models of imperfect capital markets”, European Economic Review 36, 603–611.
Aghion, P., Bolton, P. (1997), “A theory of trickle-down growth and development”, Review of Economic Studies 64, 151–172.
Ahmed, S., Gust, C.J., Kamin, S.B. and Huntley, J. (2002), “Are depreciations as contractionary as devaluations? A comparison of selected emerging and industrial economies”, International Finance Discussion Papers, Board of Governors of the Federal Reserve System (U.S.) 737, Board of Governors of the Federal Reserve System (U.S.).
Aizenman, J. and Jinjarak, Y. (2012), “Income Inequality, Tax Base and Sovereign Spreads”, FinanzArchiv: Public Finance Analysis, Mohr Siebeck, Tübingen, vol. 68(4), pages 431-444, December.
Alvarez-Cuadrado, F. and El-Attar, M. (2012), “Income Inequality and Saving”, IZA Discussion Papers 7083, Institute for the Study of Labor (IZA).
Al-Hussami, F. and Martín Remesal, A. (2012), “Current Account Imbalances and Income Inequality: Theory and Evidence”, Kiel Advanced Studies Working Papers 459, Kiel Institute for the World Economy.
Ang, J.B. (2010), "Finance and Inequality: The Case of India," Southern Economic Journal 76(3), pages 738-761
Arora, R.U. (2012), “Finance and inequality: a study of Indian states”, Applied Economics 44, 4527–4538,
Atkinson, A.B, 1997, “Bringing Income Distribution in from the Cold”, Economic Journal, vol. 107(441), pp. 297-321.
Atkinson, A.B and Morelli, S. (2010), “Income Inequality and Banking Crisis : a First look”, Report prepared for the Global Labor Forum 2011 (ILO), Turin.
Atkinson, A.B and Morelli, S. (2011), “Economic crises and Inequality”, Human Development Research Papers (2009 to present) HDRP-2011-06, Human Development Report Office (HDRO), United Nations Development Programme (UNDP).
Atkinson, A.B., Piketty, T. & E. Saez (2011), “Top Income in the Long Run History”, Journal of Economic Literature, 49(1): 3-71.
Azzimonti, M., de Francisco, E. and Quadrini, V. (2014), “Financial Globalization, Inequality, and the Rising Public Debt”, American Economic Review, 104(8): 2267-2302.

CEPII Working Paper ou Document de travail du CEPII Inequality, Leverage and Financial Crises
51
Baker, M., Nagel, S. and Wurgler, J. (2007), “The Effect of Dividends on Consumption”, Brookings Papers on Economic Activity, Economic Studies Program, The Brookings Institution, vol. 38(1), pages 231-292.
Baldacci, E., de Mello, L. and Inchauste, G. (2002), “Financial Crises, Poverty and Income Distribution”, IMF Working Paper WP/02/4
Ball, L., Furceri, D., Leigh, D. and Loungani, P. (2013), “The Distributional Effects of Fiscal Consolidation,” IMF Working Paper 13/151 (Washington: International Monetary Fund)
Bazillier, R. and Najman, B. (2012), “Labor and Financial Crises: Is Labor paying the price of the crisis?”, mimeo.
Beck, T., Demirguc-Kunt, A. and Levine, R. (2004), “Finance, Inequality, and Poverty: Cross-Country Evidence”, NBER Working Papers 10979, National Bureau of Economic Research, Inc.
Beck, T., Demirguc-Kunt, A. and Levine, R. (2007), “Finance, Inequality, and the Poor”, Journal of Economic Growth Vol. 12(1), pages 27–49.
Beck, T., Levine, R., and Levkov, A. (2010), “Big Bad Banks? The Winners and Losers from US Branch Deregulation”, Journal of Finance 65(5), pages 1637-1667.
Behringer, J. and van Treeck, T. (2013), “Income distribution and current account: A sectoral perspective”, IMK Working Paper 125-2013, IMK at the Hans Boeckler Foundation, Macroeconomic Policy Institute.
Belabed, C.A., Theobald, T. and van Treeck, T. (2013), “Income Distribution and Current Account Imbalances”, IMK Working Paper 126-2013, IMK at the Hans Boeckler Foundation, Macroeconomic Policy Institute.
Berg, A. and Pattillo, C. (1999), “Predicting currency crises: The indicators approach and an alternative”, Journal of International Money and Finance, Elsevier, Elsevier, vol. 18(4), pages 561-586, August.
Bertrand, M. and Morse, A. (2013), “Trickle-down Consumption,” NBER Working Paper No. 18883.
Bonnet, F., Ehmke, E. and Hagemejer, K. (2010), “Social Security in Times of Crisis” International Social Security Review, Vol. 63, Issue 2, pp. 47-70, April/June 2010.
Bonnet, O., Bono, P.H, Chapelle, G., and Wasmer, E. (2014), “Does housing capital contribute to inequality? A comment on Thomas Piketty’s Capital in the 21st Century”, Science-Po Economics Discussion Paper, 2014-7.
Bordo, M.D., Eichengreen, B., Klingebiel, D. and Martinez-Peria, M.S. (2001), “Is the crisis problem growing more severe?”, Economic Policy, CEPR;CES;MSH, CEPR;CES;MSH, vol. 16(32), pages 51-82, 04.
Bordo, M.D., and Meissner, C.M. (2012), “Does inequality lead to a financial crisis?”, Journal of International Money and Finance, Elsevier, vol. 31(8), pages 2147-2161.
Bourguignon, F. (2004). “The Poverty-growth-inequality triangle”, New Delhi Working Papers, Indian Council for Research on International Economic Relations, New Delhi, India 125
Buyukkarabacak, B. and Valev, N. (2010), “Credit Expansions and Banking Crises: The role of household and enterprise credit,”, Journal of Banking and Finance, 34(6), 1247-1256
Caramazza, A.J. and Salgado, R. (2000), Currency Crises: In Search of Common Elements. IMF Working Paper, WP/00/67.
Christen, M. and Morgan, R. (2005), “Keeping Up With the Joneses: Analyzing the Effect of Income Inequality on Consumer Borrowing”, Quantitative Marketing and Economics, Springer, vol. 3(2), pages 145-173.

CEPII Working Paper ou Document de travail du CEPII Inequality, Leverage and Financial Crises
52
Cho, Y. and Newhouse, D. (2013), “"How Did the Great Recession Affect Different Types of Workers? Evidence from 17 Middle-Income Countries," World Development, Elsevier, vol. 41(C), pages 31-50.
Claessens, S. and Perotti, E. (2007), “Finance and inequality: Channels and evidence”, Journal of Comparative Economics 35(4), pages 748-773.
Clarke, G.R.G., Xu, L.C. and Zou, H.F. (2006), “Finance and Income Inequality: What Do the Data Tell Us?”, Southern Economic Journal, 72(3), pages 578-596,
Coibion, O., Gorodnichenko, Y., Kueng, L. and Silvia, J. (2012), “Innocent Bystanders? Monetary Policy and Inequality in the U.S”, NBER Working Papers 18170, National Bureau of Economic Research, Inc.
Coibion, O., Gorodnichenko, Y, Kudlyak, M. and Mondragon, J. (2014), “Does Greater Inequality Lead to More Household Borrowing? New Evidence from Household Data”, NBER Working Papers 19850, National Bureau of Economic Research, Inc.
Deininger, K., Squire, L. (1996), “A new data set measuring income inequality.” World Bank Economic Review 10, 565–591.
Demirguc-Kunt, A., Detragiache, E. and Gupta, P. (2006), “Inside the crisis: An empirical analysis of banking systems in distress”, Journal of International Money and Finance, Elsevier, Elsevier, vol. 25(5), pages 702-718, August.
De Nardi, M-C., French, E. and Benson, D. (2012), “Consumption and the Great Recession” Economic Perspectives, Federal Reserve Bank of Chicago, Federal Reserve Bank of Chicago, issue Q I, pages 1-16.
Diwan, I. (2001), “Debt as sweat: labor, financial crises, and the globalization of capital”, The World Bank, mimeo, July.
Duesenberry, L.SL. (1949), Income, Saving and the Theory of Consumer Behavior, Cambridge: Harvard University Press
Eichengreen, B. and Mitchener, K.J. (2003), “The Great Depression as a Credit Boom Gone Wrong”, Bank for International Settlements Working Paper 137.
Elsby, M.W.L., Hobijn, B. and Sahin, A. (2010), “The Labor Market in the Great Recession”, Brookings Papers on Economic Activity, Economic Studies Program, The Brookings Institution, vol. 41(1 (Spring), pages 1-69.
Enowbi Batuo, M., Guidi, F., Mlambo, K. (2010), “Financial Development and Income Inequality: Evidence from African Countries” MPRA Paper 25658, University Library of Munich,
Fisher, I. (1932), Booms and Depressions. New York: Adelphi. Fisher, I. (1933), “The Debt-Deflation Theory of Great Depressions”, Econometrica, pp.337-
57 Favara, G. and Imbs, J. (2014), “Credit Supply and the Price of Housing”, American
Economic Review, Forthcoming. Fitoussi, J-P., Saraceno, F. (2010), “How Deep is a Crisis? Policy Responses and Structural
Factors Behind Diverging Performances”, Journal of Globalization and Development, De Gruyter, vol. 1(1), pages 1-19, January.
Frank, R.H., Levine, A.S. and Dijk, O. (2014), “Expenditure Cascades”, Review of Behavioral Economics, now publishers, vol. 1(1-2), pages 55-73, January.
Frankel, J.A. and Rose, A.J. (1996) “Currency Crashes in Emerging Markets: Empirical Indicators”, NBER Working Papers 5437, National Bureau of Economic Research, Inc.

CEPII Working Paper ou Document de travail du CEPII Inequality, Leverage and Financial Crises
53
French, S., Leyshon, A. and Meek, S. (2013), “The changing geography of British bank and building society branches, 2003-2012”, Working Paper available at: http://www.nottingham.ac.uk/geography/news/areas-of-high-unemployment-bear-the-brunt-of-bank-closures-.aspx
Frydman, C. and Saks, R.E. (2010), “Executive Compensation: a new view from a long-term perspectives, 1936-2005”, Review of Financial Studies, 23(5), 2099-
Galbraith, J K. (1954), The Great Crash, 1929, Houghton Mifflin, New York. Galbraith, J.K. and Giovannoni, O.G. and Russo, A.J. (2007), “The Fed's Real Reaction
Function Monetary Policy, Inflation, Unemployment, Inequality - and Presidential Politics”, Levy Economics Institute Working Paper No. 511.
Galbraith, J.K. and L. Juaqung (1999), “Inequality and Financial Crises: Some Early Findings”, UTIP Working Paper N°9..
Goldstein, M., Kaminsky, G. and Reinhart, C. (2000), “Assessing financial vulnerability, an early warning system for emerging markets: Introduction”, MPRA Paper 13629, University Library of Munich, Germany.
Gornemann, N., Kuester, K. and Nakajima, M. (2014), “Doves for the Rich, Hawks for the Poor? Distributional Consequences of Monetary Policy”, mimeo.
Gourinchas, P.-O., Valdes, R. and Landerretche, O. (2001), “Lending Booms: Latin America and the World.” Economia: Journal of the Latin American and Caribbean Economic Association 1(2): 47–89.
Galor, O. and Zeira, J. (1993), “Income Distributions and Macroeconomics”, Review of Economic Studies, 60,35-52.
Galbraith, J.K., Kum, H. (2003), “Inequality and economic growth. A global view based on measures of pay”, CESifo Economic Studies 49, 527–556.
Gimet, C., Lagoarde-Segot, T. (2011), “A closer look at financial development and income distribution”, Journal of Banking & Finance 35(7), pages 1698-1713,
Greenwood, J. and Jovanovic, B. (1990), “Financial Development, Growth and the distribution of income”, Journal of Political Economy 98(5):1076-107.
Greenwood, R., Scharfstein, D. (2013), “The Growth of Finance”, Journal of Economic Perspectives, American Economic Association, vol. 27(2), pages 3-28, Spring.
Gupta, P., Mishra, D. & Sahay, R. (2007), “Behavior of output during currency crises”, Journal of International Economics, Elsevier, Elsevier, vol. 72(2), pages 428-450, July.
Hume, M. and Sentance, A. (2009), “The Global Credit Boom: Challenges for Macroeconomics and Policy”. Bank of England External MPC Unit Discussion Paper 27.
Hutchison, M. and McDill, K. (1999), “Are All Banking Crises Alike? The Japanese Experience in International Comparison”, Journal of the Japanese and International Economies, Elsevier, vol. 13(3), pages 155-180, September.
Hutchison, M. and Noy, I. (2002), “Output Costs of Currency and Balance of Payments Crises in Emerging Markets”, Comparative Economic Studies, Palgrave Macmillan, Palgrave Macmillan, vol. 44(2-3), pages 27-44, September.
Hutchison, M. and Noy, I. (2005), “How Bad Are Twins? Output Costs of Currency and Banking Crises”, Journal of Money, Credit and Banking, Blackwell Publishing, Blackwell Publishing, vol. 37(4), pages 725-52, August.

CEPII Working Paper ou Document de travail du CEPII Inequality, Leverage and Financial Crises
54
Hutchison, M. and Noy, I. (2006), “Sudden stops and the Mexican wave: Currency crises, capital flow reversals and output loss in emerging markets”, Journal of Development Economics, Elsevier, Elsevier, vol. 79(1), pages 225-248, February.
Iacoviello, M. (2008), “Household Debt and Income Inequality, 1963-2003”, Journal of Money, Credit and Banking, Blackwell Publishing, vol. 40(5), pages 929-965, 08.
Jauch, S. and Watzka, S. 2011. “Financial Development and Income Inequality: A Panel Data Approach”, CESifo Working Paper Series 3687, CESifo Group Munich.
Jenkins, S.P., Brandolini, A., Micklewright, J. and Nolan, B. (2013), The Great Recession and the Distribution of Household Income, Oxford : Oxford University Press.
Jordà, O., Schularick, M. and Taylor, A.M. (2011), “Financial Crises, Credit Booms, and External Imbalances: 140 Years of Lessons”, IMF Economic Review, vol. 59(2), pages 340-378
Jordà, O., Schularick, M. and Taylor, A.M. (2013a), "When Credit Bites Back," Journal of Money, Credit and Banking, vol. 45(s2), pages 3-28.
Jordà, O., Schularick, M. and Taylor, A.M. (2013b), "Sovereigns versus Banks: Credit, Crises, and Consequences," NBER Working Papers 19506, National Bureau of Economic Research, Inc.
Jordà, O., Schularick, M. and Taylor, A.M. (2014), "Betting the House", NBER Working Paper 20771, National Bureau of Economic Research, Inc.
Kalecki, M. (1954), Theory of Economic Dynamics: An Essay on Cyclical and Long-RunChanges in Capitalist Economy., George Allen, Unlisted.
Kaminsky, G.L. and Reinhart. C.M. (1999), “The Twin Crises: The Causes of Banking and Balance-of-Payments Problems”, American Economic Review 89(3): 473–500.
Kappel, V. (2010). “The Effects of Financial Development on Income Inequality and Poverty”, Working Paper 10-127, Center of Economic Research at ETH Zurich,
Karabarbounis, L. and Neiman, B. (2013), “The Global Decline of the Labor Share”, The Quarterly Journal of Economics, Oxford University Press, vol. 129(1), pages 61-103.
Kim, D-H. and Lin, S-C. (2011), “Non-linearity in the financial development and “income inequality nexus”, Journal of Comparative Economics 39(3), pages 310-325.
Kopczuk, W., Saez, E. and Song, J. (2010), “Earnings Inequality and Mobility in the United States: Evidence from Social Security Data since 1937”, The Quarterly Journal of Economics, MIT Press, vol. 125(1), pages 91-128, February.
Krueger, D. and Perri, F. (2006), “Does Income Inequality Lead to Consumption Inequality? Evidence and Theory”, Review of Economic Studies, vol. 73(1), pages 163-193.
Krueger, D. and Perri, F. (2011), “How does Household Consumption Respond to Income Shocks?”, mimeo. Available online: http://economics.sas.upenn.edu/~dkrueger/research/Shocks.pdf
Krugman, P. (2010), “Inequality and Crises”, New York Times blog "The Conscience of a liberal”, (June), http://krugman.blogs.nytimes.com/2010/06/28/inequality-and-crises/
Kumhof, M. and Ranciere, R. (2010), “Inequality, Leverage and Crises”, IMF Working Papers 10/268, International Monetary Fund.
Kumhof, M., Ranciere, R. and Winant, P. (2015), “Inequality, Leverage and Crises: The Case of Endogenous Default”, American Economic Review, forthcoming.
Kumhof, M., Lebarz, C., Ranciere, R., Richter, A.W, and Throckmorton, N.A. (2012), “Income Inequality and Current Account Imbalances”, IMF Working Papers 12/8, International Monetary Fund.

CEPII Working Paper ou Document de travail du CEPII Inequality, Leverage and Financial Crises
55
Law, S.H. and Tan, H.B. (2009), “The Role Of Financial Development On Income Inequality In Malaysia”, Journal of Economic Development 34(2), pages 153-168.
Law, S.H. and Tan, H.B. (2012), “Nonlinear dynamics of the finance-inequality nexus in developing countries”, Journal of Economic Inequality 10(4), pages 551-563,
Leigh, A. (2007), “How Closely Do Top Income Shares Track Other Measures of Inequality?”, Economic Journal, Royal Economic Society, vol. 117(524), pages F619-F633, November.
Leigh, A. and Posso, A. (2009), “Top Incomes And National Savings”, Review of Income and Wealth, International Association for Research in Income and Wealth, vol. 55(1), pages 57-74, 03.
Leung, R., Stampini, M., & Vencatachellum, D. (2009). Does human capital protect workers against exogenous shocks? South Africa in the 2008–2009 crisis. IZA Working Paper No. 4608.
Levine, R. (2005), “Finance and growth: theory and evidence”, in P. Aghion and S. Durlauf (eds.), Handbook of Economic Growth, Amsterdam: North-Holland, pp. 866-934.
Lewis, M. and Verhoeven, M. (2010), “Financial Crises and Social Spending : The Impact of the 2008-2009 Crisis”, World Bank Other Operational Studies 12965, The World Bank.
Lysandrou, P. (2011), “Global Inequality, Wealth Concentration and the Subprime Crisis: A Marxian Commodity Theory Analysis”, Development and Change, Vol. 42(1), pages 183–208.
Maarek, P. and Orgiazzi, E. (2013), “Currency Crises and the Labor Share”, Economica vol. 80 (319), pages 566-588.
Martin, P. and Phillippon, T. (2014), “Inspecting the Mechanism: Leverage and the Great Recession in the Eurozone”, National Bureau of Economic Research Working Paper #20572.
McKinnon, R. and Pill H. (1997) “Credible Economic Liberalizations and Overborrowing”, American Economic Review 87(2), 189–93.
Milesi-Ferretti, G.M. and Razin, A. (2000), “Current Account Reversals and Currency Crises: Empirical Regularities”, NBER Chapters, National Bureau of Economic Research, Inc,in: Currency Crises, pages 285-323. National Bureau of Economic Research, Inc.
Mendoza, E.G. and Terrones, M.E. (2008), “An Anatomy Of Credit Booms: Evidence From Macro Aggregates And Micro Data”, NBER Working Papers 14049.
Meyer, B.D., and Sullivan, J.X. (2013), “Consumption and Income Inequality and the Great Recession”, American Economic Review, 103(3): 178-83.
Mian, A. and Sufi, A. (2010), “Household Leverage and the Recession of 2007–09”. IMF Economic Review 58(1): 74–117.
Mian, A. and Sufi, A. (2014), House of Debt. Chicago: University of Chicago Press. Milasi, S. (2012), “Top Income Shares and Budget Deficits”, CEIS Research Paper 249, Tor
Vergata University, CEIS, revised 08 Aug 2013. Minsky, H.P. (1977), “The Financial Instability Hypothesis: An Interpretation of Keynes and
an Alternative to ‘Standard’ Theory”. Nebraska Journal of Economics and Business 16(1): 5–16.
Moffitt, R.A. and Gottschalk, P. (2002), “Trends in the Transitory Variance of Earnings in the United States”, Economic Journal, Royal Economic Society, vol. 112(478), pages C68-C73, March.

CEPII Working Paper ou Document de travail du CEPII Inequality, Leverage and Financial Crises
56
Moffitt, R.A. and Gottschalk, P. (2011). “Trends in the Transitory Variance of Male Earnings in the U.S., 1970-2004”, NBER Working Papers 16833, National Bureau of Economic Research, Inc.
Mookerjee, R. and Kalipioni, P. (2010), “Availability of financial services and income inequality: The evidence from many countries”, Emerging Markets Review 11(4), pages 404-408.
Ortiz, I. and Cummins, M. (2011), “Global Inequality: Beyond the Bottom Billion € A Rapid Review of Income Distribution in 141 Countries”, Working papers, UNICEF, Division of Policy and Strategy 1102.
Giles, J., Park, A., Fang, C., & Du, Y. (2012), “Weathering a storm: Surveybased perspectives on employment in China in the aftermath of the financial crisis”. World Bank Policy Research Paper 5984.
Perugini, C., Hölscher, J. and Collie, S. (2013), “Inequality, Credit Expansion and Financial Crises”, MPRA Paper No. 51336.
Pesaran, M.H., Shin, Y. and Smith, R. (2001), “Bound Testing Approaches to the Analysis of Level Relationships”, Journal of Applied Econometrics, 16, 289-326.
Piketty, T. (1997), “The dynamics of wealth distribution and the interest rate with credit rationing”, Review of Economic Studies 64, 173–189.
Piketty, T. (2003), “Income Inequality in France, 1901-1998”, Journal of Political Economy, vol. 111, n°5, 2003, pp. 1004-1042.
Piketty, T. (2014), “Capital in the 21st Century”, Cambridge: Harvard University Press. Piketty, T. and Saez, E. (2003), “Income Inequality in the United States, 1913-1998”,
Quarterly Journal of Economics, vol. 118, no. 1, 1-39. Piketty, T. and Saez, E. (2006), “The evolution of top incomes: a historical and international
perspectives”, American economic review, vol.96, no 2, 2006, p. 200-205. Piketty, T. and Saez, E. (2013), “Top Incomes and the Great Recession: Recent Evolutions
and Policy Implications”, IMF Economic Review, Palgrave Macmillan, vol. 61(3), pages 456-478, August.
Rajan, R.G. (2010), Fault lines: How hidden fractures still threaten the world economy, Princeton University Press, Princeton.
Reinhart, C.M., and Rogoff. K.S. (2009), This Time Is Different: Eight Centuries of Financial Folly. Princeton, NJ: Princeton University Press.
Reinhart, C.M., and Rogoff. K.S. (2009b), “The Aftermath of Financial Crises”, American Economic Review, American Economic Association, American Economic Association, vol. 99(2), pages 466-72, May.
Reinhart, C.M., and Rogoff. K.S. (2010), “Growth in a Time of Debt”, American Economic Review, vol. 100(2), pages 573-78.
Reinhart, C.M., and Rogoff. K.S. (2014), “Recovery from Financial Crises: Evidence from 100 Episodes”, American Economic Review, 104(5): 50-55.
Romer, C.D. and Romer, D.H. (1998), “Monetary Policy and the Well-Being of the Poor”, in Income Inequality: Issues and Policy Options (Federal Reserve Bank of Kansas City), 159-201.
Sabelhaus, J. and Song, J. (2009), “Earnings Volatility Across Groups and Time”, National Tax Journal, National Tax Association, vol. 62(2), pages 347-64.

CEPII Working Paper ou Document de travail du CEPII Inequality, Leverage and Financial Crises
57
Schmidt-Hebbel, K. and Serven, L. (2000), “Does income inequality raise aggregate saving?”, Journal of Development Economics, Elsevier, vol. 61(2), pages 417-446, April.
Schularick, M. and Taylor, A.M. (2012), "Credit Booms Gone Bust: Monetary Policy, Leverage Cycles, and Financial Crises, 1870-2008," American Economic Review, American Economic Association, vol. 102(2), pages 1029-61, April.
Shleifer, A. & Vishny, R.W. (2010), “Unstable banking”, Journal of Financial Economics, Elsevier, vol. 97(3), pages 306-318, September.
Solt, F. (2009), “Standardizing the World Income Inequality Database”. Social Science Quarterly 90(2), 231–242.
Stiglitz, J. (2009), “Joseph Stiglitz and Why Inequality is at the Root of the Recession”, Next Left website. January 9 2009.
Tridico, P. (2012), “Financial crisis and global imbalances: its labor market origins and the aftermath”, Cambridge Journal of Economics, Oxford University Press, vol. 36(1), pages 17-42.
van Treeck, T. (2014), “Did Inequality cause the U.S. Financial Crisis?”, Journal of Economic Surveys, vol. 28(3), pages 421-448.
Woo, Bova, Kinda and Zhang (2013), “Distributional Effects of Fiscal Consolidation and the Role of Fiscal Policy: What Do the Data Say?” IMF Working Paper 13/195 (Washington: International Monetary Fund, September).

CEPII Working Paper ou Document de travail du CEPII Inequality, Leverage and Financial Crises
58
Appendix A: State of the Art
Table A1: The impact of Inequality on debt, financial crises and current account
Paper Years Number
of Countries
DC EC LIC Dependent Variable
Inequality Measure Database Result Remarks Impact
Ineq.
Empirical
Bordo & Meissner
(2012) 1920-2008 14 x
Real Bank Loans to
Private sector (in log)
Top 1 Percent WTID Not significant
yearly data or 5 years time span - Do
not deal about endogeneity
Not significant
Atkinson & Morelli 1911-2010
37 systemic banking crises
x x Banking Crisis
Gini, Top 1, bottom 60 AM2012
Inequality increases in 10 cases out of 25
Event method (no econometrics)
Positive (10/25)
Belletini & Delbono (2013)
1980-2010 OECD countries x Banking
Crisis
Gini (Before and After
tax)
AM2012, OECD2011,
WIID
High level of inequalities in 9 banking crises
out of 14
Event method. Focus on the level of inequality (and not
evolutions)
Positive (9/14)
Perugini et al. (2013) 1970-2007 18 x Credit ( %
GDP) Top 1
Percent WTID Positive impact on credit
IV: Internal & external (Labor & Product Market
Regulation, Rule of Law, Trade Openness).
Financial deregulation has a positive impact on
credit. But no effect of the interaction
term.
Positive

CEPII Working Paper ou Document de travail du CEPII Inequality, Leverage and Financial Crises
59
Christen & Morgan (2005)
1980-2003 1 (The US) x
Total Household
Debt Gini CPS Positive impact
on debt Credit demand
rather than supply Positive
Coibion et al. (2014) 2000s 1 (The
US) x household
debt accumulation
Ranking in the local (county) income
distribution / Ratio 90/10
local distribution
SCF
1. Debt accumulation
over the course of the early to
mid-2000s was, on average,
greater for lower income
households. 2. Households
living in the more unequal areas within a county accumulated less debt over
the early to mid-2000s
than did those in lower inequality
areas in the same county.
Second result is supposed to
invalidate "Keeping up with the Joneses
Hypothesis"
Mixed
Aizenman & Jinjarak (2012)
2007-2011 50 x x
Tax base, Fiscal space,
sovereign spread
Gini WDI
One point Gini coefficient: lower
tax base 2 % and higher sovereign
spread of 45 basis points
Positive
Milasi (2012) 1974-2005 17 x Public Deficit 1 % income share WTID Positive impact
on public deficit Positive
Berhinger & van Treeck
(2013) 1982-2007 20 x
Net current account balance
Top income share / Gini / Labor share
WTID, WDI, SWIID
Top income share / Gini:
Negative impact on CA
Declining labor share: Positive
Positive (labor
share) and Negative
(top income

CEPII Working Paper ou Document de travail du CEPII Inequality, Leverage and Financial Crises
60
impact on CA share and Gini)
Kumhof et al. (2012) 1960-2006 18 x
Net current account balance
Top income share WTID
Short-term: Negative
correlation of -0.1 with the top
5 % income share / -0.3 with
the top 1 % income share. Medium-term:
Negative correlation of -
0.25 with the top 5 % income
share / -0.6 with the top 1 %
income share.
Different access to capital markets may
explain heterogeneous
impact of rising top income share
between developed and
developing/emerging countries (China)
Negative
Theoretical
Iacoviello (2008) 1963-2003 1 (The
US) x Household Debt
Income Variance
Positive. Simulations of the model can replicate the dynamics of
inequalities and debt in the US.
Theoretical model where the increased
level of income volatility (temporary income shock) leads
to an increase of household debt.
Positive

CEPII Working Paper ou Document de travail du CEPII Inequality, Leverage and Financial Crises
61
Kumhof & Rancière (2010),
Kumhof et al. (2015)
1983 – 2030
(scenario)
1 (the US) x
Household Debt and financial
crisis
Top 5 percent income share
Bottom earners' debt-to-income ratio increases from 62.3% in
1983 to 143.2% in 2008,
accompanied by an increase in
crisis probability from initially
around 1.5% in any given year, to 4.9% in 2008.
DSGE model. Top earners have a preference for
wealth and benefit from a permanent positive income
shock [increase in the top 5% income
share from 21.8% in 1983 to 33.8% in
2008]
Positive
Azzimonti et al. (2014) 1973-2005 22 x Public Debt
Income Inequality
increases public debt
Public debt : uninsurable income
risk Positive
Belabed et al. (2013) 1990-2007 3 x x Current
Account
US: rise of income
inequality and Negative impact
on the CA. China &
Germany : Fall of the labor share and
Positive impact on the CA.
Stock-flow model.
Positive (labor
share) and Negative
(top income
share and Gini)
Kumhof et al. (2012) NA NA Current
Account Rise Top Income Share: fall of CA DSGE model. Negative
Al-Hussami & Martin
Remesal (2012)
1970-2007 22 X X Current Account Rise Top Income
Share: fall of CA
Simple model of CA with heterogeneous
agents Negative
DC: Developed countries EC: Emerging countries LIC: Low-Income countries Inequality Dataset:

CEPII Working Paper ou Document de travail du CEPII Inequality, Leverage and Financial Crises
62
DS96: Deininger & Squire (1996) WIID: UN-WIDER World Income Inequality Database SWIID: Standardized World Income Inequality Database EHII-UTIP: Estimated Household Inequality (Galbraith & Kum 2003), University of Texas Inequality Project HCES: Household consumption expenditure survey ID: Income Data (national level) CPS: Current Population Survey (US) SCF: Survey of Consumer Finances (US) WTID: World Top Income Database AM2012: Atkinson & Morelli (2012) OECD2011: OECD (2011, Overview, Fig. 2) WDI: World Development Indicators (World Bank)

CEPII Working Paper ou Document de travail du CEPII Inequality, Leverage and Financial Crises
63
Table A2: From leverage to financial crises
Paper Years Number
of Countries
DC EC LIC Dependent Variable Leverage Measure Result Remarks
Impact Financial
crisis
Bordo & Meissner (2012) 1920-2008 14 x
Prob (banking crisis), ie, binary indicator equal to 1 when a banking crisis
occurred.
Real bank loans
Positive impact : probability of a banking crisis
increases by 5% when real bank
loans increase by 10%
Panel data analysis, both with
linear and non-linear estimators
Positive
Perugini, Holscher and Collie (2013)
1970-2007 18 x
Prob (banking crisis), ie, binary indicator equal to 1 when a banking crisis
occurred.
Domestic credit to the
private sector / GDP
Positive impact : probability of a banking crisis
increases by 3.5-4.5% when
private credit/GDP
increases by 10%
Standard panel data analysis Positive
Schularick and Taylor (2012) 1870-2008 14 x
Prob (financial crisis), ie, binary indicator equal to 1 when a financial crisis
occurred.
Real bank loans
Positive impact : probability of a banking crisis
increases by 3-4% when real
bank loans increase by 10%
Panel data analysis, both with
linear and non-linear estimators;
various robustness
checks, notably for omitted
variable bias.
Positive
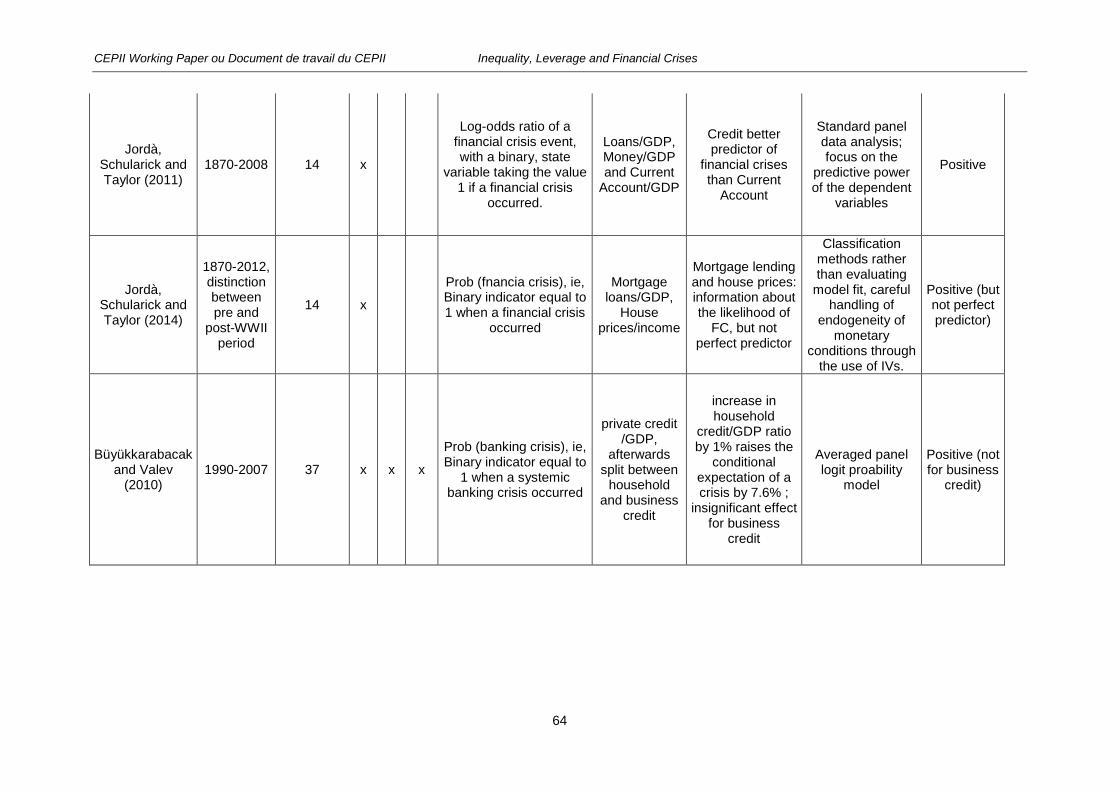
CEPII Working Paper ou Document de travail du CEPII Inequality, Leverage and Financial Crises
64
Jordà, Schularick and Taylor (2011)
1870-2008 14 x
Log-odds ratio of a financial crisis event, with a binary, state
variable taking the value 1 if a financial crisis
occurred.
Loans/GDP, Money/GDP and Current
Account/GDP
Credit better predictor of
financial crises than Current
Account
Standard panel data analysis; focus on the
predictive power of the dependent
variables
Positive
Jordà, Schularick and Taylor (2014)
1870-2012, distinction between pre and
post-WWII period
14 x
Prob (fnancia crisis), ie, Binary indicator equal to 1 when a financial crisis
occurred
Mortgage loans/GDP,
House prices/income
Mortgage lending and house prices: information about the likelihood of
FC, but not perfect predictor
Classification methods rather than evaluating
model fit, careful handling of
endogeneity of monetary
conditions through the use of IVs.
Positive (but not perfect predictor)
Büyükkarabacak and Valev
(2010) 1990-2007 37 x x x
Prob (banking crisis), ie, Binary indicator equal to
1 when a systemic banking crisis occurred
private credit /GDP,
afterwards split between
household and business
credit
increase in household
credit/GDP ratio by 1% raises the
conditional expectation of a crisis by 7.6% ;
insignificant effect for business
credit
Averaged panel logit proability
model
Positive (not for business
credit)

CEPII Working Paper ou Document de travail du CEPII Inequality, Leverage and Financial Crises
65
Mian and Sufi (2009) 2002-2009
1 (= top 450 US counties by pop.)
x
Indicators of economic outcomes (mortgage default rates, house
price growth, auto sales, new housing building
permits, and unemployment)
Various indicators of
leverage, with a focus on household leverage (housing credit and short-term finance)
household leverage early and powerful
statistical predictor of
cross-sectional county-level variation in household
default, house price,
unemployment, residential
investment, and durable
consumption from 2007 to 2009.
Standard cross-section
regressions with IV for tackling
endogentiy issues in Leverage.
Positive
Mendoza and Terrones (2008) 1960-2006 48 x x x
Banking/currency crises or sudden stops,
defined on Appendix 2
Credit to the private
sector/GDP + firm-level measures
Credit booms are more likely to end
in a financial crisis in emerging countries (55%,
vs 15 % in developed countries)
Innovative features to identify
credit booms, event study methods, frequency analyses
Positive (especially
in EC)
Kaminsky and Reinhart (1999) 1970-1995
20 (+4 "out of
sample") x x
Descriptive/classification approach, focused on Probabilities of crisis occurrence and key indicators (monetary aggregates, private
credit…)
Banking and currency crises
are closely linked in the aftermath
of financial liberalization, with credit boom and bust dynamics at
the root.
Huge majority of emerging
countries in the sample: 15 vs 5
developed.
Positive

CEPII Working Paper ou Document de travail du CEPII Inequality, Leverage and Financial Crises
66
Gourinchas, Valdes and
Landerretche (2001)
1960-1996 91 x x x
Descriptive approach focusing on the
identification of credit booms and some
stylized facts surrounding them.
Lending booms are not
associated with a significant increase in
banking and balance of payment
vulnerability.
Focus on Latin America, where
lending booms are often followed by
a banking and/or a currency crisis.
No effect
Theoretical Papers
Martin et Philippon (2014) 2000-2012 11 EA
countries x
Structural model accounting for domestic credit, fiscal policy, and
current account dynamics.
Private leverage boom: main
factor of crisis (esp. In Spain and Ireland).
Calibration of a full theoretical model
of open economies within a monetary union + counterfactual experiments with U.S. states as a
control group that did not suffer
from a sudden stop.
Positive

CEPII Working Paper ou Document de travail du CEPII Inequality, Leverage and Financial Crises
67
McKinnon and Pill (1997) Various
5 emerging,
1 developed
x x
Theoretical model enlightening the
circumstances under which financial
liberalization may lead to a fall of private
saving, overborrowing and boom and bust
dynamics.
A decline in private saving
may result partly from a false
euphoria regarding the
eventual payoffs from the credible real-side reforms. Banks lend overly
aggressively, which in turn
sends a falsely optimistic signal to nonbank firms and households
regarding the macroeconomic outcome of the reform process.
Pure theoretical approach.
Experiences of some countries, mostly emerging,
are used in an illustrative way: Chile, Mexico,
Indonesia, Malaysia,
Thailand… the UK is the only
developed country mentioned.
Positive
DC: Developed countries EC: Emerging countries LIC: Low-Income countries

CEPII Working Paper ou Document de travail du CEPII Inequality, Leverage and Financial Crises
68
Table A3. The impact of financial development in “normal times” on inequality
Paper Years Number
of Countries
DC EC LIC Dependent Variable FD measure Inequality
dataset Result Remarks impact of finance on inequality
Beck, Demirgüç-Kunt and Levine (2007)
1960-2005 and 1980-
2005
70 in average x x x
(i) Growth of the Gini
coefficient, (ii) growth of the income share of the
lowest quintile
(iii) growth of the
percentage age of the population
living on less than $ 1 (and $ 2)
dollars per day.
Private Credit/GDP
DS96, WIID
Income growth poorest
quintile: 40% explained by the inequality impact of FD, 60% by the
growth impact of FD.
GMM dynamic panel estimator
over 5-year periods.
negative
Clarke, Xu and Zou (2006)
1960-1995 83 x x x Log Gini coefficient
Private Credit/GDP, bank
assets/GDP DS96
A 1% increase in private credit decreases the Gini coefficient
by 0.3%.
IV identifying the origin of the country's legal
system
negative
Kapell (2010) 1960-2006 78 x x x Gini
coefficient
Private Credit/GDP, stock
market capitalization/GDP
WIID
A 1% increase in FD
decreases the Gini coefficient by 0.2 to 0.3%.
IV identifying the origin of the country's legal
system + geographical
latitude
negative

CEPII Working Paper ou Document de travail du CEPII Inequality, Leverage and Financial Crises
69
Enowbi Batuo,
Guidi and Mlambo (2010)
1990-2004 22 x x Gini coefficient
liquid liabilities/GDP,
M2/GDP, Private Credit/GDP
WIID
A 1% increase in FD
decreases the Gini coefficient
by 0.02 to 0.05%.
GMM dynamic panel estimator.
negative (but quantitatively
small)
Mookerjee and
Kalipioni (2010)
2000-2005 65 x x x Gini coefficient
number of bank branches per
100,000 populations
WIID
an increase in the number of
banks branches per 100,000 hab decreases inequality
IV (legal origin, initial
endowment), Cross-sectional
estimates (variables are averaged over
the period 2000-2005)
negative (but quantitatively
hard to interpret)
Law and Tan (2009)
1980Q1-2000Q4 1 x Log Gini
coefficient
Private Credit/GDP, stock
market capitalization/GDP
EHII-UTIP
No impact of financial
development on inequality
Pure time-series strategy (bound tests) focused on Malaysia
not significant
Arora (2012) 1999-2007 1 x State Gini
coefficient
Private credit/State
Domestic Product (SDP), personal
loans/SDP, population per bank branch
HCES
FD decreases inequality only in the urban
areas
Analysis based subnational
data for India Mixed evidence

CEPII Working Paper ou Document de travail du CEPII Inequality, Leverage and Financial Crises
70
Kim and Lin (2011) 1960-2005 65 x x x
Annual growth rate of the Gini coefficient
Private Credit/GDP,
Liquid Liabilities/GDP,
Bank Assets/GDP
DS96, WIID
a 1% increase in FD = rise in inequality by
0.20–0.29% in the regime with less-developed
financial intermediation,
but a fall in inequality by
0.70–1.23% in the regime with
better-developed financial
intermediation
Cross-sectional IV threshold
regression; IV = initial values of
financial development and creditor
rights + religious
composition, ethnic
fractionalization, legal origins
Non-linear effect of financial
development on inequality
Law and Tan (2012) 1980-2000 35 x x Log Gini
coefficient
Private Credit/GDP,
Liquid Liabilities/GDP
EHII-UTIP, SWIID
- With UTIP: linear, negative impact of FD
on inequality; - with SWIID:
1% increase in FD decrease inequality by -0,002-0,003,
before increasing it by
0-0,0006.
GMM dynamic panel data estimator
Non-linear effect of financial
development on inequality, but
opposite to Kim and Lin (2011)'s one. However, very dependent on the DB and quantitatively
negligible.
Jauch and Watzka (2011)
1960-2008 138 x x x
Log Gini coefficient of
gross and net income
Private Credit/GDP, Bank
deposits/GDP SWIID
An increase in FD by 1% leads to an
increase in the Gini coefficient by 0.023% for
the within estimation
Panel OLS, 2SLS, GMM
estimates. IV = legal origin,
lagged explanatory
variables, GDP per capita.
Positive (but quantitatively
small) impact of financial
development on inequality.

CEPII Working Paper ou Document de travail du CEPII Inequality, Leverage and Financial Crises
71
Ang (2010) 1951-2004 1 (India) x Log Gini
coefficient
- FD: private credit/GDP, (M3-
M1)/GDP etc. - FL: synthetic
variable based on nine indicators of
financial repressionist
policies.
ID
An increase in FD by 1% decreases
inequality by -0.3 to -0.04%; An increase in
FL by 1% raises
inequality by 0.02 to 0.07%.
Time-series analysis with an Error Correction
Model
Negative impact of FD on
inequality, positive (but
quantitatively) impact of FL on
inequality.
Beck, Levine and
Levkov (2010)
1976-2006
1 (USA, State level analysis: 48 states
+ DC)
x
Ln/logistic Gini
coefficient, Theil index, difference between 90th and
10th decile.
FL = suppression of restrictions on
restrictions on intrastate branching
CPS
Deregulation induced a
reduction in inequality
between 3 and 7% (10% when considering the
90/10 ratio).
Difference-in-differences
specification
FL reduced inequality by by
disproportionately raising incomes in the lower half of the income distribution.
Gimet and Lagoarde-
Segot (2011)
1994–2002 19 x x x
VAR model = all
variables endogenous.
EHII = combination of GINI coef
and Theil index
indicators of size and efficiency of
both banking sector and capital market, proxies of
financial integration and
transaction costs,
EHII-UTIP
Increased banking credit
and credit market
imperfections tend to raise inequalities, while bigger and more
efficient capital markets tend
to reduce inequalities.
Bayesian panel Structural VAR
model,
Impact of FD/FL depends crucially on characteristics
(transparency and ability to
allocate resources
optimally) of the financial sector,
more than its size.
DC: Developed countries EC: Emerging countries LIC: Low-Income countries Inequality Dataset:

CEPII Working Paper ou Document de travail du CEPII Inequality, Leverage and Financial Crises
72
DS96: Deininger & Squire (1996) WIID: UN-WIDER World Income Inequality Database SWIID: Standardized World Income Inequality Database EHII-UTIP: Estimated Household Inequality (Galbraith & Kum 2003), University of Texas Inequality Project HCES: Household consumption expenditure survey ID: Income Data (national level) CPS: Current Population Survey (US)

CEPII Working Paper ou Document de travail du CEPII Inequality, Leverage and Financial Crises
73
Table A4. The impact of financial crises on inequality
Paper Years Number
of Countries
DC EC LIC Dependent variable
Inequality Dataset
Crisis Measure Result Remarks Impact on
Inequality
Baldacci et al. 2012 ? 65 x x x
Gini, Income by quintile,
poverty headcount
DS96 Currency crises
Positive impact on poverty headcount
& Gini. The second lowest
income quintile are the most affected.
No Impact on formal
unemployment. Fiscal
retrenchment has a negative
impact on inequality.
Positive
Baldacci et al. 2012 1992-1996
1 (Mexican
case) x
Poverty, Income by
level HCES Mexican
crisis
Increase in poverty and poverty gap but significant reduction on
inequality
Possible influence of confounding
factors neglected (NAFTA)
Negative
Galbraith & Jiaquing (1999)
1970-1995 19 x x x EHII-UTIP Currency crises
Mean increase in inequality in the two-year period after a crisis :
+16,2 %
Possible influence of confounding
factors neglected
Positive
Morelli (2014) 1 (US) Top Income Share WTID
Systemic Banking Crises
Negative at the very top / Positive at the bottom of
the decile / neutral for the entire
decile
Mixed
Diwan (2001) 1975-1995 133 x x x Labor Share UN-NA Currency crises
Positive (fall of labor share)
Maarek & Orgiazzi (2013)
1963-2003 20 x Labor Share UNIDO data Currency crises
Fall of the labor share by 2
percentage points
Positive (fall of labor share)

CEPII Working Paper ou Document de travail du CEPII Inequality, Leverage and Financial Crises
74
Bazillier & Najman (2012) 1970-2002 70 x x x Labor Share UN-NA, ANA
Currency and
Banking Crises
Positive (fall of labor
share) for CA crises. Mixed for banking
crises
Jenkins et al. (2013) 2007-2009 21 x
Gross household disposable
income
EU-SILC
Financial Crisis 2007-2008
Lack of effect explained by
social spending.
No effect
Meyer & Sullivan (2013) 2000-2011 1 (US) x 90/10 ratio CPS, CE
Financial Crisis 2007-2008
Rise of income inequalities and
decrease of consumption inequalities
Positive (income
inequality) - Negative
(consumption inequality)
Cho & Newhouse
(2013) 2007-2011 17 x
Income by category of
workers LFS, HCES
Financial Crisis 2007-2008
Female workers and low-skilled are
not the most affected. Better
educated workers more affected.
Negative
Leung et al. (2009) 2007-2011 1 (South
Africa) x Income by category of
workers LFS, HCES
Financial Crisis 2007-2008
Low-skilled workers are the most affected
Positive
Park et al. (2012) 2007-2011 1 (China) x
Income by category of
workers LFS, HCED
Financial Crisis 2007-2008
Low-skilled workers are the most affected
Positive
Elsby et al. (2010) 2007-2011 1 (US) x
Income by category of
workers CPS
Financial Crisis 2007-2008
Low-skilled workers are the most affected
Positive
Hoynes et al. (2012) 2007-2011 1 (US) x
Income by category of
workers CPS
Financial Crisis 2007-2008
Low-skilled workers are the most affected
Positive

CEPII Working Paper ou Document de travail du CEPII Inequality, Leverage and Financial Crises
75
DC: Developed countries EC: Emerging countries LIC: Low-Income countries Inequality Dataset: DS96: Deininger & Squire (1996) WIID: UN-WIDER World Income Inequality Database SWIID: Standardized World Income Inequality Database EHII-UTIP: Estimated Household Inequality (Galbraith & Kum 2003), University of Texas Inequality Project HCES: Household consumption expenditure survey ID: Income Data (national level) CPS: Current Population Survey (US) SCF: Survey of Consumer Finances (US) CE: Consumer Expenditure Interview Survey (US) WTID: World Top Income Database AM2012: Atkinson & Morelli (2012) OECD2011: OECD (2011, Overview, Fig. 2) WDI: World Development Indicators (World Bank) EU-SILC: European Union Statistics on Income and Living Conditions UN-NA: UN's National Accounts Table on use of GDP ANA: ANA database (OECD), Sylvain (2008) LFS: Labor Force Surveys