The chloride-induced corrosion of a fly ash concrete with ...
18
The chloride-induced corrosion of a fly ash concrete with nanoparticles and corrosion inhibitor Manu Harilal a , Deepak K. Kamde b , Sudha Uthaman b , R.P. George a,⇑ , Radhakrishna G. Pillai b , John Philip a , Shaju.K. Albert a a Corrosion Science and Technology Division, MCG, Metallurgy and Materials Group, Indira Gandhi Centre for Atomic Research, HBNI, Kalpakkam, Tamil Nadu 603102, India b Department of Civil Engineering, Indian Institute of Technology Madras, Chennai 600 036, India highlights Corrosion resistance of steel rebar in a ternary concrete (CFNI) is investigated. Chloride resistance and corrosion inhibition of CFNI is studied. Apparent diffusion coefficient was found to be one order less in CFNI concrete. Significantly lower chloride ingress rate is seen in CFNI concrete. CFNI concrete is a promising concrete mix for improving service life. article info Article history: Received 11 September 2020 Received in revised form 27 November 2020 Accepted 17 December 2020 Available online 29 December 2020 Keywords: Fly ash concrete Reinforcement Nanoparticles Corrosion inhibitor Service life abstract The urge to reduce the carbon footprints from cement production warrants the development of more sus- tainable approaches in the construction industry. Towards this, the long term corrosion resistance of the embedded steel rebar in a novel ternary-blended reinforced concrete system with 56 wt% Ordinary Portland cement (OPC), 40 wt% fly ash, 2 wt% nanomodifiers, and 2 wt% corrosion inhibitor (referred to as CFNI) was studied by chemical and electrochemical tests in a simulated chloride environment for 180 days. The performance was compared with three other concrete systems (CC (100% OPC), CF (60 wt% OPC and 40 wt% fly ash) and CFN (58 wt% OPC, 40 wt% fly ash and 2 wt% nanomodifiers). The electrochemical results indicated a significant enhancement in the corrosion resistance of steel in the CFNI concrete as compared to other systems. A five times higher value of polarization resistance (R p ) is obtained in CFNI, as compared to the control concrete, indicate the better resistance of CFNI. Further, in CFNI specimen, the chloride ingress rate was significantly lower and the Field Emission Scanning Electron Microscopy (FESEM) images showed no microcracks or pores at the corroded concrete-steel interface of CFNI specimens. The apparent diffusion coefficient (D cl ) of the concrete system was deter- mined using the bulk diffusion test and chloride profiling. The value of D cl for CFNI concrete was found to be one order less in magnitude than other concrete specimens, indicating the enhanced resistance against chloride attack. These results show that CFNI concrete is a promising ternary-blended concrete mix to achieve long corrosion-free service life for the structures in aggressive chloride environments. Ó 2020 Elsevier Ltd. All rights reserved. 1. Introduction The continuously increasing boom in urbanization and infras- tructure development increases the demand for cement [1]. The production of Ordinary Portland Cement (OPC) results in carbon emission which is reported to be 7% of the global carbon emission [2]. This may have significant adverse effects on the global environ- ment and the sustainability of concrete construction [3]. One of the techniques to facilitate sustainable concrete construction is to par- tially replace cement by using minerals like silica fume, fly ash, and ground granulated blast furnace slag which are called supplemen- tary cementitious materials (SCMs) [4-6]. Despite the significant advancements in the field of construction materials (i.e., use of var- ious chemical admixtures and SCMs, low water-binder ratio, etc.), many concrete structures continue to suffer from inadequate corrosion-free service life, especially when located in marine and coastal regions with severe chloride conditions [7]. This leads to many infrastructures warranting repair within ten years of service https://doi.org/10.1016/j.conbuildmat.2020.122097 0950-0618/Ó 2020 Elsevier Ltd. All rights reserved. ⇑ Corresponding author. Construction and Building Materials 274 (2021) 122097 Contents lists available at ScienceDirect Construction and Building Materials journal homepage: www.elsevier.com/locate/conbuildmat
Transcript of The chloride-induced corrosion of a fly ash concrete with ...

Construction and Building Materials 274 (2021) 122097
Contents lists available at ScienceDirect
Construction and Building Materials
journal homepage: www.elsevier .com/locate /conbui ldmat
The chloride-induced corrosion of a fly ash concrete with nanoparticlesand corrosion inhibitor
https://doi.org/10.1016/j.conbuildmat.2020.1220970950-0618/� 2020 Elsevier Ltd. All rights reserved.
⇑ Corresponding author.
Manu Harilal a, Deepak K. Kamde b, Sudha Uthaman b, R.P. George a,⇑, Radhakrishna G. Pillai b, John Philip a,Shaju.K. Albert a
aCorrosion Science and Technology Division, MCG, Metallurgy and Materials Group, Indira Gandhi Centre for Atomic Research, HBNI, Kalpakkam, Tamil Nadu 603102, IndiabDepartment of Civil Engineering, Indian Institute of Technology Madras, Chennai 600 036, India
h i g h l i g h t s
� Corrosion resistance of steel rebar in a ternary concrete (CFNI) is investigated.� Chloride resistance and corrosion inhibition of CFNI is studied.� Apparent diffusion coefficient was found to be one order less in CFNI concrete.� Significantly lower chloride ingress rate is seen in CFNI concrete.� CFNI concrete is a promising concrete mix for improving service life.
a r t i c l e i n f o
Article history:Received 11 September 2020Received in revised form 27 November 2020Accepted 17 December 2020Available online 29 December 2020
Keywords:Fly ash concreteReinforcementNanoparticlesCorrosion inhibitorService life
a b s t r a c t
The urge to reduce the carbon footprints from cement production warrants the development of more sus-tainable approaches in the construction industry. Towards this, the long term corrosion resistance of theembedded steel rebar in a novel ternary-blended reinforced concrete system with 56 wt% OrdinaryPortland cement (OPC), 40 wt% fly ash, 2 wt% nanomodifiers, and 2 wt% corrosion inhibitor (referredto as CFNI) was studied by chemical and electrochemical tests in a simulated chloride environment for180 days. The performance was compared with three other concrete systems (CC (100% OPC), CF(60 wt% OPC and 40 wt% fly ash) and CFN (58 wt% OPC, 40 wt% fly ash and 2 wt% nanomodifiers). Theelectrochemical results indicated a significant enhancement in the corrosion resistance of steel in theCFNI concrete as compared to other systems. A five times higher value of polarization resistance (Rp) isobtained in CFNI, as compared to the control concrete, indicate the better resistance of CFNI. Further,in CFNI specimen, the chloride ingress rate was significantly lower and the Field Emission ScanningElectron Microscopy (FESEM) images showed no microcracks or pores at the corroded concrete-steelinterface of CFNI specimens. The apparent diffusion coefficient (Dcl) of the concrete system was deter-mined using the bulk diffusion test and chloride profiling. The value of Dcl for CFNI concrete was foundto be one order less in magnitude than other concrete specimens, indicating the enhanced resistanceagainst chloride attack. These results show that CFNI concrete is a promising ternary-blended concretemix to achieve long corrosion-free service life for the structures in aggressive chloride environments.
� 2020 Elsevier Ltd. All rights reserved.
1. Introduction
The continuously increasing boom in urbanization and infras-tructure development increases the demand for cement [1]. Theproduction of Ordinary Portland Cement (OPC) results in carbonemission which is reported to be 7% of the global carbon emission[2]. This may have significant adverse effects on the global environ-ment and the sustainability of concrete construction [3]. One of the
techniques to facilitate sustainable concrete construction is to par-tially replace cement by using minerals like silica fume, fly ash, andground granulated blast furnace slag which are called supplemen-tary cementitious materials (SCMs) [4-6]. Despite the significantadvancements in the field of construction materials (i.e., use of var-ious chemical admixtures and SCMs, low water-binder ratio, etc.),many concrete structures continue to suffer from inadequatecorrosion-free service life, especially when located in marine andcoastal regions with severe chloride conditions [7]. This leads tomany infrastructures warranting repair within ten years of service
M. Harilal, D.K. Kamde, S. Uthaman et al. Construction and Building Materials 274 (2021) 122097
life due to corrosion of reinforcement [8]. This deterioration ismore pronounced in chloride environments [9,10]. The prematuredeterioration of structures can result in a large number of repair ofRC structures and repetitive repairs [11]. Therefore, there is a needto develop quality concretes with adequate resistance to chloridepenetration and other forms of degradation.
Many studies reveal that the propagation time for corrosion issignificantly shorter than the initiation time [12-14]. Therefore,extensive investigation on steel–concrete interface properties andconcrete transport properties is warranted to achieve the desiredservice life of concrete structures [15]. To augment the service life,the most sustainable way is to reduce the rate of diffusion of chlo-rides into concrete [16,17].
During the diffusion of chloride ions, they can bind with thehydration products or remain as free ions in the concrete poresolution [18]. These free chloride ions diffuse further into concretedue to the concentration gradient [19]. The chloride binding initi-ates the formation of Friedel’s salt (FS), resulting in a reduction inthe rate of chloride transport [18,20,21]. Hence, the capability ofconcrete to resist the chloride attack is measured based on itscapacity to bind chloride ions (i.e., resistance to chloride trans-port); and also measured as the apparent diffusion coefficient[22]. Several chloride binding mechanisms involve the chloridebinding chemical reaction occurring between the chloride ionsand the hydration products such as C3A (tricalcium aluminate)and C4AF (tetracalciumalumino ferrite), that result in the formationof Friedel’s salt (3CaO�Al2O3�CaCl2�10H2O) [18,21]. FS is stable inbasic solutions, but becomes unstable at lower pH values as inthe case of carbonated concrete [23,24].
Many reports suggest that concrete offers more resistance tochloride penetration upon the use of supplementary cementitiousmaterials (SCMs) like fly ash [25,26]. However, fly ash incorporatedconcrete possess some drawbacks such as high levels of calciumleaching, delayed setting and lower initial strength [27]. These lim-itations can be overcome by incorporating nanoparticles such asnano-CaCO3, nano-TiO2, nano-SiO2, etc. [28]. The combined use ofnano-TiO2 and nano-CaCO3 can dramatically enhance the proper-ties of fly ash modified concrete, as reported by Uthaman et al.[29]. It has also been established that nanoparticles help in improv-ing the resistance against the initiation and propagation of corro-sion of rebars embedded in concrete [30,31].
Another approach to increase the resistance against chloridetransport is to use corrosion inhibitors due to their advantages,such as convenience, cost-effectiveness, availability and high cor-rosion resistance. It has been reported that corrosion inhibitingadmixtures can increase the resistance to chloride penetrationand reduce the critical chloride threshold [32]. Corrosion inhibitorsare added into concrete either during mixing or application on tothe external surface of hardened concrete [33]. The application ofcorrosion inhibitors like calcium nitrite, sodium nitrite, and potas-sium chromate in concrete has been widely investigated [34,35]. Itis reported that sodium nitrite is an effective corrosion inhibitor forrebars in the presence of chloride ions, but has adverse effects onthe concrete strength [36,37]. A subsequent study shows that anadequate dosage of sodium nitrite based inhibitor improves thecorrosion resistance of the reinforcing steel without any adverseeffect on the compressive strength [38].
According to NACE Impact Report, nearly 50% of concrete struc-tures hit a major repair within 10 years of service [8]. The costs ofaddressing corrosion are estimated to be about 3–4% of the GDP ofthe developed nations. This warrants the need for the developmentof quality concrete with improved corrosion resistance forenhanced service life and savings on corrosion cost. The partialreplacement of cement with supplementary cementitious materi-als (SCMs) like fly ash helps to achieve sustainability and improvesthe corrosion resistance of concrete. The addition of nanoparticles
2
and corrosion inhibiting admixtures are also shown to increase theresistance to chloride penetration and reduce the critical chloridethreshold. There are no studies reported so far on the combinedeffect of fly ash, nanoparticles and corrosion inhibitor in improvingthe corrosion resistance of steel rebars in reinforced concretestructures. We try to bridge this gap through this systematic studyusing a concrete mix involving a combination of OPC, fly ash,nanoparticles and corrosion inhibitor to evaluate the synergiceffect of the additives in improving the concrete properties.
As per the government initiative to reduce carbon footprint, wedeveloped a ternary blended high performance green concrete(CFNI), with a combination of 56 wt% OPC, 40 wt% fly ash, 2 wt%nano-CaCO3 and nano-TiO2 (1:1 ratio) and 2 wt% NaNO2 basedanodic mixed inhibitor solution [39]. The anti-microbial and anti-fungal resistance of the CFNI concrete composition was investi-gated in our previous studies and the results were highly encour-aging with CFNI concrete exhibiting enhanced properties [40,41].This paper focuses on the chloride-induced corrosion of theembedded steel rebar inside reinforced CFNI concrete and theimprovement in the corrosion resistance, if any, due to the addi-tives are discussed in detail. The results of the present studytogether with the previous results can be used to determine thepotential of CFNI concrete in an aggressive marine environmentwhere corrosion due to chlorides and microorganisms areinevitable.
2. Experimental program
2.1. Materials and mix proportion
Table 1 shows the chemical composition and physical proper-ties of cement (as per ASTM C150) and ASTM class F- siliceous typefly ash used in the present study. Crushed black granites of 12 mmand 20 mm size were used as the coarse aggregate and naturalriver sand of size less than 4.75 mmwas used as the fine aggregate.Table 2 provides the properties of the aggregates. Potable waterwas used for making the specimens. The superplasticizer usedwas sulphonated naphthalene based high range water reducingadmixture conforming to ASTM C494 type F [42]. Commerciallaboratory-grade nano-anatase TiO2 and nano-CaCO3 with an ini-tial particle size of 400–500 nm (as per the manufacturer) wereused. The nanoparticles were reduced to 20–70 nm size bymechanical alloying and the detailed procedure is reported in ourprevious study [39]. Commercially available dark brown sodiumnitrite based anodic mixed inhibitor solution of relative density1.16 and pH 11.1 was used as the corrosion inhibitor in this study.The cement, fly ash, sand and coarse aggregates were thoroughlymixed in a laboratory counter current mixer. The nanoparticlesand inhibitor were added into the potable water before mixingwith the mixture.
Four types of M45 grade concrete compositions (correspondingto a target compressive strength of 45 MPa at the age of 28 days)were designated and fabricated as follows: (i) CC – ConventionalConcrete with M45 grade and 100% OPC; (ii) CF – Concrete with60 wt% OPC and 40 wt% fly ash, (iii) CFN – Concrete with 58 wt%OPC, 40 wt% fly ash and 2 wt% nanophase modifiers (1 wt%nano-anatase TiO2 and 1 wt% nano-CaCO3); (iv) CFNI – Concretewith 56 wt% OPC, 40 wt% fly ash, nanophase modifiers and corro-sion inhibitors (1 wt% nano-CaCO3, 1 wt% nano-TiO2, and 2 wt%NaNO2 inhibitor). The detailed mix designs used for casting theconcrete specimens are shown in Table 3. The total volume ofcementitious materials in all the specimens was 450 kg/m3. Thewater-to-cement ratio of all the specimens was fixed by keepinga constant target slump of 100 mm.
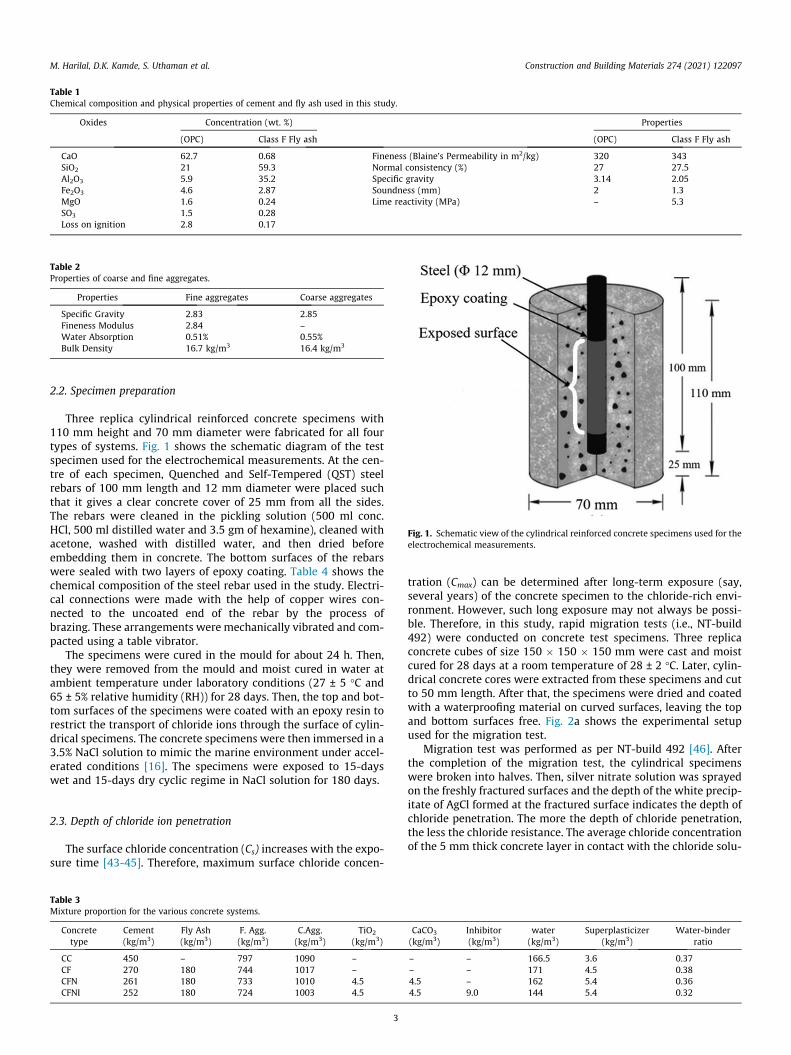
Table 1Chemical composition and physical properties of cement and fly ash used in this study.
Oxides Concentration (wt. %) Properties
(OPC) Class F Fly ash (OPC) Class F Fly ash
CaO 62.7 0.68 Fineness (Blaine’s Permeability in m2/kg) 320 343SiO2 21 59.3 Normal consistency (%) 27 27.5Al2O3 5.9 35.2 Specific gravity 3.14 2.05Fe2O3 4.6 2.87 Soundness (mm) 2 1.3MgO 1.6 0.24 Lime reactivity (MPa) – 5.3SO3 1.5 0.28Loss on ignition 2.8 0.17
Table 2Properties of coarse and fine aggregates.
Properties Fine aggregates Coarse aggregates
Specific Gravity 2.83 2.85Fineness Modulus 2.84 –Water Absorption 0.51% 0.55%Bulk Density 16.7 kg/m3 16.4 kg/m3
Fig. 1. Schematic view of the cylindrical reinforced concrete specimens used for theelectrochemical measurements.
M. Harilal, D.K. Kamde, S. Uthaman et al. Construction and Building Materials 274 (2021) 122097
2.2. Specimen preparation
Three replica cylindrical reinforced concrete specimens with110 mm height and 70 mm diameter were fabricated for all fourtypes of systems. Fig. 1 shows the schematic diagram of the testspecimen used for the electrochemical measurements. At the cen-tre of each specimen, Quenched and Self-Tempered (QST) steelrebars of 100 mm length and 12 mm diameter were placed suchthat it gives a clear concrete cover of 25 mm from all the sides.The rebars were cleaned in the pickling solution (500 ml conc.HCl, 500 ml distilled water and 3.5 gm of hexamine), cleaned withacetone, washed with distilled water, and then dried beforeembedding them in concrete. The bottom surfaces of the rebarswere sealed with two layers of epoxy coating. Table 4 shows thechemical composition of the steel rebar used in the study. Electri-cal connections were made with the help of copper wires con-nected to the uncoated end of the rebar by the process ofbrazing. These arrangements were mechanically vibrated and com-pacted using a table vibrator.
The specimens were cured in the mould for about 24 h. Then,they were removed from the mould and moist cured in water atambient temperature under laboratory conditions (27 ± 5 �C and65 ± 5% relative humidity (RH)) for 28 days. Then, the top and bot-tom surfaces of the specimens were coated with an epoxy resin torestrict the transport of chloride ions through the surface of cylin-drical specimens. The concrete specimens were then immersed in a3.5% NaCl solution to mimic the marine environment under accel-erated conditions [16]. The specimens were exposed to 15-dayswet and 15-days dry cyclic regime in NaCl solution for 180 days.
2.3. Depth of chloride ion penetration
The surface chloride concentration (Cs) increases with the expo-sure time [43-45]. Therefore, maximum surface chloride concen-
Table 3Mixture proportion for the various concrete systems.
Concretetype
Cement(kg/m3)
Fly Ash(kg/m3)
F. Agg.(kg/m3)
C.Agg.(kg/m3)
TiO2
(kg/m3)
CC 450 – 797 1090 –CF 270 180 744 1017 –CFN 261 180 733 1010 4.5CFNI 252 180 724 1003 4.5
3
tration (Cmax) can be determined after long-term exposure (say,several years) of the concrete specimen to the chloride-rich envi-ronment. However, such long exposure may not always be possi-ble. Therefore, in this study, rapid migration tests (i.e., NT-build492) were conducted on concrete test specimens. Three replicaconcrete cubes of size 150 � 150 � 150 mm were cast and moistcured for 28 days at a room temperature of 28 ± 2 �C. Later, cylin-drical concrete cores were extracted from these specimens and cutto 50 mm length. After that, the specimens were dried and coatedwith a waterproofing material on curved surfaces, leaving the topand bottom surfaces free. Fig. 2a shows the experimental setupused for the migration test.
Migration test was performed as per NT-build 492 [46]. Afterthe completion of the migration test, the cylindrical specimenswere broken into halves. Then, silver nitrate solution was sprayedon the freshly fractured surfaces and the depth of the white precip-itate of AgCl formed at the fractured surface indicates the depth ofchloride penetration. The more the depth of chloride penetration,the less the chloride resistance. The average chloride concentrationof the 5 mm thick concrete layer in contact with the chloride solu-
CaCO3
(kg/m3)Inhibitor(kg/m3)
water(kg/m3)
Superplasticizer(kg/m3)
Water-binderratio
– – 166.5 3.6 0.37– – 171 4.5 0.384.5 – 162 5.4 0.364.5 9.0 144 5.4 0.32

Table 4Chemical composition of Fe500 TMT steel rebar used as reinforcements for the electrochemical test specimens (wt. %).
C Si V P S Mo Nb Fe
0.24 0.06 0.028 0.039 0.030 0.09 0.023 Balance
Fig. 2. (a) Schematic view of accelerated chloride migration test setup (NT build 492 (2011)) (b) schematic view of the experimental set up used for the electrochemicalmeasurements.
M. Harilal, D.K. Kamde, S. Uthaman et al. Construction and Building Materials 274 (2021) 122097
tion (during the migration test) was determined and is defined asCmax.
2.4. Apparent chloride diffusion coefficient of concrete (Dcl)
To determine the apparent chloride diffusion coefficient for thedifferent concrete compositions, the bulk diffusion test was per-formed on 100 � 200 mm long cylindrical concrete specimens.The specimens were cured for one year to limit the influence ofmicrostructure evolution on the rate of chloride ingress. After cur-ing, the cylinder specimens from each concrete composition weresliced into two samples of 50 mm thickness. The specimens werethen coated with epoxy and kept for hardening. After the epoxyhas hardened, the slices were conditioned with a saturated calciumhydroxide solution and immersed in 2.8 M NaCl solution for56 days as per ASTM C1556 [47]. Chloride profiles up to 25 mmwere obtained for each specimen by grinding using a lathemachine and single head diamond dresser tools. The powdered
4
samples from each layer were collected and chloride concentra-tions were determined as per SHRP-S-330 [48]. Later, these chlo-ride profiles and Fick’s second law (Equation (1)) were used todetermine the Dcl.
C x; tð Þ ¼ Cs � Cs � Cið Þ � erfxffiffiffiffiffiffiffiffiffiffiffiffiffiffiffiffiffiffiffiffiffiffiffi
4� Dcl � tp
� �ð1Þ
where, C(x, t) is the chloride concentration measured at depth ‘x’from the exposed concrete surface at an exposure time of t s, ‘Cs’is the surface chloride concentration built-up on the exposed con-crete surface after exposure time t seconds, ‘Ci’ is the initial chlorideconcentration (assumed to be zero in this study), ‘Dcl’ is the appar-ent chloride diffusion coefficient, and (erf) is the error function.Here, Dcl is considered as a time-variant function and determinedby using Equation (2),
Dcl tð Þ ¼ Dcl � t0t
� �m
ð2Þ
M. Harilal, D.K. Kamde, S. Uthaman et al. Construction and Building Materials 274 (2021) 122097
where, Dcl (t) is the apparent chloride diffusion coefficient at age tdays, Dcl is the apparent chloride diffusion coefficient of concreteat the age of 28 days, ‘t0’ is equal to 28 days, t is the age of the spec-imen in days, and m is the decay constant/maturity coefficient,which was calculated using Equation (3) [49]. The relation was usedto incorporate the effect of supplementary cementitious materials.
m ¼ 0:2þ 0:4% of flyash
50
� �ð3Þ
where, m is the decay constant, % of fly ash is the percentagereplacement with OPC. For concrete with nanomaterials and inhibi-tors, ‘m’ value used is 0.6, which is the maximum decay constantallowed [50].
2.5. Electrochemical measurements in simulated chloride environment
2.5.1. Linear polarization resistance (LPR) techniqueFig. 2b shows the schematic diagram of the experimental setup
used for the measurements of resistance to polarization (Rp) of thesteel–concrete test specimens using a three-electrode arrange-ment. Here, the rebar is the working electrode, Ag/AgCl is the ref-erence electrode, and circumferentially placed stainless steel is thecounter electrode. There are some uncertainties associated withLPR measurements due to the ohmic (IR) drop resulting from theelectrical resistivity of concrete and the distance between embed-ded rebar and reference electrode. This IR drop during the time ofelectrochemical measurements on rebars originates from the flowof current through the finite resistivity of reinforced concrete. Thecorrosion measurements carried out without considering the IRdrop lead to too small corrosion density (icorr) values [51]. In thisstudy, the reference electrode was placed very near to the rebarduring the measurements to minimize the measurement errors.
The open circuit potentials of three replica specimens weremeasured using ACM Galvo Gill Electrochemical Workstation (Gill12, M/s ACM instruments, UK) as per ASTM G59-97 [52] afterimmersion in 3.5% NaCl solution for 55 min and averaged at theend of each cycle during the exposure period of 180 days. To accel-erate the chloride transport through the concrete, all the test spec-imens were subjected to alternate wetting and drying cycles. Onecycle consists of 15 days of wetting in NaCl solution, followed byanother 15 days of drying in the open air for a total period of180 days. The application of drying and wetting cycles acceleratecorrosion by creating nucleating paths during the drying cyclewhich enables easy penetration of chlorides into the concreteand breaking the stable passive film over the steel rebars [53].The instantaneous corrosion rates of the reinforcing steel in con-crete were then measured at the end of each cycle, by linearlypolarizing them from its equilibrium potential (OCP) value to±25 mV, to ensure that for active corrosion the potential shift lieswithin the linear Stern-Geary region [54]. The sweep rate adoptedwas 10 mV/min. The resulting LPR curve was obtained and thepolarization resistance (RP) was determined from the tangent ati = 0. The RP value obtained was used for the calculation of the cor-rosion rate following ASTM G59- 97 (2014) [52]. The estimation ofcorrosion rate from polarization measurements requires the quan-titative information about the Stern-Geary coefficient, B, which is26 mV in the case of active corrosion and 52 mV in the case of pas-sive corrosion for a reinforced concrete specimen [55]. In thisstudy, the value of B was taken as 26 mV [53,56-58], with a max-imum measurement error factor of 2 for the estimation of corro-sion rates [55].
2.5.2. Gravimetric mass loss measurement and visual examinationThe initial weights of the reinforcing steel rebars were mea-
sured before embedding them in concrete. The concrete specimens
5
with embedded steel were immersed in a 3.5% NaCl solution andsubjected to six alternate wetting and drying cycles for 180 days.After that, the concrete specimens were cut open, and the rebarswere visually observed for the degree of corrosion. The rebars werethen cleaned in a pickling solution (500 ml conc. HCl, 500 ml dis-tilled water and 3.5 gm of hexamine) according to ASTM G1-90[59]. The weight of the cleaned specimens was measured, andthe loss in weight was calculated. The rates of corrosion weredetermined in millimeters per year (mmpy) using Eqn 4, where87.6 is a conversion factor as reported in a previous study [60]:
Corrosion rate ðmmpyÞ ¼87:6�weight loss ðmgÞ
density gcm3
� �� area cm2ð Þ � time of exposure ðhÞ ð4Þ
2.5.3. Electrochemical impedance spectroscopy (EIS) measurementElectrochemical impedance spectroscopic (EIS) measurements
at open circuit potential were carried out using the same test setupas in the case of LPR measurements, with a computer-controlledpotentiostat (PGSTAT30 Autolab, EcoChemie, Netherlands) in analternating frequency range of 10 mHz to 100 kHz. AC signal withan amplitude of 10 mV was applied to the system, and the impe-dance and current values were measured using frequencies withinthe applied range. The impedance spectra were then analyzed byfitting the experimental data to the equivalent electrical circuitwith the help of Z-View software.
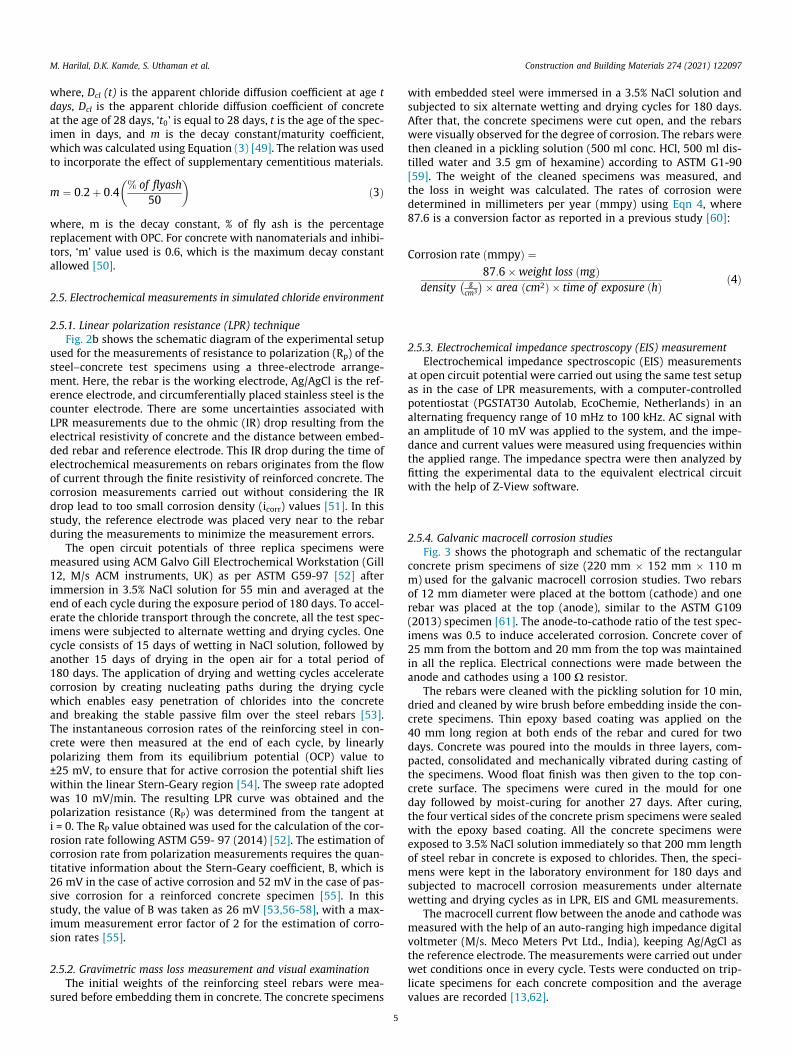
2.5.4. Galvanic macrocell corrosion studiesFig. 3 shows the photograph and schematic of the rectangular
concrete prism specimens of size (220 mm � 152 mm � 110 mm) used for the galvanic macrocell corrosion studies. Two rebarsof 12 mm diameter were placed at the bottom (cathode) and onerebar was placed at the top (anode), similar to the ASTM G109(2013) specimen [61]. The anode-to-cathode ratio of the test spec-imens was 0.5 to induce accelerated corrosion. Concrete cover of25 mm from the bottom and 20 mm from the top was maintainedin all the replica. Electrical connections were made between theanode and cathodes using a 100 X resistor.
The rebars were cleaned with the pickling solution for 10 min,dried and cleaned by wire brush before embedding inside the con-crete specimens. Thin epoxy based coating was applied on the40 mm long region at both ends of the rebar and cured for twodays. Concrete was poured into the moulds in three layers, com-pacted, consolidated and mechanically vibrated during casting ofthe specimens. Wood float finish was then given to the top con-crete surface. The specimens were cured in the mould for oneday followed by moist-curing for another 27 days. After curing,the four vertical sides of the concrete prism specimens were sealedwith the epoxy based coating. All the concrete specimens wereexposed to 3.5% NaCl solution immediately so that 200 mm lengthof steel rebar in concrete is exposed to chlorides. Then, the speci-mens were kept in the laboratory environment for 180 days andsubjected to macrocell corrosion measurements under alternatewetting and drying cycles as in LPR, EIS and GML measurements.
The macrocell current flow between the anode and cathode wasmeasured with the help of an auto-ranging high impedance digitalvoltmeter (M/s. Meco Meters Pvt Ltd., India), keeping Ag/AgCl asthe reference electrode. The measurements were carried out underwet conditions once in every cycle. Tests were conducted on trip-licate specimens for each concrete composition and the averagevalues are recorded [13,62].
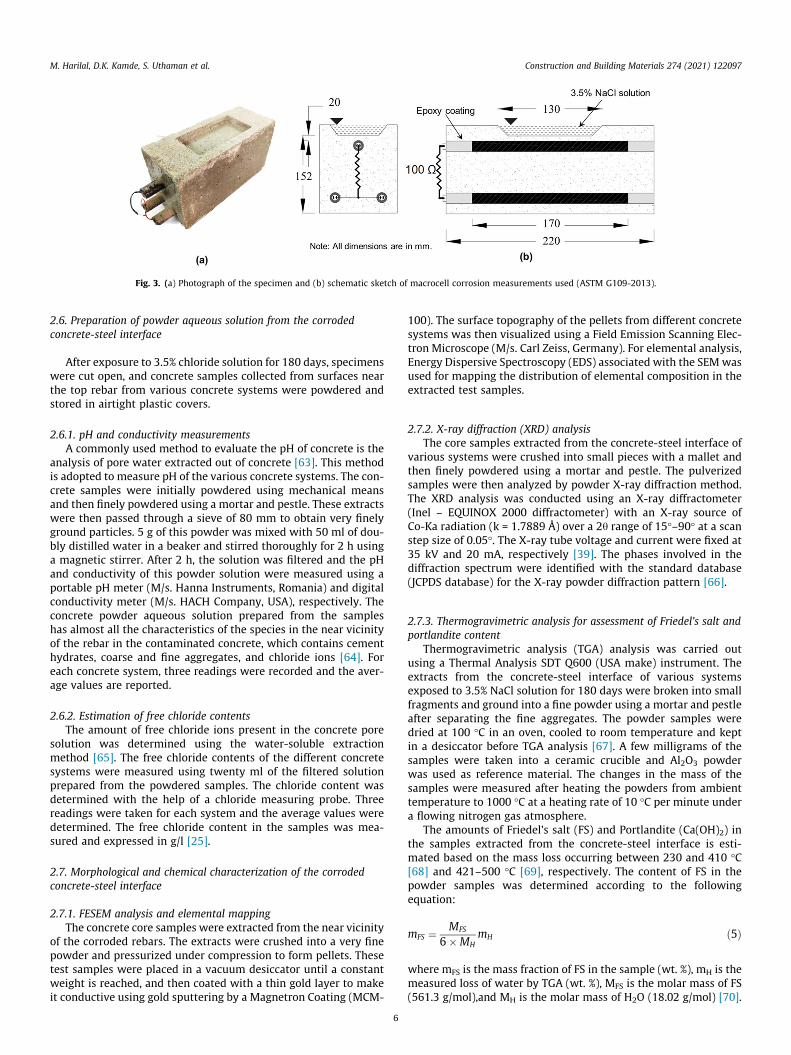
Fig. 3. (a) Photograph of the specimen and (b) schematic sketch of macrocell corrosion measurements used (ASTM G109-2013).
M. Harilal, D.K. Kamde, S. Uthaman et al. Construction and Building Materials 274 (2021) 122097
2.6. Preparation of powder aqueous solution from the corrodedconcrete-steel interface
After exposure to 3.5% chloride solution for 180 days, specimenswere cut open, and concrete samples collected from surfaces nearthe top rebar from various concrete systems were powdered andstored in airtight plastic covers.
2.6.1. pH and conductivity measurementsA commonly used method to evaluate the pH of concrete is the
analysis of pore water extracted out of concrete [63]. This methodis adopted to measure pH of the various concrete systems. The con-crete samples were initially powdered using mechanical meansand then finely powdered using a mortar and pestle. These extractswere then passed through a sieve of 80 mm to obtain very finelyground particles. 5 g of this powder was mixed with 50 ml of dou-bly distilled water in a beaker and stirred thoroughly for 2 h usinga magnetic stirrer. After 2 h, the solution was filtered and the pHand conductivity of this powder solution were measured using aportable pH meter (M/s. Hanna Instruments, Romania) and digitalconductivity meter (M/s. HACH Company, USA), respectively. Theconcrete powder aqueous solution prepared from the sampleshas almost all the characteristics of the species in the near vicinityof the rebar in the contaminated concrete, which contains cementhydrates, coarse and fine aggregates, and chloride ions [64]. Foreach concrete system, three readings were recorded and the aver-age values are reported.
2.6.2. Estimation of free chloride contentsThe amount of free chloride ions present in the concrete pore
solution was determined using the water-soluble extractionmethod [65]. The free chloride contents of the different concretesystems were measured using twenty ml of the filtered solutionprepared from the powdered samples. The chloride content wasdetermined with the help of a chloride measuring probe. Threereadings were taken for each system and the average values weredetermined. The free chloride content in the samples was mea-sured and expressed in g/l [25].
2.7. Morphological and chemical characterization of the corrodedconcrete-steel interface
2.7.1. FESEM analysis and elemental mappingThe concrete core samples were extracted from the near vicinity
of the corroded rebars. The extracts were crushed into a very finepowder and pressurized under compression to form pellets. Thesetest samples were placed in a vacuum desiccator until a constantweight is reached, and then coated with a thin gold layer to makeit conductive using gold sputtering by a Magnetron Coating (MCM-
6
100). The surface topography of the pellets from different concretesystems was then visualized using a Field Emission Scanning Elec-tron Microscope (M/s. Carl Zeiss, Germany). For elemental analysis,Energy Dispersive Spectroscopy (EDS) associated with the SEMwasused for mapping the distribution of elemental composition in theextracted test samples.
2.7.2. X-ray diffraction (XRD) analysisThe core samples extracted from the concrete-steel interface of
various systems were crushed into small pieces with a mallet andthen finely powdered using a mortar and pestle. The pulverizedsamples were then analyzed by powder X-ray diffraction method.The XRD analysis was conducted using an X-ray diffractometer(Inel – EQUINOX 2000 diffractometer) with an X-ray source ofCo-Ka radiation (k = 1.7889 Å) over a 2h range of 15�–90� at a scanstep size of 0.05�. The X-ray tube voltage and current were fixed at35 kV and 20 mA, respectively [39]. The phases involved in thediffraction spectrum were identified with the standard database(JCPDS database) for the X-ray powder diffraction pattern [66].
2.7.3. Thermogravimetric analysis for assessment of Friedel’s salt andportlandite content
Thermogravimetric analysis (TGA) analysis was carried outusing a Thermal Analysis SDT Q600 (USA make) instrument. Theextracts from the concrete-steel interface of various systemsexposed to 3.5% NaCl solution for 180 days were broken into smallfragments and ground into a fine powder using a mortar and pestleafter separating the fine aggregates. The powder samples weredried at 100 �C in an oven, cooled to room temperature and keptin a desiccator before TGA analysis [67]. A few milligrams of thesamples were taken into a ceramic crucible and Al2O3 powderwas used as reference material. The changes in the mass of thesamples were measured after heating the powders from ambienttemperature to 1000 �C at a heating rate of 10 �C per minute undera flowing nitrogen gas atmosphere.
The amounts of Friedel’s salt (FS) and Portlandite (Ca(OH)2) inthe samples extracted from the concrete-steel interface is esti-mated based on the mass loss occurring between 230 and 410 �C[68] and 421–500 �C [69], respectively. The content of FS in thepowder samples was determined according to the followingequation:
mFS ¼ MFS
6�MHmH ð5Þ
where mFS is the mass fraction of FS in the sample (wt. %), mH is themeasured loss of water by TGA (wt. %), MFS is the molar mass of FS(561.3 g/mol),and MH is the molar mass of H2O (18.02 g/mol) [70].

M. Harilal, D.K. Kamde, S. Uthaman et al. Construction and Building Materials 274 (2021) 122097
Similarly, the content of portlandite was quantified by deter-mining the weight loss in the temperature range from 400 to500 �C according to the equation:
mCH ¼ MCH
MH�m ð6Þ
where mCH corresponds to the mass fraction of portlandite in thesample (wt. %), m is the loss of water from portlandite (wt. %) inthe temperature range, MCH is the molar mass (74.09 g/mol) of port-landite, and MH is the molar mass (18.02 g/mol) of H2O [70].
2.7.4. Fourier Transform infrared (FTIR) spectroscopic analysisThe different functional groups corresponding to the hydration
products in the hardened concrete were determined with FourierTransform Infrared (FTIR) spectroscopy. The FTIR spectrum of theconcrete powders was collected using an infrared spectrometer(M/s. Bruker, Germany) in the transmission mode. The pellets forthe characterization were prepared by mixing 3 mg of the concretepowder with 250 mg of potassium bromide (KBr). Sixteen scanswere recorded in the range of 4000 cm�1 to 400 cm�1.
2.8. Estimation of service life
In this study, the probabilistic service life of the reinforced con-crete systems was estimated based on the time taken for the initi-ation of rebar corrosion. A MATLAB program (SL-chlor) developedby Rengaraju (2019) was used to estimate the service life [71].SL-Chlor program considers the one-directional diffusion of chlo-ride as per Fick’s second law of diffusion (see Eq. (1)). Followinginput parameters were used for the estimation: Cs, Cmax, Dcl, m,and Clth. The input parameters used in this study was determinedusing experiments in this study and from the field investigation ofa 6-year old bridge structure presented in a previous work [13]. Forprobabilistic estimation of service life, 1000 number of simulationsare considered. A probabilistic response was obtained and 50% ofprobability of initiation of corrosion was considered to be theend of service life [72].
3. Results and discussion
3.1. Depth of chloride ion penetration
Fig. 4a shows the average depth of chloride ion penetration inCC, CF, CFN, and CFNI concretes, estimated after the ingress of chlo-ride ions using the chloride migration test. The depth of penetra-tion in CC, CF, CFN, and CFNI was found to be 23, 11, 8, and6 mm, respectively. It is seen that the chloride penetration in con-crete with fly ash is reduced to 50% of the original value. Likewise,chloride penetration is found to be significantly decreased after theaddition of nanoparticles, which is attributed to the densermicrostructure due to the filler effect of nanoparticles. Further,the addition of inhibitor also increases the chloride resistancebut it was not significantly visible in the fractured concrete pieceshown in Fig. 4a. This may be because of the migration of chargedions of the inhibitor when potential is applied across concretespecimens during the migration test. These ions may not diffusewhen concrete is exposed to the natural environment. Therefore,the depth of penetration in the case of CFNI is an overestimatedone due to the fact that inhibitors were not effective due to theapplication of the potential [14].
Fig. 4b shows the results of the chloride migration test used toobtain a quantitative measure of the resistance against chlorideingress. The parameter obtained is the non-steady state migrationcoefficient which represents the rate of chloride ingress uponapplication of a potential. It can be seen that the value of the
7
migration coefficient in CC specimens was 3.43 � 10-12 m2/s. Theaddition of fly ash lowers the chloride migration coefficient of CFspecimens to the order of 0.96 � 10-12 m2/s (~72% compared toCC). The incorporation of nanoparticles further reduced the migra-tion coefficients of CFN specimens to 0.73 � 10-12 m2/s (~78% com-pared to CC). However, upon addition of inhibitor, the migrationcoefficient increased to a value of 1.16 � 10-12 m2/s for CFNI spec-imens. It is reported that when inhibitors are used, they have addi-tional ions. Thus, when a potential gradient is applied, theseadditional ions of inhibitors cause additional ionic flow [14]. Thiswill result in an increase the value of the migration coefficient ofCFNI than CFN. Therefore, the value for CFNI is not correct and ithas to be validated using the Diffusion coefficient. The improvedperformance of CFNI due to chloride binding is observed duringthe long-term chloride diffusion test (See Section 3.2).
3.2. Chloride diffusion coefficients of concrete
Fig. 5 shows the chloride content profiles of the concrete sam-ples obtained from CC, CF, CFN, and CFNI concrete specimensdetermined using SHRP-S-330. These chloride profiles were fittedusing Fick’s second law to determine the Dcl for each specimen.Dcl for CC, CF, CFN, and CFNI was found to be 3.17, 1.9,1.11 � 10-11 m2/Sec, and 8.56 � 10-12 m2/Sec, respectively. Thus,Dcl for CFNI type of concrete was found to be one order less thanother types of concrete specimens, indicating that the combinationof nanomaterial and inhibitor can resist or lower the chlorideingress. Also, the chloride concentration on the surface of CFNand CFNI types of concrete is significantly higher than that on CCand CF surfaces as seen in Fig. 5. The accumulation of higher chlo-ride concentration indicates the higher chloride binding capacity ofthe concrete with nanomaterials and inhibitor. Thus, the chlorideingress resistance for these concretes are ranked asCFNI > CFN > CF > CC.
3.3. Electrochemical measurements in the simulated chlorideenvironment
Fig. 6a shows the variations in the open circuit potential valuesof reinforcement, measured with the LPR test before and after thealternate wetting and drying cycle in all four types of concrete testspecimens. The extent of corrosion activity in the embedded rebarswas determined as per ASTM C 876–09 [73]. Initially, the potentialvalues of reinforcement in CC, CF and CFN specimens were in therange of �110 to �160 mVAg/AgCl electrode, which is more negativethan �105 mVAg/AgCl, indicating an uncertain probability of corro-sion at the rebar level [73]. The rebar inside CFN concrete systemshowed a potential value of �92 mV, which is more positive than�105 mVAg/AgCl, indicating 10% probability of corrosion [73]. After180 days of wet and dry exposure, the potential of CC specimenswas found to be more negative than �255 mVAg/AgCl indicating a90% probability of active corrosion whereas, the rebars embeddedin CF, CFN and CFNI test specimens showed potential valuesbetween �255 mVAg/AgCl and �105 mVAg/AgCl, indicating an uncer-tain probability of corrosion [74].
In the case of CC specimens, the permeability and pore charac-teristics is comparatively on the high side [39] and hence moreamount of chloride ions penetrated from the initial day of exposureand shifted the potential towards a negative direction [54]. Shaikhet al. [67] have reported that the addition of nano-CaCO3 and flyash together in conventional concrete could provide better corro-sion protection to fly ash concrete. The addition of nano-CaCO3 fillsup the pores near the cement particles thereby reducing the poros-ity and permeability of the concrete specimens [75]. Incorporationof nano- TiO2 up to 1.5 wt% can also act as filler, increases the rateof hydration and improves the corrosion resistance of the reinforc-
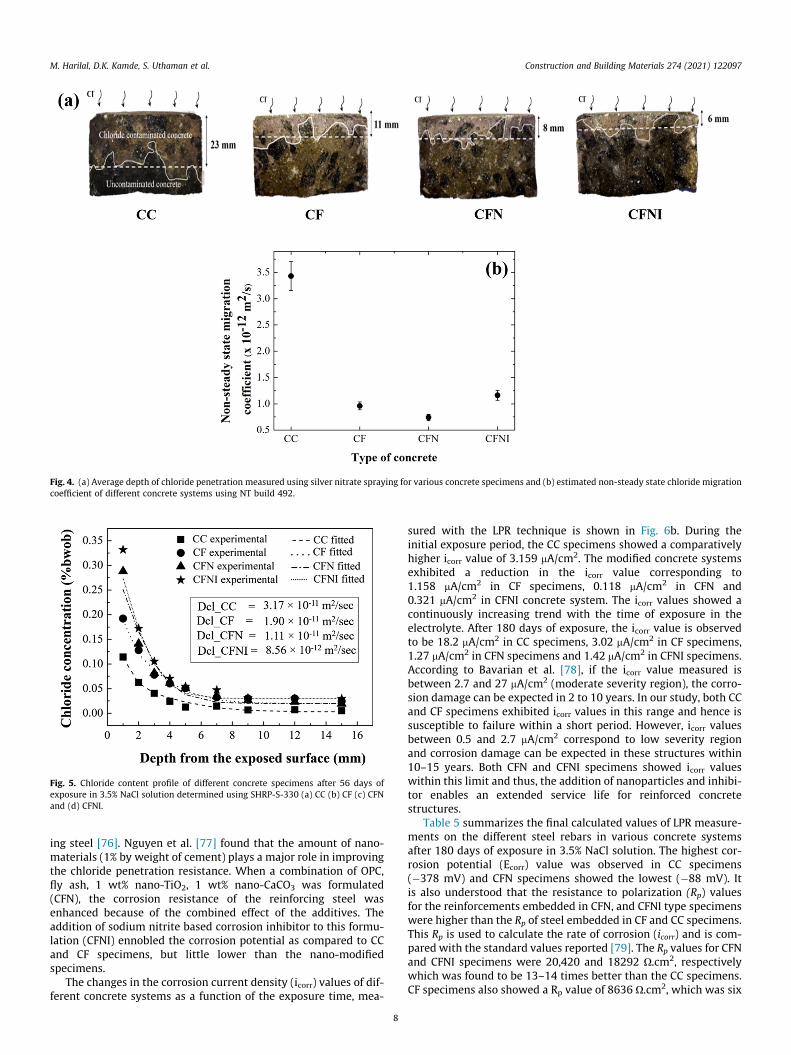
Fig. 4. (a) Average depth of chloride penetration measured using silver nitrate spraying for various concrete specimens and (b) estimated non-steady state chloride migrationcoefficient of different concrete systems using NT build 492.
Fig. 5. Chloride content profile of different concrete specimens after 56 days ofexposure in 3.5% NaCl solution determined using SHRP-S-330 (a) CC (b) CF (c) CFNand (d) CFNI.
M. Harilal, D.K. Kamde, S. Uthaman et al. Construction and Building Materials 274 (2021) 122097
ing steel [76]. Nguyen et al. [77] found that the amount of nano-materials (1% by weight of cement) plays a major role in improvingthe chloride penetration resistance. When a combination of OPC,fly ash, 1 wt% nano-TiO2, 1 wt% nano-CaCO3 was formulated(CFN), the corrosion resistance of the reinforcing steel wasenhanced because of the combined effect of the additives. Theaddition of sodium nitrite based corrosion inhibitor to this formu-lation (CFNI) ennobled the corrosion potential as compared to CCand CF specimens, but little lower than the nano-modifiedspecimens.
The changes in the corrosion current density (icorr) values of dif-ferent concrete systems as a function of the exposure time, mea-
8
sured with the LPR technique is shown in Fig. 6b. During theinitial exposure period, the CC specimens showed a comparativelyhigher icorr value of 3.159 mA/cm2. The modified concrete systemsexhibited a reduction in the icorr value corresponding to1.158 mA/cm2 in CF specimens, 0.118 mA/cm2 in CFN and0.321 mA/cm2 in CFNI concrete system. The icorr values showed acontinuously increasing trend with the time of exposure in theelectrolyte. After 180 days of exposure, the icorr value is observedto be 18.2 mA/cm2 in CC specimens, 3.02 mA/cm2 in CF specimens,1.27 mA/cm2 in CFN specimens and 1.42 mA/cm2 in CFNI specimens.According to Bavarian et al. [78], if the icorr value measured isbetween 2.7 and 27 mA/cm2 (moderate severity region), the corro-sion damage can be expected in 2 to 10 years. In our study, both CCand CF specimens exhibited icorr values in this range and hence issusceptible to failure within a short period. However, icorr valuesbetween 0.5 and 2.7 mA/cm2 correspond to low severity regionand corrosion damage can be expected in these structures within10–15 years. Both CFN and CFNI specimens showed icorr valueswithin this limit and thus, the addition of nanoparticles and inhibi-tor enables an extended service life for reinforced concretestructures.
Table 5 summarizes the final calculated values of LPR measure-ments on the different steel rebars in various concrete systemsafter 180 days of exposure in 3.5% NaCl solution. The highest cor-rosion potential (Ecorr) value was observed in CC specimens(�378 mV) and CFN specimens showed the lowest (�88 mV). Itis also understood that the resistance to polarization (Rp) valuesfor the reinforcements embedded in CFN, and CFNI type specimenswere higher than the Rp of steel embedded in CF and CC specimens.This Rp is used to calculate the rate of corrosion (icorr) and is com-pared with the standard values reported [79]. The Rp values for CFNand CFNI specimens were 20,420 and 18292 O.cm2, respectivelywhich was found to be 13–14 times better than the CC specimens.CF specimens also showed a Rp value of 8636 O.cm2, which was six
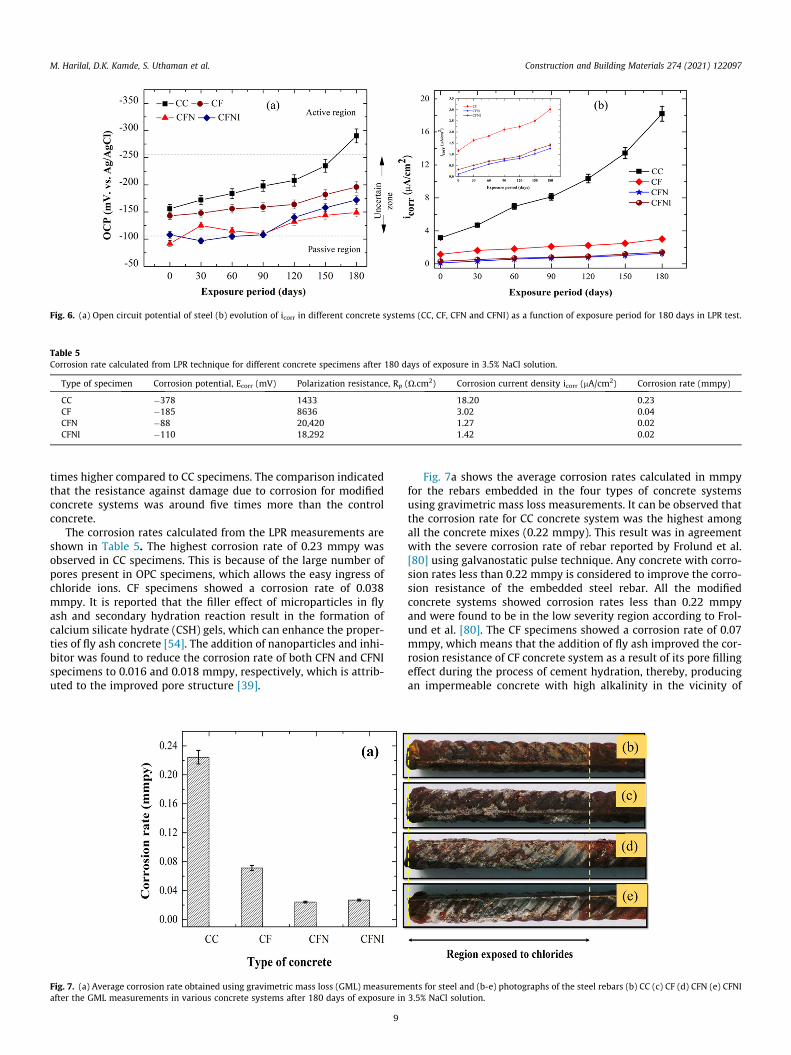
Fig. 6. (a) Open circuit potential of steel (b) evolution of icorr in different concrete systems (CC, CF, CFN and CFNI) as a function of exposure period for 180 days in LPR test.
Table 5Corrosion rate calculated from LPR technique for different concrete specimens after 180 days of exposure in 3.5% NaCl solution.
Type of specimen Corrosion potential, Ecorr (mV) Polarization resistance, Rp (O.cm2) Corrosion current density icorr (mA/cm2) Corrosion rate (mmpy)
CC �378 1433 18.20 0.23CF �185 8636 3.02 0.04CFN �88 20,420 1.27 0.02CFNI �110 18,292 1.42 0.02
M. Harilal, D.K. Kamde, S. Uthaman et al. Construction and Building Materials 274 (2021) 122097
times higher compared to CC specimens. The comparison indicatedthat the resistance against damage due to corrosion for modifiedconcrete systems was around five times more than the controlconcrete.
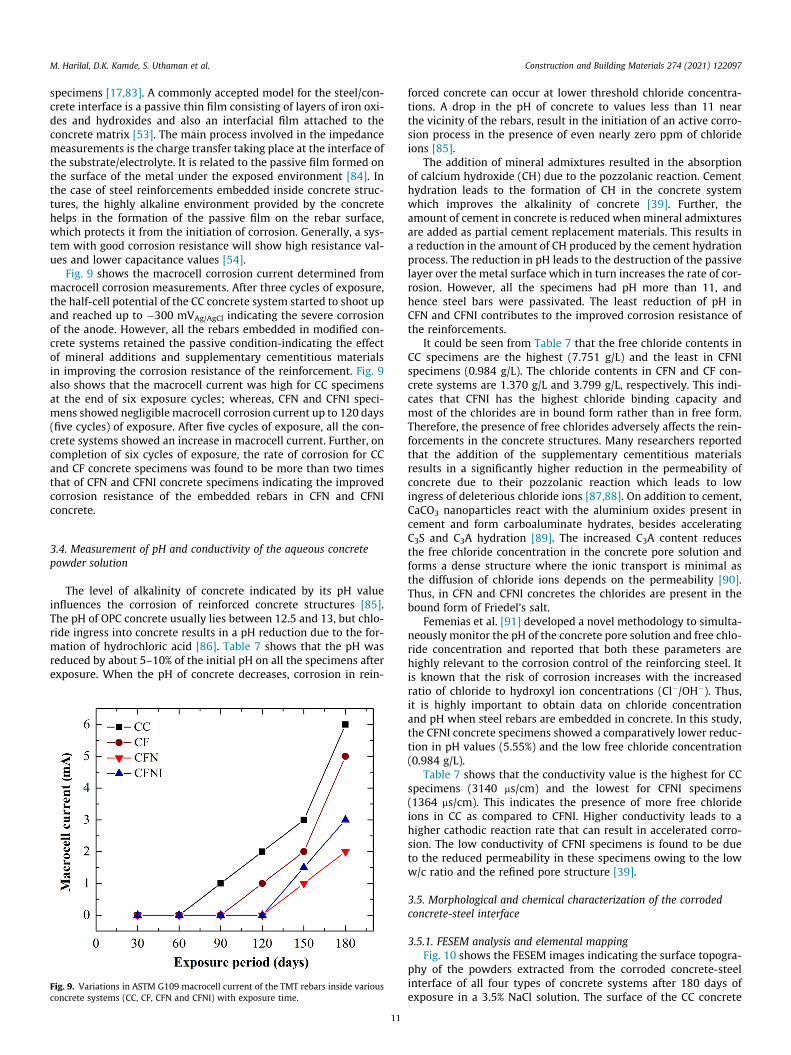
The corrosion rates calculated from the LPR measurements areshown in Table 5. The highest corrosion rate of 0.23 mmpy wasobserved in CC specimens. This is because of the large number ofpores present in OPC specimens, which allows the easy ingress ofchloride ions. CF specimens showed a corrosion rate of 0.038mmpy. It is reported that the filler effect of microparticles in flyash and secondary hydration reaction result in the formation ofcalcium silicate hydrate (CSH) gels, which can enhance the proper-ties of fly ash concrete [54]. The addition of nanoparticles and inhi-bitor was found to reduce the corrosion rate of both CFN and CFNIspecimens to 0.016 and 0.018 mmpy, respectively, which is attrib-uted to the improved pore structure [39].
Fig. 7. (a) Average corrosion rate obtained using gravimetric mass loss (GML) measuremafter the GML measurements in various concrete systems after 180 days of exposure in
9
Fig. 7a shows the average corrosion rates calculated in mmpyfor the rebars embedded in the four types of concrete systemsusing gravimetric mass loss measurements. It can be observed thatthe corrosion rate for CC concrete system was the highest amongall the concrete mixes (0.22 mmpy). This result was in agreementwith the severe corrosion rate of rebar reported by Frolund et al.[80] using galvanostatic pulse technique. Any concrete with corro-sion rates less than 0.22 mmpy is considered to improve the corro-sion resistance of the embedded steel rebar. All the modifiedconcrete systems showed corrosion rates less than 0.22 mmpyand were found to be in the low severity region according to Frol-und et al. [80]. The CF specimens showed a corrosion rate of 0.07mmpy, which means that the addition of fly ash improved the cor-rosion resistance of CF concrete system as a result of its pore fillingeffect during the process of cement hydration, thereby, producingan impermeable concrete with high alkalinity in the vicinity of
ents for steel and (b-e) photographs of the steel rebars (b) CC (c) CF (d) CFN (e) CFNI3.5% NaCl solution.

Table 6Best fitting results from the impedance spectra obtained after 180 days of exposure in3.5% NaCl solution for all the four concrete systems.
Type of specimen Rpf (�104 O.cm2) Error v2
CC 10 2% 0.002CF 15 6% 0.0002CFN 180 3% 0.001CFNI 205 6% 0.0005
M. Harilal, D.K. Kamde, S. Uthaman et al. Construction and Building Materials 274 (2021) 122097
rebar [25]. Harilal et al. [39] have reported that incorporation ofnanoparticles and inhibitor can significantly decrease the chloridepermeability of fly ash concrete. The corrosion rates of CFN andCFNI concrete specimens were 0.024 mmpy and 0.026 mmpy,respectively. The difference between the corrosion rates obtainedfrom gravimetric mass loss and polarization experiments is dueto the assumed measurement factor considered in the polarizationexperiments.
Fig. 7(b–e) shows the photographs of the steel rebars embeddedinside various concrete systems after 180 days of exposure in 3.5%NaCl solution. The visual examination of the rebars showed thatthe one placed inside the CC specimen has undergone the maxi-mum rusting. The adherence of concrete was visible on the rebarsinside modified concrete specimens. This is in agreement with thestudies conducted by Garcia et al. [81] and Bastidas et al. [82],where adherence of fly ash favoured stability to the rebars inaggressive chloride environments. The surface of CFN and CFNIspecimens showed more adherence of concrete and hence theextent of rust formation was comparatively lesser in thesespecimens.
Fig. 8 shows the typical electrochemical impedance spec-troscopy response from the steel concrete systems (CC, CF, CFN,and CFNI). The Nyquist plots for all the four specimens after180 days of exposure in 3.5% NaCl solution recorded at room tem-perature (25 ± 2 �C) are shown in Fig. 8a. The data were fit using anelectrical equivalent circuit (EEC) of the steel–concrete systems(Fig. 8c), which is similar to the reference [71] and Table 6 summa-rizes the corresponding best-fit parameters. The RS is the resistanceof solution, which is assumed to be constant in this study. RC andCPEC are the resistance and capacitance of concrete, respectively;RS-C and CPES-C are the resistance and capacitance of steel–concrete
Fig. 8. (a) Nyquist plots (b) bode modulus plots obtained from the EIS measurements (fitting the electrochemical impedance data [71].
10
interface, and Rpf and CPEpf are the resistance and capacitance ofpassive film, respectively. It could be observed that with the addi-tion of mineral admixtures and supplementary cementitious mate-rials, resistance to corrosion improved (i.e., RC (CF) > RC (CC)). TheRC of CC and CF is significantly less than the RC of CFN and CFNI.Note that the RC (CFNI) < RC(CFN). Though the resistance of con-crete will help in reducing the rate of corrosion, it will not directlyinfluence the resistance of initiation of corrosion. The informationon resistance to initiation of corrosion can be extracted from theRpf value of each element. Fitting of EIS response to EEC gave anRpf (CFNI) value of � 200 � 104 O.cm2 > Rpf (CFN) � 180 � 104 O.cm2, indicating that the resistance of the passive film to initiationof corrosion for steel in CFNI concrete systems is higher than thatin the CFN concrete system. The higher Rpf can be because of thedenser passive film formed due to the presence of inhibitor [14].
Therefore, the corrosion resistance of various steel–concretesystems can be ranked as CFN � CFNI > CF > CC. Then, these resultswere confirmed using Bode modulus plots given in Fig. 8b. Theseplots show the variations in the impedance with a change in fre-quency for all the four concrete systems. Similar EIS spectra havebeen reported for OPC concrete specimens and fly ash modified
c) magnified view of the boxed region of Fig. 8a and (d) equivalent circuit used for
M. Harilal, D.K. Kamde, S. Uthaman et al. Construction and Building Materials 274 (2021) 122097
specimens [17,83]. A commonly accepted model for the steel/con-crete interface is a passive thin film consisting of layers of iron oxi-des and hydroxides and also an interfacial film attached to theconcrete matrix [53]. The main process involved in the impedancemeasurements is the charge transfer taking place at the interface ofthe substrate/electrolyte. It is related to the passive film formed onthe surface of the metal under the exposed environment [84]. Inthe case of steel reinforcements embedded inside concrete struc-tures, the highly alkaline environment provided by the concretehelps in the formation of the passive film on the rebar surface,which protects it from the initiation of corrosion. Generally, a sys-tem with good corrosion resistance will show high resistance val-ues and lower capacitance values [54].
Fig. 9 shows the macrocell corrosion current determined frommacrocell corrosion measurements. After three cycles of exposure,the half-cell potential of the CC concrete system started to shoot upand reached up to �300 mVAg/AgCl indicating the severe corrosionof the anode. However, all the rebars embedded in modified con-crete systems retained the passive condition-indicating the effectof mineral additions and supplementary cementitious materialsin improving the corrosion resistance of the reinforcement. Fig. 9also shows that the macrocell current was high for CC specimensat the end of six exposure cycles; whereas, CFN and CFNI speci-mens showed negligiblemacrocell corrosion current up to 120 days(five cycles) of exposure. After five cycles of exposure, all the con-crete systems showed an increase in macrocell current. Further, oncompletion of six cycles of exposure, the rate of corrosion for CCand CF concrete specimens was found to be more than two timesthat of CFN and CFNI concrete specimens indicating the improvedcorrosion resistance of the embedded rebars in CFN and CFNIconcrete.
3.4. Measurement of pH and conductivity of the aqueous concretepowder solution
The level of alkalinity of concrete indicated by its pH valueinfluences the corrosion of reinforced concrete structures [85].The pH of OPC concrete usually lies between 12.5 and 13, but chlo-ride ingress into concrete results in a pH reduction due to the for-mation of hydrochloric acid [86]. Table 7 shows that the pH wasreduced by about 5–10% of the initial pH on all the specimens afterexposure. When the pH of concrete decreases, corrosion in rein-
Fig. 9. Variations in ASTM G109 macrocell current of the TMT rebars inside variousconcrete systems (CC, CF, CFN and CFNI) with exposure time.
11
forced concrete can occur at lower threshold chloride concentra-tions. A drop in the pH of concrete to values less than 11 nearthe vicinity of the rebars, result in the initiation of an active corro-sion process in the presence of even nearly zero ppm of chlorideions [85].
The addition of mineral admixtures resulted in the absorptionof calcium hydroxide (CH) due to the pozzolanic reaction. Cementhydration leads to the formation of CH in the concrete systemwhich improves the alkalinity of concrete [39]. Further, theamount of cement in concrete is reduced whenmineral admixturesare added as partial cement replacement materials. This results ina reduction in the amount of CH produced by the cement hydrationprocess. The reduction in pH leads to the destruction of the passivelayer over the metal surface which in turn increases the rate of cor-rosion. However, all the specimens had pH more than 11, andhence steel bars were passivated. The least reduction of pH inCFN and CFNI contributes to the improved corrosion resistance ofthe reinforcements.
It could be seen from Table 7 that the free chloride contents inCC specimens are the highest (7.751 g/L) and the least in CFNIspecimens (0.984 g/L). The chloride contents in CFN and CF con-crete systems are 1.370 g/L and 3.799 g/L, respectively. This indi-cates that CFNI has the highest chloride binding capacity andmost of the chlorides are in bound form rather than in free form.Therefore, the presence of free chlorides adversely affects the rein-forcements in the concrete structures. Many researchers reportedthat the addition of the supplementary cementitious materialsresults in a significantly higher reduction in the permeability ofconcrete due to their pozzolanic reaction which leads to lowingress of deleterious chloride ions [87,88]. On addition to cement,CaCO3 nanoparticles react with the aluminium oxides present incement and form carboaluminate hydrates, besides acceleratingC3S and C3A hydration [89]. The increased C3A content reducesthe free chloride concentration in the concrete pore solution andforms a dense structure where the ionic transport is minimal asthe diffusion of chloride ions depends on the permeability [90].Thus, in CFN and CFNI concretes the chlorides are present in thebound form of Friedel’s salt.
Femenias et al. [91] developed a novel methodology to simulta-neously monitor the pH of the concrete pore solution and free chlo-ride concentration and reported that both these parameters arehighly relevant to the corrosion control of the reinforcing steel. Itis known that the risk of corrosion increases with the increasedratio of chloride to hydroxyl ion concentrations (Cl�/OH�). Thus,it is highly important to obtain data on chloride concentrationand pH when steel rebars are embedded in concrete. In this study,the CFNI concrete specimens showed a comparatively lower reduc-tion in pH values (5.55%) and the low free chloride concentration(0.984 g/L).
Table 7 shows that the conductivity value is the highest for CCspecimens (3140 ms/cm) and the lowest for CFNI specimens(1364 ms/cm). This indicates the presence of more free chlorideions in CC as compared to CFNI. Higher conductivity leads to ahigher cathodic reaction rate that can result in accelerated corro-sion. The low conductivity of CFNI specimens is found to be dueto the reduced permeability in these specimens owing to the loww/c ratio and the refined pore structure [39].
3.5. Morphological and chemical characterization of the corrodedconcrete-steel interface
3.5.1. FESEM analysis and elemental mappingFig. 10 shows the FESEM images indicating the surface topogra-
phy of the powders extracted from the corroded concrete-steelinterface of all four types of concrete systems after 180 days ofexposure in a 3.5% NaCl solution. The surface of the CC concrete

Table 7pH, conductivity and free chloride contents for all concrete systems after exposure in 3.5% NaCl solution for 180 days.
Type of specimen pH reduction in pH (%) Conductivity (ms/cm) Free chloride content (g/L)
Initial Final
CC 12.9 12.2 5.42 3140 7.751CF 12.1 11.1 8.26 2260 3.799CFN 12.7 11.8 7.08 1640 1.370CFNI 12.6 11.9 5.55 1364 0.984
Fig. 10. FESEM topographies of the powders extracted from the concrete- steel interface for all specimens after 180 days of exposure in 3.5% NaCl solution (a) CC (b) CF (c)CFN and (d) CFNI.
M. Harilal, D.K. Kamde, S. Uthaman et al. Construction and Building Materials 274 (2021) 122097
showed the presence of more micropores and macropores thanthat on other concrete specimens, indicating severe corrosion(Fig. 10a). Calcium hydroxide (CH) crystals produced from thehydration of cement can also be seen in the Figure. The calcium sil-icate hydrate (CSH) gel formation, resulting from the hydration inconcrete, is less on the surface of the CC concrete system. The pres-ence of pores and cracks are also visible over the surface of fly ashmodified CF concrete specimens (Fig. 10b). The surface of the CFNspecimen showed more CSH gel and CH content as a result of theadded nanomodifiers. No visible cracks or pores are observed onthe surface of CFN specimens (Fig. 10c). CFNI specimens showedthe presence of enhanced CH content and uniformly packed CSHgel resulting from the hydration process in concrete due to theinhibitor (Fig. 10d).
The elemental analysis of the powder samples extracted fromthe corroded concrete-steel interface is shown in Fig. 11. It canbe observed that the Fe and O contents were more on the CC andCF concrete systems indicating more corrosion in these specimens.In all the concrete systems, except the CF system, Ca and Si con-tents were predominant due to the enhanced hydration process.However, the CF specimen was depleted of Ca (Fig. 11f) which isreported to be one of the disadvantages of using fly ash as a
12
replacement material [27]. The Fe and O content in both CFN andCFNI specimens were found to be less as compared to CC and CFspecimens, indicating the improvement in the corrosion resistancein these specimens. The elemental mapping of the corrodedextracts confirmed the enhancement in the corrosion propertiesdue to the addition of nanomodifiers and inhibitor.
3.5.2. XRD analysisFig. 12 shows the X-ray diffraction spectra of the powder sam-
ples extracted from the corroded concrete-steel interface of all thefour concrete systems after 180 days of exposure in a 3.5% NaClsolution. The peaks corresponding to the hydration products inconcrete, such as quartz and CSH were present in the spectra ofall the concretes. Among all the systems, CFNI specimens showedthe highest intensity peaks of both quartz and CSH, indicatingthe superior properties of this composition. A high amount ofSiO2 accelerates the secondary hydration reaction leading to theformation of more CSH gel, which reduces the permeability andporosity of concrete. This, in turn, reduces the ingress and diffusionof the chloride ions into the specimens through the pores and thusreduces the corrosion rate of the embedded steel reinforcement[16].

Fig. 11. Elemental mapping of the concrete-steel interface for all specimens after 180 days of exposure in 3.5% NaCl solution (a-d) CC (e-h) CF (i-l) CFN and (m-p) CFNI. Theimages are taken on a scale of 2.5 mm.
Fig. 12. X-ray Diffraction spectra of the concrete specimens surrounding the corroded rebar after 180 days of exposure in 3.5% NaCl solution (a) CC (b) CF (c) CFN and (d) CFNI.
M. Harilal, D.K. Kamde, S. Uthaman et al. Construction and Building Materials 274 (2021) 122097
13

M. Harilal, D.K. Kamde, S. Uthaman et al. Construction and Building Materials 274 (2021) 122097
The spectra of all the systems showed some peaks of ferriteresulting from the mild steel rebar. The corrosion products likelepidocrocite, goethite (a –FeOOH), wustite and magnetite wereidentified in the spectra of all the concrete systems. It is reportedthat both lepidocrocite and goethite produce the highest volumeexpansion ratio, which can result in cracking of the concrete spec-imens [92]. Further, a ferrous hydroxychloride phase (Fe(OH)3Cl),which is an intermediate phase to akaganeite was also identifiedin all the spectra [93]. Among all the specimens, the intensitiesof the peaks corresponding to the corrosion products were thehighest in CC specimens (Fig. 12a). CF specimens showed a reduc-tion in the intensities and the number of peaks of corrosion prod-ucts from what is observed for CC specimens. The least number ofpeaks with the lower intensities of corrosion products are observedin CFNI and CFN specimens.
3.5.3. Thermogravimetric analysis – chloride binding capacity and pHFig. 13 shows the results of the thermogravimetric analysis car-
ried out on powder samples extracted from the near vicinity of thecorroded concrete-steel interface after 180 days of exposure in theelectrolyte. The DTG curves of the powdered samples are shown inFig. 13a. Similar DTG curves were reported by Shi et al. [68], inwhich three endothermic peaks corresponding to mass losses areobserved on heating from room temperature to 1200 �C, i.e., C-S-H (30–230 �C), CH (410–520 �C) and CaCO3 (520–760 �C). The Fri-del’s salt profile and the endothermic peak corresponding to theformation of Friedel’s salt [68] were compared with the DTG curveobtained in this study to confirm its presence. The shoulder repre-senting the formation of Friedel’s salt showed the maximum inten-
Fig. 13. (a) DTG curves of the powdered samples from the concrete-steel interface (b) mestimated amount of Friedel’s salt and portlandite from TGA analysis of the concrete-st
14
sity for CFNI specimen and the lowest intensity for CC specimen.This indicates the presence of more bound chlorides in the CFNIconcrete system. The peak corresponding to CH is seen predomi-nant in all the concrete specimens, indicating high alkalinity. Theformation of CaCO3, corresponding to the the extent of carbonationprocess in the concrete specimens is also compared. It is observedthat CF specimens showed the highest carbonation as reported inthe previous study [39].
The amount of Friedel’s salt in concrete gives an idea about thechloride binding capacity of concrete. Fig. 13b shows that the massloss due to the formation of Friedel’s salt is found to be the highestin CFNI specimens (2.38%), indicating the presence of a surplusamount of bound chloride with less amount of free chlorides. Frie-del’s salt formation is found to be the minimum (1.62%) in CC spec-imens. CF and CFN specimens showed a mass loss of 1.69 and1.84%, respectively indicating their improved chloride bindingcapacity as compared to the control specimens. The thermogravi-metric analysis was also used to estimate the portlandite content,which indicates the alkalinity of the concrete specimen after expo-sure in 3.5% NaCl solution and is shown in Fig. 13b. CC specimensshowed the highest mass loss of 0.82% and CF specimens showedthe least mass loss of 0.57%. The mass loss in CFN and CFNI speci-mens are 0.61 and 0.72%, respectively. These results show that theaddition of fly ash has resulted in the consumption of Ca(OH)2 in CFspecimens.
The amount of Friedel’s salt and portlandite estimated using theabove method is described in section 3.7.3 and is shown in Fig. 13c.The Friedel’s salt content was found to be the highest in CFNI spec-imens (12.36 wt%) and the lowest in CC specimens (8.41 wt%). Frie-
ass loss due to the formation of Friedel’s salt and decomposition of portlandite (c)eel interface after 180 days of exposure in 3.5% NaCl solution.

M. Harilal, D.K. Kamde, S. Uthaman et al. Construction and Building Materials 274 (2021) 122097
del’s salt content of CF and CFN specimens are 8.78 and 9.56 wt%,respectively. The thermogravimetric analysis of the corrodedconcrete-steel interface indicated the presence of more Friedel’ssalt, due to the presence of more bound chlorides in CFNI speci-mens. The presence of free chlorides is detrimental to the rein-forcements inside the concrete structures. If chloride ions arepresent in the bound form, the process of corrosion initiation willbe delayed. These results are consistent with the observations offree chloride contents in Table 7.
The estimated portlandite content is shown in Fig. 13c. CC spec-imens showed the highest Ca(OH)2 content of 3.36 wt%, owing tothe more amount of cement per unit volume and CF specimensshowed the lowest Ca(OH)2 content of 2.33 wt%. The addition ofnanoparticles and inhibitor to fly ash admixed concrete improvedthe Ca(OH)2 content in CFN (2.46 wt%) and CFNI (2.88 wt%) speci-mens, which resulted in high pH value in these specimens as com-pared to CF specimens. This is in good agreement with the pHmeasurements. Thus, thermogravimetric analysis helped to estab-lish the increased corrosion resistance of CFNI concrete in a highlychloride environment.
3.5.4. FTIR spectroscopic measurementsFTIR spectra of the powder samples extracted from the corroded
concrete-steel interface of all the four concrete systems are shownin Fig. 14. The peaks corresponding to the main corrosion productof mild steel (lepidocrocite), was found in the spectra of all foursamples at 1035 cm�1 [94]. However, in the case of the CC powdersample (Fig. 14a), an additional peak at 874 cm�1 corresponding tolepidocrocite was also observed. The peak at 774 cm�1 correspond-ing to goethite, a transformed form of lepidocrocite was alsoobserved in the spectra of all the powder samples [95]. The inten-sities of the peaks corresponding to both lepidocrocite and goethitewere the maximum in the case of CC specimens, indicating severecorrosion in these specimens. Both CFN and CFNI specimensshowed less intense peaks of lepidocrocite and goethite, due tothe improved corrosion resistance.
The peak at 1436 cm�1 corresponds to the asymmetric stretch-ing vibrations of carbonate ions, which was present in all the pow-der samples, indicating the carbonation in these specimens [96]. Ahigh intense peak at 1634 cm�1 in CC specimens is attributed tothe water molecules in the powder samples [97]. The narrowabsorption band at 3642 cm�1 corresponds to the stretching modeof O–H from Ca(OH)2 in all the powder samples [98]. Both CC and
Fig. 14. FTIR spectra of the concrete-steel interface after 180 days of exposure in3.5% NaCl solution (a) CC (b) CF (C) CFN and (d) CFNI.
15
CFNI specimens showed comparatively higher intensity peaks of(OH)-, which is also reflected in the pH values in these specimens.Thus, the high pH and fewer corrosion products in CFNI specimensconfirm its superior corrosion resistance.
3.6. Estimation of service life
Fig. 15 shows the Cumulative Distribution Function (CDF) of tifor the girder element for all the four concrete mixes. A 50% prob-ability of initiation of corrosion was considered to be failure crite-ria which decide the end of service life. The ti for CC and CFconcrete compositions was found to 25 and 35 years, respectively.However, the bridge girder with CFN and CFNI concrete composi-tions were found to have a service life of approximately 75 and150 years, respectively, which is about three and six times longerthan that of CC. Considering the design life, CFNI type of concretecompositions can meet the requirement for the long service lifeof marine infrastructure. This can be attributed to the closelypacked microstructure and reduced apparent diffusion coefficientof CFNI concrete. This suggests that ternary blends can enhancethe service life of RC structures significantly.
Harilal et al. [39] have previously reported that the incorpora-tion of fly ash, nanoparticles and sodium nitrite based corrosioninhibitor into conventional concrete can greatly enhance the chlo-ride ion penetration resistance of concrete. This was evident fromthe low RCPT values, improved time to cracking and the reducedmaximum anodic current seen in this concrete composition underaccelerated testing conditions. In the present study, even thoughthe addition of inhibitor improved the corrosion resistance bymany folds, the electrochemical measurements on the inhibitoradmixed concrete (CFNI) showed inferior properties than thenanoparticles admixed concrete (CFN). However, life predictionand other characterization data established the overall advantagesof CFNI concrete composition. OCP monitoring and LPR techniquesare considered as natural electrochemical experiments, whereasthe accelerated corrosion testing (ACT) method is used frequentlyto reduce the time taken for obtaining a critical level of chlorideson the surface of the reinforcement. In ACT test, CFNI showed thehighest corrosion resistance due to the combined action of npsand inhibitor [39].
Fig. 15. Cumulative distribution function of time to corrosion initiation vs age ofconcrete (years) for different concrete specimens.

M. Harilal, D.K. Kamde, S. Uthaman et al. Construction and Building Materials 274 (2021) 122097
It is possible that the addition of inhibitor and nanoparticlestogether may take comparatively longer exposure periods to real-ize their combined effect from electrochemical measurements. Acombination of fly ash and inhibitor alone is being attempted toestablish the individual effect of inhibitor in fly ash modifiedconcrete.
4. Conclusions
The combined effect of fly ash, nanoparticles, and inhibitor inenhancing the corrosion resistance of reinforcements embeddedinside a newly developed M45 grade concrete composition (CFNI)was investigated using chloride diffusion coefficients and electro-chemical measurements. The following conclusions were drawnfrom the present study:
1. The chloride concentrations on the surface of CFNI and CFN con-crete specimens were significantly higher than those on CC andCF specimens, indicating an improved chloride bindingcapacity.
2. The value of Dcl for CFNI concrete was found to be one order lessin magnitude than other concrete specimens, indicating theenhanced resistance against chloride attack.
3. The corrosion current density values of rebars embedded inCFNI and CFN test specimens showed values corresponding tothe low severity region, indicating the higher resistance to cor-rosion activities.
4. The average corrosion rates for all the modified concrete sys-tems determined using the LPR and gravimetric measurementsshow that that the use of fly ash, nanomaterials, inhibitors, or acombination of them can enhance the corrosion resistance of RCsystems.
5. From the EIS measurement results, the resistance of passivefilm of steel embedded in CFNI concrete is higher than the resis-tance of passive film of steel embedded in all other concretesystems. The conductivity measurements and free chloride con-tents also corroborated the EIS studies.
6. The FESEM images showed no micro cracks or pores over thesurface of CFNI and CFN specimens. The Fe and O content deter-mined through elemental mapping in both CFN and CFNI spec-imens were also found to be lower, indicating an improvedcorrosion resistance in these specimens.
7. The thermogravimetric analysis of the corroded concrete-steelinterface indicated the presence of more Friedel’s salt, whichresults from the presence of more bound chlorides in CFNIspecimens.
8. The probabilistic service life of the steel in concrete systems,estimated using the measured chloride diffusion coefficients,showed that the time to initiation of corrosion in CFNI speci-mens is six times higher than the control mix with OPC.
These results suggest that the CFNI type of concrete gives signif-icantly enhanced service life in aggressive marine environments.
CRediT authorship contribution statement
Manu Harilal: Conceptualization, Methodology, Software, Visu-alization, Writing - original draft. Deepak K. Kamde: Software,Visualization, Methodology, Investigation. Sudha Uthaman: Inves-tigation. R.P. George: Supervision, Writing - review & editing. Rad-hakrishna G. Pillai: Supervision, Writing - review & editing. JohnPhilip: Supervision, Writing - review & editing. Shaju.K. Albert:Supervision, Writing - review & editing.
16
Declaration of Competing Interest
The authors declare that they have no known competing finan-cial interests or personal relationships that could have appearedto influence the work reported in this paper.
Acknowledgements
The fellowship provided by DAE, Govt. of India for carrying outthis research is greatly acknowledged. The authors sincerelyacknowledge the Director, IGCAR and Dr. S. Raju, AD, MCG for theirsupport. Mr. Rathish.V. R. and Dr. M.S. Haji Sheik Mohammed areacknowledged for their extended help in providing laboratoryfacility for casting the specimens and Ms. Geetisubhra Jena,MMG, IGCAR for the useful technical discussions.
References
[1] K. Tamanna, S.N. Raman, M. Jamil, R. Hamid, Utilization of wood waste ash inconstruction technology: a review, Constr. Build. Mater. 237 (2020) 117654,https://doi.org/10.1016/j.conbuildmat.2019.117654.
[2] F.-C. Lo, S.-L. Lo, M.-G. Lee, Effect of partially replacing ordinary Portlandcement with municipal solid waste incinerator ashes and rice husk ashes onpervious concrete quality, Environ. Sci. Pollut. Res. 27 (19) (2020) 23742–23760, https://doi.org/10.1007/s11356-020-08796-z.
[3] E. Benhelal, A. Rafiei, E. Shamsaei, Green cement production: potentials andachievements, IJCEA (2012) 407–409, https://doi.org/10.7763/IJCEA.2012.V3.229.
[4] X. Chen, H. Wang, H. Najm, G. Venkiteela, J. Hencken, Evaluating engineeringproperties and environmental impact of pervious concrete with fly ash andslag, J. Cleaner Prod. 237 (2019) 117714, https://doi.org/10.1016/j.jclepro.2019.117714.
[5] M. Manera, Ø. Vennesland, L. Bertolini, Chloride threshold for rebar corrosionin concrete with addition of silica fume, Corros. Sci. 50 (2) (2008) 554–560,https://doi.org/10.1016/j.corsci.2007.07.007.
[6] M. Reiner, S.A. Durham, K.L. Rens, Development and analysis of high-performance green concrete in the urban infrastructure, Int. J. SustainableEng. 3 (3) (2010) 198–210, https://doi.org/10.1080/19397031003746662.
[7] I. Papanikolaou, N. Arena, A. Al-Tabbaa, Graphene nanoplatelet reinforcedconcrete for self-sensing structures – a lifecycle assessment perspective, J.Cleaner Prod. 240 (2019) 118202, https://doi.org/10.1016/j.jclepro.2019.118202.
[8] G. Koch, J.V.N. Thompson, O. Moghissi, M. Gould, J. Payer, Internationalmeasures of prevention, application, and economics of corrosion technologiesstudy, NACE International (2016) 1–30. http://impact.nace.org/documents/Nace-International-Report.pdf.
[9] M. Jin, S. Gao, L. Jiang, H. Chu, M. Lu, F.F. Zhi, Degradation of concrete withaddition of mineral admixture due to free chloride ion penetration under theeffect of carbonation, Corros. Sci. 138 (2018) 42–53, https://doi.org/10.1016/j.corsci.2018.04.004.
[10] J. Kline, B. Pesic, K. Raja, I. Ehrsam, Corrosion studies of rebar in contact withsaturated solution produced by leaching of Portland Type-II cement:examining the effects of chloride, carbonation and an amorphous silicaadditive, Corros. Eng., Sci. Technol. 53 (6) (2018) 431–443, https://doi.org/10.1080/1478422X.2018.1496219.
[11] R.B. Polder, W.H.A. Peelen, W.M.G. Courage, Non-traditional assessment andmaintenance methods for aging concrete structures – technical and non-technical issues: non-traditional assessment and maintenance methods,Mater. Corros. 63 (12) (2012) 1147–1153, https://doi.org/10.1002/maco.201206725.
[12] D. Joseline, D.K. Kamde, S. Rengaraju, R.G. Pillai, Residual Service LifeEstimation and its Importance for Pretensioned Concrete (PTC) Bridges inCoastal Cities, Sixth International Conference on Durability of ConcreteStructures. United Kingdom (2019) 800–806.
[13] D.K. Kamde, R.G. Pillai, Effect of surface preparation on corrosion of steelrebars coated with cement-polymer-composites (CPC) and embedded inconcrete, Constr. Build. Mater. 237 (2020) 117616, https://doi.org/10.1016/j.conbuildmat.2019.117616.
[14] J. Karuppanasamy, R.G. Pillai, A short-term test method to determine thechloride threshold of steel–cementitious systems with corrosion inhibitingadmixtures, Mater. Struct. 50 (4) (2017), https://doi.org/10.1617/s11527-017-1071-1.
[15] Y. Zhao, J. Dong, Y. Wu, H. Wang, X. Li, Q. Xu, Steel corrosion and corrosion-induced cracking in recycled aggregate concrete, Corros. Sci. 85 (2014) 241–250, https://doi.org/10.1016/j.corsci.2014.04.028.
[16] K. De Weerdt, B. Lothenbach, M.R. Geiker, Comparing chloride ingress fromseawater and NaCl solution in Portland cement mortar, Cem. Concr. Res. 115(2019) 80–89, https://doi.org/10.1016/j.cemconres.2018.09.014.
[17] S.-J. Kwon, H.-S. Lee, S. Karthick, V. Saraswathy, H.-M. Yang,Long-term corrosion performance of blended cement concrete in the marine
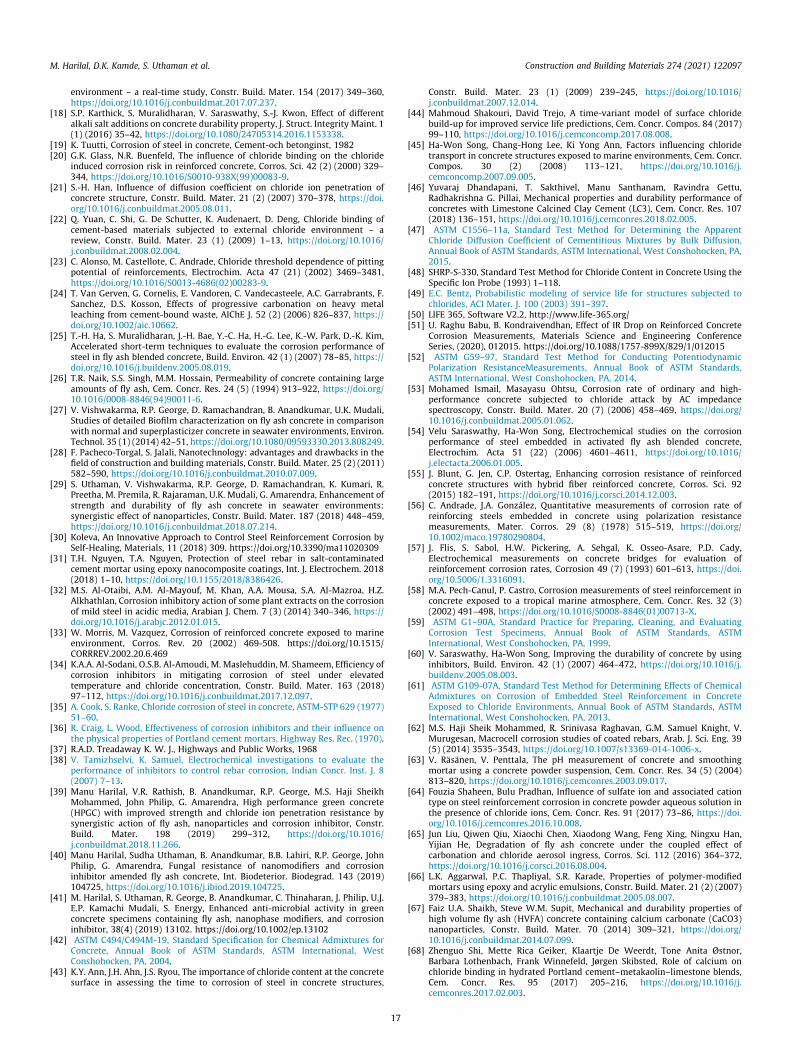
M. Harilal, D.K. Kamde, S. Uthaman et al. Construction and Building Materials 274 (2021) 122097
environment – a real-time study, Constr. Build. Mater. 154 (2017) 349–360,https://doi.org/10.1016/j.conbuildmat.2017.07.237.
[18] S.P. Karthick, S. Muralidharan, V. Saraswathy, S.-J. Kwon, Effect of differentalkali salt additions on concrete durability property, J. Struct. Integrity Maint. 1(1) (2016) 35–42, https://doi.org/10.1080/24705314.2016.1153338.
[19] K. Tuutti, Corrosion of steel in concrete, Cement-och betonginst, 1982[20] G.K. Glass, N.R. Buenfeld, The influence of chloride binding on the chloride
induced corrosion risk in reinforced concrete, Corros. Sci. 42 (2) (2000) 329–344, https://doi.org/10.1016/S0010-938X(99)00083-9.
[21] S.-H. Han, Influence of diffusion coefficient on chloride ion penetration ofconcrete structure, Constr. Build. Mater. 21 (2) (2007) 370–378, https://doi.org/10.1016/j.conbuildmat.2005.08.011.
[22] Q. Yuan, C. Shi, G. De Schutter, K. Audenaert, D. Deng, Chloride binding ofcement-based materials subjected to external chloride environment – areview, Constr. Build. Mater. 23 (1) (2009) 1–13, https://doi.org/10.1016/j.conbuildmat.2008.02.004.
[23] C. Alonso, M. Castellote, C. Andrade, Chloride threshold dependence of pittingpotential of reinforcements, Electrochim. Acta 47 (21) (2002) 3469–3481,https://doi.org/10.1016/S0013-4686(02)00283-9.
[24] T. Van Gerven, G. Cornelis, E. Vandoren, C. Vandecasteele, A.C. Garrabrants, F.Sanchez, D.S. Kosson, Effects of progressive carbonation on heavy metalleaching from cement-bound waste, AIChE J. 52 (2) (2006) 826–837, https://doi.org/10.1002/aic.10662.
[25] T.-H. Ha, S. Muralidharan, J.-H. Bae, Y.-C. Ha, H.-G. Lee, K.-W. Park, D.-K. Kim,Accelerated short-term techniques to evaluate the corrosion performance ofsteel in fly ash blended concrete, Build. Environ. 42 (1) (2007) 78–85, https://doi.org/10.1016/j.buildenv.2005.08.019.
[26] T.R. Naik, S.S. Singh, M.M. Hossain, Permeability of concrete containing largeamounts of fly ash, Cem. Concr. Res. 24 (5) (1994) 913–922, https://doi.org/10.1016/0008-8846(94)90011-6.
[27] V. Vishwakarma, R.P. George, D. Ramachandran, B. Anandkumar, U.K. Mudali,Studies of detailed Biofilm characterization on fly ash concrete in comparisonwith normal and superplasticizer concrete in seawater environments, Environ.Technol. 35 (1) (2014) 42–51, https://doi.org/10.1080/09593330.2013.808249.
[28] F. Pacheco-Torgal, S. Jalali, Nanotechnology: advantages and drawbacks in thefield of construction and building materials, Constr. Build. Mater. 25 (2) (2011)582–590, https://doi.org/10.1016/j.conbuildmat.2010.07.009.
[29] S. Uthaman, V. Vishwakarma, R.P. George, D. Ramachandran, K. Kumari, R.Preetha, M. Premila, R. Rajaraman, U.K. Mudali, G. Amarendra, Enhancement ofstrength and durability of fly ash concrete in seawater environments:synergistic effect of nanoparticles, Constr. Build. Mater. 187 (2018) 448–459,https://doi.org/10.1016/j.conbuildmat.2018.07.214.
[30] Koleva, An Innovative Approach to Control Steel Reinforcement Corrosion bySelf-Healing, Materials, 11 (2018) 309. https://doi.org/10.3390/ma11020309
[31] T.H. Nguyen, T.A. Nguyen, Protection of steel rebar in salt-contaminatedcement mortar using epoxy nanocomposite coatings, Int. J. Electrochem. 2018(2018) 1–10, https://doi.org/10.1155/2018/8386426.
[32] M.S. Al-Otaibi, A.M. Al-Mayouf, M. Khan, A.A. Mousa, S.A. Al-Mazroa, H.Z.Alkhathlan, Corrosion inhibitory action of some plant extracts on the corrosionof mild steel in acidic media, Arabian J. Chem. 7 (3) (2014) 340–346, https://doi.org/10.1016/j.arabjc.2012.01.015.
[33] W. Morris, M. Vazquez, Corrosion of reinforced concrete exposed to marineenvironment, Corros. Rev. 20 (2002) 469-508. https://doi.org/10.1515/CORRREV.2002.20.6.469
[34] K.A.A. Al-Sodani, O.S.B. Al-Amoudi, M. Maslehuddin, M. Shameem, Efficiency ofcorrosion inhibitors in mitigating corrosion of steel under elevatedtemperature and chloride concentration, Constr. Build. Mater. 163 (2018)97–112, https://doi.org/10.1016/j.conbuildmat.2017.12.097.
[35] A. Cook, S. Ranke, Chloride corrosion of steel in concrete, ASTM-STP 629 (1977)51–60.
[36] R. Craig, L. Wood, Effectiveness of corrosion inhibitors and their influence onthe physical properties of Portland cement mortars, Highway Res. Rec. (1970).
[37] R.A.D. Treadaway K. W. J., Highways and Public Works, 1968[38] V. Tamizhselvi, K. Samuel, Electrochemical investigations to evaluate the
performance of inhibitors to control rebar corrosion, Indian Concr. Inst. J. 8(2007) 7–13.
[39] Manu Harilal, V.R. Rathish, B. Anandkumar, R.P. George, M.S. Haji SheikhMohammed, John Philip, G. Amarendra, High performance green concrete(HPGC) with improved strength and chloride ion penetration resistance bysynergistic action of fly ash, nanoparticles and corrosion inhibitor, Constr.Build. Mater. 198 (2019) 299–312, https://doi.org/10.1016/j.conbuildmat.2018.11.266.
[40] Manu Harilal, Sudha Uthaman, B. Anandkumar, B.B. Lahiri, R.P. George, JohnPhilip, G. Amarendra, Fungal resistance of nanomodifiers and corrosioninhibitor amended fly ash concrete, Int. Biodeterior. Biodegrad. 143 (2019)104725, https://doi.org/10.1016/j.ibiod.2019.104725.
[41] M. Harilal, S. Uthaman, R. George, B. Anandkumar, C. Thinaharan, J. Philip, U.J.E.P. Kamachi Mudali, S. Energy, Enhanced anti-microbial activity in greenconcrete specimens containing fly ash, nanophase modifiers, and corrosioninhibitor, 38(4) (2019) 13102. https://doi.org/10.1002/ep.13102
[42] ASTM C494/C494M-19, Standard Specification for Chemical Admixtures forConcrete, Annual Book of ASTM Standards, ASTM International, WestConshohocken, PA, 2004.
[43] K.Y. Ann, J.H. Ahn, J.S. Ryou, The importance of chloride content at the concretesurface in assessing the time to corrosion of steel in concrete structures,
17
Constr. Build. Mater. 23 (1) (2009) 239–245, https://doi.org/10.1016/j.conbuildmat.2007.12.014.
[44] Mahmoud Shakouri, David Trejo, A time-variant model of surface chloridebuild-up for improved service life predictions, Cem. Concr. Compos. 84 (2017)99–110, https://doi.org/10.1016/j.cemconcomp.2017.08.008.
[45] Ha-Won Song, Chang-Hong Lee, Ki Yong Ann, Factors influencing chloridetransport in concrete structures exposed to marine environments, Cem. Concr.Compos. 30 (2) (2008) 113–121, https://doi.org/10.1016/j.cemconcomp.2007.09.005.
[46] Yuvaraj Dhandapani, T. Sakthivel, Manu Santhanam, Ravindra Gettu,Radhakrishna G. Pillai, Mechanical properties and durability performance ofconcretes with Limestone Calcined Clay Cement (LC3), Cem. Concr. Res. 107(2018) 136–151, https://doi.org/10.1016/j.cemconres.2018.02.005.
[47] ASTM C1556–11a, Standard Test Method for Determining the ApparentChloride Diffusion Coefficient of Cementitious Mixtures by Bulk Diffusion,Annual Book of ASTM Standards, ASTM International, West Conshohocken, PA,2015.
[48] SHRP-S-330, Standard Test Method for Chloride Content in Concrete Using theSpecific Ion Probe (1993) 1–118.
[49] E.C. Bentz, Probabilistic modeling of service life for structures subjected tochlorides, ACI Mater. J. 100 (2003) 391–397.
[50] LIFE 365, Software V2.2, http://www.life-365.org/[51] U. Raghu Babu, B. Kondraivendhan, Effect of IR Drop on Reinforced Concrete
Corrosion Measurements, Materials Science and Engineering ConferenceSeries, (2020), 012015. https://doi.org/10.1088/1757-899X/829/1/012015
[52] ASTM G59–97, Standard Test Method for Conducting PotentiodynamicPolarization ResistanceMeasurements, Annual Book of ASTM Standards,ASTM International, West Conshohocken, PA, 2014.
[53] Mohamed Ismail, Masayasu Ohtsu, Corrosion rate of ordinary and high-performance concrete subjected to chloride attack by AC impedancespectroscopy, Constr. Build. Mater. 20 (7) (2006) 458–469, https://doi.org/10.1016/j.conbuildmat.2005.01.062.
[54] Velu Saraswathy, Ha-Won Song, Electrochemical studies on the corrosionperformance of steel embedded in activated fly ash blended concrete,Electrochim. Acta 51 (22) (2006) 4601–4611, https://doi.org/10.1016/j.electacta.2006.01.005.
[55] J. Blunt, G. Jen, C.P. Ostertag, Enhancing corrosion resistance of reinforcedconcrete structures with hybrid fiber reinforced concrete, Corros. Sci. 92(2015) 182–191, https://doi.org/10.1016/j.corsci.2014.12.003.
[56] C. Andrade, J.A. González, Quantitative measurements of corrosion rate ofreinforcing steels embedded in concrete using polarization resistancemeasurements, Mater. Corros. 29 (8) (1978) 515–519, https://doi.org/10.1002/maco.19780290804.
[57] J. Flis, S. Sabol, H.W. Pickering, A. Sehgal, K. Osseo-Asare, P.D. Cady,Electrochemical measurements on concrete bridges for evaluation ofreinforcement corrosion rates, Corrosion 49 (7) (1993) 601–613, https://doi.org/10.5006/1.3316091.
[58] M.A. Pech-Canul, P. Castro, Corrosion measurements of steel reinforcement inconcrete exposed to a tropical marine atmosphere, Cem. Concr. Res. 32 (3)(2002) 491–498, https://doi.org/10.1016/S0008-8846(01)00713-X.
[59] ASTM G1–90A, Standard Practice for Preparing, Cleaning, and EvaluatingCorrosion Test Specimens, Annual Book of ASTM Standards, ASTMInternational, West Conshohocken, PA, 1999.
[60] V. Saraswathy, Ha-Won Song, Improving the durability of concrete by usinginhibitors, Build. Environ. 42 (1) (2007) 464–472, https://doi.org/10.1016/j.buildenv.2005.08.003.
[61] ASTM G109-07A, Standard Test Method for Determining Effects of ChemicalAdmixtures on Corrosion of Embedded Steel Reinforcement in ConcreteExposed to Chloride Environments, Annual Book of ASTM Standards, ASTMInternational, West Conshohocken, PA, 2013.
[62] M.S. Haji Sheik Mohammed, R. Srinivasa Raghavan, G.M. Samuel Knight, V.Murugesan, Macrocell corrosion studies of coated rebars, Arab. J. Sci. Eng. 39(5) (2014) 3535–3543, https://doi.org/10.1007/s13369-014-1006-x.
[63] V. Räsänen, V. Penttala, The pH measurement of concrete and smoothingmortar using a concrete powder suspension, Cem. Concr. Res. 34 (5) (2004)813–820, https://doi.org/10.1016/j.cemconres.2003.09.017.
[64] Fouzia Shaheen, Bulu Pradhan, Influence of sulfate ion and associated cationtype on steel reinforcement corrosion in concrete powder aqueous solution inthe presence of chloride ions, Cem. Concr. Res. 91 (2017) 73–86, https://doi.org/10.1016/j.cemconres.2016.10.008.
[65] Jun Liu, Qiwen Qiu, Xiaochi Chen, Xiaodong Wang, Feng Xing, Ningxu Han,Yijian He, Degradation of fly ash concrete under the coupled effect ofcarbonation and chloride aerosol ingress, Corros. Sci. 112 (2016) 364–372,https://doi.org/10.1016/j.corsci.2016.08.004.
[66] L.K. Aggarwal, P.C. Thapliyal, S.R. Karade, Properties of polymer-modifiedmortars using epoxy and acrylic emulsions, Constr. Build. Mater. 21 (2) (2007)379–383, https://doi.org/10.1016/j.conbuildmat.2005.08.007.
[67] Faiz U.A. Shaikh, Steve W.M. Supit, Mechanical and durability properties ofhigh volume fly ash (HVFA) concrete containing calcium carbonate (CaCO3)nanoparticles, Constr. Build. Mater. 70 (2014) 309–321, https://doi.org/10.1016/j.conbuildmat.2014.07.099.
[68] Zhenguo Shi, Mette Rica Geiker, Klaartje De Weerdt, Tone Anita Østnor,Barbara Lothenbach, Frank Winnefeld, Jørgen Skibsted, Role of calcium onchloride binding in hydrated Portland cement–metakaolin–limestone blends,Cem. Concr. Res. 95 (2017) 205–216, https://doi.org/10.1016/j.cemconres.2017.02.003.
M. Harilal, D.K. Kamde, S. Uthaman et al. Construction and Building Materials 274 (2021) 122097
[69] Taehwan Kim, Jan Olek, Effects of sample preparation and interpretation ofthermogravimetric curves on calcium hydroxide in hydrated pastes andmortars, Transp. Res. Rec. 2290 (1) (2012) 10–18, https://doi.org/10.3141/2290-02.
[70] Zhenguo Shi, Mette Rica Geiker, Barbara Lothenbach, Klaartje De Weerdt,Sergio Ferreiro Garzón, Kasper Enemark-Rasmussen, Jørgen Skibsted, Friedel’ssalt profiles from thermogravimetric analysis and thermodynamic modellingof Portland cement-based mortars exposed to sodium chloride solution, Cem.Concr. Compos. 78 (2017) 73–83, https://doi.org/10.1016/j.cemconcomp.2017.01.002.
[71] Sripriya Rengaraju, Lakshman Neelakantan, Radhakrishna G. Pillai,Investigation on the polarization resistance of steel embedded in highlyresistive cementitious systems – An attempt and challenges, Electrochim. Acta308 (2019) 131–141, https://doi.org/10.1016/j.electacta.2019.03.200.
[72] Radhakrishna G. Pillai, Ravindra Gettu, Manu Santhanam, Sripriya Rengaraju,Yuvaraj Dhandapani, Sundar Rathnarajan, Anusha S. Basavaraj, Service life andlife cycle assessment of reinforced concrete systems with limestone calcinedclay cement (LC3), Cem. Concr. Res. 118 (2019) 111–119, https://doi.org/10.1016/j.cemconres.2018.11.019.
[73] ASTM C876-09, Standard Test Method for Corrosion Potentials of UncoatedReinforcing Steel in Concrete, Annual Book of ASTM Standards, ASTMInternational, West Conshohocken, PA (2009)
[74] R. Vedalakshmi, L. Balamurugan, V. Saraswathy, S. -H. Kim, K.Y. Ann, Reliabilityof Galvanostatic Pulse Technique in assessing the corrosion rate of rebar inconcrete structures: Laboratory vs field studies, KSCE J. Civ. Eng. 14 (6) (2010)867–877, https://doi.org/10.1007/s12205-010-1023-6.
[75] Xiaoyan Liu, Lei Chen, Aihua Liu, Xinrui Wang, Effect of nano-CaCO3 onproperties of cement paste, Energy Procedia 16 (2012) 991–996, https://doi.org/10.1016/j.egypro.2012.01.158.
[76] M.M. Sadawy, E. Elsharkawy, Effect of nano-TiO2 addition on mechanicalproperties of concrete and corrosion behavior of reinforcement bars, IJERA 6(2016) 61–65.
[77] Tuan Anh Nguyen, The Huyen Nguyen, Thi Lua Pham, Thi Mai Thanh Dinh,Hoang Thai, Xianming Shi, Application of nano-SiO 2 and nano-Fe 2 O 3 forprotection of steel rebar in chloride contaminated concrete: epoxynanocomposite coatings and nano-modified mortars, J. Nanosci.Nanotechnol. 17 (1) (2017) 427–436, https://doi.org/10.1166/jnn.2017.12396.
[78] B. Bavarian, L. Reiner, The Efficacy of using Migrating Corrosion Inhibitors (MCI2020 & MCI 2020M) for Reinforced Concrete, 2004
[79] C. Andrade, M.C. Alonso, J.A. Gonzalez, An initial effort to use the corrosion ratemeasurements for estimating rebar durability, Corrosion rates of steel inconcrete, ASTM International, 1990. https://doi.org/10.1520/STP25013S
[80] T. Frølund, F.M. Jensen, R. Bassler, Determination of reinforcement corrosionrate by means of the galvanostatic pulse technique, First InternationalConference on Bridge Maintenance, Safety and Management IABMAS (2002).
[81] I. García-Lodeiro, A. Palomo, A. Fernández-Jiménez, Alkali–aggregate reactionin activated fly ash systems, Cem. Concr. Res. 37 (2) (2007) 175–183, https://doi.org/10.1016/j.cemconres.2006.11.002.
[82] D.M. Bastidas, A. Fernández-Jiménez, A. Palomo, J.A. González, A study on thepassive state stability of steel embedded in activated fly ash mortars, Corros.Sci. 50 (4) (2008) 1058–1065, https://doi.org/10.1016/j.corsci.2007.11.016.
[83] Yuvaraj Dhandapani, Manu Santhanam, Assessment of pore structureevolution in the limestone calcined clay cementitious system and itsimplications for performance, Cem. Concr. Compos. 84 (2017) 36–47,https://doi.org/10.1016/j.cemconcomp.2017.08.012.
18
[84] Lipika Rani Bairi, R.P. George, U. Kamachi Mudali, Microbially inducedcorrosion of D9 stainless steel–zirconium metal waste form alloy undersimulated geological repository environment, Corros. Sci. 61 (2012) 19–27,https://doi.org/10.1016/j.corsci.2012.04.019.
[85] Ali Behnood, Kim Van Tittelboom, Nele De Belie, Methods for measuring pH inconcrete: a review, Constr. Build. Mater. 105 (2016) 176–188, https://doi.org/10.1016/j.conbuildmat.2015.12.032.
[86] Florian Deschner, Frank Winnefeld, Barbara Lothenbach, Sebastian Seufert,Peter Schwesig, Sebastian Dittrich, Friedlinde Goetz-Neunhoeffer, JürgenNeubauer, Hydration of Portland cement with high replacement by siliceousfly ash, Cem. Concr. Res. 42 (10) (2012) 1389–1400, https://doi.org/10.1016/j.cemconres.2012.06.009.
[87] Ana María Aguirre-Guerrero, Ruby Mejía-de-Gutiérrez, Maria João RibeiroMontês-Correia, Corrosion performance of blended concretes exposed todifferent aggressive environments, Constr. Build. Mater. 121 (2016) 704–716,https://doi.org/10.1016/j.conbuildmat.2016.06.038.
[88] C. Arya, Y. Xu, Effect of cement type on chloride binding and corrosion of steelin concrete, Cem. Concr. Res. 25 (4) (1995) 893–902, https://doi.org/10.1016/0008-8846(95)00080-V.
[89] Barbara Lothenbach, Gwenn Le Saout, Emmanuel Gallucci, Karen Scrivener,Influence of limestone on the hydration of Portland cements, Cem. Concr. Res.38 (6) (2008) 848–860, https://doi.org/10.1016/j.cemconres.2008.01.002.
[90] S.E. Hussain, S. Al-Saadoun, Effect of tricalcium aluminate content of cementon chloride binding corrosion of reinforcing steel in concrete, ACI Mater. J. 89(1993) 3–12.
[91] Y.S. Femenias, U. Angst, F. Moro, B. Elsener, Development of a novelmethodology to assess the corrosion threshold in concrete based onsimultaneous monitoring of pH and free chloride concentration, Sensors 18(9) (2018) 3101, https://doi.org/10.3390/s18093101.
[92] Agustín Sánchez-Deza, David M. Bastidas, Angel La Iglesia, Jose-María Bastidas,A simple thermodynamic model on the cracking of concrete due to rustformed after casting, ACMM 64 (3) (2017) 335–339, https://doi.org/10.1108/ACMM-11-2015-1602.
[93] S. Reguer, P. Dillmann, F. Mirambet, J. Susini, P. Lagarde, Investigation of Clcorrosion products of iron archaeological artefacts using micro-focusedsynchrotron X-ray absorption spectroscopy, Appl. Phys. A 83 (2) (2006) 189–193, https://doi.org/10.1007/s00339-006-3506-3.
[94] S. Li, Marine atmospheric corrosion initiation and corrosion productscharacterization, Doctoral dissertation, University of Hawaii at Manoa, 2010.http://hdl.handle.net/10125/101922
[95] M. Ishii, M. Nakahira, T. Yamanaka, Infrared absorption spectra and cationdistributions in (Mn, Fe)3O4, Solid State Commun. 11 (1) (1972) 209–212,https://doi.org/10.1016/0038-1098(72)91162-3.
[96] F. Zhu, D. Persson, D. Thierry, C. Taxen, Formation of corrosion products onopen and confined zinc surfaces exposed to periodic wet/dry conditions,Corrosion 56 (12) (2000) 1256–1265, https://doi.org/10.5006/1.3280514.
[97] Shengxi Li, L.H. Hihara, Aerosol salt particle deposition on metals exposed tomarine environments: a study related to marine atmospheric corrosion, J.Electrochem. Soc. 161 (5) (2014) C268–C275, https://doi.org/10.1149/2.071405jes.
[98] M. Khachani, A. El Hamidi, M. Halim, S. Arsalane, Non-isothermal kinetic andthermodynamic studies of the dehydroxylation process of synthetic calciumhydroxide Ca (OH) 2, J Mater Environ Sci 5 (2014) 615–624.