The Chinese model: Towards the end of producer-biased … · The Chinese model: Towards the end of...
41
The Chinese model: Towards the end of The Chinese model: Towards the end of producer producer - - biased and export biased and export - - led growth? led growth? Ettore Dorrucci European Central Bank (Deputy Head, International Policy Analysis Division) Workshop “The Chinese Economy”, co Workshop “The Chinese Economy”, co - - organised by organised by Banca Banca d’Italia d’Italia and Venice International University and Venice International University (Venice, 25 (Venice, 25 - - 27 November 2010) 27 November 2010)
Transcript of The Chinese model: Towards the end of producer-biased … · The Chinese model: Towards the end of...
The Chinese model: Towards the end of The Chinese model: Towards the end of producerproducer--biased and exportbiased and export--led growth?led growth?
Ettore DorrucciEuropean Central Bank (Deputy Head, International Policy Analysis Division)
Workshop “The Chinese Economy”, coWorkshop “The Chinese Economy”, co--organised by organised by BancaBanca
d’Italiad’Italia
and Venice International Universityand Venice International University
(Venice, 25(Venice, 25--27 November 2010)27 November 2010)
Outline
1
Part 1 – The current Chinese model:
Sustained growth Sustained growth cumcum imbalancesimbalances
Part 2 – Longer-term sustainability of the current model:
Are the longAre the long--term factors supporting China’s model running out? term factors supporting China’s model running out? Will this “force” adjustment towards more sustainable growth?Will this “force” adjustment towards more sustainable growth?
Part 3 – What is being done do adjust the model:
The thorny way to rebalancingThe thorny way to rebalancing
Part 4 – Current contradictions in the adjustment of the model:
Tensions between shortTensions between short--term growth objectives and rebalancing needsterm growth objectives and rebalancing needs
Part 1 – The current Chinese model:
Sustained growth Sustained growth cumcum imbalancesimbalances
Key proposition:In the past three decades, China’s policy-makers have had incentives to maximise growth while postponing any fundamental adjustment in the associated economic model.
This has led to the accumulation of serious imbalances.
Part 1: Sustained growth cum imbalances 2
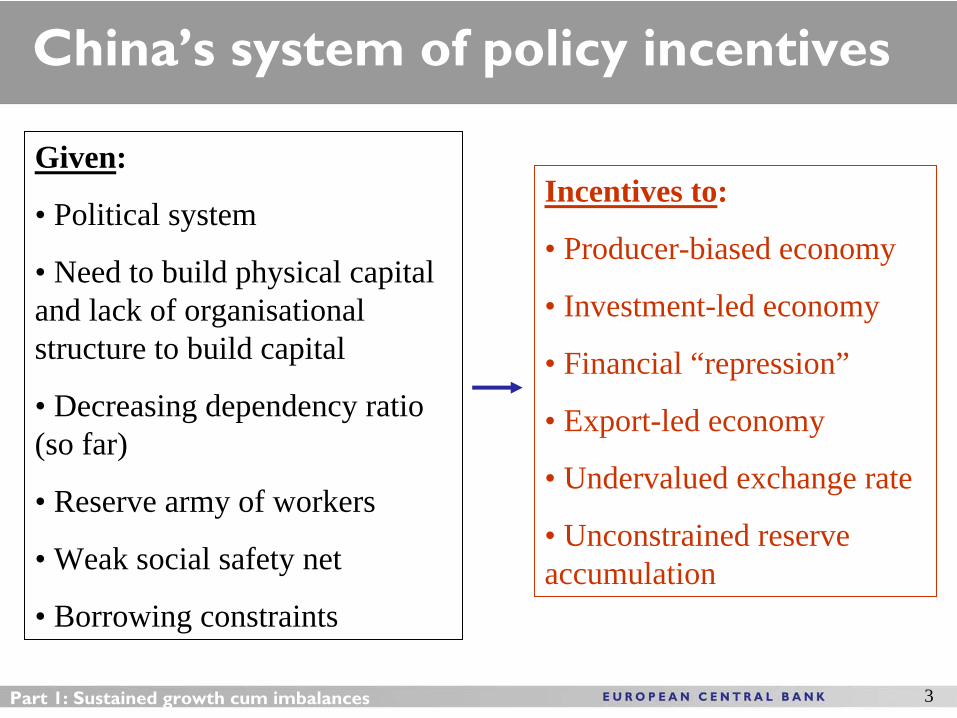
China’s system of policy incentives
Incentives to:
• Producer-biased economy
• Investment-led economy
• Financial “repression”
• Export-led economy
• Undervalued exchange rate
• Unconstrained reserve accumulation
Given:
• Political system
• Need to build physical capital and lack of organisational structure to build capital
• Decreasing dependency ratio (so far)
• Reserve army of workers
• Weak social safety net
• Borrowing constraints
Part 1: Sustained growth cum imbalances 3
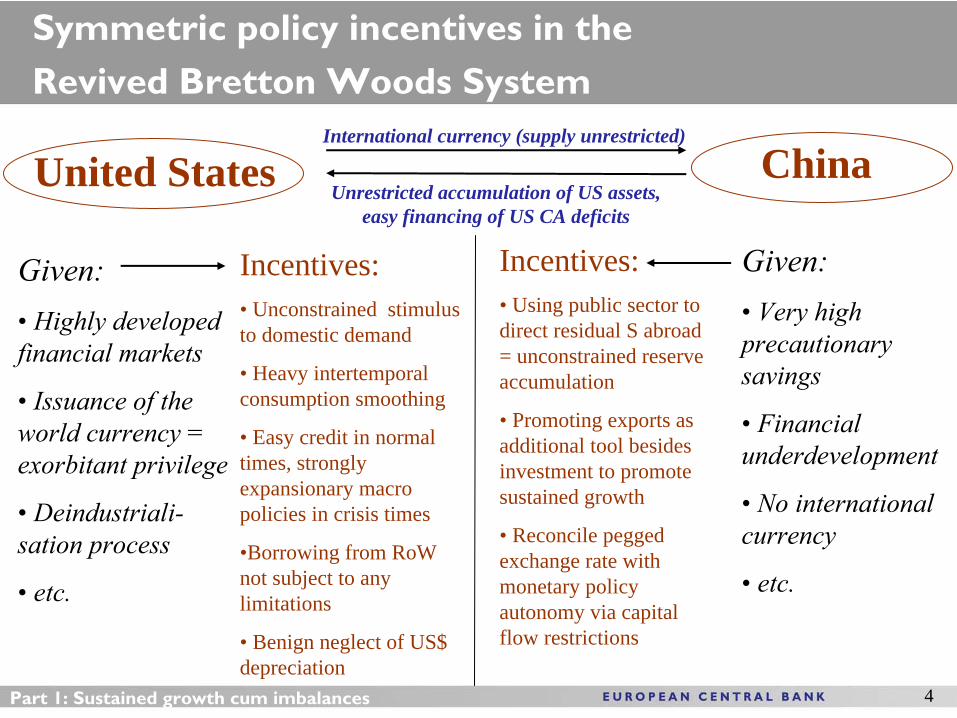
Part 1: Sustained growth cum imbalances 4
Symmetric policy incentives in the Revived Bretton
Woods System
United States ChinaInternational currency (supply unrestricted)
Given:• Highly developed financial markets
• Issuance of the world currency = exorbitant privilege
• Deindustriali- sation
process
• etc.
Incentives:• Unconstrained stimulus to domestic demand
• Heavy intertemporal consumption smoothing
• Easy credit in normal times, strongly expansionary macro policies in crisis times
•Borrowing from RoW not subject to any limitations
• Benign neglect of US$ depreciation
Given:• Very high precautionary savings
• Financial underdevelopment
• No international currency
• etc.
Incentives:• Using public sector to direct residual S abroad = unconstrained reserve accumulation
• Promoting exports as additional tool besides investment to promote sustained growth
• Reconcile pegged exchange rate with monetary policy autonomy via capital flow restrictions
Unrestricted accumulation of US assets, easy financing of US CA deficits
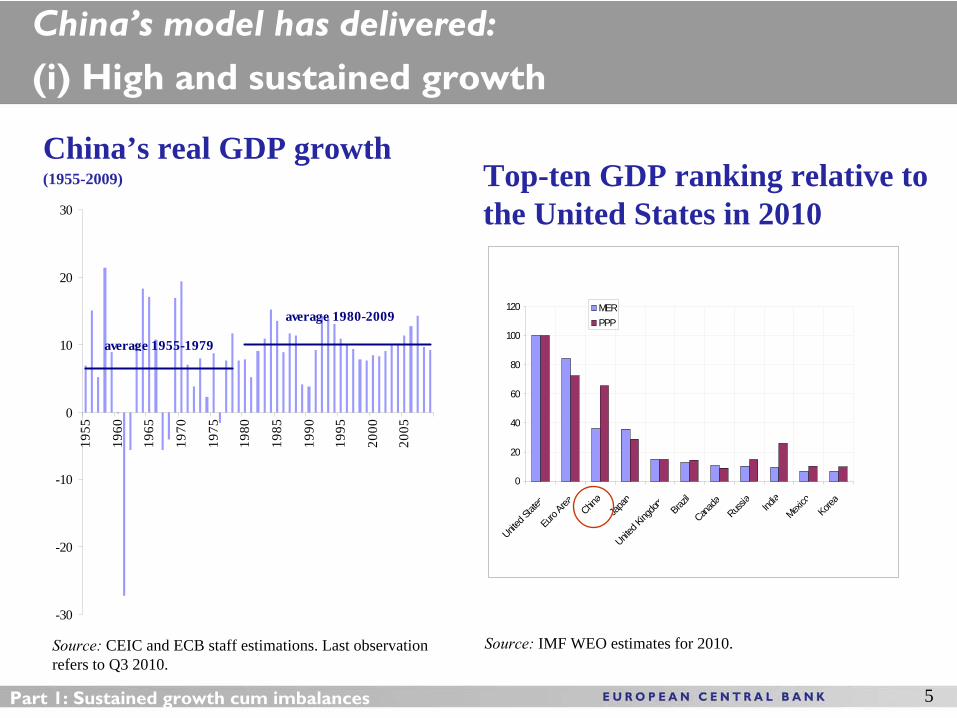
China’s model has delivered:
(i) High and sustained growth
5Part 1: Sustained growth cum imbalances
China’s real GDP growth(1955-2009)
Source: CEIC and ECB staff estimations. Last observation refers to Q3 2010.
0
20
40
60
80
100
120
United S
tates
Euro
Area China
Japan
United K
ingdom Braz
ilCana
daRuss
ia
India
Mexico
Korea
MERPPP
Top-ten GDP ranking relative to the United States in 2010
Source: IMF WEO estimates for 2010.
-30
-20
-10
0
10
20
30
1955
1960
1965
1970
1975
1980
1985
1990
1995
2000
2005
average 1955-1979
average 1980-2009
6Part 1: Sustained growth cum imbalances
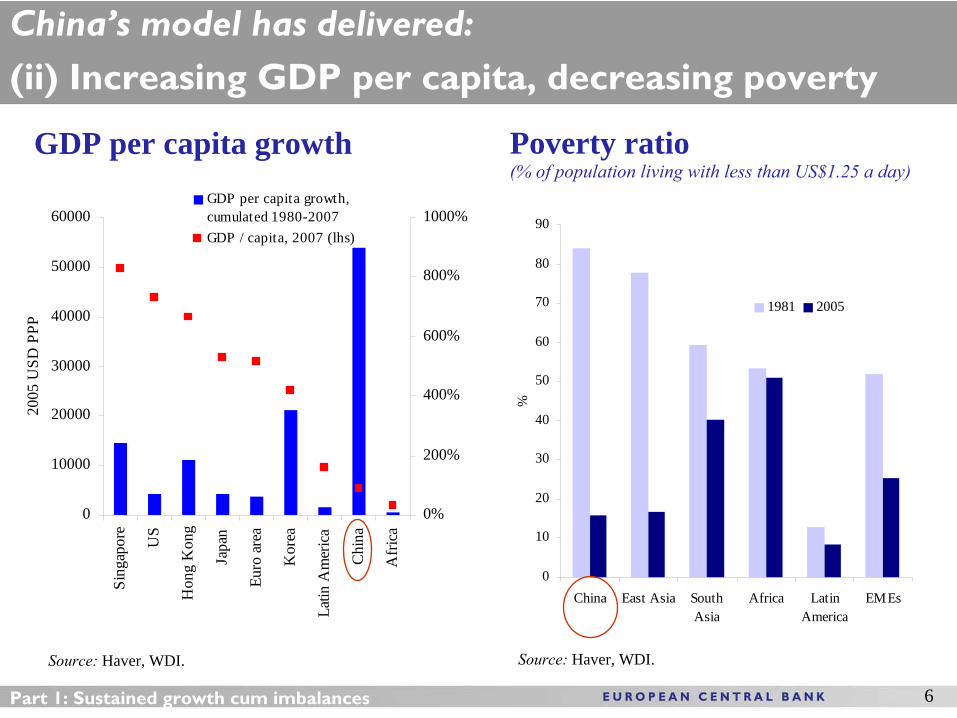
GDP per capita growth
Source: Haver, WDI.
Poverty ratio (% of population living with less than US$1.25 a day)
Source: Haver, WDI.
China’s model has delivered:
(ii) Increasing GDP per capita, decreasing poverty
0
10000
20000
30000
40000
50000
60000
Sing
apor
e
US
Hon
g K
ong
Japa
n
Euro
are
a
Kor
ea
Latin
Am
eric
a
Chi
na
Afr
ica
2005
USD
PPP
0%
200%
400%
600%
800%
1000%GDP per capita growth,cumulated 1980-2007GDP / capita, 2007 (lhs)
0
10
20
30
40
50
60
70
80
90
China East Asia SouthAsia
Africa LatinAmerica
EMEs
%
1981 2005
7Part 1: Sustained growth cum imbalances
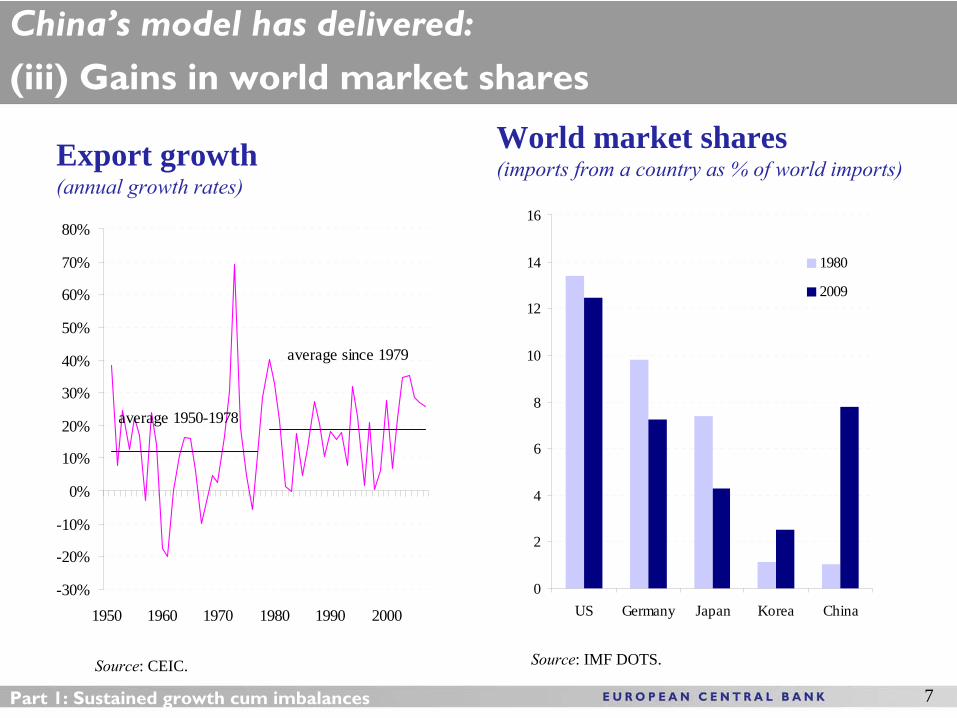
Export growth(annual growth rates)
Source: CEIC.
World market shares(imports from a country as % of world imports)
Source: IMF DOTS.
China’s model has delivered:
(iii) Gains in world market shares
-30%
-20%
-10%
0%
10%
20%
30%
40%
50%
60%
70%
80%
1950 1960 1970 1980 1990 2000
average 1950-1978
average since 1979
0
2
4
6
8
10
12
14
16
US Germany Japan Korea China
1980
2009
8Part 1: Sustained growth cum imbalances
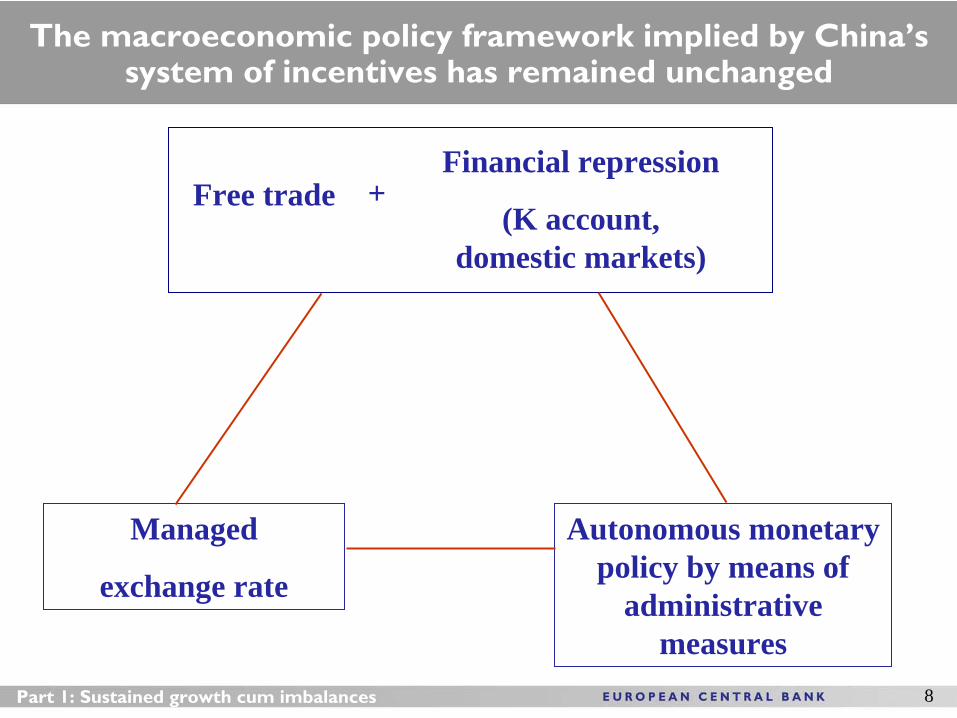
Managed
exchange rate
Free tradeFinancial repression
(K account, domestic markets)
Autonomous monetary policy by means of
administrative measures
+
The macroeconomic policy framework implied by China’s system of incentives has remained unchanged
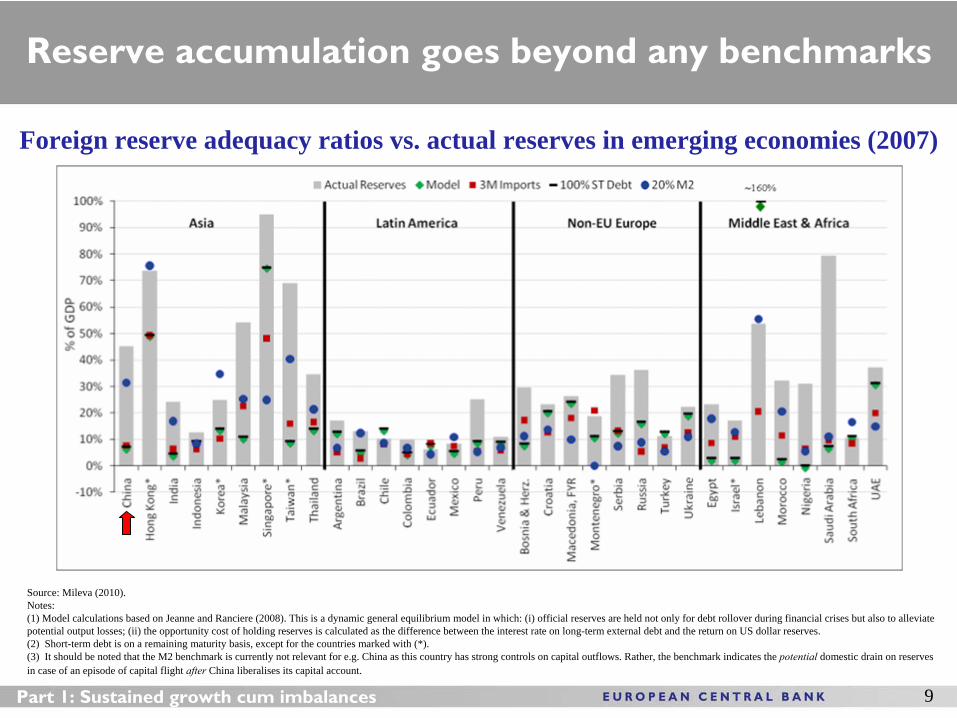
Reserve accumulation goes beyond any benchmarks
9
Foreign reserve adequacy ratios vs. actual reserves in emerging economies (2007)
Source: Mileva (2010).Notes: (1) Model calculations based on Jeanne and Ranciere (2008). This is a dynamic general equilibrium model in which: (i) official reserves are held not only for debt rollover during financial crises but also to alleviate potential output losses; (ii) the opportunity cost of holding reserves is calculated as the difference between the interest rate on long-term external debt and the return on US dollar reserves. (2) Short-term debt is on a remaining maturity basis, except for the countries marked with (*).(3) It should be noted that the M2 benchmark is currently not relevant for e.g. China as this country has strong controls on capital outflows. Rather, the benchmark indicates the potential
domestic drain on reserves in case of an episode of capital flight after
China liberalises its capital account.
Part 1: Sustained growth cum imbalances
10Part 1: Sustained growth cum imbalances
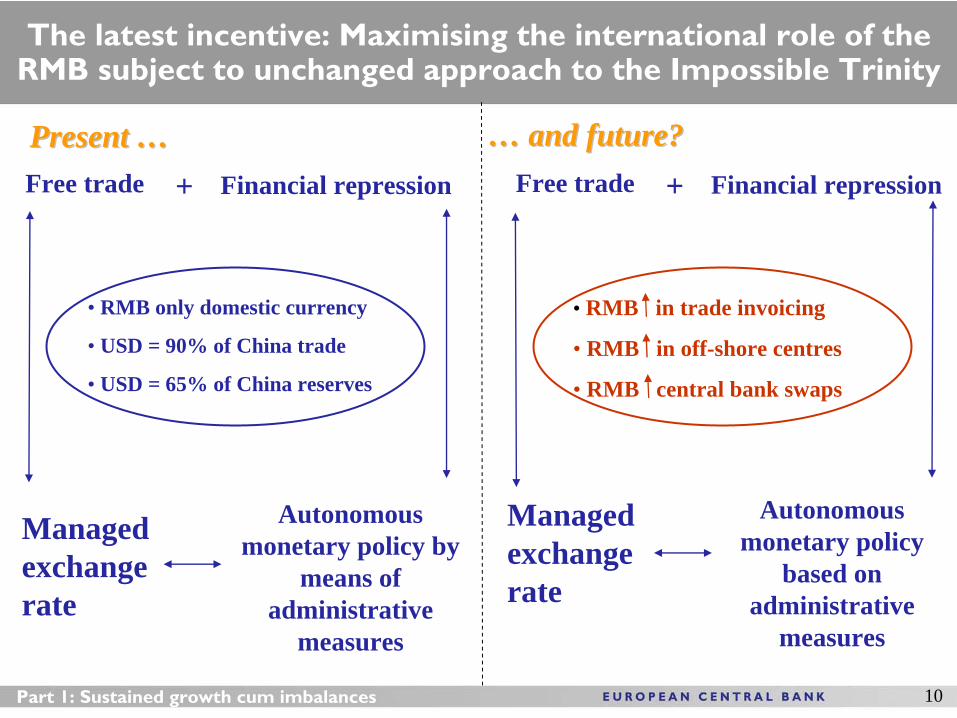
Managed exchange rate
Free trade Financial repression
Autonomous monetary policy by
means of administrative
measures
+
• RMB only domestic currency
• USD = 90% of China trade
• USD = 65% of China reserves
Autonomous monetary policy
based on administrative
measures
• RMB in trade invoicing
• RMB in off-shore centres
• RMB central bank swaps
The latest incentive: Maximising the international role of the RMB subject to unchanged approach to the Impossible Trinity
Managed exchange rate
Present …Present … …… and future?and future?Free trade Financial repression+
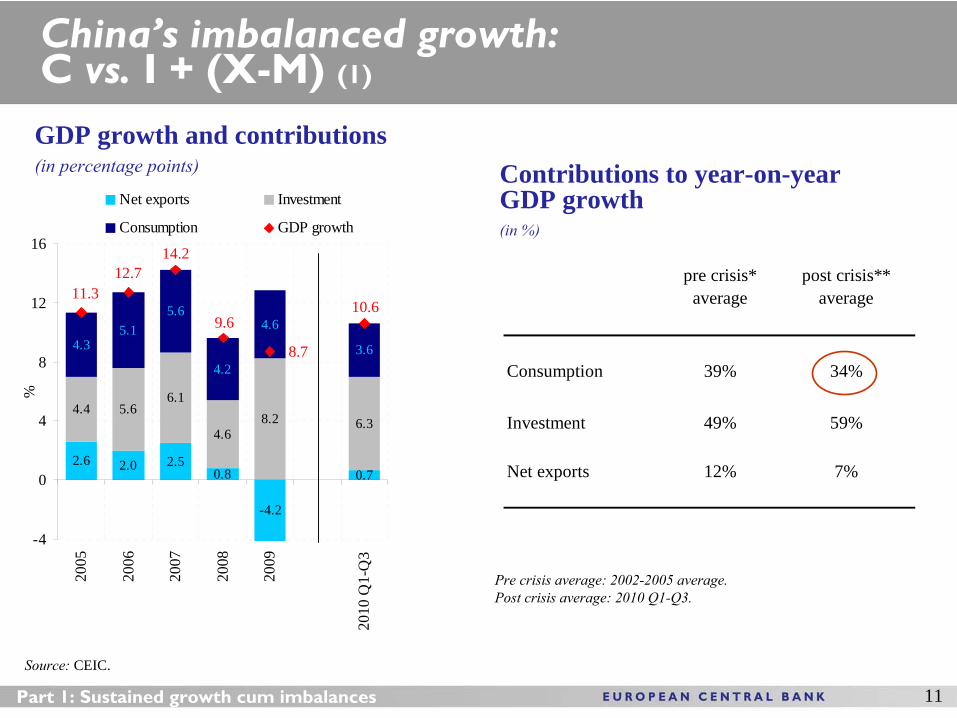
China’s imbalanced growth: C vs.
I + (X-M) (1)
11Part 1: Sustained growth cum imbalances
GDP growth and contributions(in percentage points)
Source: CEIC.
2.6 2.0 2.50.8
-4.2
0.7
4.4 5.66.1
4.68.2 6.3
4.35.1
5.6
4.2
4.6
3.6
10.6
8.7
9.6
14.212.7
11.3
-4
0
4
8
12
16
2005
2006
2007
2008
2009
2010
Q1-
Q3
%
Net exports Investment
Consumption GDP growth
Contributions to year-on-year GDP growth (in %)
pre crisis* average
post crisis** average
Consumption 39% 34%
Investment 49% 59%
Net exports 12% 7%
Pre crisis average: 2002-2005 average.Post crisis average: 2010 Q1-Q3.

China’s imbalanced growth: C vs.
I + (X-M) (2)
12Part 1: Sustained growth cum imbalances
Household consumption vs. investment: Shares in China and other EMEs(in % of GDP)
Source: WDI, CEIC.Last observation refers to 2009.
10
20
30
40
50
60
70
80
1980 1985 1990 1995 2000 2005 2010
China I shareEMEs (excl China) I shareChina C shareEMEs (excl China) C share
Shares in global consumption in 2009 (%)
Source: WDI and ECB Staff Calculations.
0
5
10
15
20
25
30
35
40
USEMEs
euro a
rea Japan UK
China
Brazil
Canada
Mexico
Russia
India
Korea
Turkey
Austral
iaInd
onesi
aArge
ntina
Market exchange rates PPP
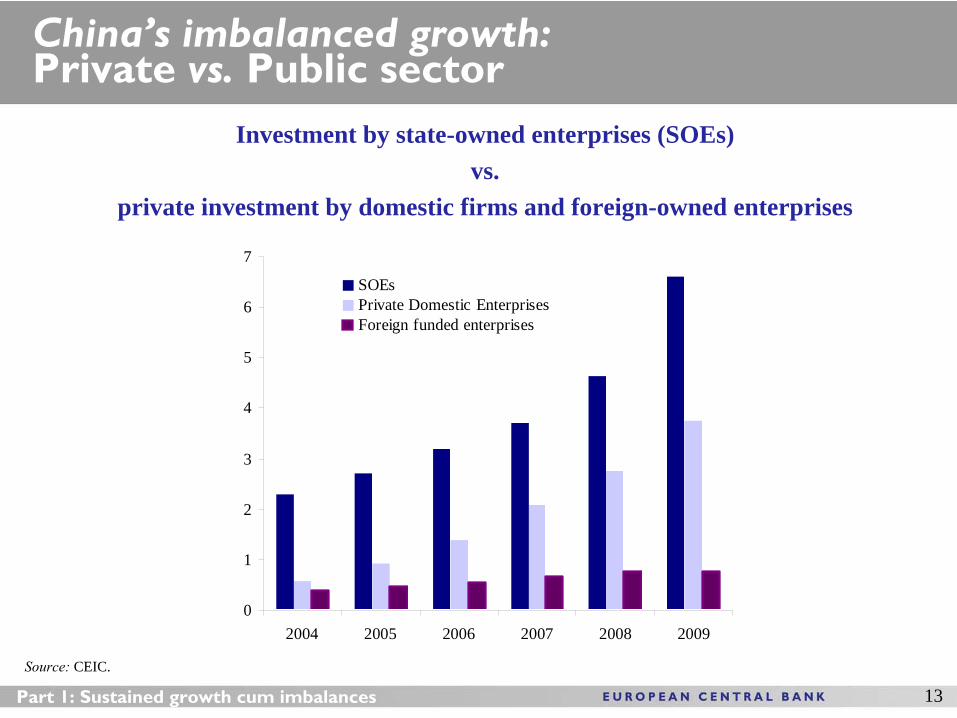
China’s imbalanced growth: Private vs.
Public sector
13Part 1: Sustained growth cum imbalances
Investment by state-owned enterprises (SOEs) vs.
private investment by domestic firms and foreign-owned enterprises(RMB trn)
Source: CEIC.
0
1
2
3
4
5
6
7
2004 2005 2006 2007 2008 2009
SOEsPrivate Domestic EnterprisesForeign funded enterprises
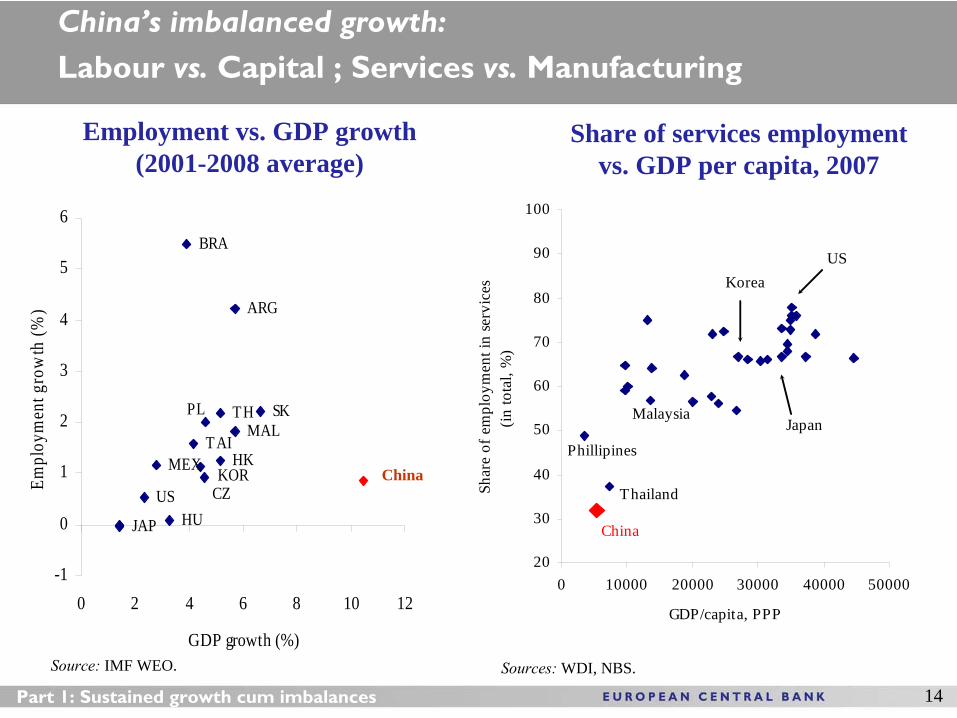
China’s imbalanced growth:
Labour vs.
Capital ; Services vs. Manufacturing
14
Employment vs. GDP growth (2001-2008 average)
CH
TH
HKKOR
MALTAI
ARG
BRA
MEX
JAP
CZHU
PL SK
US
-1
0
1
2
3
4
5
6
0 2 4 6 8 10 12
GDP growth (%)
Empl
oym
ent g
row
th (%
)
Source: IMF WEO.
China
20
30
40
50
60
70
80
90
100
0 10000 20000 30000 40000 50000
GDP/capita, PPP
Shar
e of
em
ploy
men
t in
serv
ices
(in
tota
l, %
)China
Korea
Japan
US
Thailand
Phillipines
Malaysia
Sources: WDI, NBS.
Share of services employment vs. GDP per capita, 2007
Part 1: Sustained growth cum imbalances
15
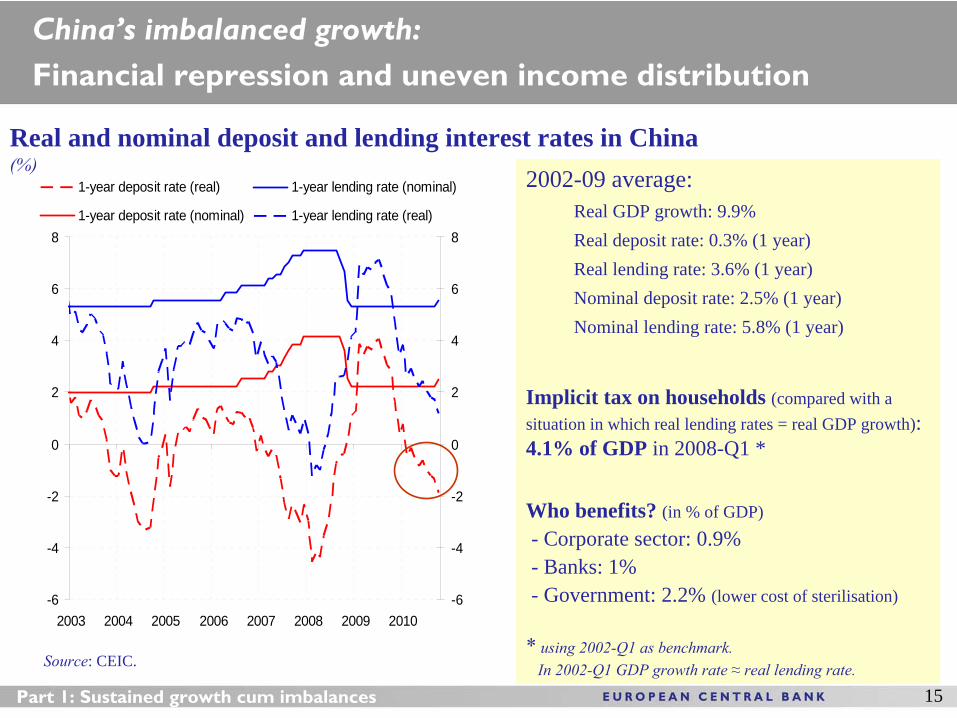
Real and nominal deposit and lending interest rates in China (%)
Source: CEIC.
2002-09 average: Real GDP growth: 9.9%Real deposit rate: 0.3% (1 year)Real lending rate: 3.6% (1 year)Nominal deposit rate: 2.5% (1 year)Nominal lending rate: 5.8% (1 year)
Implicit tax on households (compared with a situation in which real lending rates = real GDP growth): 4.1% of GDP in 2008-Q1 *
Who benefits? (in % of GDP)- Corporate sector: 0.9%- Banks: 1% - Government: 2.2% (lower cost of sterilisation)
*
using 2002-Q1 as benchmark. In 2002-Q1 GDP growth rate ≈
real lending rate.
China’s imbalanced growth:
Financial repression and uneven income distribution
Part 1: Sustained growth cum imbalances
-6
-4
-2
0
2
4
6
8
2003 2004 2005 2006 2007 2008 2009 2010-6
-4
-2
0
2
4
6
8
1-year deposit rate (real) 1-year lending rate (nominal)
1-year deposit rate (nominal) 1-year lending rate (real)
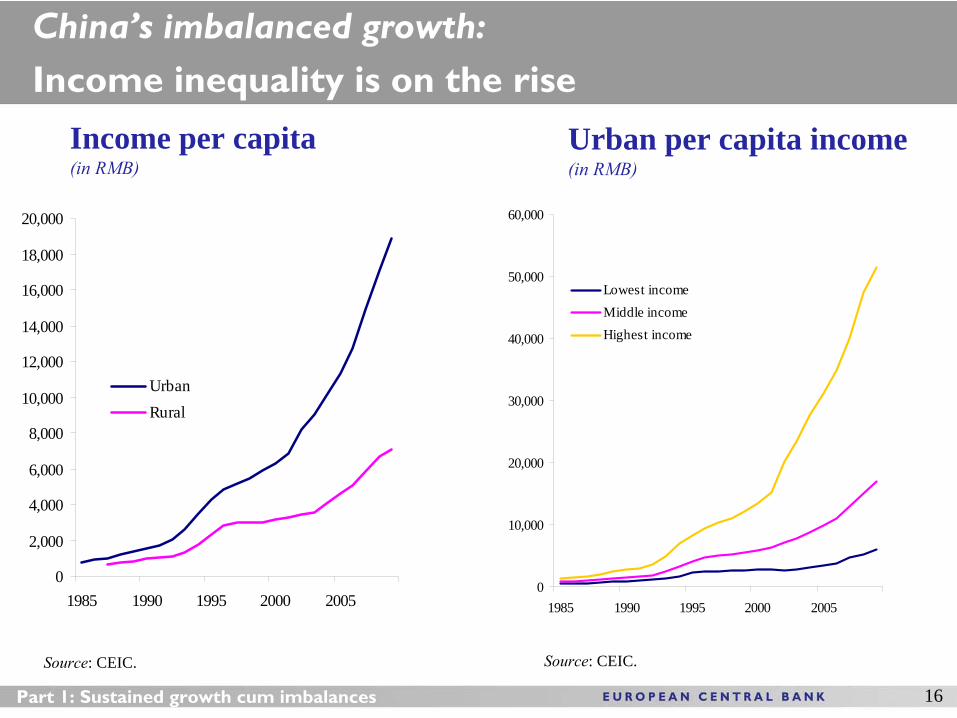
16
Urban per capita income(in RMB)
Source: CEIC.
China’s imbalanced growth:
Income inequality is on the rise
Part 1: Sustained growth cum imbalances
0
10,000
20,000
30,000
40,000
50,000
60,000
1985 1990 1995 2000 2005
Lowest incomeMiddle incomeHighest income
Income per capita(in RMB)
0
2,000
4,000
6,000
8,000
10,000
12,000
14,000
16,000
18,000
20,000
1985 1990 1995 2000 2005
UrbanRural
Source: CEIC.
Part 2 Part 2 –– LongerLonger--term sustainability of the current model:term sustainability of the current model:
Are the longAre the long--term factors supporting China’s model running out? term factors supporting China’s model running out? Will this “force” adjustment towards more sustainable growth?Will this “force” adjustment towards more sustainable growth?
Key proposition:
The main long-term factors making China’s growth model possible have been: (1) export demand; (2) demographic factors coupled with labour surplus in the primary sector; and (3) capital accumulation.
These factors have started running out, thus forcing adjustment.17Part 2: What longer-term developments could “force” adjustment?
18
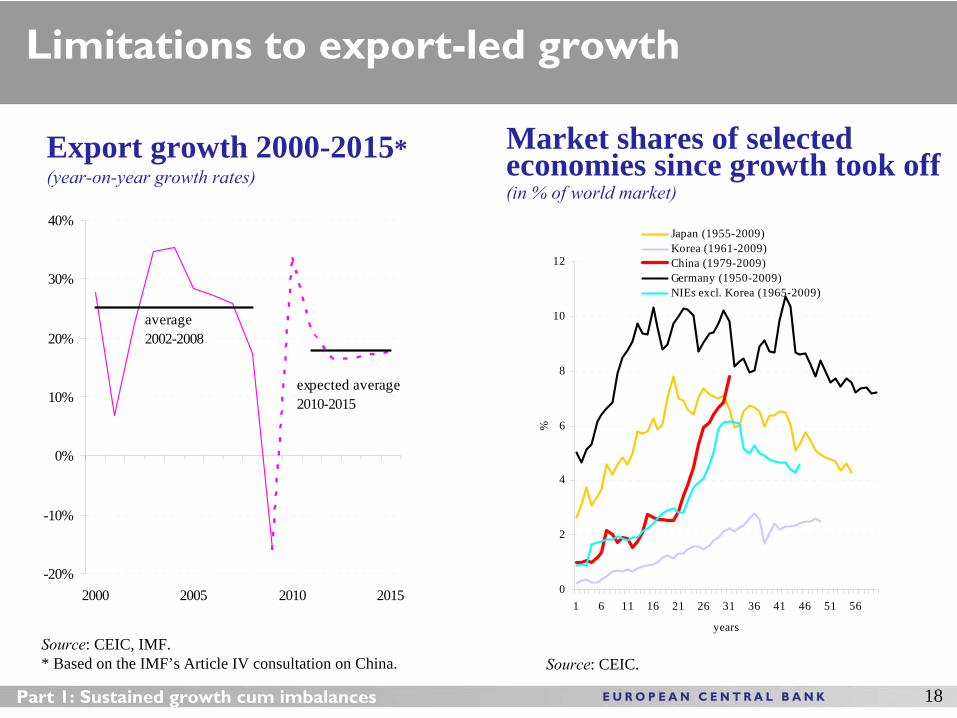
Export growth 2000-2015*(year-on-year growth rates)
Source: CEIC, IMF. * Based on the IMF’s Article IV consultation on China.
Limitations to export-led growth
Part 1: Sustained growth cum imbalances
Market shares of selected economies since growth took off(in % of world market)
Source: CEIC.
0
2
4
6
8
10
12
1 6 11 16 21 26 31 36 41 46 51 56
years
%
Japan (1955-2009)Korea (1961-2009)China (1979-2009)Germany (1950-2009)NIEs excl. Korea (1965-2009)
-20%
-10%
0%
10%
20%
30%
40%
2000 2005 2010 2015
average 2002-2008
expected average 2010-2015
19
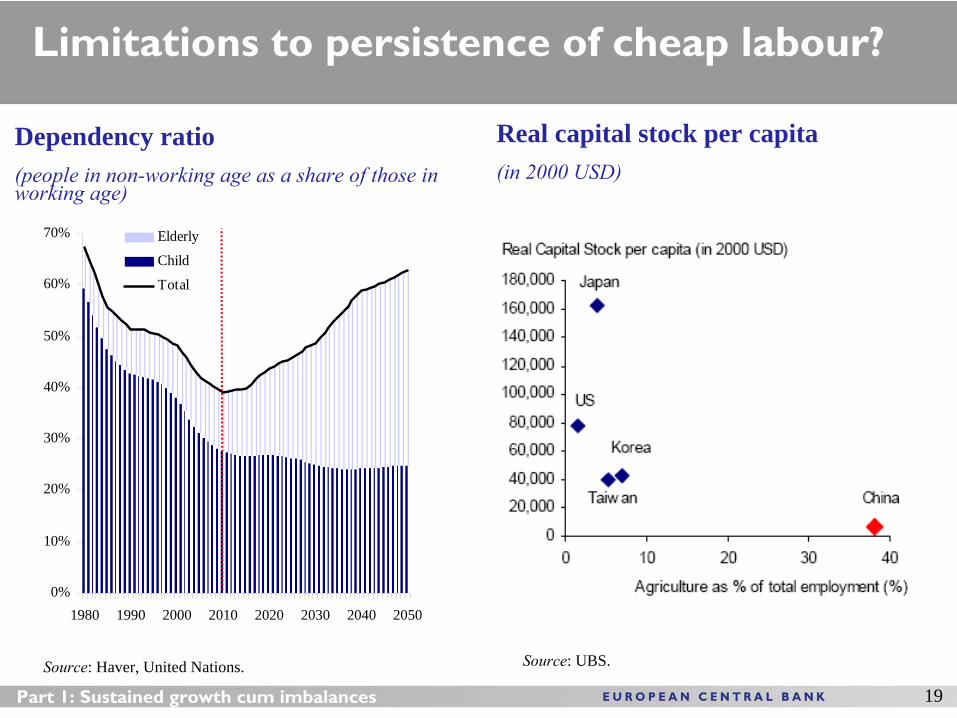
Real capital stock per capita (in 2000 USD)
Source: UBS.
Limitations to persistence of cheap labour?
Part 1: Sustained growth cum imbalances
Dependency ratio(people in non-working age as a share of those in working age)
Source: Haver, United Nations.
0%
10%
20%
30%
40%
50%
60%
70%
1980 1990 2000 2010 2020 2030 2040 2050
Elderly
Child
Total
20
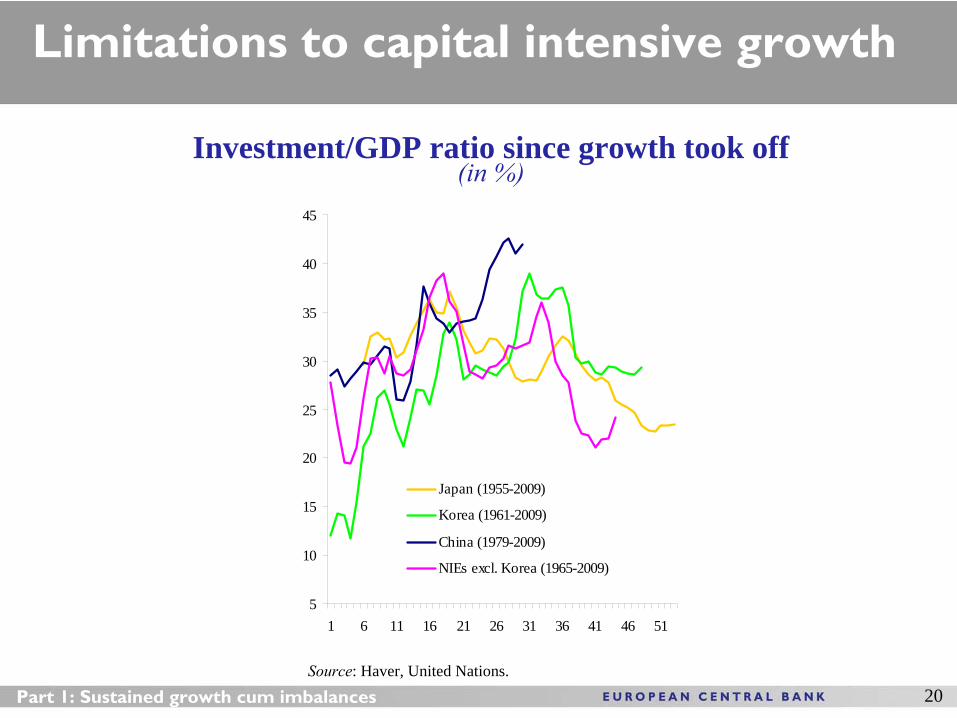
Limitations to capital intensive growth
Part 1: Sustained growth cum imbalances
Investment/GDP ratio since growth took off (in %)
Source: Haver, United Nations.
5
10
15
20
25
30
35
40
45
1 6 11 16 21 26 31 36 41 46 51
Japan (1955-2009)
Korea (1961-2009)
China (1979-2009)
NIEs excl. Korea (1965-2009)
21
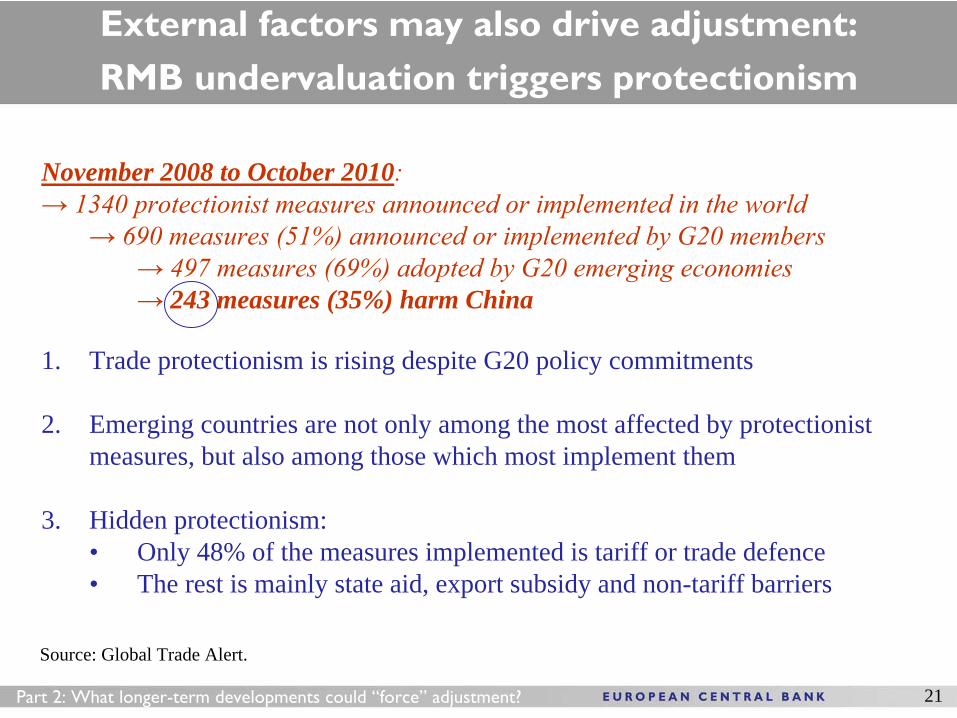
External factors may also drive adjustment:
RMB undervaluation triggers protectionism
November 2008 to October 2010: → 1340 protectionist measures announced or implemented in the world
→ 690 measures (51%) announced or implemented by G20 members→ 497 measures (69%) adopted by G20 emerging economies→ 243 measures (35%) harm China
1. Trade protectionism is rising despite G20 policy commitments
2. Emerging countries are not only among the most affected by protectionist measures, but also among those which most implement them
3. Hidden protectionism:• Only 48% of the measures implemented is tariff or trade defence• The rest is mainly state aid, export subsidy and non-tariff barriers
Source: Global Trade Alert.
Part 2: What longer-term developments could “force” adjustment?
Part 3 – What is being done do adjust the model:
The thorny way to rebalancingThe thorny way to rebalancing
Key proposition:Rebalancing is proceeding slowly, also because of policy resistance to change a model of growth that delivered for 30 years.
This may imply short-term advantages, but also longer-term risks given the fading away of longer-run supporting factors.
22
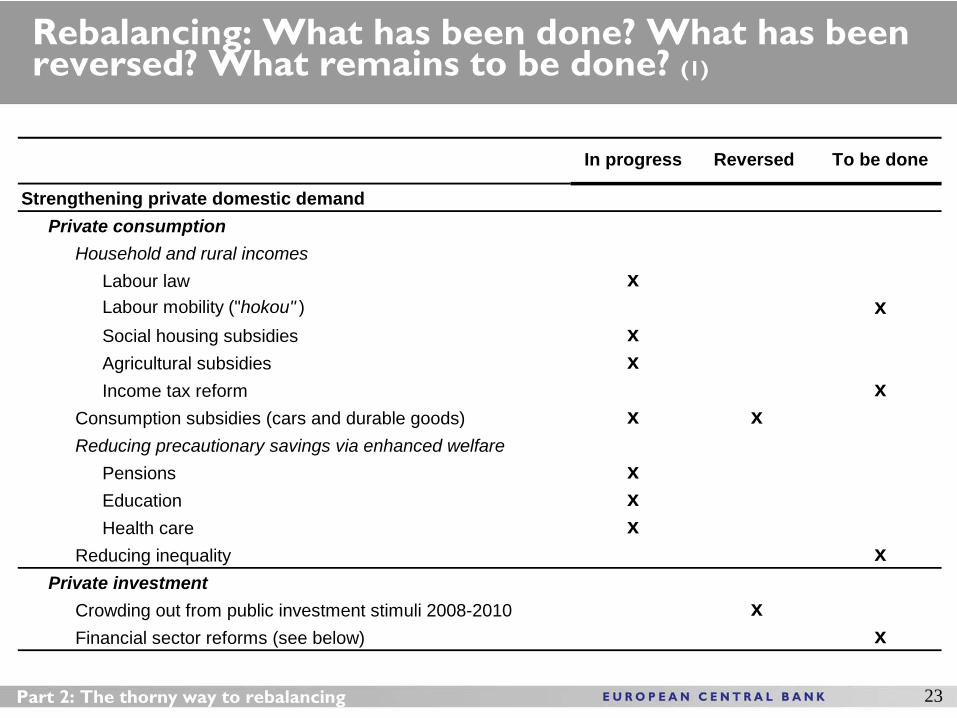
Rebalancing: What has been done? What has been reversed? What remains to be done? (1)
23Part 2: The thorny way to rebalancing
Strengthening private domestic demandPrivate consumption
Household and rural incomesLabour law xLabour mobility ("hokou" ) xSocial housing subsidies xAgricultural subsidies xIncome tax reform x
Consumption subsidies (cars and durable goods) x xReducing precautionary savings via enhanced welfare
Pensions xEducation xHealth care x
Reducing inequality xPrivate investment
Crowding out from public investment stimuli 2008-2010 xFinancial sector reforms (see below) x
In progress Reversed To be done
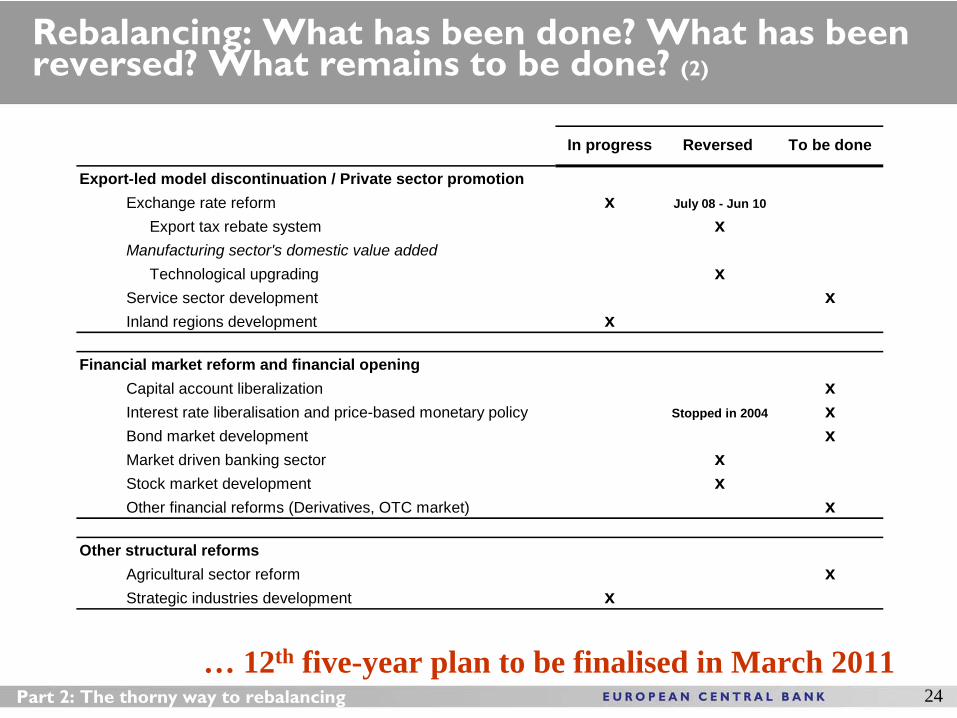
Rebalancing: What has been done? What has been reversed? What remains to be done? (2)
24Part 2: The thorny way to rebalancing
… 12th five-year plan to be finalised in March 2011
Export-led model discontinuation / Private sector promotionExchange rate reform x July 08 - Jun 10
Export tax rebate system xManufacturing sector's domestic value added
Technological upgrading xService sector development xInland regions development x
Financial market reform and financial openingCapital account liberalization xInterest rate liberalisation and price-based monetary policy Stopped in 2004 xBond market development xMarket driven banking sector xStock market development xOther financial reforms (Derivatives, OTC market) x
Other structural reformsAgricultural sector reform xStrategic industries development x
In progress Reversed To be done
Part 4 – Current contradictions in the adjustment of the model:
Tensions between Tensions between shortshort--term growth objectives and term growth objectives and
longerlonger--term rebalancing needsterm rebalancing needs
Key proposition:
Yes, there are tensions and contradictions, both on Yes, there are tensions and contradictions, both on (1) the external and (2) the domestic front.(1) the external and (2) the domestic front.
25
26Part 3: Tensions between short-term objectives and rebalancing needs
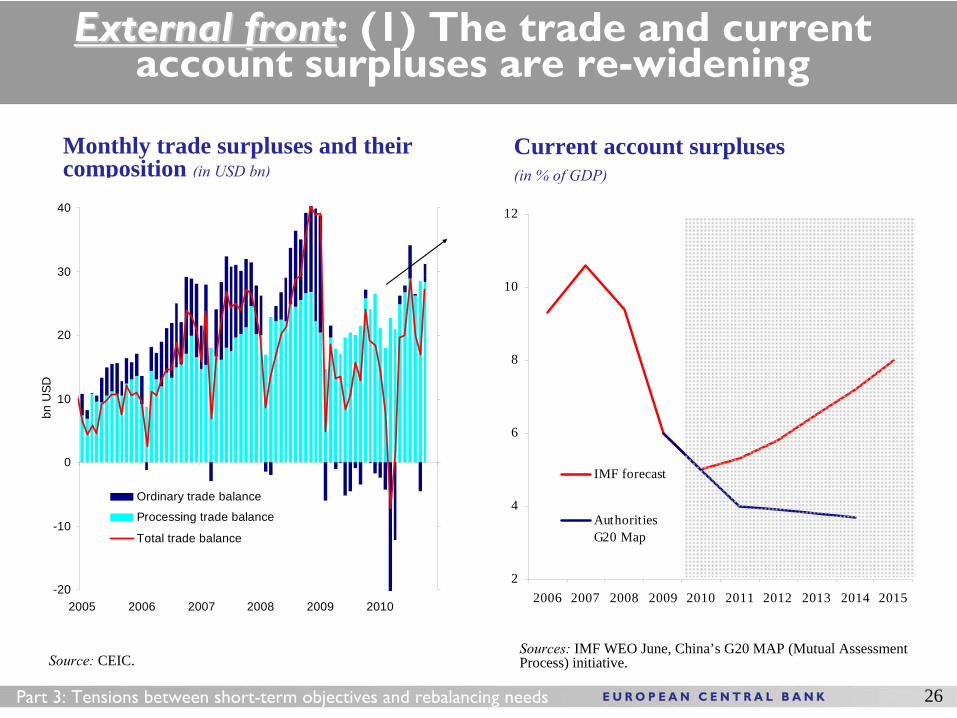
External frontExternal front: (1) The trade and current account surpluses are re-widening
Current account surpluses(in % of GDP)
Monthly trade surpluses and their composition (in USD bn)
Source: CEIC.
-20
-10
0
10
20
30
40
2005 2006 2007 2008 2009 2010
bn U
SD
-20
-10
0
10
20
30
40
Ordinary trade balance
Processing trade balance
Total trade balance
2
4
6
8
10
12
2006 2007 2008 2009 2010 2011 2012 2013 2014 2015
IMF forecast
AuthoritiesG20 Map
Sources:
IMF WEO June, China’s G20 MAP (Mutual Assessment Process) initiative.
27Part 3: Tensions between short-term objectives and rebalancing needs
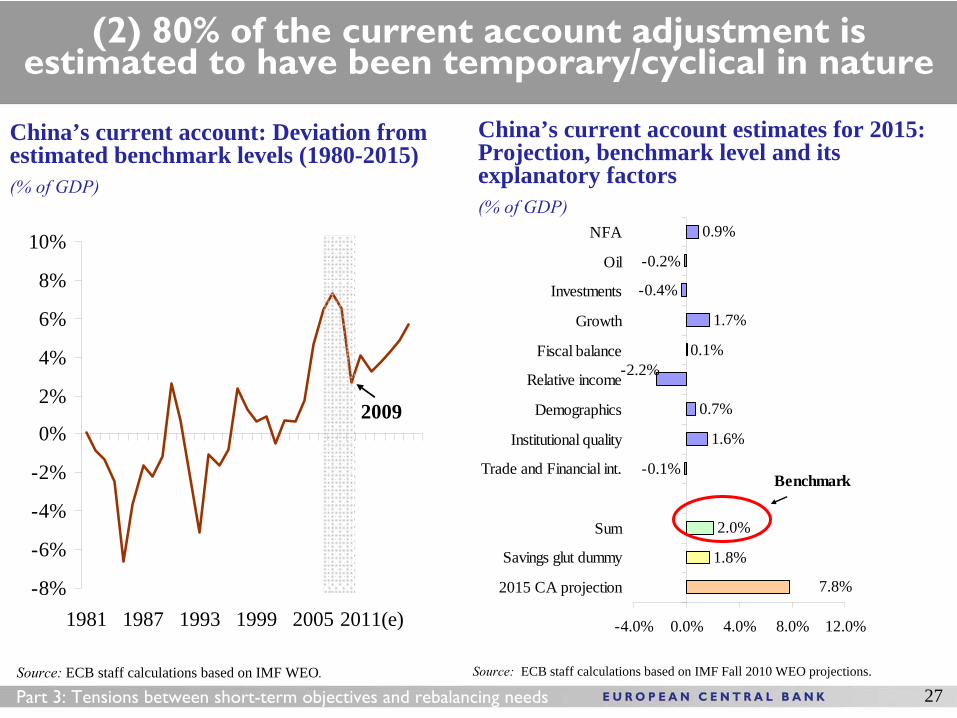
(2) 80% of the current account adjustment is estimated to have been temporary/cyclical in nature
China’s current account: Deviation from estimated benchmark levels (1980-2015) (% of GDP)
China’s current account estimates for 2015: Projection, benchmark level and its explanatory factors(% of GDP)
Source: ECB staff calculations based on IMF WEO. Source: ECB staff calculations based on IMF Fall 2010 WEO projections.
0.9%
-0.2%
-0.4%
1.7%
0.1%
0.7%
1.6%
-0.1%
2.0%
-2.2%
1.8%
7.8%
-4.0% 0.0% 4.0% 8.0% 12.0%
NFA
Oil
Investments
Growth
Fiscal balance
Relative income
Demographics
Institutional quality
Trade and Financial int.
Sum
Savings glut dummy
2015 CA projection
Benchmark
-8%
-6%
-4%
-2%
0%
2%
4%
6%
8%
10%
1981 1987 1993 1999 2005 2011(e)
2009
28
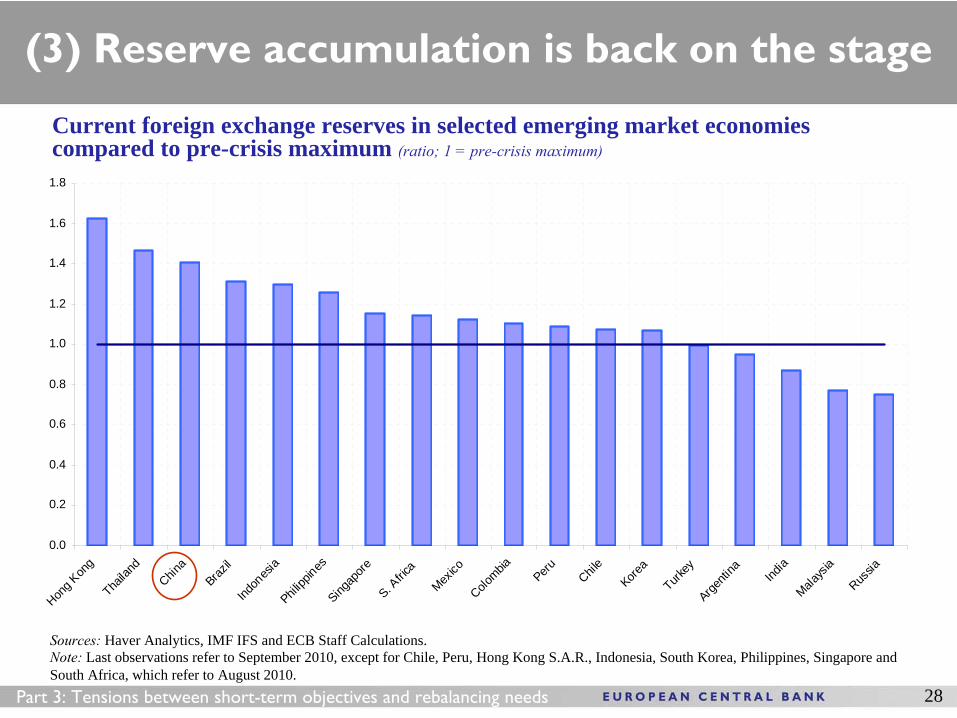
(3) Reserve accumulation is back on the stage
Current foreign exchange reserves in selected emerging market economies compared to pre-crisis maximum (ratio; 1 = pre-crisis maximum)
Sources: Haver Analytics, IMF IFS and ECB Staff Calculations.Note: Last observations refer to September 2010, except for Chile, Peru, Hong Kong S.A.R., Indonesia, South Korea, Philippines, Singapore and South Africa, which refer to August 2010.
Part 3: Tensions between short-term objectives and rebalancing needs
0.0
0.2
0.4
0.6
0.8
1.0
1.2
1.4
1.6
1.8
Hong K
ong
Thaila
nd
China
Brazil
Indon
esia
Philipp
inesSing
apore
S. Afric
a
Mexico
Colombia
Peru Chile
Korea
Turkey
Argenti
na India
Malays
ia
Russia
29Part 3: Tensions between short-term objectives and rebalancing needs
Source: BloombergNote: Last observation refers to 17 November 2010.
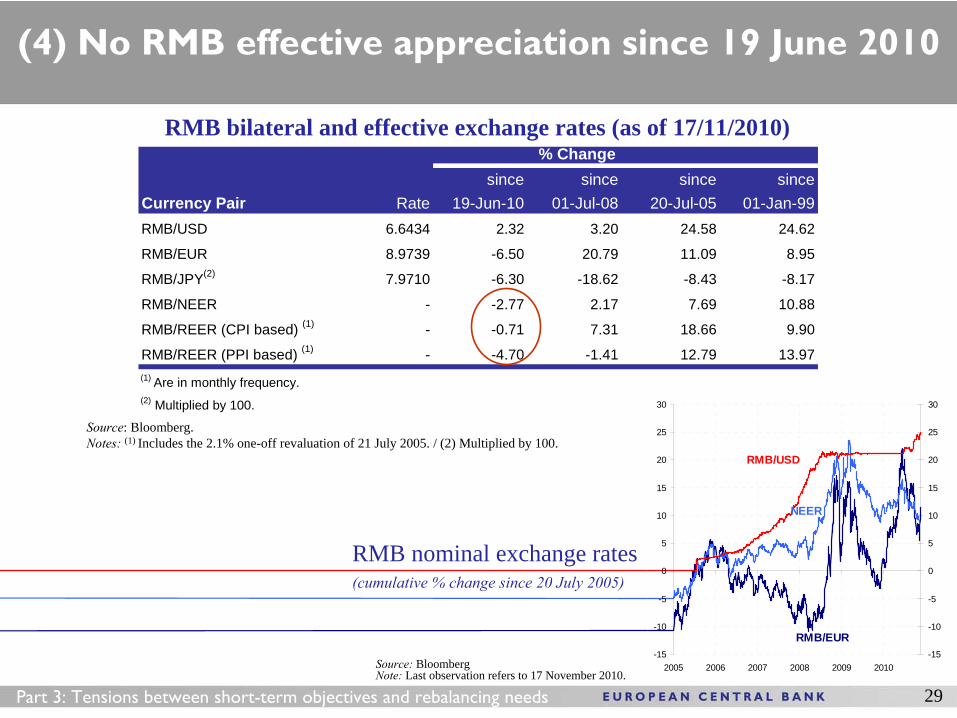
(4) No RMB effective appreciation since 19 June 2010
RMB nominal exchange rates (cumulative % change since 20 July 2005)
RMB bilateral and effective exchange rates (as of 17/11/2010)
Source: Bloomberg.Notes: (1) Includes the 2.1% one-off revaluation of 21 July 2005. / (2) Multiplied by 100.
(1)
7.31
-1.41
since01-Jan-99
24.62
8.95
-8.17
10.88
9.90
13.97
since19-Jun-10
since20-Jul-05
since01-Jul-08
24.58
RMB/NEER
RMB/EUR
-6.30
12.79
- -2.77
-0.71
-4.70
2.17
11.09
-8.43
7.69
18.66
RMB/USD
RMB/JPY(2)
RMB/REER (CPI based) (1)
RMB/REER (PPI based) (1)
-
-(1) Are in monthly frequency.(2) Multiplied by 100.
20.79
6.6434
8.9739
7.9710
2.32
-6.50
3.20
-18.62
RateCurrency Pair
% Change
-15
-10
-5
0
5
10
15
20
25
30
2005 2006 2007 2008 2009 2010-15
-10
-5
0
5
10
15
20
25
30
RMB/USD
RMB/EUR
NEER
30Part 3: Tensions between short-term objectives and rebalancing needs
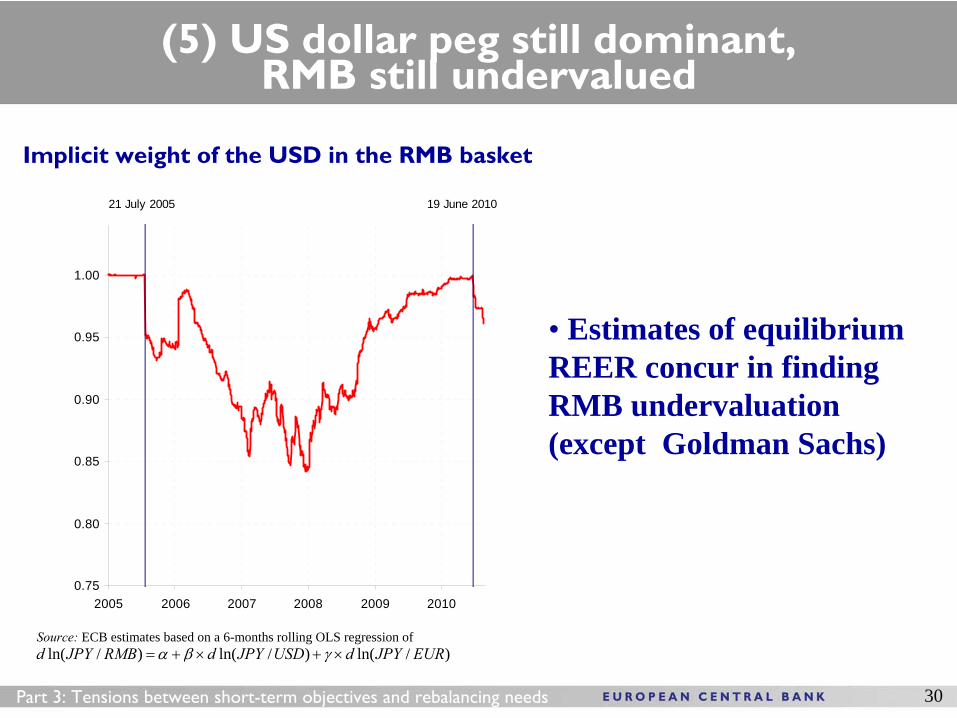
(5) US dollar peg still dominant, RMB still undervalued
Source:
ECB estimates based on a 6-months rolling OLS regression of
Implicit weight of the USD in the RMB basket
0.75
0.80
0.85
0.90
0.95
1.00
2005 2006 2007 2008 2009 2010
21 July 2005 19 June 2010
)/ln()/ln()/ln( EURJPYdUSDJPYdRMBJPYd
• Estimates of equilibrium REER concur in finding RMB undervaluation (except Goldman Sachs)
31Part 3: Tensions between short-term objectives and rebalancing needs
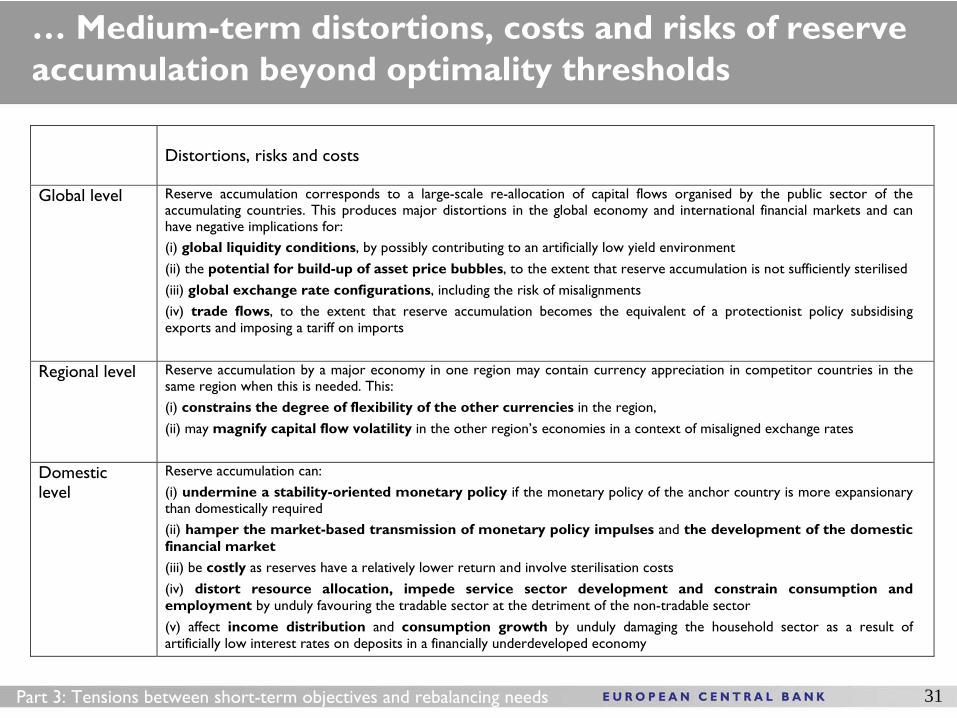
Distortions, risks and costs
Global level Reserve accumulation corresponds to a large-scale re-allocation of capital flows organised by the public sector of the accumulating countries. This produces major distortions in the global economy and international financial markets and can have negative implications for: (i) global liquidity conditions, by possibly contributing to an artificially low yield environment (ii) the potential for build-up of asset price bubbles, to the extent that reserve accumulation is not sufficiently sterilised (iii) global exchange rate configurations, including the risk of misalignments (iv) trade flows, to the extent that reserve accumulation becomes the equivalent of a protectionist policy subsidising exports and imposing a tariff on imports
Regional level Reserve accumulation by a major economy in one region may contain currency appreciation in competitor countries in the same region when this is needed. This: (i) constrains the degree of flexibility of the other currencies in the region, (ii) may magnify capital flow volatility in the other region’s economies in a context of misaligned exchange rates
Domestic level
Reserve accumulation can: (i) undermine a stability-oriented monetary policy if the monetary policy of the anchor country is more expansionary than domestically required (ii) hamper the market-based transmission of monetary policy impulses and the development of the domestic financial market (iii) be costly as reserves have a relatively lower return and involve sterilisation costs (iv) distort resource allocation, impede service sector development and constrain consumption and employment by unduly favouring the tradable sector at the detriment of the non-tradable sector (v) affect income distribution and consumption growth by unduly damaging the household sector as a result of artificially low interest rates on deposits in a financially underdeveloped economy
… Medium-term distortions, costs and risks of reserve accumulation beyond optimality thresholds
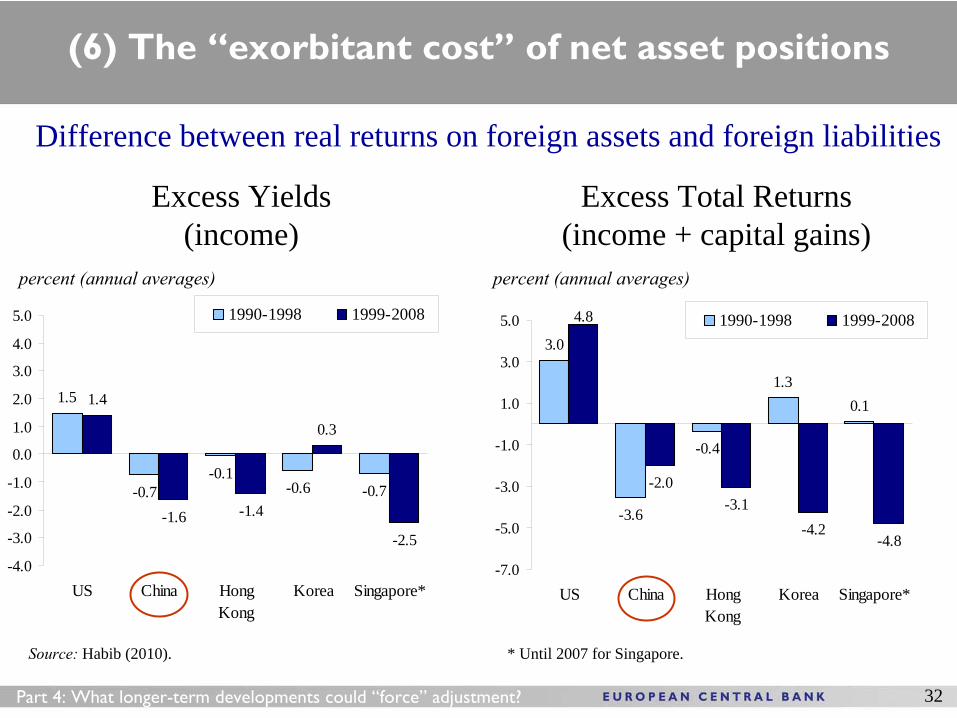
(6) The “exorbitant cost” of net asset positions
Source:
Habib (2010). * Until 2007 for Singapore.
Difference between real returns on foreign assets and foreign liabilities
Excess Yields (income)
Excess Total Returns (income + capital gains)
percent (annual averages) percent (annual averages)
32
3.0
-3.6
-0.4
1.30.1
4.8
-2.0-3.1
-4.2-4.8
-7.0
-5.0
-3.0
-1.0
1.0
3.0
5.0
US China HongKong
Korea Singapore*
1990-1998 1999-2008
1.5
-0.7-0.1
-0.6 -0.7
1.4
-1.6 -1.4
0.3
-2.5
-4.0
-3.0
-2.0
-1.0
0.0
1.0
2.0
3.0
4.0
5.0
US China HongKong
Korea Singapore*
1990-1998 1999-2008
Part 4: What longer-term developments could “force” adjustment?
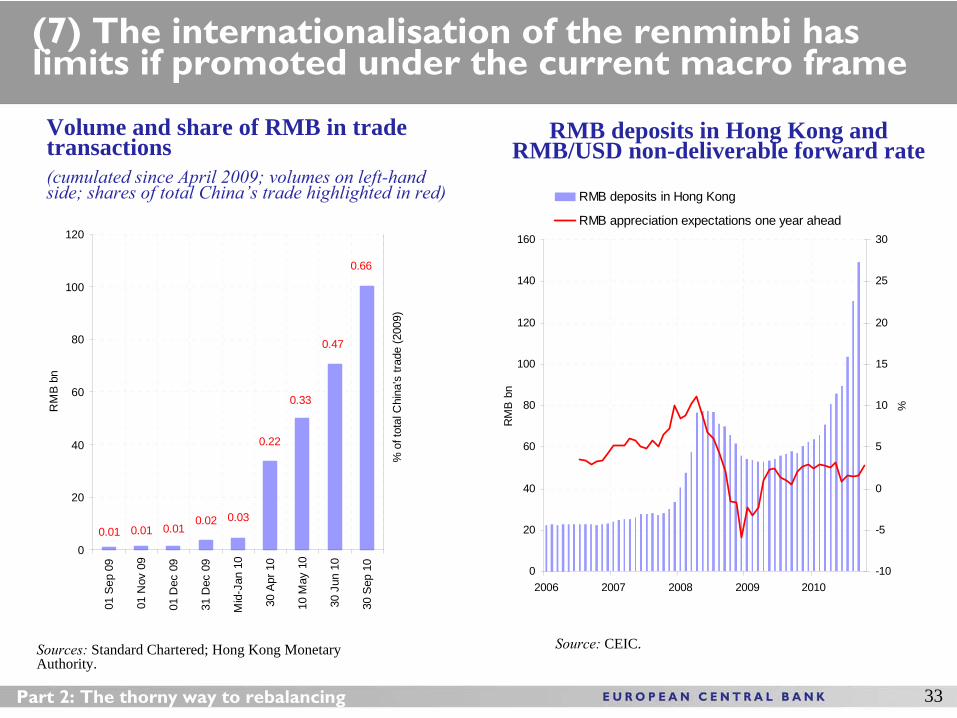
(7) The internationalisation of the renminbi has limits if promoted under the current macro frame
33Part 2: The thorny way to rebalancing
Volume and share of RMB in trade transactions(cumulated since April 2009; volumes on left-hand side; shares of total China’s trade highlighted in red)
Sources: Standard Chartered; Hong Kong Monetary Authority.
RMB deposits in Hong Kong and RMB/USD non-deliverable forward rate
Source: CEIC.
0
20
40
60
80
100
120
140
160
2006 2007 2008 2009 2010
RM
B b
n
-10
-5
0
5
10
15
20
25
30
%
RMB deposits in Hong Kong
RMB appreciation expectations one year ahead
0.47
0.01 0.01 0.010.02 0.03
0.22
0.33
0
20
40
60
80
100
120
01 S
ep 0
9
01 N
ov 0
9
01 D
ec 0
9
31 D
ec 0
9
Mid
-Jan
10
30 A
pr 1
0
10 M
ay 1
0
30 J
un 1
0
30 S
ep 1
0
RM
B b
n
% o
f tot
al C
hina
's tr
ade
(200
9)
0.66
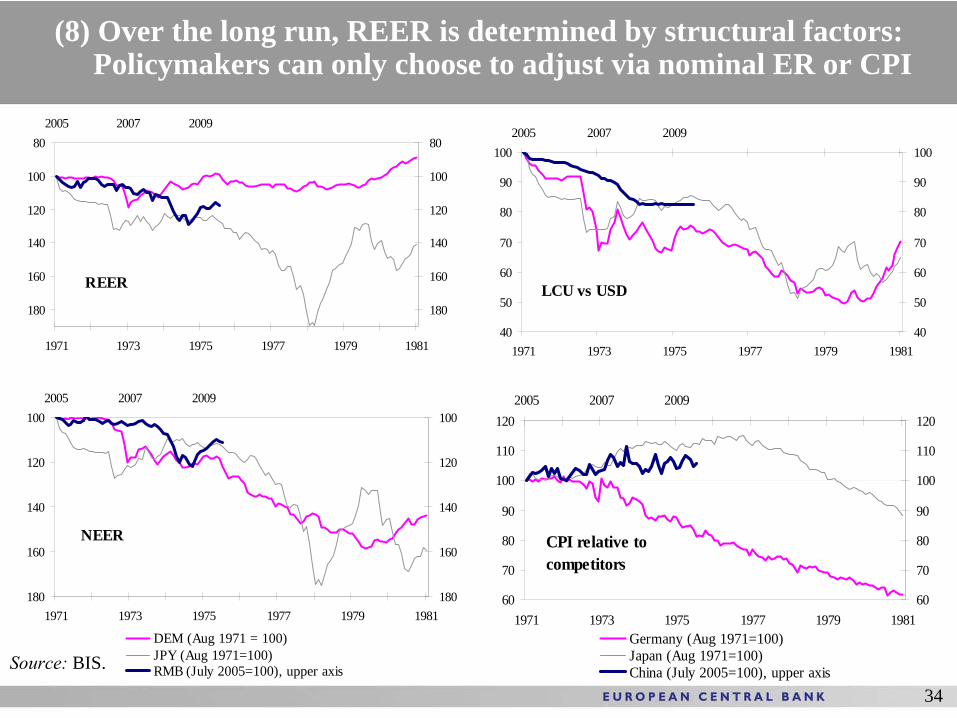
(8) Over the long run, REER is determined by structural factors: Policymakers can only choose to adjust via nominal ER or CPI
34
80
100
120
140
160
180
1971 1973 1975 1977 1979 1981
80
100
120
140
160
180
2005 2007 2009
REER
100
120
140
160
1801971 1973 1975 1977 1979 1981
100
120
140
160
180
2005 2007 2009
DEM (Aug 1971 = 100)JPY (Aug 1971=100)RMB (July 2005=100), upper axis
NEER
40
50
60
70
80
90
100
1971 1973 1975 1977 1979 198140
50
60
70
80
90
1002005 2007 2009
LCU vs USD
60
70
80
90
100
110
120
1971 1973 1975 1977 1979 198160
70
80
90
100
110
1202005 2007 2009
Germany (Aug 1971=100)Japan (Aug 1971=100)China (July 2005=100), upper axis
CPI relative to competitors
Source: BIS.
35
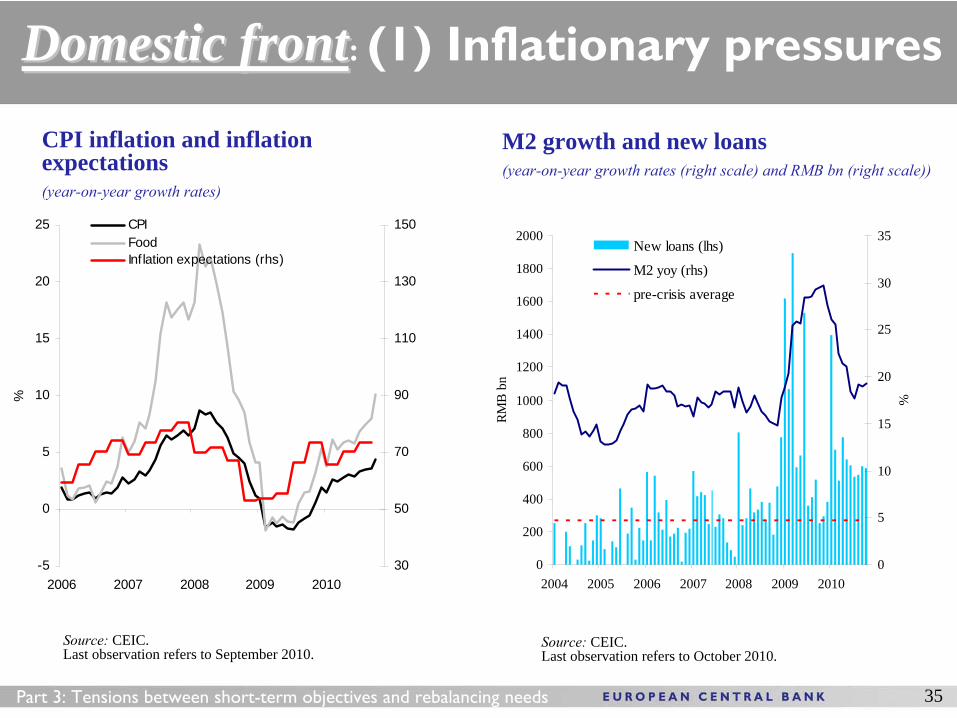
Domestic frontDomestic front: (1) Inflationary pressures
Part 3: Tensions between short-term objectives and rebalancing needs
CPI inflation and inflation expectations(year-on-year growth rates)
Source: CEIC.Last observation refers to September 2010.
Source: CEIC.Last observation refers to October 2010.
-5
0
5
10
15
20
25
2006 2007 2008 2009 2010
%
30
50
70
90
110
130
150CPIFoodInflation expectations (rhs)
0
200
400
600
800
1000
1200
1400
1600
1800
2000
2004 2005 2006 2007 2008 2009 2010
RMB
bn
0
5
10
15
20
25
30
35
%
New loans (lhs)
M2 yoy (rhs)
pre-crisis average
M2 growth and new loans(year-on-year growth rates (right scale) and RMB bn
(right scale))
36
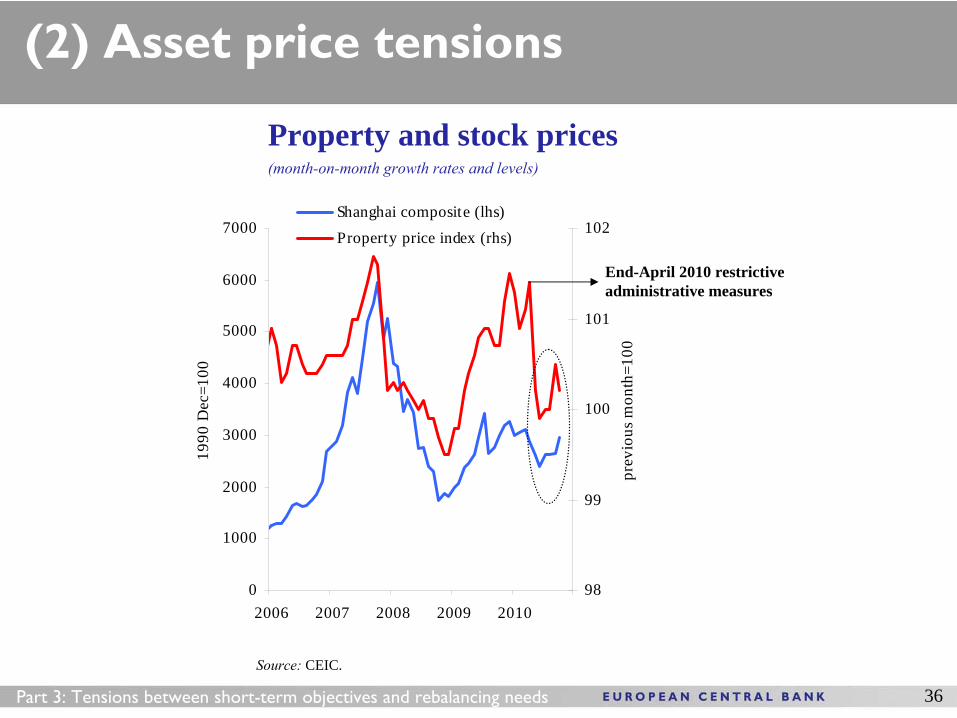
(2) Asset price tensions
Source: CEIC.
Part 3: Tensions between short-term objectives and rebalancing needs
0
1000
2000
3000
4000
5000
6000
7000
2006 2007 2008 2009 2010
1990
Dec
=100
98
99
100
101
102
prev
ious
mon
th=1
00
Shanghai composite (lhs)Property price index (rhs)
Property and stock prices(month-on-month growth rates and levels)
End-April 2010 restrictive administrative measures
37
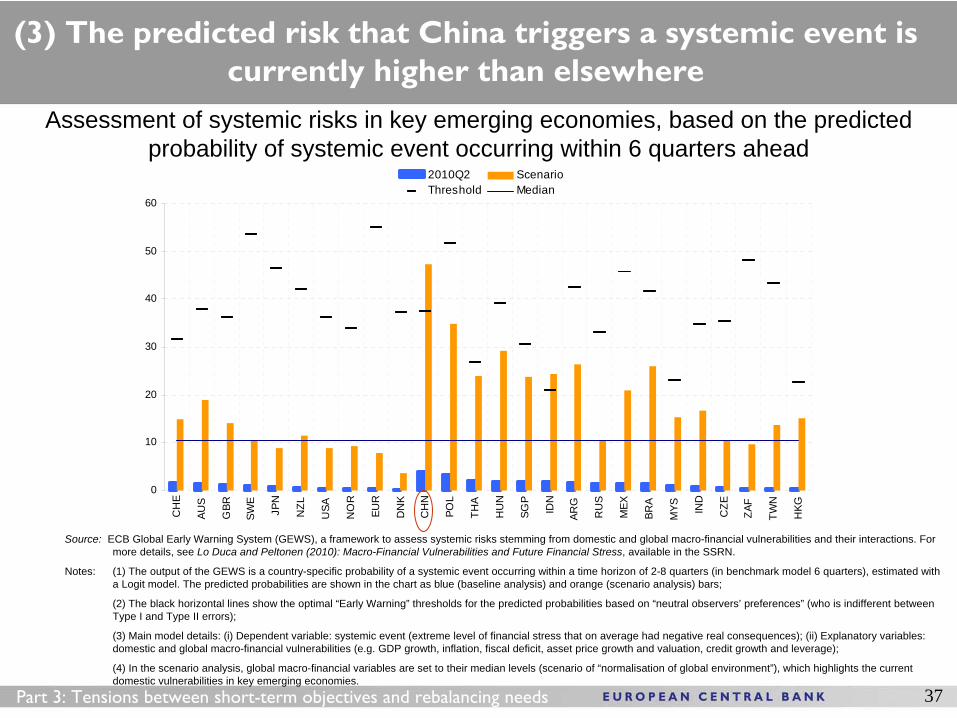
(3) The predicted risk that China triggers a systemic event is currently higher than elsewhere
Part 3: Tensions between short-term objectives and rebalancing needs
Assessment of systemic risks in key emerging economies, based on the predicted probability of systemic event occurring within 6 quarters ahead
0
10
20
30
40
50
60
CH
E
AUS
GBR
SWE
JPN
NZL
USA
NO
R
EUR
DN
K
CH
N
POL
THA
HU
N
SGP
IDN
ARG
RU
S
MEX
BRA
MYS IN
D
CZE
ZAF
TWN
HKG
2010Q2 ScenarioThreshold Median
Source: ECB Global Early Warning System (GEWS), a framework to assess systemic risks stemming from domestic and global macro-financial vulnerabilities and their interactions. For more details, see Lo Duca and Peltonen (2010): Macro-Financial Vulnerabilities and Future Financial Stress, available in the SSRN.
Notes: (1) The output of the GEWS is a country-specific probability of a systemic event occurring within a time horizon of 2-8 quarters (in benchmark model 6 quarters), estimated with a Logit model. The predicted probabilities are shown in the chart as blue (baseline analysis) and orange (scenario analysis) bars;
(2) The black horizontal lines show the optimal “Early Warning” thresholds for the predicted probabilities based on “neutral observers’ preferences” (who is indifferent between Type I and Type II errors);
(3) Main model details: (i) Dependent variable: systemic event (extreme level of financial stress that on average had negative real consequences); (ii) Explanatory variables: domestic and global macro-financial vulnerabilities (e.g. GDP growth, inflation, fiscal deficit, asset price growth and valuation, credit growth and leverage);
(4) In the scenario analysis, global macro-financial variables are set to their median levels (scenario of “normalisation of global environment”), which highlights the current domestic vulnerabilities in key emerging economies.
38
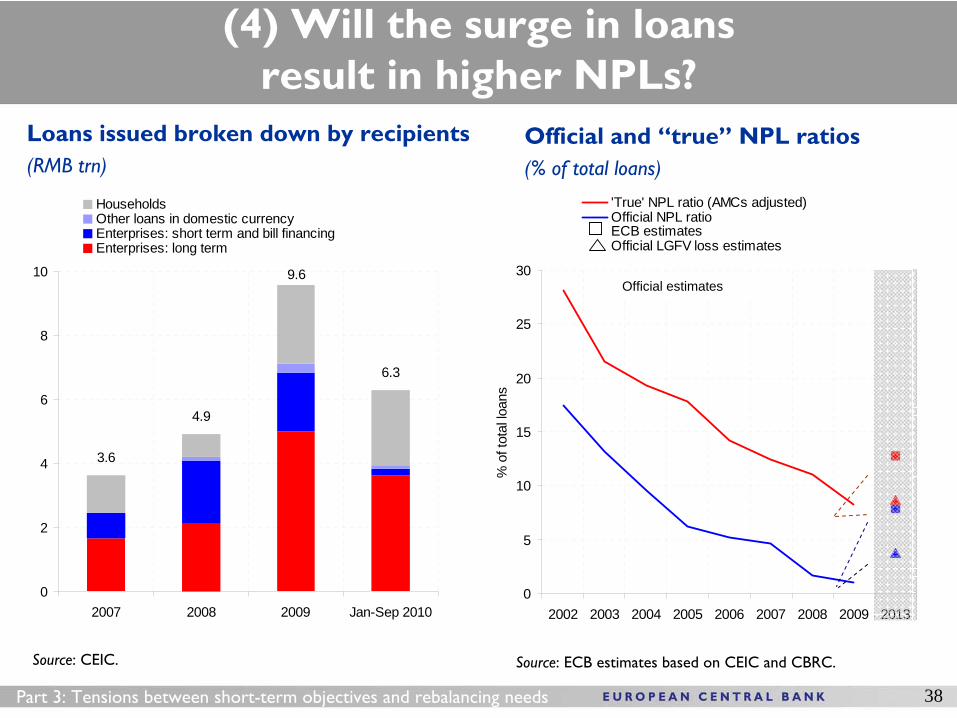
Source: CEIC.
Loans issued broken down by recipients (RMB trn)
(4) Will the surge in loans result in higher NPLs?
Official and “true” NPL ratios (% of total loans)
0
5
10
15
20
25
30
2002 2003 2004 2005 2006 2007 2008 2009 2013
% o
f tot
al lo
ans
'True' NPL ratio (AMCs adjusted)Official NPL ratioECB estimatesOfficial LGFV loss estimates
Source: ECB estimates based on CEIC and CBRC.
Official estimates
Part 3: Tensions between short-term objectives and rebalancing needs
3.6
4.9
6.3
9.6
0
2
4
6
8
10
2007 2008 2009 Jan-Sep 2010
HouseholdsOther loans in domestic currencyEnterprises: short term and bill financingEnterprises: long term
1. China’s model may not be sustainable going ahead
2. Reforms are needed to rebalance the economy. This is both in the domestic and global interest
3. Reforms agreed thus far might prove too gradual given the running out of long-term supporting factors; importance of upcoming 12th five-year plan
4. Multilateral cooperation (G20, IMF) can help set the right aligned incentives to rebalancing both in China and in its key global partners
CONCLUSIONS
39

Thanks!
Grazie!
Xiè xiè!