The Chemistry of Black Tea Aroma Tea_Samples2
16
1 Electronic Sensor Technology The chemistry of black tea aroma By Edward J. Staples, Ph.D. Electronic Sensor Technology www.zNose.com abstract A new electronic nose technology based upon ultra-high speed gas chroma- tography, called the zNose™, quantifies the chemistry of black tea aroma with precision and accuracy in seconds. In this paper the results of testing 20 samples of blended black tea with the zNose™ is described. Test methods for tea include chromatographic analysis using Kovats indices and n-alkane vapor standards, a virtual chemical sensor array specific to black tea, principal chemical component analysis, and VaporPrint™ olfactory images. The zNose™ can monitor quality online and even has the ability to calibrate itself using proprietary zNose™ perfumes. zNose™ …THE NEED FOR SPEED
-
Upload
javiercdeae -
Category
Documents
-
view
221 -
download
3
Transcript of The Chemistry of Black Tea Aroma Tea_Samples2
1
ElectronicSensorTechnology
The chemistry of black tea aroma
By
Edward J. Staples, Ph.D.
Electronic Sensor Technology
www.zNose.com
abstract
A new electronic nose technology based upon ultra-high speed gas chroma-tography, called the zNose™, quantifies the chemistry of black tea aroma withprecision and accuracy in seconds. In this paper the results of testing 20 samples ofblended black tea with the zNose™ is described. Test methods for tea includechromatographic analysis using Kovats indices and n-alkane vapor standards, avirtual chemical sensor array specific to black tea, principal chemical componentanalysis, and VaporPrint™ olfactory images. The zNose™ can monitor qualityonline and even has the ability to calibrate itself using proprietary zNose™perfumes.
zNose™ …THE NEED FOR SPEED
2
Testing Tea Samples with the zNose
Chemistry of Tea
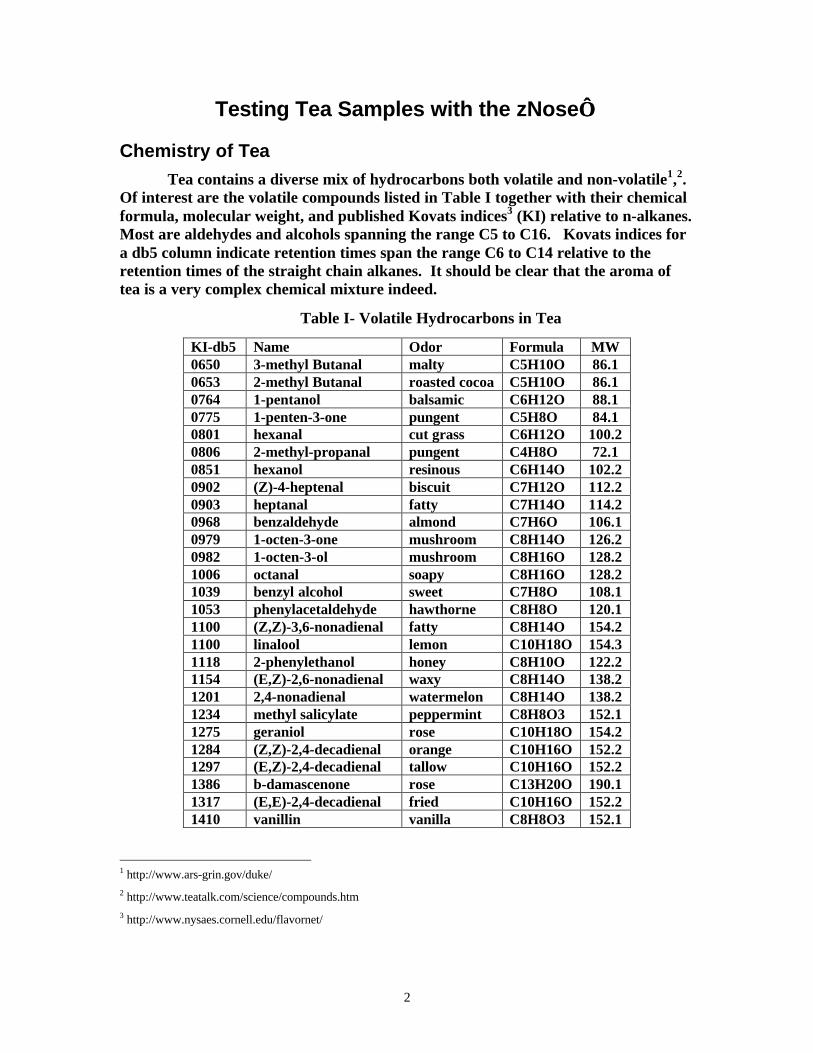
Tea contains a diverse mix of hydrocarbons both volatile and non-volatile1,2.Of interest are the volatile compounds listed in Table I together with their chemicalformula, molecular weight, and published Kovats indices3 (KI) relative to n-alkanes.Most are aldehydes and alcohols spanning the range C5 to C16. Kovats indices fora db5 column indicate retention times span the range C6 to C14 relative to theretention times of the straight chain alkanes. It should be clear that the aroma oftea is a very complex chemical mixture indeed.
Table I- Volatile Hydrocarbons in Tea
KI-db5 Name Odor Formula MW0650 3-methyl Butanal malty C5H10O 86.10653 2-methyl Butanal roasted cocoa C5H10O 86.10764 1-pentanol balsamic C6H12O 88.10775 1-penten-3-one pungent C5H8O 84.10801 hexanal cut grass C6H12O 100.20806 2-methyl-propanal pungent C4H8O 72.10851 hexanol resinous C6H14O 102.20902 (Z)-4-heptenal biscuit C7H12O 112.20903 heptanal fatty C7H14O 114.20968 benzaldehyde almond C7H6O 106.10979 1-octen-3-one mushroom C8H14O 126.20982 1-octen-3-ol mushroom C8H16O 128.21006 octanal soapy C8H16O 128.21039 benzyl alcohol sweet C7H8O 108.11053 phenylacetaldehyde hawthorne C8H8O 120.11100 (Z,Z)-3,6-nonadienal fatty C8H14O 154.21100 linalool lemon C10H18O 154.31118 2-phenylethanol honey C8H10O 122.21154 (E,Z)-2,6-nonadienal waxy C8H14O 138.21201 2,4-nonadienal watermelon C8H14O 138.21234 methyl salicylate peppermint C8H8O3 152.11275 geraniol rose C10H18O 154.21284 (Z,Z)-2,4-decadienal orange C10H16O 152.21297 (E,Z)-2,4-decadienal tallow C10H16O 152.21386 b-damascenone rose C13H20O 190.11317 (E,E)-2,4-decadienal fried C10H16O 152.21410 vanillin vanilla C8H8O3 152.1
1 http://www.ars-grin.gov/duke/2 http://www.teatalk.com/science/compounds.htm3 http://www.nysaes.cornell.edu/flavornet/

3
Calibrating the zNose n-Alkane Standards
Testing of tea aroma requires that the retention time scale of the zNose becalibrated using standard headspace vapors containing C6-C14 n-alkanes. ThezNose is able to speciate and quantify the concentration of these compounds inseconds using a proprietary SAW detector. The SAW detector produces a stablefrequency whose deviation is directly proportional to the concentration of theindividual n-alkanes as shown in Figure 1.
Retention time is defined by the flux (derivative) of the sensor response andis shown for replicate measurements of n-alkane vapors in Figure 2. Microsensesoftware simultaneously displays the sensor frequency and derivative-of-frequencywhich is equivalent to a conventional chromatogram. All hydrocarbons C6 to C14can be analyzed in less than 10 seconds.
Figure 1- SAW detector frequency response to n-alkanes C6-C14 using10ps2a1b method, 10 second sample, 60oC detector.
Figure 2- Six replicate analyses (vertically offset) performed on n-alkane vapors. The retention times are identified and the frequencydeviation (concentration) for each listed for the most recent (bottom)test.
4
2-zoneVial
Heater
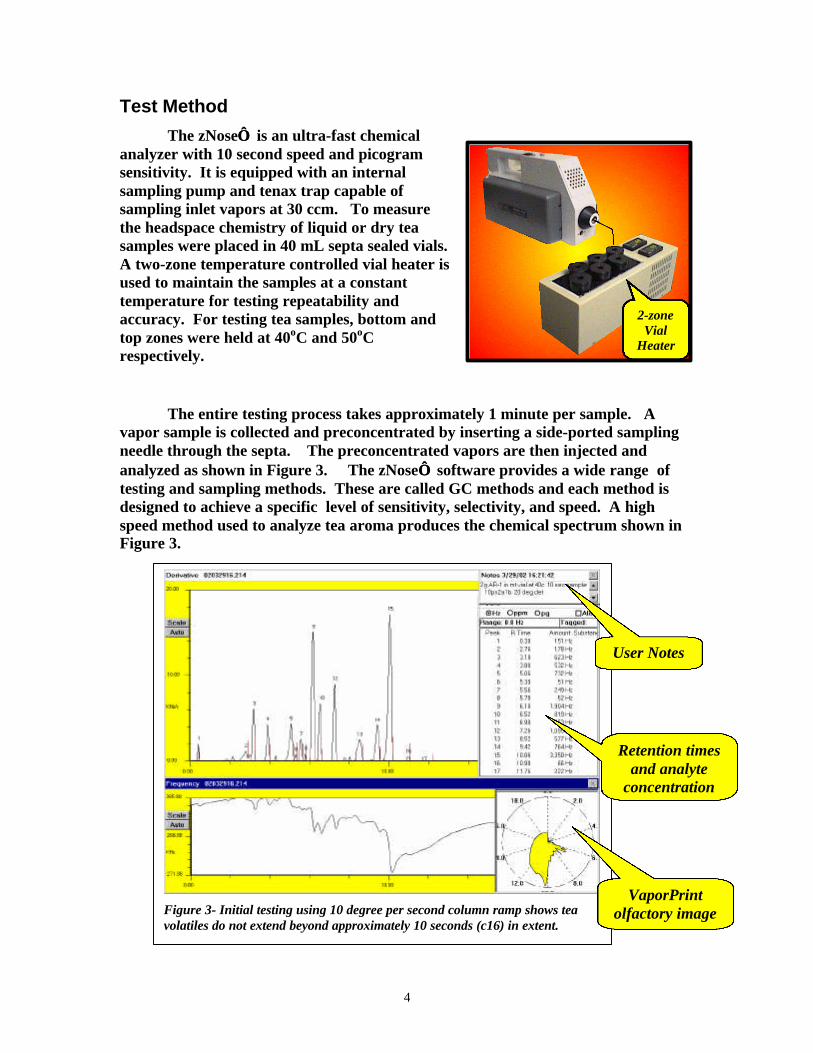
Figure 3- Initial testing using 10 degree per second column ramp shows teavolatiles do not extend beyond approximately 10 seconds (c16) in extent.
Test Method
The zNose is an ultra-fast chemicalanalyzer with 10 second speed and picogramsensitivity. It is equipped with an internalsampling pump and tenax trap capable ofsampling inlet vapors at 30 ccm. To measurethe headspace chemistry of liquid or dry teasamples were placed in 40 mL septa sealed vials.A two-zone temperature controlled vial heater isused to maintain the samples at a constanttemperature for testing repeatability andaccuracy. For testing tea samples, bottom andtop zones were held at 40oC and 50oCrespectively.
The entire testing process takes approximately 1 minute per sample. Avapor sample is collected and preconcentrated by inserting a side-ported samplingneedle through the septa. The preconcentrated vapors are then injected andanalyzed as shown in Figure 3. The zNose software provides a wide range oftesting and sampling methods. These are called GC methods and each method isdesigned to achieve a specific level of sensitivity, selectivity, and speed. A highspeed method used to analyze tea aroma produces the chemical spectrum shown inFigure 3.
VaporPrintolfactory image
Retention timesand analyte
concentration
User Notes

5
0
5
10
15
20
25
5 6 7 8 9 10 11 12 13 14 15 16 17
N-alkanes
Ret
enti
on
tim
e
c6-c14 alkanes
Poly. (c6-c14 alkanes)
Figure 5- Retention time vs alkane number.
n-Alkane RetentionTime (s)
6 1.407 2.468 4.049 5.98
10 8.1011 10.3012 12.5013 14.6414 16.74
Figure 4- Response of zNose to c6-c14 n-alkanes vaporstandards using a 5ps2a1b GC method
GC Method for Tea Aroma
The resolving power of the measurement can be increased by changing theGC method e.g. decreasing the speed of the measurement. Sensitivity of the meas-urement can also be in-creased by preconcentratingfor a longer time and de-creasing the detector tem-perature. Using a slowermethod and temperatureprofile (5oC/second) all of thehydrocarbons in tea can beanalyzed over the range C6 toC16 with good resolution in20 seconds. A c6-c14 alkanestandard vapor calibration isshown in Figure 4.
The zNose functions much like a hydrocarbon spectrum analyzer withretention time proportional to alkane number or molecular weight of the analytes.This can be seen in the tabulation of retention time and plot of retention time vsalkane number shown in Figure 5.

6
PeakNo.
RetentionTime (s)
Counts(Hz)
KovatIndices
1 0.48 231 5132 0.94 199 5573 1.46 56 6064 2.22 83 6775 2.72 397 7166 4.14 533 8057 4.46 3007 8228 5.68 2269 8859 6.46 470 92310 7.4 192 96711 8 2001 99512 8.42 50 101513 8.88 780 103514 9.34 1132 105615 10.22 6021 109616 10.9 2189 112717 11.46 2012 115318 12.38 3344 119519 12.92 386 122020 13.78 348 126021 14.52 539 129422 15.02 260 131823 15.7 154 135024 16.04 218 136725 16.68 2524 139726 17.82 8556 145127 19.54 1991 153328 20.1 54 156029 20.62 550 1585
Figure 7- Kovats indices for teaanalytes
Figure 6- Increased showing approximately 29 distincthydrocarbons present in tea samples.
Tea Analysis Techniques
A number of different techniques can be used to characterize and quantifythe chemistry contained within tea aroma e.g. quality. A chromatograhic analysisusing the tea method (5ps2a1b)settings is shown in Figure 6. Inthis analysis the n-alkane responseis overlaid in red so as to allow easydetermination of the retention timeof the tea chemicals relative to thatof the n-alkanes.
Using a 20 second analysis,approximately 29 individualchemicals can be resolved in thissample. Their retention time,concentration (detector counts),and Kovats indice are tabulated inFigure 7.
Since concentration is proportional to thedetector counts, this is plotted for each compounddetected vs it’s Kovats indices in Figure 8.
0
1000
2000
3000
4000
5000
6000
7000
8000
9000
601
650
713
800
900
977
1021
1088
1150
1223
1303
1362
1411
1554
1608
Figure 8- Detector counts vs Kovats Induce for tea
7
60162465068871378480086190094797799810211044108811221150119612231266130313281362137914111468155415821608
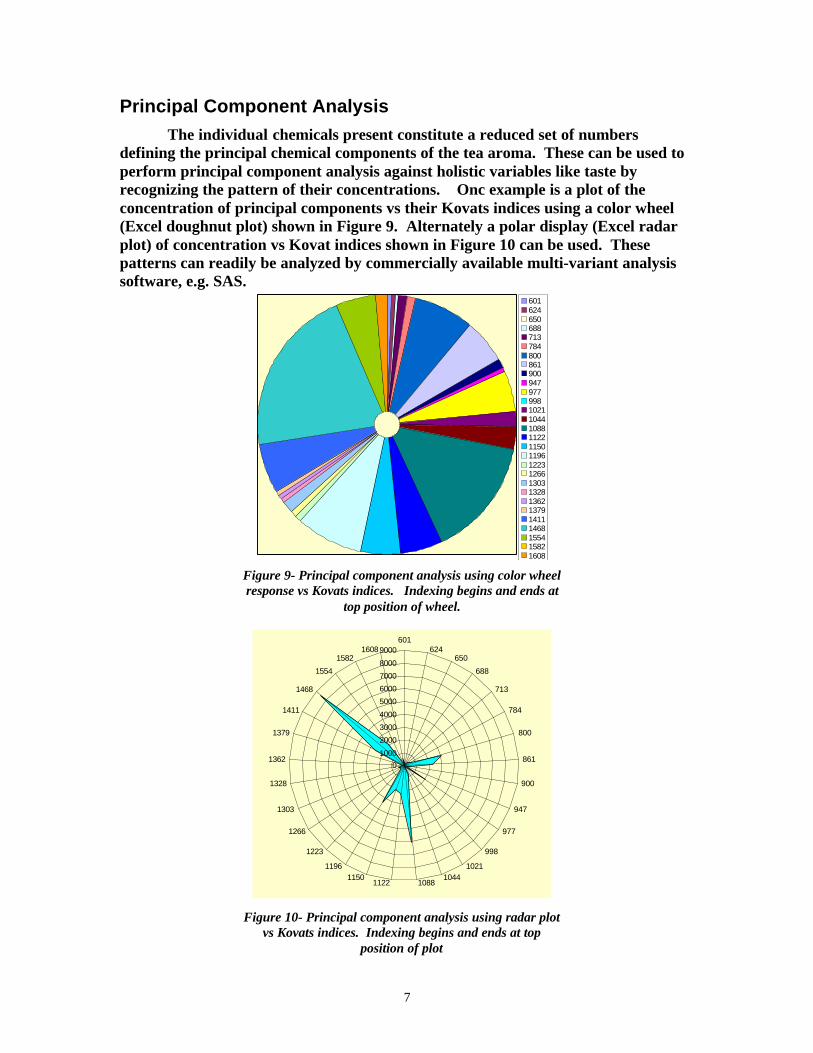
Figure 9- Principal component analysis using color wheelresponse vs Kovats indices. Indexing begins and ends at
top position of wheel.
Principal Component Analysis
The individual chemicals present constitute a reduced set of numbersdefining the principal chemical components of the tea aroma. These can be used toperform principal component analysis against holistic variables like taste byrecognizing the pattern of their concentrations. Onc example is a plot of theconcentration of principal components vs their Kovats indices using a color wheel(Excel doughnut plot) shown in Figure 9. Alternately a polar display (Excel radarplot) of concentration vs Kovat indices shown in Figure 10 can be used. Thesepatterns can readily be analyzed by commercially available multi-variant analysissoftware, e.g. SAS.
0
1000
2000
3000
4000
5000
6000
7000
8000
9000601
624650
688
713
784
800
861
900
947
977
998
10211044
108811221150
1196
1223
1266
1303
1328
1362
1379
1411
1468
1554
15821608
Figure 10- Principal component analysis using radar plotvs Kovats indices. Indexing begins and ends at top
position of plot

8
Figure 12- High resolution 2-dimensional olfactory imagesformed from SAW sensor signal and retention time.
Figure 11- Virtual chemical sensors defined by alarms andcalibration standards allow alarms to be set to monitor
quality of tea aroma based upon chemical concentrations.
Virtual Chemical Sensors and VaporPrint olfactory images
Another useful tool for monitoring the quality of tea using it’s aromachemistry is to define a set of virtual chemical sensors. Each sensor monitors theconcentration of a specificchemical within the tea aroma.Although the zNose contains asingle physical sensor, systemsoftware can create hundreds ofvirtual chemical sensors basedupon retention time windows.
An example based upontea vapors is shown in Figure 11.Virtual chemical sensors arespecific to each chemical andallow the user to set alarms andbe notified when these alarmlevels are exceeded.
Another approach uniqueto the zNose is to use visual 2-dimensional olfactory images,called VaporPrints . Usingretention time as the angularvariable and the SAW detectorresponse as the radial variable theolfactory image for one tea sampleis shown in Figure 12. Thisapproach provides a highresolution visual image whichdisplays the aroma chemistry inits entirety. Skilled observers canfrequently judge quality byobserving only this image.

9
Figure 14- Liquid tea (40oC) chromatogram using5ps10a1b method, 30oC detector, and a 15 mLvapor sample. (2g/20 mL water in 40 mL vial)
Figure 13- Replicate chromatograms showingreproducibility and repeatability of liquid tea test
method.
Headspace Chemistry of Dry and Liquid Tea (Sample AR-1)
The concentration of volatile organics from dry tea is proportional to thevapor pressure of the individual analytes and the surface area of the tea particles.The headspace concentration of volatile organics from water containing dissolvedtea is determined by the vapor pressure of the analytes and their solubility in water.Liquid Tea was produced using AR-1 sample. The tea was prepared using 2 gramsof tea grounds in 20 mL water measured into a 40 mL vial and equilibrated at 40oCfor 5 minutes. Shown in Figure 13 are offset replicate chromatograms showing thechemistry of the headspace vapors from liquid tea. Reproducibility or precision ofthe measurement was excellent as can be seen in the identical nature of thechromatograms.
Shown in Figure 14 is a more detailed of view of the liquid tea aroma and it’schemistry. The number of compounds resolved was the same as in the dry tea,however their relative concentrations were altered because each analyte exhibited adifferent Henry’s constant (= Vapor pressure/solubility).

10
Figure 15- Comparing liquid (bottom) vs dry (top)tea samples
Figure 16- Liquid tea response derivative vs dry overlay in RED.
A comparison between dry and liquid tea chromatograms is shown in Figure15. In this figure the top chromatogram (dry tea) is offset for easier viewing and itis clear that the solubility of certain analytes (RT=8, 8.6,10,12 & 18), results in theirbeing considerably lower in concen-tration than that of dry tea. How-ever, in other cases (RT=2.2, 4.5, 5.5,10.5,14.8 & 18.2),the opposite is trueand being soluble in water allowsextraction of the compound from thetea matrix and increases its con-centration in the headspace vapors.
The headspace vapors in dryand liquid tea samples can also beoverlaid for comparison. In Figure16 the dry tea chromatogram (RED)is overlaid with liquid (BLACK). Inthis case bipolar nature of the chro-matogram is also displayed (clip-ping=Off) so every small inflectionof the derivative response can beviewed. It is clear in either case thatthe compounds are the same andthat they just have different concen-trations. Hence, the aroma of liquidtea is different from dry tea, yetboth display the same chemicals.

11
0
1000
2000
3000
4000
5000
6000
7000
0 1 2 3 4 5 6
Dry Tea Weight (g)
Res
po
nse
0.464.525.768.110.2410.9412.4213.8214.616.7
Figure 18- Detector counts vs the amount of dry tea invial at 40oC.
Figure 17- Chromatograms for differingamounts of dry tea in vials. Each triplicatemeasurement demonstrates precision of the
method and provides an average concentrationfor all analytes detected.
Dry Tea Aroma vs Amount of Tea Placed in Vial (AR-1)
Headspace vapors were tested using different amounts of dry tea in vialsheld at 40oC. The concentration of individual analytes as a function of tea placed inthe vial is shown in Figure 17. Concentrationincreased with tea mass for all analytesdetected but not always in direct linearproportion to the amount of tea in the vial.The concentration of a select number ofanalytes is plotted in Figure 18. In generalthe more volatile compounds displayed alinear relationship while the less volatilecompounds exhibited a saturation effect.

12
Figure 20- Chromatograms for Samples AR-1 to AR-6. Eachanalysis represents 3rd run of triplicate measurement.
Figure 19- Each sample was measured intriplicate followed by blanks and n-alkane runs to
insure quality of measurement.
Evaluation of 20 Different Dry Tea Samples
Five (5) grams of tea were placed in 40 mL septa sealed vials and thermo-stated in a 2-zone vial heater at 40oC bottom and 50oC top zone. Using a 5ps2a1bmethod, 20oC detector and 30 secondsample time, 15 mL of headspace va-pors were preconcentrated and ana-lyzed with the zNose. Each samplewas analyzed in triplicate and theKovats indices evaluated by also in-cluding an analysis of n-alkane stan-dard vapor as shown in Figure 19.
The response from the 3rd
analysis run in each triplicate meas-urement series are compared as offsettraces in Figure 20 for samples Ar-1through AR-6. In similar fashionFigures 21-23 show chromatogramsfor samples Ar-7 through AR-20.
AR-2
AR-1
AR-3
AR-4
AR-5
AR-6

13
Figure 21- Chromatograms of sample AR-7 to AR-12.
Figure 22- Chromatograms of samples AR-13 to AR-16
AR-7
AR-8
AR-9
AR-10
AR-11
AR-12
AR-13
AR-14
AR-15
AR-16
14
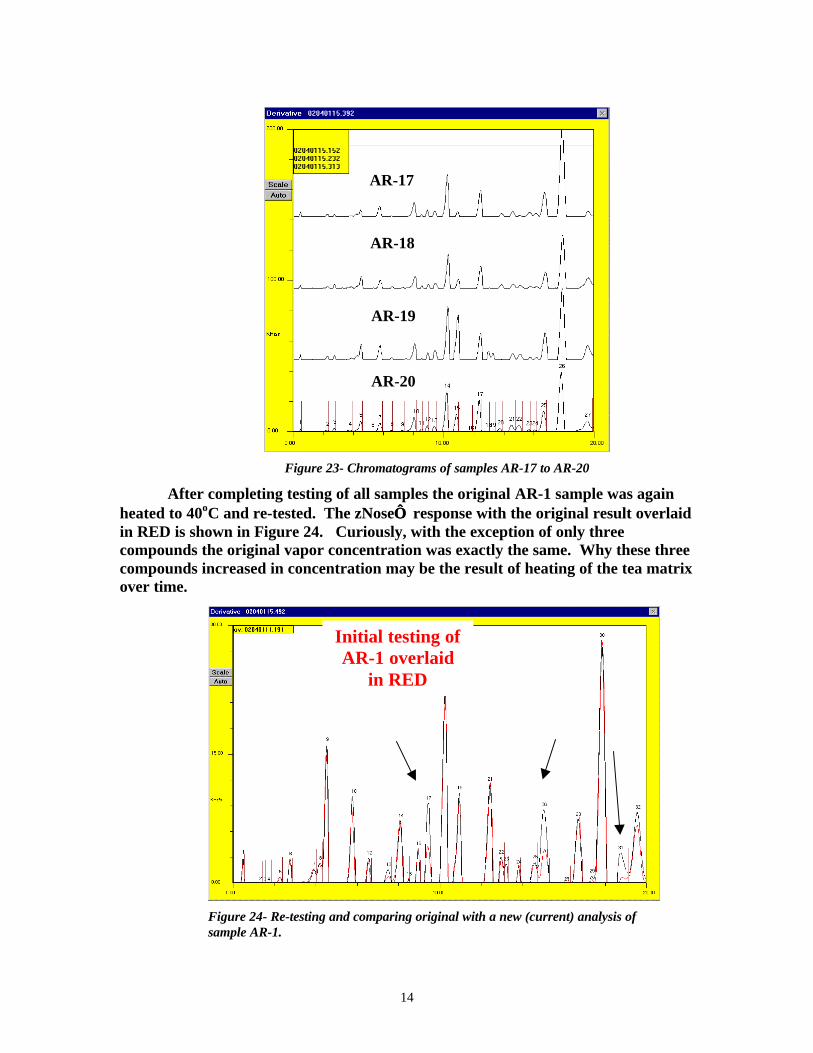
Figure 23- Chromatograms of samples AR-17 to AR-20
Figure 24- Re-testing and comparing original with a new (current) analysis ofsample AR-1.
After completing testing of all samples the original AR-1 sample was againheated to 40oC and re-tested. The zNose response with the original result overlaidin RED is shown in Figure 24. Curiously, with the exception of only threecompounds the original vapor concentration was exactly the same. Why these threecompounds increased in concentration may be the result of heating of the tea matrixover time.
AR-18
AR-17
AR-19
AR-20
Initial testing ofAR-1 overlaid
in RED

15
Figure 25- Comparison using olfactory images normalized to highest concentration analyte.
Comparison Using VaporPrint Olfactory Images
Whereas chromatographic results show the trees of the forest, olfactoryimages known as VaporPrints display the forest of trees in its entirety. Olfactoryimages display aroma concentration with retention time as the angular variable.Because of our acute visual perception skills and abilities in recognizing subtlechanges in 2-dimensional figures and patterns, olfactory images provide humanoperators with a useful tool for comparing the chemistry of fragrances, odors, andaroma. An example is the display of Figure 25 showing a gallery of VaporPrintimages for the 20 different tea samples. Clearly sample AR-2 was an exception tothe normal pattern. Nevertheless the basic pattern can be seen to undergo manydifferent variations on the basic theme represented in sample AR-1.

16
Summary and Conclusions
A new instrument, the zNose, is providing chemists and quality controlpersonnel with a fast and accurate tool for measuring the quality of a wide varietyof foods and beverages. Based upon ultra-high speed chromatography, theinstrument is able to speciate and quantify the concentration of nearly 30 or moreindividual compounds in seconds. With a zNose, over 300 tea samples can beevaluated in an 8 hour period.
In addition to standard chromatographic methods, high resolution olfactoryimages, called VaporPrints, allow quality to be assessed based upon the chemicalodor chemistry in its entirety. These 2-dimensional images are particularly useful tohumans because of their ability to recognize and differentiate visual images. Ineffect the olfactory response is transformed into a visual response.
An evaluation of 20 blind tea samples was carried out using headspacevapors from dry tea. Water extracted tea was also tested and found to contain thesame chemicals but a much altered concentration profile. The testing of dry tea issimpler and quicker since no extraction process is required. However, somecompounds are enhanced by extraction and for these the liquid extraction methodmay be a more appropriate approach.
Identification of compounds was performed indirectly. The individualchemicals in the tea samples were identified by their retention times compared tothat of n-alkanes (Kovats Indices). Recommended future work would be toevaluate the Kovats indices for chemicals known to be present in tea. These findingswould then be compared to the Kovats indices of the compounds observed in the teasamples.


![21956606 CBSE XII Chemistry Project Determination of Caffeine in Tea Samples[1]](https://static.fdocuments.us/doc/165x107/577d2fa51a28ab4e1eb23de4/21956606-cbse-xii-chemistry-project-determination-of-caffeine-in-tea-samples1.jpg)