Biosketch Kathleen C. Blazar, M.S.L.S. Interim Director Cleveland Health Sciences Library.

The characterization of the distant blazar GB6 1239+0443from flaring and low activity period
L. Pacciani,IASF-ROMA/INAF and
MNRAS 425, 2015-2026 (2012)
A. Tarchi


Association of the unidentifiedgamma-ray source 3EG J1236+0457
With the distant FSRQ GB6 1239+0443At z=1.76
Tramacere et al., 2009, Atel 1888 (FERMI+SWIFT),Ikejiri et al., 2009, Atel 1892 (FERMI+SWIFT+KANATA),
Fermi catalogs: Abdo et al., 2010 & 2011, (1FGL & 2FGL)
Fermi observed the source to flare at the end of 2008with a gamma-ray flux arising of a factor ~10
with respect to quiescent state
The only optical source with a optical flux enhanchementwith respect to archival data was GB6 1239+0443
(flux enhanchment of a factor ~30).All the other optical/uv candidates in the Swift/UVOT
F.O.V.remained at a level comparable to the archival data
(with a flux change of a factor < 30%)

AGILE pointed the VIRGO field in dec. 2007 – Jan. 2008,and detected flaring activity of 3EG J1236+0457 (GB6 1239+0443)
For that observation there was a MWL campaign on the VIRGO field, with INTEGRAL pointing at the same field.
We searched for the optical counterpart in the INTERGRAL/OMC and found it.
In spite of the large amount of data available for the source,this FSRQ has not been studied so far.
We will show the available data and we will discuss the quiescent state and the remarkable flares of the distant source
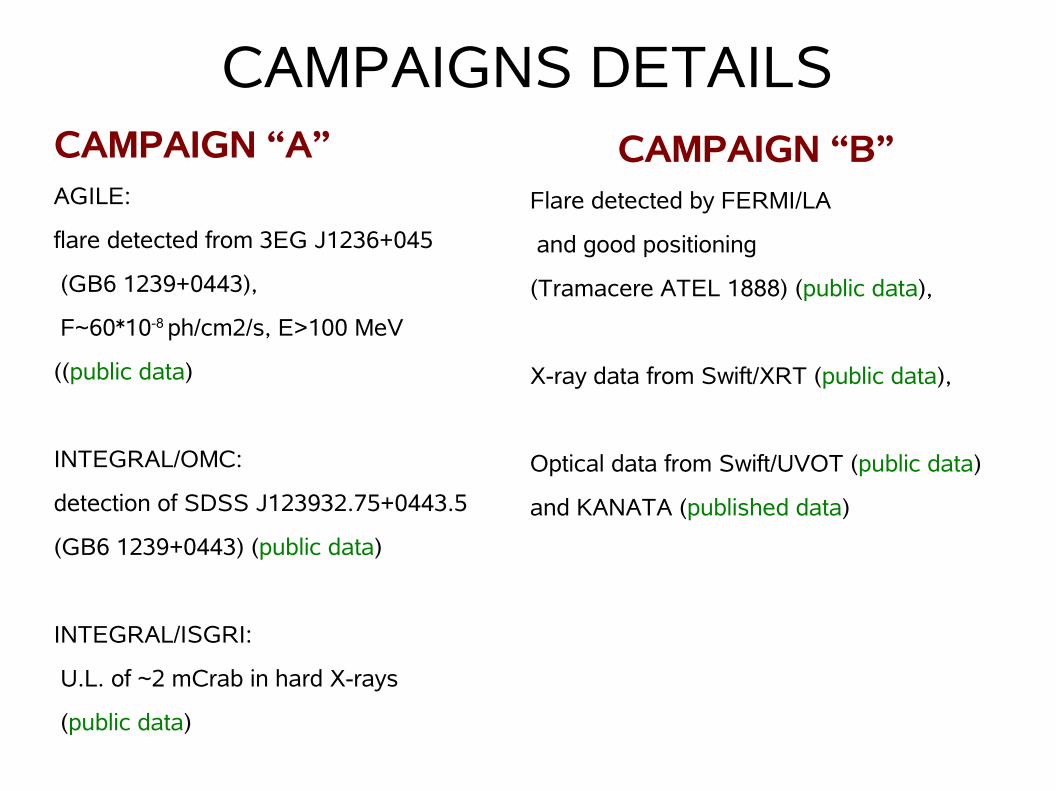
CAMPAIGNS DETAILSCAMPAIGN “A”AGILE:
flare detected from 3EG J1236+045
(GB6 1239+0443),
F~60*10-8 ph/cm2/s, E>100 MeV
((public data)
INTEGRAL/OMC:
detection of SDSS J123932.75+0443.5
(GB6 1239+0443) (public data)
INTEGRAL/ISGRI:
U.L. of ~2 mCrab in hard X-rays
(public data)
CAMPAIGN “B”Flare detected by FERMI/LA
and good positioning
(Tramacere ATEL 1888) (public data),
X-ray data from Swift/XRT (public data),
Optical data from Swift/UVOT (public data)
and KANATA (published data)

Campaign AAGILE data
Data analysed with the AGILE Standard Analysis Pipeline(BUILD20) and the AGILE Scientific Analysis Package
Integrating the GRID data for 4 days between 2008 January 4 13:35 and 2008 January 8 11:16 we detected a source (AGL J1238+0406 in the AGILE catalog, see Pittori et al. 2009, and Verrecchia et al. 2011) with SQRT(TS)~6 positionally consistent with GB6 1239+0443.
Flux: (62±9)*10-8 ph/cm2/s, E>100 MeV Photon index 1.92±0.14, E> 100 MeV
GB6 1239+04433C 273
First week Second week Third week

CAMPAIGN A:The image from INTEGRAL/OMC simultaneous to the gamma-ray flare detected with AGILE
AGN1 is GB6 1239+0443, detected with V magnitude ~17.5(S/NR=4, integrated for all the longest shotsof the 3 weeks campaign),to be compared with the archival V magnitude of ~19.9(V magn evaluated from u and g magnitude from SDSS)

CAMPAIGN BFERMI-LAT
We performed the STANDARD FERMI-LAT analysis as explained inhttp://fermi.gsfc.nasa.gov/ssc/data/analysis/documentation.
Data were analysed with P7_V6 response functions.The analysis has been taken inside a circular region with radius 15 deg,and taking into account the sources of the 2FGL in the analysis region,the galactic diffuse emission (gal 2yearp7v6 v0)and the isotropic extragalactic emission (iso p7v6source).
We detected the source with SQRT(TS)~18, and obtained a photon index of 2.21±0.15 between 0.3-20 GeVfor an integration time of 4 dayscentered around 2008 December 29 16:00 UT.
During the flare GB6 1239+0443 is revealedup to the energy bin 10-20 GeVwith a SQRT(TS)~5.8
With the integration of 30 days period centered around the same date,we detected the source with SQRT(TS)~20,and we obtained a photon index of 2.15±0.11

CAMPAIGN BSWIFT/UVOT
The UVOT observed the sourcewith U, UW1, UM2, UW2 filters.We obtained UVW1=16.24± 0.03 (extinction corrected)
U image
UM2 image
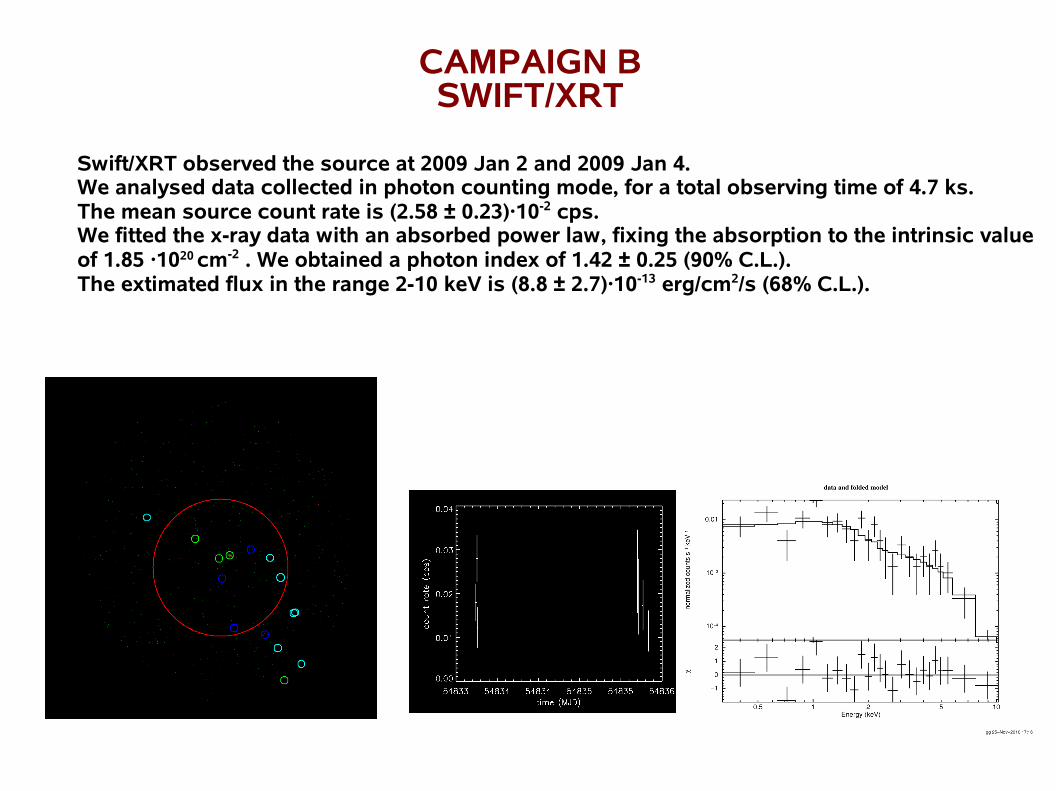
CAMPAIGN BSWIFT/XRT
Swift/XRT observed the source at 2009 Jan 2 and 2009 Jan 4.We analysed data collected in photon counting mode, for a total observing time of 4.7 ks.The mean source count rate is (2.58 ± 0.23)·10-2 cps.We fitted the x-ray data with an absorbed power law, fixing the absorption to the intrinsic valueof 1.85 ·1020 cm-2 . We obtained a photon index of 1.42 ± 0.25 (90% C.L.).The extimated flux in the range 2-10 keV is (8.8 ± 2.7)·10-13 erg/cm2/s (68% C.L.).

Gamma-ray Light curvemaking use of the long term coverage of FERMI
I use two different flux scales in the plots below, one for AGILE/GRID, the other for FERMI-LAT
CAMPAIGN “A” (AGILE DATA)Simultaneous data in optical,U.L. in hard X
CAMPAIGN “B” (FERMI DATA)Simultaneous data in optical,X-ray

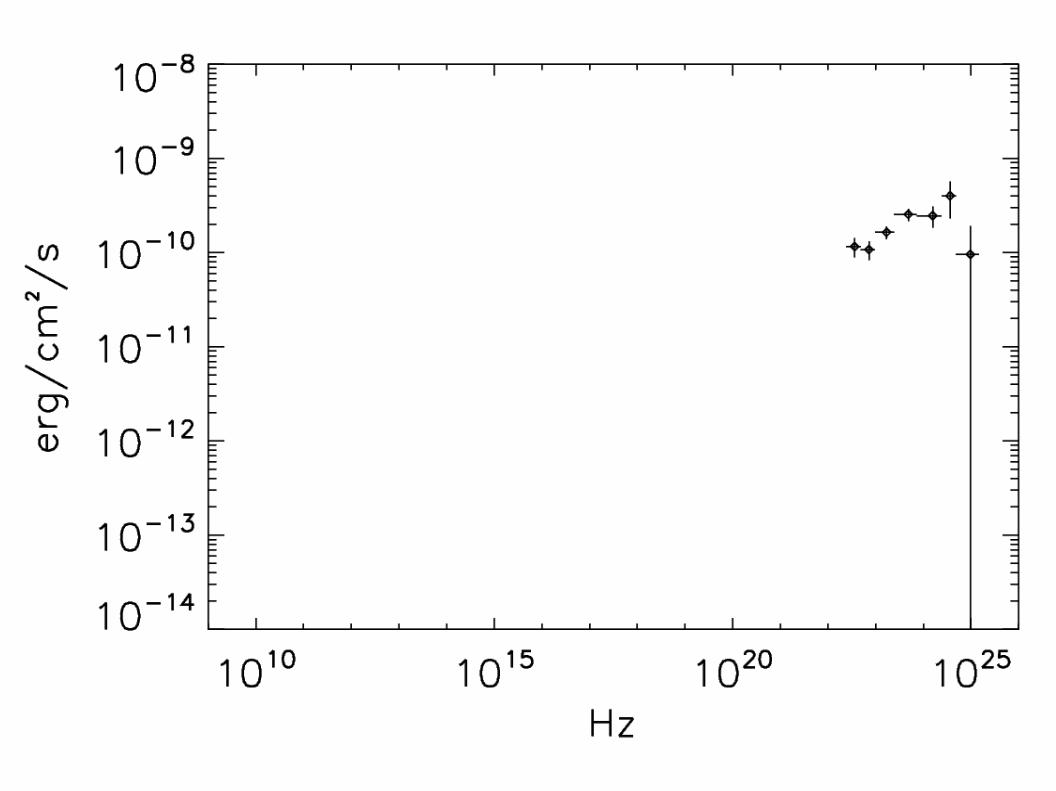
The Gamma-ray spectrum
No sizeable gamma-gamma absorptionRed line is the fit with a power-law only (chi2=1.1), ph ind=2.13green line is the result of the fit including gamma-gamma absorption (chi2=1.6)(τHI =1.0+4.6
-1.0 τHe =+0.9
-0.0 compared with the total opacity= 25 for 3C 454.3 (Poutanen & Stern 2010),F test (to test the hypothesis of the need of absorption component) gives F=0.15, prob.=85%: absorption is not necessary.
Black data:1 month integrated data
Cyan data:4 days integrated data (magnified x2)

ARCHIVAL DATASloan digital sky survey: optical photometry (March 2001) and optical spectrum (May 2002)
UKIDSS-Large Area Survey Near-ir photometry (January 2007)
GALEX UV photometry (April 2007)
RADIO data from MOJAVE (2009 January 30),
PLANCK (January 2010),
VLA (November 2001),
Metsahovi (May 2002)

BH mass from C IV broad line widthBH mass can be derived with the single epoch BH mass scaling relationship forC IV derived by Vestergaard and Peterson (2006), and applying the corrections in Assef. et al. (2011).The S/NR of the optical spectrum is low: S/NR~3 for the continuum,and this can bring to systematics (for example unrecognized absorption,see Vestergaard and Peterson 2006, Assef et al. 2011, Denney et al. 2011).
We used two methods to estimate the C IV broad line width: direct line width measurement(FWHM=2860±910 km/s) and Gauss-hermite polinomial fit (FWHM=4710±390 km/s).The first method is known to underestimate the line width, the other method to overerestimate(Denney et al. 2009).
From the mean of the two estimates we obtain: mBH=(5.3+4.4-3.3) *1088 solar masses

Disk luminosity andBH mass from
archival SDSS + GALEX
photometry
Yellow data: 2001(March optical, November radio)
Green data: 2002 May (simultaneous optical – radio observations)
Light green: 2007 January near-ir photometry
Blu data: Optical (2007 April)
Black data: radio (January 2009)
Cyan data: radio (2010 January)
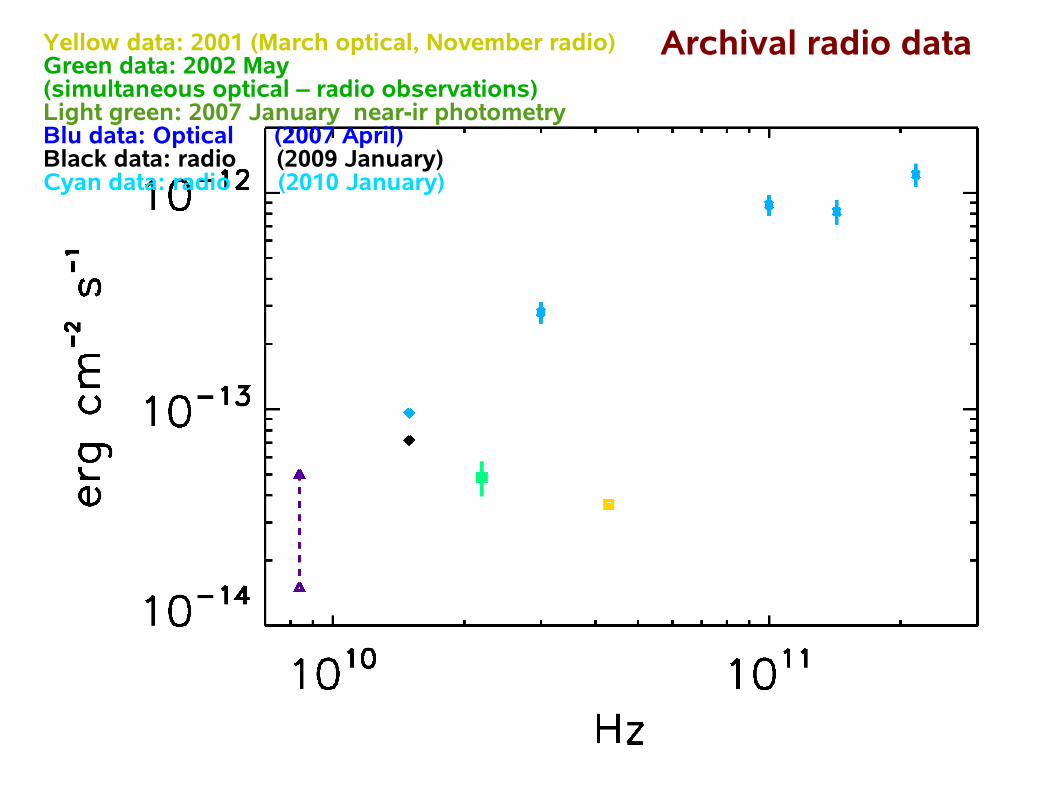
Archival radio dataYellow data: 2001 (March optical, November radio)Green data: 2002 May (simultaneous optical – radio observations)Light green: 2007 January near-ir photometryBlu data: Optical (2007 April) Black data: radio (2009 January)Cyan data: radio (2010 January)

Archival optical dataYellow data: 2001 (March optical, November radio)Green data: 2002 May (simultaneous optical – radio observations)Light green: 2007 January near-ir photometryBlu data: Optical (2007 April) Black data: radio (2009 January)Cyan data: radio (2010 January)

Disk luminosity and BH massfrom archival SDSS + GALEX photometry
We assumed these SDSS+GALEX data to be obtained during a low activityPeriod, dominated by a Shakura-Sunyaev accretion disk (Shakura-Sunyaev 1974).
The Non thermal dominance evaluated from CIV line emission and continuum, and from Mg II line give a value of 1, consistent with a pure disk emission.
We modelled the disk emisison with the prescriptions in Ghisellini & Tavecchio (2009), with inner Radius of 3 r
s
and outer radius of 500 rs.
We obtained:a disk luminosity of ~8.9*1045 erg/s, rs~2.4*1014cm
a max emitting Temperature of ~5.4*104K
mBH~8*1088 solar masses(in agreement with thevirial determination).
The i filter SDSS photometryIncludes the Mg II line emission,
The NUV GALEX photometryIncludes the Lyα

Multiepoch SEDAGILE/GRID and simultaneous data in red
FERMI-LAT data(4-day integration around the flare)and simultanous data in blackFermi-LAT data in green(30-day integration around the flare)Fermi-LAT data in cyan (2FGL catalog)
For the EC contribution we adoptedthe parametrization inGhisellini & Tavecchio 2009
And we assumed the disk luminosityduring the flares of the same amount asmeasured during low states of 2001

Multiepoch SEDAGILE/GRID and simultaneous data in red
FERMI-LAT data (4-day integration around the flare)and simultanous data in blackFermi-LAT data in green (30-day integration around the flare)Fermi-LAT data in cyan (2FGL catalog)
Dissipation region at 7 pc from the SMBHRblob=2*1018cmB=1*10-2 Gauss
Dissipation region at 0.2 pc from the SMBH(Just outside the BLR)Rblob=6.7*1016cm B=0.6 Gauss This model gives a satisfactory gamma-ray
spectral shape, but the expected variability is ~102
days
Rdiss=0.2 pc Rdiss=7 pc

Multiepoch SED
Model is for a dissipation region at 5 pc from the central BH,a blob radius of 1*1017 cm, B=7*10-2 Gauss
Rblob=0.0067*Rdiss in agreement within a factor 2 withBromberg and Levinson 2009 (Rblob=10-2.5 Rdiss )inverting Rdiss=2.5*Ljet,46(RBLR/0.1 pc)-1 and using Rdiss =5 pc, we obtainLjet=3.5*1046 erg/s. We need to assume that the p/e number ratio is ~0.1to accomplish such a luminosity.
Relaxing the relation between blob radius and dissipation region (as in Tavecchio 2011),and using a blob radius suitable for the observed gamma-ray variability
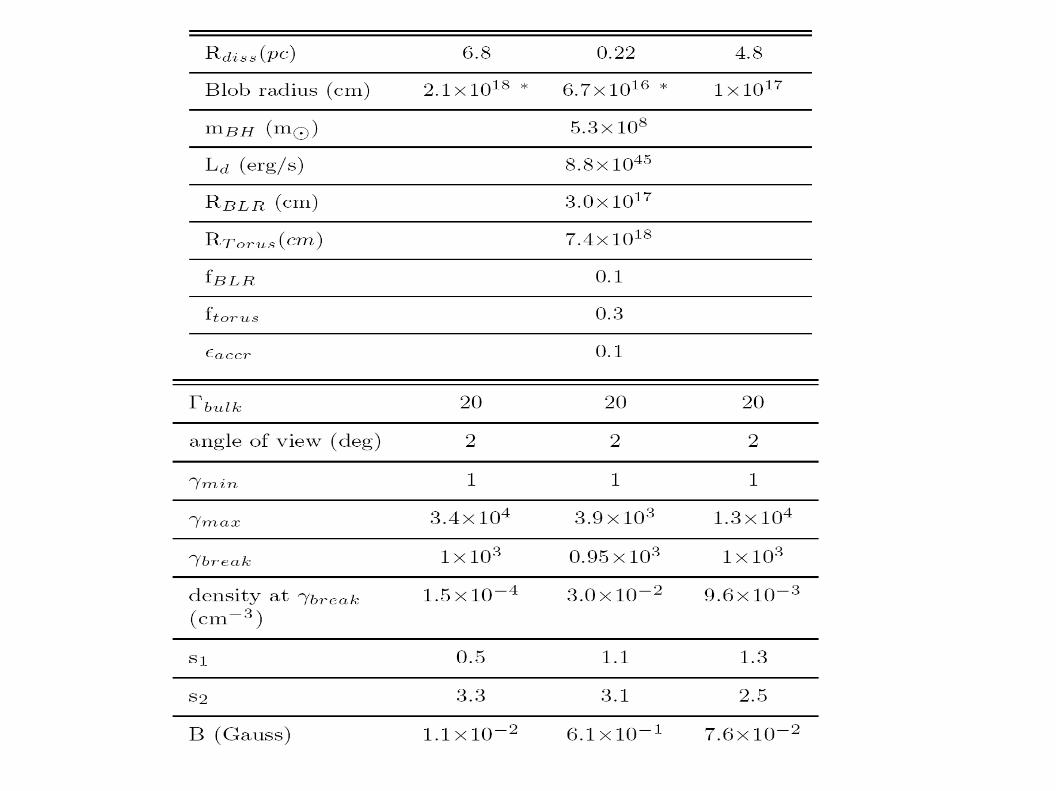

**) Assuming p/e=1
(**)
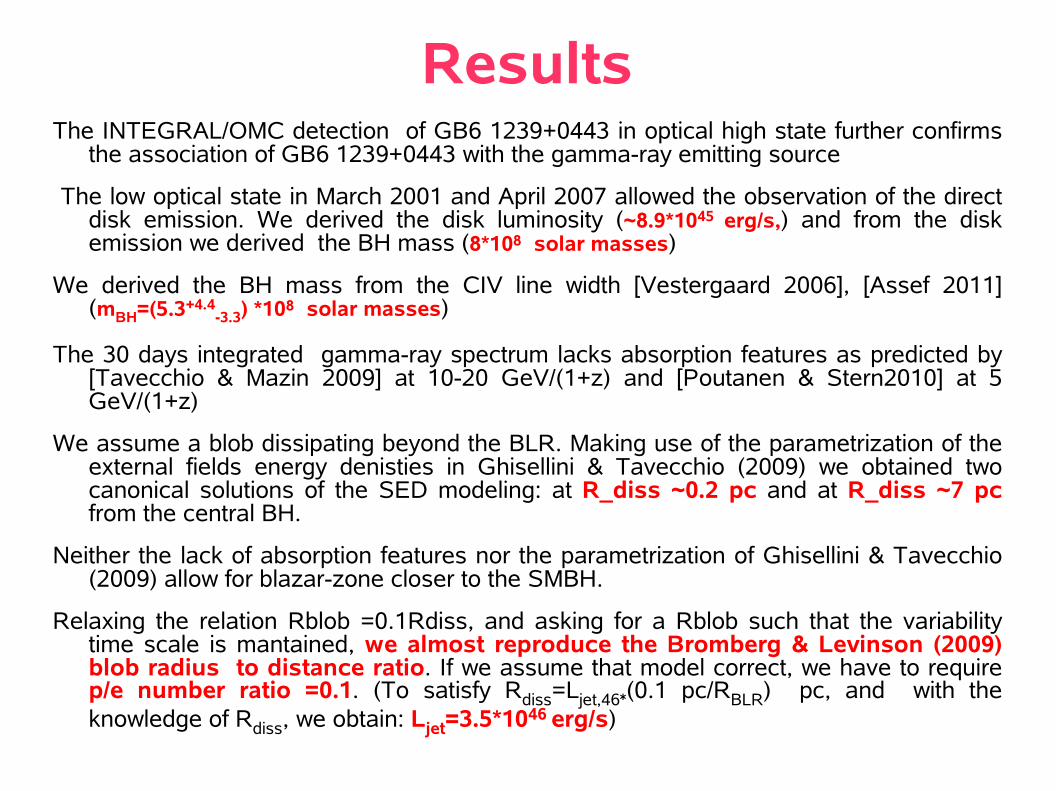
ResultsThe INTEGRAL/OMC detection of GB6 1239+0443 in optical high state further confirms
the association of GB6 1239+0443 with the gamma-ray emitting source
The low optical state in March 2001 and April 2007 allowed the observation of the direct disk emission. We derived the disk luminosity (~8.9*1045 erg/s,) and from the disk emission we derived the BH mass (8*1088 solar masses)
We derived the BH mass from the CIV line width [Vestergaard 2006], [Assef 2011] (mBH=(5.3+4.4
-3.3) *1088 solar masses)
The 30 days integrated gamma-ray spectrum lacks absorption features as predicted by [Tavecchio & Mazin 2009] at 10-20 GeV/(1+z) and [Poutanen & Stern2010] at 5 GeV/(1+z)
We assume a blob dissipating beyond the BLR. Making use of the parametrization of the external fields energy denisties in Ghisellini & Tavecchio (2009) we obtained two canonical solutions of the SED modeling: at R_diss ~0.2 pc and at R_diss ~7 pc from the central BH.
Neither the lack of absorption features nor the parametrization of Ghisellini & Tavecchio (2009) allow for blazar-zone closer to the SMBH.
Relaxing the relation Rblob =0.1Rdiss, and asking for a Rblob such that the variability time scale is mantained, we almost reproduce the Bromberg & Levinson (2009) blob radius to distance ratio. If we assume that model correct, we have to require p/e number ratio =0.1. (To satisfy Rdiss=Ljet,46*(0.1 pc/RBLR) pc, and with the knowledge of Rdiss, we obtain: Ljet=3.5*1046 erg/s)

Prospects
We found in the Fermi-LAT sample, about 10 FSRQ that have a gamma-ray spectrum similar to GB6 J1239+0443: we are selecting those with an almost flat gamma-ray spectrum extended up to 20-40 GeV, and with a similar optical-UV SED shape during flares.
Radio observations will allow to disentangle between models (model 2 does not require self absorption in radio). Not only the dissipation region location could be obtained, but if models like model 3 could be confirmed, compliant with Bromberg and Levinson (2009), they will tell us about the p/e number ratio.
But we need an extensive radio/optical/X-ray monitoring program on the sample, or at least radio observations just after the gamma-ray flare?
Trigger, starting from Fermi archived data, is not time consuming (starting from a list of candidates).

SED during flares
For some of the candidates


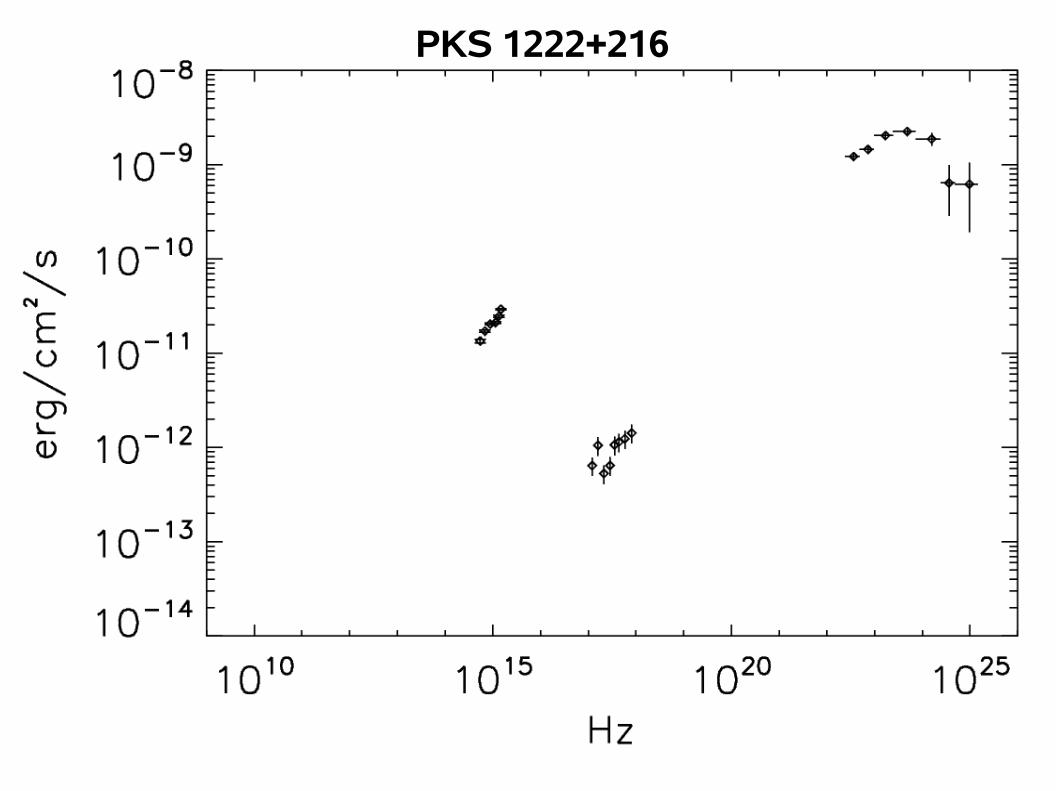
PKS 1222+216
AcknowledgementsWe acknowledge financial contribution from the agreement ASI-INAF I/009/10/0.The AGILEMission is funded by the Italian Space Agency (through contract ASI I/089/06/2)with scientific and programmatic participation by the Italian Institute of Astrophysics(INAF) and the Italian Institute of Nuclear Physics (INFN).This research has made use of data from the MOJAVE database that is maintained by theMOJAVE team (Lister et al. 2009).This research has made use of the NASA/IPAC Extragalactic Database (NED) which is operatedby the Jet Propulsion Laboratory, California Institute of Technology, under contractwith the National Aeronautics and Space Administration.This research has made use of the SIMBAD database, operated at CDS, Strasbourg, France.RJA is supported by an appointment to the NASA Postdoctoral Program at the Jet PropulsionLaboratory, administered by Oak Ridge Associated Universities through a contract withNASA.The Fermi LAT Collaboration acknowledges generous ongoing support from a number ofagencies and institutes that have supported both the development and the operation of theLAT as well as scientific data analysis. These include the National Aeronautics and SpaceAdministration and the Department of Energy in the United States, the Commissariat `al’Energie Atomique and the Centre National de la Recherche Scientifique / Institut Nationalde Physique Nucl´eaire et de Physique des Particules in France, the Agenzia Spaziale Italianaand the Istituto Nazionale di Fisica Nucleare in Italy, the Ministry of Education, Culture,Sports, Science and Technology (MEXT), High Energy Accelerator Research Organization(KEK) and Japan Aerospace Exploration Agency (JAXA) in Japan, and the K. A. WallenbergFoundation, the Swedish Research Council and the Swedish National Space Boardin Sweden. Additional support for science analysis during the operations phase is gratefullyacknowledged from the Istituto Nazionale di Astrofisica in Italy and the Centre Nationald’´Etudes Spatiales in France.