THE CHARACTERIZATION OF SOME METHACRYLATE AND …etd.lib.metu.edu.tr/upload/12615308/index.pdf ·...
198
THE CHARACTERIZATION OF SOME METHACRYLATE AND ACRYLATE HOMOPOLYMERS, COPOLYMERS AND FIBERS VIA DIRECT PYROLYSIS MASS SPECTROSCOPY A THESIS SUBMITTED TO THE GRADUATE SCHOOL OF NATURAL AND APPLIED SCIENCES OF MIDDLE EAST TECHNICAL UNIVERSITY BY SURİYE ÖZLEM GÜNDOĞDU IN PARTIAL FULFILLMENT OF THE REQUIREMENTS FOR THE DEGREE OF DOCTOR OF PHILOSOPHY IN POLYMER SCIENCE AND TECHNOLOGY DECEMBER 2012
Transcript of THE CHARACTERIZATION OF SOME METHACRYLATE AND …etd.lib.metu.edu.tr/upload/12615308/index.pdf ·...
THE CHARACTERIZATION OF SOME METHACRYLATE AND ACRYLATE HOMOPOLYMERS, COPOLYMERS AND FIBERS VIA DIRECT PYROLYSIS MASS
SPECTROSCOPY
A THESIS SUBMITTED TO THE GRADUATE SCHOOL OF NATURAL AND APPLIED SCIENCES
OF MIDDLE EAST TECHNICAL UNIVERSITY
BY
SURİYE ÖZLEM GÜNDOĞDU
IN PARTIAL FULFILLMENT OF THE REQUIREMENTS FOR
THE DEGREE OF DOCTOR OF PHILOSOPHY IN
POLYMER SCIENCE AND TECHNOLOGY
DECEMBER 2012
ii
Approval of the thesis:
THE CHARACTERIZATION OF SOME METHACRYLATE AND ACRYLATE HOMOPOLYMERS, COPOLYMERS AND FIBERS VIA DIRECT PYROLYSIS MASS
SPECTROSCOPY submitted by SURİYE ÖZLEM GÜNDOĞDU in partial fulfillment of the requirements for the degree of Doctor of Philosophy in Polymer Science and Technology Department by,
Prof. Dr. Canan Özgen Dean, Graduate School of Natural and Applied Sciences
Prof. Dr. Teoman Tinçer Head of Department, Polymer Science and Technology
Prof. Dr. Jale Hacaloğlu Supervisor, Chemistry Dept., METU
Examining Committee Members: Prof. Dr. Nursel Dilsiz Chemical Engineering Dept., Gazi University Prof. Dr. Jale Hacaloğlu Chemistry Dept., METU Prof. Dr. Göknur Bayram Chemical Engineering Dept., METU Prof. Dr. Cevdet Kaynak Metallurgical and Materials Engineering Dept., METU Prof. Dr. Ahmet M. Önal Chemistry Dept., METU
Date: 19.12.2012
iii
I hereby declare that all information in this document has been obtained and presented in accordance with academic rules and ethical conduct. I also declare that, as required by these rules and conduct, I have fully cited and referenced all material and results that are not original to this work.
Name, Last Name : SURİYE ÖZLEM GÜNDOĞDU Signature :
iv
ABSTRACT
THE CHARACTERIZATION OF SOME METHACRYLATE AND ACRYLATE HOMOPOLYMERS, COPOLYMERS AND FIBERS VIA DIRECT PYROLYSIS MASS
SPECTROSCOPY
Özlem Gündoğdu, Suriye
Ph.D., Department of Polymer Science and Technology
Supervisor: Prof. Dr. Jale Hacaloğlu
December 2012, 177 pages
Poly(methyl methacrylate) possesses many desirable properties and is used in various
areas. However, the relatively low glass transition temperature limits its applications in
textile and optical-electronic industries. Monomers containing isobornyl, benzyl and
butyl groups as the side chain are chosen to copolymerize with MMA to increase Tg
and to obtain fibers with PMMA.
In this work, thermal degradation characteristics, degradation products and
mechanisms of methacrylate homopolymers, poly(methyl methacrylate), poly(butyl
methacrylate), poly(isobornyl methacrylate) and poly(benzyl methacrylate), acrylate
homopolymers, poly(n-butyl acrylate), poly(t-butyl acrylate), poly(isobornyl acrylate),
two, three and four component copolymers of MMA and fibers are analyzed via direct
pyrolysis mass spectrometry. The effects of substituents on the main and side chains,
the components present in the copolymers and fiber formation on thermal stability,
degradation characteristics and degradation mechanisms are investigated.
According to the results obtained, the depolymerization mechanism yielding mainly the
monomer is the main thermal decomposition route for the methacrylate polymers,
acrylate polymers degradation occurs by H-transfer reactions from the main chain to the
carbonyl groups. However, when the alkoxy group involves γ-H, then, H-transfer
v
reactions from the alkoxy group to the CO group also takes place leading to a complex
thermal degradation mechanism.
The thermal degradation mechanisms and the relative yields of products are affected by
copolymerization due to the inter and intra-molecular interactions. As a consequence of
transesterification reactions new fragments can be generated.
In general, the samples taken from different parts of the fibers do not show different
thermal degradation behavior. However, upon fiber formation, enhancements in
intermolecular interactions decreasing the thermal stability and changing the product
distribution are detected.
Keywords: PMMA copolymers, fiber formation, thermal degradation, direct pyrolysis
mass spectrometry.
vi
ÖZ
BAZI METAKRİLAT VE AKRİLAT HOMOPOLİMERLERİNİN, KOPOLİMERLERİN VE
FİBERLERİNİN DİREKT PİROLİZ KÜTLE SPEKTROMETRESİ İLE KARAKTERİZASYONU
Özlem Gündoğdu, Suriye
Doktora, Polimer Bilimi ve Teknolojisi Bölümü
Tez Yöneticisi: Prof. Dr. Jale Hacaloğlu
Aralık 2012, 177 sayfa
Poli(metil metakrilat) fiziksel ve kimyasal özellikleri nedeniyle oldukça geniş uygulama
alanı olan bir polimer türü haline gelmiştir. Buna rağmen, oldukça düşük olan Tg’si bu
polimerin tekstil ve optik-elektronik endüstrisinde kullanımını kısıtlamaktadır. Bu
nedenle, PMMA, Tg’si arttırılmak amacıyla yan zincir olarak bütil, benzil ve izobornil
grupları içeren monomerlerle kopolimerleştirilmekte ve fiberleştirilmektedirler.
Bu çalışmada, metakrilat homopolimerler, poli(metil metakrilat), poli(bütil metakrilat),
poli(izobornil metakrilat), poli(benzil metakrilat) akrilat homopolimerler, poli(n-bütil
akrilat), poli(t-bütil akrilat), poli(izobornil akrilat), ve bu monomerlerin ikili, üçlü ve dörtlü
kopolimerlerinin, elyaflarının ısıl bozunum karakterleri, ürünleri ve mekanizmaları
doğrudan piroliz kütle spektrometresi yöntemi kullanılarak analiz edilmiştir. Bu
çalışmalar neticesinde, ana ve yan zincirlerdeki moleküllerin çeşitliliği, kopolimeri
oluşturan her bir parçanın birbiri üzerindeki etkisi ve elyaf oluşumunun ısıl kararlılık,
bozunum karakteristiği ve ısıl bozunum mekanizması üzerindeki etkisi incelenmiştir.
Elde edilen sonuçlara göre, metakrilat polimerleri için temel bozunum mekanizmasının
monomer oluşumuna neden olan depolimerizasyon olduğu görülmüştür, akrilat
polimerlerinin bozunumu ise ana zincirden karbonil gruba hidrojen transfer
reaksiyonuyla başlamaktadır. Fakat alkoksi grup γ-H içeriyorsa bu gruptan karbonil
gruba hidrojen transfer reaksiyonları da oluşabilmektedir ve bu tür durumlarda genellikle
reaksiyon, karmaşık termal bozunum mekanizmalarıyla devam etmektedir.
vii
Kopolimerleşme nedeniyle moleküller arası etkileşimin farklılaşmasının, maddelerin ısıl
bozunum mekanizmalarını ve ürünlerinin bağıl verimliliğini etkilediği gösterilmiştir.
Transesterifikasyon reaksiyonları sonucunda da yeni ürünler oluşmuştur.
Genel olarak, elyafların farklı bölgelerinden alınan örnekler farklı ısıl bozunum
davranışları sergilemezler. Fakat elyaf oluşumun etkisiyle moleküller arası etkileşimin
farklılaşması nedeniyle termal bozunum ürünlerinde ve bu ürünlerin ısıl kararlılıklarında
bazı değişikliklerin olabildiği gösterilmiştir.
Anahtar Kelimeler: PMMA kopolimerleri, elyaf oluşumu, ısıl bozunum, doğrudan piroliz
kütle spektrometresi.

viii
To my lovely husband, Gençay……..
ix
ACKNOWLEDGEMENTS
I would like to express my deepest gratitude to my thesis supervisor Prof. Dr. Jale
Hacaloğlu for her guidance, patience, understanding, kind support, encouraging
advices, criticism, and valuable discussions throughout my thesis. I thank Prof. Dr.
Ahmet M. Önal, Prof. Dr. Göknur Bayram, Prof. Dr. Cevdet Kaynak and Prof. Dr. Nursel
Dilsiz for their helpful comments and suggestions as committee members.
I would sincerely thank to Dr. Yusuf Nur for his guidance, patience and valuable
friendship during my learning stage of using the concerning laboratory instruments and
Dr. Evren Güler for her contribution in providing most of the polymers used in my
experiments.
My special thanks go to my mother, father and my brother for their continuous support,
patience and encouragement.
Last but not the least; I wish to express my sincere thanks to my husband Gençay
Gündoğdu for his support, understanding and endless love.
x
TABLE OF CONTENTS
ABSTRACT ...................................................................................................................... iv
ÖZ ..................................................................................................................................... vi
ACKNOWLEDGEMENTS ................................................................................................ ix
TABLE OF CONTENTS .................................................................................................... x
LIST OF TABLES ............................................................................................................ xiii
LIST OF FIGURES .......................................................................................................... xv
LIST OF SCHEMES ....................................................................................................... xix
LIST OF ABBREVIATIONS ............................................................................................. ix
CHAPTERS
1. INTRODUCTION .......................................................................................................... 1
1.1 Polymers and Fibers ................................................................................................. 1
1.1.1 Fiber Spinning ................................................................................................... 2
1.1.1.1 Wet Spinning ............................................................................................. 3
1.1.1.2 Dry Spinning .............................................................................................. 4
1.1.1.3 Melt Spinning ............................................................................................. 4
1.1.1.4 Gel Spinning .............................................................................................. 5
1.1.2 Application Areas of Polymers .......................................................................... 5
1.2 Thermal Degradation of Polymers ............................................................................. 6
1.2.1 Depolymerization ........................................................................................... 7
1.2.2 Random Chain Scission ............................................................................... 7
1.2.3 Side Group Elimination ................................................................................. 7
1.3 Thermal Degradation Techniques ............................................................................. 7
1.3.1 Thermogravimetric Analysis (TGA) ................................................................... 8
1.3.2 Thermal Volatilization Analysis (TVA) ............................................................... 9
1.3.3 Differential Scanning Analysis (DSC) .............................................................. 10
1.3.4 Pyrolysis (Py) ................................................................................................... 11
1.3.4.1 Pyrolysis GC/MS (Py-GC/MS) ................................................................ 12
1.3.4.2 Direct Pyrolysis-MS (DP-MS) .................................................................. 13
1.4. Acrylate Polymers .................................................................................................. 15
xi
1.4.1 Why Acrylates are Copolymerized? ............................................................... 17
1.4.2 Poly(methyl methacrylate) PMMA ................................................................. 18
1.4.3 Poly(butyl acrylate) and It’s Copolymer with PMMA ..................................... 21
1.4.4 Poly(benzyl metharylate) PBzMA and It’s Copolymer with PMMA .............. 26
1.4.5 Poly(isobornylacrylate) (PIBA) and It’s Copolymer with PMMA ................... 27
1.5 Aim of Work ............................................................................................................ 30
2. EXPERIMENTAL ........................................................................................................ 32
2.1 Materials ................................................................................................................ 32
2.1.1 Homopolymers ............................................................................................. 32
2.1.2 Copolymers ................................................................................................... 33 2.1.3 Fibers ............................................................................................................ 34
2.2 Characterization ..................................................................................................... 36
2.2.1 Fourier Transform Infrared (FTIR) ................................................................. 36
2.2.2 Differential Scanning Calorimetry (DSC) ....................................................... 36
2.2.3 Thermogravimetry Analyzer (TGA) ............................................................... 37
2.2.4 Direct Pyrolysis Mass Spectrometry (DP-MS) .............................................. 37
3. RESULTS AND DISCUSSION ................................................................................... 38
3.1 Homopolymers ........................................................................................................ 38
3.1.1 Thermal Degradation of PMMA ....................................................................... 38
3.1.2 Thermal Degradation of Acrylates Involving Butoxy Group ............................ 42
3.1.2.1 Thermal Degradation of Poly(n-butyl methacrylate) PnBMA .................. 43
3.1.2.2 Thermal Degradation of Poly(n-butyl acrylate) PnBA .............................. 50
3.1.2.3 Thermal Degradation of Poly(t-butyl acrylate), PtBA ............................... 62
3.1.3 Thermal Degradation of Poly (isobornyl acrylate) PIBA ................................. 66
3.1.4 Thermal Degradation of Poly(isobornyl methacrylate) PIBMA ....................... 74
3.1.5 Thermal Degradation of Poly(benzyl methacrylate) PBzMA .......................... 79
3.2 Copolymers .............................................................................................................. 84
3.2.1 Poly(methyl methacrylate-co-nbutyl acrylate) ................................................. 84
3.2.2 Poly(methyl methacrylate-co- isobornyl acrylate) ........................................... 95
3.2.3 Poly(methyl methacrylate-co-benzyl methacrylate) ...................................... 103
3.2.4 Poly(methyl methacrylate-co-nbutyl acrylate-co-ısobornyl acrylate) ............ 107
3.2.5 Poly(methyl methacrylate-co-nbutylacrylate-co-ısobornyl acrylate) ............ 125
xii
3.3.Fibers ..................................................................................................................... 134
3.3.1 Poly(methyl methacrylate)-poly(benzyl methacrylate) fiber ......................... 134
3.3.2 P(MMA-co-BzMA) fiber ................................................................................. 141
3.3.3 P(MMA-co-nBA-co-IBA) fiber ....................................................................... 147
4.CONCLUSION ........................................................................................................... 155
REFERENCES ...................................................................................................... 160
APPENDICIES
A. SPECTRAL DATA ........................................................................................... 166
CURRICULUM VITAE ........................................................................................... 176
xiii
LIST OF TABLES TABLES
Table 1 Molecular weights and polydispersity indexes of the homopolymers .............. 32
Table 2 Molecular weights and polydispersity indexes of the copolymers ................... 35
Table 3 Molecular weights and mole percentages of fibers ........................................... 41
Table 4 The relative intensities and assignments made for the intense and/or characteristic peaks present in the pyrolysis mass spectra of PMMA recorded at 325 and 420oC ...................................................................................................................... 46
Table 5 The relative intensities and assignments made for the intense and/or characteristic peaks present in the pyrolysis mass spectrum of PnBMA at 395 and 425 oC .................................................................................................................................... 52
Table 6 The relative intensities and assignments made for the intense and/or characteristic peaks present in the pyrolysis mass spectra of PnBA recorded at 280 and 375 oC ............................................................................................................................. 64
Table 8 The relative intensities and assignments made for the intense and/or characteristic peaks present in the pyrolysis mass spectrum of PIBA at 335 and 440 oC .......................................................................................................................................... 69
Table 9 The relative intensities and assignments made for the intense and/or characteristic peaks present in the pyrolysis mass spectrum of PIBMA at 342 and 440 oC .................................................................................................................................... 77
Table 10 The relative intensities and assignments made for the intense and/or characteristic peaks present in the pyrolysis mass spectrum of PBzMA at 330 and 415 oC .................................................................................................................................... 82
Table 11 The relative intensities and assignments made for the intense and/or characteristic peaks present in the pyrolysis mass spectrum of P(MMA-co-nBA) at 325 and 420 oC ...................................................................................................................... 86
Table 12 The relative intensities and assignments made for the intense and/or characteristic peaks present in the pyrolysis mass spectrum of P(MMA-co-IBA) at 375 and 407 oC ..................................................................................................................... 97
Table 13 The relative intensities and assignments made for the intense and/or characteristic peaks present in the pyrolysis mass spectrum of P(MMA-co-BzMA) at 320 and 400 oC ............................................................................................................ 105
xiv
Table 14 The relative intensities and assignments made for the intense and/or characteristic peaks present in the pyrolysis mass spectrum of P(MMA-co-IBA-co-BA) at 332 and 440 oC …..………………….………………………………………………………………………….109
Table 15 The relative intensities (RI) and assignments made for the intense and/or characteristic peaks present in the pyrolysis mass spectrum of PMMA-PBzMA fiber first, second and end part at 322 and 403 oC ........................................................................ 115
Table 16: The relative intensities and assignments made for the intense and/or characteristic peaks present in the pyrolysis mass spectrum of P(MMA-co-IBA-co-nBA-co-BzMA) at 338 and 440°C ........................................................................................ 127
Table 17: The relative intensities and assignments made for the pyrolysis mass spectra of first, second and third parts of the P(MMA-co-nBA) fiber, the intense and/or characteristic peaks present at their peak maxima ....................................................... 136
Table 18: The relative intensities and assignments made for the pyrolysis mass spectra of first, second and third parts of P(MMA-co-BzMA) fiber, the intense and/or characteristic peaks present at 322 and 403°C ........................................................... 146
Table 19: The relative intensities and assignments made for the pyrolysis mass spectra of first, second and third parts of P(MMA-co-nBA-co-IBA) fiber, the intense and/or characteristic peaks present at 362 and 418°C ........................................................... 149
xv
LIST OF FIGURES FIGURE
Figure 1 Schematic diagram of fiber spinning process ................................................... 2
Figure 2 Schematic diagram of wet spinning process ..................................................... 3
Figure 3 Schematic diagram of dry spinning process ...................................................... 4
Figure 4 Schematic diagram of melt spinning process ................................................... 5
Figure 5 General formula of polyacrylate, R= alkyl group ............................................. 16
Figure 6 Poly(methyl acrylate) R=H, poly(methyl methacrylate) R=CH3 ....................... 18
Figure 7 Poly(butyl acrylate) R=H, poly(butyl methacrylate) R=CH3 .............................. 22
Figure 8 Poly(benzyl acrylate) R=H, poly(benzyl methacrylate) R=CH3 ........................ 26
Figure 9 Poly(isobornyl acrylate) R=H, poly(isobornyl methacrylate) R=CH3 ............... 28
Figure 10 Schematic diagram of the existing bi-component melt spinning facility at Empa, laboratory for Advanced Fibers ........................................................................... 36
Figure 11 TGA curve of PMMA ...................................................................................... 39
Figure 12 a. TIC curve, the pyrolysis mass spectra of PMMA at b. 325 and c. 420°C and d. single ion evolution profiles of some selected products ............................................ 40
Figure 13 Mass spectrum of MMA………………………………………………………………………………………….....41
Figure 14 Mass spectra of monomers a) n-butyl acrylate, b) t-butyl acrylate and c) n-butyl methacrylate ........................................................................................................... 43
Figure 15 TGA curve of PnBMA .................................................................................... 44
Figure 16 a. TIC curve and the pyrolysis mass of PnBMA at b. 395 and c. 425°C ....... 45
Figure 17 Single ion evolution profiles of some selected products detected during the pyrolysis of PnBMA ........................................................................................................ 47
Figure 18 TGA curve of PnBA ....................................................................................... 50
xvi
Figure 19 a. TIC curve, the pyrolysis mass of PnBA at b. 280, c. 375 and d. 420°C ... 51
Figure 20 Single ion evolution profiles of some selected products detected during the pyrolysis PnBA .............................................................................................................. 61
Figure 21 TGA curve of PtBA ......................................................................................... 62
Figure 22 a. TIC curve, the pyrolysis mass of PtBA at b. 250 and c. 440°C ................ 63
Figure 23 Single ion evolution profiles of some selected products detected during the pyrolysis of PtBA ............................................................................................................ 65
Figure 24 TGA curve of PIBA ........................................................................................ 67
Figure 25 Mass spectrum of isobornyl acrylate .............................................................. 67
Figure 26 a. TIC curve and the pyrolysis mass of PIBA at b. 335, c. 345 and d. 440°C ..................................................................................................................................... … 68
Figure 27 Mass spectrum of isobornylene .................................................................... 69
Figure 28 Single ion evolution profiles of some selected products detected during the pyrolysis of PIBA ............................................................................................................ 71
Figure 29 TGA curve of PIBMA ...................................................................................... 75
Figure 30 a. TIC curve and the pyrolysis mass of PIBMA at b. 225, c. 342, d.355 and e. 440°C ............................................................................................................................. 76
Figure 31 Single ion evolution profiles of some selected products detected during the pyrolysis of PIBMA ......................................................................................................... 78
Figure 32 TGA curve of PBzMA .................................................................................... 79
Figure 33 Mass spectrum of benzyl methacrylate .......................................................... 80
Figure 34 Single ion evolution profiles of some selected products detected during the pyrolysis of PBzMA ........................................................................................................ 81
Figure 35 Single ion evolution profiles of some selected products detected during the pyrolysis of PBzMA ........................................................................................................ 83
Figure 36 TGA curve of P(MMA-co-nBA) ....................................................................... 84
Figure 37 a. TIC curve and the pyrolysis mass of P(MMA-co-nBA) at b. 325 and c. 420°C .............................................................................................................................. 85
Figure 38 Single ion evolution profiles of some selected products recorded during pyrolysis of (PMMA-co-PBA) .......................................................................................... 88
xvii
Figure 39 TGA curve of P(MMA-co-IBA) ........................................................................ 95
Figure 40 a. TIC curve and the pyrolysis mass of P(MMA-co-IBA) at b. 320, c. 375 and d. 407°C ......................................................................................................................... 96
Figure 41 Single ion evolution profiles of some selected products recorded during pyrolysis of (PMMA-co-PIBA) ........................................................................................ 101
Figure 42 TGA curve of P(MMA-co-BzMA) .................................................................. 103
Figure 43 a. TIC curve and the pyrolysis mass of P(MMA-co-BzMA) at b. 320 and c. 400°C …. ....................................................................................................................... 104
Figure 44 Single ion evolution profiles of some selected products detected during the pyrolysis of P(MMA-co-BzMA) ...................................................................................... 106
Figure 45 TGA curve of P(MMA-co-nBA-co-IBA) .......................................................... 107
Figure 46 a. TIC curve and the pyrolysis mass of P(MMA-co-IBA-co-nBA) at b. 332 and c. 440°C ........................................................................................................................ 108
Figure 47 a Single ion evolution profiles of some selected PIBA and PMMA based products recorded during pyrolysis of P(MMA-co-IBA-co-nBA) ................................... 113
Figure 47 b. Single ion evolution profiles of some selected PBA and PMMA based products recorded during pyrolysis of P(MMA-co-IBA-co-nBA) ................................... 114
Figure 48 TGA curve of P(MMA-co-nBA-co-IBA) .......................................................... 116
Figure 49 a. TIC curve and the pyrolysis mass of P(MMA-co-nBA-co-IBA) at b. 358 and c. 403, d. 427°C ........................................................................................................... 117
Figure 50 a. Single ion evolution profiles of some selected PBA and PMMA based products recorded during pyrolysis of P(MMA-co-nBA-co-IBA) ................................... 121
Figure 50 b. Single ion evolution profiles of some selected PBA and PMMA based products recorded during pyrolysis of P(MMA-co-nBA-co-IBA) ................................... 122
Figure 51 TGA curve of P(MMA-co-nBA-co-IBA-co-BzMA) .......................................... 125
Figure 52 a. TIC curve and the pyrolysis mass of P(MMA-co-IBA-co-BA-co-BzMA) at b. 338 and c. 440°C ........................................................................................................ 126
Figure 53 a. Single ion evolution profiles of some selected PBzMA and PMMA based products recorded during pyrolysis of P(MMA-co-IBA-co-nBA-co-BzMA) ................... 129
Figure 53 b. Single ion evolution profiles of some selected PBA and PMMA based products recorded during pyrolysis of P(MMA-co-IBA-co-nBA-co-BzMA) ................... 130
xviii
Figure 53 c. Single ion evolution profiles of some selected PIBA and PMMA based products recorded during pyrolysis of P(MMA-co-IBA-co-nBA-co-BzMA) .................... 132
Figure 54 TGA curve of the second part of the P(MMA-co-nBA) fiber ....................... 134
Figure 55 a. TIC curve and the pyrolysis mass of P(MMA-co-nBA) fiber i. the first part at b. 392 and c. 433°C, ii. the second part at 392 and 440°C and iii. the third part at b. 396 and c. 425°C ................................................................................................................ 135
Figure 56 Single ion evolution profiles of some selected products recorded during pyrolysis of the second part of the P(MMA-co-nBA) fiber ........................................... 140
Figure 57 TGA curve of the second part of the P(MMA-co-BzMA) fiber ..................... 141
Figure 58.a TIC curve and single ion evolution profiles of some selected products recorded during pyrolysis of the first part of the P(MMA-co-BzMA) fiber ................... 143
Figure 58.b TIC curve and single ion evolution profiles of some selected products recorded during pyrolysis of the second part of P(MMA-co-BzMA) fiber .................... 144
Figure 58.c TIC curve and single ion evolution profiles of some selected products recorded during pyrolysis of the end part of P(MMA-co-BzMA) fiber ......................... 145
Figure 59. TGA curve of the third part of the P(MMA-co-nBA-co-IBA) fiber ................ 147
Figure 60. a. TIC curve and the pyrolysis mass spectrum of third part of P(MMA-co-nBA-co-IBA) fiber at b. 362, c. 406, d. 418 and e. 442°C ........................................... 148
Figure 61.a. Single ion evolution profiles of some selected PIBA and PMMA based products recorded during pyrolysis of P(MMA-co-nBA-co-IBA) fiber ......................... 152
Figure 61.b. Single ion evolution profiles of some selected PBA and PMMA based products recorded during pyrolysis of P(MMA-co-nBA-co-IBA) fiber ......................... 153
xix
LIST OF SCHEMES SCHEMES
Scheme 1 Poly(isobornyl methacrylate) thermal degradation mechanism ................... 29
Scheme 2 Camphene formation reaction ...................................................................... 29
Scheme 3 Chemical structures of (a) MMA, (b) BA, (c) BzMA, (d) IBMA and the polymerization reaction ................................................................................................... 33
Scheme 4 a. γ-hydrogen transfer to the carbonyl group a. from the alkyl chain (McLafferty rearrangement reaction) b. Generation of anhydride units ........................ 48
Scheme 5 Loss of alkoxy group from the side chain and subsequent carbon monoxide and unsaturated chain end production .......................................................................... 54
Scheme 6 McLafferty rearrangement, γ-Hydrogen transfer from the main chain to carbonyl groups. Generation of unsaturated chain ends .............................................. 55
Scheme 7 Hydrogen abstraction reactions .................................................................... 56
Scheme 8 Stabilization of dimer stable products by a. γ-hydrogen transfer reactions b. hydrogen abstraction reactions ...................................................................................... 57
Scheme 9 Generation of anhydride units ...................................................................... 58
Scheme 10 Loss of butanol by hydrogen transfer reactions .......................................... 59
Scheme 11 Random scissions of the main chain ......................................................... 59
Scheme 12 Thermal degradation of PIBA via side chains a. Degradation via loss of side chains b. Decomposition of isobornyl rings ................................................................... 72
Scheme 13 Generation of poly(acrylic acid) and isobornylene…………………………………73
Scheme 14 Generation of unsaturated chain ends ........................................................ 74
Scheme 15 Reaction between H2O-MMA and H2O-nBA .............................................. 91
Scheme 16 Trans-esterification reaction between acrylic acid and methyl methacrylate units ................................................................................................................................. 92
Scheme 17 Transesterification reaction between acrylic acid units and methanol ...... 93
Scheme 18 Reaction between BA and MMA units due to H-transfer reactions ........... 94
xx
LIST OF ABBREVIATIONS
HDPE High Density Polyethylene
PMMA Polymethyl Methacrylate
PVC Polyvinyl Chloride
TG Thermogravimetry
TGA Thermo Gravimetric Analysis
DSC Differential Scanning Calorimetry
TVA Thermal Volatilization Analysis
FTIR Fourier Transform Infrared Spectroscopy
MS Mass Spectrometry
Py Pyrolysis
GC Gas Chromatography
TIC Total Ion Chromatogram
DESI Desorption Electrospray Ionization
MALDI-MS Matrix Assisted Laser Desorption Mass Spectroscopy
APCI Atmospheric Pressure Chemical Ionization
PBMA Poly(butyl methacrylate)
PtBMA Poly(tert-butyl methacrylate)
PHFBMA Poly(hexafluoro butyl methacrylate)
PMA Poly(methy acrylate)
LC–PB-MS Liquid Chromatograpy- Particle Beam-Mass Spectrometry
p(MMA-co-BA) Poly(methyl methacrylate-co-butyl acrylate)
PBA Poly(butyl acrylate)
PBMA Poly(butyl methacrylate)
xxi
PBzMA Poly(benzyl methacrylate)
PVAc Polyvinyl Acetate
PIBA Poly(isobornyl acrylate)
PIBMA Poly(isobornyl methacrylate)
ATRP Atom Transfer Radical Polymerization
DMA Dynamic Mechanical Analyses
SAXS Small-Angle X-Ray Scattering
1
CHAPTER 1
INTRODUCTION
1.1 Polymers and Fibers
The chemistry and technology of man-made, fiber forming polymers dates back to
1885 when an artificial silk was patented by Chardonnet in France. Since then,
these materials have progressed to become the focus of a major global industry with
applications ranging from the everyday world of apparel to biomedical and advanced
aerospace engineering concepts.
Fiber is a class of materials that are continuous filaments or are in discrete
elongated pieces. They impart elasticity, flexibility, and tensile strength. They can be
spun into filaments, string, or rope, used as a component of composite materials, or
matted into sheets to make products such as paper. Fibers are often used in the
manufacture of other materials. The strongest engineering materials are generally
made as fibers, for example carbon fiber and ultra-high-molecular-weight
polyethylene fiber [1].
In the manufacture of all man-made fibers the most crucial step is the production of
polymers or polymer derivatives suitable for spinning into fibers. For fiber formation,
the polymer should contain crystallinity as much possible as in the structure.
Polyethylene, polypropylene, nylon, polyester, polyacrylonitrile and polyurethanes
are the most common polymers that are used in fiber formation due to their regular
structure which gives rise to the close packing of the chains so the polymers can be
spun into fibers.
Fibers are polymers characterized by a high initial modulus in the range of 1010 to
1011 dynes.cm-2. They have a low range of extensibility of the order 10 to 20 percent.
2
Parts of this extensibility is permanent, part of it shows delayed recovery, and part of
the elasticity is instantaneous. Most of the mechanical properties of fibers are
relatively independent of temperature over a fairly long range from above -50°C to
about 150°C, depending on the particular fiber [2].
The polymers used for synthetic fibers are similar, and in many cases identical to
those used as plastics, but for fibers, the processing operation must produce an
essentially infinite length-to-diameter ratio. In all cases this is accomplished by
forcing the plasticized polymer through a spinneret, a plate in which the multiplicity
of holes has been formed to produce the individual fiber. The cross section of the
spinneret holes obviously has a lot to do with the fiber cross section, which in turn
greatly influence the properties of the fiber and this is obtained with a fiber spinning
operation [3].
1.1.1 Fiber Spinning
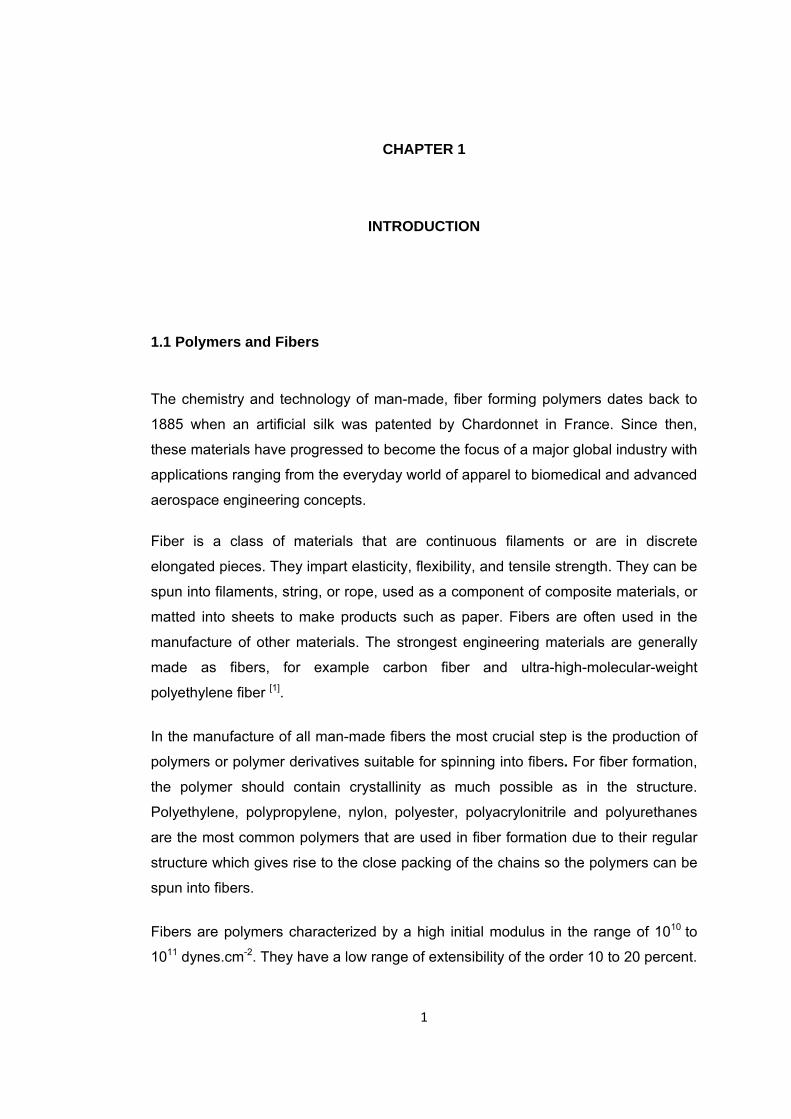
Fiber spinning is used to manufacture synthetic fibers. During fiber spinning, a
filament is continuously extruded through an orifice and stretched to diameters of
100 µm and smaller. The schematic diagram of fiber spinning process is shown in
Figure 1.
Figure 1. Schematic diagram of fiber spinning process.
3
In this process the molten polymer is first extruded through a filter to eliminate small
contaminants. The melt is then extruded through a spinneret, or die composed of
multiple orifices. The fibers are then drawn to their final diameter, solidified and
wound onto a spool. The solidification takes place either in a water bath or by forced
convection. The drawing and cooling processes determine the morphology and
mechanical properties of the final fiber. For example, ultra high molecular weight
(high density polyethylene) HDPE fibers with high degrees of orientation in the axial
direction can have the stiffness of steel with today’s fiber spinning technology [4].
There are basically four types of spinning operations which are wet spinning, dry
spinning, melt spinning and gel spinning, differing mainly in the method of
plasticizing and deplasticizing the polymer.
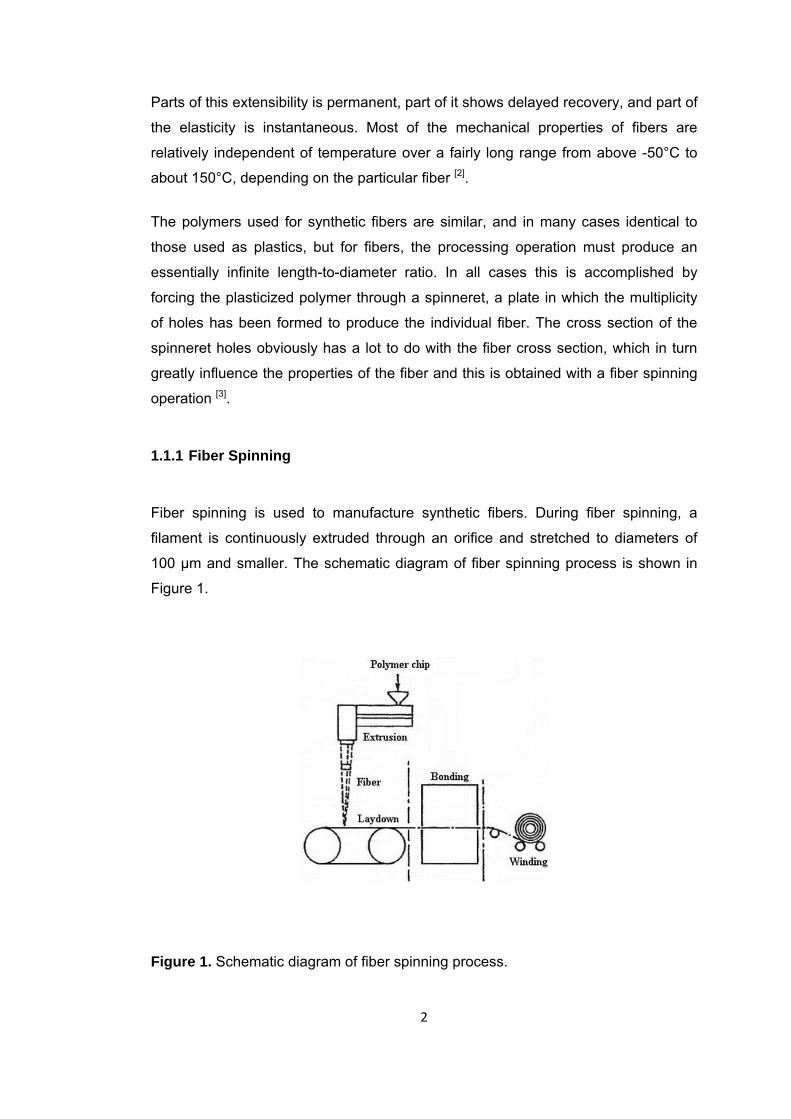
1.1.1.1 Wet Spinning
Of all the four processes, wet spinning is the oldest process. It is used for polymers
that need to be dissolved in a solvent to be spun. The spinneret remains submerged
in a chemical bath that leads the fiber to precipitate, and then solidify, as it emerges
out of the spinneret holes (Figure 2). Acrylic, rayon, aramid, mod acrylic and
spandex fibers all are manufactured through wet spinning.
Figure 2. Schematic diagram of wet spinning process.
4
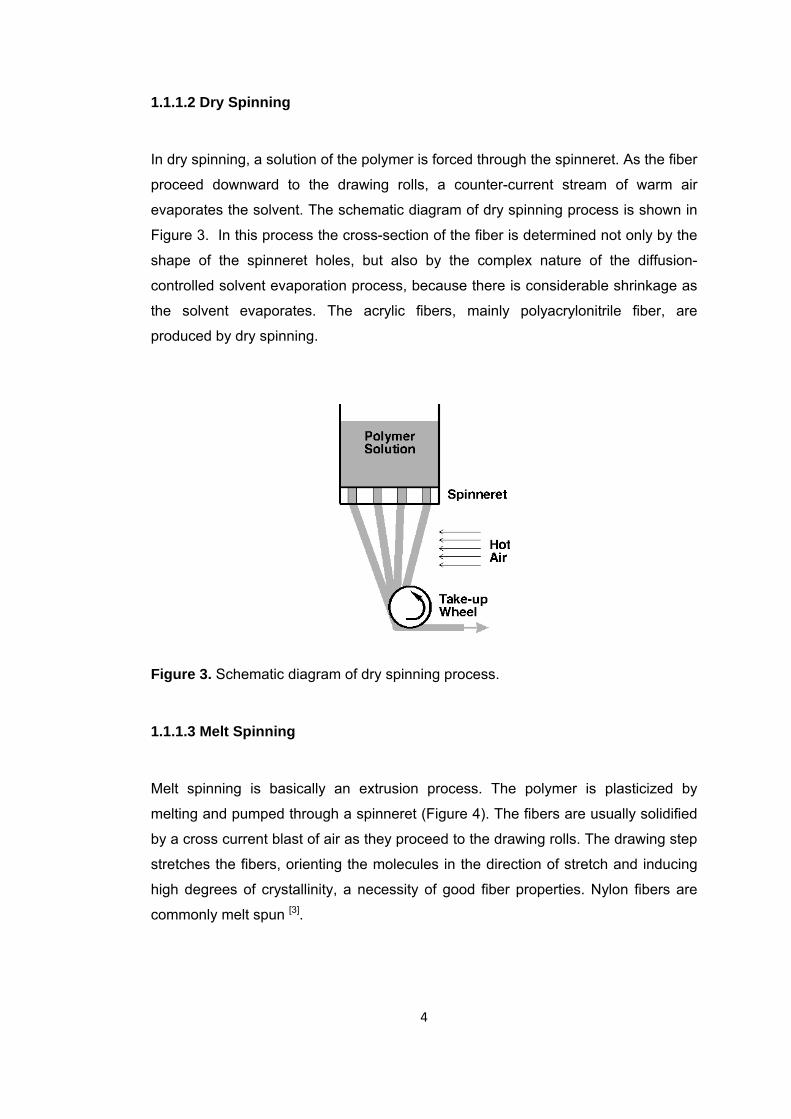
1.1.1.2 Dry Spinning
In dry spinning, a solution of the polymer is forced through the spinneret. As the fiber
proceed downward to the drawing rolls, a counter-current stream of warm air
evaporates the solvent. The schematic diagram of dry spinning process is shown in
Figure 3. In this process the cross-section of the fiber is determined not only by the
shape of the spinneret holes, but also by the complex nature of the diffusion-
controlled solvent evaporation process, because there is considerable shrinkage as
the solvent evaporates. The acrylic fibers, mainly polyacrylonitrile fiber, are
produced by dry spinning.
Figure 3. Schematic diagram of dry spinning process.
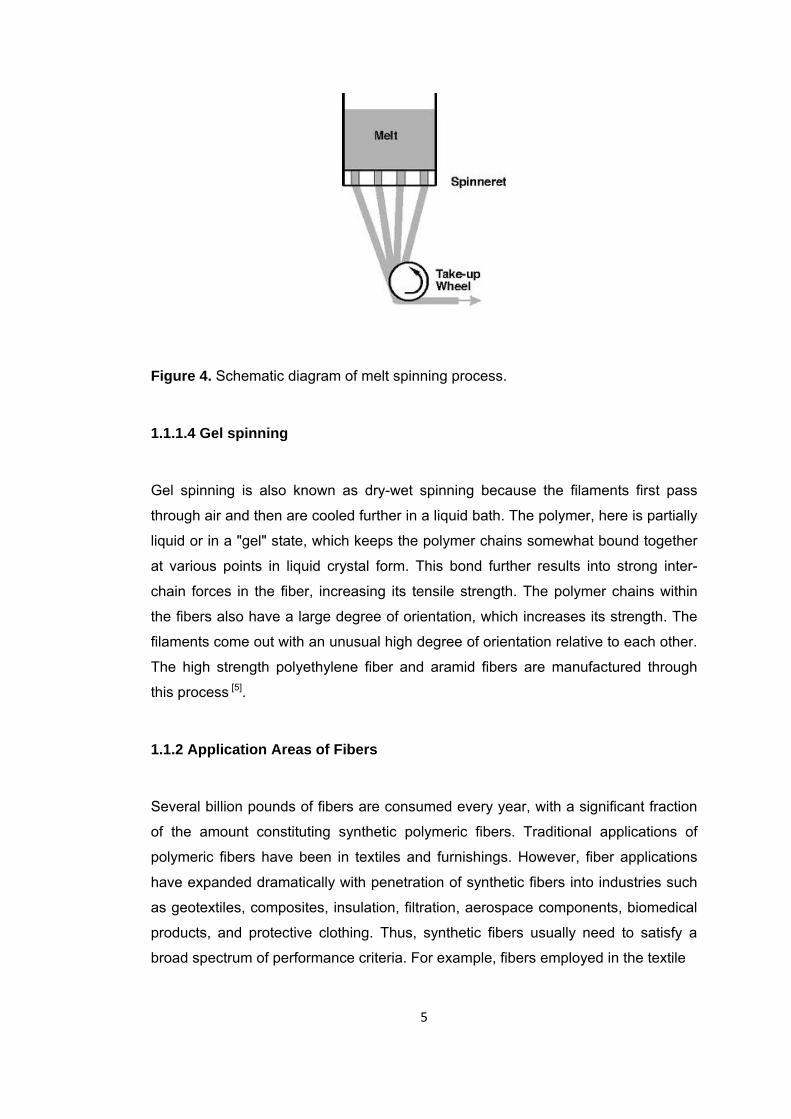
1.1.1.3 Melt Spinning
Melt spinning is basically an extrusion process. The polymer is plasticized by
melting and pumped through a spinneret (Figure 4). The fibers are usually solidified
by a cross current blast of air as they proceed to the drawing rolls. The drawing step
stretches the fibers, orienting the molecules in the direction of stretch and inducing
high degrees of crystallinity, a necessity of good fiber properties. Nylon fibers are
commonly melt spun [3].
5
Figure 4. Schematic diagram of melt spinning process.
1.1.1.4 Gel spinning
Gel spinning is also known as dry-wet spinning because the filaments first pass
through air and then are cooled further in a liquid bath. The polymer, here is partially
liquid or in a "gel" state, which keeps the polymer chains somewhat bound together
at various points in liquid crystal form. This bond further results into strong inter-
chain forces in the fiber, increasing its tensile strength. The polymer chains within
the fibers also have a large degree of orientation, which increases its strength. The
filaments come out with an unusual high degree of orientation relative to each other.
The high strength polyethylene fiber and aramid fibers are manufactured through
this process [5].
1.1.2 Application Areas of Fibers
Several billion pounds of fibers are consumed every year, with a significant fraction
of the amount constituting synthetic polymeric fibers. Traditional applications of
polymeric fibers have been in textiles and furnishings. However, fiber applications
have expanded dramatically with penetration of synthetic fibers into industries such
as geotextiles, composites, insulation, filtration, aerospace components, biomedical
products, and protective clothing. Thus, synthetic fibers usually need to satisfy a
broad spectrum of performance criteria. For example, fibers employed in the textile
6
industry needs a high softening temperature, adequate tensile strength over fairly
wide temperature range, solubility or meltability for spinning, high modulus,
dyeability, chemical, biological and thermal stability, flame resistance, and good
appearance. Enhancing the quality of fibers requires changes not only in the
chemistry of the material to obtain desired properties, but also significant
modifications in the spinning process. The search for higher performance materials
has led researchers to either blend existing polymers or polymerize different
monomers simultaneously. Blending and copolymerization approaches to obtain
specific properties usually require relatively little investment in comparison to the
development of new polymers or new processes. Hence, fibers from polymer blends
and copolymers have assumed to have an important role in the synthetic fiber
industry [6]. Thermal degradation properties of the materials are one of the
performance characteristics for determination of application areas.
1.2 Thermal Degradation of Polymers
When the polymers are exposed to high temperature thermal degradation takes
place. The degradation characteristics such as thermal stability, thermal degradation
products and thermal degradation mechanism are mainly determined by the
chemical structure of the corresponding polymer. In general, thermal degradation
starts with vaporization of additives and is followed by thermal degradation of high
molecular weight components.
Thermal degradation of polymers may follow a depolymerization mechanism
producing mainly monomer and low molecular weight oligomers. If statistical or
random cleavage of the polymer chain takes place, products that may have quite
different structure than the monomer are generated. In the presence of thermally
labile side chains, generally, two-step decomposition occurs; the first being the
elimination of side chains and the second being the decomposition of the polymer
backbone forming more stable condensed structures. A non-free radical process
involving intermolecular exchange reactions yielding mainly cyclic oligomers may
also be involved during thermal degradation [7].
7
1.2.1 Depolymerization
In depolymerization process, the end of polymer chain separates and generates a
free radical with low activity under thermal effect. Then according to the chain
reaction mechanism, the polymer loses monomers one by one. This process called
as unzipping produces mainly monomer and low molecular weight oligomers. This
process is common for poly(methyl methacrylate) (PMMA) and polystyrene
decomposition [8].
1.2.2 Random chain scission
In the random chain scission process the backbone breaks down randomly at any
position of the backbone. Therefore, the molecular weight decreases rapidly and
monomer can not be obtained in this process. As the new free radicals generated
has high activity and intermolecular chain transfer and disproportion termination
reactions can readily occur. Thermal degradation of polyethylene is an example for
polymers that decomposes by random chain scission [9].
1.2.3 Side group elimination
Elimination of side chains is generally a first step of a two-step thermal degradation
process. Side groups held by bonds which are weaker than the bonds connecting
the main chain are stripped off before the decomposition of the main chain during
the heating process. For example, the first step of thermal degradation of polyvinyl
chloride (PVC) is the elimination of the side groups to form hydrogen chloride. With
the side groups removed, the polyene macromolecule remains. This then undergoes
reactions to form aromatic molecules [10].
1.3 Thermal Degradation Techniques
The study of the thermal degradation of the polymers is important in understanding
their usability, storage and recycling. Various kinds of thermal analysis techniques
have been proposed to define suitable processing conditions and give useful service
8
guidelines for their wise application area. Some of the most common techniques
used to study the thermal degradation characteristics of the polymers are
thermogravimetry (TG), differential scanning calorimetry (DSC), thermal
volatilization analysis (TVA) and pyrolysis techniques.
1.3.1 Thermogravimetric Analysis (TGA)
Thermogravimetry is the branch of thermal analysis which examines the mass
change of a sample as a function of temperature in the scanning mode or as a
function of time in the isothermal mode. TG is used to characterize the
decomposition and thermal stability of materials under a variety of conditions and to
examine the kinetics of the physicochemical processes occurring in the sample [8].
TGA has been utilized to determine some important kinetic parameters for polymeric
materials degradation. These kinetic parameters are the reaction order, n, and the
overall activation energy, E. These values can be of great importance in the
elucidation of the mechanisms involved in polymer degradation since these
degradation parameters manifest themselves in changes in the slope and shape of
the TG curves [11].
Thermogravimetry curves are characteristic for a given polymer or compound
because of the unique sequence of the physciochemical reaction that occurs over
specific temperature ranges and heating rates and are function of the molecular
structure. The principal applications of TGA in polymers are determination of the
thermal stability of polymers, compositional analysis and identification of polymers
from their decomposition pattern. Also, TGA curves are used to determine the
kinetics of thermal decomposition of polymers and the kinetics of cure where weight
loss accompanies the cure reaction (as in condensation polymerizations, such as
cure of phenolic resins) [8].
In 1989 Compton and coworkers integrated TGA and FTIR (Fourier Transform
Infrared Spectroscopy) (TGA/FTIR) and since then it has been in progression for
use as a valuable instrument in observation of thermal behavior of synthetic
polymer.
9
This technique has also been applied to distinguish homopolymers, copolymers, and
blends and to determine compositions of copolymers [12].
Thermogravimetry can also be coupled with a mass spectrometry (TG-MS) which
enables in addition to the weight loss information, identification of the evolved gases
in sequential order during thermal degradation of a polymer in controlled
atmospheric conditions. In addition, the technique is also used to differentiate
trapped solvents, unreacted reagents, and trace impurities. As the products of
degradation are flushed out with the purged gas the possibility of secondary
reactions is reduced compared to sealed tube pyrolysis experiments. Also no
sample contamination occurs and sample preparation is minimal [13].
Although TGA is a widely used method in polymer degradation there are some
drawbacks of TGA analysis. TGA measurements only record the loss of volatile
fragments of polymers, caused by decomposition. TGA cannot detect any chemical
changes or degradation properties caused by cross-linking [8].
1.3.2 Thermal Volatilization Analysis (TVA)
Use of thermal volatilization analyses in observation of polymer degradation dates
back to 1960’s. McNeill was the one who proposed TVA as a comprehensive tool for
the identification of pyrolysis products from commodity polymers [14]. In this method
sample is heated in vacuum system (0.001 Pa) equipped with a liquid nitrogen tank
(77°K) between the sample and the vacuum pump. Any volatiles produced will
increase the pressure in the system until they reach the liquid nitrogen and
condense out. As a theory, in TVA the variation in pressure of volatile products is
recorded during a degradation in which the temperature of the polymer sample is
increased at a steady rate. When this pressure (measured by Pirani gauge) is
recorded as the sample temperature is increased in a linear manner, a TVA
thermogram, showing one or more peaks, is obtained. The apparatus required for
TVA is simple. It consists of a flat-bottomed glass tube containing the polymer
sample as a fine powder or film which is inserted into the top of a small oven, the
temperature of which is varied by means of a linear temperature programming unit.
The glass tube is connected first to a trap surrounded with liquid nitrogen and then
to a mercury diffusion pump and rotary oil pump.
10
Between the tube and the trap is attached a Pirani gauge head. The gage control
unit provides an output for a 10-mV potentiometric strip chart recorder so that a
continuous trace of pressure versus time (temperature) may be obtained. Polymer
samples from 10 to 250 mg can conveniently be handled.
Guo et al. used spectroscopic methods together with TVA for the identification of
polymer degradation products [15]. They used a vacuum-tight long-path gas IR cell,
as an interface allowing for the application of FTIR for the on-line analysis of volatile
products of polymer in TVA analysis. This relatively new analytical technique was
named as TVA/FT-IR.
1.3.3 Differential Scanning Analysis (DSC)
In addition to the rate of decomposition, heat of reaction of decomposition process
also gives information about the thermal degradation characteristics of polymers.
DSC is one of the most widely used instruments in that respect in polymer thermal
degradation analysis field. In all degradation processes heat must be supplied to the
polymer to get it to a temperature at which a significant degradation takes place.
However, once this temperature is obtained, further thermal decomposition process
may either generate or consume additional heat. The magnitude of this energy
generation or requirement can be measured with DSC. It is a technique in which the
heat flow rate difference into a substance and a reference is measured as a function
of temperature, while the sample is subjected to a controlled temperature program.
DSC is an extremely useful instrument when only a limited amount of substance is
available, since only milligrams of sample is required for analysis [16].
In DSC analysis both the sample and the reference are maintained at nearly the
same temperature throughout the experiment. The basic principle underlying this
technique is that, when the sample undergoes a physical transformation such as
phase transitions, more (or less) heat will need to flow to it than the reference to
maintain both at the same temperature. Whether more or less heat must flow to the
sample depends on whether the process is exothermic or endothermic. For
example, as a solid sample melts to a liquid it will require more heat flowing to the
sample to increase its temperature at the same rate as the reference. Likewise, as
the sample undergoes exothermic processes (such as crystallization) less heat is
required to raise the sample temperature.
11
By observing the difference in heat flow between the sample and the reference,
differential scanning calorimeter is able to measure the amount of heat absorbed or
released during such transitions. For example, the cross-linking of polymer
molecules that occurs in the curing process is exothermic; resulting in a positive
peak in the DSC curve that usually appears soon after the glass transition.
DSC provides a rapid method for the determination of the thermal properties of
polymeric materials, including thermal history studies, oxidation induction time
testing and dynamic and isothermal kinetic studies, evaluation of sample purity and
glass transition temperature. The result of a DSC experiment is a heating or cooling
curve.
Drawback of DSC is that; the DSC experiments are carried out by placing the
sample inside a sealed sample holder and this technique is seldom suitable for
thermal decomposition processes. It is ideally suited for physical changes but not for
chemical processes [17].
1.3.4 Pyrolysis (Py)
Basically, pyrolysis is the thermal degradation of a compound in an inert atmosphere
or vacuum. When vibrational excitation, as a result of distribution of thermal energy
over all modes of excitation, is greater than the energy of specific bonds,
decomposition of the molecule takes place. Temperature and heating rate have
significant importance on product distribution. At low temperatures, thermal
degradation may be too slow to be useful. On the other hand, at very high
temperatures extensive decomposition generating only very small and nonspecific
products may be generated. Product distribution is also affected by the heating rate
depending on the kinetics of thermal equilibrium among several vibrational modes.
Thus, thermal decomposition of a compound always occurs in a reproducible way
producing a fingerprint only at a specific temperature and at a specific heating rate [7].
The fragments often contain sufficient information to identify the chemistry of the
original polymer. This is a relatively straightforward method to establish the chemical
structure of an unknown polymer material [18].
12
Pyrolysis technique can be coupled with FT-IR, GC (Py-GC), GC/MS (Py-GC/MS) or
MS (DP-MS). Among these various analytical pyrolysis techniques, pyrolysis gas
chromatography mass spectrometry, Py-GC/MS and direct pyrolysis mass
spectrometry, DP-MS, have several advantages such as sensitivity, reproducibility,
minimal sample preparation and consumption and speed of analysis [8].
1.3.4.1 Pyrolysis GC/MS (Py-GC/MS)
Pyrolysis-gas chromatography-mass spectrometry (Py-GC/MS) is a widely used
instrument for the separation and identification of volatile pyrolysis products of
polymers. It can be both used for quantitative and qualitative analysis. The number
of peaks seen in the total ion chromatogram (TIC) represents the number of
compounds detected by GC-MS. The relative intensity of each peak corresponds to
the relative concentration of each product.
The principle technique behind the Py-GC/MS is that; after the chosen pyrolysis
time, the carrier gas sweeps volatiles in to the GC column where they are separated
according to their boiling points and polarities. The separated components are then
measured and characterized by the mass spectrometer.
Most existing pyrolysis units are designed for the degradation of solid or highly
viscous materials such as polymers. However, the volatile oily samples were used to
evaporate before degradation. This difficulty is overcome with the investigation of in-
line pyrolysis units for the MS study of thermal stability of volatile liquid polymers.
To conclude, the advances in this technique such as design of pyrolysis units, the
use of sufficiently small samples have provided reliable quantitative data that can be
used to obtain information about the polymer degradation process and help
deducing the initial polymer structure [17].However, there are also some drawbacks
of Py-GC/MS method. As thermal degradation occurs in a close container
secondary reactions can not be eliminated totally.
13
Also, as pyrolyzers are mounted external to the GC system, deposition of higher-
boiling point pyrolyzates and condensation of thermal degradation products in the
transfer line is likely causing discrimination of high mass components and sample
losses. Thus, Py-GC/MS can be used only for identification of stable volatile thermal
degradation products.
In addition, there is always the possibility of not detecting some of the thermal
degradation products retained in the pyrolytical zone, injection system or capillary
column as a consequence of molecular weight and high polarity. Polar pyrolyzates
even if they enter the gas chromatography column may often display peak tailing
characteristics, poor reproducibility, long elution times and in some cases no
chromatographic peak [19].
1.3.4.2 Direct Pyrolysis-MS (DP-MS)
Pyrolysis techniques are widely applied to elucidate thermal stability, degradation
products and decomposition mechanism of a compound. Further subsequent MS
characterization of the pyrolyzates is a powerful method for determination of
composition, microstructure, and additives of industrial polymers, especially in
unknown samples [7].
Direct pyrolysis mass spectrometry, DP-MS, technique is the only technique in
which secondary and condensation reactions are at least partly avoided and
detection of high mass pyrolyzates and unstable thermal degradation products are
possible. Thus, a better understanding of the thermal characteristics, polymerization,
crosslinking and char formation processes can be achieved [19].
The DP-MS, in general, is a four step process: Thermal degradation of the sample
followed by the ionization of thermal degradation products, fragmentation of ionized
species involving excess energy and finally, detection of all ions generated by MS [20].
In direct insertion probe pyrolysis, thermal degradation occurs inside the mass
spectrometer and pyrolyzates are rapidly transported from the heating zone to the
source region and ionized, almost totally eliminating the possibility of secondary and
condensation reactions. Furthermore, as the high vacuum inside the mass
spectrometer favors vaporization, analysis of higher molecular mass pyrolyzates are
14
possible. The rapid detection system of the mass spectrometers also enables the
detection of unstable thermal degradation products. Thus, a better understanding of
the thermal characteristics, polymerization, crosslinking and char formation
processes can be achieved. However, direct pyrolysis mass spectra of polymers are
almost always very complicated due to concurrent degradation processes and
dissociative ionization of the thermal degradation products inside the mass
spectrometer. Thus, in DP-MS analysis not only the detection of a peak but also the
variation of its intensity as a function of temperature, single ion evolution profiles or
single ion pyrograms, are important. When analyzing the DP-MS spectra, all ions
with identical evolution profiles should be grouped and analyzed separately. In each
group ion with highest mass may be assumed to be generated during thermal
degradation. On the other hand the low mass fragments having similar evolution
profiles may be generated either during thermal degradation or during ionization in
the mass spectrometer [7, 19, 20].
Since thermal degradation products further dissociate during ionization and yield
very complicated pyrolysis mass spectra soft ionization techniques may seem to be
more appropriate. However, for soft ionization techniques secondary reactions may
take place. Then, investigation of thermal degradation mechanism may be even
more difficult [19].
There are some developments eliminating the drawbacks of DP-MS instrument
analysis which makes it more widely applicable for polymer degradation analysis.
For the analysis of non-volatile pyrolytic residues by MS and MS/MS analyses
Zhang et al. described the development of an on-probe pyrolyzer interfaced to a
desorption electrospray ionization (DESI) source as a novel in situ and rapid
pyrolysis technique [21]. In their study for the analysis of synthetic polymer,
poly(ethylene glycol), the on-probe pyrolysis DESI-MS system yielded data and
information equivalent to previous Matrix Assisted Laser Desorption Mass
Spectroscopy (MALDI-MS) analysis, where the use of a matrix compound and
cationizing agent were required. Advantages of this system can be summarized to
be its simplicity and speed of analysis since the pyrolysis is performed in situ on the
DESI source probe and hence, extraction steps and/or use of matrices are avoided.
Another development about DP-MS instrument is done by Witson and coworkers in
which a simple modification of a commercial quadruple ion trap to permit in situ
15
pyrolysis of synthetic polymers inside an atmospheric pressure chemical ionization
(APCI) ion source was developed [22]. Results obtained indicated that DP-APCI
mass spectrometry technique provides a rapid and cost effective means for analysis
of thermal stability and chemical composition of complex synthetic polymers that are
too large or too complex for direct mass spectrometry analysis. Witson and
coworkers claimed that; although, the traditional direct probe analysis combined with
chemical ionization MS and MS/MS allows more precise temperature control and
provides a steadier ion current profile and less background noise, thereby leading to
more reproducible spectra. DP-APCI conducts pyrolysis at atmospheric pressure,
which is more similar to a thermogravimetric analysis experiment and, hence, may
provide more useful information on the thermal properties of materials. To conclude, the difficulties in interpretation of quite complex pyrolysis mass spectra
due to dissociation of thermal degradation products during ionization that limits the
application of the technique seem to be resolved with the applications of soft
ionization techniques such as APCI and DESI.
Pyrolysis mass spectrometry techniques have find wide applications in the field of
polymer science which includes molecular weight distribution, the fingerprint pattern
for polymer identification, the sequence of monomeric units, the branching, cross-
linking, end groups and chain substitution and the copolymer structure and grafting
functionalities or variations in polymeric systems, and identification of additives or
impurities present [20].
1.4 Acrylate Polymers
Acrylate monomers used to form acrylate polymers are based on the structure of
acrylic acid, which consists of a vinyl and a carboxylic acid group. The resultant alkyl
acrylate is given the generic formula (CH2=CHCO2R), with R representing the alkyl
group. In commercial production, polymerization of acrylate polymers is conducted
under the action of free-radical initiators, with the acrylates dissolved in a
hydrocarbon solvent or dispersed in water by soap like surfactants. The general
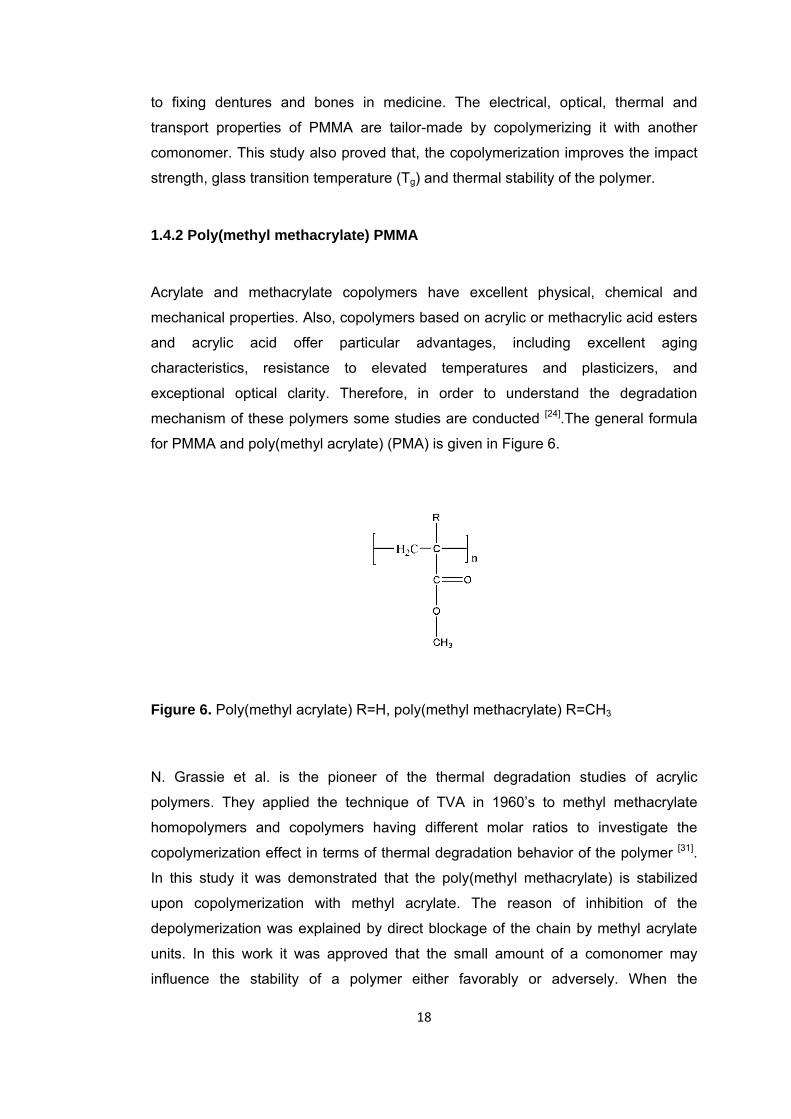
formula of the polyacrylate is given in Figure 5.
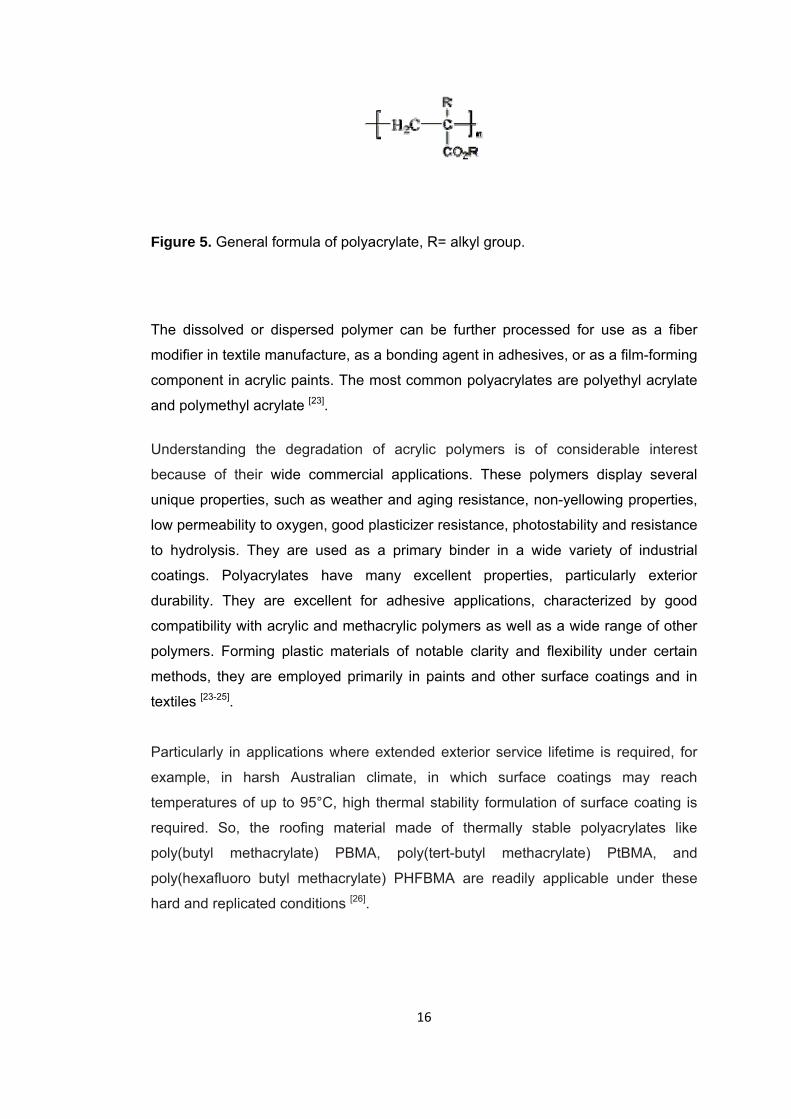
16
Figure 5. General formula of polyacrylate, R= alkyl group.
The dissolved or dispersed polymer can be further processed for use as a fiber
modifier in textile manufacture, as a bonding agent in adhesives, or as a film-forming
component in acrylic paints. The most common polyacrylates are polyethyl acrylate
and polymethyl acrylate [23].
Understanding the degradation of acrylic polymers is of considerable interest
because of their wide commercial applications. These polymers display several
unique properties, such as weather and aging resistance, non-yellowing properties,
low permeability to oxygen, good plasticizer resistance, photostability and resistance
to hydrolysis. They are used as a primary binder in a wide variety of industrial
coatings. Polyacrylates have many excellent properties, particularly exterior
durability. They are excellent for adhesive applications, characterized by good
compatibility with acrylic and methacrylic polymers as well as a wide range of other
polymers. Forming plastic materials of notable clarity and flexibility under certain
methods, they are employed primarily in paints and other surface coatings and in
textiles [23-25].
Particularly in applications where extended exterior service lifetime is required, for
example, in harsh Australian climate, in which surface coatings may reach
temperatures of up to 95°C, high thermal stability formulation of surface coating is
required. So, the roofing material made of thermally stable polyacrylates like
poly(butyl methacrylate) PBMA, poly(tert-butyl methacrylate) PtBMA, and
poly(hexafluoro butyl methacrylate) PHFBMA are readily applicable under these
hard and replicated conditions [26].
17
1.4.1 Why acrylates are copolymerized?
The constantly advancing technologies demand new, high performance and more
specialized materials with highly specialized functions. Such materials are no longer
one component systems. The investigation on systems built with two or more
components is in demand, especially for structure property correlations [27].
Copolymerization modulates both the intramolecular and intermolecular forces
exercised between polymer segments. Therefore, some properties, such as the
procedural decomposition temperatures (initial and final) with respect to thermal
degradation and the glass-transition temperature, may vary within wide limits. So,
copolymerization is an important and useful way to develop new materials [28].
Although certain homopolymers have properties almost ideally suited to an intended
application they are deficient in some respect. A copolymer with only a small
proportion of a second monomer often possesses the desirable properties of the
parent homopolymer, while the minor component lends the qualities formerly
lacking. As an example, synthetic fibers made from the homopolymer of acrylonitrile
have excellent dimensional stability and resistance to weathering, chemicals, and
microorganisms but poor affinity for dyes. Copolymerization of acrylonitrile with
small amounts of other monomers yields the fiber orlon, with the desirable qualities
of the homopolymer and the advantage of dyeability [23].
Acrylic/methacrylic polymers and their copolymers are widely used in many
applications like paints, surface coatings, textiles, automobiles, fibers etc. because
of their high chemical and thermal stability, optical clarity, adhesion and superior
mechanical properties. Alkyl methacrylates have very high ability to react with alkyl
acrylates to form copolymers. So, copolymers having a wide range of properties
from rigid plastics to elastomeric materials can be prepared by combining alkyl
methacrylates with alkyl acrylates [28-29].
For example, the experiment conducted by Vinu and coworkers to investigate the
effect of copolymerization on physical properties of PMMA clearly shows that the
copolymerization improves the properties of the resulting material [30]. Since PMMA
is an optically clear, industrially and domestically important polymer it finds a
multitude of applications from glass replacement, through paints and lubricating fluid
18
to fixing dentures and bones in medicine. The electrical, optical, thermal and
transport properties of PMMA are tailor-made by copolymerizing it with another
comonomer. This study also proved that, the copolymerization improves the impact
strength, glass transition temperature (Tg) and thermal stability of the polymer.
1.4.2 Poly(methyl methacrylate) PMMA
Acrylate and methacrylate copolymers have excellent physical, chemical and
mechanical properties. Also, copolymers based on acrylic or methacrylic acid esters
and acrylic acid offer particular advantages, including excellent aging
characteristics, resistance to elevated temperatures and plasticizers, and
exceptional optical clarity. Therefore, in order to understand the degradation
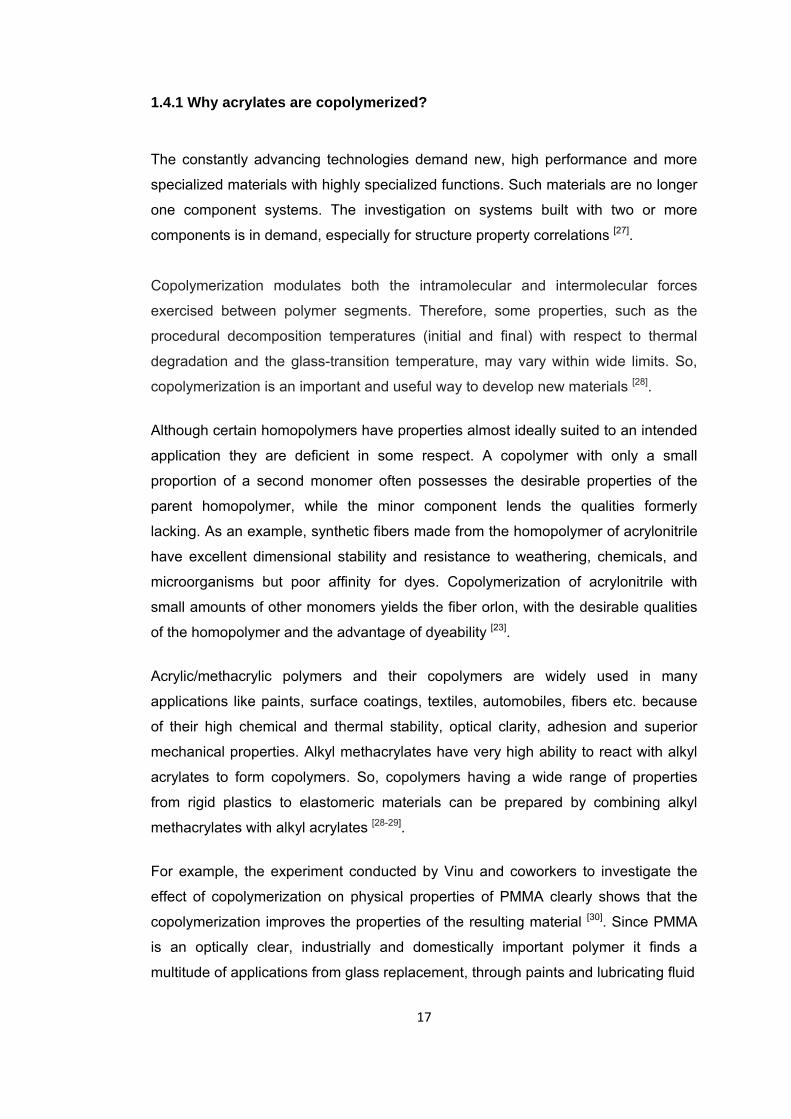
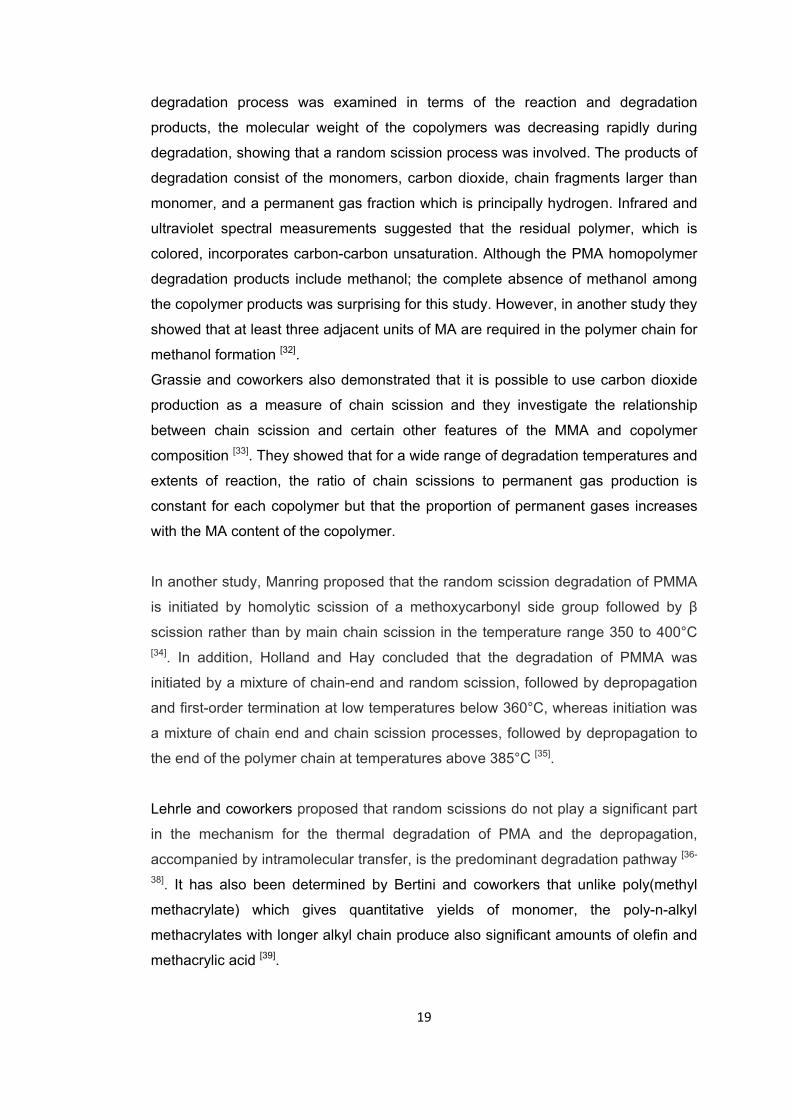
mechanism of these polymers some studies are conducted [24].The general formula
for PMMA and poly(methyl acrylate) (PMA) is given in Figure 6.
Figure 6. Poly(methyl acrylate) R=H, poly(methyl methacrylate) R=CH3 N. Grassie et al. is the pioneer of the thermal degradation studies of acrylic
polymers. They applied the technique of TVA in 1960’s to methyl methacrylate
homopolymers and copolymers having different molar ratios to investigate the
copolymerization effect in terms of thermal degradation behavior of the polymer [31].
In this study it was demonstrated that the poly(methyl methacrylate) is stabilized
upon copolymerization with methyl acrylate. The reason of inhibition of the
depolymerization was explained by direct blockage of the chain by methyl acrylate
units. In this work it was approved that the small amount of a comonomer may
influence the stability of a polymer either favorably or adversely. When the
19
degradation process was examined in terms of the reaction and degradation
products, the molecular weight of the copolymers was decreasing rapidly during
degradation, showing that a random scission process was involved. The products of
degradation consist of the monomers, carbon dioxide, chain fragments larger than
monomer, and a permanent gas fraction which is principally hydrogen. Infrared and
ultraviolet spectral measurements suggested that the residual polymer, which is
colored, incorporates carbon-carbon unsaturation. Although the PMA homopolymer
degradation products include methanol; the complete absence of methanol among
the copolymer products was surprising for this study. However, in another study they
showed that at least three adjacent units of MA are required in the polymer chain for
methanol formation [32].
Grassie and coworkers also demonstrated that it is possible to use carbon dioxide
production as a measure of chain scission and they investigate the relationship
between chain scission and certain other features of the MMA and copolymer
composition [33]. They showed that for a wide range of degradation temperatures and
extents of reaction, the ratio of chain scissions to permanent gas production is
constant for each copolymer but that the proportion of permanent gases increases
with the MA content of the copolymer.
In another study, Manring proposed that the random scission degradation of PMMA
is initiated by homolytic scission of a methoxycarbonyl side group followed by β
scission rather than by main chain scission in the temperature range 350 to 400°C [34]. In addition, Holland and Hay concluded that the degradation of PMMA was
initiated by a mixture of chain-end and random scission, followed by depropagation
and first-order termination at low temperatures below 360°C, whereas initiation was
a mixture of chain end and chain scission processes, followed by depropagation to
the end of the polymer chain at temperatures above 385°C [35].
Lehrle and coworkers proposed that random scissions do not play a significant part
in the mechanism for the thermal degradation of PMA and the depropagation,
accompanied by intramolecular transfer, is the predominant degradation pathway [36-
38]. It has also been determined by Bertini and coworkers that unlike poly(methyl
methacrylate) which gives quantitative yields of monomer, the poly-n-alkyl
methacrylates with longer alkyl chain produce also significant amounts of olefin and
methacrylic acid [39].
20
In another study it was proposed that a side-group scission of a methoxycarbonyl
group initiates PMMA-H degradation [40]. It was claimed that the side-group scission
is favored due to a large 'cage" recombination effect which reduces the contribution
of main-chain scission. It is anticipated that side-group scission will initiate polymer
degradation whenever side-group bonds are of similar energy or weaker than main-
chain bonds.
In recent years the thermal degradation of PMMA, PMA and their different
composition copolymers was also studied by TGA [29]. In this study, the effect of alkyl
group substituent on the thermal degradation behavior of the copolymers was
investigated. It was shown that the pyrolysis of polymers mainly involves chain
depolymerization along with the formation of alcohol and anhydride type of products.
The normalized weight loss profiles showed that the temperature (Tm) at which
maximum rate of degradation occurs, increases with alkyl acrylate content,
indicating that the thermal stability of the copolymers poly(methyl methacrylate-co-
alkyl acrylate)s increases with alkyl acrylate content.
The thermal stability and thermal degradation of copolymers based on selected alkyl
methacrylates such as MMA, EMA and BMA was also analyzed by pyrolysis–gas
chromatography at temperatures between 250 and 400°C [41]. In this study it was
observed that the main thermal degradation products from alkyl methacrylate
copolymers are monomers. Other pyrolysis by-products formed during thermal
degradation were carbon dioxide, carbon monoxide, methane, ethane, methanol,
ethanol, and propanol-1.
Czech et al. had also studied the thermal degradation of above discussed polymers
at higher temperatures, between 300 and 800°C, again with by pyrolysis gas
chromatography [42]. They showed that the main thermal degradation products were
unsaturated monomeric alkyl methacrylates, carbon dioxide, carbon monoxide,
methane, ethane, methanol, ethanol, and propanol. An increase in pyrolysis
temperature leads to higher yields of products derived from the main and side
chains at cracking temperatures, such as carbon dioxide, carbon monoxide,
methane, ethane, or low molecular weight alcohols. During thermal degradation,
poly(alkyl methacrylates) produce monomer methacrylates as the predominant
breakdown product in all tested pyrolysis conditions. In this work it was shown that
21
the poly(alkyl methacrylates) undergo a thermal degradation process at high
temperatures that includes main chain scission.
Degradation mechanism of PMMA was also studied by a liquid chromatography with
a particle beam mass spectrometry (LC–PB-MS) by Murphya and coworkers[43].In
this study, the effect of polymer composition, concentration, molecular mass and
monomer unit sequence on HPLC retention and MS ion intensity were studied.
According to this study, a monomer yield of 92–98 % has been reported regardless
of the temperature, as long as there is sufficient energy to break an initial carbon–
carbon bond. They showed that in contrast to the degradation of poly(alkyl
methacrylate) polymers, poly(alkylacrylate) polymers containing α-hydrogen in the α
position and do not form a stable radical upon β-scission, thus these polymers have
a higher probability of inter and intramolecular chain transfer and degrade by a
random depolymerization mechanism. Therefore a variety of products are produced
in random depolymerization resulting in a lower monomer yield.
In general, it can be concluded that the principal degradation reactions which occur
in polymethacrylates are depolymerization to monomer, and ester decomposition
yielding methacrylic acid units in the polymer and liberating the corresponding olefin.
The greater the number of hydrogen atoms in the ester group, the greater is the
tendency towards ester decomposition. There is also a strong tendency to ester
decomposition in polyacrylates incorporating large numbers of β-hydrogen atoms
but the degradation processes which occur in primary esters are much more
complex.
1.4.3 Poly(butyl acrylate) and Its Copolymer with Poly(methyl methacrylate) (PMMA)
Poly(methyl methacrylate-co-butyl acrylate), p(MMA-co-BA) copolymers are
extensively used as adhesives and coatings. The general formula for poly(butyl
acrylate) (PBA) and poly(butyl methacrylate) (PBMA) is given in Figure 7. By
combining methyl methacrylate, which can be considered as hard sequences
contributing stiffness, with butyl acrylate, as soft sequences the polymer with desired
property is obtained.
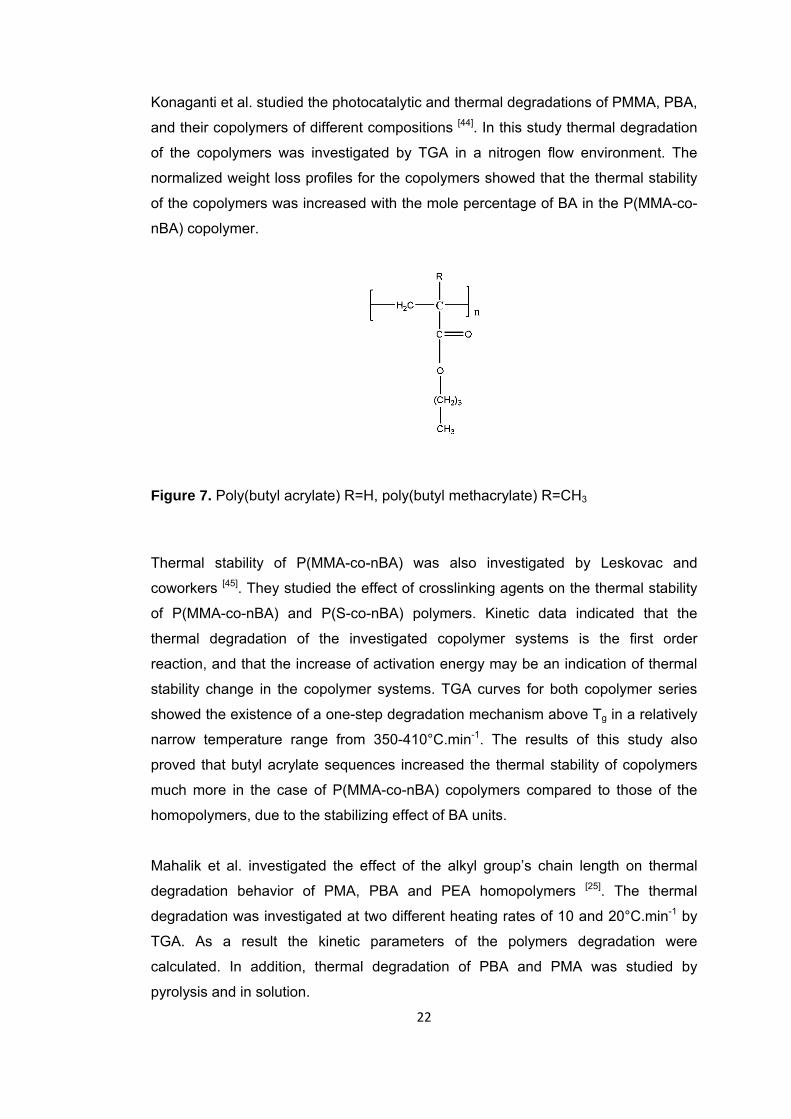
22
Konaganti et al. studied the photocatalytic and thermal degradations of PMMA, PBA,
and their copolymers of different compositions [44]. In this study thermal degradation
of the copolymers was investigated by TGA in a nitrogen flow environment. The
normalized weight loss profiles for the copolymers showed that the thermal stability
of the copolymers was increased with the mole percentage of BA in the P(MMA-co-
nBA) copolymer.
Figure 7. Poly(butyl acrylate) R=H, poly(butyl methacrylate) R=CH3
Thermal stability of P(MMA-co-nBA) was also investigated by Leskovac and
coworkers [45]. They studied the effect of crosslinking agents on the thermal stability
of P(MMA-co-nBA) and P(S-co-nBA) polymers. Kinetic data indicated that the
thermal degradation of the investigated copolymer systems is the first order
reaction, and that the increase of activation energy may be an indication of thermal
stability change in the copolymer systems. TGA curves for both copolymer series
showed the existence of a one-step degradation mechanism above Tg in a relatively
narrow temperature range from 350-410°C.min-1. The results of this study also
proved that butyl acrylate sequences increased the thermal stability of copolymers
much more in the case of P(MMA-co-nBA) copolymers compared to those of the
homopolymers, due to the stabilizing effect of BA units.
Mahalik et al. investigated the effect of the alkyl group’s chain length on thermal
degradation behavior of PMA, PBA and PEA homopolymers [25]. The thermal
degradation was investigated at two different heating rates of 10 and 20°C.min-1 by
TGA. As a result the kinetic parameters of the polymers degradation were
calculated. In addition, thermal degradation of PBA and PMA was studied by
pyrolysis and in solution.
23
On the basis of pyrolytic degradation studies, it was found that the degradability of
the polymer decreases with an increase in the alkyl group chain length of poly(n-
alkyl acrylate). Another study investigating the thermal degradation behavior of poly(butyl acrylate)
was done by Haken and coworkers [46]. They aimed to study the major pyrolysis
products of PBA and its isomers. This study was investigated with a Curie Point
Pyrolyser in conjunction with GC-MS. When the degradation products of poly(tertiary
butyl acrylate) were considered, the formation of carbon dioxide, monomer and
dimer was consistent with the mechanism for poly(n-butyl acrylate) degradation. In
degradation products of poly(t-butyl acrylate) isobutylene formation was in
agreement with the previous studies but the presence of carbon dioxide, monomer
and dimer was first approved in this work.
Thermal degradation of some alkyl methacrylate’s (methyl methacrylate, ethyl
methacrylate, butyl methacrylate, and 2-ethylhexyl methacrylate) was also
investigated by Czech et al. at temperatures between 300 and 800°C by another
method which is pyrolysis gas chromatography [24]. In this work a simple degradation
mechanism was suggested, providing a satisfactory explanation for the formation of
the major breakdown products of alkyl methacrylates. Unsaturated monomeric alkyl
methacrylates, carbon dioxide, carbon monoxide, methane, ethane, methanol,
ethanol, and propanol were formed during thermal degradation of poly(alkyl
methacrylates). These results quantified the various monomer yields, which depend
on the number of carbon atoms in the alkyl side chain. The concentrations of
monomers with short alkyl side chains (methyl and ethyl) were higher than for
monomers with long side chains (butyl). Longer alkyl side chains in poly(alkyl
methacrylates) corresponded to fewer monomers formed during pyrolysis. The
mechanism of thermal degradation supported the absence of alkenes, the presence
of alcohols, and monomeric alkyl acrylates. During cracking reactions, especially at
higher temperatures, gaseous products and mixtures of low molecular weight
alcohols were formed. An increase in pyrolysis temperature lead to higher yields of
products derived from the main and side chains at cracking temperatures, such as
carbon dioxide, carbon monoxide, methane, ethane, or low molecular weight
alcohols. During thermal degradation, poly(alky methacrylates) produced mainly
monomer as the predominant breakdown product in all tested pyrolysis conditions.
24
In another study the thermal-ageing of a series of commercial acrylic/methacrylic
resins, homo and copolymers which are extensively used as stone protective, has
been investigated under conditions of constant temperatures at 110, 135 and 150°C [47]. In this work, structural and molecular changes induced by the isothermal
treatments in a forced-air circulation oven were followed by infrared and UV–VIS
spectroscopy, and size exclusion chromatography (SEC), respectively. It was shown
that the stability of the resins could be controlled by the reactivity of alkyl side
groups, whose oxidative decomposition is favored in the case of long ester groups,
like the isobutyl and butyl ones. At the same time, the polymers containing long
ester groups undergo fast and extensive cross-linking, together with loss of short
chain fragments. In the acrylic/methacrylic resins where all or the majority of the
alkyl side groups are short, chain scissions prevail over cross-linking and no
insoluble fractions were formed.
The degradation behavior of various high-molecular-weight acrylic polymers namely
PMMA, PnBMA, PnBA and poly(lauryl methacrylate) (PLMA) was also investigated
under extreme environmental conditions [48]. The degradation behavior of the
polymeric materials on their surface was followed via attenuated total reflectance
infrared Spectroscopy (ATR-IR), high resolution FTIR microscopy, and X-ray
photoelectron spectroscopy. As a result of this study it was concluded that the
general degradation mechanism of studied polymers involves the loss of the ester
side groups to form methacrylic acid followed by cross-linking.
There are also some studies about the photooxidative stability of acrylic and
methacrylic polymers in the literature. Chiantore et al. had investigated the
photooxidative stability of poly(methyl acrylate), poly(ethyl acrylate), poly(ethyl
methacrylate) and poly(butyl methacrylate) polymers under conditions of artificial
solar light irradiation [49, 50]. Molecular and chemical changes induced by the light
treatment were followed by size exclusion chromatography and fourier transform
infrared spectroscopy. In this work, the acrylate units were found to be more reactive
towards oxidation, in comparison with the methacrylate ones. With short alkyl side
groups chain scissions prevailed over cross-linking reactions both in acrylate and
methacrylate samples. This work showed that the degradation of poly(butyl
methacrylate) proceeds in a completely different way, with extensive cross-linking
and simultaneous fragmentation reactions.
25
The conditions required for alcohol production is an important step in polyacrylates
degradation mechanism. Goikoetxea et al. investigated the mechanisms involved in
the formation of n-butanol during the synthesis of butyl acrylate containing lattices 51]. The experimental results showed that neither the hydrolysis of butyl acrylate nor
of the ester bond in the butyl acrylate segments of the polymer played a major role
in the formation of n-butanol, which was mainly generated from the polymer
backbone, by transfer reactions to polymer chain followed by cyclization. It was
found that the hydrolysis of either butyl acrylate monomer or of the ester bond in the
BA units in the copolymer was not responsible for the formation of any significant
fraction of n-butanol. Mainly from the polymer backbone n-butanol was formed. The
proposed mechanism was as follows: radicals abstracted hydrogen from the tertiary
carbon of the n-BA unit. This radical could propagate or if there were at least two
adjacent acrylate units, cyclize to form one molecule of n-butanol. The propagation
is a second order process and it was favored in the presence of free monomer,
whereas cyclization is a first order process, and it was important when the
concentration of free monomer was low. According to this mechanism process
variables that lead to low concentration of monomer in the system will yield higher n-
butanol concentrations.
Another type of degradation for the polymers is photocatalytic degradation. In recent
years the photocatalytic degradation of the homopolymers, poly(methyl
methacrylate) (PMMA), poly(butyl methacrylate) (PBMA), and their copolymers
P(MMA-co-BMA) was studied in o-dichlorobenzene in the presence of commercial
TiO2 (Degussa P-25) [52]. Gel permeation chromatography was used to determine
the evolution of molecular weight distributions with reaction time. The experimental
data indicated that the polymers PMMA and PBMA and their copolymers degrade by
simultaneous random and chain end scission. A continuous distribution model was
developed for the mechanism involved in degradation by both random and chain
end scission and used to determine the degradation rate coefficients. In this work
the degradation of PMMA, PBMA, and their copolymers was also investigated by
thermogravimetric analysis. The copolymers exhibited better thermal stability than
the homopolymers in contrast to that observed for photocatalytic degradation. The
photodegradation of these copolymers was determined in the absence of catalyst
and in the presence of two different catalysts. Simultaneous random and chain end
scission was observed in all cases for all polymers.
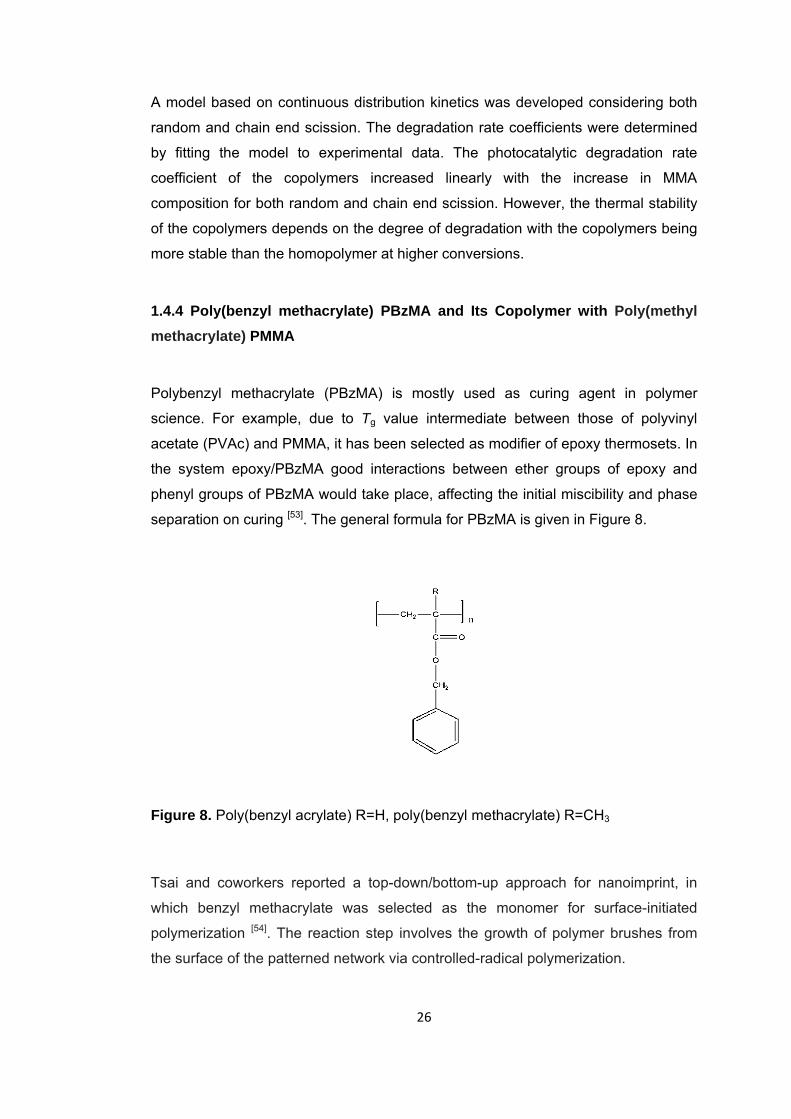
26
A model based on continuous distribution kinetics was developed considering both
random and chain end scission. The degradation rate coefficients were determined
by fitting the model to experimental data. The photocatalytic degradation rate
coefficient of the copolymers increased linearly with the increase in MMA
composition for both random and chain end scission. However, the thermal stability
of the copolymers depends on the degree of degradation with the copolymers being
more stable than the homopolymer at higher conversions.
1.4.4 Poly(benzyl methacrylate) PBzMA and Its Copolymer with Poly(methyl methacrylate) PMMA
Polybenzyl methacrylate (PBzMA) is mostly used as curing agent in polymer
science. For example, due to Tg value intermediate between those of polyvinyl
acetate (PVAc) and PMMA, it has been selected as modifier of epoxy thermosets. In
the system epoxy/PBzMA good interactions between ether groups of epoxy and
phenyl groups of PBzMA would take place, affecting the initial miscibility and phase
separation on curing [53]. The general formula for PBzMA is given in Figure 8.
Figure 8. Poly(benzyl acrylate) R=H, poly(benzyl methacrylate) R=CH3 Tsai and coworkers reported a top-down/bottom-up approach for nanoimprint, in
which benzyl methacrylate was selected as the monomer for surface-initiated
polymerization [54]. The reaction step involves the growth of polymer brushes from
the surface of the patterned network via controlled-radical polymerization.
27
Consequently, various nanoscopic structures with different feature sizes and
functional groups can be grown from the original molded template. Although most
controlled-radical polymerization reactions on surfaces have been conducted at
fairly raised temperatures, mostly between 90 and 120°C, grafting reaction of the
patterned polymers to a certain thickness should be completed rapidly and under
ambient temperature. That’s why benzyl methacrylate is selected as the monomer
for surface-initiated polymerization.
Copolymer of BzMA with MMA is also a valuable end product especially in
pharmaceutical industry. Ishikawa and coworkers have obtained controlled-release
tablet by oxygen plasma irradiation [55]. Since PBzMA has dual intramolecular
functions, a plasma degradable main chain and a plasma-cross-linkable benzyl
group in the side chain as an effect of plasma irradiation copolymer of MMA and
BzMA was used as a single wall material. In this work it was shown that the
dissolution profiles can be varied so as to cause release of drug at different rates,
depending on the set of conditions chosen for tablet manufacture and for plasma
operation which is mainly depended on the degradation of copolymer. Although
PBzMA and its copolymer with PMMA are very valuable end products, there is no
study evaluating the thermal degradation behavior of this polymers.
1.4.5 Poly(isobornyl acrylate) (PIBA) and Its Copolymer with Poly(methyl methacrylate) (PMMA)
Poly(isobornyl acrylate) has a number of interesting physical properties, such as a
high glass transition temperature (Tg) (94°C) and hardness (19.6 kg/mm2 at 20°C).
While polyacrylates have, in general, a low Tg, the bulky side group of isobornyl
acrylate is responsible for the high Tg, comparable with the one of poly(methyl
methacrylate) (PMMA, Tg = 105°C) or polystyrene (PS, Tg = 100°C). Like PIBA,
Poly(isobornyl methacrylate) (PIBMA) is a novel transparent polymer resin, which
can also be used as optical material. The general formula for PIBA is given in Figure
9. Since PIBMA and PIBA are widely used their thermal degradation behavior is an
important aspect of polymer science [56].
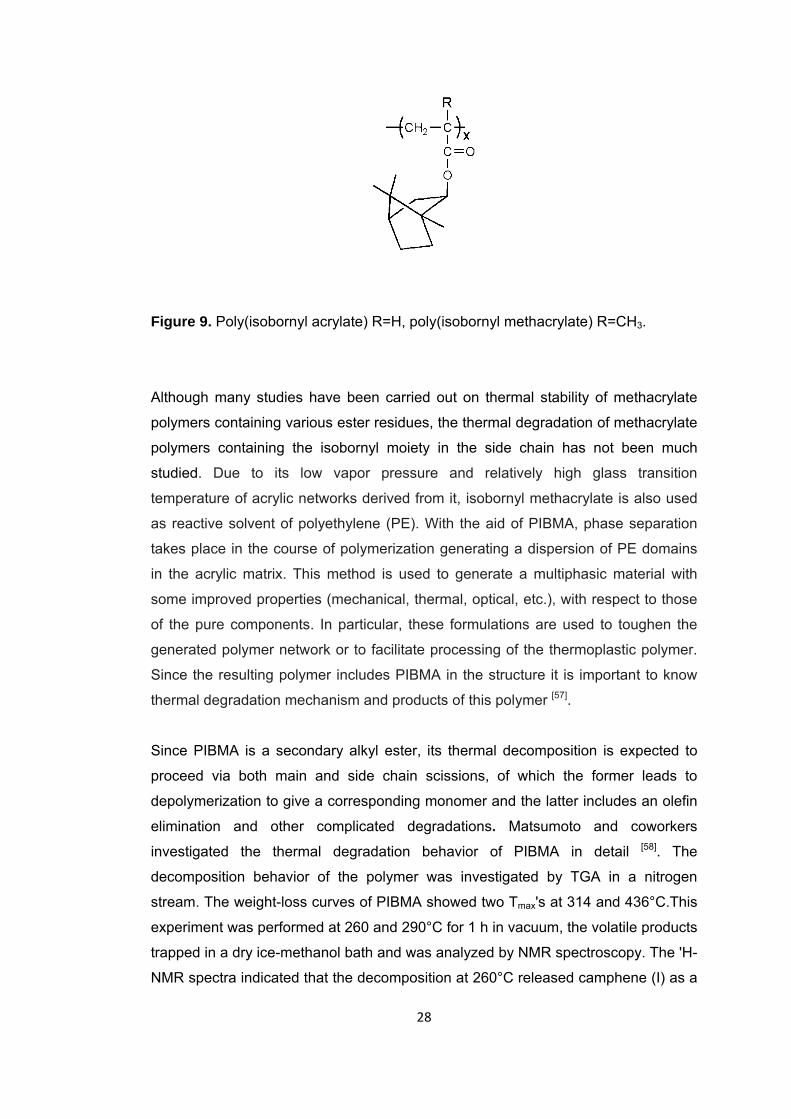
28
Figure 9. Poly(isobornyl acrylate) R=H, poly(isobornyl methacrylate) R=CH3.
Although many studies have been carried out on thermal stability of methacrylate
polymers containing various ester residues, the thermal degradation of methacrylate
polymers containing the isobornyl moiety in the side chain has not been much
studied. Due to its low vapor pressure and relatively high glass transition
temperature of acrylic networks derived from it, isobornyl methacrylate is also used
as reactive solvent of polyethylene (PE). With the aid of PIBMA, phase separation
takes place in the course of polymerization generating a dispersion of PE domains
in the acrylic matrix. This method is used to generate a multiphasic material with
some improved properties (mechanical, thermal, optical, etc.), with respect to those
of the pure components. In particular, these formulations are used to toughen the
generated polymer network or to facilitate processing of the thermoplastic polymer.
Since the resulting polymer includes PIBMA in the structure it is important to know
thermal degradation mechanism and products of this polymer [57].
Since PIBMA is a secondary alkyl ester, its thermal decomposition is expected to
proceed via both main and side chain scissions, of which the former leads to
depolymerization to give a corresponding monomer and the latter includes an olefin
elimination and other complicated degradations. Matsumoto and coworkers
investigated the thermal degradation behavior of PIBMA in detail [58]. The
decomposition behavior of the polymer was investigated by TGA in a nitrogen
stream. The weight-loss curves of PIBMA showed two Tmax's at 314 and 436°C.This
experiment was performed at 260 and 290°C for 1 h in vacuum, the volatile products
trapped in a dry ice-methanol bath and was analyzed by NMR spectroscopy. The 'H-
NMR spectra indicated that the decomposition at 260°C released camphene (I) as a
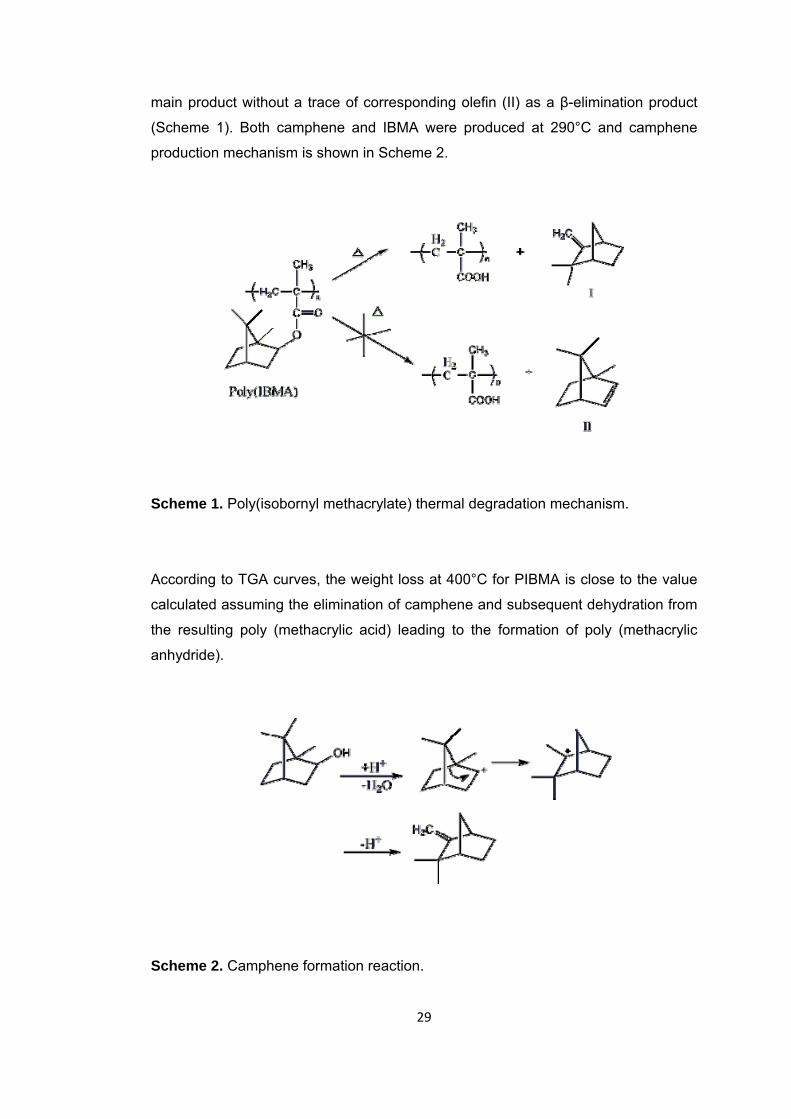
29
main product without a trace of corresponding olefin (II) as a β-elimination product
(Scheme 1). Both camphene and IBMA were produced at 290°C and camphene
production mechanism is shown in Scheme 2.
Scheme 1. Poly(isobornyl methacrylate) thermal degradation mechanism.
According to TGA curves, the weight loss at 400°C for PIBMA is close to the value
calculated assuming the elimination of camphene and subsequent dehydration from
the resulting poly (methacrylic acid) leading to the formation of poly (methacrylic
anhydride).
Scheme 2. Camphene formation reaction.
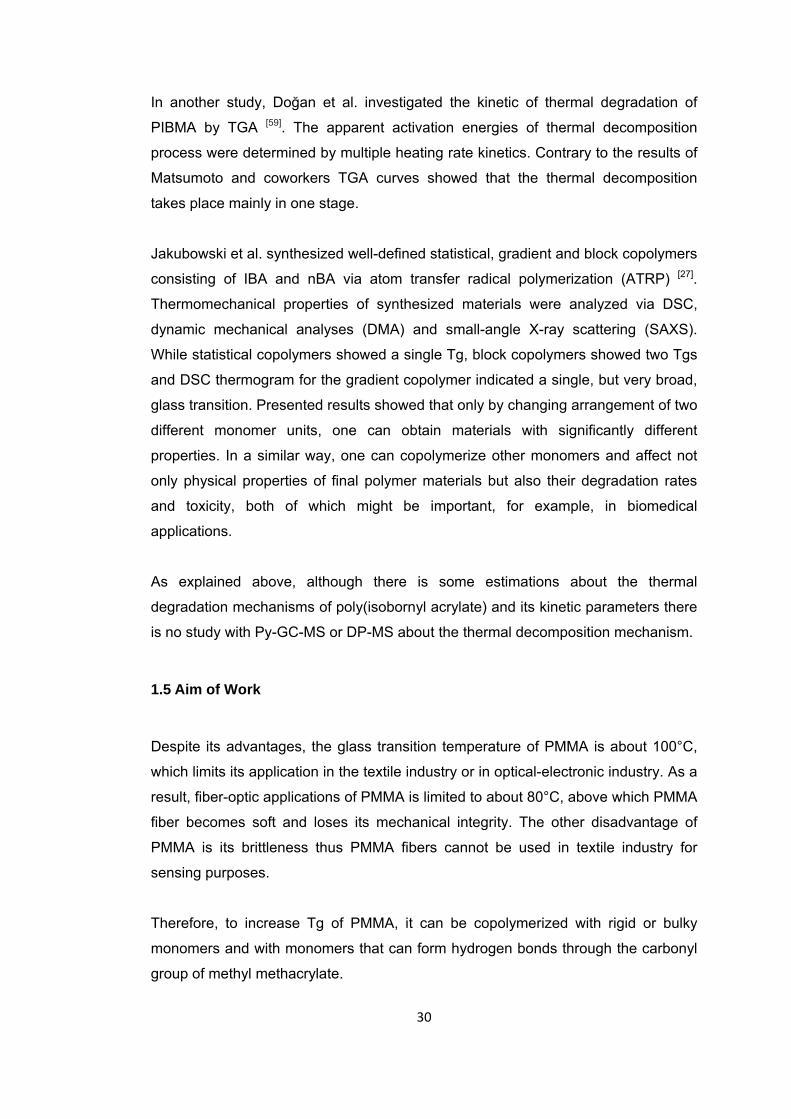
30
In another study, Doğan et al. investigated the kinetic of thermal degradation of
PIBMA by TGA [59]. The apparent activation energies of thermal decomposition
process were determined by multiple heating rate kinetics. Contrary to the results of
Matsumoto and coworkers TGA curves showed that the thermal decomposition
takes place mainly in one stage.
Jakubowski et al. synthesized well-defined statistical, gradient and block copolymers
consisting of IBA and nBA via atom transfer radical polymerization (ATRP) [27].
Thermomechanical properties of synthesized materials were analyzed via DSC,
dynamic mechanical analyses (DMA) and small-angle X-ray scattering (SAXS).
While statistical copolymers showed a single Tg, block copolymers showed two Tgs
and DSC thermogram for the gradient copolymer indicated a single, but very broad,
glass transition. Presented results showed that only by changing arrangement of two
different monomer units, one can obtain materials with significantly different
properties. In a similar way, one can copolymerize other monomers and affect not
only physical properties of final polymer materials but also their degradation rates
and toxicity, both of which might be important, for example, in biomedical
applications.
As explained above, although there is some estimations about the thermal
degradation mechanisms of poly(isobornyl acrylate) and its kinetic parameters there
is no study with Py-GC-MS or DP-MS about the thermal decomposition mechanism.
1.5 Aim of Work
Despite its advantages, the glass transition temperature of PMMA is about 100°C,
which limits its application in the textile industry or in optical-electronic industry. As a
result, fiber-optic applications of PMMA is limited to about 80°C, above which PMMA
fiber becomes soft and loses its mechanical integrity. The other disadvantage of
PMMA is its brittleness thus PMMA fibers cannot be used in textile industry for
sensing purposes.
Therefore, to increase Tg of PMMA, it can be copolymerized with rigid or bulky
monomers and with monomers that can form hydrogen bonds through the carbonyl
group of methyl methacrylate.
31
For this purpose, monomers containing isobornyl, benzyl and butyl groups as side
chain are chosen to copolymerize and to obtain fibers with PMMA. Due to the bulky
side chains, the free rotation of the polymer will be restricted giving rise to the
reduced chain flexibility and increase in the Tg of the resulting copolymers and
fibers. Due to improved properties of these polymers their application area will also
increase which makes the information about thermal degradation characteristics of
PMMA and its corresponding copolymers and fibers also very important.
Most of the researches on thermal characterization are focused on TGA and DSC
studies that can only give information on thermal stability, weight loss and kinetic
parameters of thermal degradation. Few studies on thermal degradation products
involved pyrolysis GC-MS, TGA-FTIR and TVA analyses. Yet, with the use of classic
techniques secondary reactions during heating can not be eliminated and only
stable degradation products can be detected. Thus, the data obtained can not be
used to investigate the thermal degradation mechanism.
In this work, thermal degradation characteristics, thermal degradation products and
mechanisms of
• methacrylate homopolymers: PMMA, PBMA, PIBMA, PBzMA
• acrylate homopolymers: PnBA, PtBA, PIBA,
• copolymers: P(MMA-co-nBA), P(MMA-co-IBA), P(MMA-co-BzMA), P(MMA-
co-nBA-IBA), and P(MMA-nBA-co-IBA-co-Bz),
• copolymer fibers: P(MMA-co-BA)f, P(MMA-co-BzMA)f, and P(MMA-co-nBA-
IBA)f
are analyzed via direct pyrolysis mass spectrometry.
The effects of
• substituents on the main and side chains,
• each component of the copolymer on thermal characteristics of the other and
• fiber formation
on thermal stability, degradation characteristics and thermal degradation
mechanisms are investigated.
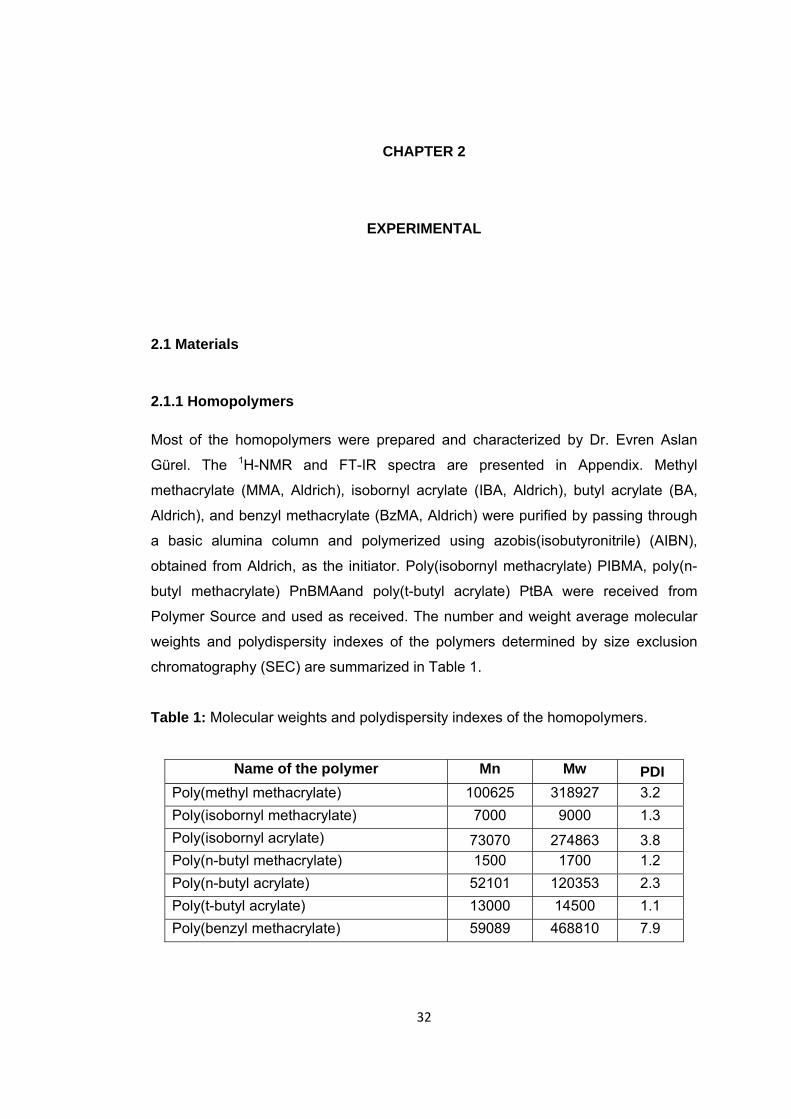
32
CHAPTER 2
EXPERIMENTAL
2.1 Materials
2.1.1 Homopolymers
Most of the homopolymers were prepared and characterized by Dr. Evren Aslan
Gürel. The 1H-NMR and FT-IR spectra are presented in Appendix. Methyl
methacrylate (MMA, Aldrich), isobornyl acrylate (IBA, Aldrich), butyl acrylate (BA,
Aldrich), and benzyl methacrylate (BzMA, Aldrich) were purified by passing through
a basic alumina column and polymerized using azobis(isobutyronitrile) (AIBN),
obtained from Aldrich, as the initiator. Poly(isobornyl methacrylate) PIBMA, poly(n-
butyl methacrylate) PnBMAand poly(t-butyl acrylate) PtBA were received from
Polymer Source and used as received. The number and weight average molecular
weights and polydispersity indexes of the polymers determined by size exclusion
chromatography (SEC) are summarized in Table 1.
Table 1: Molecular weights and polydispersity indexes of the homopolymers.
Name of the polymer Mn Mw PDI Poly(methyl methacrylate) 100625 318927 3.2 Poly(isobornyl methacrylate) 7000 9000 1.3 Poly(isobornyl acrylate) 73070 274863 3.8 Poly(n-butyl methacrylate) 1500 1700 1.2 Poly(n-butyl acrylate) 52101 120353 2.3 Poly(t-butyl acrylate) 13000 14500 1.1 Poly(benzyl methacrylate) 59089 468810 7.9
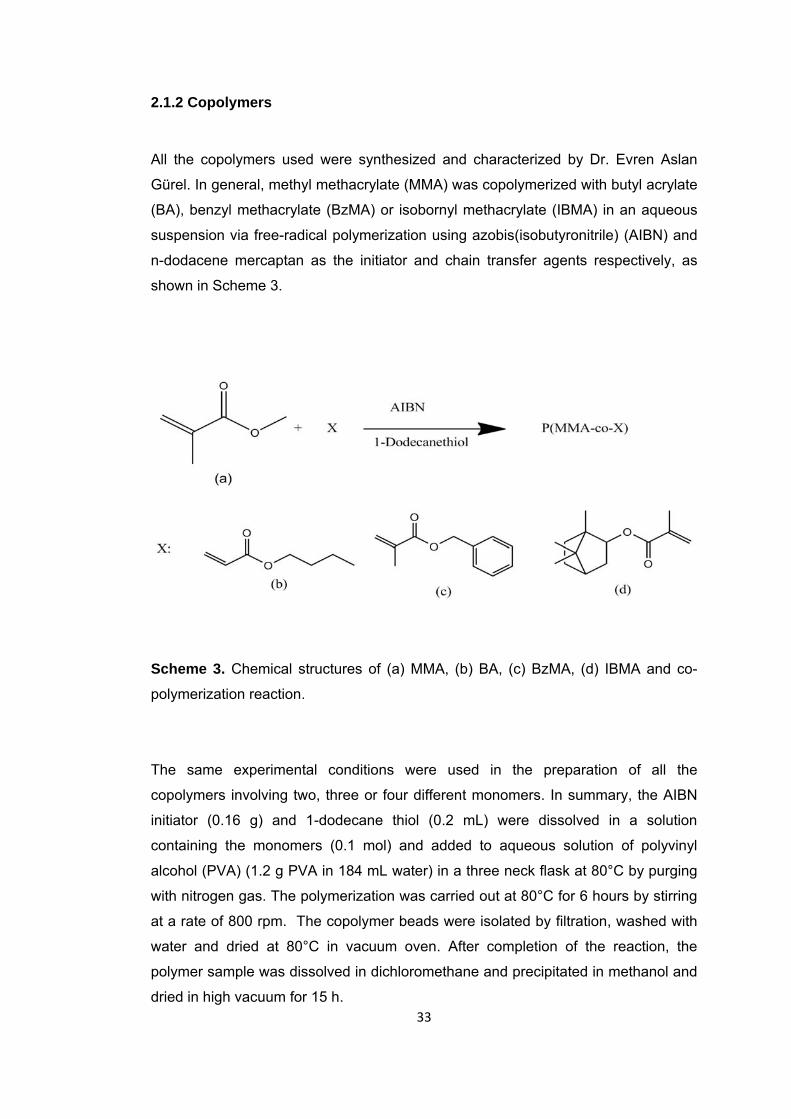
33
2.1.2 Copolymers
All the copolymers used were synthesized and characterized by Dr. Evren Aslan
Gürel. In general, methyl methacrylate (MMA) was copolymerized with butyl acrylate
(BA), benzyl methacrylate (BzMA) or isobornyl methacrylate (IBMA) in an aqueous
suspension via free-radical polymerization using azobis(isobutyronitrile) (AIBN) and
n-dodacene mercaptan as the initiator and chain transfer agents respectively, as
shown in Scheme 3.
Scheme 3. Chemical structures of (a) MMA, (b) BA, (c) BzMA, (d) IBMA and co-
polymerization reaction.
The same experimental conditions were used in the preparation of all the
copolymers involving two, three or four different monomers. In summary, the AIBN
initiator (0.16 g) and 1-dodecane thiol (0.2 mL) were dissolved in a solution
containing the monomers (0.1 mol) and added to aqueous solution of polyvinyl
alcohol (PVA) (1.2 g PVA in 184 mL water) in a three neck flask at 80°C by purging
with nitrogen gas. The polymerization was carried out at 80°C for 6 hours by stirring
at a rate of 800 rpm. The copolymer beads were isolated by filtration, washed with
water and dried at 80°C in vacuum oven. After completion of the reaction, the
polymer sample was dissolved in dichloromethane and precipitated in methanol and
dried in high vacuum for 15 h.
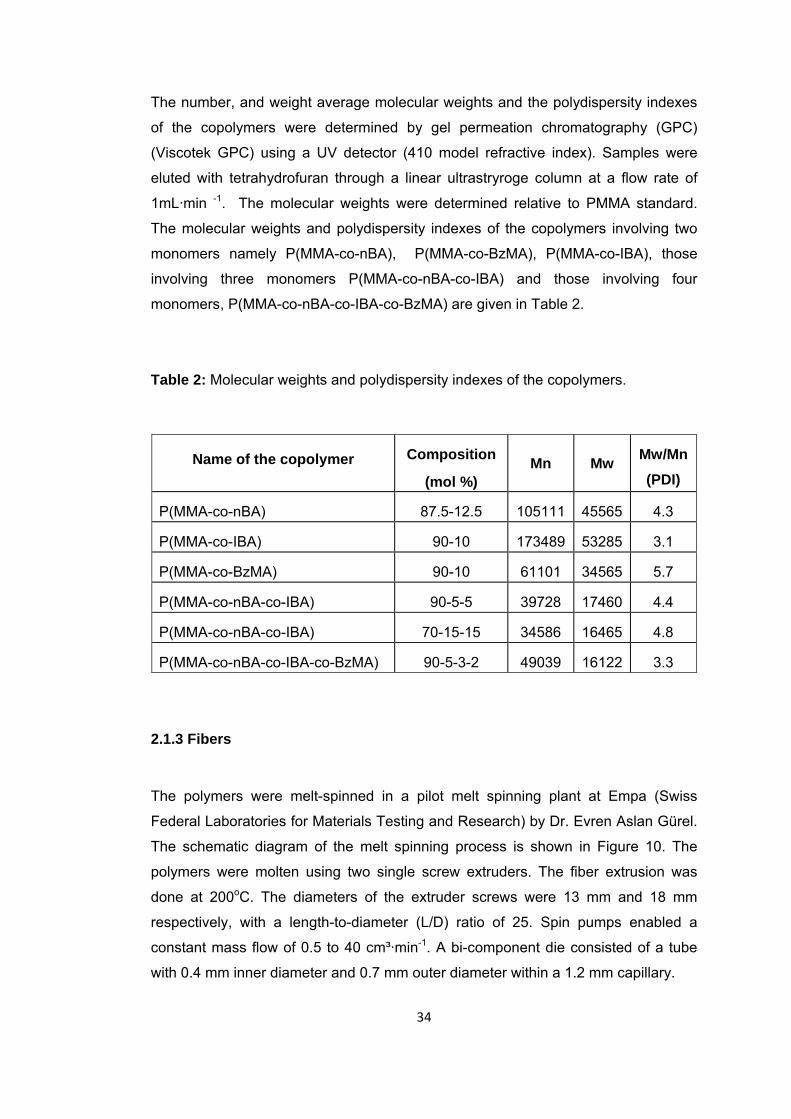
34
The number, and weight average molecular weights and the polydispersity indexes
of the copolymers were determined by gel permeation chromatography (GPC)
(Viscotek GPC) using a UV detector (410 model refractive index). Samples were
eluted with tetrahydrofuran through a linear ultrastryroge column at a flow rate of
1mL·min -1. The molecular weights were determined relative to PMMA standard.
The molecular weights and polydispersity indexes of the copolymers involving two
monomers namely P(MMA-co-nBA), P(MMA-co-BzMA), P(MMA-co-IBA), those
involving three monomers P(MMA-co-nBA-co-IBA) and those involving four
monomers, P(MMA-co-nBA-co-IBA-co-BzMA) are given in Table 2.
Table 2: Molecular weights and polydispersity indexes of the copolymers.
2.1.3 Fibers
The polymers were melt-spinned in a pilot melt spinning plant at Empa (Swiss
Federal Laboratories for Materials Testing and Research) by Dr. Evren Aslan Gürel.
The schematic diagram of the melt spinning process is shown in Figure 10. The
polymers were molten using two single screw extruders. The fiber extrusion was
done at 200oC. The diameters of the extruder screws were 13 mm and 18 mm
respectively, with a length-to-diameter (L/D) ratio of 25. Spin pumps enabled a
constant mass flow of 0.5 to 40 cm³·min-1. A bi-component die consisted of a tube
with 0.4 mm inner diameter and 0.7 mm outer diameter within a 1.2 mm capillary.
Name of the copolymer Composition
(mol %) Mn Mw Mw/Mn
(PDI)
P(MMA-co-nBA) 87.5-12.5 105111 45565 4.3
P(MMA-co-IBA) 90-10 173489 53285 3.1
P(MMA-co-BzMA) 90-10 61101 34565 5.7
P(MMA-co-nBA-co-IBA) 90-5-5 39728 17460 4.4
P(MMA-co-nBA-co-IBA) 70-15-15 34586 16465 4.8
P(MMA-co-nBA-co-IBA-co-BzMA) 90-5-3-2 49039 16122 3.3
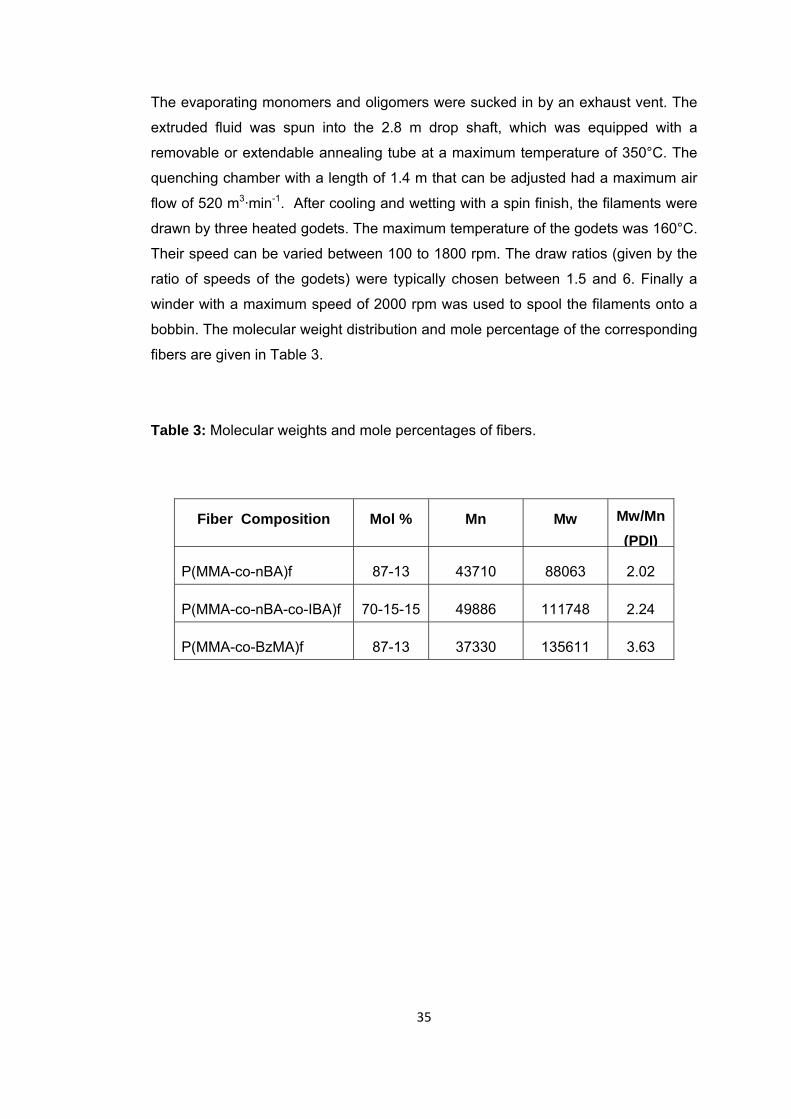
35
The evaporating monomers and oligomers were sucked in by an exhaust vent. The
extruded fluid was spun into the 2.8 m drop shaft, which was equipped with a
removable or extendable annealing tube at a maximum temperature of 350°C. The
quenching chamber with a length of 1.4 m that can be adjusted had a maximum air
flow of 520 m3·min-1. After cooling and wetting with a spin finish, the filaments were
drawn by three heated godets. The maximum temperature of the godets was 160°C.
Their speed can be varied between 100 to 1800 rpm. The draw ratios (given by the
ratio of speeds of the godets) were typically chosen between 1.5 and 6. Finally a
winder with a maximum speed of 2000 rpm was used to spool the filaments onto a
bobbin. The molecular weight distribution and mole percentage of the corresponding
fibers are given in Table 3.
Table 3: Molecular weights and mole percentages of fibers.
Fiber Composition Mol % Mn Mw Mw/Mn (PDI)
P(MMA-co-nBA)f 87-13 43710 88063 2.02
P(MMA-co-nBA-co-IBA)f 70-15-15 49886 111748 2.24
P(MMA-co-BzMA)f 87-13 37330 135611 3.63
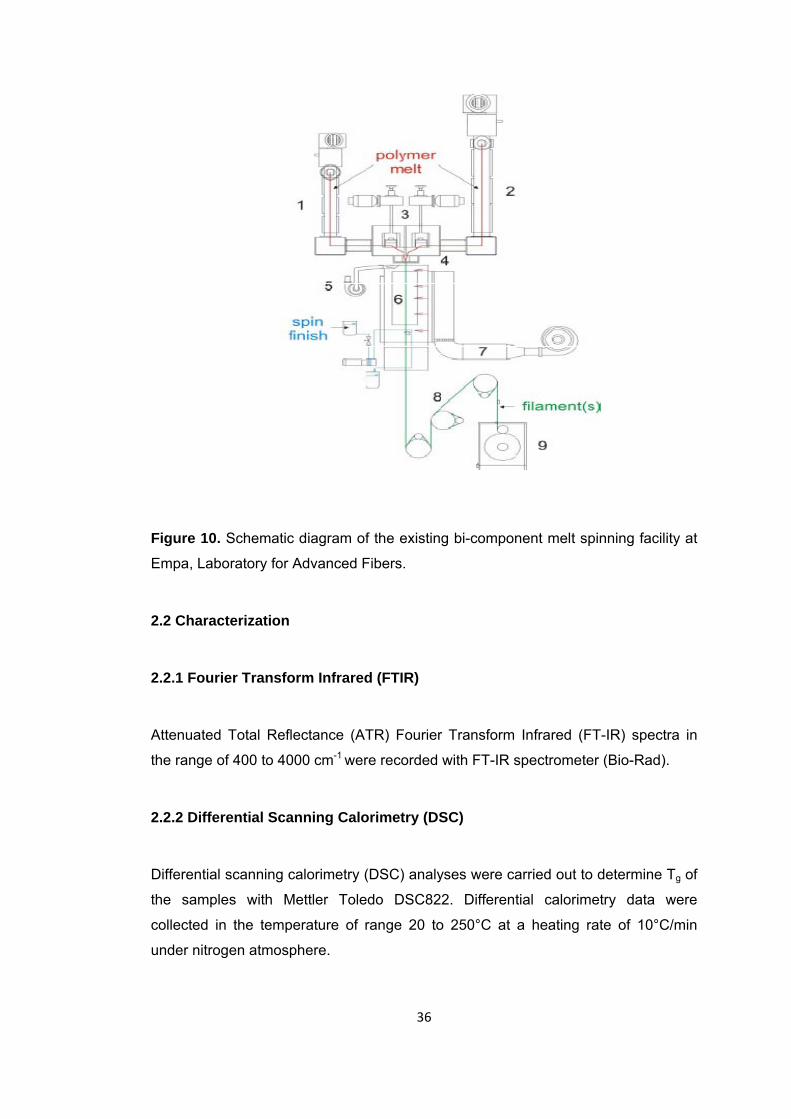
36
Figure 10. Schematic diagram of the existing bi-component melt spinning facility at
Empa, Laboratory for Advanced Fibers.
2.2 Characterization
2.2.1 Fourier Transform Infrared (FTIR)
Attenuated Total Reflectance (ATR) Fourier Transform Infrared (FT-IR) spectra in
the range of 400 to 4000 cm-1 were recorded with FT-IR spectrometer (Bio-Rad).
2.2.2 Differential Scanning Calorimetry (DSC)
Differential scanning calorimetry (DSC) analyses were carried out to determine Tg of
the samples with Mettler Toledo DSC822. Differential calorimetry data were
collected in the temperature of range 20 to 250°C at a heating rate of 10°C/min
under nitrogen atmosphere.
37
2.2.3 Thermogravimetric Analyzer (TGA)
Thermal decompositions of the samples were studied by thermogravimetry analyzer
(TGA). The analyses were conducted by Perkin Elmer STA 6000 simultaneous
thermal analyzer at a heating rate 10°C·min-1 in the temperature range from 30 to
600°C.
2.2.4 Direct pyrolysis mass spectrometry (DP-MS)
Direct pyrolysis mass spectrometry (DP-MS) analyses were performed on a 5973
HP quadrupole mass spectrometry system coupled to a JHP SIS direct insertion
probe pyrolysis system for thermal analyses. 70 eV EI mass spectra, at a rate of 2
scan⋅s-1, were recorded. 0.01 mg samples in the flared glass sample vials were
heated to 450°C at a rate of 10 °C⋅min-1. The pyrolysis mass spectrometry analyses
were repeated at least two times to ensure reproducibility.
Some of the pyrolysis experiments were repeated by using 25 eV ionization energy
to investigate the effect of dissociative ionization on fragmentation pattern observed
in the pyrolysis mass spectra. The elative intensities of high mass peaks increased,
however in general reproducibility and signal to nose ratio were decreased. Thus, 70
eV EI mass spectra were used for analyses of thermal degradation behaviors.
For the analyses of pyrolysis mass spectra, the mass spectrum recorded at the TIC
maximum was selected first. The next step was the identification of all intense
peaks. The trends in the evolution profiles were used to group the products to
determine whether the fragment was generated during pyrolysis or EI ionization. For
each peak in a given group, assignments were made and tabulated considering the
mass differences and possible dissociation processes, classical fragmentation
pathways for organic compounds and taking into consideration the structure of the
sample under investigation.
38
CHAPTER 3
RESULTS AND DISCUSSION
Thermal characterization of acrylate and methacrylate homopolymers and
copolymers of PMMA with PBA, PBzMA and PIBA are investigated by direct
pyrolysis mass spectrometry technique. Furthermore, the effect of fiber formation on
thermal degradation characteristics is studied for P(MMA-co-BzMA), P(MMA-co-
nBA) and P(MMA-co-BzMA-co-IBA) fibers. The effect of copolymerization and fiber
formation on the degradation pathways and relative abundances of products are
evaluated.
3.1 Homopolymers
3.1.1 Thermal Degradation of Poly(methyl methacrylate) PMMA
Thermal degradation of PMMA is studied in the literature in details [31-33]. It has been
determined that thermal degradation of PMMA occurs by depolymerization
mechanism yielding mainly the monomer. TGA curve of the PMMA is given in Figure
11. As can be seen the PMMA sample shows a two-step weight loss in the
temperature range of 300–400°C due to polymer degradation.
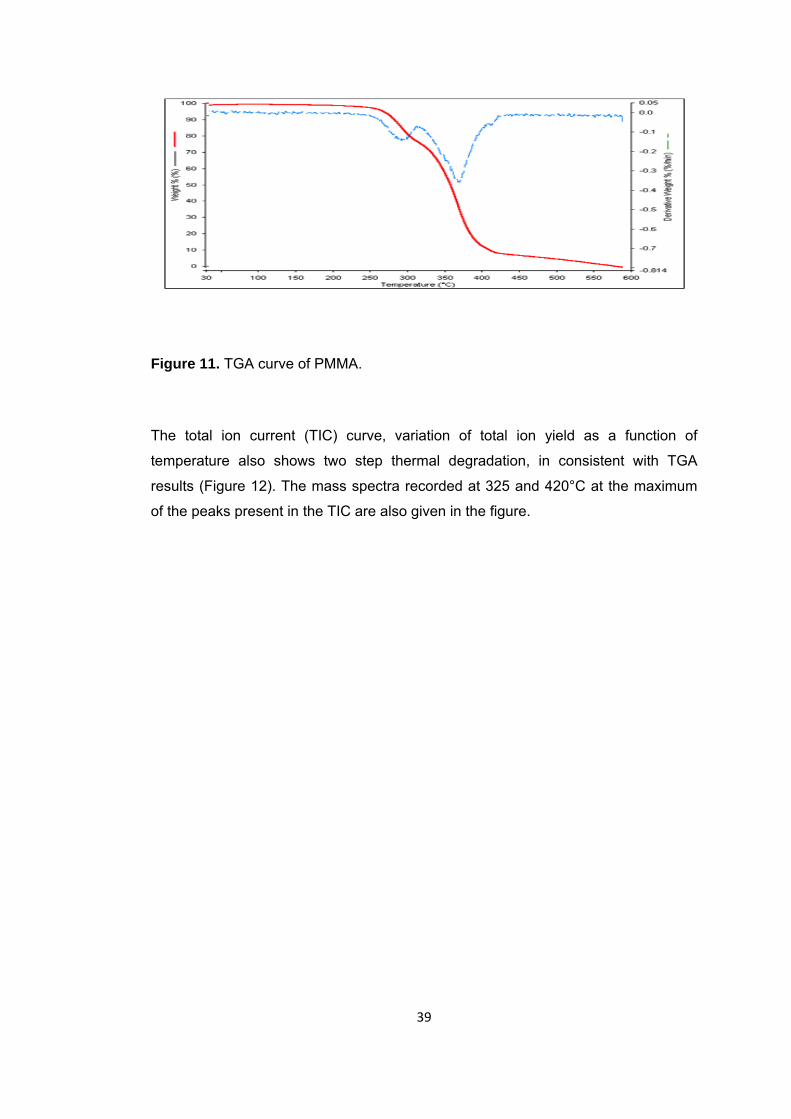
39
Figure 11. TGA curve of PMMA.
The total ion current (TIC) curve, variation of total ion yield as a function of
temperature also shows two step thermal degradation, in consistent with TGA
results (Figure 12). The mass spectra recorded at 325 and 420°C at the maximum
of the peaks present in the TIC are also given in the figure.
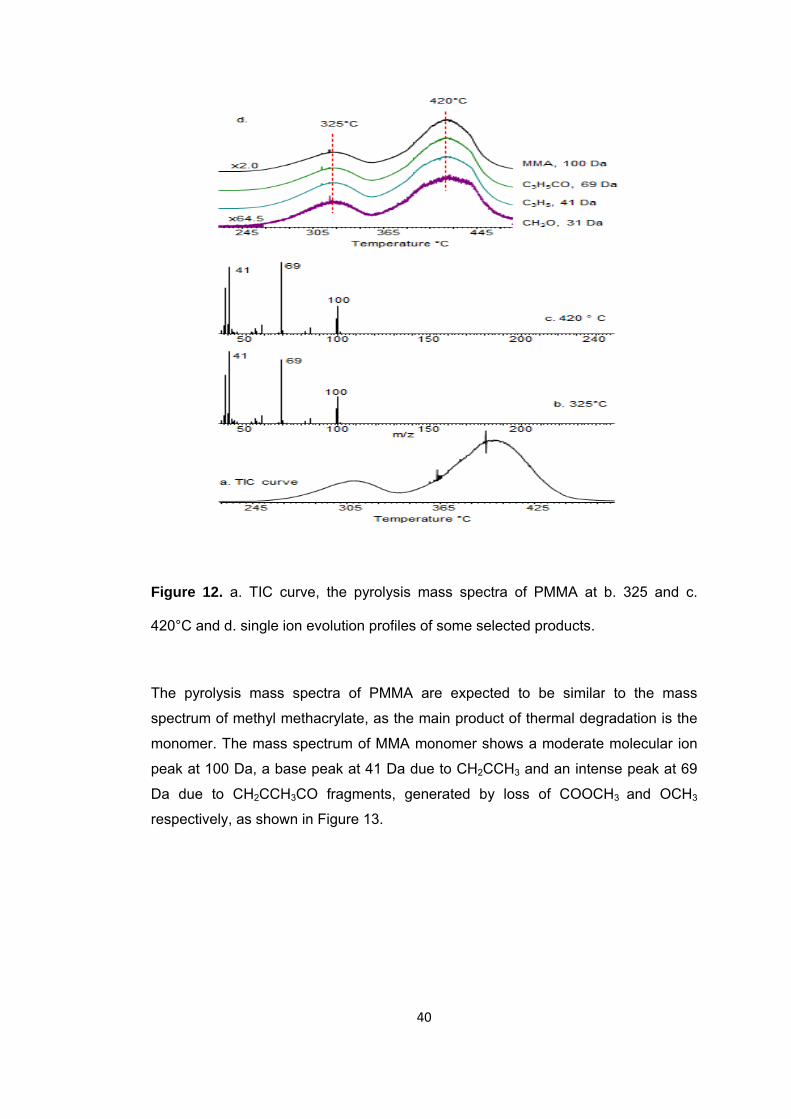
Figure 12
420°C and
The pyrol
spectrum
monomer.
peak at 10
Da due t
respective
2. a. TIC c
d d. single i
lysis mass
of methyl m
. The mass
00 Da, a ba
to CH2CCH
ely, as show
curve, the p
on evolutio
spectra of
methacrylate
s spectrum
ase peak at
H3CO fragm
wn in Figure
40
pyrolysis m
n profiles of
f PMMA a
e, as the m
of MMA mo
t 41 Da due
ments, gen
e 13.
0
ass spectra
f some sele
re expecte
main product
onomer sho
e to CH2CC
erated by
a of PMMA
ected produ
ed to be si
t of therma
ows a mode
CH3 and an
loss of CO
A at b. 325
cts.
imilar to th
l degradatio
erate molec
intense pe
OOCH3 and
5 and c.
he mass
on is the
cular ion
ak at 69
d OCH3
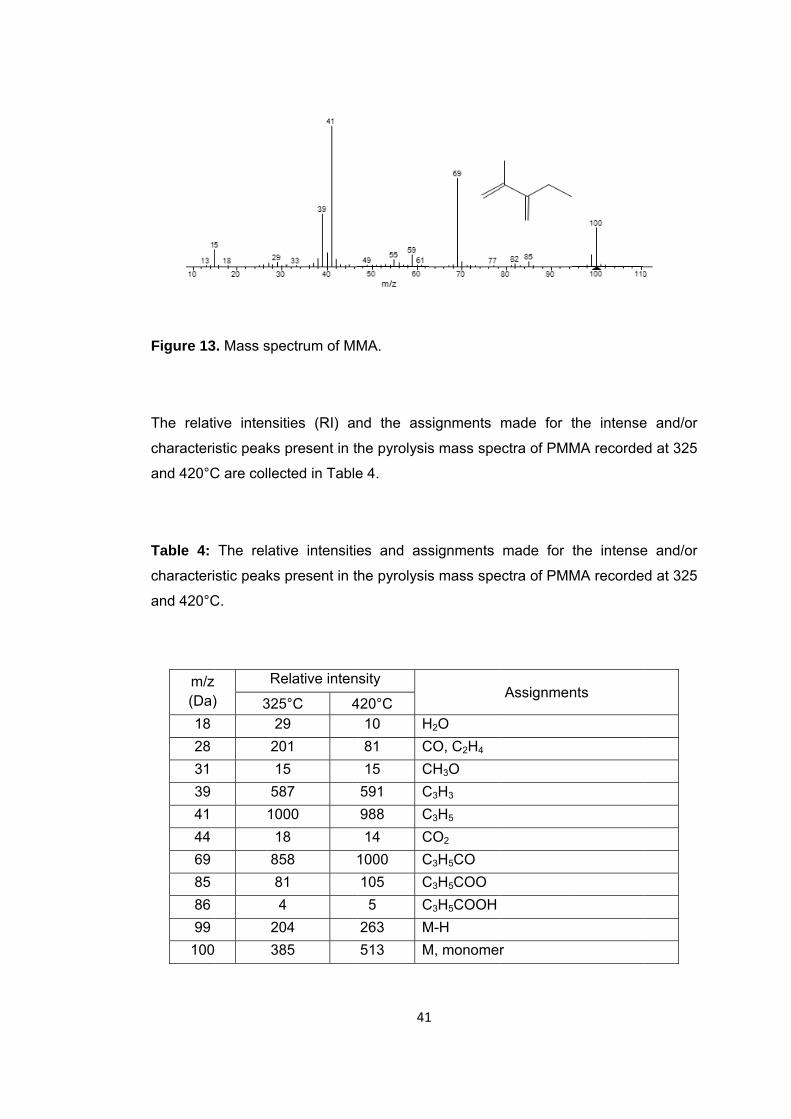
Figure 13
The relati
characteri
and 420°C
Table 4: characteri
and 420°C
m/z (Da)18 28 31 39 41 44 69 85 86 99
100
3. Mass spe
ive intensit
stic peaks p
C are collec
The relativ
stic peaks p
C.
) Re
32529
2015
58100
1885814
20 38
ectrum of MM
ties (RI) an
present in t
cted in Table
ve intensitie
present in t
elative inten
5°C 49
01 5
87 00 8
58 1
4 04 85
41
MA.
nd the ass
he pyrolysis
e 4.
es and ass
he pyrolysis
nsity
420°C 10 H81 C15 C
591 C988 C14 C
1000 C105 C
5 C263 M513 M
1
signments
s mass spe
signments
s mass spe
H2O CO, C2H4 CH3O C3H3 C3H5 CO2 C3H5CO C3H5COO C3H5COOHM-H M, monomer
made for t
ectra of PMM
made for
ectra of PMM
Assignmen
r
the intense
MA recorde
the intense
MA recorde
nts
e and/or
ed at 325
e and/or
ed at 325
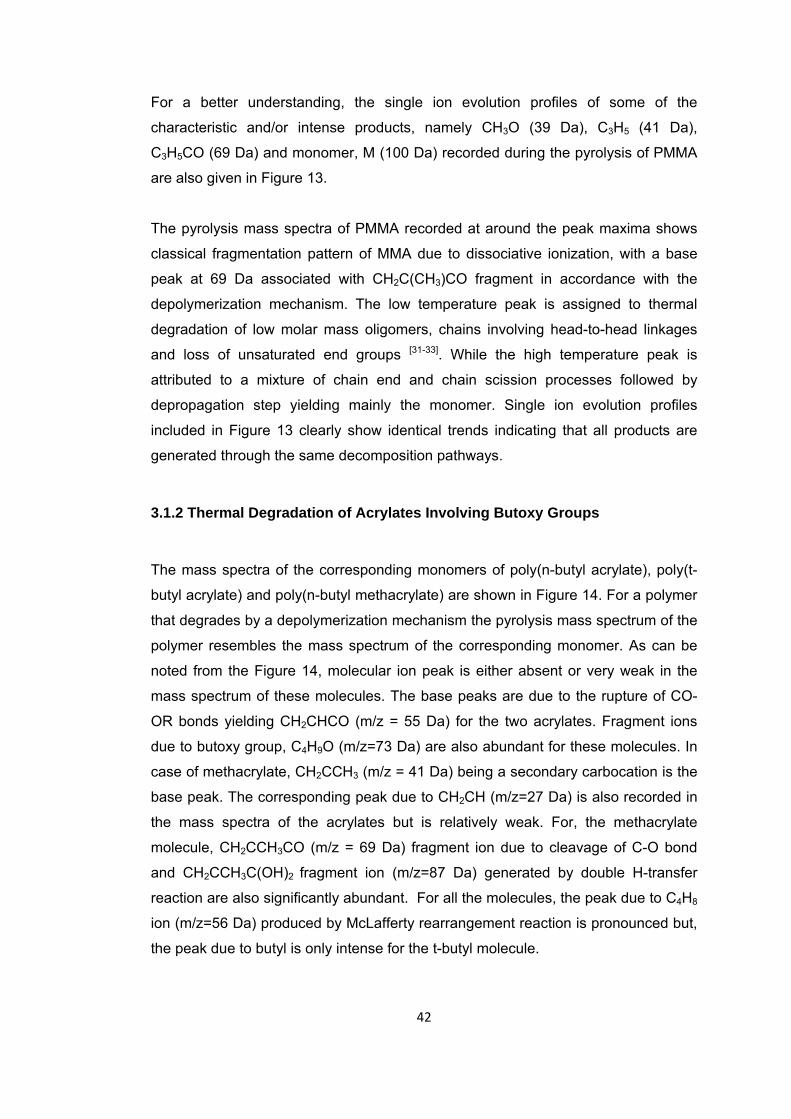
42
For a better understanding, the single ion evolution profiles of some of the
characteristic and/or intense products, namely CH3O (39 Da), C3H5 (41 Da),
C3H5CO (69 Da) and monomer, M (100 Da) recorded during the pyrolysis of PMMA
are also given in Figure 13.
The pyrolysis mass spectra of PMMA recorded at around the peak maxima shows
classical fragmentation pattern of MMA due to dissociative ionization, with a base
peak at 69 Da associated with CH2C(CH3)CO fragment in accordance with the
depolymerization mechanism. The low temperature peak is assigned to thermal
degradation of low molar mass oligomers, chains involving head-to-head linkages
and loss of unsaturated end groups [31-33]. While the high temperature peak is
attributed to a mixture of chain end and chain scission processes followed by
depropagation step yielding mainly the monomer. Single ion evolution profiles
included in Figure 13 clearly show identical trends indicating that all products are
generated through the same decomposition pathways.
3.1.2 Thermal Degradation of Acrylates Involving Butoxy Groups
The mass spectra of the corresponding monomers of poly(n-butyl acrylate), poly(t-
butyl acrylate) and poly(n-butyl methacrylate) are shown in Figure 14. For a polymer
that degrades by a depolymerization mechanism the pyrolysis mass spectrum of the
polymer resembles the mass spectrum of the corresponding monomer. As can be
noted from the Figure 14, molecular ion peak is either absent or very weak in the
mass spectrum of these molecules. The base peaks are due to the rupture of CO-
OR bonds yielding CH2CHCO (m/z = 55 Da) for the two acrylates. Fragment ions
due to butoxy group, C4H9O (m/z=73 Da) are also abundant for these molecules. In
case of methacrylate, CH2CCH3 (m/z = 41 Da) being a secondary carbocation is the
base peak. The corresponding peak due to CH2CH (m/z=27 Da) is also recorded in
the mass spectra of the acrylates but is relatively weak. For, the methacrylate
molecule, CH2CCH3CO (m/z = 69 Da) fragment ion due to cleavage of C-O bond
and CH2CCH3C(OH)2 fragment ion (m/z=87 Da) generated by double H-transfer
reaction are also significantly abundant. For all the molecules, the peak due to C4H8
ion (m/z=56 Da) produced by McLafferty rearrangement reaction is pronounced but,
the peak due to butyl is only intense for the t-butyl molecule.
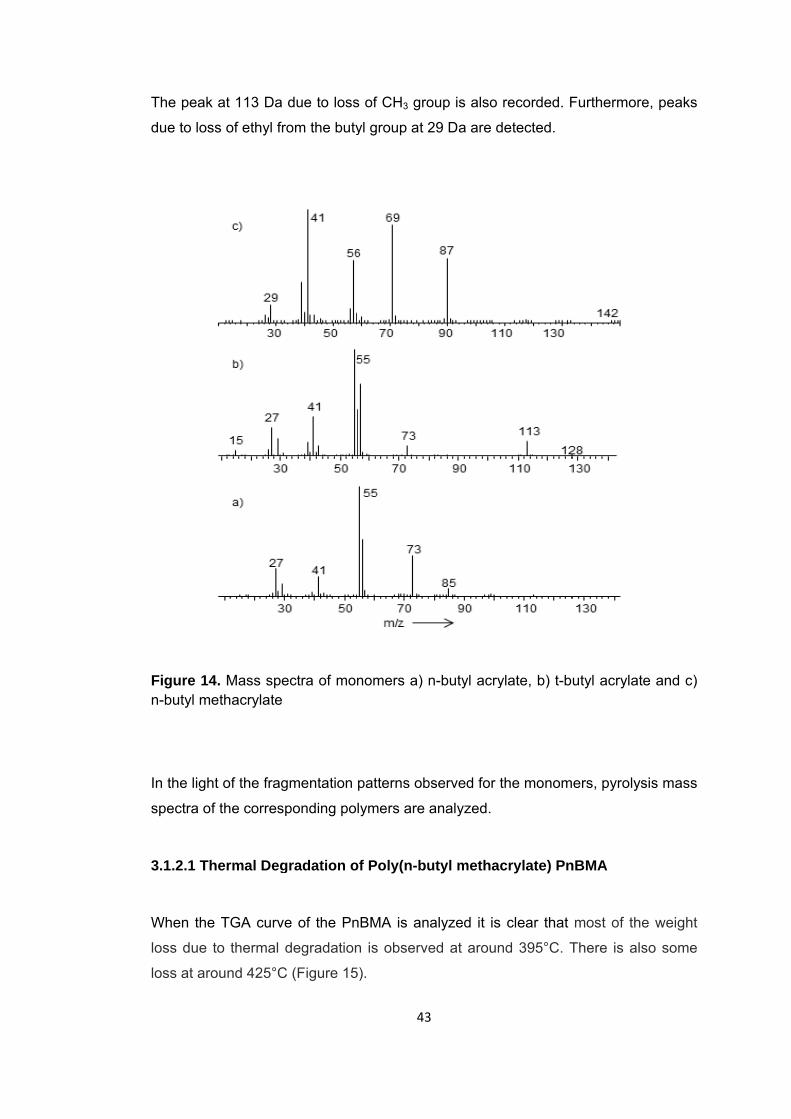
The peak
due to los
Figure 14n-butyl me
In the ligh
spectra of
3.1.2.1 Th
When the
loss due t
loss at aro
at 113 Da
s of ethyl fr
4. Mass speethacrylate
t of the frag
f the corresp
hermal Deg
TGA curve
to thermal d
ound 425°C
due to loss
rom the buty
ectra of mon
gmentation
ponding po
gradation o
e of the Pn
degradation
C (Figure 15
43
s of CH3 gro
yl group at 2
nomers a) n
patterns ob
lymers are
of Poly(n-bu
nBMA is an
n is observe
5).
3
oup is also
29 Da are d
n-butyl acry
bserved for t
analyzed.
utyl methac
alyzed it is
ed at aroun
recorded. F
detected.
ylate, b) t-b
the monom
crylate) Pn
clear that
nd 395°C. T
Furthermore
utyl acrylate
ers, pyrolys
nBMA
most of the
There is als
e, peaks
e and c)
sis mass
e weight
so some
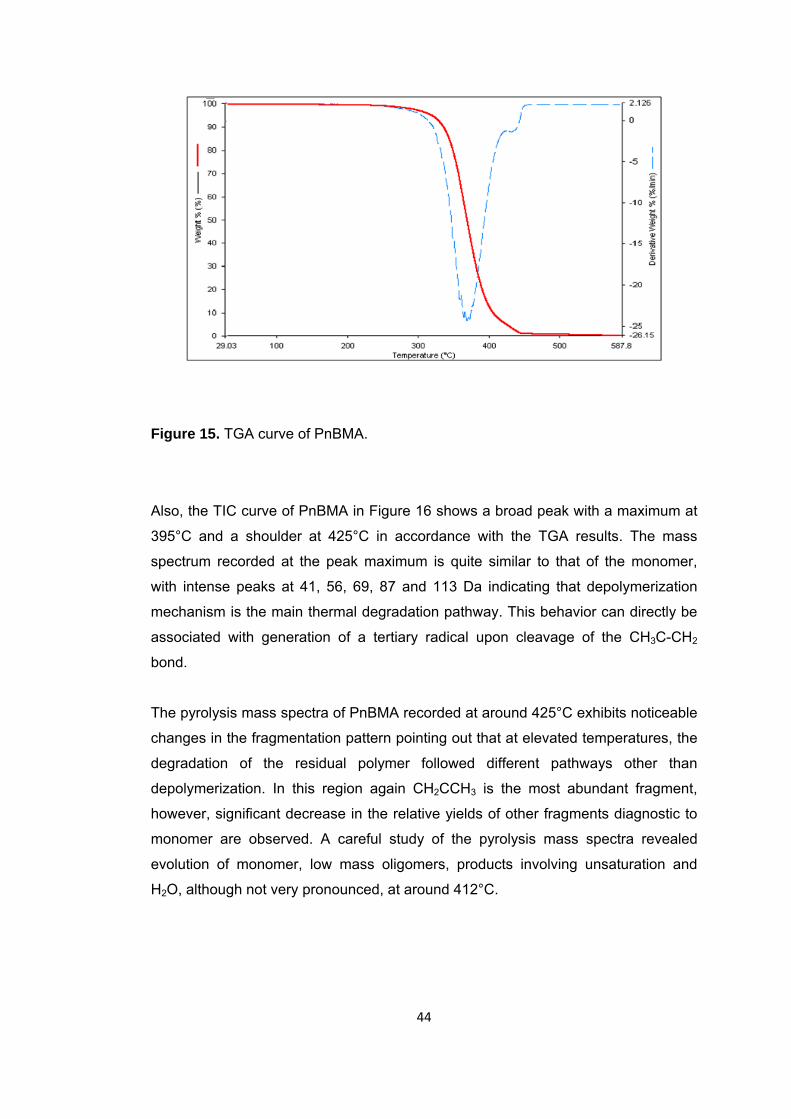
44
Figure 15. TGA curve of PnBMA.
Also, the TIC curve of PnBMA in Figure 16 shows a broad peak with a maximum at
395°C and a shoulder at 425°C in accordance with the TGA results. The mass
spectrum recorded at the peak maximum is quite similar to that of the monomer,
with intense peaks at 41, 56, 69, 87 and 113 Da indicating that depolymerization
mechanism is the main thermal degradation pathway. This behavior can directly be
associated with generation of a tertiary radical upon cleavage of the CH3C-CH2
bond.
The pyrolysis mass spectra of PnBMA recorded at around 425°C exhibits noticeable
changes in the fragmentation pattern pointing out that at elevated temperatures, the
degradation of the residual polymer followed different pathways other than
depolymerization. In this region again CH2CCH3 is the most abundant fragment,
however, significant decrease in the relative yields of other fragments diagnostic to
monomer are observed. A careful study of the pyrolysis mass spectra revealed
evolution of monomer, low mass oligomers, products involving unsaturation and
H2O, although not very pronounced, at around 412°C.
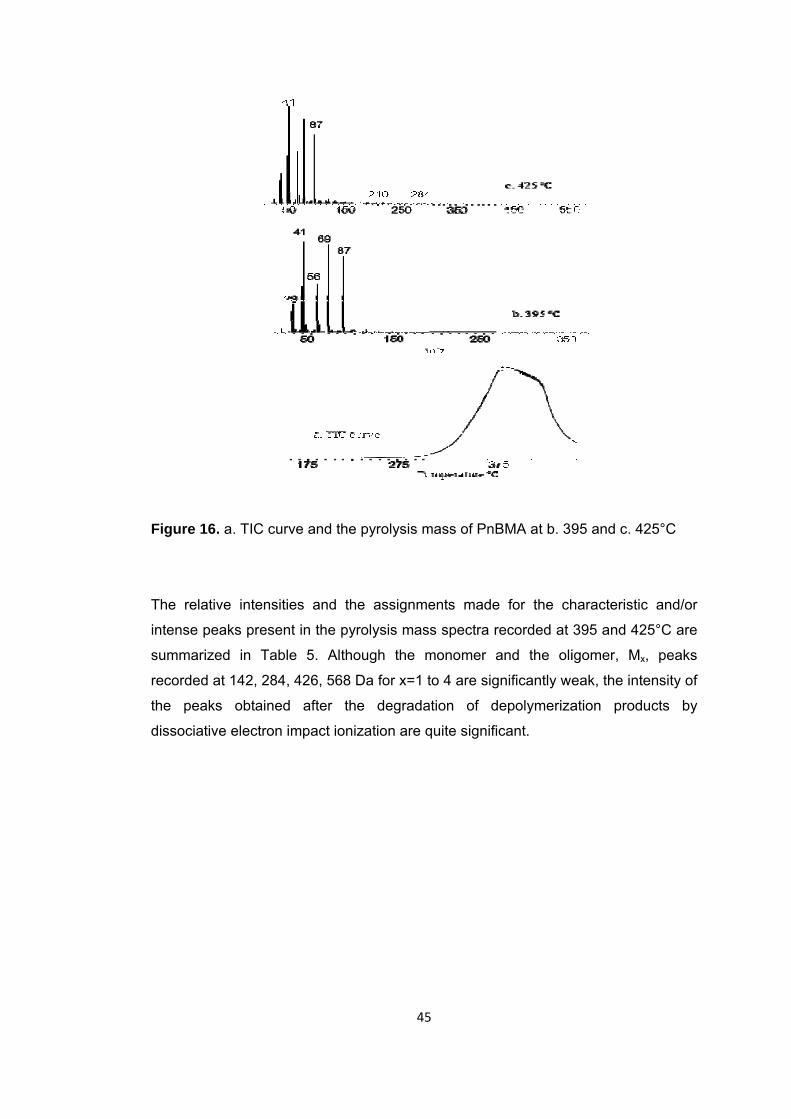
Figure 16
The relati
intense pe
summariz
recorded a
the peak
dissociativ
6. a. TIC cur
ive intensit
eaks presen
ed in Tab
at 142, 284
ks obtained
ve electron
rve and the
ies and th
nt in the pyr
le 5. Altho
, 426, 568 D
d after the
impact ioniz
45
pyrolysis m
e assignme
rolysis mas
ough the m
Da for x=1 t
e degrada
zation are q
5
mass of PnB
ents made
s spectra re
monomer a
to 4 are sig
ation of de
quite signific
BMA at b. 39
for the ch
ecorded at
and the oli
nificantly we
epolymeriza
cant.
95 and c. 4
haracteristic
395 and 42
igomer, Mx
eak, the inte
ation prod
25°C
c and/or
25°C are
x, peaks
ensity of
ucts by
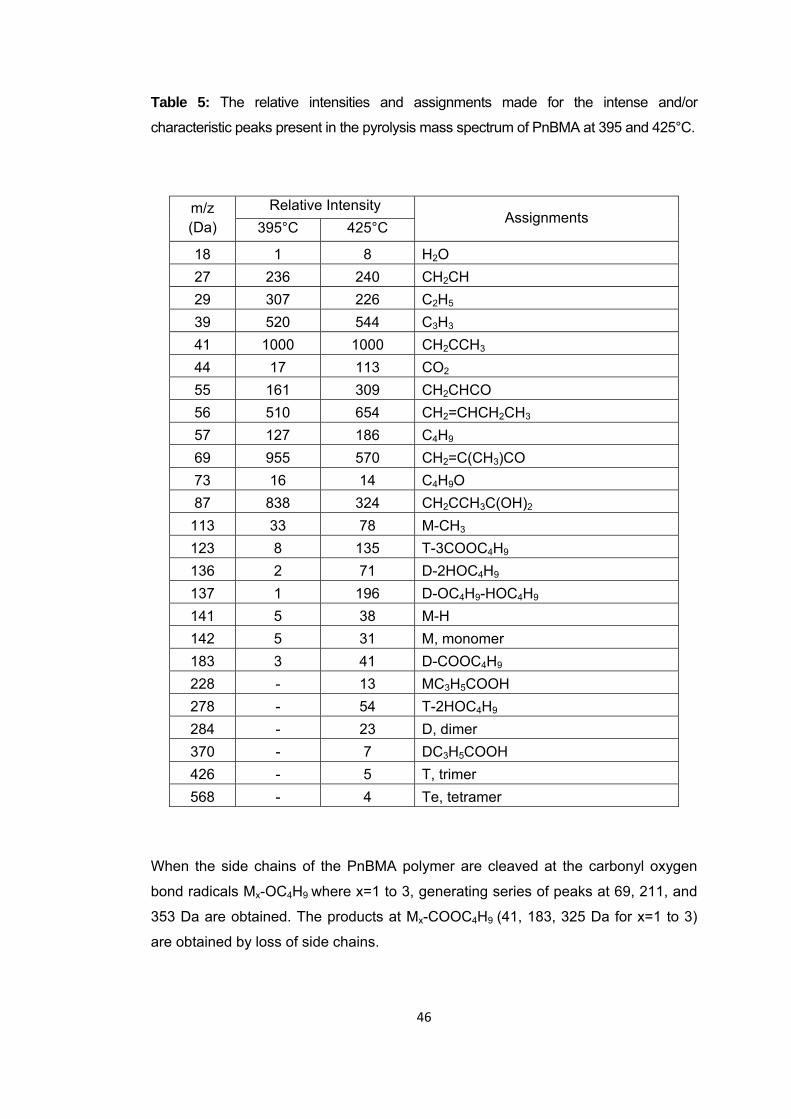
46
Table 5: The relative intensities and assignments made for the intense and/or
characteristic peaks present in the pyrolysis mass spectrum of PnBMA at 395 and 425°C.
m/z (Da)
Relative Intensity Assignments
395°C 425°C
18 1 8 H2O 27 236 240 CH2CH 29 307 226 C2H5 39 520 544 C3H3 41 1000 1000 CH2CCH3 44 17 113 CO2 55 161 309 CH2CHCO 56 510 654 CH2=CHCH2CH3 57 127 186 C4H9 69 955 570 CH2=C(CH3)CO 73 16 14 C4H9O 87 838 324 CH2CCH3C(OH)2
113 33 78 M-CH3 123 8 135 T-3COOC4H9 136 2 71 D-2HOC4H9 137 1 196 D-OC4H9-HOC4H9 141 5 38 M-H 142 5 31 M, monomer 183 3 41 D-COOC4H9 228 - 13 MC3H5COOH 278 - 54 T-2HOC4H9 284 - 23 D, dimer 370 - 7 DC3H5COOH 426 - 5 T, trimer 568 - 4 Te, tetramer
When the side chains of the PnBMA polymer are cleaved at the carbonyl oxygen
bond radicals Mx-OC4H9 where x=1 to 3, generating series of peaks at 69, 211, and
353 Da are obtained. The products at Mx-COOC4H9 (41, 183, 325 Da for x=1 to 3)
are obtained by loss of side chains.
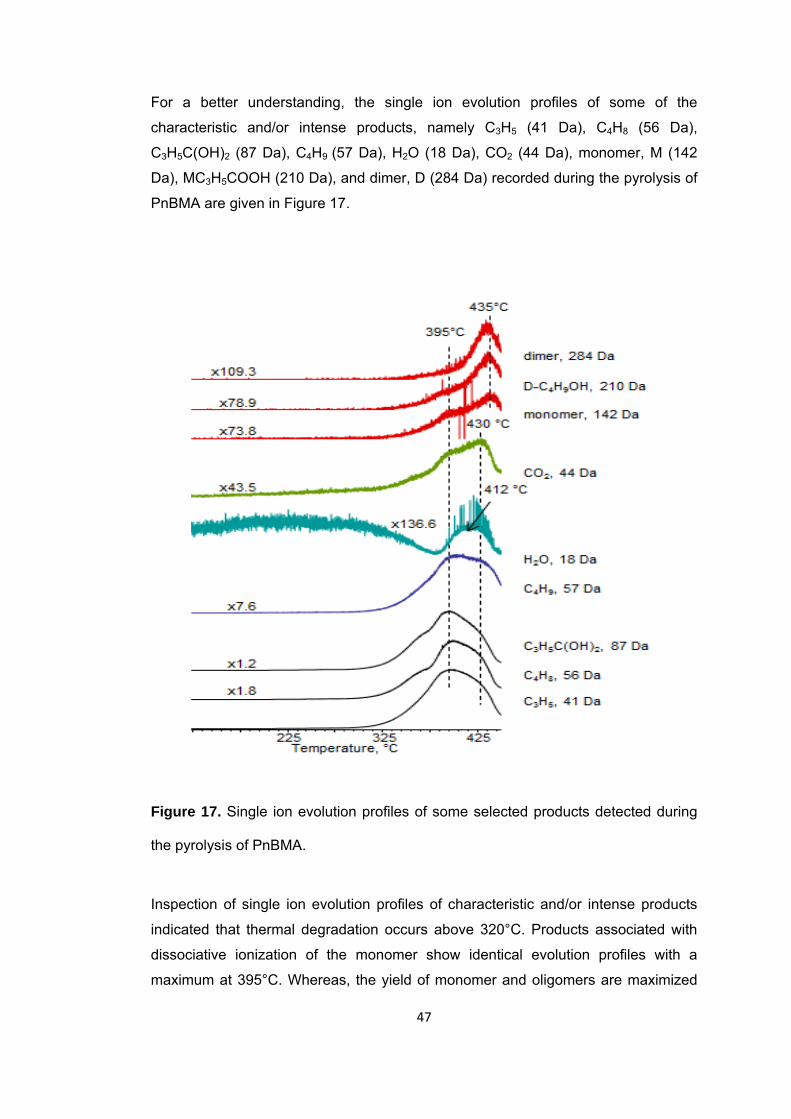
47
For a better understanding, the single ion evolution profiles of some of the
characteristic and/or intense products, namely C3H5 (41 Da), C4H8 (56 Da),
C3H5C(OH)2 (87 Da), C4H9 (57 Da), H2O (18 Da), CO2 (44 Da), monomer, M (142
Da), MC3H5COOH (210 Da), and dimer, D (284 Da) recorded during the pyrolysis of
PnBMA are given in Figure 17.
Figure 17. Single ion evolution profiles of some selected products detected during
the pyrolysis of PnBMA.
Inspection of single ion evolution profiles of characteristic and/or intense products
indicated that thermal degradation occurs above 320°C. Products associated with
dissociative ionization of the monomer show identical evolution profiles with a
maximum at 395°C. Whereas, the yield of monomer and oligomers are maximized
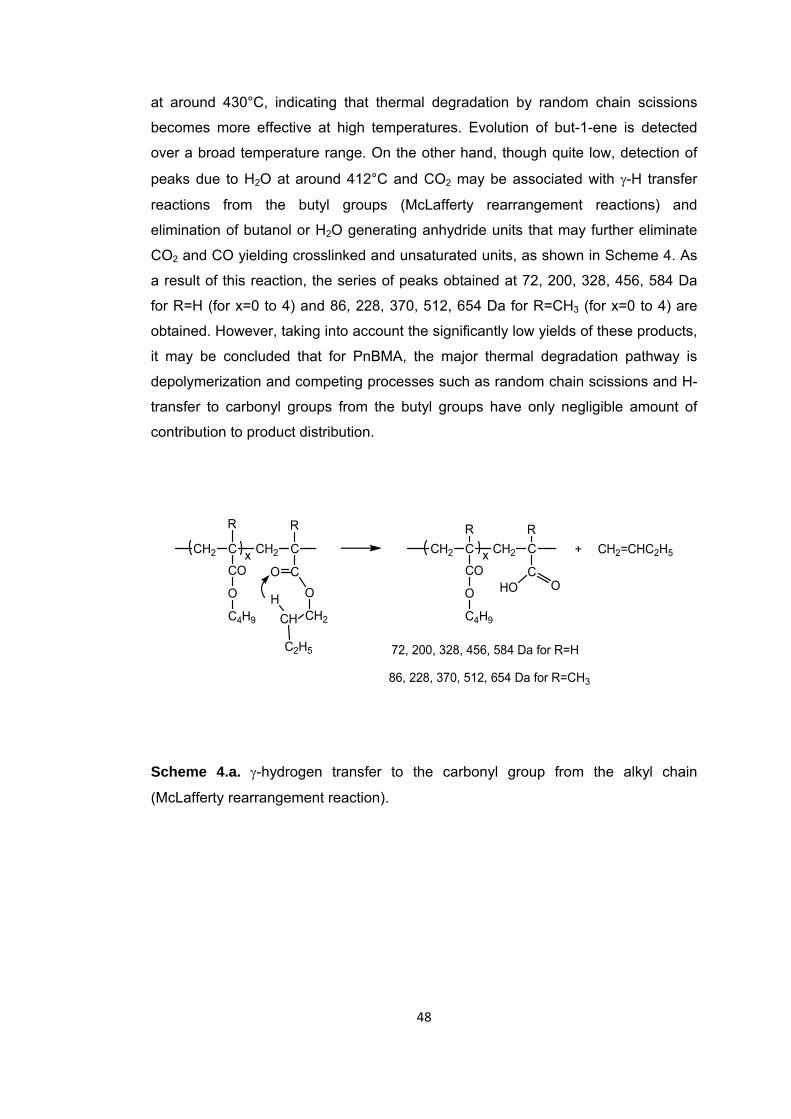
48
at around 430°C, indicating that thermal degradation by random chain scissions
becomes more effective at high temperatures. Evolution of but-1-ene is detected
over a broad temperature range. On the other hand, though quite low, detection of
peaks due to H2O at around 412°C and CO2 may be associated with γ-H transfer
reactions from the butyl groups (McLafferty rearrangement reactions) and
elimination of butanol or H2O generating anhydride units that may further eliminate
CO2 and CO yielding crosslinked and unsaturated units, as shown in Scheme 4. As
a result of this reaction, the series of peaks obtained at 72, 200, 328, 456, 584 Da
for R=H (for x=0 to 4) and 86, 228, 370, 512, 654 Da for R=CH3 (for x=0 to 4) are
obtained. However, taking into account the significantly low yields of these products,
it may be concluded that for PnBMA, the major thermal degradation pathway is
depolymerization and competing processes such as random chain scissions and H-
transfer to carbonyl groups from the butyl groups have only negligible amount of
contribution to product distribution.
CH2 C
CO
O
C4H9
CH2 C
CO
CH2
+
O
CH2=CHC2H5
CHH
C2H5
CH2 C
CO
O
C4H9
CH2 C
CHO O
x x
72, 200, 328, 456, 584 Da for R=H
R R R R
86, 228, 370, 512, 654 Da for R=CH3
Scheme 4.a. γ-hydrogen transfer to the carbonyl group from the alkyl chain
(McLafferty rearrangement reaction).
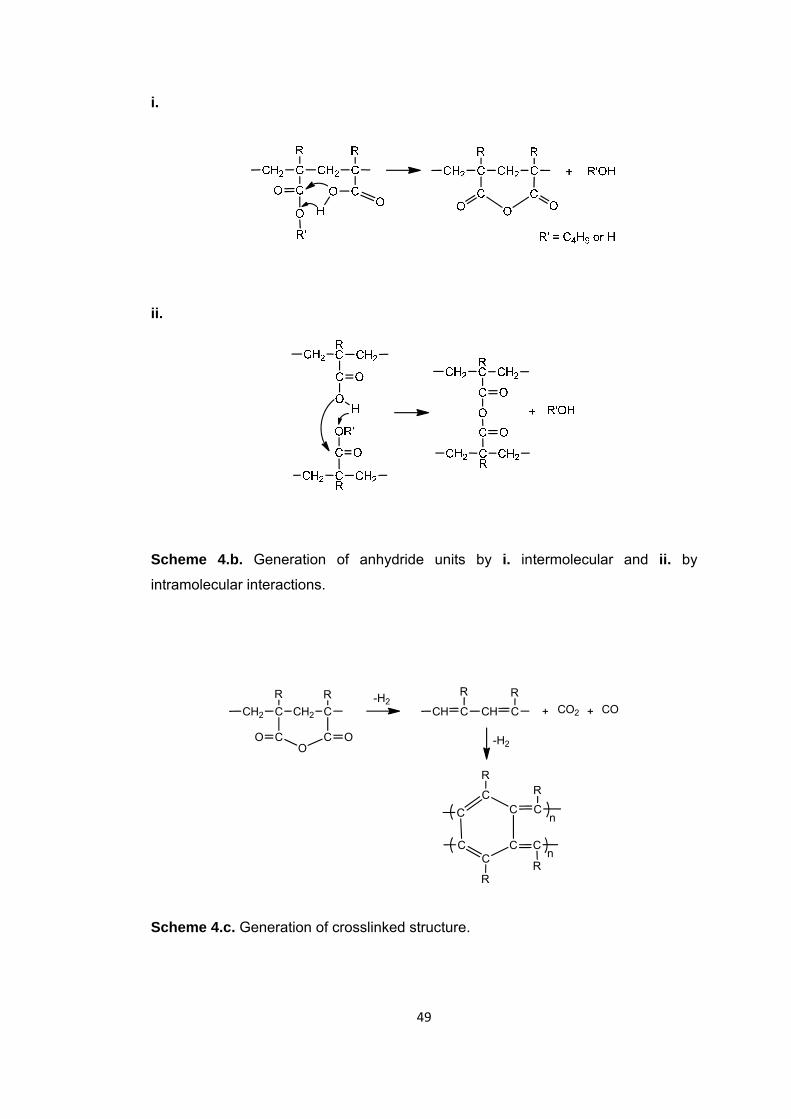
49
i.
ii.
Scheme 4.b. Generation of anhydride units by i. intermolecular and ii. by
intramolecular interactions.
CH2 C
CO
CH2 C
C OO
CH C CH C + CO2 + CO
CC
C C
CC
C C
-H2
-H2
n
n
R R R R
R
R
R
R
Scheme 4.c. Generation of crosslinked structure.
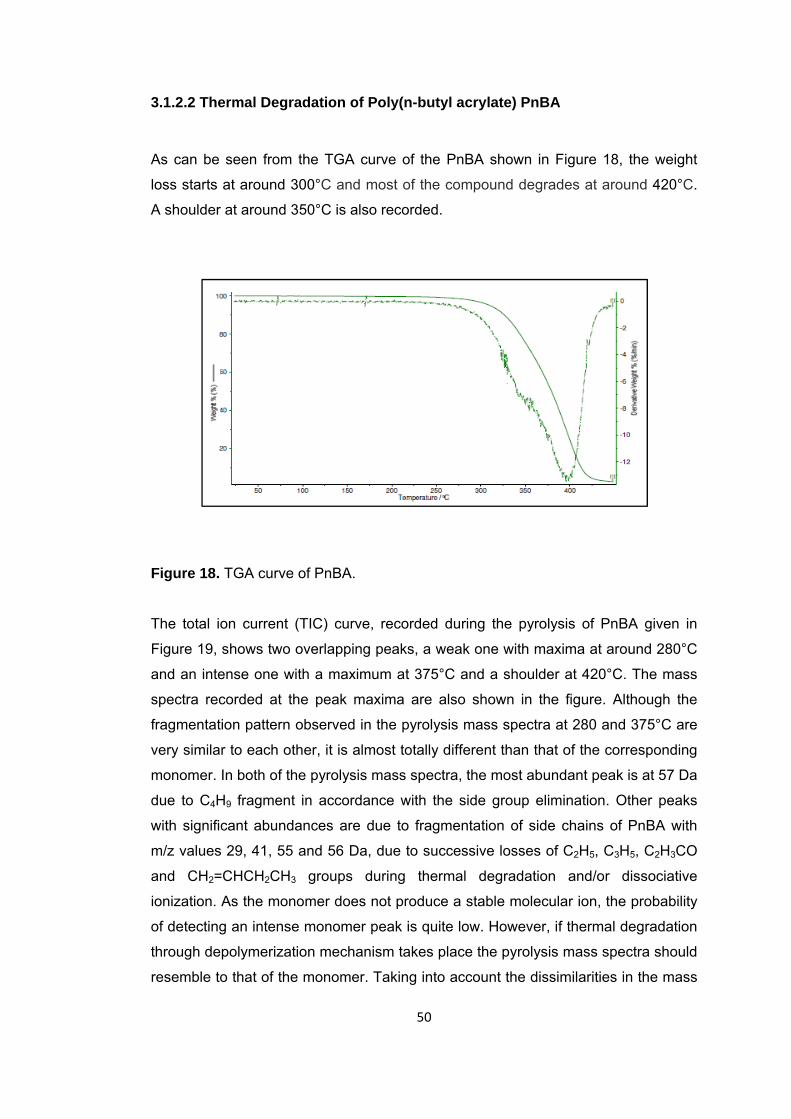
50
3.1.2.2 Thermal Degradation of Poly(n-butyl acrylate) PnBA
As can be seen from the TGA curve of the PnBA shown in Figure 18, the weight
loss starts at around 300°C and most of the compound degrades at around 420°C.
A shoulder at around 350°C is also recorded.
Figure 18. TGA curve of PnBA.
The total ion current (TIC) curve, recorded during the pyrolysis of PnBA given in
Figure 19, shows two overlapping peaks, a weak one with maxima at around 280°C
and an intense one with a maximum at 375°C and a shoulder at 420°C. The mass
spectra recorded at the peak maxima are also shown in the figure. Although the
fragmentation pattern observed in the pyrolysis mass spectra at 280 and 375°C are
very similar to each other, it is almost totally different than that of the corresponding
monomer. In both of the pyrolysis mass spectra, the most abundant peak is at 57 Da
due to C4H9 fragment in accordance with the side group elimination. Other peaks
with significant abundances are due to fragmentation of side chains of PnBA with
m/z values 29, 41, 55 and 56 Da, due to successive losses of C2H5, C3H5, C2H3CO
and CH2=CHCH2CH3 groups during thermal degradation and/or dissociative
ionization. As the monomer does not produce a stable molecular ion, the probability
of detecting an intense monomer peak is quite low. However, if thermal degradation
through depolymerization mechanism takes place the pyrolysis mass spectra should
resemble to that of the monomer. Taking into account the dissimilarities in the mass
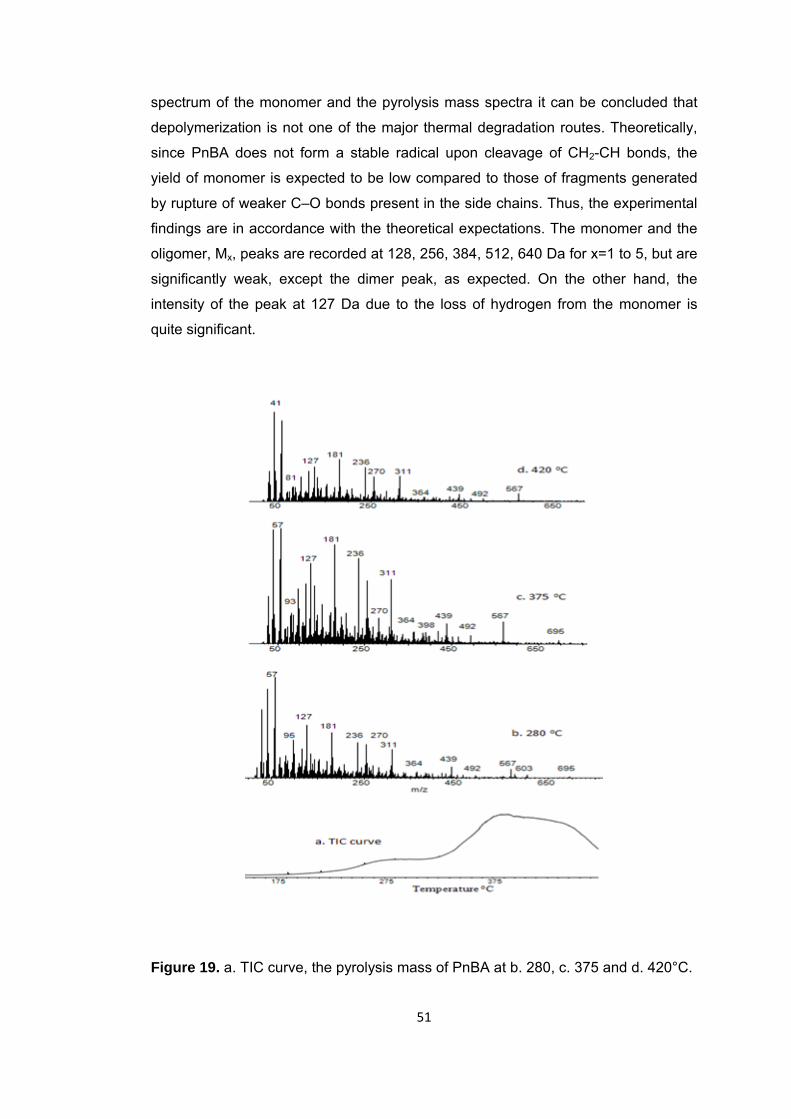
51
spectrum of the monomer and the pyrolysis mass spectra it can be concluded that
depolymerization is not one of the major thermal degradation routes. Theoretically,
since PnBA does not form a stable radical upon cleavage of CH2-CH bonds, the
yield of monomer is expected to be low compared to those of fragments generated
by rupture of weaker C–O bonds present in the side chains. Thus, the experimental
findings are in accordance with the theoretical expectations. The monomer and the
oligomer, Mx, peaks are recorded at 128, 256, 384, 512, 640 Da for x=1 to 5, but are
significantly weak, except the dimer peak, as expected. On the other hand, the
intensity of the peak at 127 Da due to the loss of hydrogen from the monomer is
quite significant.
Figure 19. a. TIC curve, the pyrolysis mass of PnBA at b. 280, c. 375 and d. 420°C.
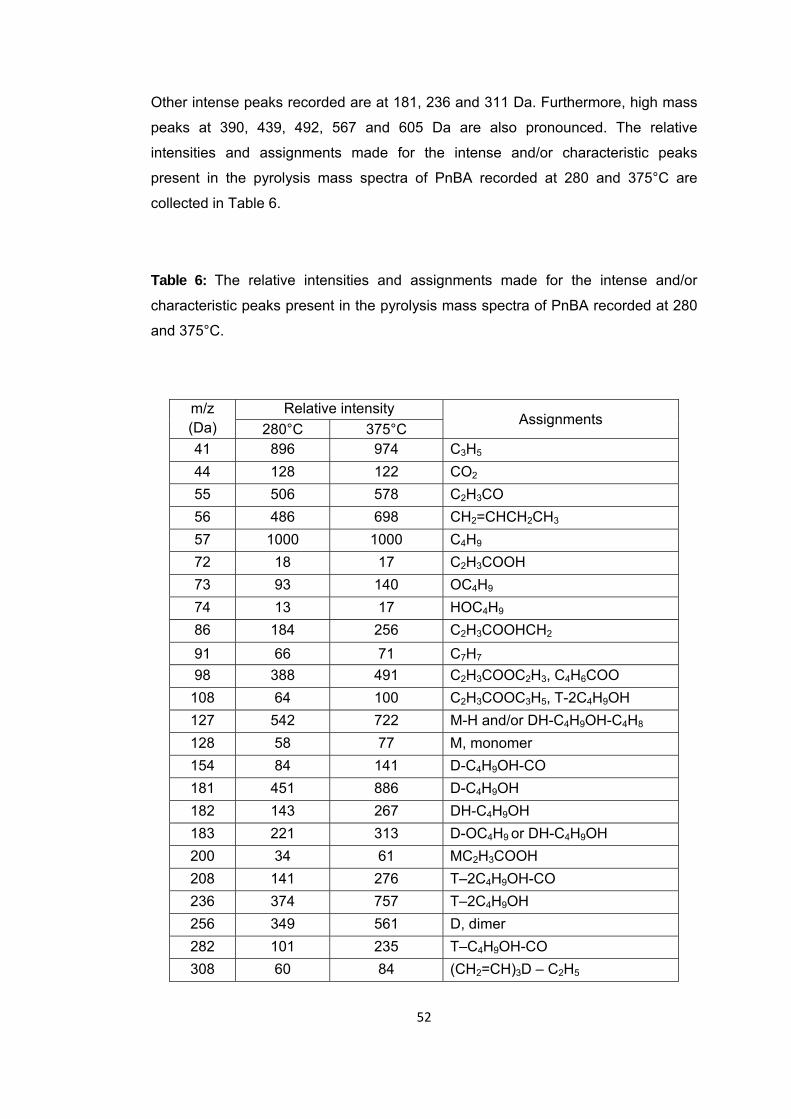
52
Other intense peaks recorded are at 181, 236 and 311 Da. Furthermore, high mass
peaks at 390, 439, 492, 567 and 605 Da are also pronounced. The relative
intensities and assignments made for the intense and/or characteristic peaks
present in the pyrolysis mass spectra of PnBA recorded at 280 and 375°C are
collected in Table 6.
Table 6: The relative intensities and assignments made for the intense and/or
characteristic peaks present in the pyrolysis mass spectra of PnBA recorded at 280
and 375°C.
m/z (Da)
Relative intensity Assignments
280°C 375°C 41 896 974 C3H5 44 128 122 CO2 55 506 578 C2H3CO 56 486 698 CH2=CHCH2CH3 57 1000 1000 C4H9 72 18 17 C2H3COOH 73 93 140 OC4H9 74 13 17 HOC4H9 86 184 256 C2H3COOHCH2 91 66 71 C7H7 98 388 491 C2H3COOC2H3, C4H6COO
108 64 100 C2H3COOC3H5, T-2C4H9OH 127 542 722 M-H and/or DH-C4H9OH-C4H8 128 58 77 M, monomer 154 84 141 D-C4H9OH-CO 181 451 886 D-C4H9OH 182 143 267 DH-C4H9OH 183 221 313 D-OC4H9 or DH-C4H9OH 200 34 61 MC2H3COOH 208 141 276 T–2C4H9OH-CO 236 374 757 T–2C4H9OH 256 349 561 D, dimer 282 101 235 T–C4H9OH-CO 308 60 84 (CH2=CH)3D – C2H5
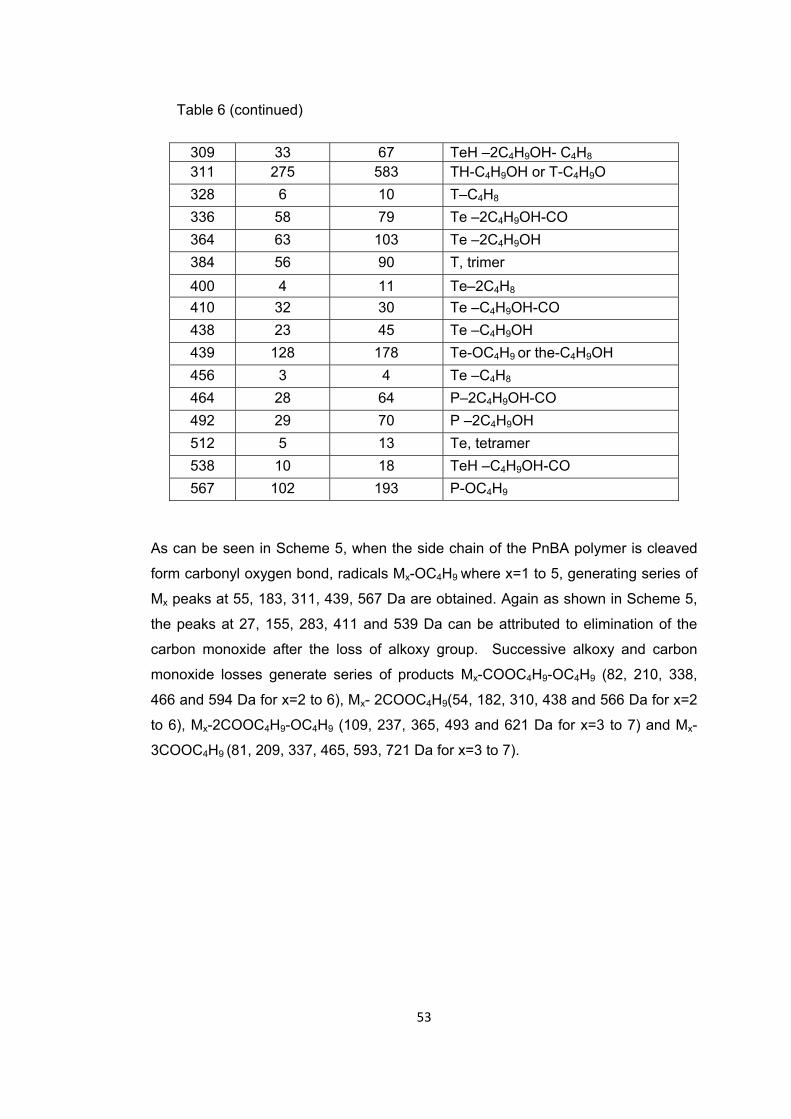
53
Table 6 (continued)
309 33 67 TeH –2C4H9OH- C4H8 311 275 583 TH-C4H9OH or T-C4H9O 328 6 10 T–C4H8 336 58 79 Te –2C4H9OH-CO 364 63 103 Te –2C4H9OH 384 56 90 T, trimer 400 4 11 Te–2C4H8 410 32 30 Te –C4H9OH-CO 438 23 45 Te –C4H9OH 439 128 178 Te-OC4H9 or the-C4H9OH 456 3 4 Te –C4H8 464 28 64 P–2C4H9OH-CO 492 29 70 P –2C4H9OH 512 5 13 Te, tetramer 538 10 18 TeH –C4H9OH-CO 567 102 193 P-OC4H9
As can be seen in Scheme 5, when the side chain of the PnBA polymer is cleaved
form carbonyl oxygen bond, radicals Mx-OC4H9 where x=1 to 5, generating series of
Mx peaks at 55, 183, 311, 439, 567 Da are obtained. Again as shown in Scheme 5,
the peaks at 27, 155, 283, 411 and 539 Da can be attributed to elimination of the
carbon monoxide after the loss of alkoxy group. Successive alkoxy and carbon
monoxide losses generate series of products Mx-COOC4H9-OC4H9 (82, 210, 338,
466 and 594 Da for x=2 to 6), Mx- 2COOC4H9(54, 182, 310, 438 and 566 Da for x=2
to 6), Mx-2COOC4H9-OC4H9 (109, 237, 365, 493 and 621 Da for x=3 to 7) and Mx-
3COOC4H9 (81, 209, 337, 465, 593, 721 Da for x=3 to 7).
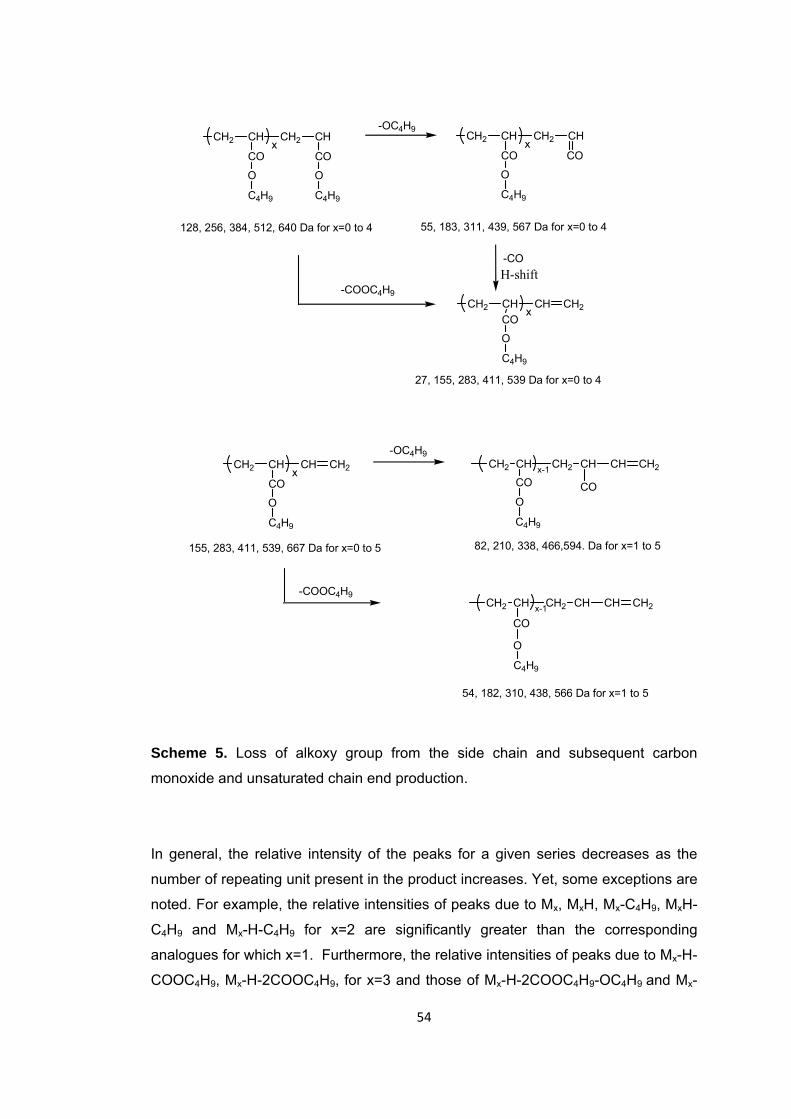
54
CH2 CH
CO
O
C4H9
CH2 CH
CO
O
C4H9
x
128, 256, 384, 512, 640 Da for x=0 to 4
CH2 CH
CO
O
C4H9
CH2 CH
COx
55, 183, 311, 439, 567 Da for x=0 to 4
CO
O
C4H9
27, 155, 283, 411, 539 Da for x=0 to 4
O
C4H9
54, 182, 310, 438, 566 Da for x=1 to 5
CH2 CH CH CH2x
CH2 CH CH2 CHx-1 CH CH2
CO
CO
O
C4H9
155, 283, 411, 539, 667 Da for x=0 to 5
CH2 CH CH CH2x
O
C4H9
82, 210, 338, 466,594. Da for x=1 to 5
CH2 CH CH2 CHx-1 CH CH2
CO
-OC4H9
-CO
-COOC4H9
-COOC4H9
-OC4H9
CO
H-shift
Scheme 5. Loss of alkoxy group from the side chain and subsequent carbon
monoxide and unsaturated chain end production.
In general, the relative intensity of the peaks for a given series decreases as the
number of repeating unit present in the product increases. Yet, some exceptions are
noted. For example, the relative intensities of peaks due to Mx, MxH, Mx-C4H9, MxH-
C4H9 and Mx-H-C4H9 for x=2 are significantly greater than the corresponding
analogues for which x=1. Furthermore, the relative intensities of peaks due to Mx-H-
COOC4H9, Mx-H-2COOC4H9, for x=3 and those of Mx-H-2COOC4H9-OC4H9 and Mx-
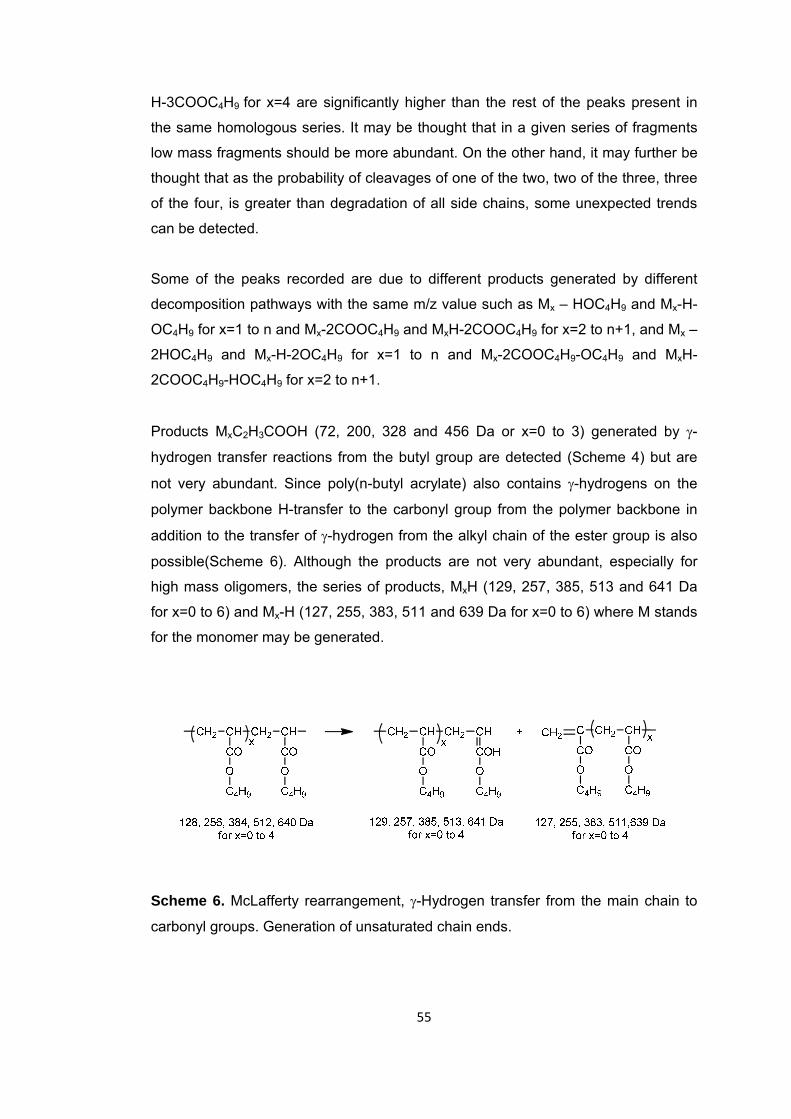
55
H-3COOC4H9 for x=4 are significantly higher than the rest of the peaks present in
the same homologous series. It may be thought that in a given series of fragments
low mass fragments should be more abundant. On the other hand, it may further be
thought that as the probability of cleavages of one of the two, two of the three, three
of the four, is greater than degradation of all side chains, some unexpected trends
can be detected.
Some of the peaks recorded are due to different products generated by different
decomposition pathways with the same m/z value such as Mx – HOC4H9 and Mx-H-
OC4H9 for x=1 to n and Mx-2COOC4H9 and MxH-2COOC4H9 for x=2 to n+1, and Mx –
2HOC4H9 and Mx-H-2OC4H9 for x=1 to n and Mx-2COOC4H9-OC4H9 and MxH-
2COOC4H9-HOC4H9 for x=2 to n+1.
Products MxC2H3COOH (72, 200, 328 and 456 Da or x=0 to 3) generated by γ-
hydrogen transfer reactions from the butyl group are detected (Scheme 4) but are
not very abundant. Since poly(n-butyl acrylate) also contains γ-hydrogens on the
polymer backbone H-transfer to the carbonyl group from the polymer backbone in
addition to the transfer of γ-hydrogen from the alkyl chain of the ester group is also
possible(Scheme 6). Although the products are not very abundant, especially for
high mass oligomers, the series of products, MxH (129, 257, 385, 513 and 641 Da
for x=0 to 6) and Mx-H (127, 255, 383, 511 and 639 Da for x=0 to 6) where M stands
for the monomer may be generated.
Scheme 6. McLafferty rearrangement, γ-Hydrogen transfer from the main chain to
carbonyl groups. Generation of unsaturated chain ends.
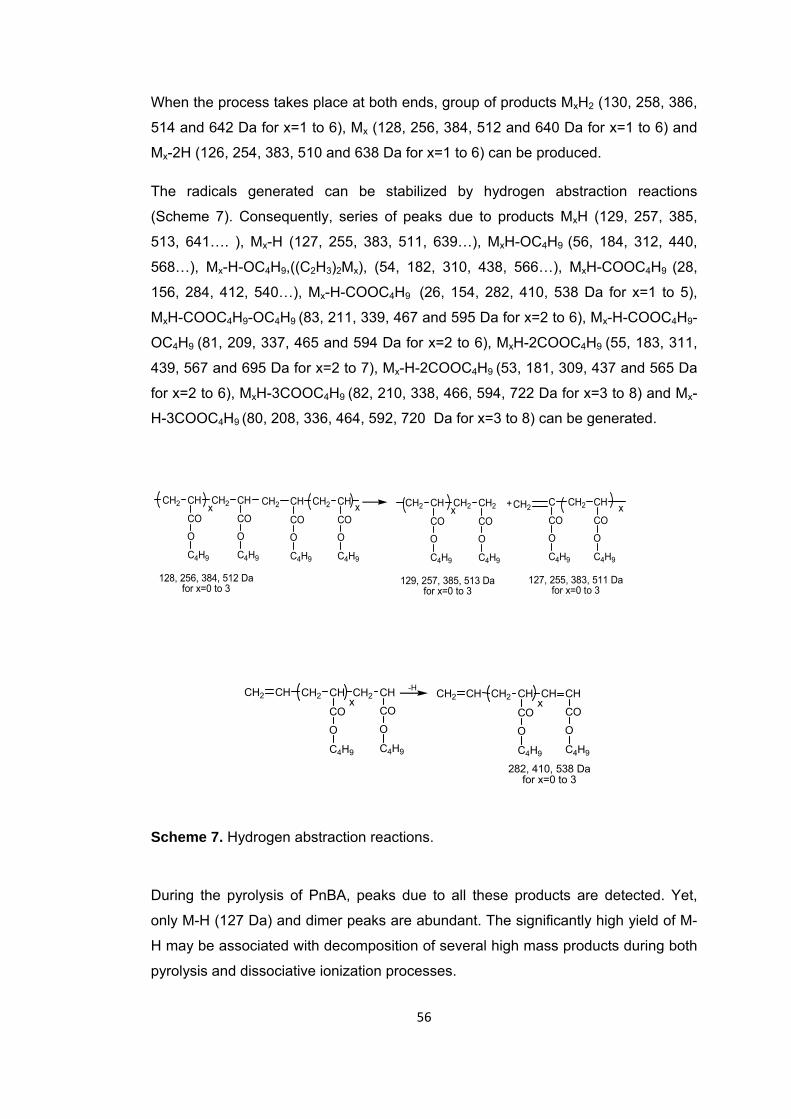
56
When the process takes place at both ends, group of products MxH2 (130, 258, 386,
514 and 642 Da for x=1 to 6), Mx (128, 256, 384, 512 and 640 Da for x=1 to 6) and
Mx-2H (126, 254, 383, 510 and 638 Da for x=1 to 6) can be produced.
The radicals generated can be stabilized by hydrogen abstraction reactions
(Scheme 7). Consequently, series of peaks due to products MxH (129, 257, 385,
513, 641…. ), Mx-H (127, 255, 383, 511, 639…), MxH-OC4H9 (56, 184, 312, 440,
568…), Mx-H-OC4H9,((C2H3)2Mx), (54, 182, 310, 438, 566…), MxH-COOC4H9 (28,
156, 284, 412, 540…), Mx-H-COOC4H9 (26, 154, 282, 410, 538 Da for x=1 to 5),
MxH-COOC4H9-OC4H9 (83, 211, 339, 467 and 595 Da for x=2 to 6), Mx-H-COOC4H9-
OC4H9 (81, 209, 337, 465 and 594 Da for x=2 to 6), MxH-2COOC4H9 (55, 183, 311,
439, 567 and 695 Da for x=2 to 7), Mx-H-2COOC4H9 (53, 181, 309, 437 and 565 Da
for x=2 to 6), MxH-3COOC4H9 (82, 210, 338, 466, 594, 722 Da for x=3 to 8) and Mx-
H-3COOC4H9 (80, 208, 336, 464, 592, 720 Da for x=3 to 8) can be generated.
CH2 CH
CO
O
C4H9
CH2 CH
CO
O
C4H9
x
128, 256, 384, 512 Dafor x=0 to 3
CH2 CH
CO
O
C4H9
CH2 CH
CO
O
C4H9
x CH2 CH
CO
O
C4H9
CH2 CH2
CO
O
C4H9
x CH2 C
CO
O
C4H9
CH2 CH
CO
O
C4H9
x+
129, 257, 385, 513 Dafor x=0 to 3
127, 255, 383, 511 Da for x=0 to 3
CH2 CH
CO
O
C4H9
xCH2 CH
CO
O
C4H9
CH2 CH CH2 CH
CO
O
C4H9
xCH2 CH
CO
O
C4H9
CH CH
282, 410, 538 Da for x=0 to 3
-H
Scheme 7. Hydrogen abstraction reactions.
During the pyrolysis of PnBA, peaks due to all these products are detected. Yet,
only M-H (127 Da) and dimer peaks are abundant. The significantly high yield of M-
H may be associated with decomposition of several high mass products during both
pyrolysis and dissociative ionization processes.
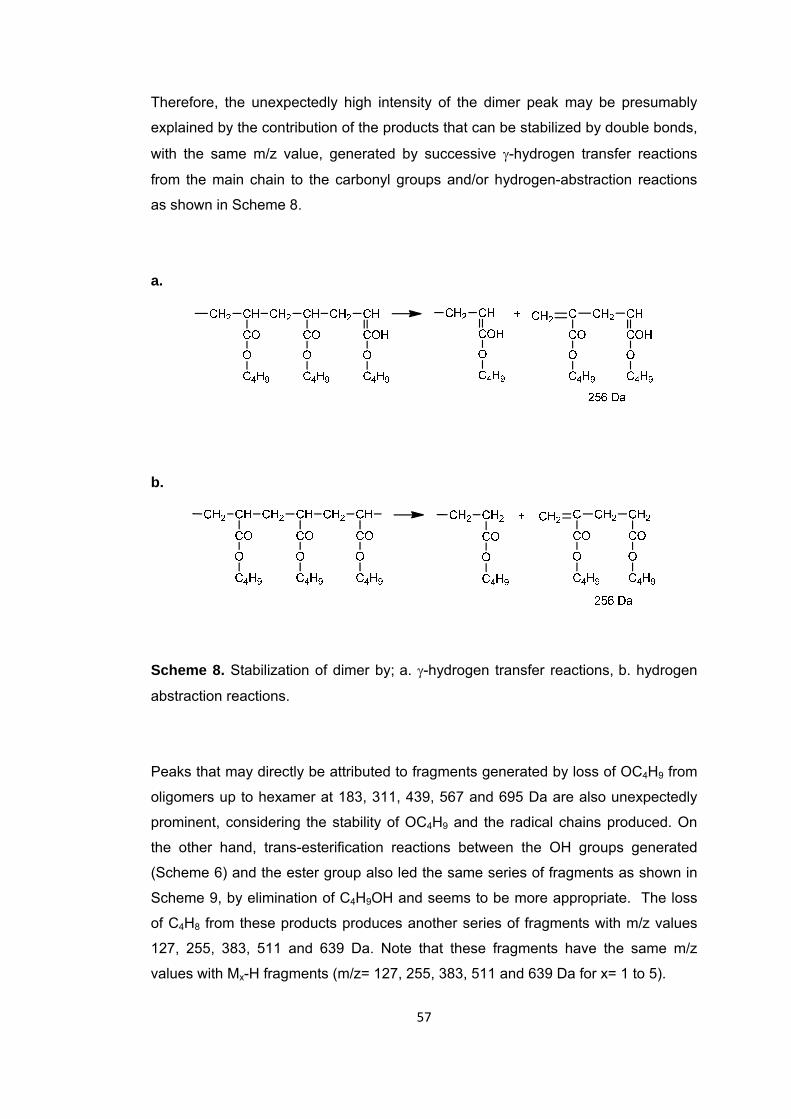
57
Therefore, the unexpectedly high intensity of the dimer peak may be presumably
explained by the contribution of the products that can be stabilized by double bonds,
with the same m/z value, generated by successive γ-hydrogen transfer reactions
from the main chain to the carbonyl groups and/or hydrogen-abstraction reactions
as shown in Scheme 8.
a.
b.
Scheme 8. Stabilization of dimer by; a. γ-hydrogen transfer reactions, b. hydrogen
abstraction reactions.
Peaks that may directly be attributed to fragments generated by loss of OC4H9 from
oligomers up to hexamer at 183, 311, 439, 567 and 695 Da are also unexpectedly
prominent, considering the stability of OC4H9 and the radical chains produced. On
the other hand, trans-esterification reactions between the OH groups generated
(Scheme 6) and the ester group also led the same series of fragments as shown in
Scheme 9, by elimination of C4H9OH and seems to be more appropriate. The loss
of C4H8 from these products produces another series of fragments with m/z values
127, 255, 383, 511 and 639 Da. Note that these fragments have the same m/z
values with Mx-H fragments (m/z= 127, 255, 383, 511 and 639 Da for x= 1 to 5).
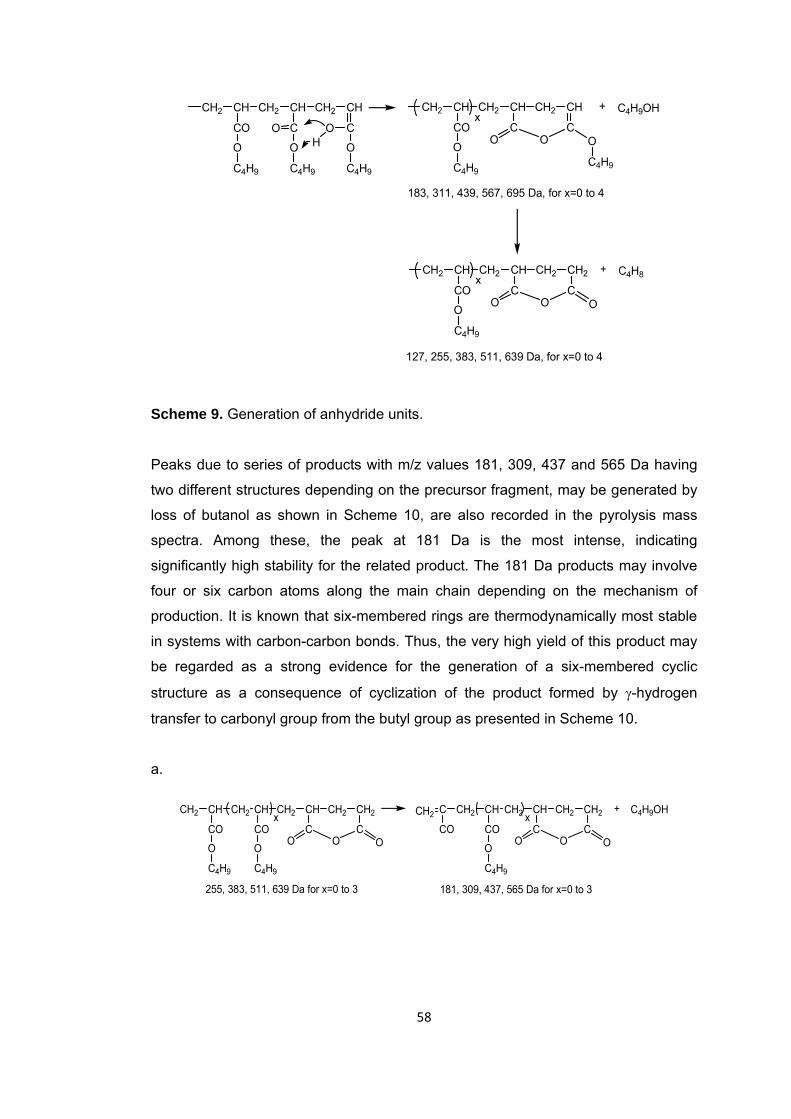
58
CH2 CH
C
O
C4H9
CH2 CH
C
O
C4H9
CH2 CH
CO
O
C4H9
O OH
CH2 CH
C
CH2 CH
CO
C4H9
CH2 CH
CO
O
C4H9
O O
C4H9OH+
183, 311, 439, 567, 695 Da, for x=0 to 4
x
CH2 CH
C
CH2 CH2
CO
CH2 CH
CO
O
C4H9
O O
C4H8+x
127, 255, 383, 511, 639 Da, for x=0 to 4
Scheme 9. Generation of anhydride units. Peaks due to series of products with m/z values 181, 309, 437 and 565 Da having
two different structures depending on the precursor fragment, may be generated by
loss of butanol as shown in Scheme 10, are also recorded in the pyrolysis mass
spectra. Among these, the peak at 181 Da is the most intense, indicating
significantly high stability for the related product. The 181 Da products may involve
four or six carbon atoms along the main chain depending on the mechanism of
production. It is known that six-membered rings are thermodynamically most stable
in systems with carbon-carbon bonds. Thus, the very high yield of this product may
be regarded as a strong evidence for the generation of a six-membered cyclic
structure as a consequence of cyclization of the product formed by γ-hydrogen
transfer to carbonyl group from the butyl group as presented in Scheme 10.
a.
C4H9OH+xCH2 CH
C
CH2 CH2
CO
CH2 CH
CO
O
C4H9
O O
255, 383, 511, 639 Da for x=0 to 3
CH2 CH
CO
O
C4H9
xCH2 CH
C
CH2 CH2
CO
CH2 CH
CO
O
C4H9
O O
181, 309, 437, 565 Da for x=0 to 3
CH2 C
CO
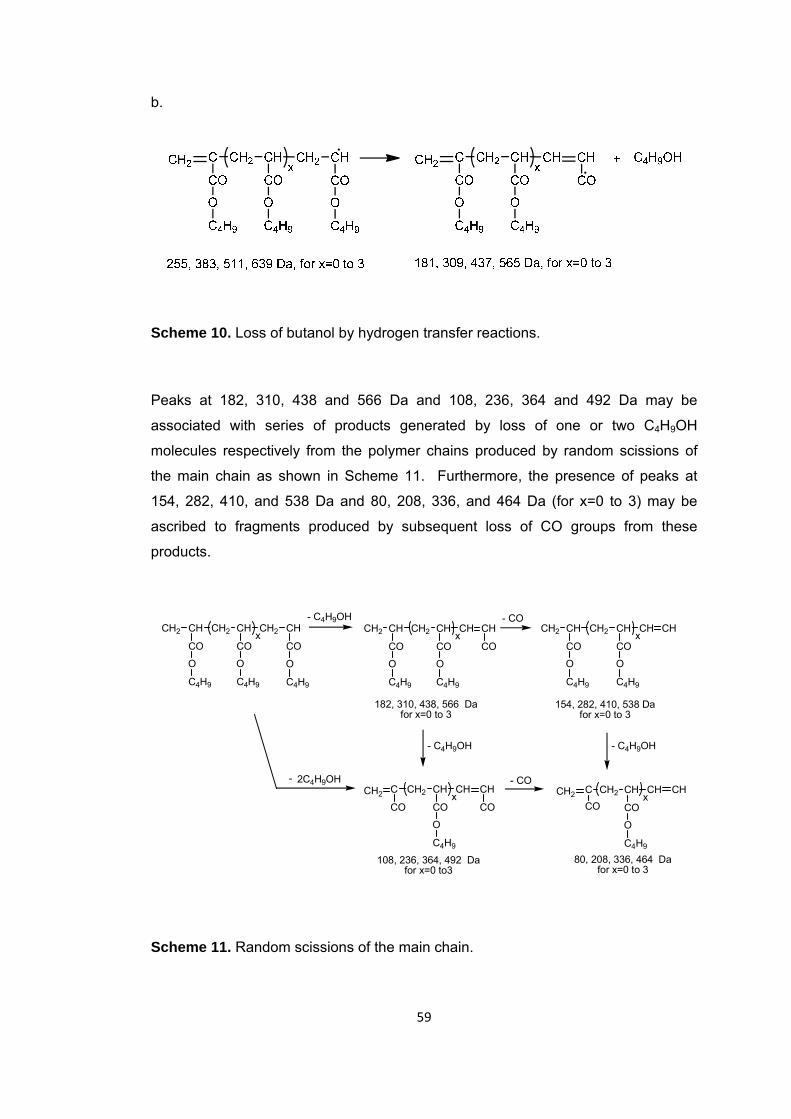
59
b.
Scheme 10. Loss of butanol by hydrogen transfer reactions.
Peaks at 182, 310, 438 and 566 Da and 108, 236, 364 and 492 Da may be
associated with series of products generated by loss of one or two C4H9OH
molecules respectively from the polymer chains produced by random scissions of
the main chain as shown in Scheme 11. Furthermore, the presence of peaks at
154, 282, 410, and 538 Da and 80, 208, 336, and 464 Da (for x=0 to 3) may be
ascribed to fragments produced by subsequent loss of CO groups from these
products.
- C4H9OH
182, 310, 438, 566 Da for x=0 to 3
CH2 CH
CO
O
C4H9
CH2 CH
COx
CH2 CH
CO
O
C4H9
- C4H9OH
CH2 CH
CO
O
C4H9
CH CH
COxCH2 C
CO
108, 236, 364, 492 Dafor x=0 to3
O
C4H9
2C4H9OH-
CH2 CH
CO
O
C4H9
CH CH
COx
CH2 CH
CO
O
C4H9
- CO
154, 282, 410, 538 Da for x=0 to 3
CH2 CH
CO
O
C4H9
CH CHx
CH2 CH
CO
O
C4H9
CH2 CH
CO
O
C4H9
CH CHxCH2 C
80, 208, 336, 464 Dafor x=0 to 3
- C4H9OH
- CO
CO
Scheme 11. Random scissions of the main chain.
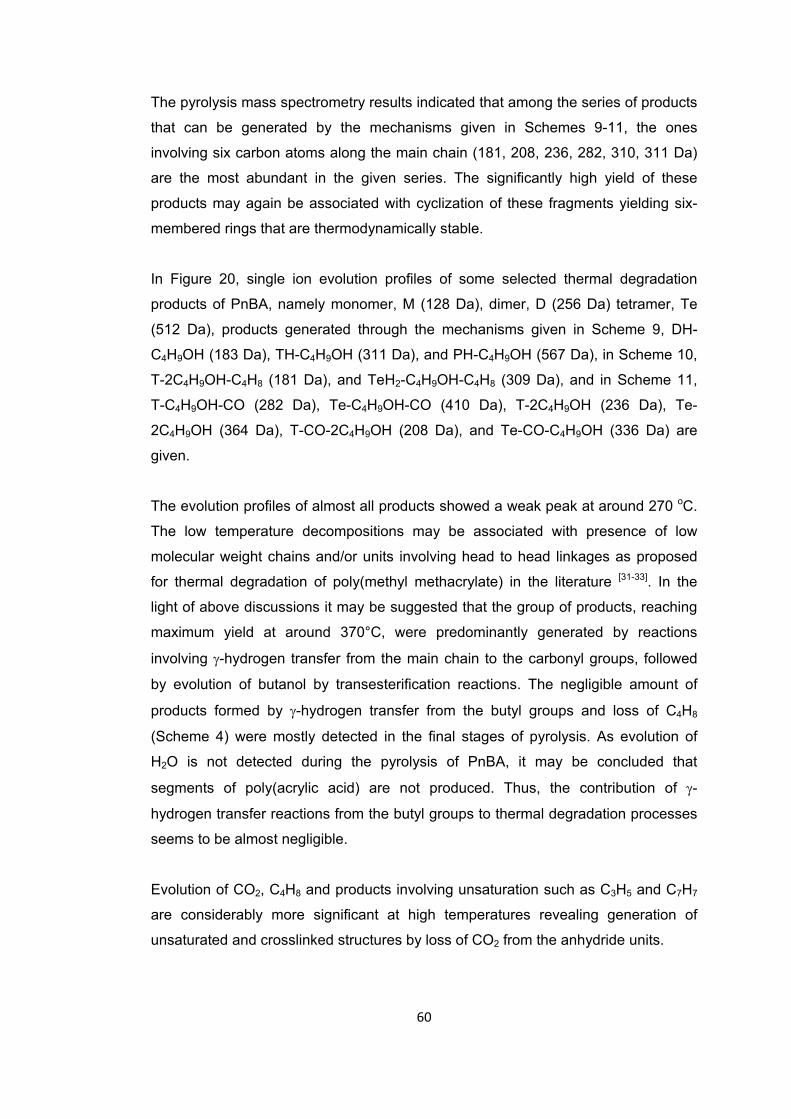
60
The pyrolysis mass spectrometry results indicated that among the series of products
that can be generated by the mechanisms given in Schemes 9-11, the ones
involving six carbon atoms along the main chain (181, 208, 236, 282, 310, 311 Da)
are the most abundant in the given series. The significantly high yield of these
products may again be associated with cyclization of these fragments yielding six-
membered rings that are thermodynamically stable.
In Figure 20, single ion evolution profiles of some selected thermal degradation
products of PnBA, namely monomer, M (128 Da), dimer, D (256 Da) tetramer, Te
(512 Da), products generated through the mechanisms given in Scheme 9, DH-
C4H9OH (183 Da), TH-C4H9OH (311 Da), and PH-C4H9OH (567 Da), in Scheme 10,
T-2C4H9OH-C4H8 (181 Da), and TeH2-C4H9OH-C4H8 (309 Da), and in Scheme 11,
T-C4H9OH-CO (282 Da), Te-C4H9OH-CO (410 Da), T-2C4H9OH (236 Da), Te-
2C4H9OH (364 Da), T-CO-2C4H9OH (208 Da), and Te-CO-C4H9OH (336 Da) are
given.
The evolution profiles of almost all products showed a weak peak at around 270 oC.
The low temperature decompositions may be associated with presence of low
molecular weight chains and/or units involving head to head linkages as proposed
for thermal degradation of poly(methyl methacrylate) in the literature [31-33]. In the
light of above discussions it may be suggested that the group of products, reaching
maximum yield at around 370°C, were predominantly generated by reactions
involving γ-hydrogen transfer from the main chain to the carbonyl groups, followed
by evolution of butanol by transesterification reactions. The negligible amount of
products formed by γ-hydrogen transfer from the butyl groups and loss of C4H8
(Scheme 4) were mostly detected in the final stages of pyrolysis. As evolution of
H2O is not detected during the pyrolysis of PnBA, it may be concluded that
segments of poly(acrylic acid) are not produced. Thus, the contribution of γ-
hydrogen transfer reactions from the butyl groups to thermal degradation processes
seems to be almost negligible.
Evolution of CO2, C4H8 and products involving unsaturation such as C3H5 and C7H7
are considerably more significant at high temperatures revealing generation of
unsaturated and crosslinked structures by loss of CO2 from the anhydride units.
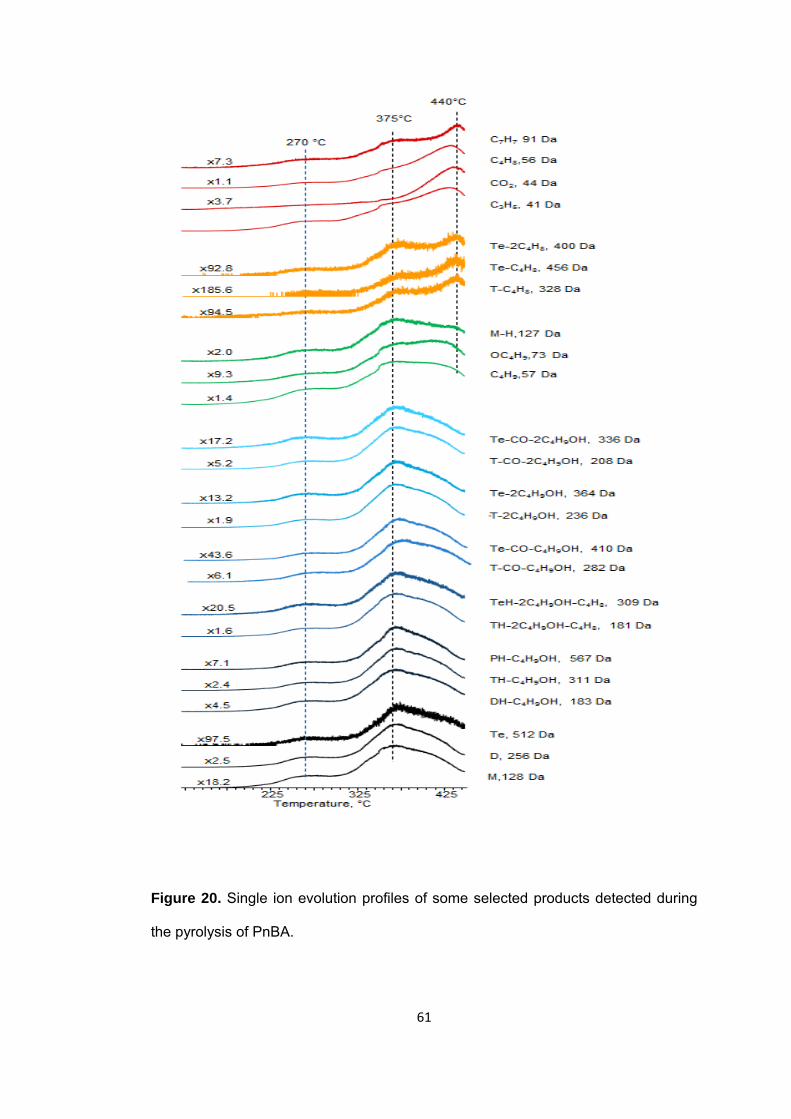
Figure 20
the pyroly
0. Single ion
sis of PnBA
n evolution
A.
61
profiles of
1
some selected produccts detecte
d during
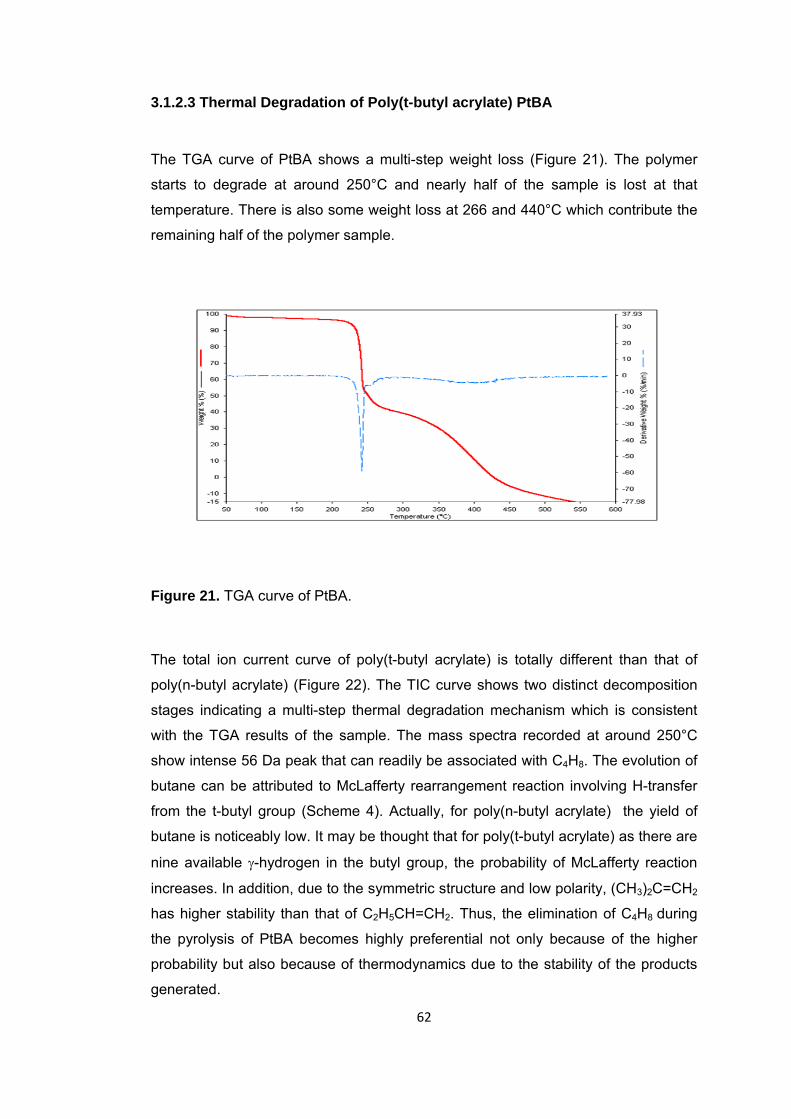
62
3.1.2.3 Thermal Degradation of Poly(t-butyl acrylate) PtBA
The TGA curve of PtBA shows a multi-step weight loss (Figure 21). The polymer
starts to degrade at around 250°C and nearly half of the sample is lost at that
temperature. There is also some weight loss at 266 and 440°C which contribute the
remaining half of the polymer sample.
Figure 21. TGA curve of PtBA.
The total ion current curve of poly(t-butyl acrylate) is totally different than that of
poly(n-butyl acrylate) (Figure 22). The TIC curve shows two distinct decomposition
stages indicating a multi-step thermal degradation mechanism which is consistent
with the TGA results of the sample. The mass spectra recorded at around 250°C
show intense 56 Da peak that can readily be associated with C4H8. The evolution of
butane can be attributed to McLafferty rearrangement reaction involving H-transfer
from the t-butyl group (Scheme 4). Actually, for poly(n-butyl acrylate) the yield of
butane is noticeably low. It may be thought that for poly(t-butyl acrylate) as there are
nine available γ-hydrogen in the butyl group, the probability of McLafferty reaction
increases. In addition, due to the symmetric structure and low polarity, (CH3)2C=CH2
has higher stability than that of C2H5CH=CH2. Thus, the elimination of C4H8 during
the pyrolysis of PtBA becomes highly preferential not only because of the higher
probability but also because of thermodynamics due to the stability of the products
generated.
Figure 22
The mass
curve, are
unsaturate
and C8H9,
characteri
at 250 and
2. a. TIC cur
s spectra re
e quite crow
ed hydrocar
, (m/z=105
stic and/or
d 440°C are
rve, the pyro
corded at a
wded and d
rbon fragme
Da). The re
intense pe
e summariz
63
olysis mass
around 440°
dominated
ents such a
elative inten
eaks presen
ed in Table
3
s of PtBA at
°C, of the th
with peaks
as C6H5, (m
nsities and
nt in the pyr
e 7.
t b. 250 and
hird peak m
s that can
m/z=77 Da),
the assignm
rolysis mas
d c. 440°C.
maximum in
be associa
C7H7, (m/z
ments made
ss spectra r
the TIC
ated with
z=91 Da)
e for the
recorded
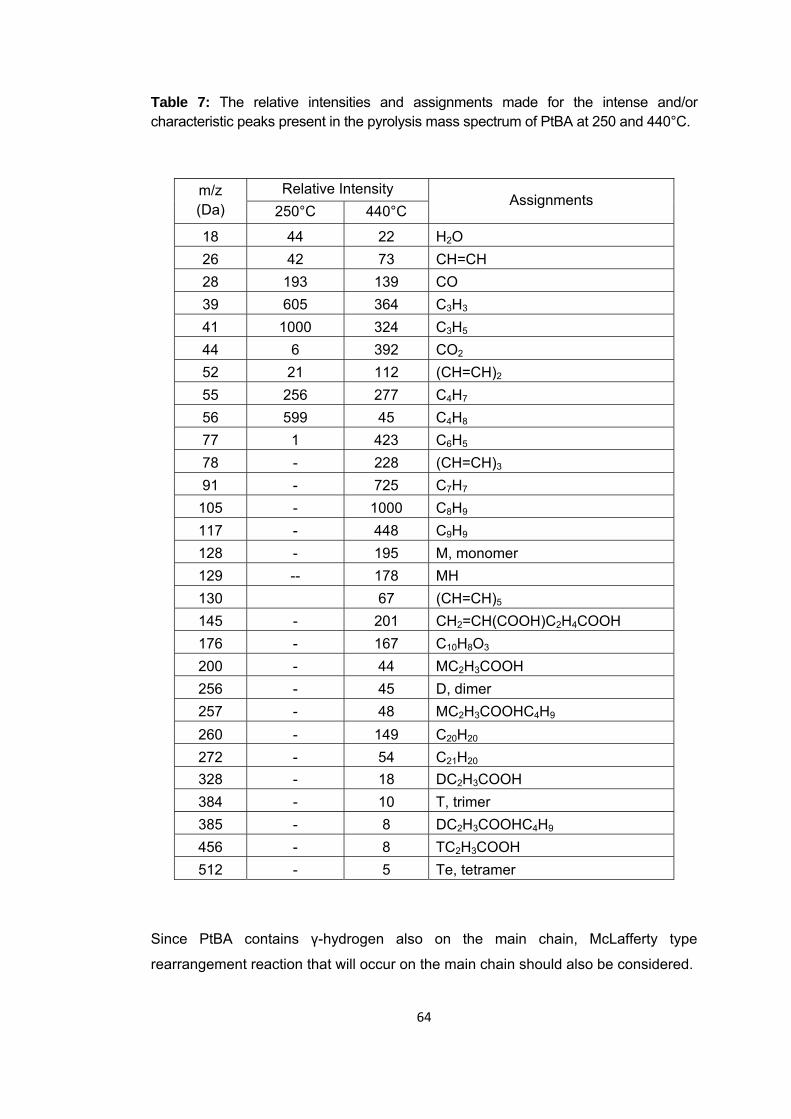
64
Table 7: The relative intensities and assignments made for the intense and/or characteristic peaks present in the pyrolysis mass spectrum of PtBA at 250 and 440°C.
m/z (Da)
Relative Intensity Assignments
250°C 440°C
18 44 22 H2O 26 42 73 CH=CH 28 193 139 CO 39 605 364 C3H3 41 1000 324 C3H5 44 6 392 CO2 52 21 112 (CH=CH)2 55 256 277 C4H7 56 599 45 C4H8 77 1 423 C6H5 78 - 228 (CH=CH)3 91 - 725 C7H7
105 - 1000 C8H9 117 - 448 C9H9 128 - 195 M, monomer 129 -- 178 MH 130 67 (CH=CH)5 145 - 201 CH2=CH(COOH)C2H4COOH 176 - 167 C10H8O3
200 - 44 MC2H3COOH 256 - 45 D, dimer 257 - 48 MC2H3COOHC4H9 260 - 149 C20H20 272 - 54 C21H20 328 - 18 DC2H3COOH 384 - 10 T, trimer 385 - 8 DC2H3COOHC4H9 456 - 8 TC2H3COOH 512 - 5 Te, tetramer
Since PtBA contains γ-hydrogen also on the main chain, McLafferty type
rearrangement reaction that will occur on the main chain should also be considered.
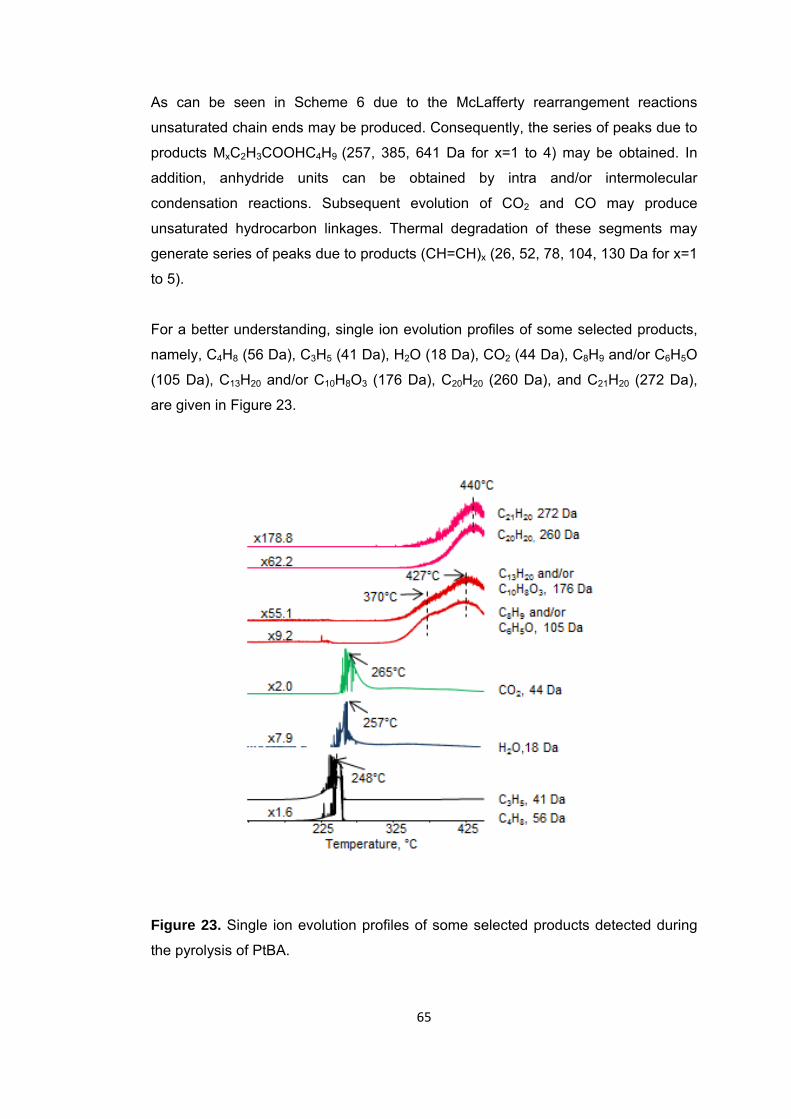
65
As can be seen in Scheme 6 due to the McLafferty rearrangement reactions
unsaturated chain ends may be produced. Consequently, the series of peaks due to
products MxC2H3COOHC4H9 (257, 385, 641 Da for x=1 to 4) may be obtained. In
addition, anhydride units can be obtained by intra and/or intermolecular
condensation reactions. Subsequent evolution of CO2 and CO may produce
unsaturated hydrocarbon linkages. Thermal degradation of these segments may
generate series of peaks due to products (CH=CH)x (26, 52, 78, 104, 130 Da for x=1
to 5).
For a better understanding, single ion evolution profiles of some selected products,
namely, C4H8 (56 Da), C3H5 (41 Da), H2O (18 Da), CO2 (44 Da), C8H9 and/or C6H5O
(105 Da), C13H20 and/or C10H8O3 (176 Da), C20H20 (260 Da), and C21H20 (272 Da),
are given in Figure 23.
Figure 23. Single ion evolution profiles of some selected products detected during
the pyrolysis of PtBA.
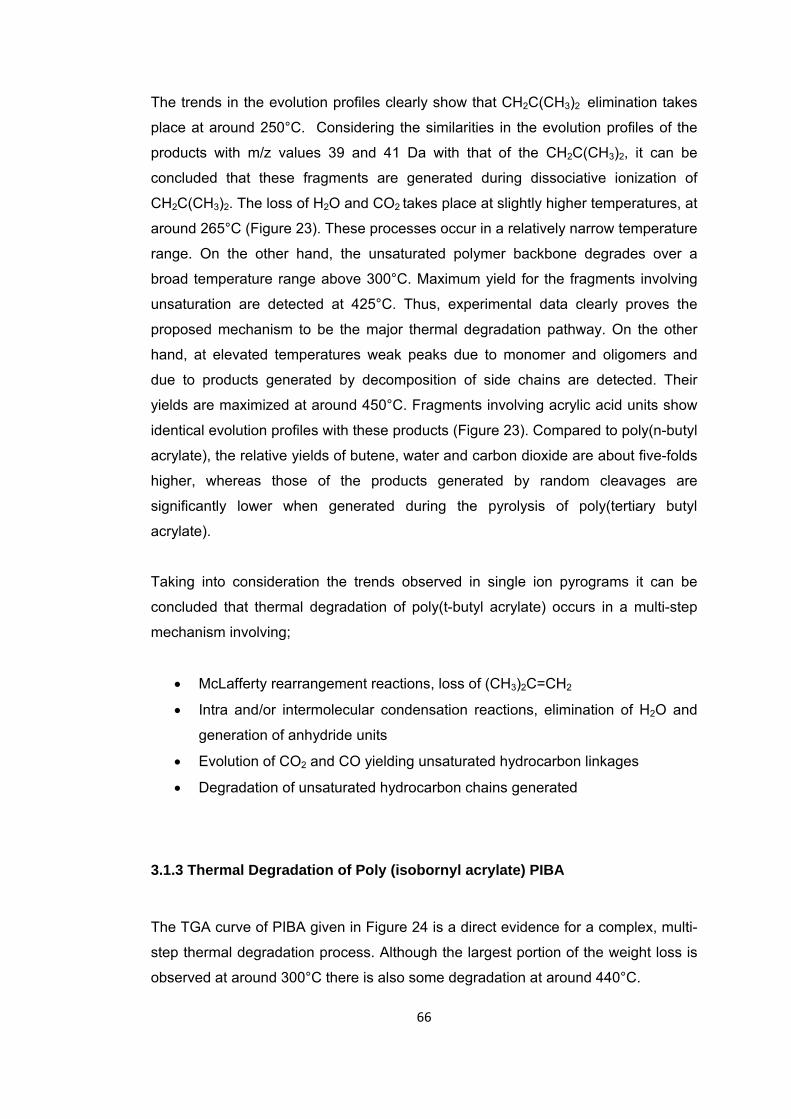
66
The trends in the evolution profiles clearly show that CH2C(CH3)2 elimination takes
place at around 250°C. Considering the similarities in the evolution profiles of the
products with m/z values 39 and 41 Da with that of the CH2C(CH3)2, it can be
concluded that these fragments are generated during dissociative ionization of
CH2C(CH3)2. The loss of H2O and CO2 takes place at slightly higher temperatures, at
around 265°C (Figure 23). These processes occur in a relatively narrow temperature
range. On the other hand, the unsaturated polymer backbone degrades over a
broad temperature range above 300°C. Maximum yield for the fragments involving
unsaturation are detected at 425°C. Thus, experimental data clearly proves the
proposed mechanism to be the major thermal degradation pathway. On the other
hand, at elevated temperatures weak peaks due to monomer and oligomers and
due to products generated by decomposition of side chains are detected. Their
yields are maximized at around 450°C. Fragments involving acrylic acid units show
identical evolution profiles with these products (Figure 23). Compared to poly(n-butyl
acrylate), the relative yields of butene, water and carbon dioxide are about five-folds
higher, whereas those of the products generated by random cleavages are
significantly lower when generated during the pyrolysis of poly(tertiary butyl
acrylate).
Taking into consideration the trends observed in single ion pyrograms it can be
concluded that thermal degradation of poly(t-butyl acrylate) occurs in a multi-step
mechanism involving;
• McLafferty rearrangement reactions, loss of (CH3)2C=CH2
• Intra and/or intermolecular condensation reactions, elimination of H2O and
generation of anhydride units
• Evolution of CO2 and CO yielding unsaturated hydrocarbon linkages
• Degradation of unsaturated hydrocarbon chains generated
3.1.3 Thermal Degradation of Poly (isobornyl acrylate) PIBA
The TGA curve of PIBA given in Figure 24 is a direct evidence for a complex, multi-
step thermal degradation process. Although the largest portion of the weight loss is
observed at around 300°C there is also some degradation at around 440°C.
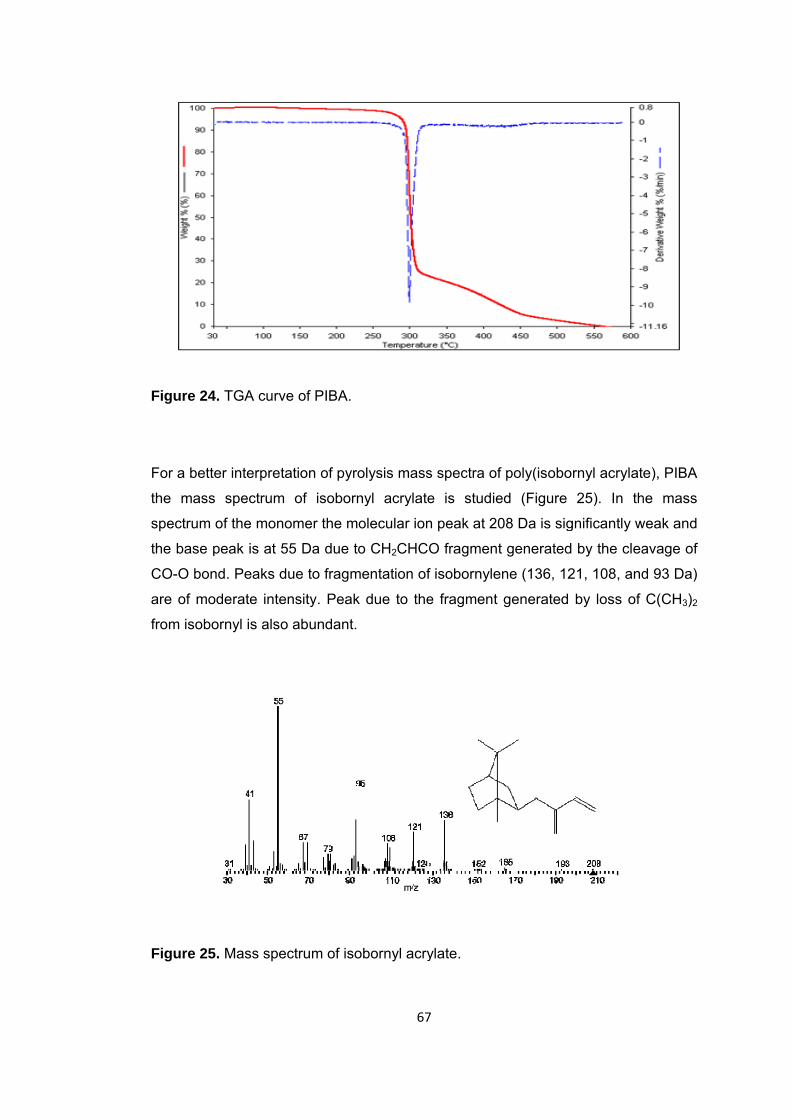
Figure 24
For a bette
the mass
spectrum
the base p
CO-O bon
are of mo
from isobo
Figure 25
4. TGA curv
er interpreta
s spectrum
of the mono
peak is at 5
nd. Peaks d
oderate inte
ornyl is also
5. Mass spe
e of PIBA.
ation of pyr
of isoborn
omer the m
55 Da due t
due to fragm
ensity. Peak
o abundant.
ectrum of iso
67
olysis mass
nyl acrylate
olecular ion
to CH2CHC
mentation of
k due to the
obornyl acry
7
s spectra of
e is studie
n peak at 20
O fragment
f isobornyle
e fragment
ylate.
f poly(isobo
ed (Figure
08 Da is sig
t generated
ne (136, 12
generated
rnyl acrylate
25). In th
gnificantly w
by the clea
21, 108, and
by loss of
e), PIBA
he mass
weak and
avage of
d 93 Da)
C(CH3)2
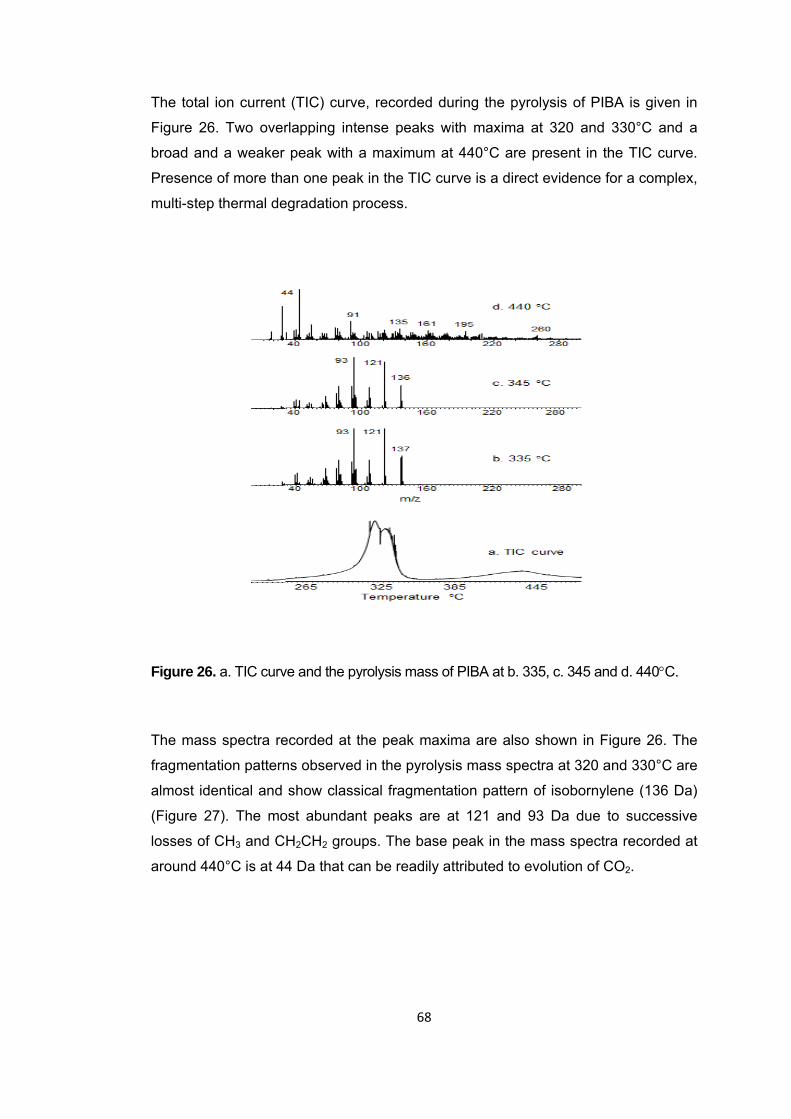
The total
Figure 26
broad and
Presence
multi-step
Figure 26.
The mass
fragmenta
almost ide
(Figure 27
losses of
around 44
ion current
. Two over
d a weaker
of more tha
thermal de
. a. TIC curv
s spectra re
ation pattern
entical and
7). The mo
CH3 and C
40°C is at 44
(TIC) curv
rlapping int
peak with
an one peak
egradation p
ve and the py
ecorded at t
ns observed
show class
ost abundan
H2CH2 grou
4 Da that ca
68
e, recorded
ense peaks
a maximum
k in the TIC
process.
yrolysis mas
the peak m
d in the pyro
sical fragme
nt peaks ar
ups. The ba
an be readi
8
d during the
s with max
m at 440°C
C curve is a
ss of PIBA at
maxima are
olysis mass
entation pat
re at 121 a
ase peak in
ly attributed
e pyrolysis
xima at 320
are presen
direct evide
t b. 335, c. 3
also shown
s spectra at
ttern of isob
and 93 Da
the mass s
d to evolutio
of PIBA is
0 and 330°C
nt in the TIC
ence for a c
345 and d. 4
n in Figure
320 and 33
bornylene (
due to suc
spectra rec
on of CO2.
given in
C and a
C curve.
complex,
40°C.
26. The
30°C are
(136 Da)
ccessive
orded at
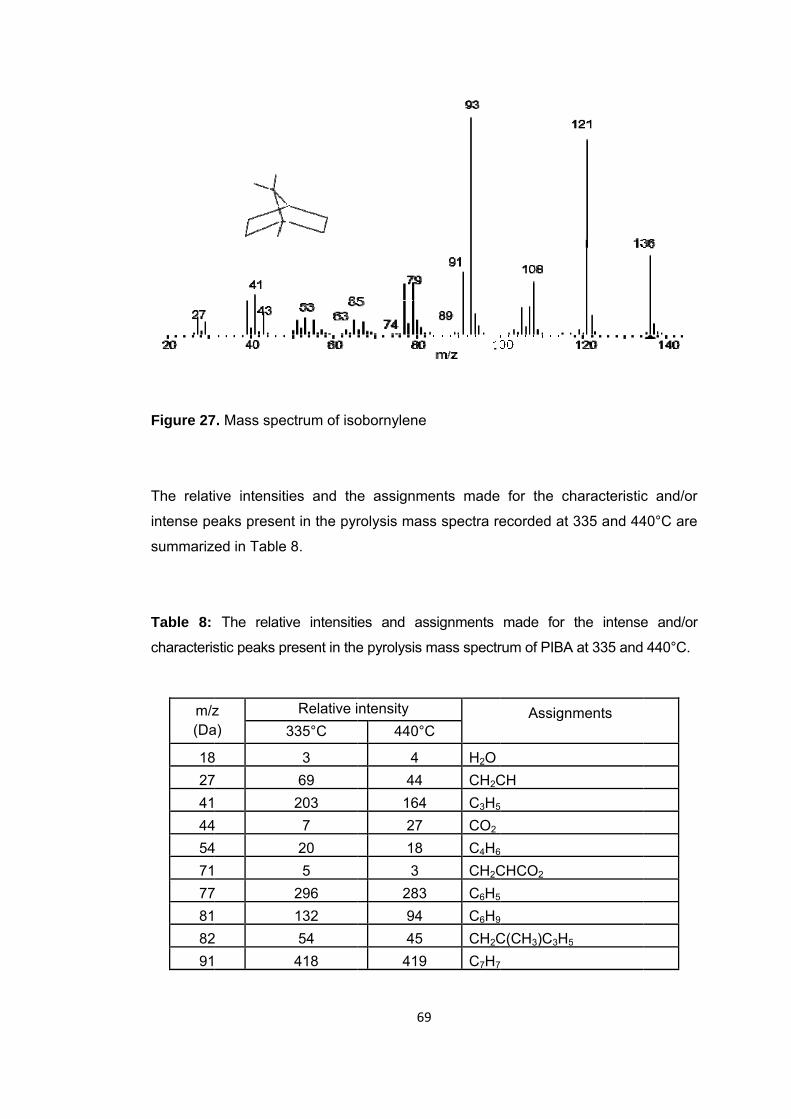
Figure 27
The relati
intense pe
summariz
Table 8: characteris
m/z(Da
18274144547177818291
7. Mass spe
ive intensit
eaks presen
ed in Table
The relativ
stic peaks p
z a)
8 7
4 4
7
2
ectrum of iso
ies and th
nt in the pyr
e 8.
ve intensiti
present in the
Relative i335°C
3 69
203 7
20 5
296 132 54
418
69
obornylene
e assignme
rolysis mas
es and as
e pyrolysis m
ntensity 440°C
444
16427183
2839445
419
9
ents made
s spectra re
ssignments
mass spectr
C
H2OCH2CC3H5
CO2
C4H6
CH2CC6H5
C6H9
CH2CC7H7
for the ch
ecorded at
made for
rum of PIBA
Assign
CH
CHCO2
C(CH3)C3H5
haracteristic
335 and 44
the intense
A at 335 and
ments
5
c and/or
40°C are
e and/or
440°C.
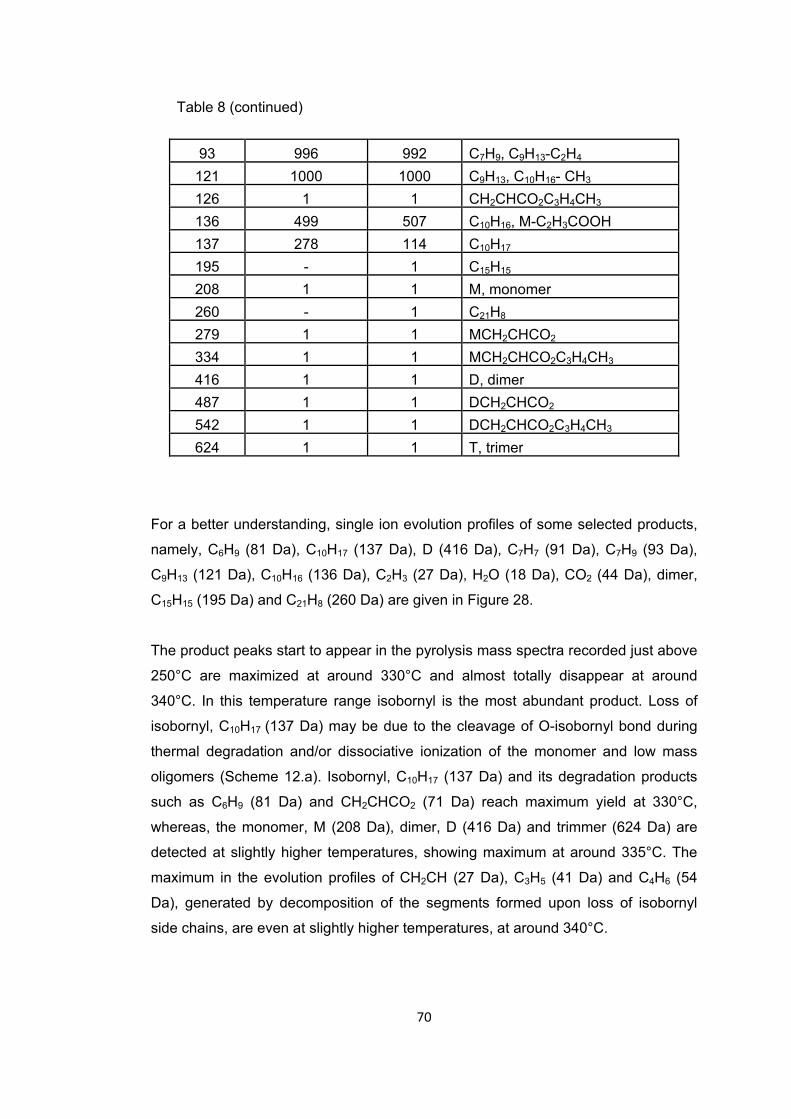
70
Table 8 (continued)
93 996 992 C7H9, C9H13-C2H4 121 1000 1000 C9H13, C10H16- CH3 126 1 1 CH2CHCO2C3H4CH3 136 499 507 C10H16, M-C2H3COOH 137 278 114 C10H17
195 - 1 C15H15
208 1 1 M, monomer260 - 1 C21H8
279 1 1 MCH2CHCO2
334 1 1 MCH2CHCO2C3H4CH3 416 1 1 D, dimer487 1 1 DCH2CHCO2
542 1 1 DCH2CHCO2C3H4CH3 624 1 1 T, trimer
For a better understanding, single ion evolution profiles of some selected products,
namely, C6H9 (81 Da), C10H17 (137 Da), D (416 Da), C7H7 (91 Da), C7H9 (93 Da),
C9H13 (121 Da), C10H16 (136 Da), C2H3 (27 Da), H2O (18 Da), CO2 (44 Da), dimer,
C15H15 (195 Da) and C21H8 (260 Da) are given in Figure 28.
The product peaks start to appear in the pyrolysis mass spectra recorded just above
250°C are maximized at around 330°C and almost totally disappear at around
340°C. In this temperature range isobornyl is the most abundant product. Loss of
isobornyl, C10H17 (137 Da) may be due to the cleavage of O-isobornyl bond during
thermal degradation and/or dissociative ionization of the monomer and low mass
oligomers (Scheme 12.a). Isobornyl, C10H17 (137 Da) and its degradation products
such as C6H9 (81 Da) and CH2CHCO2 (71 Da) reach maximum yield at 330°C,
whereas, the monomer, M (208 Da), dimer, D (416 Da) and trimmer (624 Da) are
detected at slightly higher temperatures, showing maximum at around 335°C. The
maximum in the evolution profiles of CH2CH (27 Da), C3H5 (41 Da) and C4H6 (54
Da), generated by decomposition of the segments formed upon loss of isobornyl
side chains, are even at slightly higher temperatures, at around 340°C.
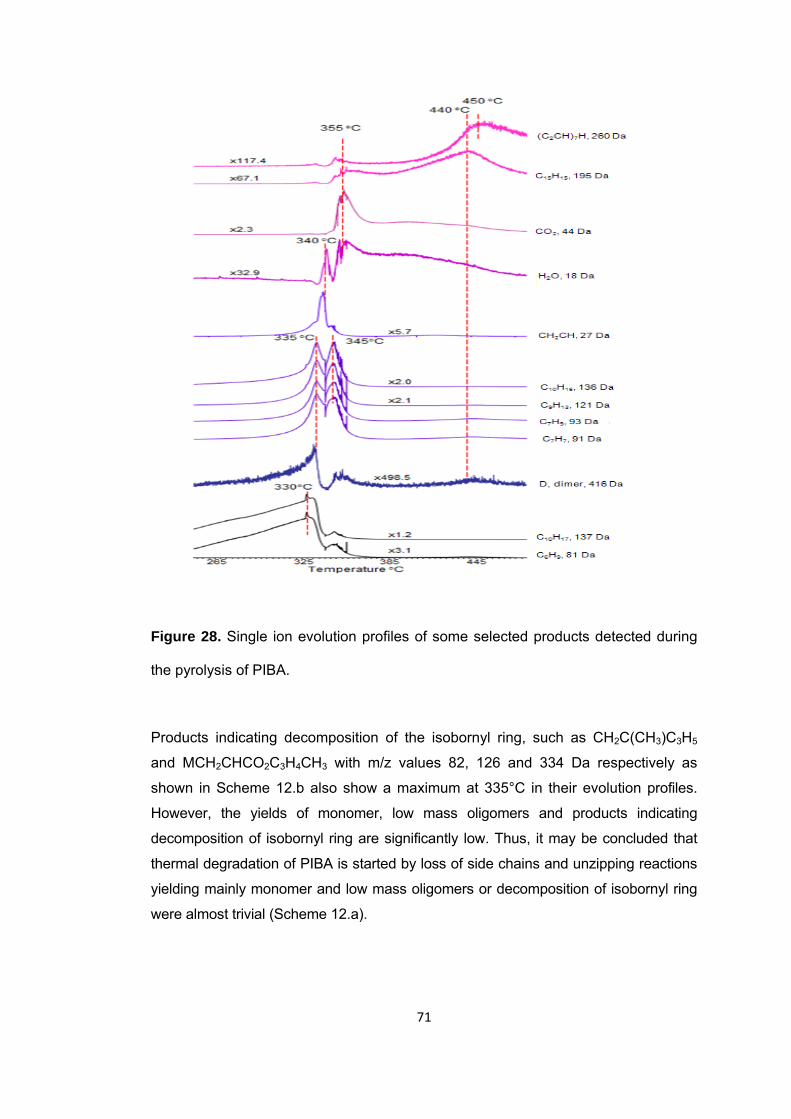
71
Figure 28. Single ion evolution profiles of some selected products detected during
the pyrolysis of PIBA.
Products indicating decomposition of the isobornyl ring, such as CH2C(CH3)C3H5
and MCH2CHCO2C3H4CH3 with m/z values 82, 126 and 334 Da respectively as
shown in Scheme 12.b also show a maximum at 335°C in their evolution profiles.
However, the yields of monomer, low mass oligomers and products indicating
decomposition of isobornyl ring are significantly low. Thus, it may be concluded that
thermal degradation of PIBA is started by loss of side chains and unzipping reactions
yielding mainly monomer and low mass oligomers or decomposition of isobornyl ring
were almost trivial (Scheme 12.a).
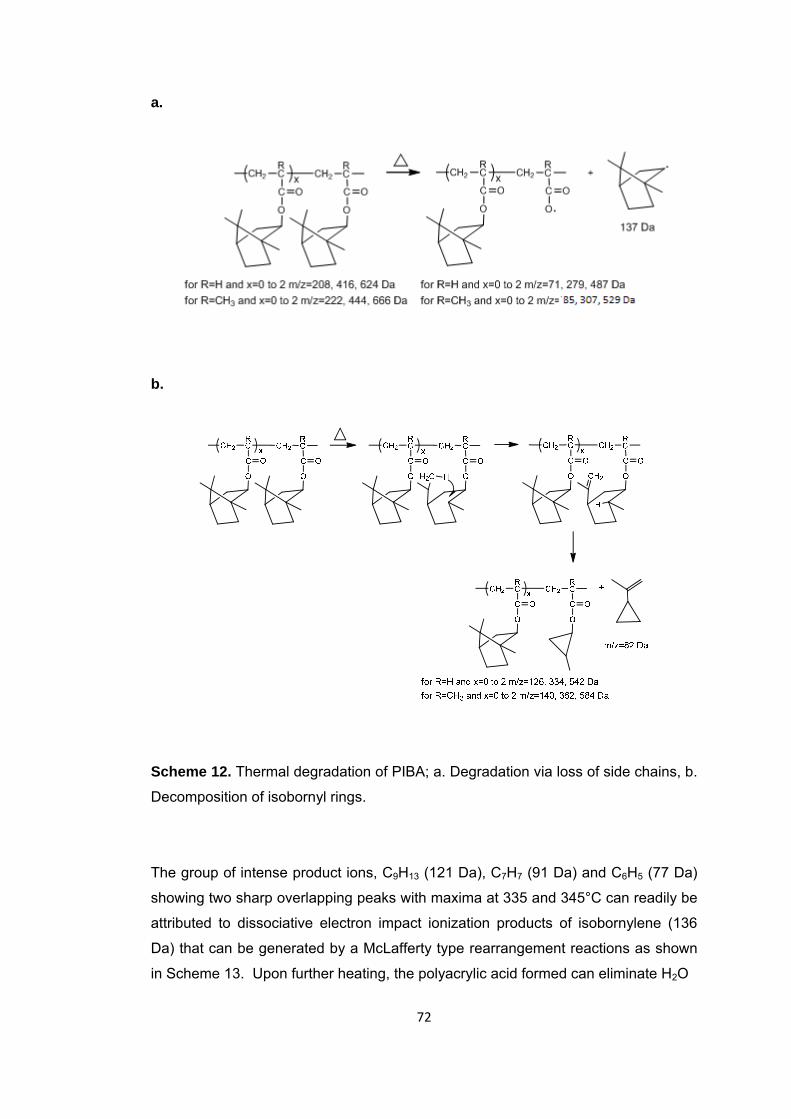
72
a.
b.
Scheme 12. Thermal degradation of PIBA; a. Degradation via loss of side chains, b.
Decomposition of isobornyl rings.
The group of intense product ions, C9H13 (121 Da), C7H7 (91 Da) and C6H5 (77 Da)
showing two sharp overlapping peaks with maxima at 335 and 345°C can readily be
attributed to dissociative electron impact ionization products of isobornylene (136
Da) that can be generated by a McLafferty type rearrangement reactions as shown
in Scheme 13. Upon further heating, the polyacrylic acid formed can eliminate H2O
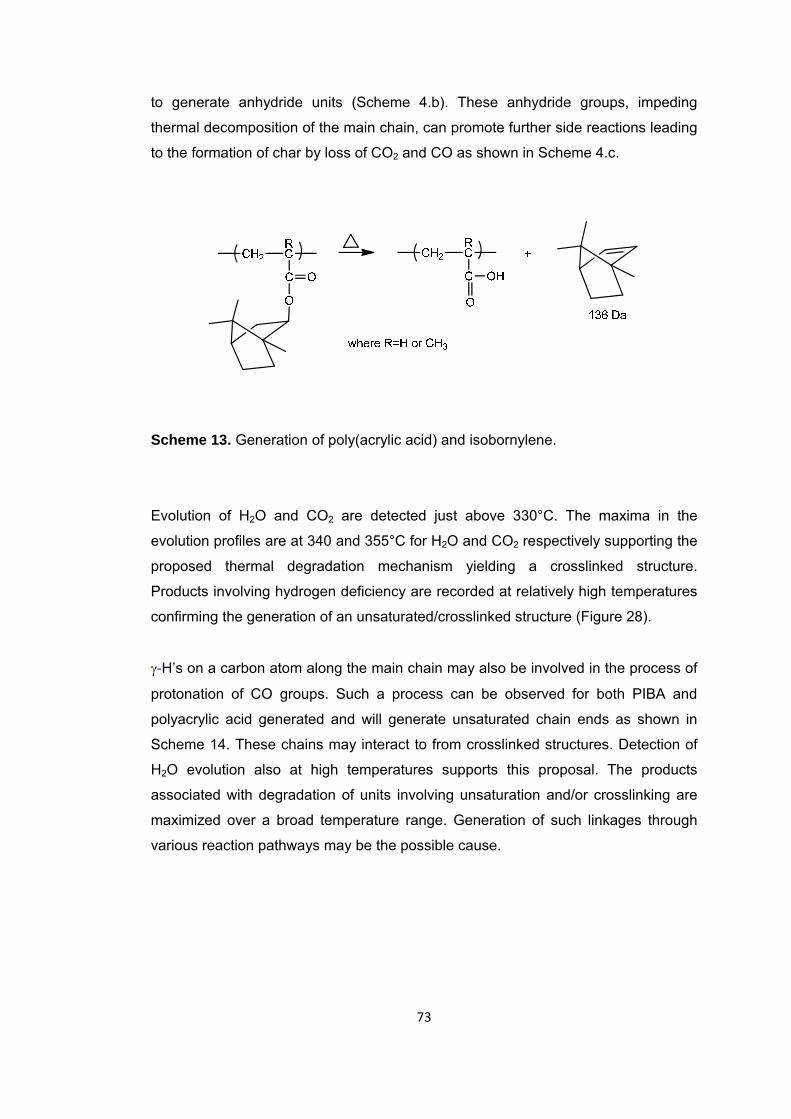
73
to generate anhydride units (Scheme 4.b). These anhydride groups, impeding
thermal decomposition of the main chain, can promote further side reactions leading
to the formation of char by loss of CO2 and CO as shown in Scheme 4.c.
Scheme 13. Generation of poly(acrylic acid) and isobornylene.
Evolution of H2O and CO2 are detected just above 330°C. The maxima in the
evolution profiles are at 340 and 355°C for H2O and CO2 respectively supporting the
proposed thermal degradation mechanism yielding a crosslinked structure.
Products involving hydrogen deficiency are recorded at relatively high temperatures
confirming the generation of an unsaturated/crosslinked structure (Figure 28).
γ-H’s on a carbon atom along the main chain may also be involved in the process of
protonation of CO groups. Such a process can be observed for both PIBA and
polyacrylic acid generated and will generate unsaturated chain ends as shown in
Scheme 14. These chains may interact to from crosslinked structures. Detection of
H2O evolution also at high temperatures supports this proposal. The products
associated with degradation of units involving unsaturation and/or crosslinking are
maximized over a broad temperature range. Generation of such linkages through
various reaction pathways may be the possible cause.
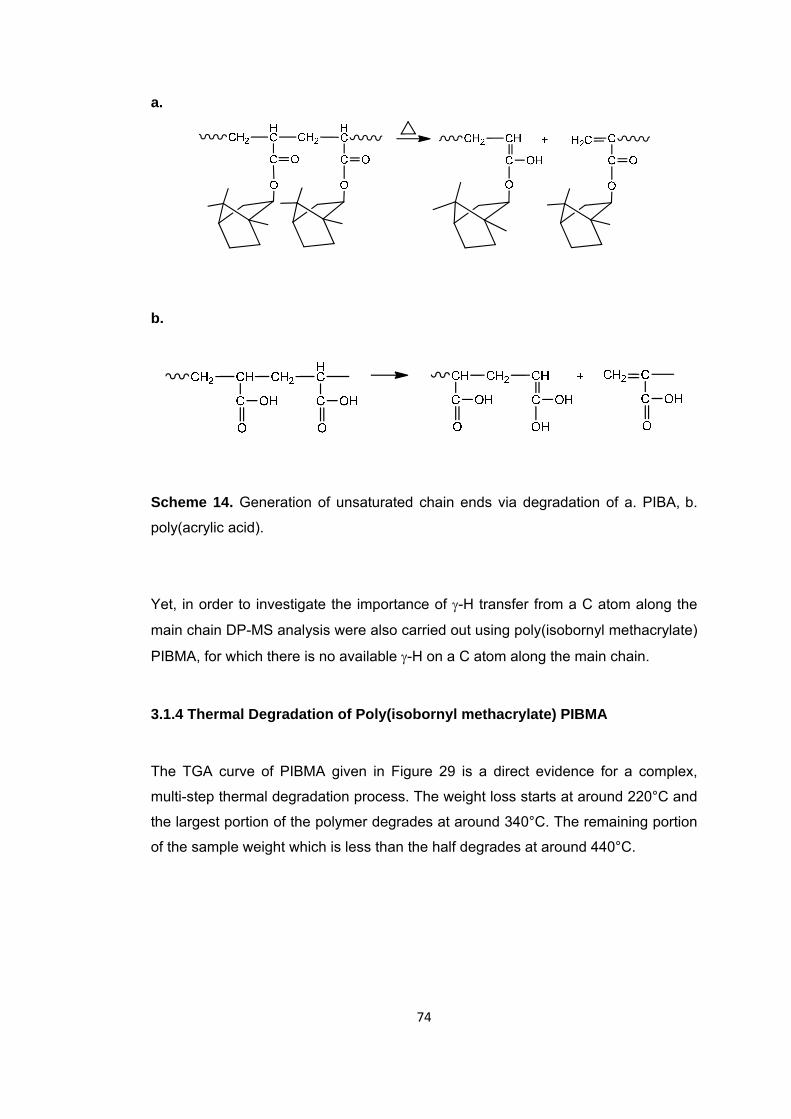
74
a.
b.
Scheme 14. Generation of unsaturated chain ends via degradation of a. PIBA, b.
poly(acrylic acid).
Yet, in order to investigate the importance of γ-H transfer from a C atom along the
main chain DP-MS analysis were also carried out using poly(isobornyl methacrylate)
PIBMA, for which there is no available γ-H on a C atom along the main chain.
3.1.4 Thermal Degradation of Poly(isobornyl methacrylate) PIBMA
The TGA curve of PIBMA given in Figure 29 is a direct evidence for a complex,
multi-step thermal degradation process. The weight loss starts at around 220°C and
the largest portion of the polymer degrades at around 340°C. The remaining portion
of the sample weight which is less than the half degrades at around 440°C.
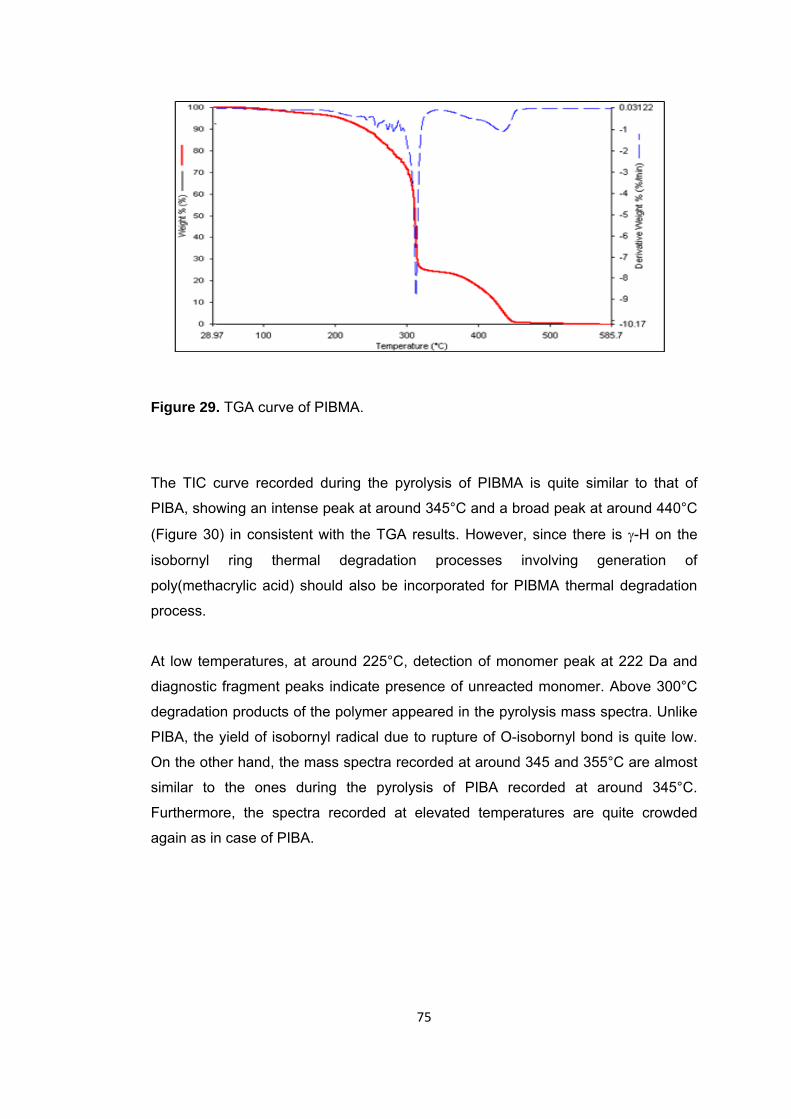
75
Figure 29. TGA curve of PIBMA.
The TIC curve recorded during the pyrolysis of PIBMA is quite similar to that of
PIBA, showing an intense peak at around 345°C and a broad peak at around 440°C
(Figure 30) in consistent with the TGA results. However, since there is γ-H on the
isobornyl ring thermal degradation processes involving generation of
poly(methacrylic acid) should also be incorporated for PIBMA thermal degradation
process.
At low temperatures, at around 225°C, detection of monomer peak at 222 Da and
diagnostic fragment peaks indicate presence of unreacted monomer. Above 300°C
degradation products of the polymer appeared in the pyrolysis mass spectra. Unlike
PIBA, the yield of isobornyl radical due to rupture of O-isobornyl bond is quite low.
On the other hand, the mass spectra recorded at around 345 and 355°C are almost
similar to the ones during the pyrolysis of PIBA recorded at around 345°C.
Furthermore, the spectra recorded at elevated temperatures are quite crowded
again as in case of PIBA.
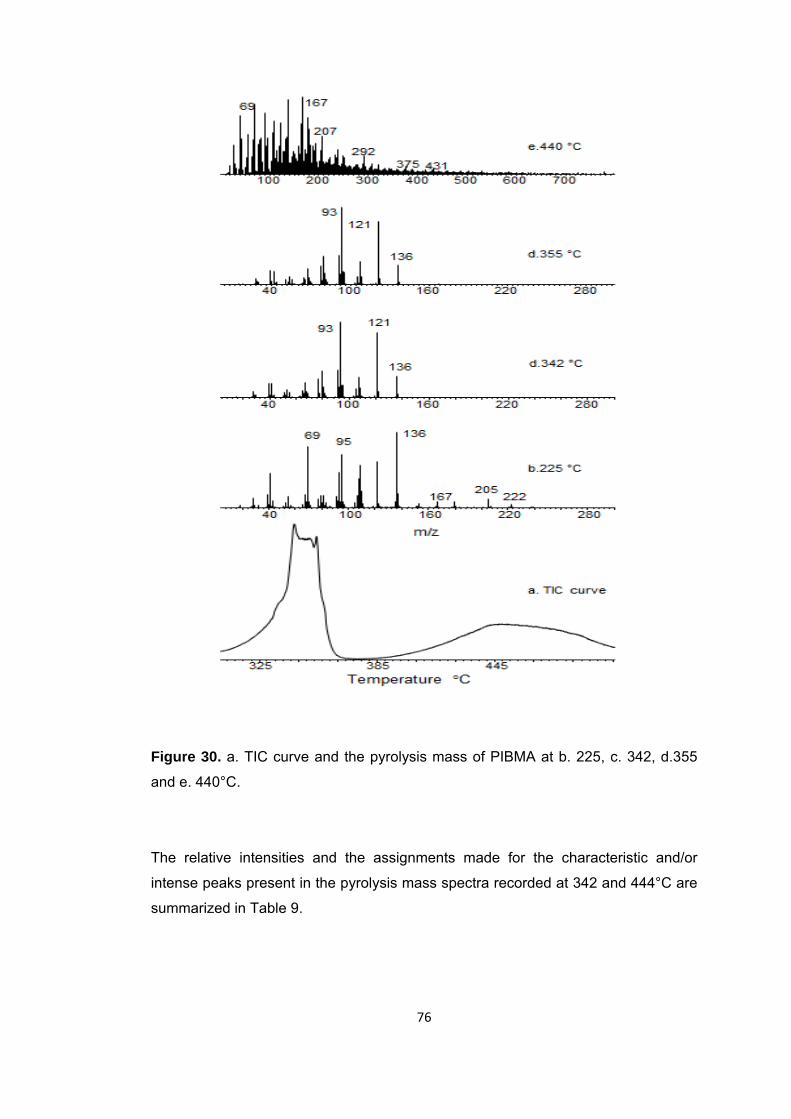
Figure 30and e. 440
The relati
intense pe
summariz
0. a. TIC cu
0°C.
ive intensit
eaks presen
ed in Table
urve and the
ies and th
nt in the pyr
e 9.
76
e pyrolysis
e assignme
rolysis mas
6
mass of P
ents made
s spectra re
IBMA at b.
for the ch
ecorded at
225, c. 34
haracteristic
342 and 44
2, d.355
c and/or
44°C are
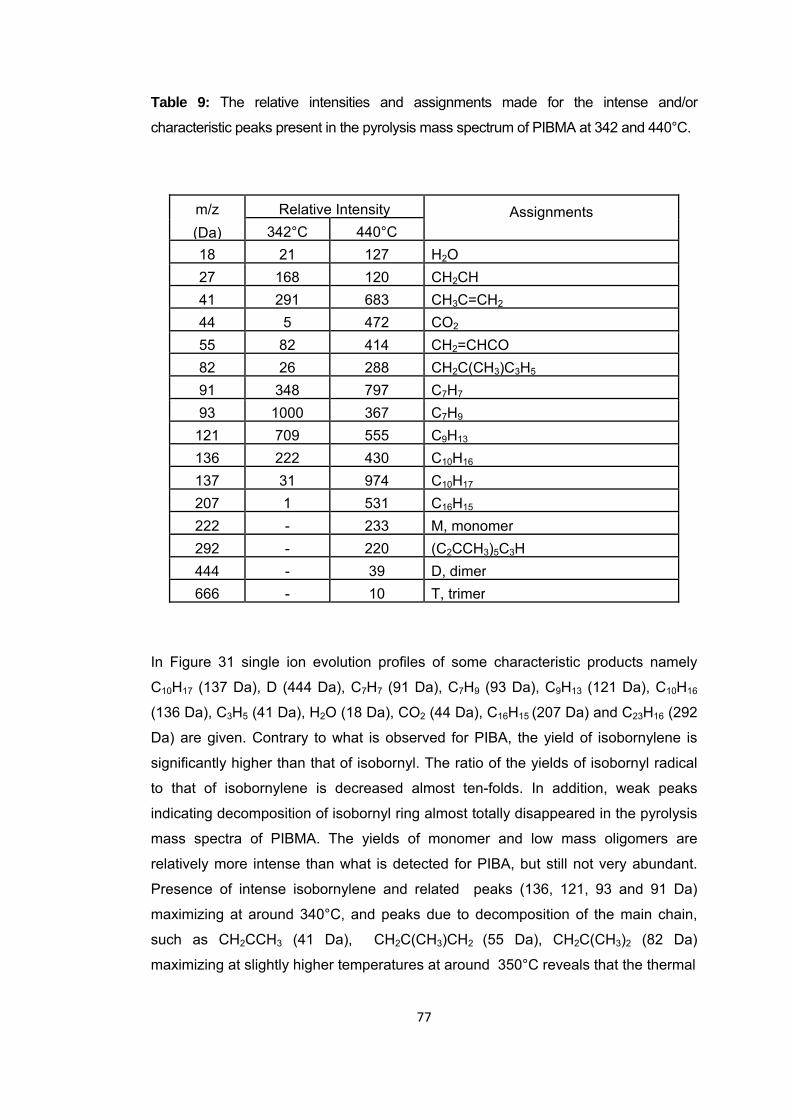
77
Table 9: The relative intensities and assignments made for the intense and/or
characteristic peaks present in the pyrolysis mass spectrum of PIBMA at 342 and 440°C.
m/z (Da)
Relative Intensity Assignments 342°C 440°C
18 21 127 H2O27 168 120 CH2CH41 291 683 CH3C=CH2
44 5 472 CO2
55 82 414 CH2=CHCO82 26 288 CH2C(CH3)C3H5
91 348 797 C7H7
93 1000 367 C7H9
121 709 555 C9H13
136 222 430 C10H16
137 31 974 C10H17
207 1 531 C16H15
222 - 233 M, monomer292 - 220 (C2CCH3)5C3H444 - 39 D, dimer666 - 10 T, trimer
In Figure 31 single ion evolution profiles of some characteristic products namely
C10H17 (137 Da), D (444 Da), C7H7 (91 Da), C7H9 (93 Da), C9H13 (121 Da), C10H16
(136 Da), C3H5 (41 Da), H2O (18 Da), CO2 (44 Da), C16H15 (207 Da) and C23H16 (292
Da) are given. Contrary to what is observed for PIBA, the yield of isobornylene is
significantly higher than that of isobornyl. The ratio of the yields of isobornyl radical
to that of isobornylene is decreased almost ten-folds. In addition, weak peaks
indicating decomposition of isobornyl ring almost totally disappeared in the pyrolysis
mass spectra of PIBMA. The yields of monomer and low mass oligomers are
relatively more intense than what is detected for PIBA, but still not very abundant.
Presence of intense isobornylene and related peaks (136, 121, 93 and 91 Da)
maximizing at around 340°C, and peaks due to decomposition of the main chain,
such as CH2CCH3 (41 Da), CH2C(CH3)CH2 (55 Da), CH2C(CH3)2 (82 Da)
maximizing at slightly higher temperatures at around 350°C reveals that the thermal
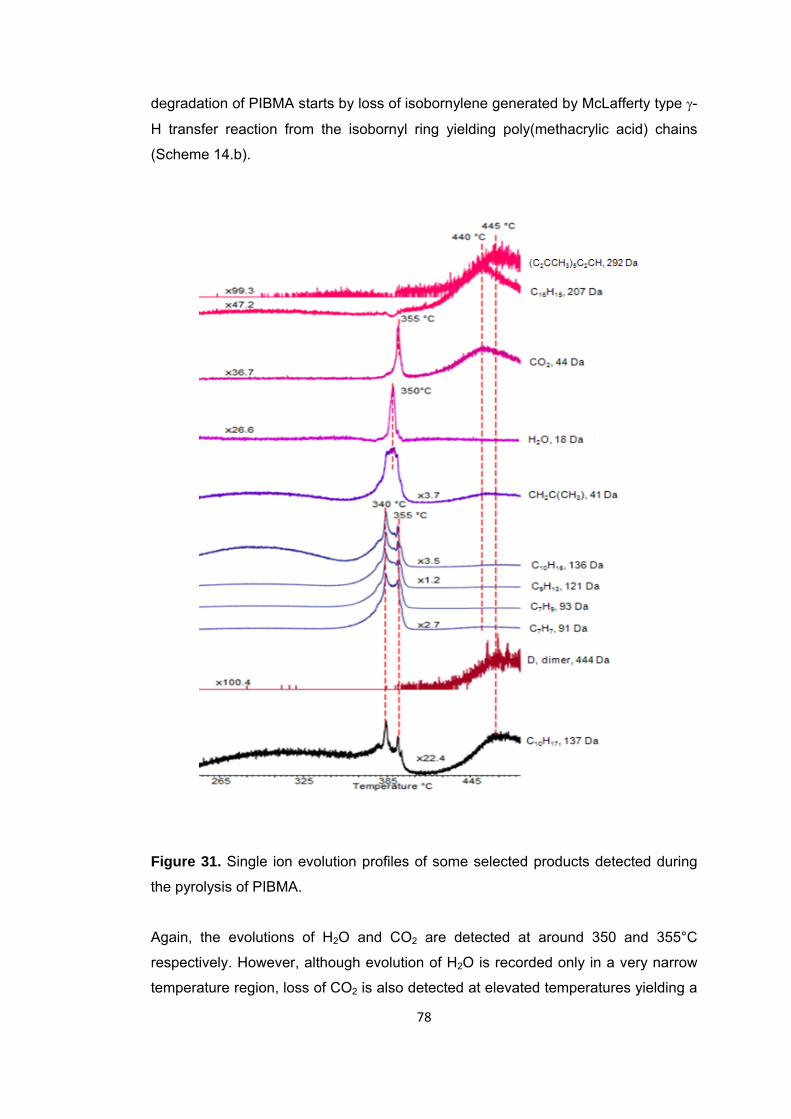
78
degradation of PIBMA starts by loss of isobornylene generated by McLafferty type γ-
H transfer reaction from the isobornyl ring yielding poly(methacrylic acid) chains
(Scheme 14.b).
Figure 31. Single ion evolution profiles of some selected products detected during
the pyrolysis of PIBMA.
Again, the evolutions of H2O and CO2 are detected at around 350 and 355°C
respectively. However, although evolution of H2O is recorded only in a very narrow
temperature region, loss of CO2 is also detected at elevated temperatures yielding a
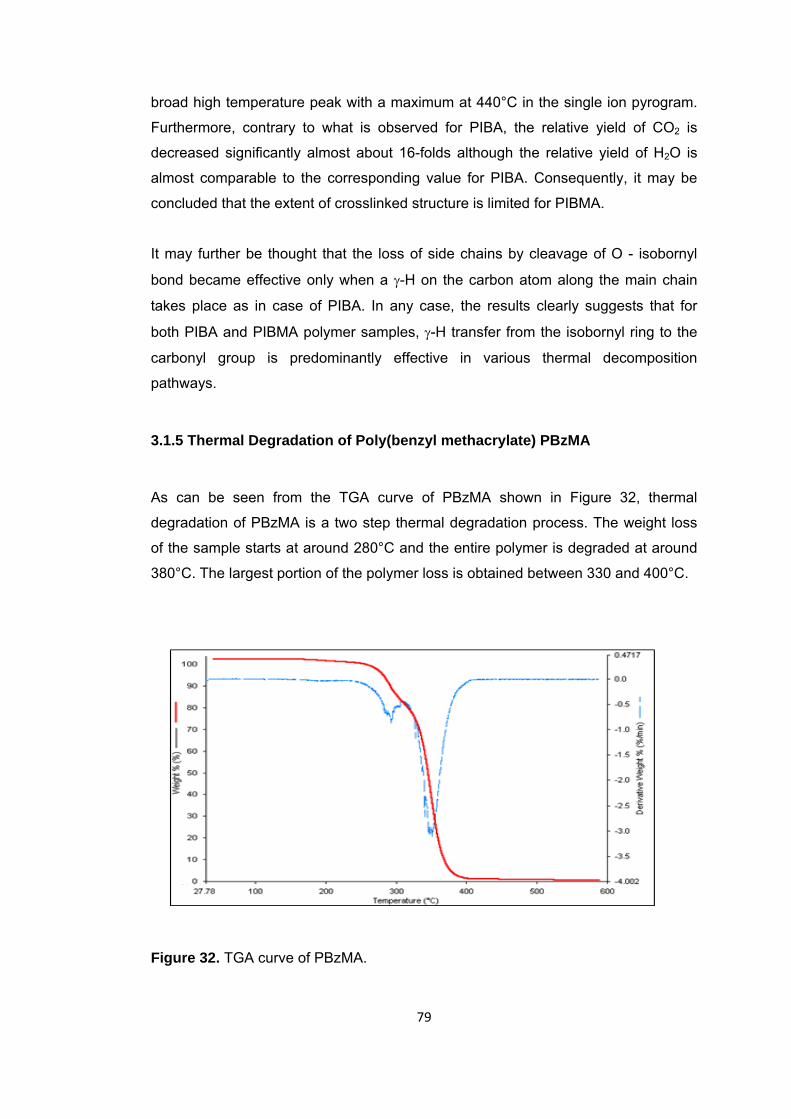
79
broad high temperature peak with a maximum at 440°C in the single ion pyrogram.
Furthermore, contrary to what is observed for PIBA, the relative yield of CO2 is
decreased significantly almost about 16-folds although the relative yield of H2O is
almost comparable to the corresponding value for PIBA. Consequently, it may be
concluded that the extent of crosslinked structure is limited for PIBMA.
It may further be thought that the loss of side chains by cleavage of O - isobornyl
bond became effective only when a γ-H on the carbon atom along the main chain
takes place as in case of PIBA. In any case, the results clearly suggests that for
both PIBA and PIBMA polymer samples, γ-H transfer from the isobornyl ring to the
carbonyl group is predominantly effective in various thermal decomposition
pathways.
3.1.5 Thermal Degradation of Poly(benzyl methacrylate) PBzMA
As can be seen from the TGA curve of PBzMA shown in Figure 32, thermal
degradation of PBzMA is a two step thermal degradation process. The weight loss
of the sample starts at around 280°C and the entire polymer is degraded at around
380°C. The largest portion of the polymer loss is obtained between 330 and 400°C.
Figure 32. TGA curve of PBzMA.
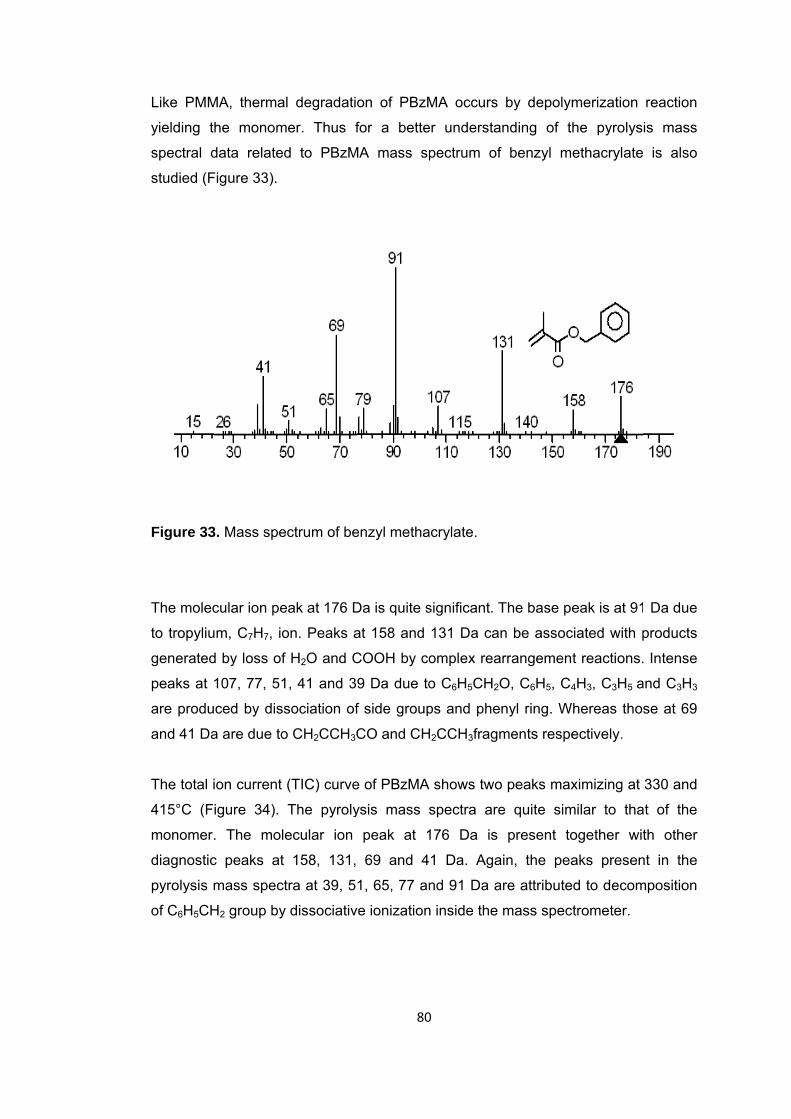
Like PMM
yielding th
spectral d
studied (F
Figure 33
The molec
to tropyliu
generated
peaks at 1
are produ
and 41 Da
The total i
415°C (F
monomer.
diagnostic
pyrolysis m
of C6H5CH
MA, therma
he monom
data related
Figure 33).
3. Mass spe
cular ion pe
m, C7H7, io
d by loss of
107, 77, 51
ced by diss
a are due to
ion current
igure 34).
. The mole
c peaks at
mass spect
H2 group by
l degradatio
mer. Thus f
d to PBzM
ectrum of be
eak at 176 D
on. Peaks a
H2O and C
, 41 and 39
sociation of
o CH2CCH3C
(TIC) curve
The pyroly
ecular ion
158, 131,
tra at 39, 5
dissociativ
80
on of PBzM
for a bette
MA mass sp
enzyl metha
Da is quite s
at 158 and
COOH by co
9 Da due to
f side group
CO and CH
e of PBzMA
ysis mass
peak at 1
69 and 4
1, 65, 77 an
e ionization
0
MA occurs
er understa
pectrum of
acrylate.
significant. T
131 Da ca
omplex rea
o C6H5CH2O
ps and phe
H2CCH3fragm
A shows two
spectra are
176 Da is
1 Da. Aga
nd 91 Da a
n inside the
by depolym
anding of t
f benzyl m
The base pe
n be assoc
arrangemen
O, C6H5, C4
nyl ring. W
ments respe
o peaks max
e quite sim
present to
ain, the pea
are attribute
mass spec
merization
he pyrolys
ethacrylate
eak is at 91
ciated with p
t reactions.
4H3, C3H5 a
Whereas thos
ectively.
ximizing at
milar to tha
ogether wit
aks presen
ed to decom
ctrometer.
reaction
is mass
is also
Da due
products
Intense
and C3H3
se at 69
330 and
at of the
th other
nt in the
mposition
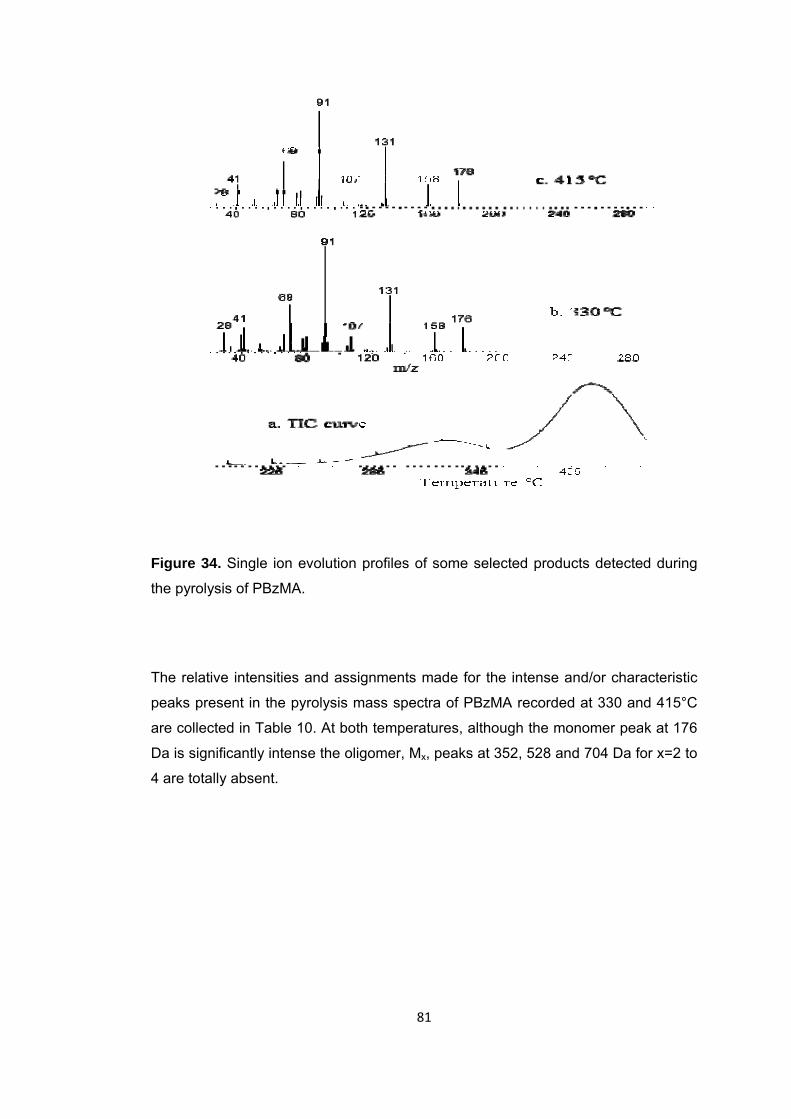
Figure 34the pyroly
The relativ
peaks pre
are collect
Da is sign
4 are total
4. Single ion
sis of PBzM
ve intensitie
esent in the
ted in Table
nificantly inte
lly absent.
n evolution
MA.
es and ass
pyrolysis m
e 10. At bot
ense the oli
81
profiles of
ignments m
mass spectr
th temperat
igomer, Mx,
1
some sele
made for the
ra of PBzM
tures, althou
peaks at 3
cted produc
e intense a
MA recorded
ugh the mo
352, 528 an
cts detecte
nd/or chara
d at 330 an
onomer pea
d 704 Da fo
d during
acteristic
d 415°C
k at 176
or x=2 to
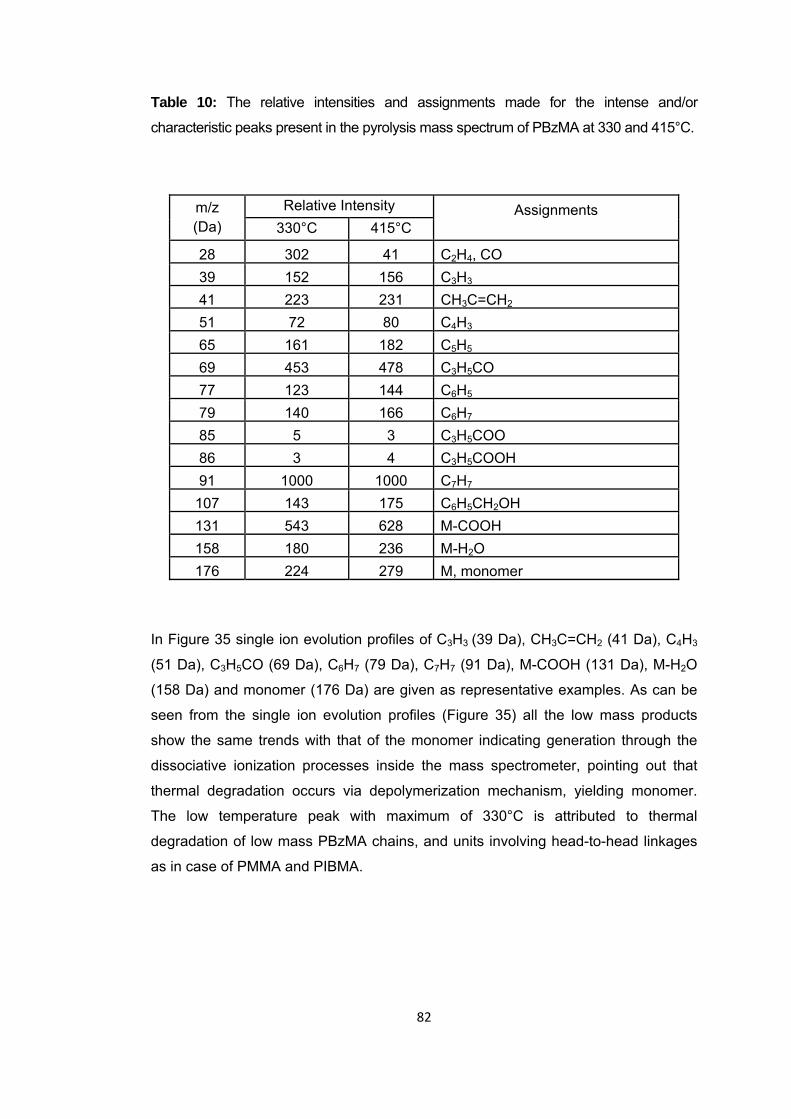
82
Table 10: The relative intensities and assignments made for the intense and/or
characteristic peaks present in the pyrolysis mass spectrum of PBzMA at 330 and 415°C.
m/z (Da)
Relative Intensity Assignments 330°C 415°C
28 302 41 C2H4, CO39 152 156 C3H3
41 223 231 CH3C=CH2
51 72 80 C4H3
65 161 182 C5H5
69 453 478 C3H5CO77 123 144 C6H5
79 140 166 C6H7
85 5 3 C3H5COO86 3 4 C3H5COOH91 1000 1000 C7H7
107 143 175 C6H5CH2OH131 543 628 M-COOH158 180 236 M-H2O176 224 279 M, monomer
In Figure 35 single ion evolution profiles of C3H3 (39 Da), CH3C=CH2 (41 Da), C4H3
(51 Da), C3H5CO (69 Da), C6H7 (79 Da), C7H7 (91 Da), M-COOH (131 Da), M-H2O
(158 Da) and monomer (176 Da) are given as representative examples. As can be
seen from the single ion evolution profiles (Figure 35) all the low mass products
show the same trends with that of the monomer indicating generation through the
dissociative ionization processes inside the mass spectrometer, pointing out that
thermal degradation occurs via depolymerization mechanism, yielding monomer.
The low temperature peak with maximum of 330°C is attributed to thermal
degradation of low mass PBzMA chains, and units involving head-to-head linkages
as in case of PMMA and PIBMA.
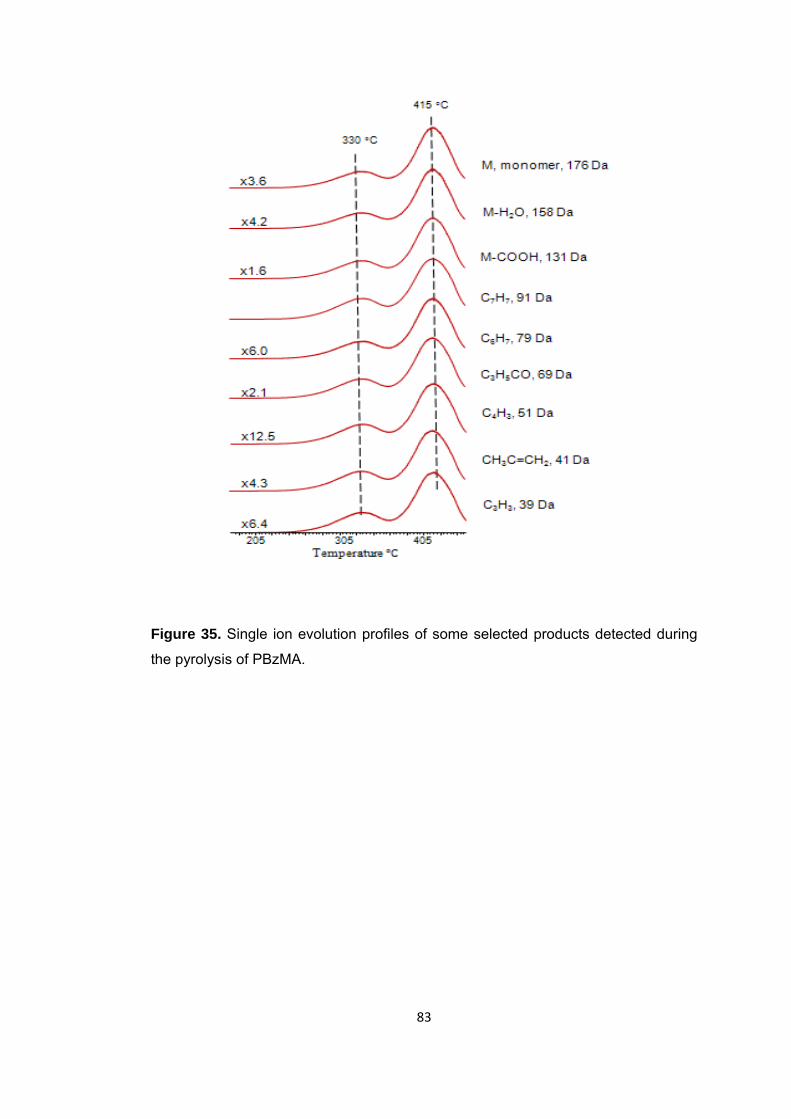
83
Figure 35. Single ion evolution profiles of some selected products detected during
the pyrolysis of PBzMA.
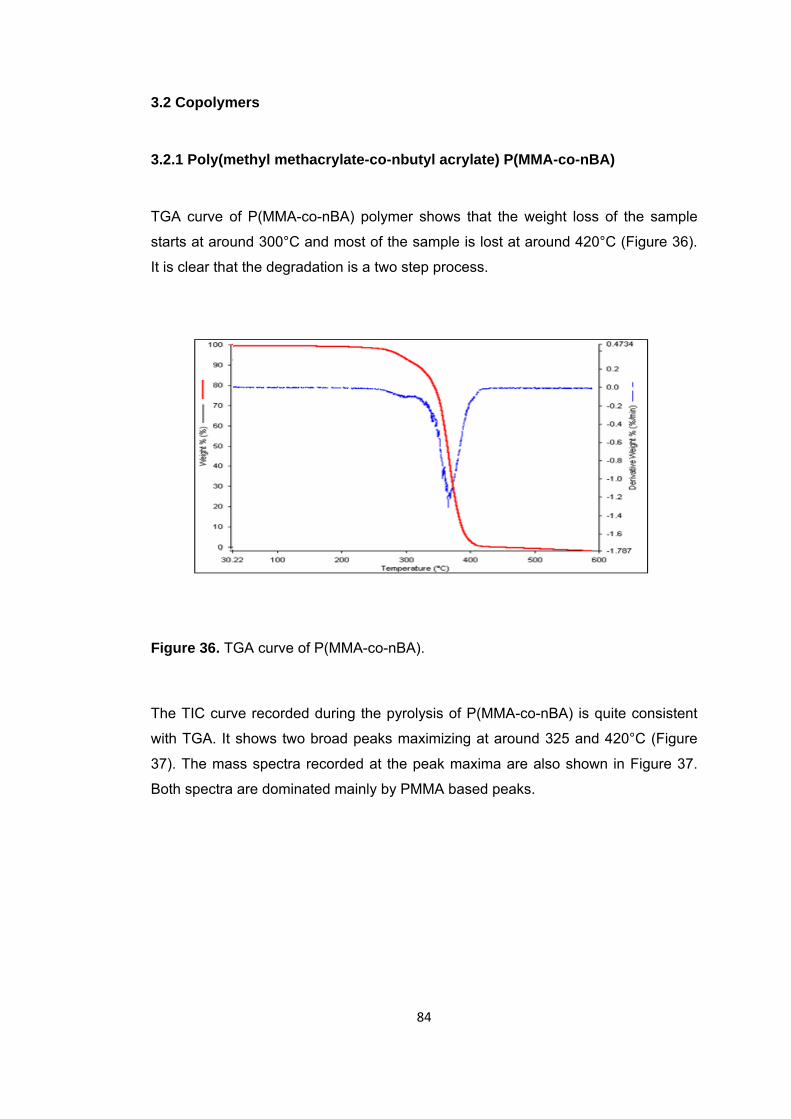
84
3.2 Copolymers
3.2.1 Poly(methyl methacrylate-co-nbutyl acrylate) P(MMA-co-nBA)
TGA curve of P(MMA-co-nBA) polymer shows that the weight loss of the sample
starts at around 300°C and most of the sample is lost at around 420°C (Figure 36).
It is clear that the degradation is a two step process.
Figure 36. TGA curve of P(MMA-co-nBA).
The TIC curve recorded during the pyrolysis of P(MMA-co-nBA) is quite consistent
with TGA. It shows two broad peaks maximizing at around 325 and 420°C (Figure
37). The mass spectra recorded at the peak maxima are also shown in Figure 37.
Both spectra are dominated mainly by PMMA based peaks.
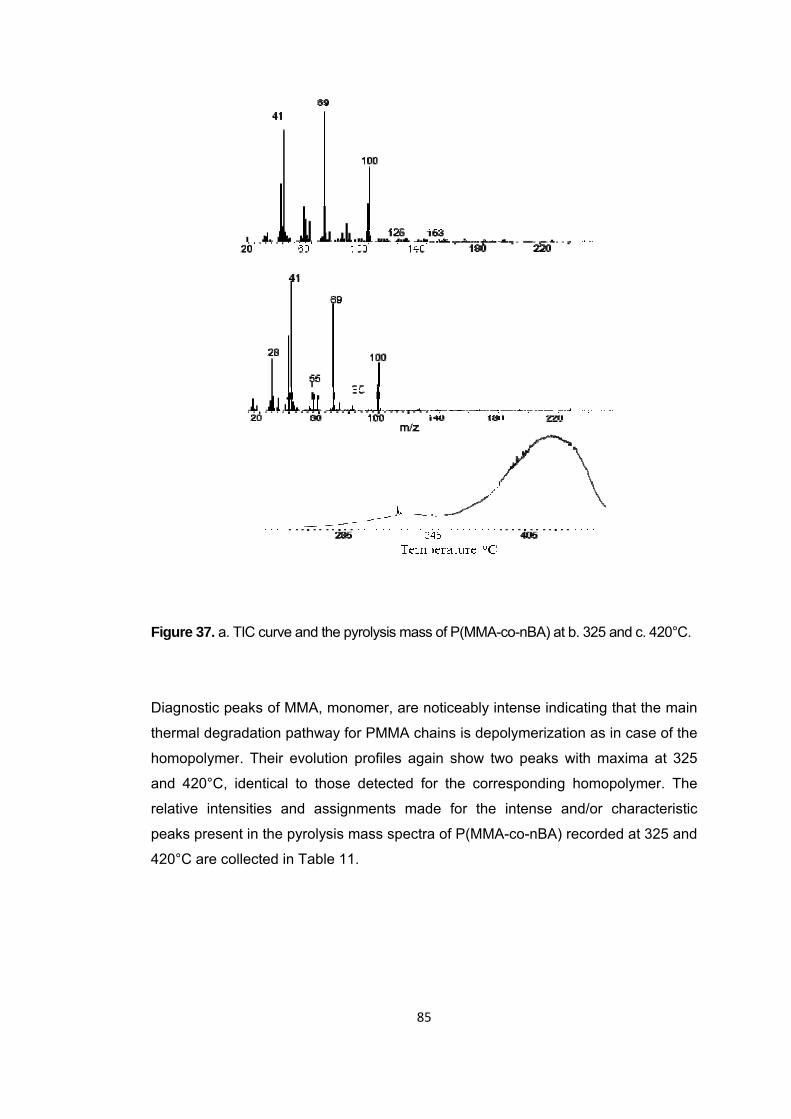
Figure 37.
Diagnostic
thermal de
homopoly
and 420°C
relative in
peaks pre
420°C are
a. TIC curve
c peaks of M
egradation
mer. Their
C, identical
ntensities a
esent in the
e collected i
e and the py
MMA, mono
pathway for
evolution p
l to those
and assignm
pyrolysis m
n Table 11.
85
yrolysis mass
omer, are n
r PMMA ch
profiles aga
detected fo
ments mad
mass spectra
.
5
s of P(MMA-
noticeably in
ains is depo
ain show tw
or the corre
de for the
a of P(MMA
-co-nBA) at b
ntense indic
olymerizatio
wo peaks w
esponding
intense an
A-co-nBA) re
b. 325 and c
cating that t
on as in cas
with maxima
homopolym
nd/or chara
ecorded at
. 420°C.
the main
se of the
a at 325
mer. The
acteristic
325 and
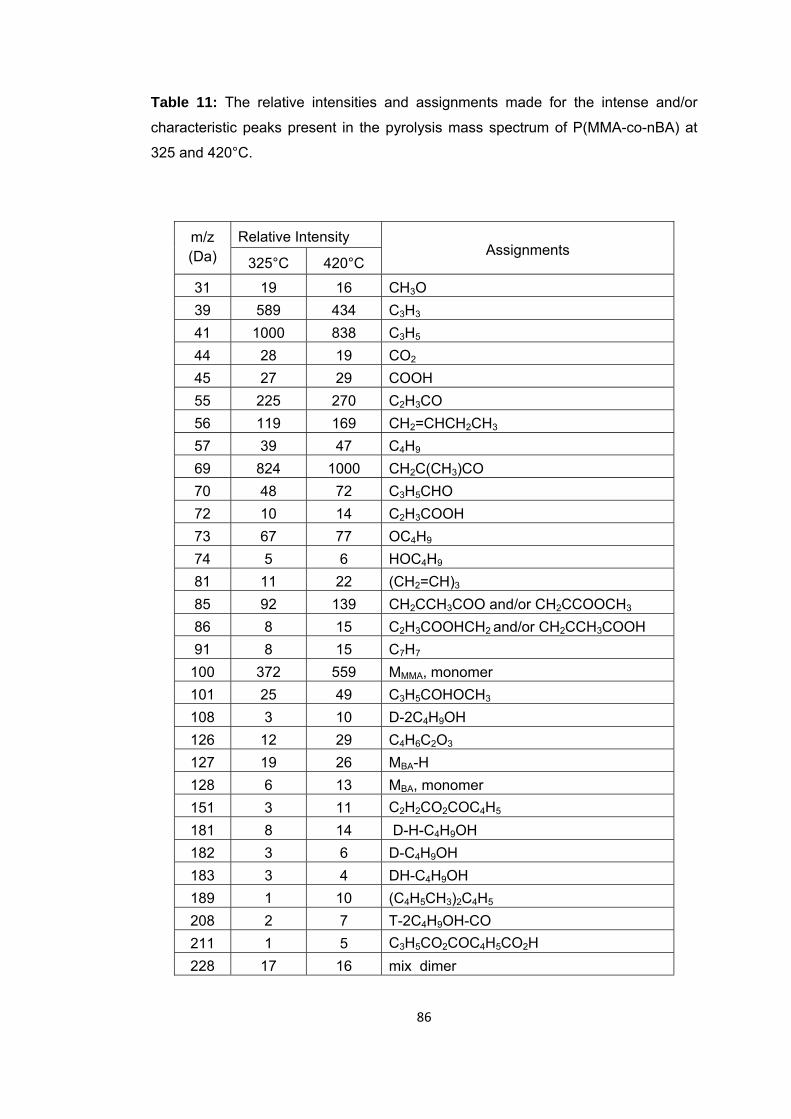
86
Table 11: The relative intensities and assignments made for the intense and/or
characteristic peaks present in the pyrolysis mass spectrum of P(MMA-co-nBA) at
325 and 420°C.
m/z (Da)
Relative Intensity Assignments
325°C 420°C
31 19 16 CH3O 39 589 434 C3H3 41 1000 838 C3H5 44 28 19 CO2 45 27 29 COOH 55 225 270 C2H3CO 56 119 169 CH2=CHCH2CH3 57 39 47 C4H9 69 824 1000 CH2C(CH3)CO 70 48 72 C3H5CHO 72 10 14 C2H3COOH 73 67 77 OC4H9 74 5 6 HOC4H9 81 11 22 (CH2=CH)3 85 92 139 CH2CCH3COO and/or CH2CCOOCH3 86 8 15 C2H3COOHCH2 and/or CH2CCH3COOH 91 8 15 C7H7
100 372 559 MMMA, monomer 101 25 49 C3H5COHOCH3 108 3 10 D-2C4H9OH 126 12 29 C4H6C2O3 127 19 26 MBA-H 128 6 13 MBA, monomer 151 3 11 C2H2CO2COC4H5
181 8 14 D-H-C4H9OH 182 3 6 D-C4H9OH 183 3 4 DH-C4H9OH 189 1 10 (C4H5CH3)2C4H5 208 2 7 T-2C4H9OH-CO 211 1 5 C3H5CO2COC4H5CO2H 228 17 16 mix dimer
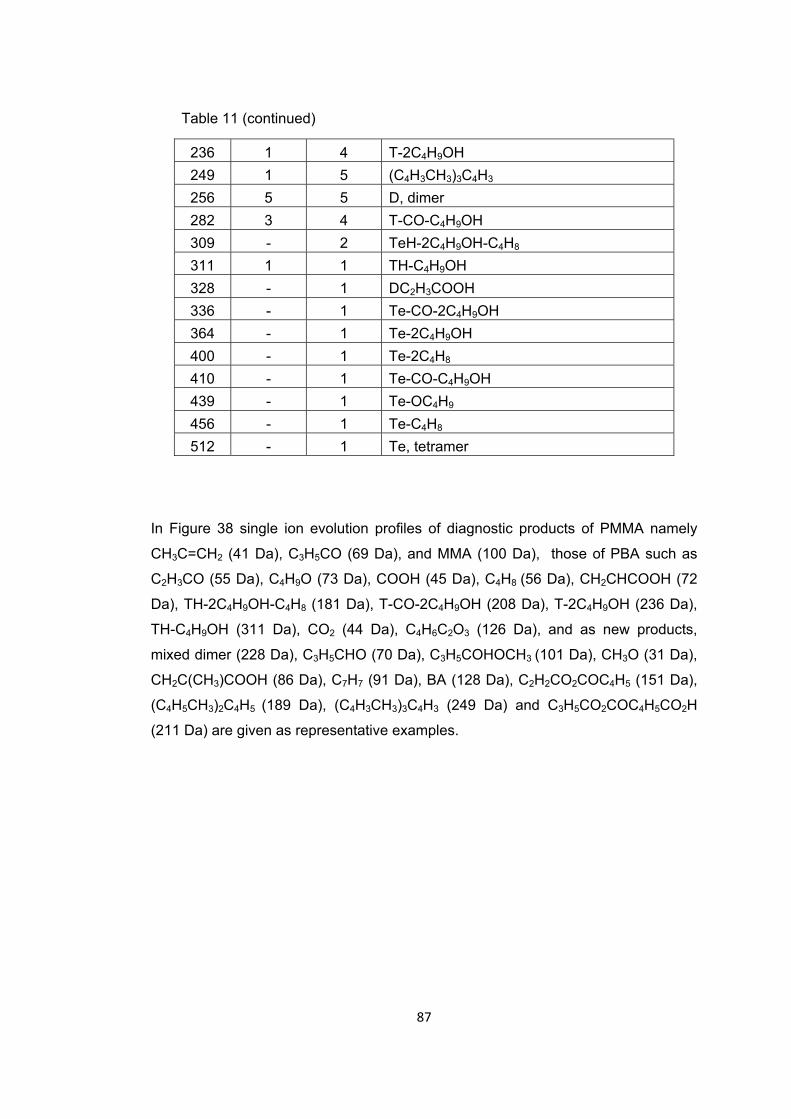
87
Table 11 (continued)
236 1 4 T-2C4H9OH 249 1 5 (C4H3CH3)3C4H3 256 5 5 D, dimer 282 3 4 T-CO-C4H9OH 309 - 2 TeH-2C4H9OH-C4H8 311 1 1 TH-C4H9OH 328 - 1 DC2H3COOH 336 - 1 Te-CO-2C4H9OH 364 - 1 Te-2C4H9OH 400 - 1 Te-2C4H8 410 - 1 Te-CO-C4H9OH 439 - 1 Te-OC4H9 456 - 1 Te-C4H8 512 - 1 Te, tetramer
In Figure 38 single ion evolution profiles of diagnostic products of PMMA namely
CH3C=CH2 (41 Da), C3H5CO (69 Da), and MMA (100 Da), those of PBA such as
C2H3CO (55 Da), C4H9O (73 Da), COOH (45 Da), C4H8 (56 Da), CH2CHCOOH (72
Da), TH-2C4H9OH-C4H8 (181 Da), T-CO-2C4H9OH (208 Da), T-2C4H9OH (236 Da),
TH-C4H9OH (311 Da), CO2 (44 Da), C4H6C2O3 (126 Da), and as new products,
mixed dimer (228 Da), C3H5CHO (70 Da), C3H5COHOCH3 (101 Da), CH3O (31 Da),
CH2C(CH3)COOH (86 Da), C7H7 (91 Da), BA (128 Da), C2H2CO2COC4H5 (151 Da),
(C4H5CH3)2C4H5 (189 Da), (C4H3CH3)3C4H3 (249 Da) and C3H5CO2COC4H5CO2H
(211 Da) are given as representative examples.
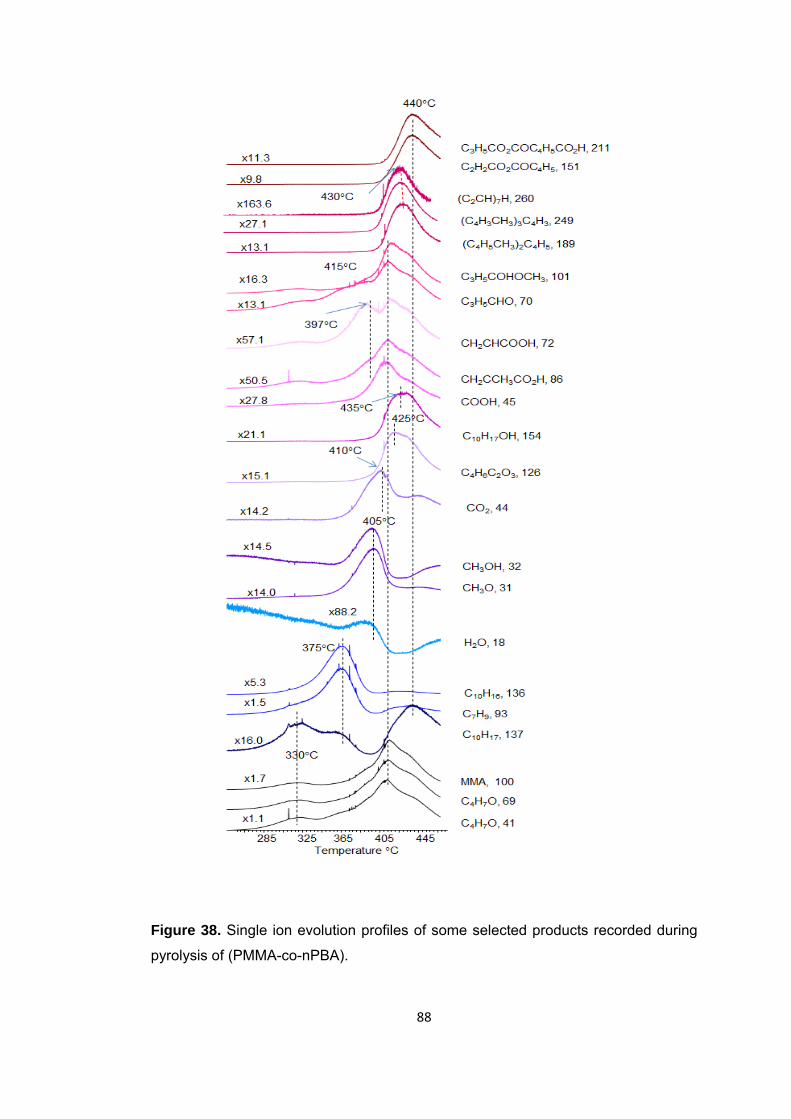
88
Figure 38. Single ion evolution profiles of some selected products recorded during
pyrolysis of (PMMA-co-nPBA).
89
As can be noted from the single ion evolution profiles, the trends observed in PMMA
based products detected during the pyrolysis of the copolymer are identical to those
recorded from the homopolymer. Two peaks with a maximum at 325 and 420°C are
present in the single ion evolution profiles of PMMA based products as in case of
the homopolymer. On the other hand, significant changes are present in the single
ion evolution profiles of PnBA based products (Figure 38).
Firstly, the yield of products characteristic to PnBA are low as expected due to the
composition of the copolymer. Furthermore, it is clear that all BA chains are
stabilized to some extent. The weak peak observed in the evolution profiles of
thermal degradation products of PnBA homopolymer at around 270°C is totally
absent in the evolution profiles of PnBA based products of the copolymer.
Presence of randomly distributed BA units along the PMMA chains randomly, should
increase the yield of BA monomer, as the PMMA degradation proceeds through
depolymerization. The molecular ion peak is absent in the mass spectrum of BA
(Figure 14.a ), however, the products obtained at 55 and 73 Da due to the
dissociative ionization of the butyl acrylate monomer show identical evolution
profiles maximizing at 415°C supporting evolution of BA during the depolymerization
process. In addition, a new peak that can be directly attributed to a mix dimer is
observed at 228 Da. The yield of this product is maximized at around 408°C. It also
shows a second but weaker peak at 325°C in its evolution profile.
Contrary to what is observed for PBA, the single ion evolution profiles of products
CH2CHCOOH (72 Da), COOH (45 Da) and C4H8 (56 Da) generated by McLafferty
type rearrangement reactions involving γ-H transfer from the butyl groups to CO
groups of PBA (Scheme 4.a) show a single peak, with a maximum at 420°C. The
evolution of high mass fragments involving acrylic acid units such as
MxCH2CHCOOH where x=2 to 5 are only detected at elevated temperatures, at
around 440°C. The decrease in the yield of CH2CHCOOH (72 Da), C4H8 (56 Da) is
about 1.7 and 5.1 folds respectively, but, the yield of COOH (45 Da) is about same.
It is clear that the decrease in the yield of products that may be associated with loss
of C4H8 and generation of acrylic acid is less than the expected considering the
composition of the copolymer. It is clear that the decrease in the yield of C4H8 is less
than the expected considering the composition of the copolymer.
90
It may be thought that the H-transfer reactions to CO groups from the butyl groups
become preferential when the H-transfer reactions from the main chain become less
likely. For the PBA homopolymer, the yield of the monomer is quite low, whereas
those of M-H (127 Da), Mx-OC4H9 or MH-HOC4H9 (183, 311, 439, 567 Da for x=2 to
5) that may be generated through reaction pathways given in Scheme 9 and the
products involving six or more carbon atoms along the main chain and generated
through the reaction pathways given in Schemes 10 and 11, such as TH-2C4H9OH-
C4H8 (181 Da) and TeH-C4H9OH-C4H8 (309 Da),T-C4H9OH-CO (282 Da), T-
2C4H9OH (236 Da), TH -2C4H9OH-CO (208 Da) are significantly intense. Contrary to
what is observed for the homopolymer, the yield of all products involving more than
one monomer unit are reduced significantly, more than ten-folds during the pyrolysis
of the copolymer. On the other hand the decrease in the yield of BA, the monomer is
only 3.6 folds. In addition only 1.3 and 5.1 folds decreases are recorded in the
relative yields of OC4H9 (73 Da) and C4H8 (56 Da) respectively. The decrease in the
yield of the segments involving more than one repeating unit may directly be
attributed to the composition of the copolymer. It may be thought that the random
copolymer involving only 12.5 % BA does not involve sufficiently long BA segments
that degrade into segments involving more than one monomer unit. As a
consequence, degradation by rearrangement reactions involving γ-H transfer from
the main chain as shown in Schemes 9 and 10 cannot be preferential. The presence
of methyl group on the main chain of the polymer backbone due to the longer methyl
methacrylate segments hinders the hydrogen transfer reactions from the main chain
to the carbonyl groups. This explains the reductions in the yields of products such as
those at 127, 181, and 309 Da fragments (Schemes 9 and 10).
High mass products such as Te (512 Da), Te-CO-C4H9OH (410 Da), Te-2C4H8 (400
Da), Te-2C4H9OH (364 Da), Te-CO-2C4H9OH (336 Da) and Te-2C4H9OH-C4H9 (309
Da), show a single peak with a maximum at around 440 °C in their evolution profiles.
Actually, their yields are lower than the expected considering the composition of the
copolymer; i.e. the decrease in the yield of tetramer of BA is more than 44-folds
compared to what is recorded for PBA. It may be thought that high mass products
are only generated at high temperatures due to the decomposition of segments
involving crosslinking.
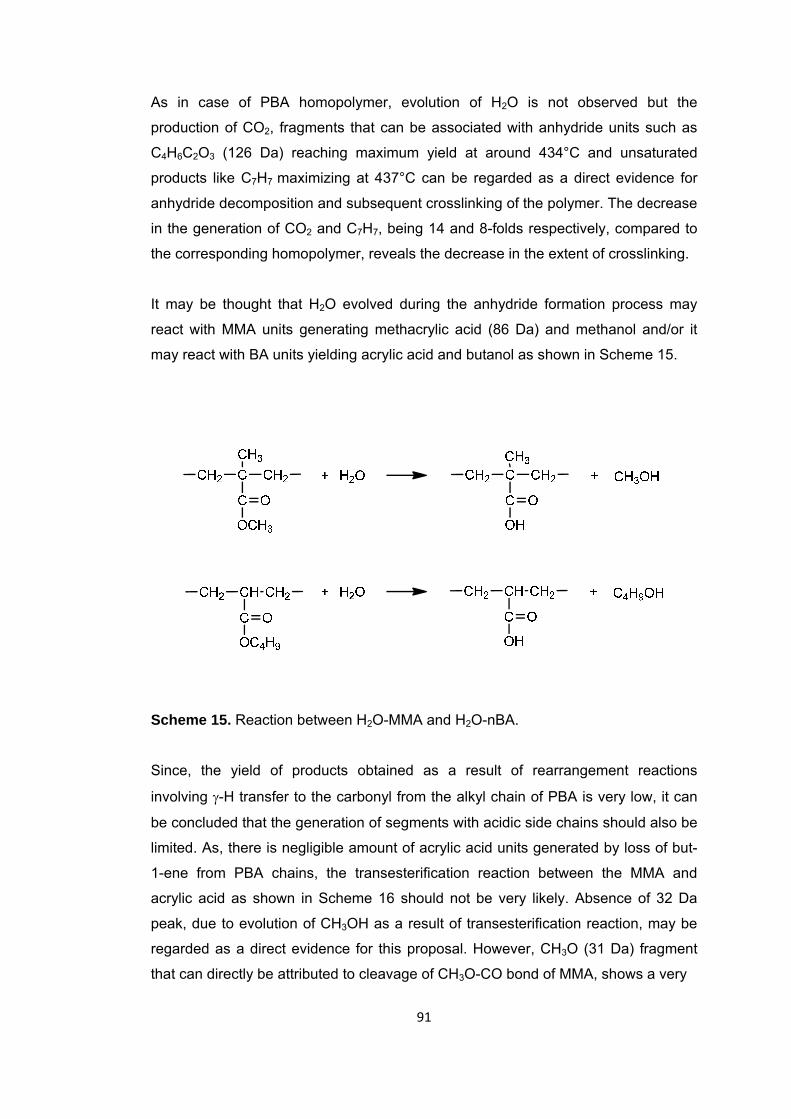
91
As in case of PBA homopolymer, evolution of H2O is not observed but the
production of CO2, fragments that can be associated with anhydride units such as
C4H6C2O3 (126 Da) reaching maximum yield at around 434°C and unsaturated
products like C7H7 maximizing at 437°C can be regarded as a direct evidence for
anhydride decomposition and subsequent crosslinking of the polymer. The decrease
in the generation of CO2 and C7H7, being 14 and 8-folds respectively, compared to
the corresponding homopolymer, reveals the decrease in the extent of crosslinking.
It may be thought that H2O evolved during the anhydride formation process may
react with MMA units generating methacrylic acid (86 Da) and methanol and/or it
may react with BA units yielding acrylic acid and butanol as shown in Scheme 15.
Scheme 15. Reaction between H2O-MMA and H2O-nBA.
Since, the yield of products obtained as a result of rearrangement reactions
involving γ-H transfer to the carbonyl from the alkyl chain of PBA is very low, it can
be concluded that the generation of segments with acidic side chains should also be
limited. As, there is negligible amount of acrylic acid units generated by loss of but-
1-ene from PBA chains, the transesterification reaction between the MMA and
acrylic acid as shown in Scheme 16 should not be very likely. Absence of 32 Da
peak, due to evolution of CH3OH as a result of transesterification reaction, may be
regarded as a direct evidence for this proposal. However, CH3O (31 Da) fragment
that can directly be attributed to cleavage of CH3O-CO bond of MMA, shows a very
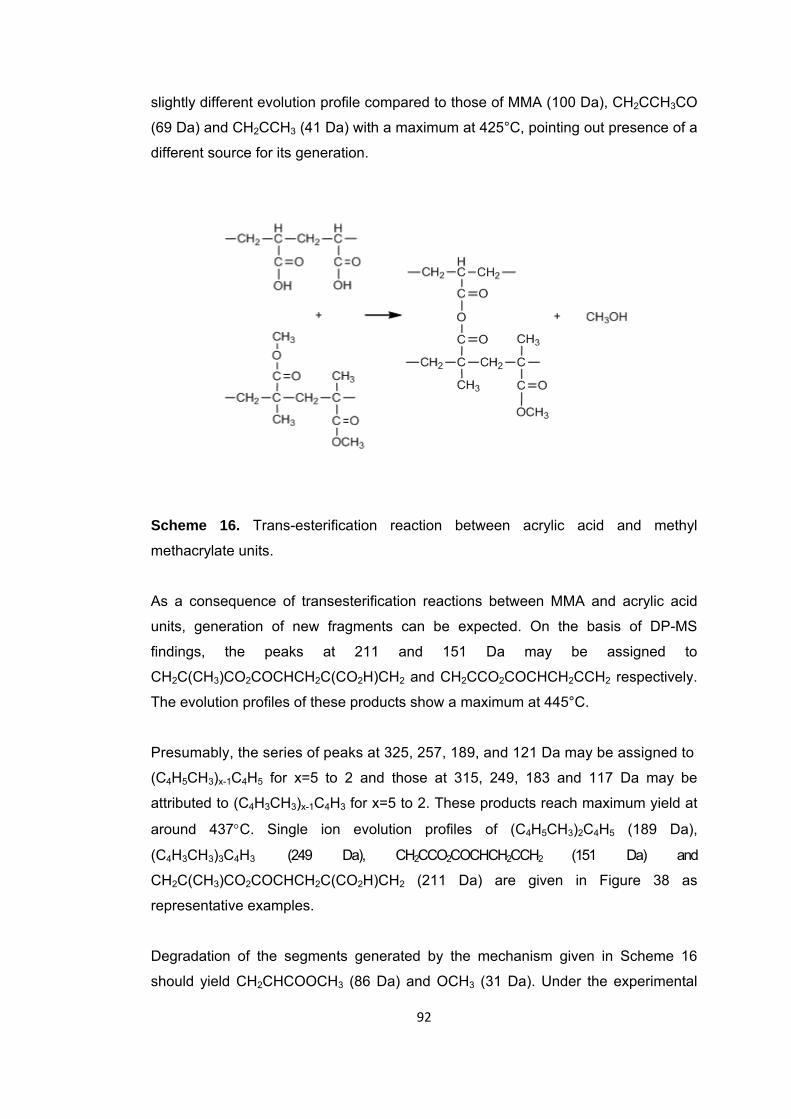
92
slightly different evolution profile compared to those of MMA (100 Da), CH2CCH3CO
(69 Da) and CH2CCH3 (41 Da) with a maximum at 425°C, pointing out presence of a
different source for its generation.
Scheme 16. Trans-esterification reaction between acrylic acid and methyl
methacrylate units.
As a consequence of transesterification reactions between MMA and acrylic acid
units, generation of new fragments can be expected. On the basis of DP-MS
findings, the peaks at 211 and 151 Da may be assigned to
CH2C(CH3)CO2COCHCH2C(CO2H)CH2 and CH2CCO2COCHCH2CCH2 respectively.
The evolution profiles of these products show a maximum at 445°C.
Presumably, the series of peaks at 325, 257, 189, and 121 Da may be assigned to
(C4H5CH3)x-1C4H5 for x=5 to 2 and those at 315, 249, 183 and 117 Da may be
attributed to (C4H3CH3)x-1C4H3 for x=5 to 2. These products reach maximum yield at
around 437°C. Single ion evolution profiles of (C4H5CH3)2C4H5 (189 Da),
(C4H3CH3)3C4H3 (249 Da), CH2CCO2COCHCH2CCH2 (151 Da) and
CH2C(CH3)CO2COCHCH2C(CO2H)CH2 (211 Da) are given in Figure 38 as
representative examples.
Degradation of the segments generated by the mechanism given in Scheme 16
should yield CH2CHCOOCH3 (86 Da) and OCH3 (31 Da). Under the experimental
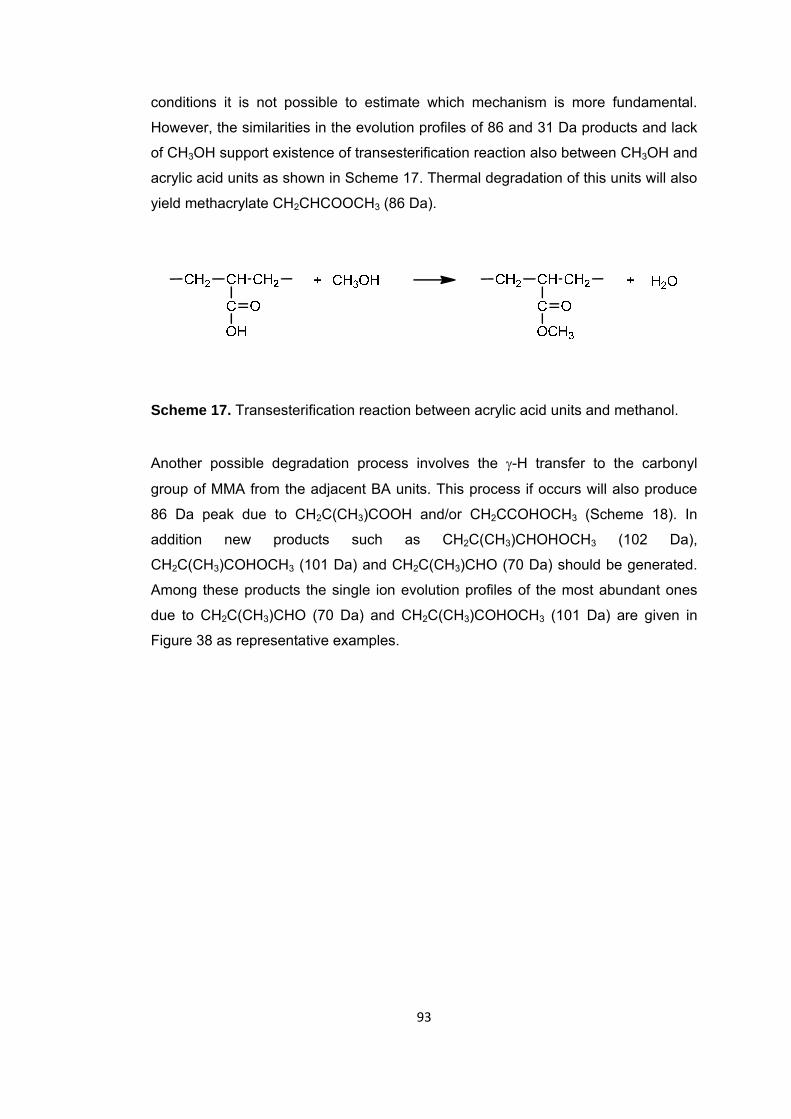
93
conditions it is not possible to estimate which mechanism is more fundamental.
However, the similarities in the evolution profiles of 86 and 31 Da products and lack
of CH3OH support existence of transesterification reaction also between CH3OH and
acrylic acid units as shown in Scheme 17. Thermal degradation of this units will also
yield methacrylate CH2CHCOOCH3 (86 Da).
Scheme 17. Transesterification reaction between acrylic acid units and methanol.
Another possible degradation process involves the γ-H transfer to the carbonyl
group of MMA from the adjacent BA units. This process if occurs will also produce
86 Da peak due to CH2C(CH3)COOH and/or CH2CCOHOCH3 (Scheme 18). In
addition new products such as CH2C(CH3)CHOHOCH3 (102 Da),
CH2C(CH3)COHOCH3 (101 Da) and CH2C(CH3)CHO (70 Da) should be generated.
Among these products the single ion evolution profiles of the most abundant ones
due to CH2C(CH3)CHO (70 Da) and CH2C(CH3)COHOCH3 (101 Da) are given in
Figure 38 as representative examples.
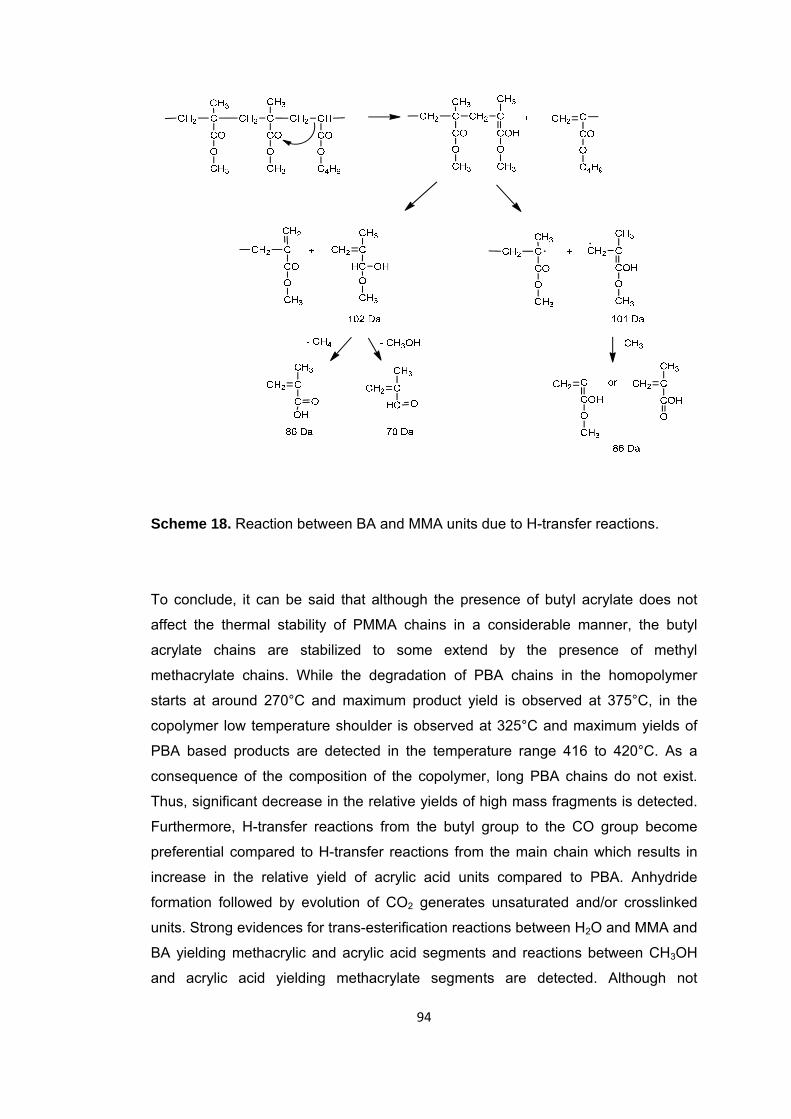
94
Scheme 18. Reaction between BA and MMA units due to H-transfer reactions.
To conclude, it can be said that although the presence of butyl acrylate does not
affect the thermal stability of PMMA chains in a considerable manner, the butyl
acrylate chains are stabilized to some extend by the presence of methyl
methacrylate chains. While the degradation of PBA chains in the homopolymer
starts at around 270°C and maximum product yield is observed at 375°C, in the
copolymer low temperature shoulder is observed at 325°C and maximum yields of
PBA based products are detected in the temperature range 416 to 420°C. As a
consequence of the composition of the copolymer, long PBA chains do not exist.
Thus, significant decrease in the relative yields of high mass fragments is detected.
Furthermore, H-transfer reactions from the butyl group to the CO group become
preferential compared to H-transfer reactions from the main chain which results in
increase in the relative yield of acrylic acid units compared to PBA. Anhydride
formation followed by evolution of CO2 generates unsaturated and/or crosslinked
units. Strong evidences for trans-esterification reactions between H2O and MMA and
BA yielding methacrylic and acrylic acid segments and reactions between CH3OH
and acrylic acid yielding methacrylate segments are detected. Although not
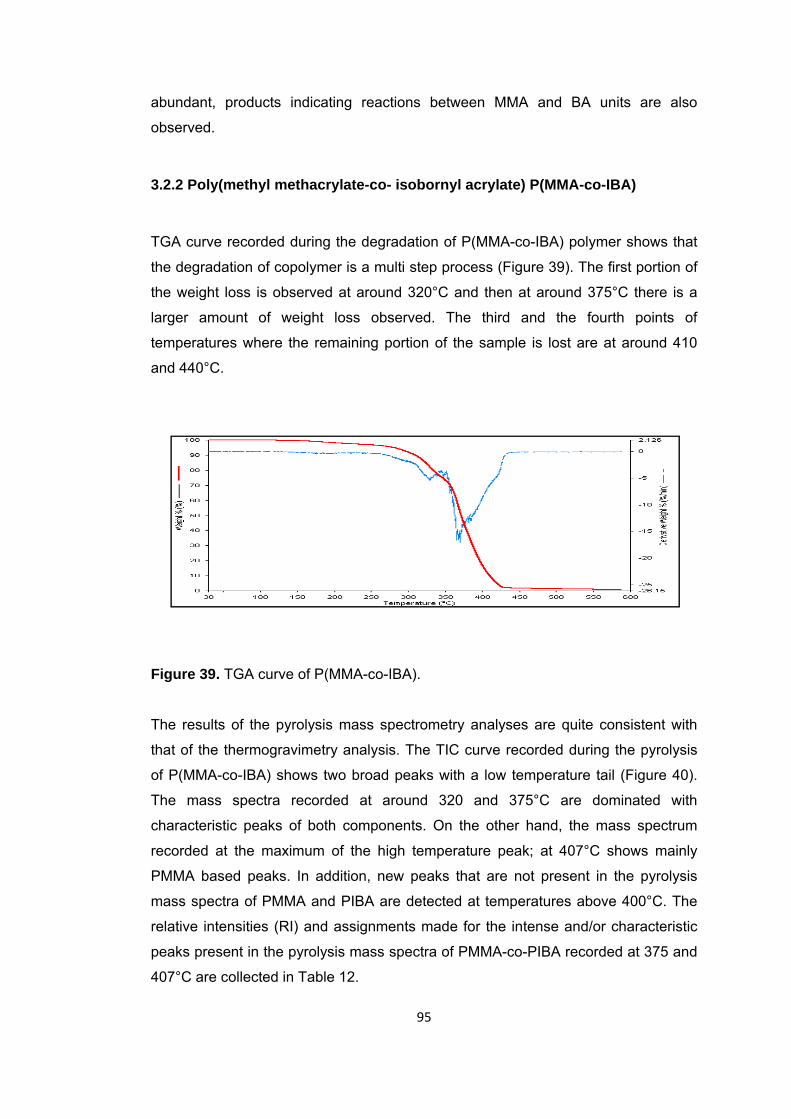
95
abundant, products indicating reactions between MMA and BA units are also
observed.
3.2.2 Poly(methyl methacrylate-co- isobornyl acrylate) P(MMA-co-IBA)
TGA curve recorded during the degradation of P(MMA-co-IBA) polymer shows that
the degradation of copolymer is a multi step process (Figure 39). The first portion of
the weight loss is observed at around 320°C and then at around 375°C there is a
larger amount of weight loss observed. The third and the fourth points of
temperatures where the remaining portion of the sample is lost are at around 410
and 440°C.
Figure 39. TGA curve of P(MMA-co-IBA).
The results of the pyrolysis mass spectrometry analyses are quite consistent with
that of the thermogravimetry analysis. The TIC curve recorded during the pyrolysis
of P(MMA-co-IBA) shows two broad peaks with a low temperature tail (Figure 40).
The mass spectra recorded at around 320 and 375°C are dominated with
characteristic peaks of both components. On the other hand, the mass spectrum
recorded at the maximum of the high temperature peak; at 407°C shows mainly
PMMA based peaks. In addition, new peaks that are not present in the pyrolysis
mass spectra of PMMA and PIBA are detected at temperatures above 400°C. The
relative intensities (RI) and assignments made for the intense and/or characteristic
peaks present in the pyrolysis mass spectra of PMMA-co-PIBA recorded at 375 and
407°C are collected in Table 12.
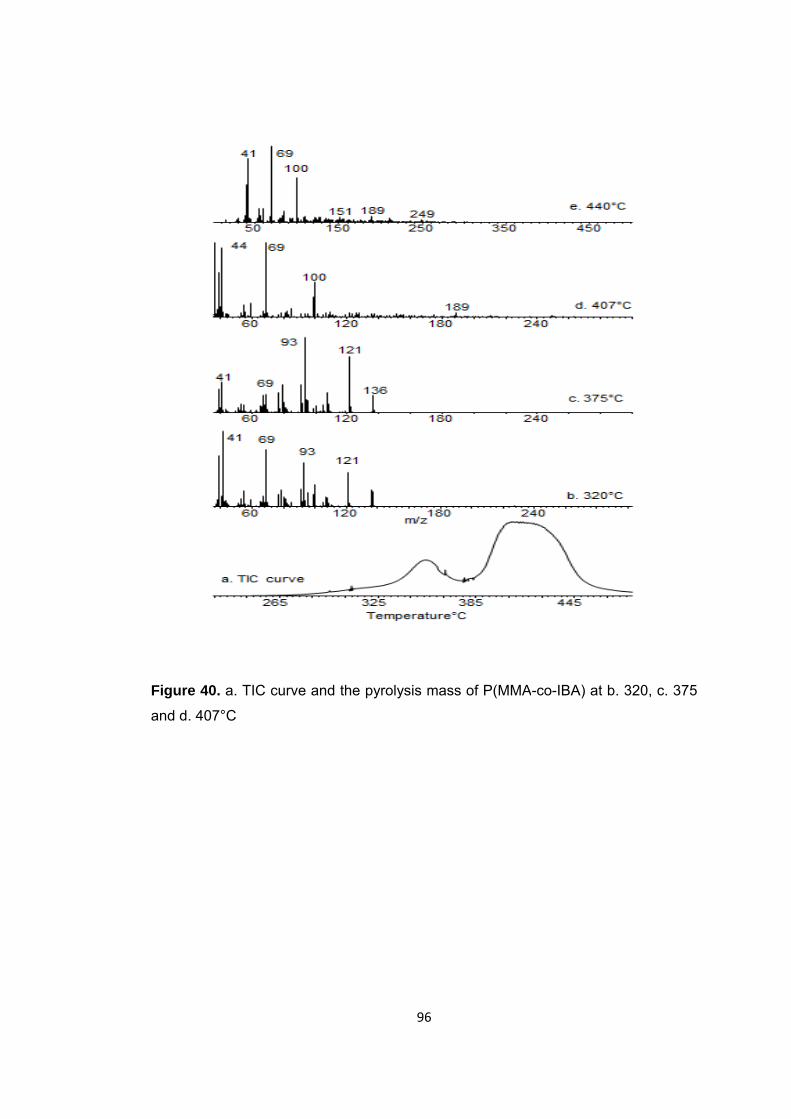
Figure 40and d. 407
0. a. TIC cu
7°C
rve and the
96
e pyrolysis m
6
mass of P(MMMA-co-IBA
A) at b. 3200, c. 375
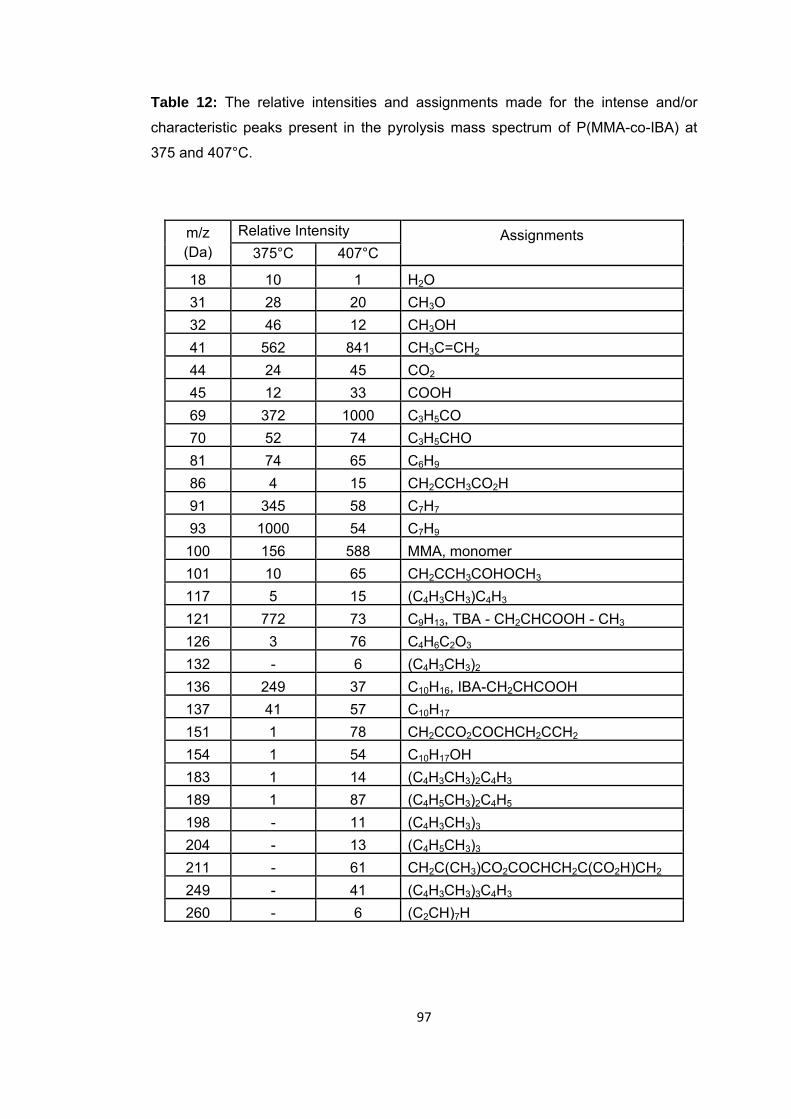
97
Table 12: The relative intensities and assignments made for the intense and/or
characteristic peaks present in the pyrolysis mass spectrum of P(MMA-co-IBA) at
375 and 407°C.
m/z (Da)
Relative Intensity Assignments 375°C 407°C
18 10 1 H2O31 28 20 CH3O32 46 12 CH3OH41 562 841 CH3C=CH2
44 24 45 CO2
45 12 33 COOH69 372 1000 C3H5CO70 52 74 C3H5CHO81 74 65 C6H9
86 4 15 CH2CCH3CO2H91 345 58 C7H7
93 1000 54 C7H9
100 156 588 MMA, monomer101 10 65 CH2CCH3COHOCH3
117 5 15 (C4H3CH3)C4H3
121 772 73 C9H13, TBA - CH2CHCOOH - CH3 126 3 76 C4H6C2O3
132 - 6 (C4H3CH3)2
136 249 37 C10H16, IBA-CH2CHCOOH 137 41 57 C10H17
151 1 78 CH2CCO2COCHCH2CCH2 154 1 54 C10H17OH183 1 14 (C4H3CH3)2C4H3
189 1 87 (C4H5CH3)2C4H5
198 - 11 (C4H3CH3)3
204 - 13 (C4H5CH3)3
211 - 61 CH2C(CH3)CO2COCHCH2C(CO2H)CH2
249 - 41 (C4H3CH3)3C4H3
260 - 6 (C2CH)7H
98
Inspection of single ion evolution profiles of diagnostics products of the components
of the copolymer P(MMA-co-IBA) indicates significant differences compared to the
corresponding homopolymers (Figure 41). Diagnostic peaks of MMA are noticeably
intense indicating that the main thermal degradation pathway for PMMA chains is
depolymerization as in case of the homopolymer. Their evolution profiles again
show two peaks with maxima at 330 and 415°C, almost identical to those detected
for the corresponding homopolymer. However weak shoulders at around 375 and
445°C are present.
On the other hand, more significant differences are detected in the evolution profiles
of the thermal degradation products of PIBA. Firstly, the evolution profiles are
broader. Three peaks, the first two being overlapped, with maxima at 330, 375 and
440°C are present in the evolution profile of isobornyl (137 Da) radical. Isobornylene
evolution is mainly detected at around 375°C. Yet, weak shoulders/peaks are also
detected at around 330 and 440°C. Contrary to the results of PIBA, during the
pyrolysis of the copolymer, the ratio of relative yields of isobornylene to isobornyl
increased from 0.6 to 3.0 indicating that generation of isobornylene is enhanced.
Single ion evolution profile of acrylic acid generated upon loss of isobornylene
shows two overlapping peaks with maxima at 397 and 415°C.
In contrast, a decrease in the yield of H2O is detected. The broad peak in its
evolution profile is associated with desorption of H2O from the surfaces of the probe
under the vacuum conditions of the DP-MS system. The small peak on the H2O
background has a maximum at 405°C. The fragment with m/ z value 126 Da
reaching maximum yield above 410°C may be associated with C4H5C2O3 having
anhydride structure. A detailed analysis of the pyrolysis mass spectra indicates
evolution of CH3OH (32 Da) following the isobornylene generation. The trends in
the single ion evolution profiles of CH3O (31 Da) due to cleavage of CH3O-CO bond
of MMA and those of the products with m/z values 31 and 32 Da generated during
the pyrolysis of the copolymer clearly supports generation of methanol (32 Da),
producing CH3O (31 Da) during the ionization process. In the light of present
findings, a transesterification reaction between the MMA and acrylic acid units
generated by loss of isobornylene from PIBA chains can be proposed as shown in
Scheme 16.
99
Evolution of CO2 is detected in a broad temperature region pointing out degradation
of anhydride units. The yield of CO2 is maximized at around 410°C but is continued
until the end of the pyrolysis process. Products involving unsaturation observed in
the final stages of thermal degradation, as in case of PIBA, are again detected. As
an example the evolution profile of product with m/z 260 Da tentatively (C2CH)7H is
given in Figure 41.
In addition, as a consequence of transesterification reactions between MMA and
acrylic acid units, generation of new fragments can be expected as in case of
poly(MMA-co-BA). On the basis of DP-MS findings, the peaks at 211 and 151 Da
may again be assigned to CH2C(CH3)CO2COCHCH2C(CO2H)CH2 and
CH2CCO2COCHCH2CCH2 respectively. Presumably, the series of peaks at 340,
272, 204 and 136 Da may be assigned to (C4H5CH3)x while those at 324, 255, 189
and 121 Da to (C4H5CH3)x-1C4H5 for x=5 to 2. Similarly peaks at 330, 264, 198 and
132 Da may be associated with (C4H3CH3)x and 315, 249, 183 and 117 Da may be
attributed to (C4H3CH3)x-1C4H3 for x=5 to 2.
Thus, it can be concluded that generation of anhydride units impeding
depolymerization reactions, generates H2O and CH3OH and promotes further side
reactions leading to the formation of crosslinked structure by loss of CO2.
Actually the low yield of H2O may be due to possible transesterification reactions
between H2O and MMA and IBA. When MMA units are involved this reactions
should generate methacrylic acid (86 Da) in addition to methanol (Scheme 15).
Evolution profile of methacrylic acid follows almost identical trends with that of
COOH, indicating that anhydride formation for methacrylic acid does not take place.
When IBA units are involved in trans-esterification reactions with H2O, acrylic acid
and isobornyl alcohol should be generated. The high temperature peak in the
evolution profile of acrylic acid with a maximum at 415°C may be attributed to acrylic
acid units generated by reactions of IBA with H2O. Evolution of isobornyl alcohol is
also recorded at elevated temperatures supporting the existence of these
transesterification reactions.
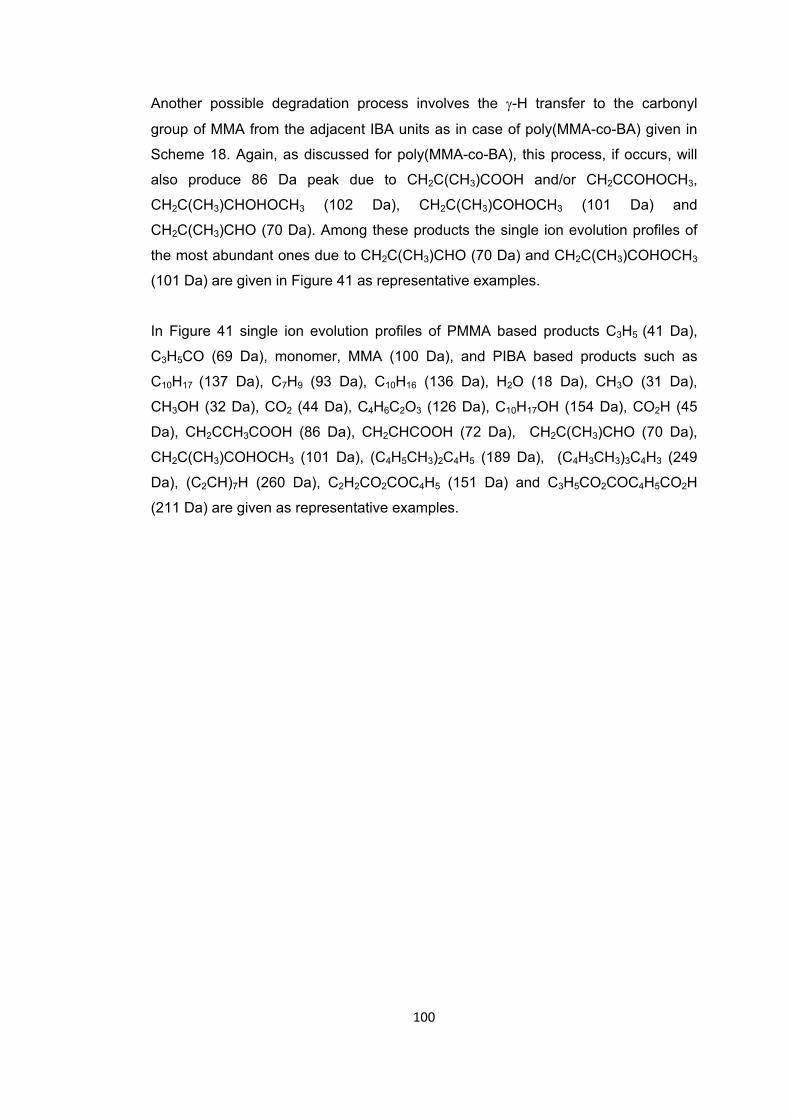
100
Another possible degradation process involves the γ-H transfer to the carbonyl
group of MMA from the adjacent IBA units as in case of poly(MMA-co-BA) given in
Scheme 18. Again, as discussed for poly(MMA-co-BA), this process, if occurs, will
also produce 86 Da peak due to CH2C(CH3)COOH and/or CH2CCOHOCH3,
CH2C(CH3)CHOHOCH3 (102 Da), CH2C(CH3)COHOCH3 (101 Da) and
CH2C(CH3)CHO (70 Da). Among these products the single ion evolution profiles of
the most abundant ones due to CH2C(CH3)CHO (70 Da) and CH2C(CH3)COHOCH3
(101 Da) are given in Figure 41 as representative examples.
In Figure 41 single ion evolution profiles of PMMA based products C3H5 (41 Da),
C3H5CO (69 Da), monomer, MMA (100 Da), and PIBA based products such as
C10H17 (137 Da), C7H9 (93 Da), C10H16 (136 Da), H2O (18 Da), CH3O (31 Da),
CH3OH (32 Da), CO2 (44 Da), C4H6C2O3 (126 Da), C10H17OH (154 Da), CO2H (45
Da), CH2CCH3COOH (86 Da), CH2CHCOOH (72 Da), CH2C(CH3)CHO (70 Da),
CH2C(CH3)COHOCH3 (101 Da), (C4H5CH3)2C4H5 (189 Da), (C4H3CH3)3C4H3 (249
Da), (C2CH)7H (260 Da), C2H2CO2COC4H5 (151 Da) and C3H5CO2COC4H5CO2H
(211 Da) are given as representative examples.
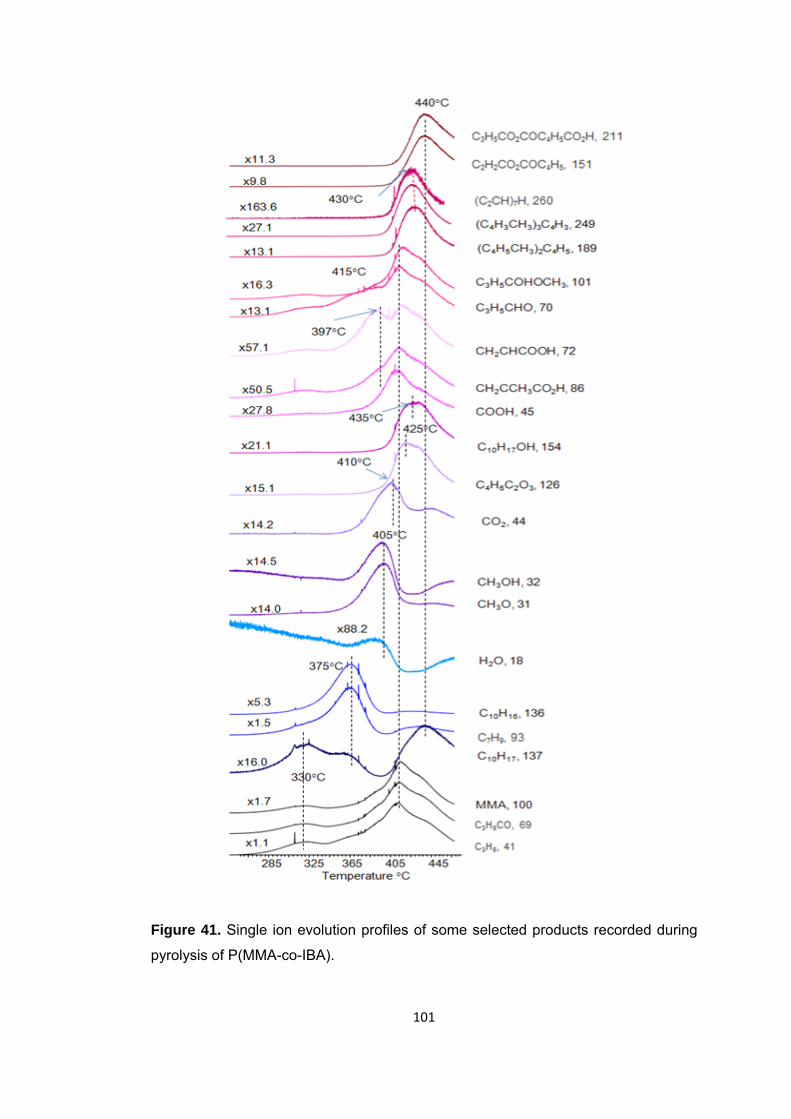
101
Figure 41. Single ion evolution profiles of some selected products recorded during
pyrolysis of P(MMA-co-IBA).
102
Thus, it can be concluded that PMMA chains of the copolymer involving 12.5 % IBA
units, degrades mainly by depolymerization as in case of pure PMMA, yet, H-
transfer from the isobornyl group to CO of IBA and from the back bone of PIBA to
CO of MMA units generate acrylic acid and methacrylic acid to a certain extent.
Anhydride formation by elimination of H2O, and generation of crosslinked and/or
unsaturated linkages by loss of CO2 and CO are detected. Strong evidences for
trans-esterification reaction between MMA and acrylic acid and H2O and those
between IBA and H2O are detected.
Compared to P(MMA-co-nBA), the relative yields of acrylic acid and products due to
transesterification reactions are noticeably higher for P(MMA-co-IBA). The
degradation via H-transfer from the isobornyl group to CO group is the main thermal
degradation pathway for the homopolymer PIBA, whereas H-transfer butyl group to
CO group is only one of the competing degradation processes for the homopolymer
PBA. Thus, the generation of acrylic acid during the decomposition of P(MMA-co-
IBA) is more likely. Acrylic acid generation takes place more readily at lower
temperatures for PIBA and its copolymer with MMA, at around 335 and 375°C
respectively. Whereas for PBA and its copolymer with MMA, its generation takes
place above 375 and 410°C respectively, very close to the temperature region
where PMMA chains start to degrade. Thus, transesterification reactions of acrylic
acid and H2O with MMA seem to be more likely for the copolymer involving IBA.
The increase in the relative yields of related products during the pyrolysis of
poly(MMA-co-IBA) confirms this proposal.
103
3.2.3 Poly(methyl methacrylate-co-benzyl methacrylate) P(MMA-co-BzMA)
The TGA curve of P(MMA-co-BzMA) given in Figure 42 shows that the thermal
degradation of the sample starts at around 250°C. It is a two-step thermal
degradation process. The first portion of the weight loss occurs at around 300°C and
the remaining portion of the polymer degrades at around 360°C.
Figure 42. TGA curve of P(MMA-co-BzMA).
The TIC curve recorded during the pyrolysis of P(MMA-co-BzMA) shows two broad
peaks maximizing at 320 and 400°C (Figure 43) with TGA data. The mass spectra
recorded at both maxima are dominated with characteristic peaks of both
components. Diagnostic peaks of both MMA and BzMA are noticeably intense
indicating that the main thermal degradation pathway is depolymerization as in case
of the homopolymers.
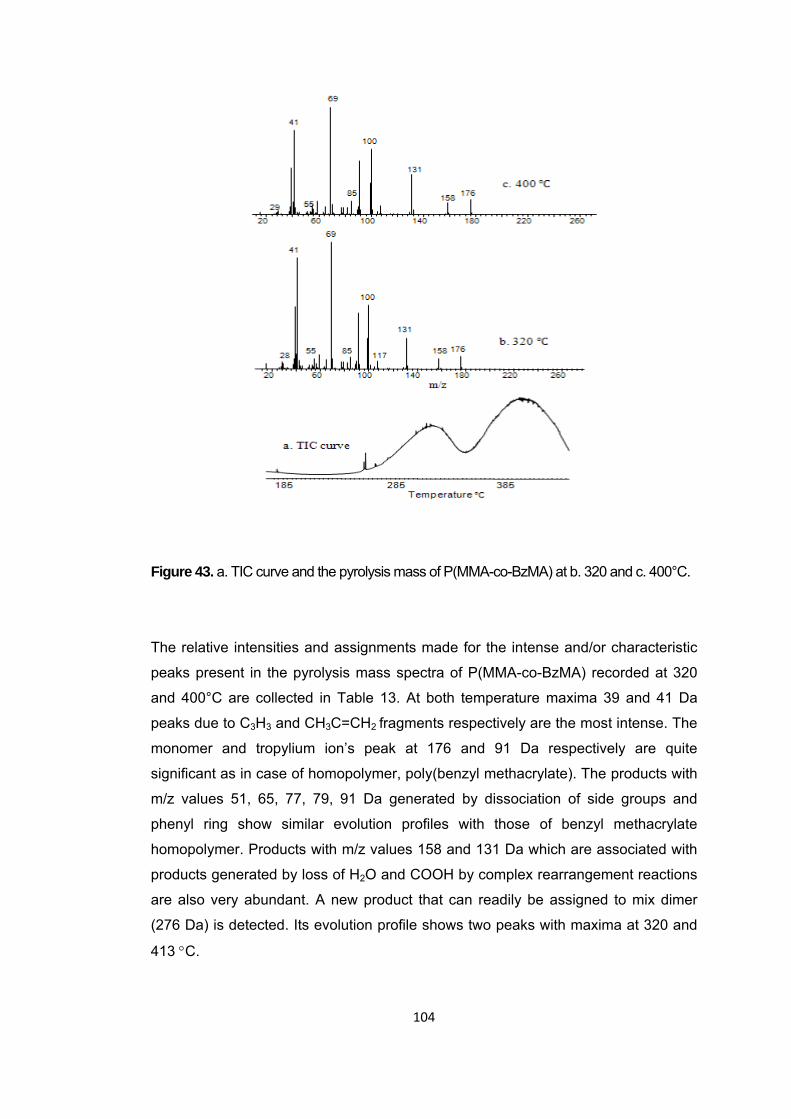
104
Figure 43. a. TIC curve and the pyrolysis mass of P(MMA-co-BzMA) at b. 320 and c. 400°C.
The relative intensities and assignments made for the intense and/or characteristic
peaks present in the pyrolysis mass spectra of P(MMA-co-BzMA) recorded at 320
and 400°C are collected in Table 13. At both temperature maxima 39 and 41 Da
peaks due to C3H3 and CH3C=CH2 fragments respectively are the most intense. The
monomer and tropylium ion’s peak at 176 and 91 Da respectively are quite
significant as in case of homopolymer, poly(benzyl methacrylate). The products with
m/z values 51, 65, 77, 79, 91 Da generated by dissociation of side groups and
phenyl ring show similar evolution profiles with those of benzyl methacrylate
homopolymer. Products with m/z values 158 and 131 Da which are associated with
products generated by loss of H2O and COOH by complex rearrangement reactions
are also very abundant. A new product that can readily be assigned to mix dimer
(276 Da) is detected. Its evolution profile shows two peaks with maxima at 320 and
413 °C.
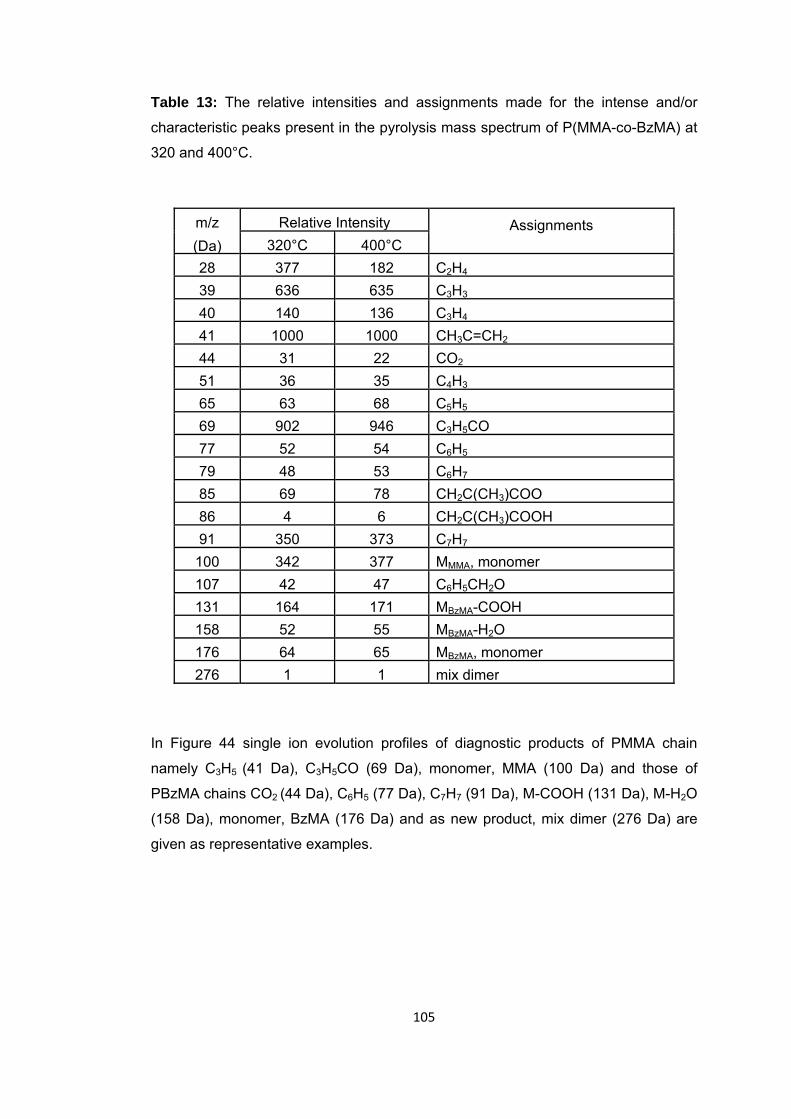
105
Table 13: The relative intensities and assignments made for the intense and/or
characteristic peaks present in the pyrolysis mass spectrum of P(MMA-co-BzMA) at
320 and 400°C.
m/z (Da)
Relative Intensity Assignments 320°C 400°C
28 377 182 C2H4
39 636 635 C3H3
40 140 136 C3H4
41 1000 1000 CH3C=CH2
44 31 22 CO2
51 36 35 C4H3
65 63 68 C5H5
69 902 946 C3H5CO77 52 54 C6H5
79 48 53 C6H7
85 69 78 CH2C(CH3)COO86 4 6 CH2C(CH3)COOH91 350 373 C7H7
100 342 377 MMMA, monomer107 42 47 C6H5CH2O131 164 171 MBzMA-COOH158 52 55 MBzMA-H2O176 64 65 MBzMA, monomer276 1 1 mix dimer
In Figure 44 single ion evolution profiles of diagnostic products of PMMA chain
namely C3H5 (41 Da), C3H5CO (69 Da), monomer, MMA (100 Da) and those of
PBzMA chains CO2 (44 Da), C6H5 (77 Da), C7H7 (91 Da), M-COOH (131 Da), M-H2O
(158 Da), monomer, BzMA (176 Da) and as new product, mix dimer (276 Da) are
given as representative examples.
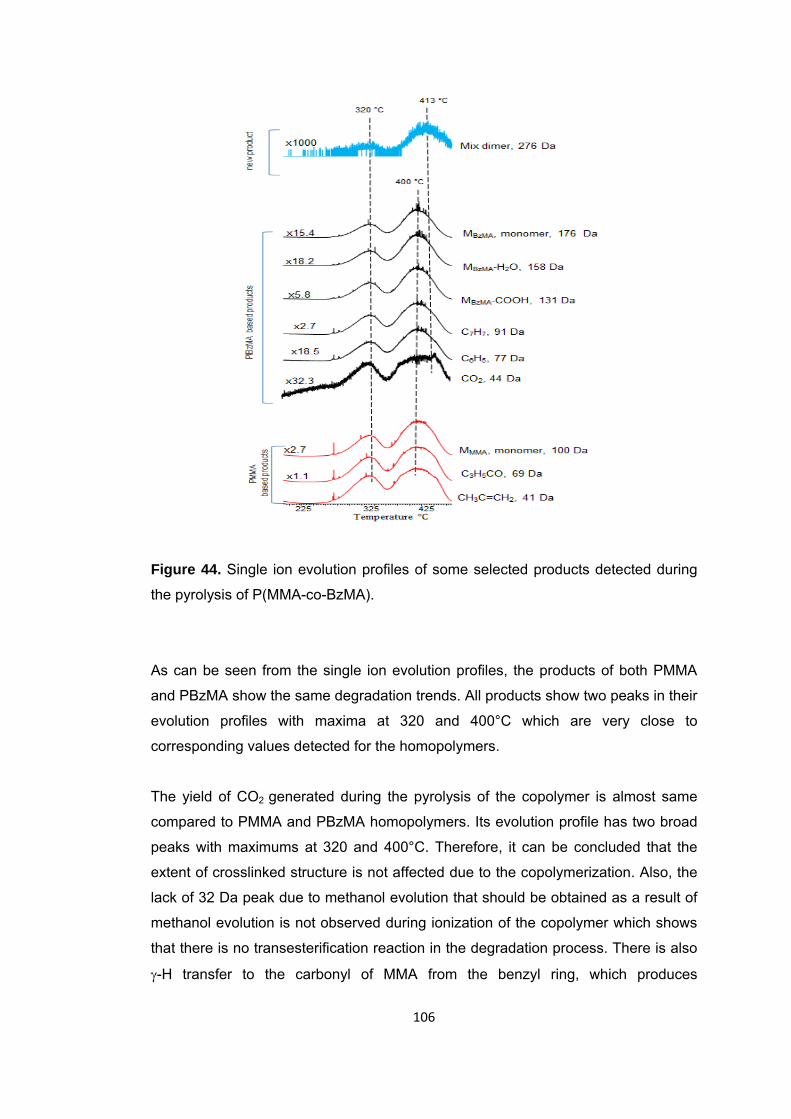
106
Figure 44. Single ion evolution profiles of some selected products detected during
the pyrolysis of P(MMA-co-BzMA).
As can be seen from the single ion evolution profiles, the products of both PMMA
and PBzMA show the same degradation trends. All products show two peaks in their
evolution profiles with maxima at 320 and 400°C which are very close to
corresponding values detected for the homopolymers.
The yield of CO2 generated during the pyrolysis of the copolymer is almost same
compared to PMMA and PBzMA homopolymers. Its evolution profile has two broad
peaks with maximums at 320 and 400°C. Therefore, it can be concluded that the
extent of crosslinked structure is not affected due to the copolymerization. Also, the
lack of 32 Da peak due to methanol evolution that should be obtained as a result of
methanol evolution is not observed during ionization of the copolymer which shows
that there is no transesterification reaction in the degradation process. There is also
γ-H transfer to the carbonyl of MMA from the benzyl ring, which produces
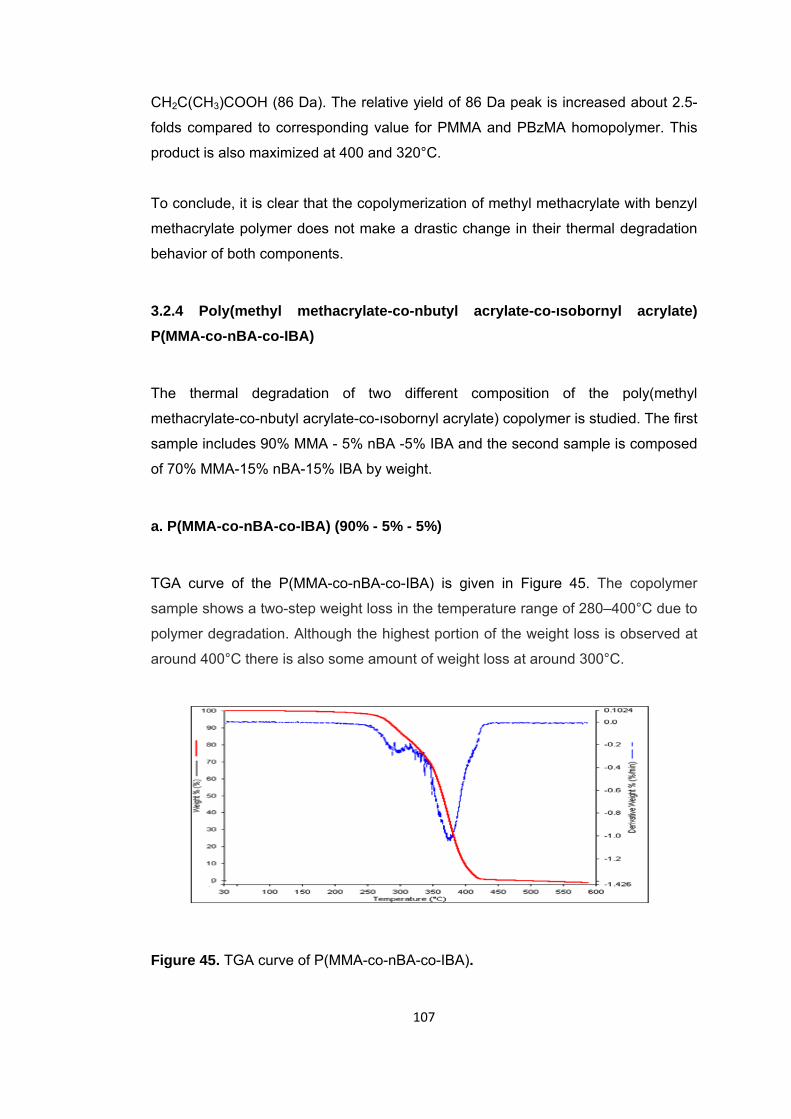
107
CH2C(CH3)COOH (86 Da). The relative yield of 86 Da peak is increased about 2.5-
folds compared to corresponding value for PMMA and PBzMA homopolymer. This
product is also maximized at 400 and 320°C.
To conclude, it is clear that the copolymerization of methyl methacrylate with benzyl
methacrylate polymer does not make a drastic change in their thermal degradation
behavior of both components.
3.2.4 Poly(methyl methacrylate-co-nbutyl acrylate-co-ısobornyl acrylate) P(MMA-co-nBA-co-IBA)
The thermal degradation of two different composition of the poly(methyl
methacrylate-co-nbutyl acrylate-co-ısobornyl acrylate) copolymer is studied. The first
sample includes 90% MMA - 5% nBA -5% IBA and the second sample is composed
of 70% MMA-15% nBA-15% IBA by weight.
a. P(MMA-co-nBA-co-IBA) (90% - 5% - 5%)
TGA curve of the P(MMA-co-nBA-co-IBA) is given in Figure 45. The copolymer
sample shows a two-step weight loss in the temperature range of 280–400°C due to
polymer degradation. Although the highest portion of the weight loss is observed at
around 400°C there is also some amount of weight loss at around 300°C.
Figure 45. TGA curve of P(MMA-co-nBA-co-IBA).
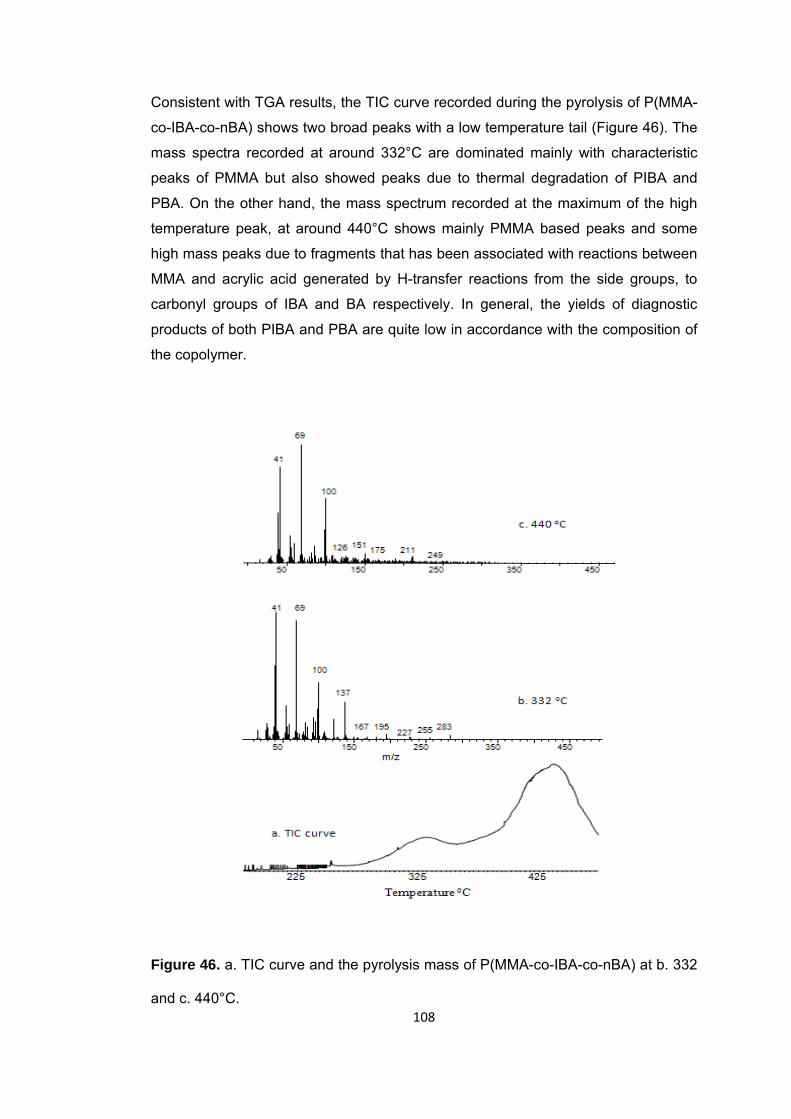
108
Consistent with TGA results, the TIC curve recorded during the pyrolysis of P(MMA-
co-IBA-co-nBA) shows two broad peaks with a low temperature tail (Figure 46). The
mass spectra recorded at around 332°C are dominated mainly with characteristic
peaks of PMMA but also showed peaks due to thermal degradation of PIBA and
PBA. On the other hand, the mass spectrum recorded at the maximum of the high
temperature peak, at around 440°C shows mainly PMMA based peaks and some
high mass peaks due to fragments that has been associated with reactions between
MMA and acrylic acid generated by H-transfer reactions from the side groups, to
carbonyl groups of IBA and BA respectively. In general, the yields of diagnostic
products of both PIBA and PBA are quite low in accordance with the composition of
the copolymer.
Figure 46. a. TIC curve and the pyrolysis mass of P(MMA-co-IBA-co-nBA) at b. 332
and c. 440°C.
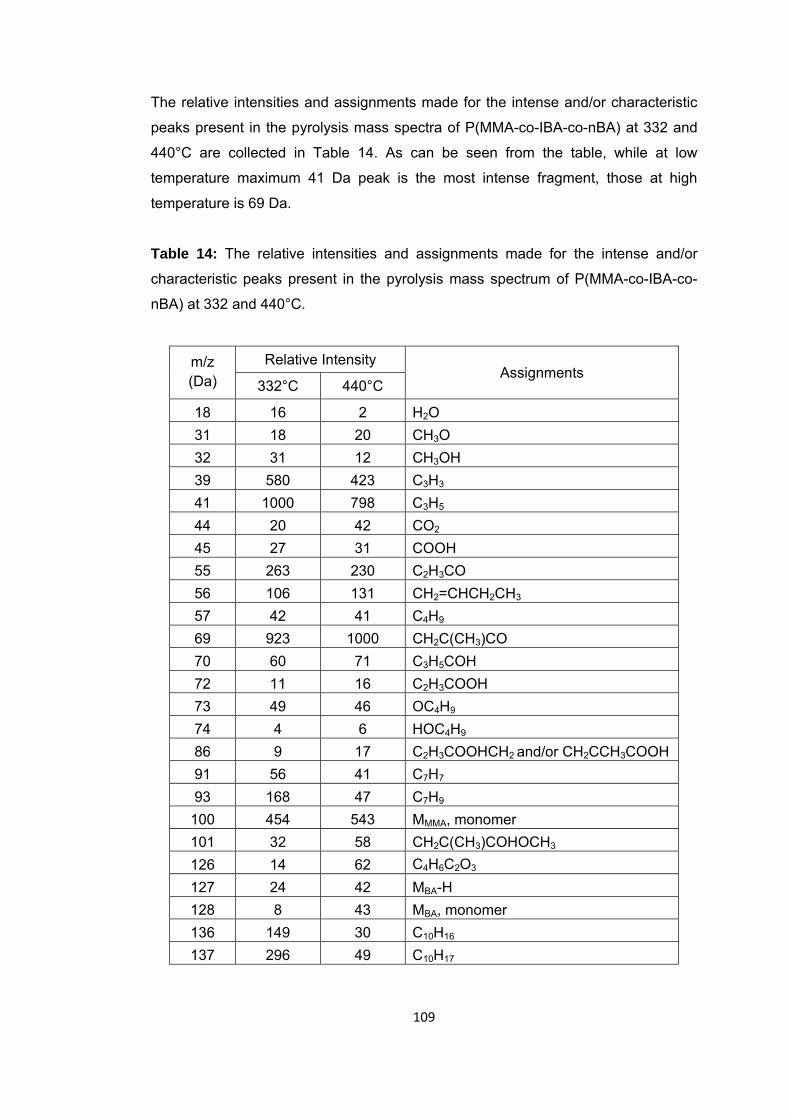
109
The relative intensities and assignments made for the intense and/or characteristic
peaks present in the pyrolysis mass spectra of P(MMA-co-IBA-co-nBA) at 332 and
440°C are collected in Table 14. As can be seen from the table, while at low
temperature maximum 41 Da peak is the most intense fragment, those at high
temperature is 69 Da.
Table 14: The relative intensities and assignments made for the intense and/or
characteristic peaks present in the pyrolysis mass spectrum of P(MMA-co-IBA-co-
nBA) at 332 and 440°C.
m/z (Da)
Relative Intensity Assignments
332°C 440°C
18 16 2 H2O 31 18 20 CH3O 32 31 12 CH3OH 39 580 423 C3H3 41 1000 798 C3H5 44 20 42 CO2 45 27 31 COOH 55 263 230 C2H3CO 56 106 131 CH2=CHCH2CH3 57 42 41 C4H9 69 923 1000 CH2C(CH3)CO 70 60 71 C3H5COH 72 11 16 C2H3COOH 73 49 46 OC4H9 74 4 6 HOC4H9 86 9 17 C2H3COOHCH2 and/or CH2CCH3COOH 91 56 41 C7H7 93 168 47 C7H9
100 454 543 MMMA, monomer 101 32 58 CH2C(CH3)COHOCH3 126 14 62 C4H6C2O3
127 24 42 MBA-H 128 8 43 MBA, monomer 136 149 30 C10H16 137 296 49 C10H17
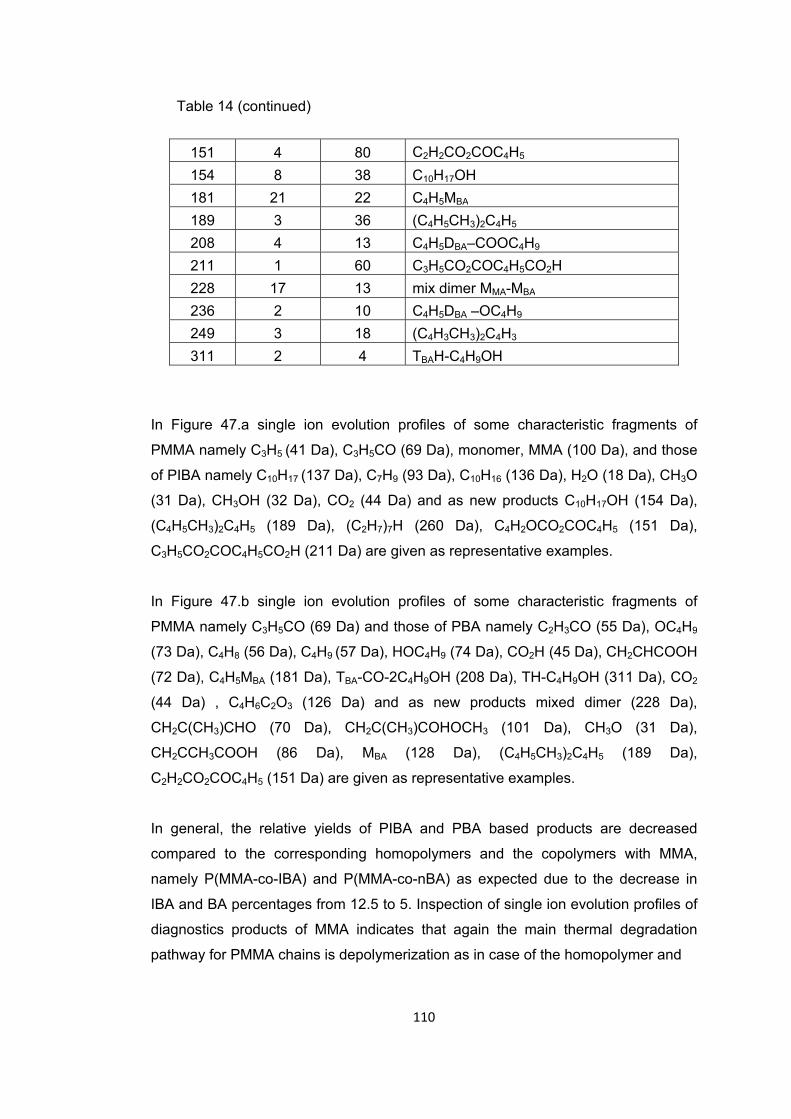
110
Table 14 (continued)
151 4 80 C2H2CO2COC4H5
154 8 38 C10H17OH 181 21 22 C4H5MBA 189 3 36 (C4H5CH3)2C4H5 208 4 13 C4H5DBA–COOC4H9 211 1 60 C3H5CO2COC4H5CO2H 228 17 13 mix dimer MMA-MBA 236 2 10 C4H5DBA –OC4H9 249 3 18 (C4H3CH3)2C4H3 311 2 4 TBAH-C4H9OH
In Figure 47.a single ion evolution profiles of some characteristic fragments of
PMMA namely C3H5 (41 Da), C3H5CO (69 Da), monomer, MMA (100 Da), and those
of PIBA namely C10H17 (137 Da), C7H9 (93 Da), C10H16 (136 Da), H2O (18 Da), CH3O
(31 Da), CH3OH (32 Da), CO2 (44 Da) and as new products C10H17OH (154 Da),
(C4H5CH3)2C4H5 (189 Da), (C2H7)7H (260 Da), C4H2OCO2COC4H5 (151 Da),
C3H5CO2COC4H5CO2H (211 Da) are given as representative examples.
In Figure 47.b single ion evolution profiles of some characteristic fragments of
PMMA namely C3H5CO (69 Da) and those of PBA namely C2H3CO (55 Da), OC4H9
(73 Da), C4H8 (56 Da), C4H9 (57 Da), HOC4H9 (74 Da), CO2H (45 Da), CH2CHCOOH
(72 Da), C4H5MBA (181 Da), TBA-CO-2C4H9OH (208 Da), TH-C4H9OH (311 Da), CO2
(44 Da) , C4H6C2O3 (126 Da) and as new products mixed dimer (228 Da),
CH2C(CH3)CHO (70 Da), CH2C(CH3)COHOCH3 (101 Da), CH3O (31 Da),
CH2CCH3COOH (86 Da), MBA (128 Da), (C4H5CH3)2C4H5 (189 Da),
C2H2CO2COC4H5 (151 Da) are given as representative examples.
In general, the relative yields of PIBA and PBA based products are decreased
compared to the corresponding homopolymers and the copolymers with MMA,
namely P(MMA-co-IBA) and P(MMA-co-nBA) as expected due to the decrease in
IBA and BA percentages from 12.5 to 5. Inspection of single ion evolution profiles of
diagnostics products of MMA indicates that again the main thermal degradation
pathway for PMMA chains is depolymerization as in case of the homopolymer and
111
the copolymers involving two components. The evolution profiles of PMMA based
products again show two peaks with maxima at 330 and 432°C, indicating an
increase in thermal stability as the yield of MMA is maximized at 420°C during the
thermal degradation of PMMA, and P(MMA-co-nBA) and at 415°C during the
thermal degradation of P(MMA-co-IBA). Isobornylene evolution is mainly detected at
around 395°C, again at slightly higher temperature regions. Unlike what is observed
for P(MMA-co-IBA), evolution of CH3OH is also recorded at around 395°C. The ratio
of relative yields of isobornylene to isobornyl is 0.8, slightly higher than the
corresponding value for the homopolymer but significantly lower than the value for
the copolymer P(MMA-co-IBA) indicating that generation of isobornylene is
diminished in the presence of BA units.
Similarly, the yield of PBA based products, especially those involving more than one
repeating unit, are decreased. As in case of the copolymers involving MMA and IBA
or BA, acrylic acid formation is detected. No significant change is observed in its
yield. Actually, the yield of acrylic acid generated during the thermal degradation of
copolymers P(MMA-co-IBA) and P(MMA-co-nBA) involving 12.5 % IBA or nBA are
almost identical. As a consequence, no significant change in the yield of acrylic acid
generated during the pyrolysis of P(MMA-co-IBA-co-nBA) involving 5 % IBA and 5
% BA is noted. However, most probably due to the increase of thermal stability of
both IBA and BA segments, evolution of acrylic acid is only detected at elevated
temperatures, in the region where PMMA chains starts to decompose.
For this sample, evolution of H2O is detected as in case of P(MMA-co-IBA).
Condensation of acrylic acid segments yielding anhydride units is diminished
noticeably as expected compared to PIBA and PBA. The decrease in the amount of
evolved H2O may be regarded as the reason for the decrease in the yields of
butanol, isobornyl alcohol and methacrylic acid that are generated by
transesterification reactions with BA, IBA and MMA respectively. Actually generation
of anhydride units and thus H2O are more efficient for PIBA. Thus, it may be thought
that the chain length of the segments involving repeating anhydride units
significantly decreased when % IBA is decreased in P(MMA-co-nBA-co-IBA). It may
further be thought that as thermal stability of IBA chains is increased, generation of
acrylic acid and in turn anhydride units also shifts to higher temperatures decreasing
the probability of transesterification reactions in the temperature region where
PMMA chains start to decompose.
112
The increase in the yield of methacrylic acid is only about 1.2 folds with respect to
P(MMA-co-nBA). Yet, compared to P(MMA-co-IBA) more than 4-folds decrease in
its intensity is recorded supporting the above discussions.
Contrary to expectations, the yield of products due to transesterification reactions
between MMA and acrylic acid are increased significantly compared to P(MMA-co-
nBA) and slightly with respect to P(MMA-co-IBA). One possible reason may be the
decrease in the extent of competing reactions between MMA and H2O and MMA
and butyl and isobornyl alcohols.
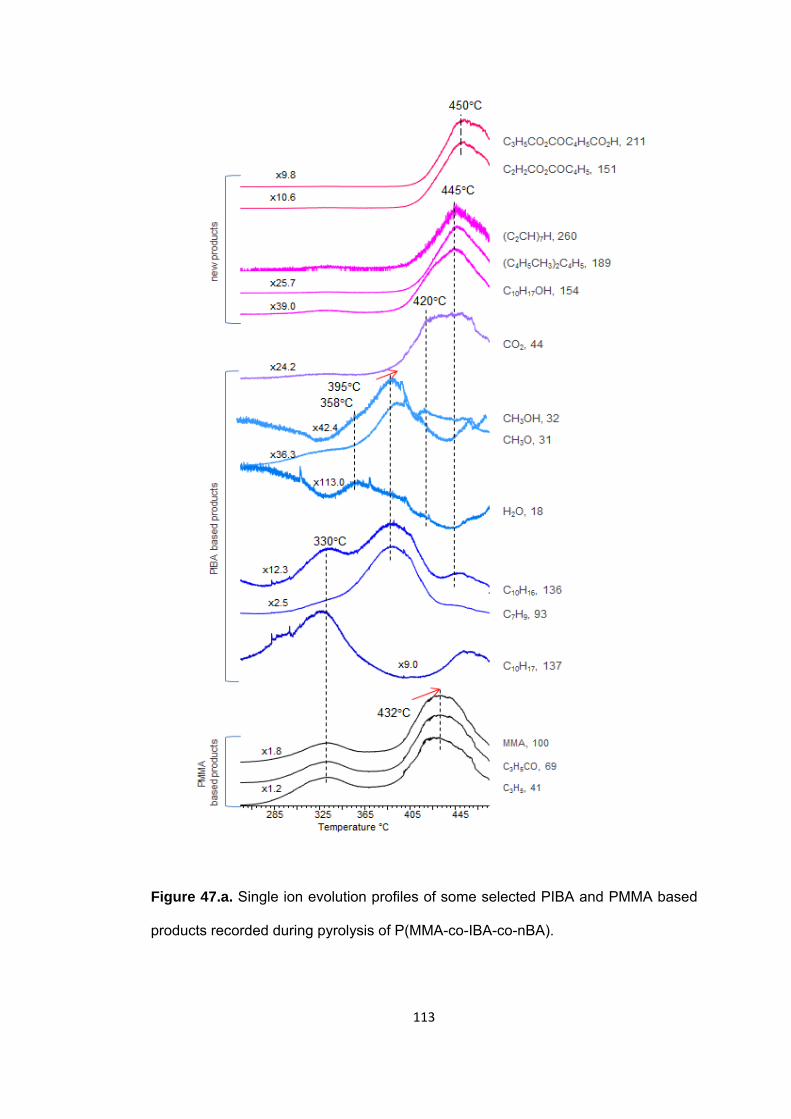
113
Figure 47.a. Single ion evolution profiles of some selected PIBA and PMMA based
products recorded during pyrolysis of P(MMA-co-IBA-co-nBA).
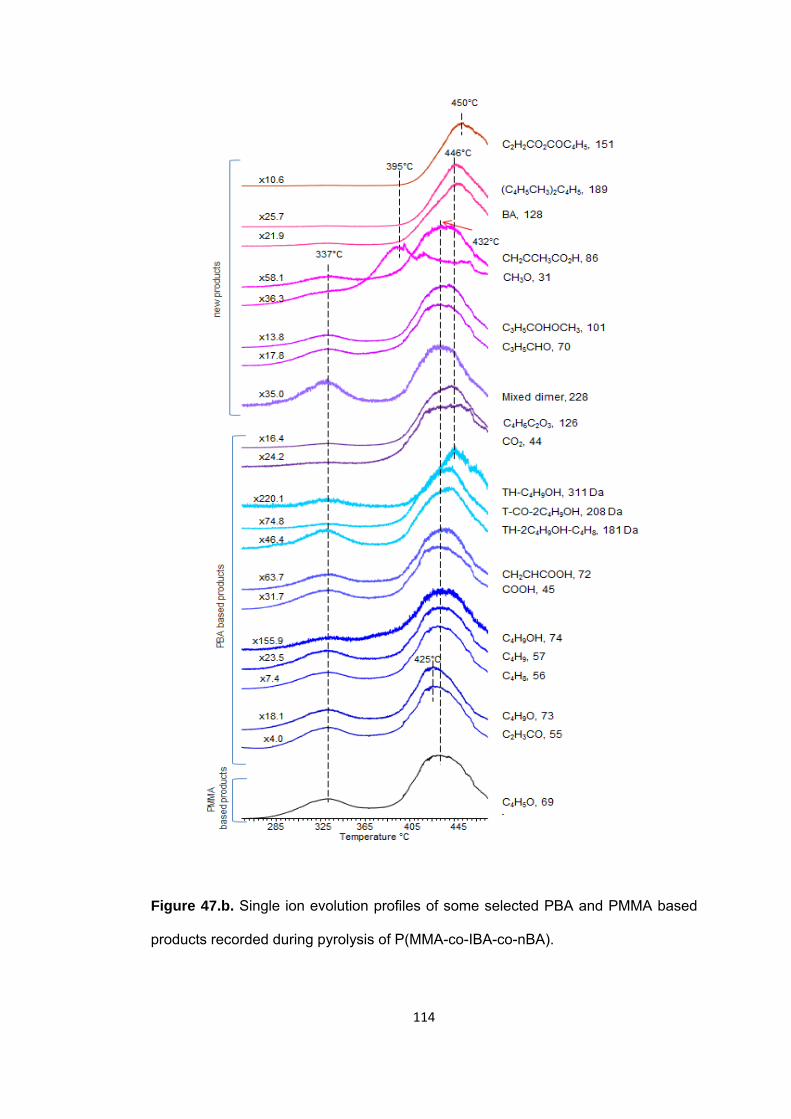
114
Figure 47.b. Single ion evolution profiles of some selected PBA and PMMA based
products recorded during pyrolysis of P(MMA-co-IBA-co-nBA).
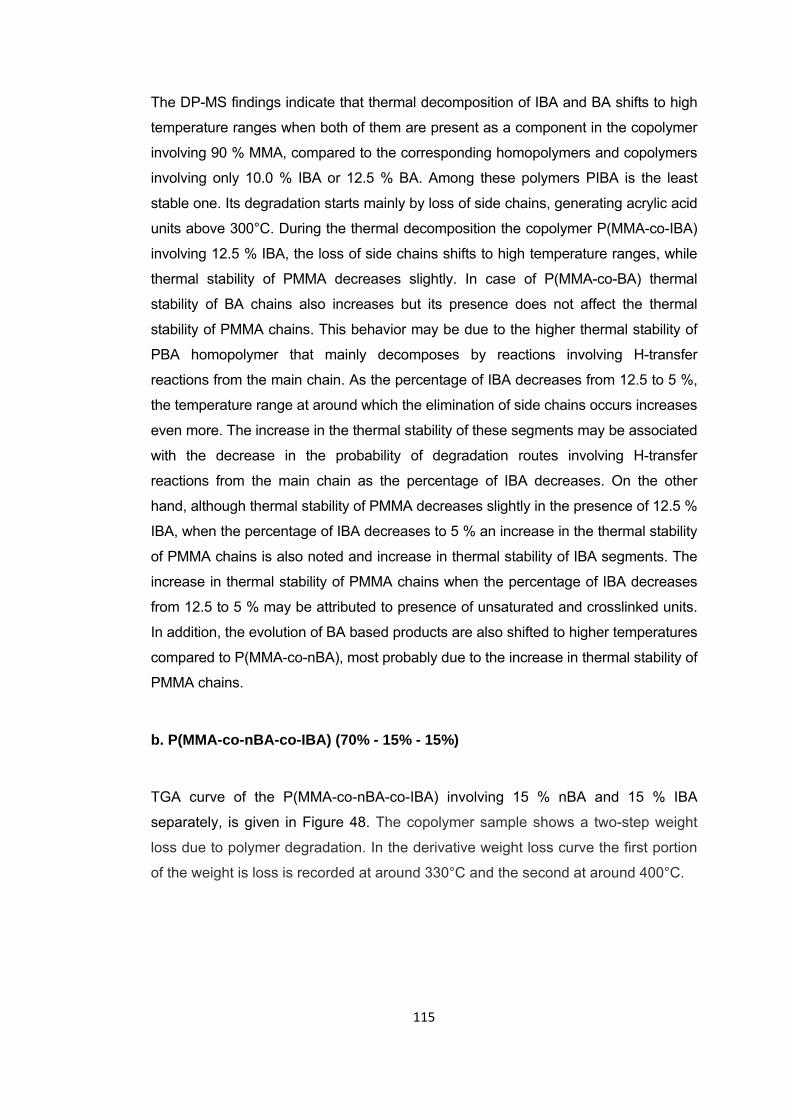
115
The DP-MS findings indicate that thermal decomposition of IBA and BA shifts to high
temperature ranges when both of them are present as a component in the copolymer
involving 90 % MMA, compared to the corresponding homopolymers and copolymers
involving only 10.0 % IBA or 12.5 % BA. Among these polymers PIBA is the least
stable one. Its degradation starts mainly by loss of side chains, generating acrylic acid
units above 300°C. During the thermal decomposition the copolymer P(MMA-co-IBA)
involving 12.5 % IBA, the loss of side chains shifts to high temperature ranges, while
thermal stability of PMMA decreases slightly. In case of P(MMA-co-BA) thermal
stability of BA chains also increases but its presence does not affect the thermal
stability of PMMA chains. This behavior may be due to the higher thermal stability of
PBA homopolymer that mainly decomposes by reactions involving H-transfer
reactions from the main chain. As the percentage of IBA decreases from 12.5 to 5 %,
the temperature range at around which the elimination of side chains occurs increases
even more. The increase in the thermal stability of these segments may be associated
with the decrease in the probability of degradation routes involving H-transfer
reactions from the main chain as the percentage of IBA decreases. On the other
hand, although thermal stability of PMMA decreases slightly in the presence of 12.5 %
IBA, when the percentage of IBA decreases to 5 % an increase in the thermal stability
of PMMA chains is also noted and increase in thermal stability of IBA segments. The
increase in thermal stability of PMMA chains when the percentage of IBA decreases
from 12.5 to 5 % may be attributed to presence of unsaturated and crosslinked units.
In addition, the evolution of BA based products are also shifted to higher temperatures
compared to P(MMA-co-nBA), most probably due to the increase in thermal stability of
PMMA chains.
b. P(MMA-co-nBA-co-IBA) (70% - 15% - 15%)
TGA curve of the P(MMA-co-nBA-co-IBA) involving 15 % nBA and 15 % IBA
separately, is given in Figure 48. The copolymer sample shows a two-step weight
loss due to polymer degradation. In the derivative weight loss curve the first portion
of the weight is loss is recorded at around 330°C and the second at around 400°C.
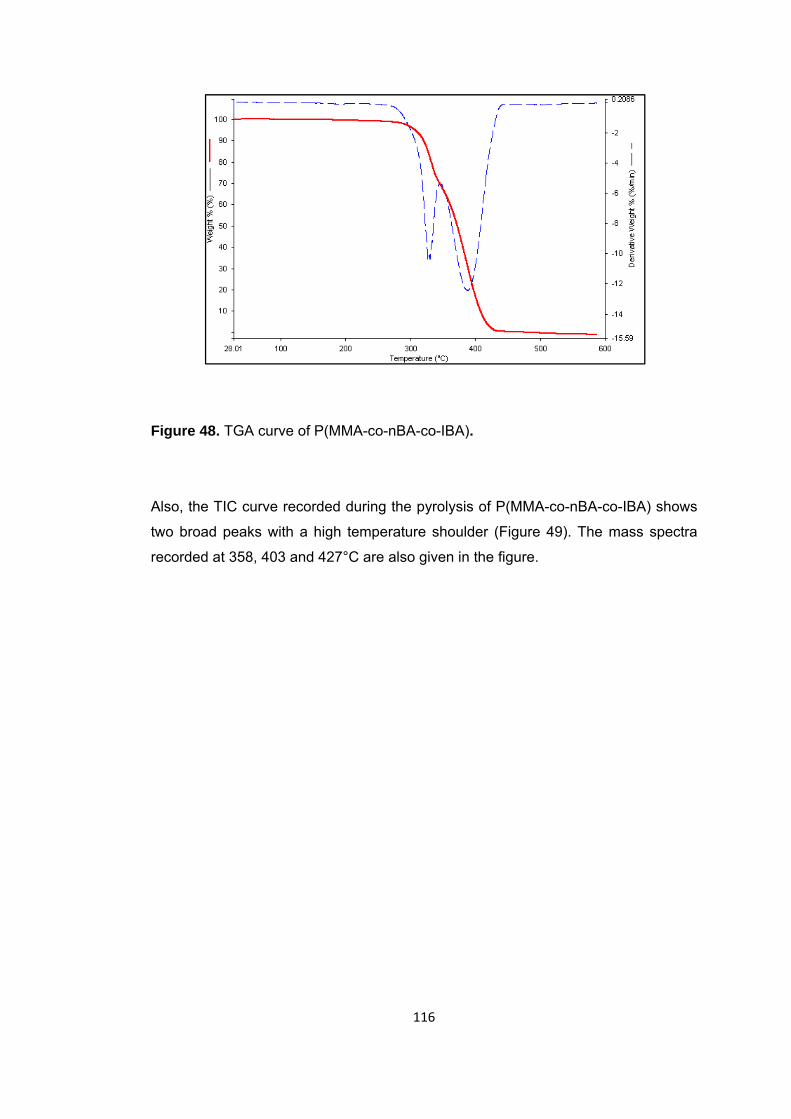
116
Figure 48. TGA curve of P(MMA-co-nBA-co-IBA). Also, the TIC curve recorded during the pyrolysis of P(MMA-co-nBA-co-IBA) shows
two broad peaks with a high temperature shoulder (Figure 49). The mass spectra
recorded at 358, 403 and 427°C are also given in the figure.
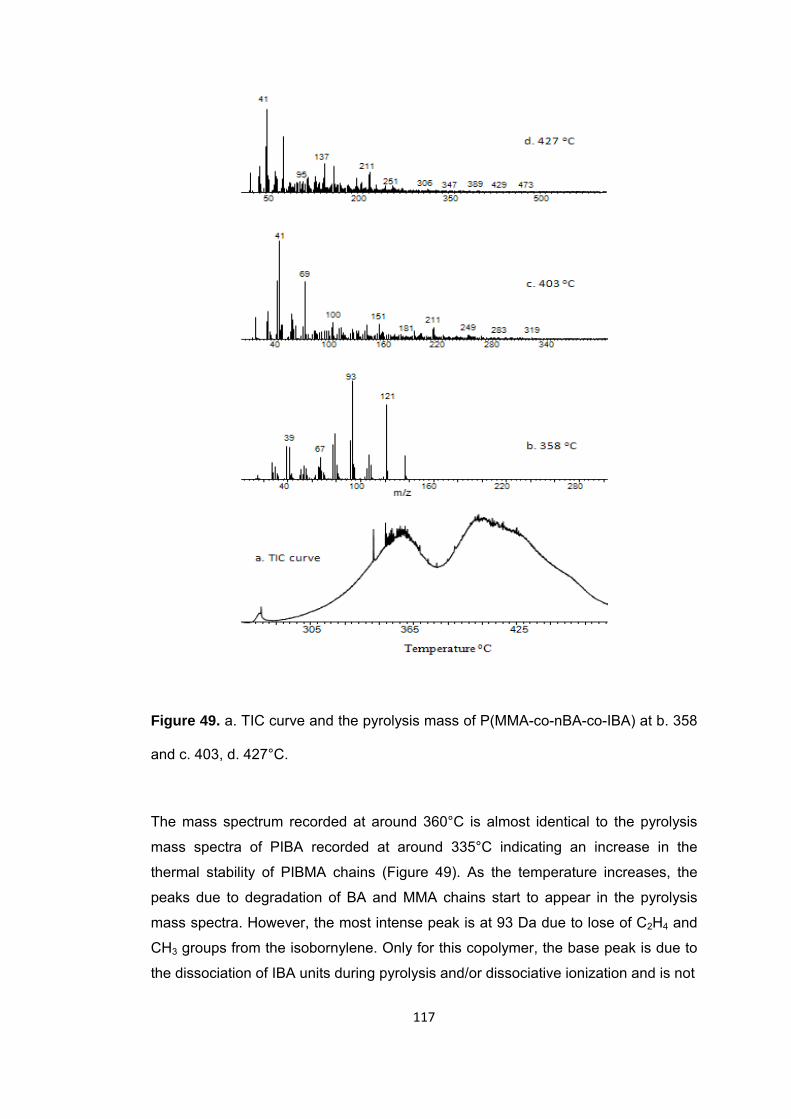
117
Figure 49. a. TIC curve and the pyrolysis mass of P(MMA-co-nBA-co-IBA) at b. 358
and c. 403, d. 427°C.
The mass spectrum recorded at around 360°C is almost identical to the pyrolysis
mass spectra of PIBA recorded at around 335°C indicating an increase in the
thermal stability of PIBMA chains (Figure 49). As the temperature increases, the
peaks due to degradation of BA and MMA chains start to appear in the pyrolysis
mass spectra. However, the most intense peak is at 93 Da due to lose of C2H4 and
CH3 groups from the isobornylene. Only for this copolymer, the base peak is due to
the dissociation of IBA units during pyrolysis and/or dissociative ionization and is not
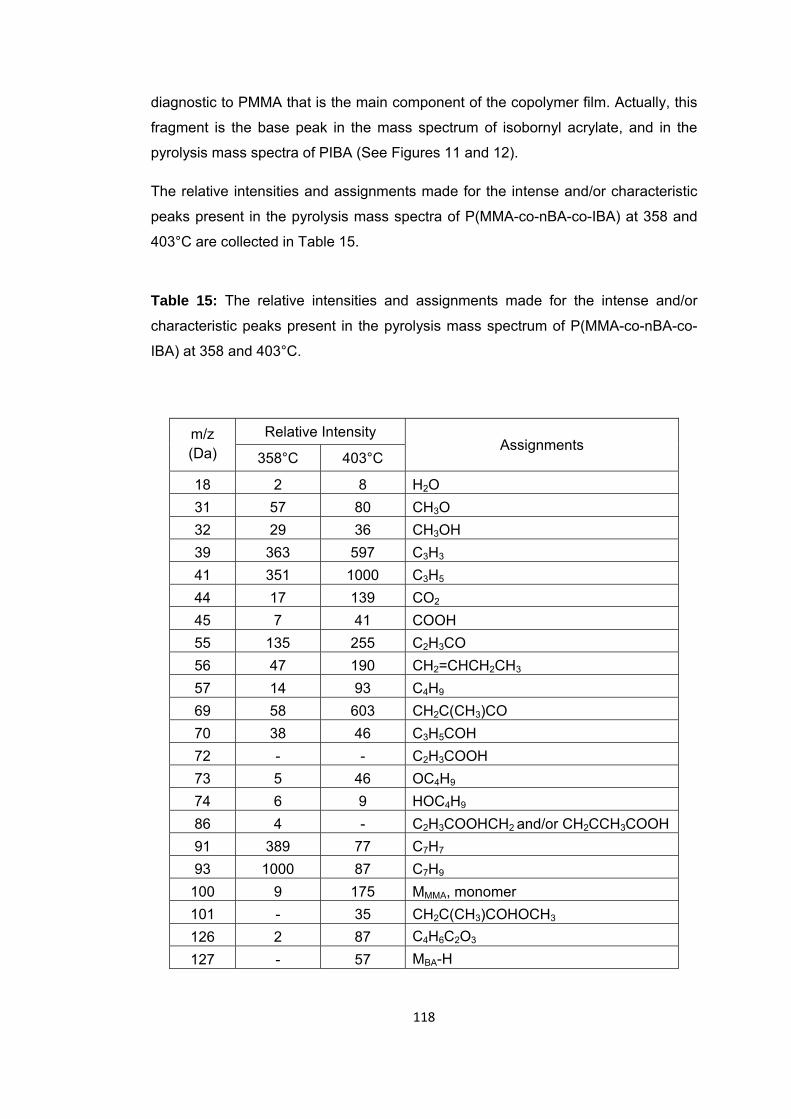
118
diagnostic to PMMA that is the main component of the copolymer film. Actually, this
fragment is the base peak in the mass spectrum of isobornyl acrylate, and in the
pyrolysis mass spectra of PIBA (See Figures 11 and 12).
The relative intensities and assignments made for the intense and/or characteristic
peaks present in the pyrolysis mass spectra of P(MMA-co-nBA-co-IBA) at 358 and
403°C are collected in Table 15.
Table 15: The relative intensities and assignments made for the intense and/or
characteristic peaks present in the pyrolysis mass spectrum of P(MMA-co-nBA-co-
IBA) at 358 and 403°C.
m/z (Da)
Relative Intensity Assignments
358°C 403°C
18 2 8 H2O 31 57 80 CH3O 32 29 36 CH3OH 39 363 597 C3H3 41 351 1000 C3H5 44 17 139 CO2 45 7 41 COOH 55 135 255 C2H3CO 56 47 190 CH2=CHCH2CH3 57 14 93 C4H9 69 58 603 CH2C(CH3)CO 70 38 46 C3H5COH 72 - - C2H3COOH 73 5 46 OC4H9 74 6 9 HOC4H9 86 4 - C2H3COOHCH2 and/or CH2CCH3COOH 91 389 77 C7H7 93 1000 87 C7H9
100 9 175 MMMA, monomer 101 - 35 CH2C(CH3)COHOCH3 126 2 87 C4H6C2O3 127 - 57 MBA-H
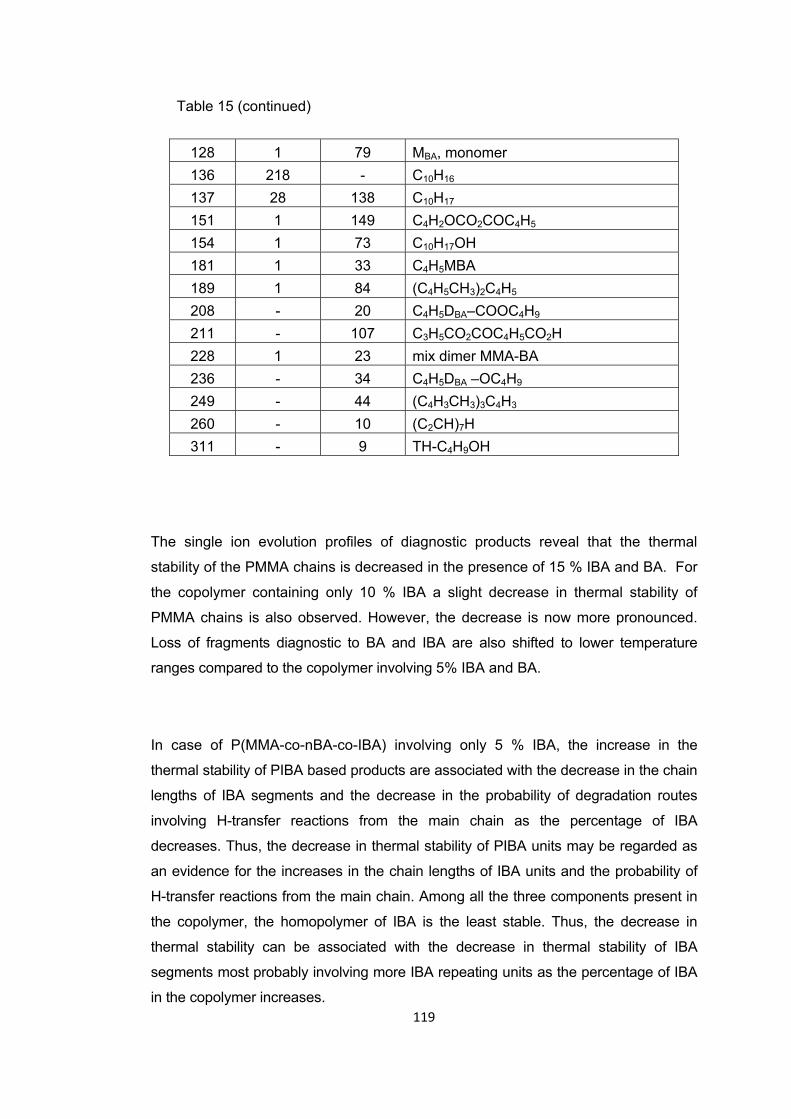
119
Table 15 (continued)
128 1 79 MBA, monomer 136 218 - C10H16 137 28 138 C10H17 151 1 149 C4H2OCO2COC4H5 154 1 73 C10H17OH 181 1 33 C4H5MBA 189 1 84 (C4H5CH3)2C4H5 208 - 20 C4H5DBA–COOC4H9 211 - 107 C3H5CO2COC4H5CO2H 228 1 23 mix dimer MMA-BA 236 - 34 C4H5DBA –OC4H9 249 - 44 (C4H3CH3)3C4H3 260 - 10 (C2CH)7H 311 - 9 TH-C4H9OH
The single ion evolution profiles of diagnostic products reveal that the thermal
stability of the PMMA chains is decreased in the presence of 15 % IBA and BA. For
the copolymer containing only 10 % IBA a slight decrease in thermal stability of
PMMA chains is also observed. However, the decrease is now more pronounced.
Loss of fragments diagnostic to BA and IBA are also shifted to lower temperature
ranges compared to the copolymer involving 5% IBA and BA.
In case of P(MMA-co-nBA-co-IBA) involving only 5 % IBA, the increase in the
thermal stability of PIBA based products are associated with the decrease in the chain
lengths of IBA segments and the decrease in the probability of degradation routes
involving H-transfer reactions from the main chain as the percentage of IBA
decreases. Thus, the decrease in thermal stability of PIBA units may be regarded as
an evidence for the increases in the chain lengths of IBA units and the probability of
H-transfer reactions from the main chain. Among all the three components present in
the copolymer, the homopolymer of IBA is the least stable. Thus, the decrease in
thermal stability can be associated with the decrease in thermal stability of IBA
segments most probably involving more IBA repeating units as the percentage of IBA
in the copolymer increases.
120
In Figure 50.a single ion evolution profiles of some characteristic fragments of
PMMA namely C3H5 (41 Da), C3H5CO (69 Da), monomer, MMA (100 Da), and those
of PIBA namely C10H17 (137 Da), C7H9 (93 Da), C10H16 (136 Da), H2O (18 Da),
C4H6C2O3 (126 Da), CO2 (44 Da), and as new products CH3O (31 Da), CH3OH (32
Da), COOH (45 Da), CH2CCH3COOH (86 Da), C10H17OH (154 Da), CH2C(CH3)CHO
(70 Da), (C4H5CH3)2C4H5 (189 Da), (C4H3CH3)3C4H3 (249 Da), (C2H)7H (260 Da),
C2H2CO2COC4H5 (151 Da), C3H5CO2COC4H5CO2H (211 Da) are given as
representative examples.
In Figure 50.b single ion evolution profiles of some characteristic fragments of
PMMA namely C3H5CO (69 Da) and those of PBA namely C2H3CO (55 Da), OC4H9
(73 Da), C4H8 (56 Da), C4H9 (57 Da), HOC4H9 (74 Da), CO2H (45 Da), C4H5MBA (181
Da), T-CO-2C4H9OH (208 Da), TH-C4H9OH (311 Da), CO2 (44 Da) , C4H6C2O3 (126
Da) and as new products mixed dimer (228 Da), CH2C(CH3)CHO (70 Da),
CH2C(CH3)COHOCH3 (101 Da), CH3O (31 Da), CH2CCH3COOH (86 Da), MBA (128
Da), (C4H5CH3)2C4H5 (189 Da), C2H2CO2COC4H5 (151 Da) are given as
representative examples.
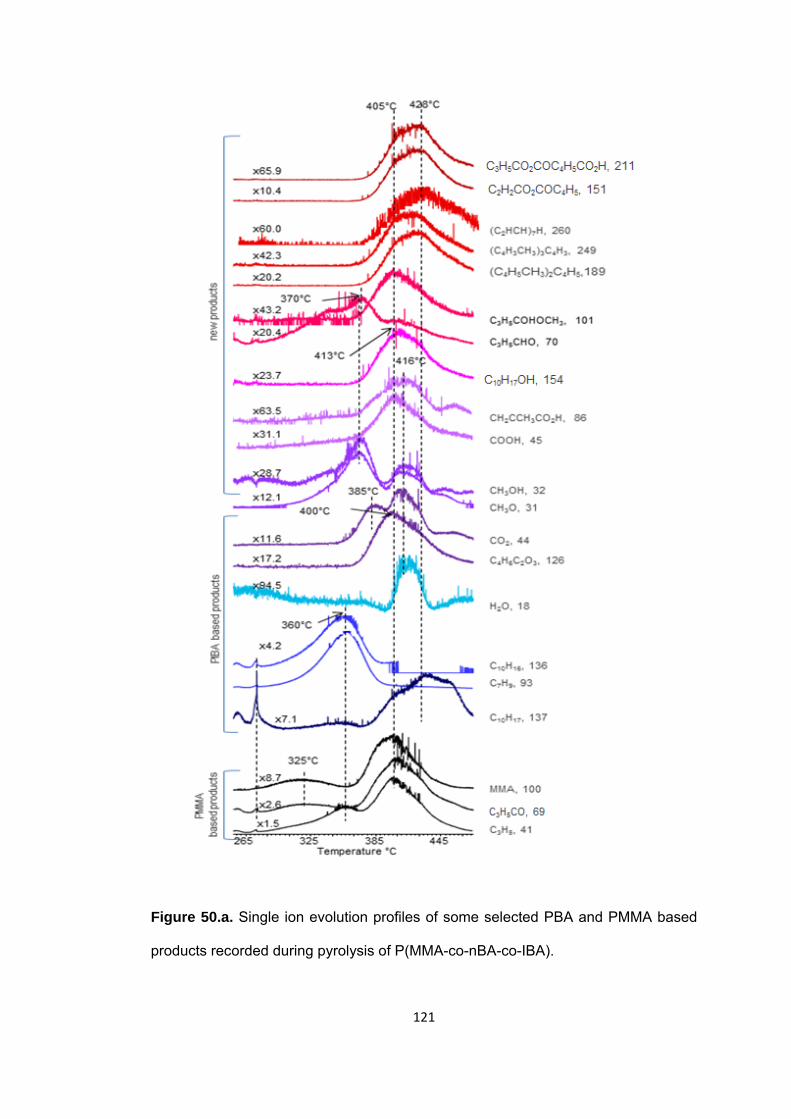
121
Figure 50.a. Single ion evolution profiles of some selected PBA and PMMA based
products recorded during pyrolysis of P(MMA-co-nBA-co-IBA).
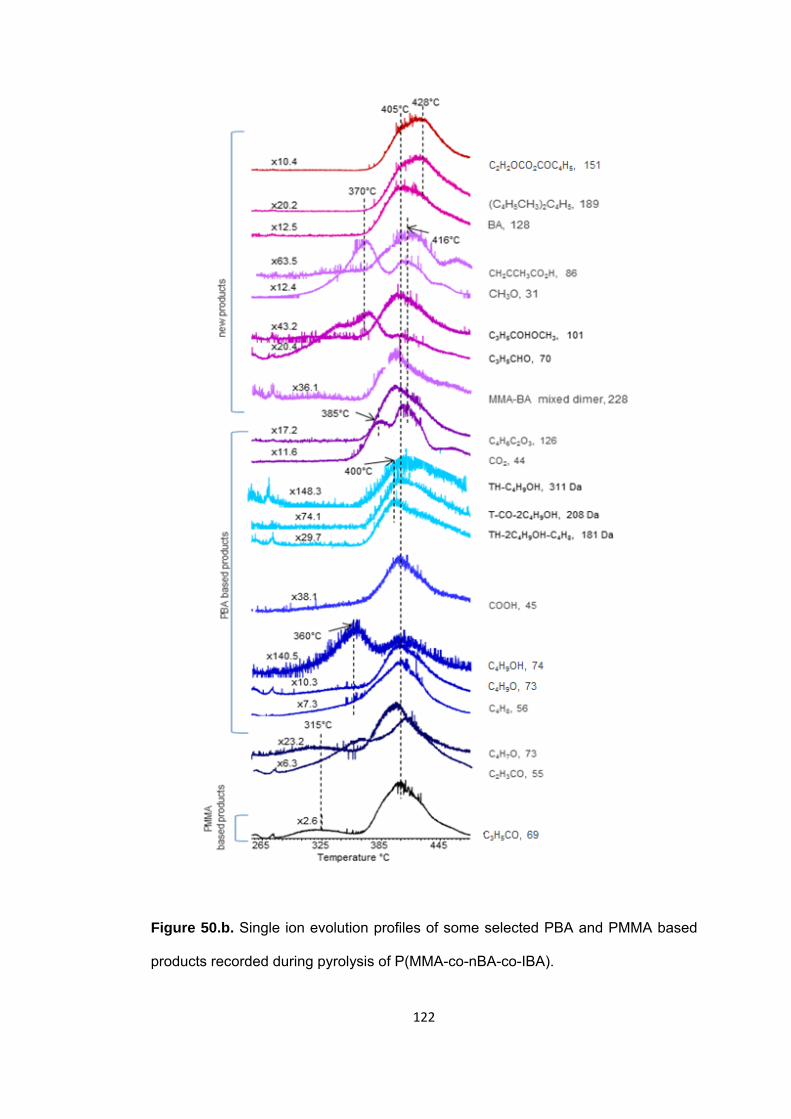
122
Figure 50.b. Single ion evolution profiles of some selected PBA and PMMA based
products recorded during pyrolysis of P(MMA-co-nBA-co-IBA).
123
The trends observed in the single ion evolution profiles of PMMA based products
recorded during the pyrolysis of the copolymer containing 15 % nBA and IBA are
almost identical to those observed during the pyrolysis of all copolymers. The low
temperature peak in the evolution profile of C3H5 (41 Da) can directly be related to
contribution of the fragment generated during the pyrolysis or dissociative ionization
of IBA with the same m/z value.
PBA based products are also maximized at around 405°C, at slightly higher
temperature than the PMMA based products. On the other hand, IBA based
products show a maximum at around 360°C, at higher temperatures than that is
detected for PIBA, but at lower temperatures than that are recorded for P(MMA-co-
IBA) and P(MMA-co-BA-co-IBA) containing 5 % IBA.
In general, besides the decrease in thermal stability, noticeable changes are
detected in product distributions. The relative yields of products associated with
thermal degradation of PBA chains are increased compared to P(MMA-co-nBA) and
P(MMA-co-nBA-co-IBA) containing 5 % BA. A slight increase in the generation of
butanol is also noted. On the other hand, the relative yield of butene is decreased
with respect to P(MMA-co-BA) and is constant compared to that is detected for
P(MMA-co-BA-co-IBA) containing only 5 % BA and IBA. This behavior may be
associated with the increase in the probability of H-transfer reactions from the main
chain, competing with H-transfer reactions from the side chains, as in case of
homopolymer PnBA.
The relative yield of isobornylene is increased by 1.3 and 2.9-folds compared to
P(MMA-co-IBA) and P(MMA-co-BA-co-IBA) containing % 5 nBA respectively. The
ratio of the relative yields of isobornylene to isobornyl is 1.7, noticeably higher than
the value for the copolymer P(MMA-co-BA-co-IBA) indicating that generation of
isobornylene is enhanced as the percentage of IBA is increased from 5 to 15 %,
however, it is still lower than the value for the P(MMA-co-IBA). The generation of
isobornylene actually indicates formation of acrylic acid. However, only negligible
amount of acrylic acid is evolved. Furthermore, the yield of anhydride units is almost
constant. These fragments are detected at relatively low temperatures and are
reached to maximum yield at around 385°C. Their evolutions are continued over a
broad temperature range. However, 1.2 and 2.1- folds of increases in the yield of
CO2 compared to P(MMA-co-IBA) and P(MMA-co-BA-co-IBA) containing % 5 nBA
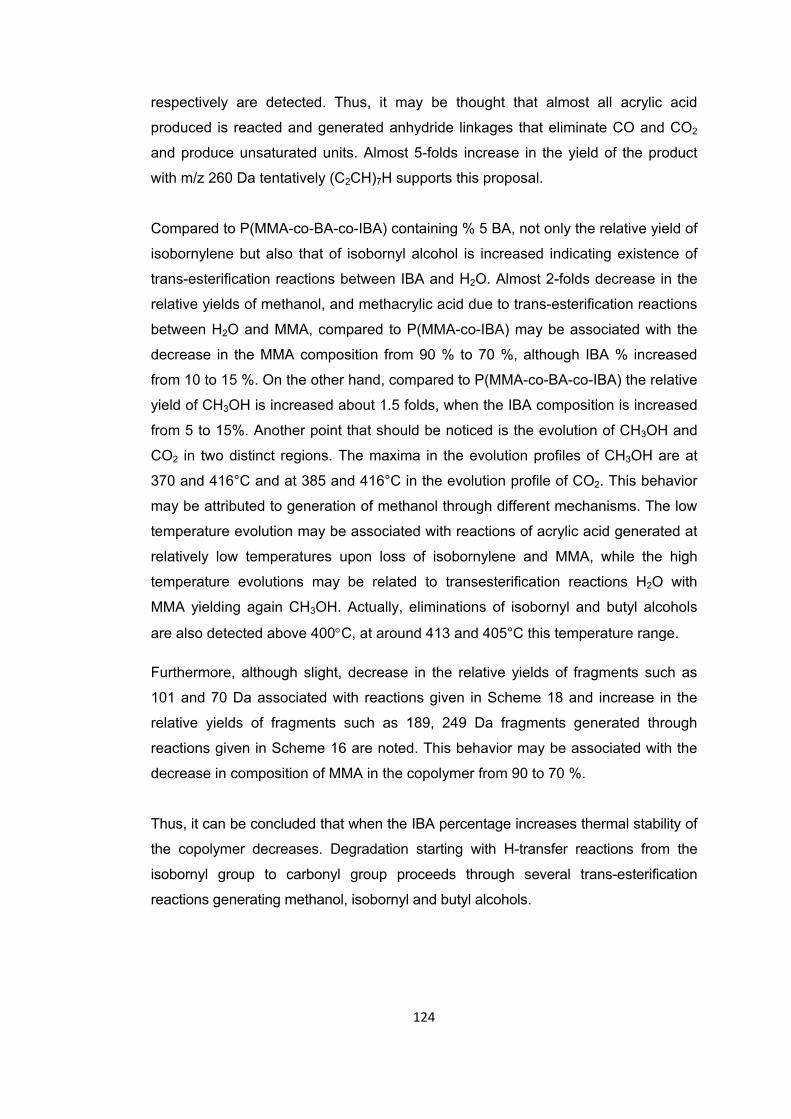
124
respectively are detected. Thus, it may be thought that almost all acrylic acid
produced is reacted and generated anhydride linkages that eliminate CO and CO2
and produce unsaturated units. Almost 5-folds increase in the yield of the product
with m/z 260 Da tentatively (C2CH)7H supports this proposal.
Compared to P(MMA-co-BA-co-IBA) containing % 5 BA, not only the relative yield of
isobornylene but also that of isobornyl alcohol is increased indicating existence of
trans-esterification reactions between IBA and H2O. Almost 2-folds decrease in the
relative yields of methanol, and methacrylic acid due to trans-esterification reactions
between H2O and MMA, compared to P(MMA-co-IBA) may be associated with the
decrease in the MMA composition from 90 % to 70 %, although IBA % increased
from 10 to 15 %. On the other hand, compared to P(MMA-co-BA-co-IBA) the relative
yield of CH3OH is increased about 1.5 folds, when the IBA composition is increased
from 5 to 15%. Another point that should be noticed is the evolution of CH3OH and
CO2 in two distinct regions. The maxima in the evolution profiles of CH3OH are at
370 and 416°C and at 385 and 416°C in the evolution profile of CO2. This behavior
may be attributed to generation of methanol through different mechanisms. The low
temperature evolution may be associated with reactions of acrylic acid generated at
relatively low temperatures upon loss of isobornylene and MMA, while the high
temperature evolutions may be related to transesterification reactions H2O with
MMA yielding again CH3OH. Actually, eliminations of isobornyl and butyl alcohols
are also detected above 400°C, at around 413 and 405°C this temperature range.
Furthermore, although slight, decrease in the relative yields of fragments such as
101 and 70 Da associated with reactions given in Scheme 18 and increase in the
relative yields of fragments such as 189, 249 Da fragments generated through
reactions given in Scheme 16 are noted. This behavior may be associated with the
decrease in composition of MMA in the copolymer from 90 to 70 %.
Thus, it can be concluded that when the IBA percentage increases thermal stability of
the copolymer decreases. Degradation starting with H-transfer reactions from the
isobornyl group to carbonyl group proceeds through several trans-esterification
reactions generating methanol, isobornyl and butyl alcohols.
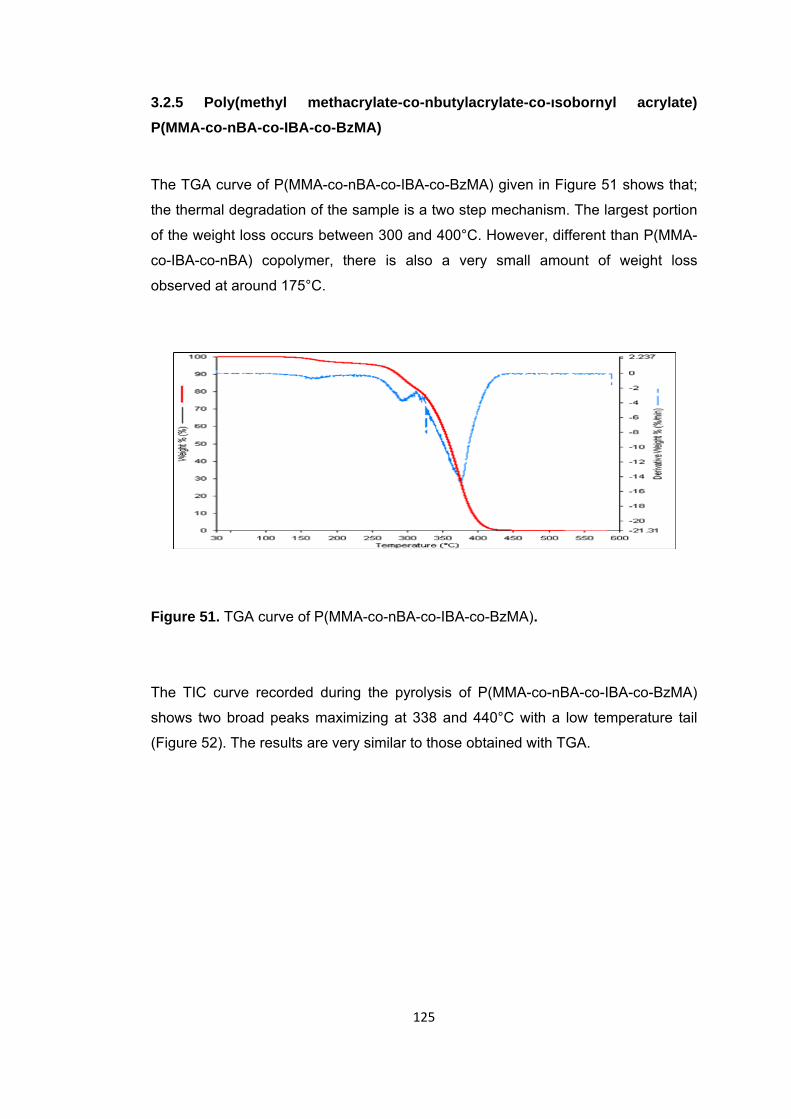
125
3.2.5 Poly(methyl methacrylate-co-nbutylacrylate-co-ısobornyl acrylate) P(MMA-co-nBA-co-IBA-co-BzMA)
The TGA curve of P(MMA-co-nBA-co-IBA-co-BzMA) given in Figure 51 shows that;
the thermal degradation of the sample is a two step mechanism. The largest portion
of the weight loss occurs between 300 and 400°C. However, different than P(MMA-
co-IBA-co-nBA) copolymer, there is also a very small amount of weight loss
observed at around 175°C.
Figure 51. TGA curve of P(MMA-co-nBA-co-IBA-co-BzMA).
The TIC curve recorded during the pyrolysis of P(MMA-co-nBA-co-IBA-co-BzMA)
shows two broad peaks maximizing at 338 and 440°C with a low temperature tail
(Figure 52). The results are very similar to those obtained with TGA.
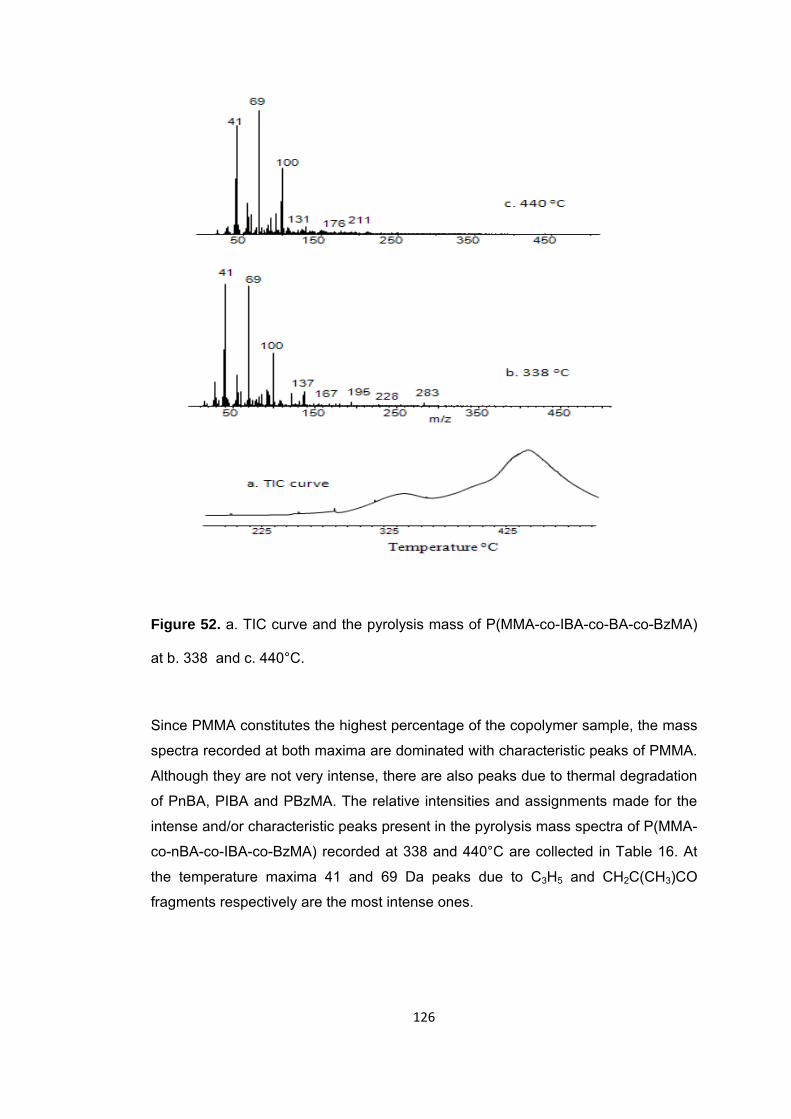
126
Figure 52. a. TIC curve and the pyrolysis mass of P(MMA-co-IBA-co-BA-co-BzMA)
at b. 338 and c. 440°C.
Since PMMA constitutes the highest percentage of the copolymer sample, the mass
spectra recorded at both maxima are dominated with characteristic peaks of PMMA.
Although they are not very intense, there are also peaks due to thermal degradation
of PnBA, PIBA and PBzMA. The relative intensities and assignments made for the
intense and/or characteristic peaks present in the pyrolysis mass spectra of P(MMA-
co-nBA-co-IBA-co-BzMA) recorded at 338 and 440°C are collected in Table 16. At
the temperature maxima 41 and 69 Da peaks due to C3H5 and CH2C(CH3)CO
fragments respectively are the most intense ones.
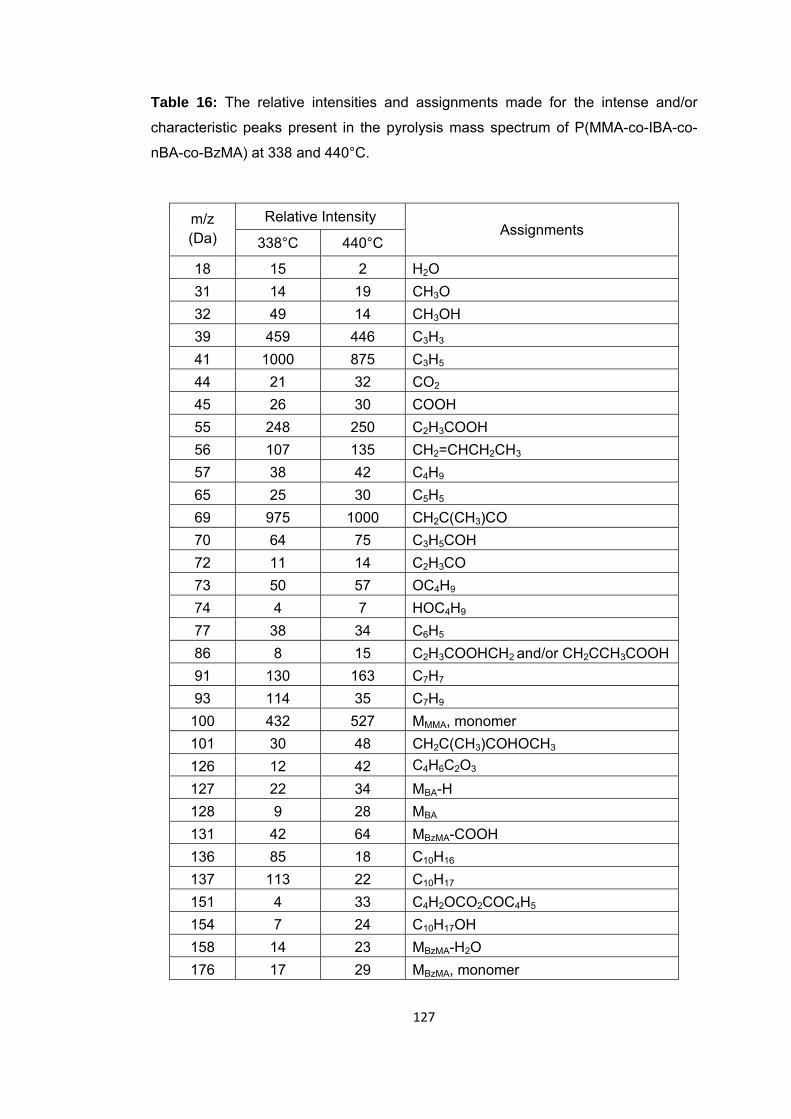
127
Table 16: The relative intensities and assignments made for the intense and/or
characteristic peaks present in the pyrolysis mass spectrum of P(MMA-co-IBA-co-
nBA-co-BzMA) at 338 and 440°C.
m/z (Da)
Relative Intensity Assignments
338°C 440°C
18 15 2 H2O 31 14 19 CH3O 32 49 14 CH3OH 39 459 446 C3H3 41 1000 875 C3H5 44 21 32 CO2 45 26 30 COOH 55 248 250 C2H3COOH 56 107 135 CH2=CHCH2CH3 57 38 42 C4H9 65 25 30 C5H5 69 975 1000 CH2C(CH3)CO 70 64 75 C3H5COH 72 11 14 C2H3CO 73 50 57 OC4H9 74 4 7 HOC4H9 77 38 34 C6H5 86 8 15 C2H3COOHCH2 and/or CH2CCH3COOH 91 130 163 C7H7 93 114 35 C7H9
100 432 527 MMMA, monomer 101 30 48 CH2C(CH3)COHOCH3 126 12 42 C4H6C2O3 127 22 34 MBA-H 128 9 28 MBA 131 42 64 MBzMA-COOH 136 85 18 C10H16 137 113 22 C10H17 151 4 33 C4H2OCO2COC4H5 154 7 24 C10H17OH 158 14 23 MBzMA-H2O 176 17 29 MBzMA, monomer
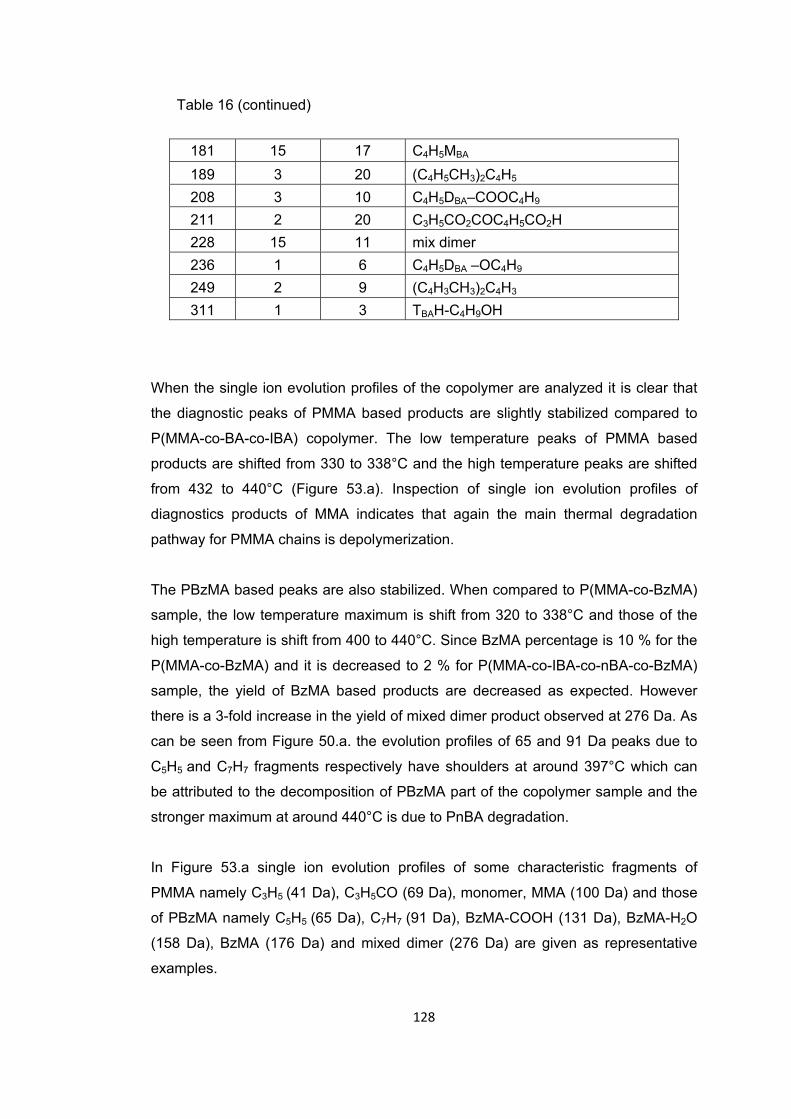
128
Table 16 (continued)
181 15 17 C4H5MBA 189 3 20 (C4H5CH3)2C4H5 208 3 10 C4H5DBA–COOC4H9 211 2 20 C3H5CO2COC4H5CO2H 228 15 11 mix dimer 236 1 6 C4H5DBA –OC4H9 249 2 9 (C4H3CH3)2C4H3 311 1 3 TBAH-C4H9OH
When the single ion evolution profiles of the copolymer are analyzed it is clear that
the diagnostic peaks of PMMA based products are slightly stabilized compared to
P(MMA-co-BA-co-IBA) copolymer. The low temperature peaks of PMMA based
products are shifted from 330 to 338°C and the high temperature peaks are shifted
from 432 to 440°C (Figure 53.a). Inspection of single ion evolution profiles of
diagnostics products of MMA indicates that again the main thermal degradation
pathway for PMMA chains is depolymerization.
The PBzMA based peaks are also stabilized. When compared to P(MMA-co-BzMA)
sample, the low temperature maximum is shift from 320 to 338°C and those of the
high temperature is shift from 400 to 440°C. Since BzMA percentage is 10 % for the
P(MMA-co-BzMA) and it is decreased to 2 % for P(MMA-co-IBA-co-nBA-co-BzMA)
sample, the yield of BzMA based products are decreased as expected. However
there is a 3-fold increase in the yield of mixed dimer product observed at 276 Da. As
can be seen from Figure 50.a. the evolution profiles of 65 and 91 Da peaks due to
C5H5 and C7H7 fragments respectively have shoulders at around 397°C which can
be attributed to the decomposition of PBzMA part of the copolymer sample and the
stronger maximum at around 440°C is due to PnBA degradation.
In Figure 53.a single ion evolution profiles of some characteristic fragments of
PMMA namely C3H5 (41 Da), C3H5CO (69 Da), monomer, MMA (100 Da) and those
of PBzMA namely C5H5 (65 Da), C7H7 (91 Da), BzMA-COOH (131 Da), BzMA-H2O
(158 Da), BzMA (176 Da) and mixed dimer (276 Da) are given as representative
examples.
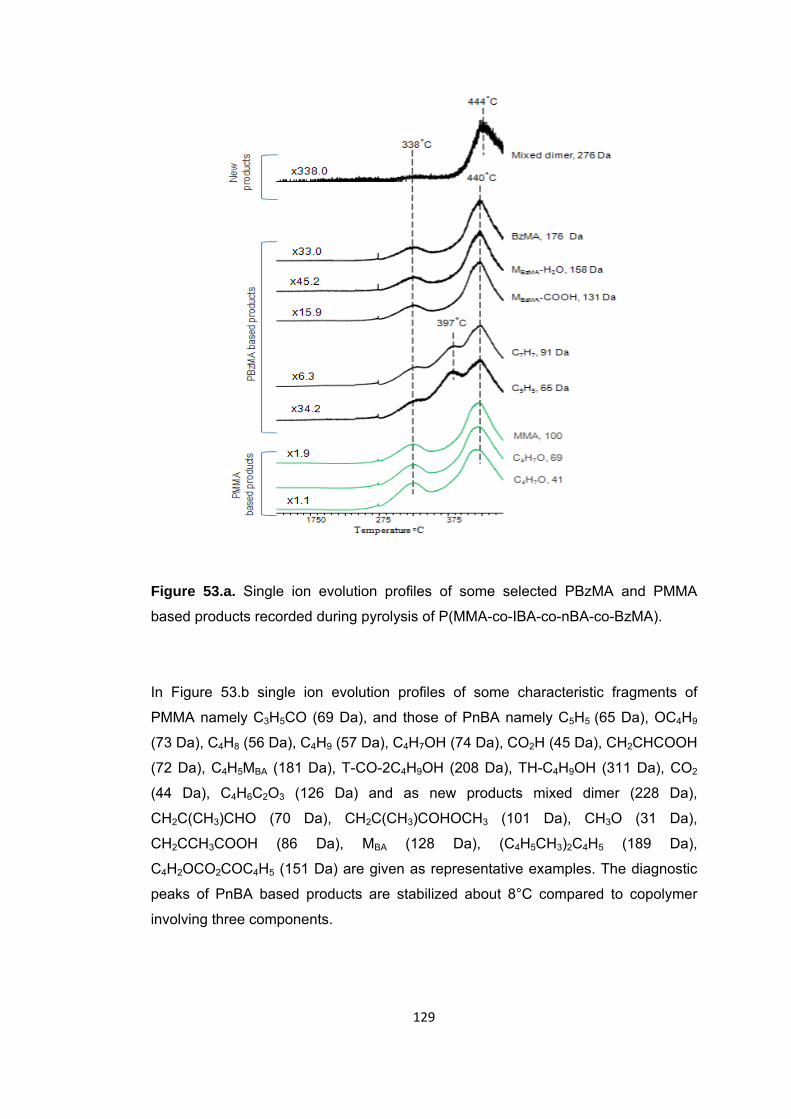
129
Figure 53.a. Single ion evolution profiles of some selected PBzMA and PMMA
based products recorded during pyrolysis of P(MMA-co-IBA-co-nBA-co-BzMA).
In Figure 53.b single ion evolution profiles of some characteristic fragments of
PMMA namely C3H5CO (69 Da), and those of PnBA namely C5H5 (65 Da), OC4H9
(73 Da), C4H8 (56 Da), C4H9 (57 Da), C4H7OH (74 Da), CO2H (45 Da), CH2CHCOOH
(72 Da), C4H5MBA (181 Da), T-CO-2C4H9OH (208 Da), TH-C4H9OH (311 Da), CO2
(44 Da), C4H6C2O3 (126 Da) and as new products mixed dimer (228 Da),
CH2C(CH3)CHO (70 Da), CH2C(CH3)COHOCH3 (101 Da), CH3O (31 Da),
CH2CCH3COOH (86 Da), MBA (128 Da), (C4H5CH3)2C4H5 (189 Da),
C4H2OCO2COC4H5 (151 Da) are given as representative examples. The diagnostic
peaks of PnBA based products are stabilized about 8°C compared to copolymer
involving three components.
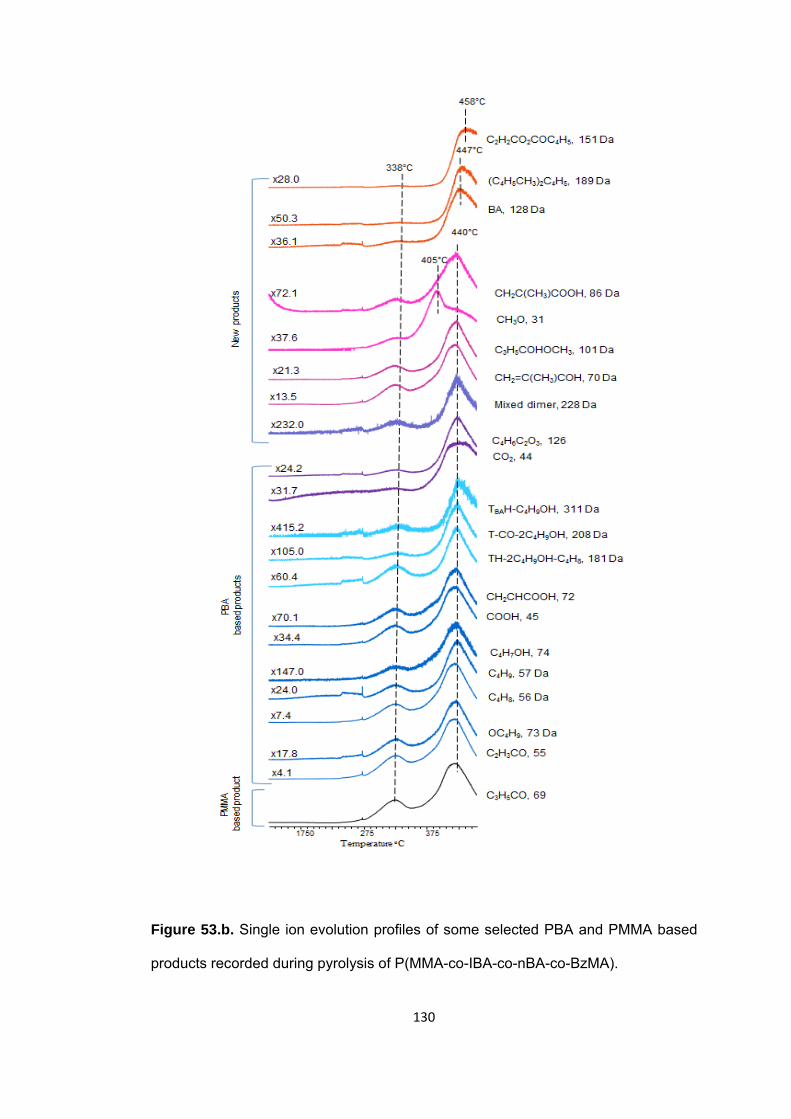
130
Figure 53.b. Single ion evolution profiles of some selected PBA and PMMA based
products recorded during pyrolysis of P(MMA-co-IBA-co-nBA-co-BzMA).
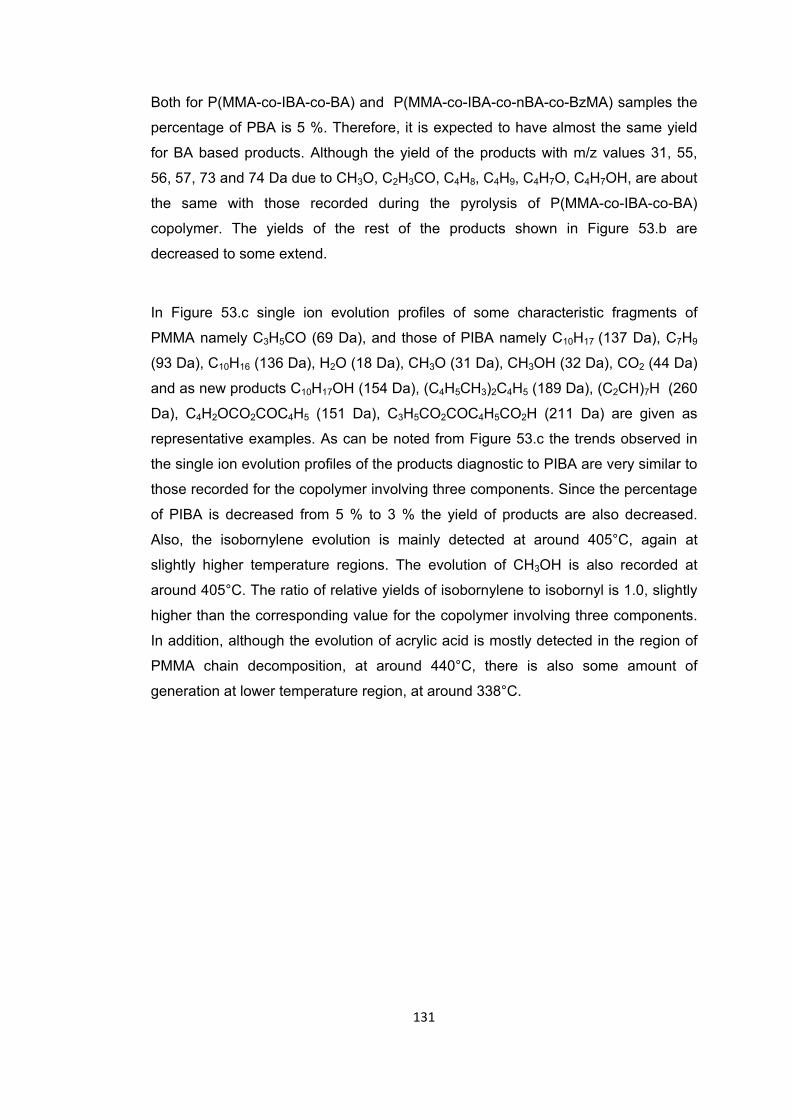
131
Both for P(MMA-co-IBA-co-BA) and P(MMA-co-IBA-co-nBA-co-BzMA) samples the
percentage of PBA is 5 %. Therefore, it is expected to have almost the same yield
for BA based products. Although the yield of the products with m/z values 31, 55,
56, 57, 73 and 74 Da due to CH3O, C2H3CO, C4H8, C4H9, C4H7O, C4H7OH, are about
the same with those recorded during the pyrolysis of P(MMA-co-IBA-co-BA)
copolymer. The yields of the rest of the products shown in Figure 53.b are
decreased to some extend.
In Figure 53.c single ion evolution profiles of some characteristic fragments of
PMMA namely C3H5CO (69 Da), and those of PIBA namely C10H17 (137 Da), C7H9
(93 Da), C10H16 (136 Da), H2O (18 Da), CH3O (31 Da), CH3OH (32 Da), CO2 (44 Da)
and as new products C10H17OH (154 Da), (C4H5CH3)2C4H5 (189 Da), (C2CH)7H (260
Da), C4H2OCO2COC4H5 (151 Da), C3H5CO2COC4H5CO2H (211 Da) are given as
representative examples. As can be noted from Figure 53.c the trends observed in
the single ion evolution profiles of the products diagnostic to PIBA are very similar to
those recorded for the copolymer involving three components. Since the percentage
of PIBA is decreased from 5 % to 3 % the yield of products are also decreased.
Also, the isobornylene evolution is mainly detected at around 405°C, again at
slightly higher temperature regions. The evolution of CH3OH is also recorded at
around 405°C. The ratio of relative yields of isobornylene to isobornyl is 1.0, slightly
higher than the corresponding value for the copolymer involving three components.
In addition, although the evolution of acrylic acid is mostly detected in the region of
PMMA chain decomposition, at around 440°C, there is also some amount of
generation at lower temperature region, at around 338°C.
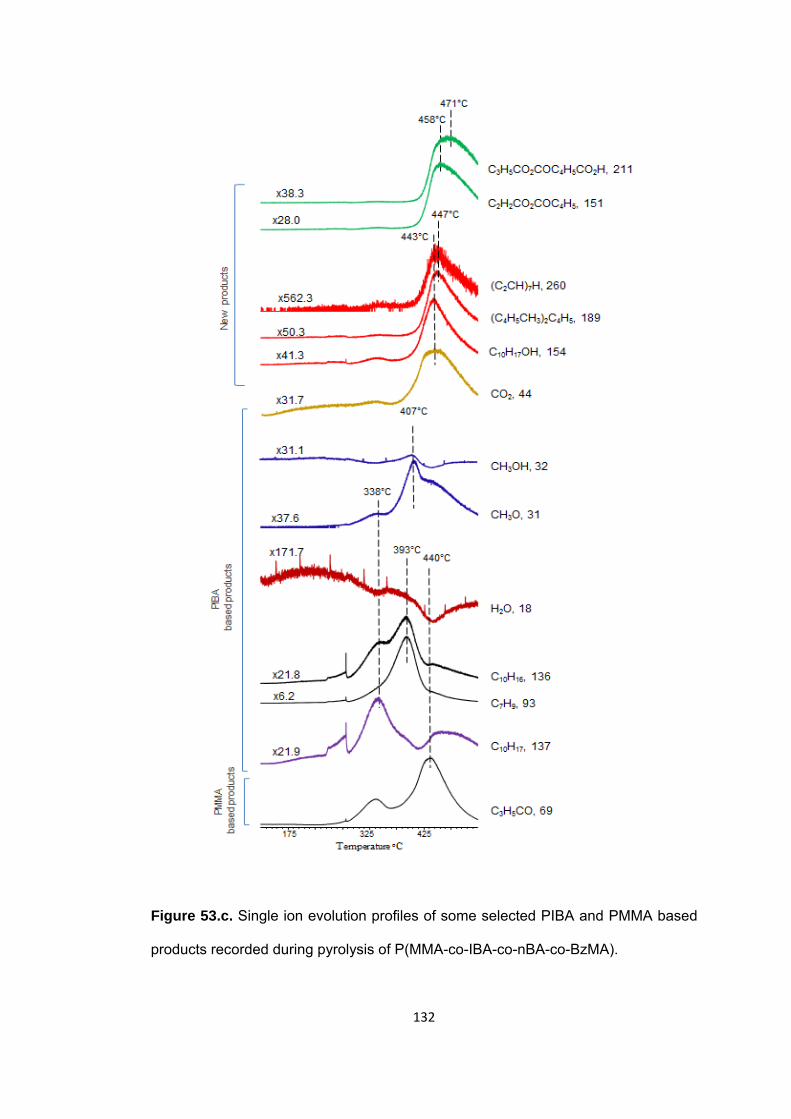
132
Figure 53.c. Single ion evolution profiles of some selected PIBA and PMMA based
products recorded during pyrolysis of P(MMA-co-IBA-co-nBA-co-BzMA).
133
To conclude, the thermal decomposition of IBA is not affected by the addition of
BzMA units as a third component in the copolymer sample. However, the thermal
decomposition of PBA and PMMA shifts to a slightly higher temperature region. The
BzMA units are the most seriously affected by copolymerization of the sample with
PMMA, PBA and PIBA. Although it is used 2 % in the copolymer sample the
maximum of the high temperature peak is shifted about 40°C to higher temperature
region.
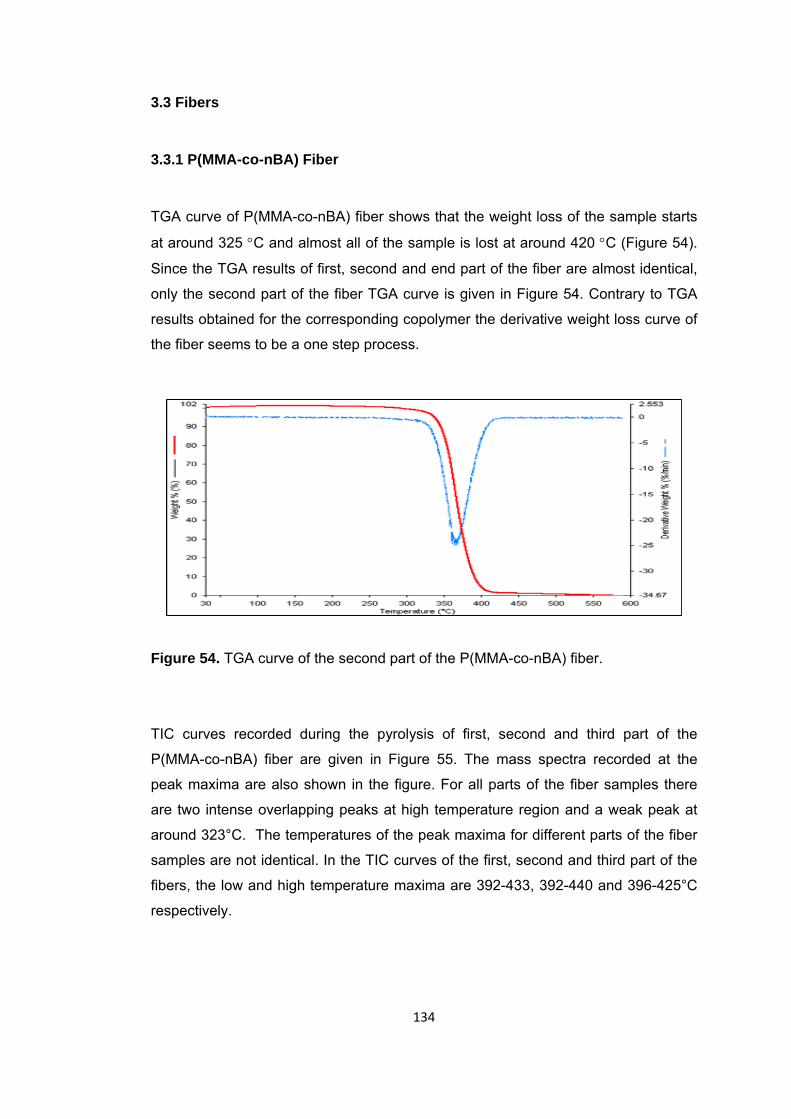
134
3.3 Fibers
3.3.1 P(MMA-co-nBA) Fiber
TGA curve of P(MMA-co-nBA) fiber shows that the weight loss of the sample starts
at around 325 °C and almost all of the sample is lost at around 420 °C (Figure 54).
Since the TGA results of first, second and end part of the fiber are almost identical,
only the second part of the fiber TGA curve is given in Figure 54. Contrary to TGA
results obtained for the corresponding copolymer the derivative weight loss curve of
the fiber seems to be a one step process.
Figure 54. TGA curve of the second part of the P(MMA-co-nBA) fiber.
TIC curves recorded during the pyrolysis of first, second and third part of the
P(MMA-co-nBA) fiber are given in Figure 55. The mass spectra recorded at the
peak maxima are also shown in the figure. For all parts of the fiber samples there
are two intense overlapping peaks at high temperature region and a weak peak at
around 323°C. The temperatures of the peak maxima for different parts of the fiber
samples are not identical. In the TIC curves of the first, second and third part of the
fibers, the low and high temperature maxima are 392-433, 392-440 and 396-425°C
respectively.
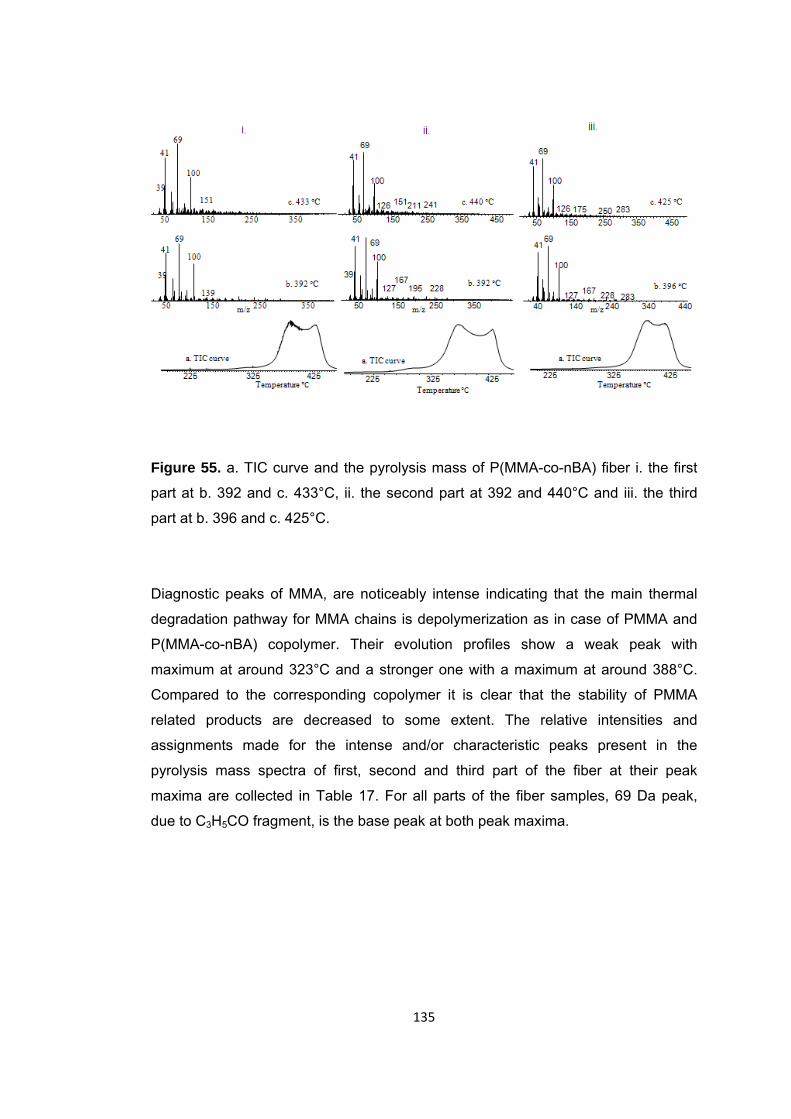
135
Figure 55. a. TIC curve and the pyrolysis mass of P(MMA-co-nBA) fiber i. the first
part at b. 392 and c. 433°C, ii. the second part at 392 and 440°C and iii. the third
part at b. 396 and c. 425°C.
Diagnostic peaks of MMA, are noticeably intense indicating that the main thermal
degradation pathway for MMA chains is depolymerization as in case of PMMA and
P(MMA-co-nBA) copolymer. Their evolution profiles show a weak peak with
maximum at around 323°C and a stronger one with a maximum at around 388°C.
Compared to the corresponding copolymer it is clear that the stability of PMMA
related products are decreased to some extent. The relative intensities and
assignments made for the intense and/or characteristic peaks present in the
pyrolysis mass spectra of first, second and third part of the fiber at their peak
maxima are collected in Table 17. For all parts of the fiber samples, 69 Da peak,
due to C3H5CO fragment, is the base peak at both peak maxima.
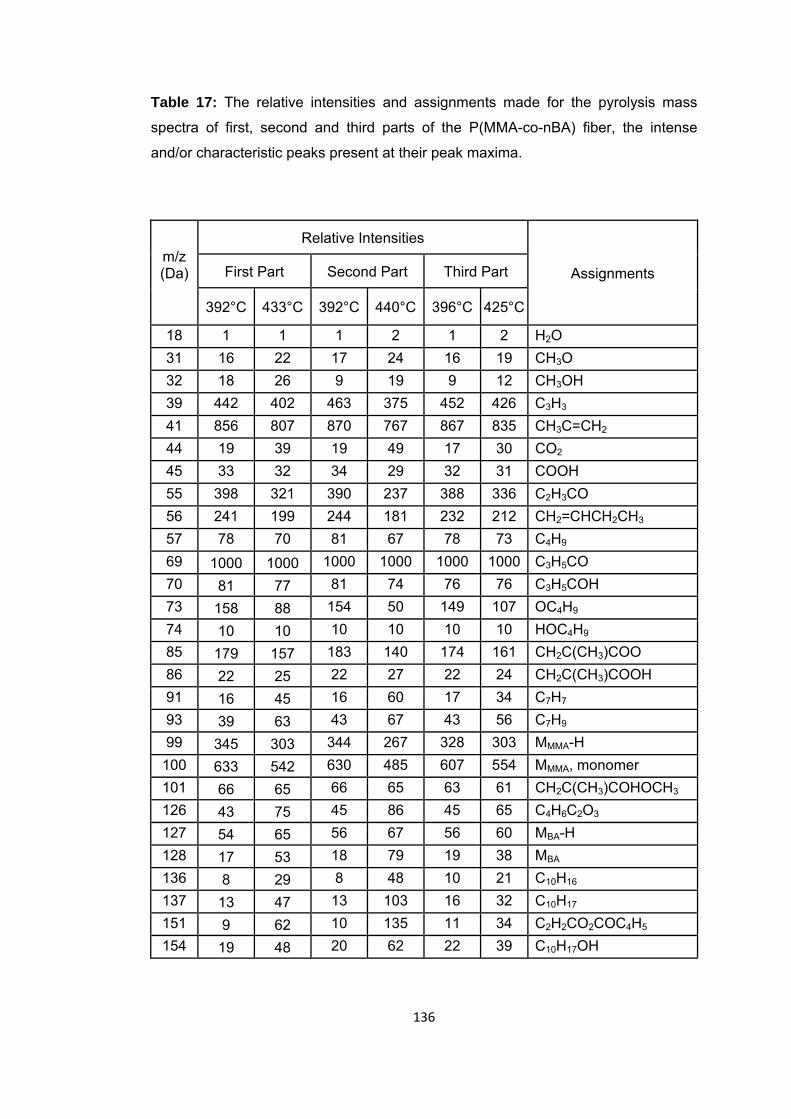
136
Table 17: The relative intensities and assignments made for the pyrolysis mass
spectra of first, second and third parts of the P(MMA-co-nBA) fiber, the intense
and/or characteristic peaks present at their peak maxima.
m/z (Da)
Relative Intensities
Assignments First Part Second Part Third Part
392°C 433°C 392°C 440°C 396°C 425°C
18 1 1 1 2 1 2 H2O 31 16 22 17 24 16 19 CH3O 32 18 26 9 19 9 12 CH3OH 39 442 402 463 375 452 426 C3H3 41 856 807 870 767 867 835 CH3C=CH2 44 19 39 19 49 17 30 CO2 45 33 32 34 29 32 31 COOH 55 398 321 390 237 388 336 C2H3CO 56 241 199 244 181 232 212 CH2=CHCH2CH3 57 78 70 81 67 78 73 C4H9 69 1000 1000 1000 1000 1000 1000 C3H5CO 70 81 77 81 74 76 76 C3H5COH 73 158 88 154 50 149 107 OC4H9 74 10 10 10 10 10 10 HOC4H9 85 179 157 183 140 174 161 CH2C(CH3)COO 86 22 25 22 27 22 24 CH2C(CH3)COOH 91 16 45 16 60 17 34 C7H7 93 39 63 43 67 43 56 C7H9 99 345 303 344 267 328 303 MMMA-H
100 633 542 630 485 607 554 MMMA, monomer 101 66 65 66 65 63 61 CH2C(CH3)COHOCH3 126 43 75 45 86 45 65 C4H6C2O3
127 54 65 56 67 56 60 MBA-H 128 17 53 18 79 19 38 MBA 136 8 29 8 48 10 21 C10H16 137 13 47 13 103 16 32 C10H17 151 9 62 10 135 11 34 C2H2CO2COC4H5 154 19 48 20 62 22 39 C10H17OH
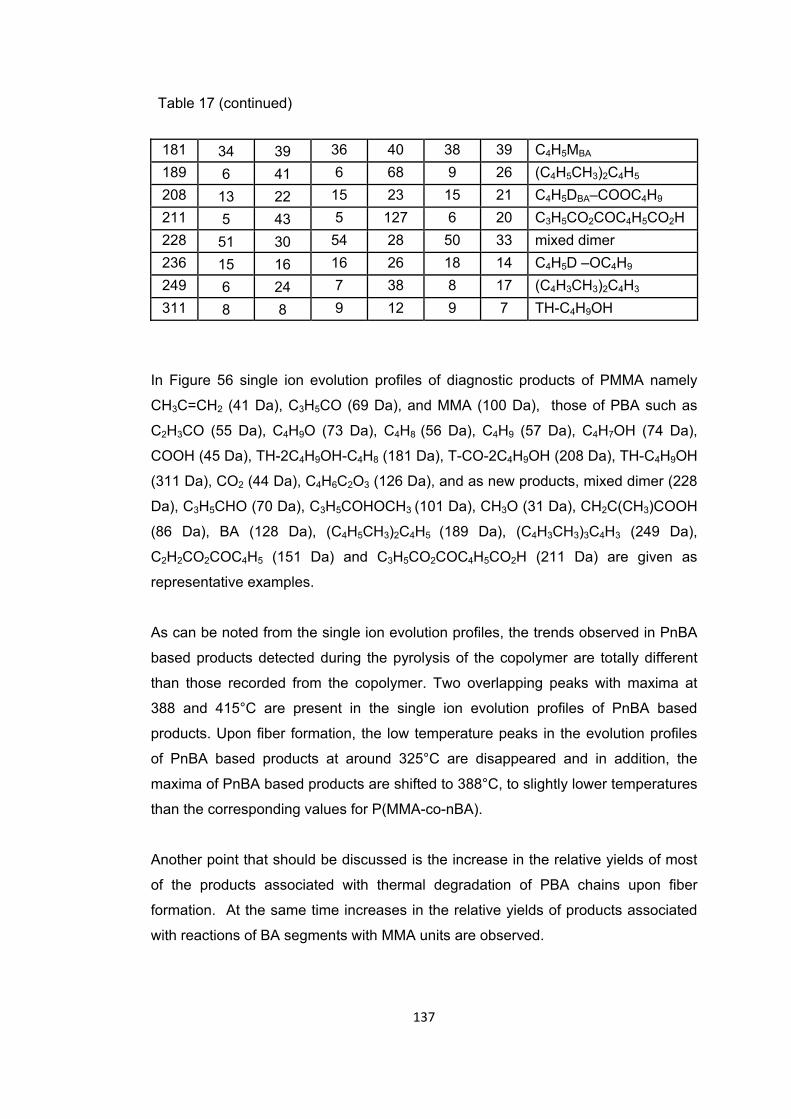
137
Table 17 (continued)
181 34 39 36 40 38 39 C4H5MBA
189 6 41 6 68 9 26 (C4H5CH3)2C4H5 208 13 22 15 23 15 21 C4H5DBA–COOC4H9 211 5 43 5 127 6 20 C3H5CO2COC4H5CO2H228 51 30 54 28 50 33 mixed dimer 236 15 16 16 26 18 14 C4H5D –OC4H9 249 6 24 7 38 8 17 (C4H3CH3)2C4H3 311 8 8 9 12 9 7 TH-C4H9OH
In Figure 56 single ion evolution profiles of diagnostic products of PMMA namely
CH3C=CH2 (41 Da), C3H5CO (69 Da), and MMA (100 Da), those of PBA such as
C2H3CO (55 Da), C4H9O (73 Da), C4H8 (56 Da), C4H9 (57 Da), C4H7OH (74 Da),
COOH (45 Da), TH-2C4H9OH-C4H8 (181 Da), T-CO-2C4H9OH (208 Da), TH-C4H9OH
(311 Da), CO2 (44 Da), C4H6C2O3 (126 Da), and as new products, mixed dimer (228
Da), C3H5CHO (70 Da), C3H5COHOCH3 (101 Da), CH3O (31 Da), CH2C(CH3)COOH
(86 Da), BA (128 Da), (C4H5CH3)2C4H5 (189 Da), (C4H3CH3)3C4H3 (249 Da),
C2H2CO2COC4H5 (151 Da) and C3H5CO2COC4H5CO2H (211 Da) are given as
representative examples.
As can be noted from the single ion evolution profiles, the trends observed in PnBA
based products detected during the pyrolysis of the copolymer are totally different
than those recorded from the copolymer. Two overlapping peaks with maxima at
388 and 415°C are present in the single ion evolution profiles of PnBA based
products. Upon fiber formation, the low temperature peaks in the evolution profiles
of PnBA based products at around 325°C are disappeared and in addition, the
maxima of PnBA based products are shifted to 388°C, to slightly lower temperatures
than the corresponding values for P(MMA-co-nBA).
Another point that should be discussed is the increase in the relative yields of most
of the products associated with thermal degradation of PBA chains upon fiber
formation. At the same time increases in the relative yields of products associated
with reactions of BA segments with MMA units are observed.
138
Thus, it may be concluded that the extent of reactions among BA and MMA chains
are enhanced upon fiber formation. Since after fiber formation the polymer chains
become more aligned and closely packed so the interaction between the molecules
are also increased.
The single ion evolution profiles of products, COOH (45 Da) and C4H8 (56 Da)
generated by McLafferty type rearrangement reactions involving γ-H transfer from
the butyl groups to CO groups of PBA show two overlapping peaks, with maximum
at 388°C and a shoulder at around 442°C. Compared to the corresponding
copolymer, the increase in the yield of C4H8 (56 Da) and COOH (45 Da) is about 1.4
and 1.1-folds respectively. In addition, the yield of the products due to
CH2CHCOOCH3 (86 Da) and OCH3 (31 Da) fragments, obtained as a result of
degradation of the segments generated by the trans-esterification reaction between
acrylic acid and methyl methacrylate units are 1.4 and 1.1-fold increased compared
to those of the copolymer.
C4H7OH and CO2 show maxima at 388 and at 446°C in their evolution profiles
respectively. For the P(MMA-co-nBA) copolymer sample the corresponding values
are 370 and 385°C respectively. This behavior may be associated with higher
thermal stability of the fiber compared to the copolymer.
The maxima of the products with m/z values 181, 208, 311 Da due to TH-2C4H9OH-
C4H8, T-CO-2C4H9OH and TH-C4H9OH fragments are shifted about 26°C to lower
temperature ranges. In addition, the relative yields of these fragments are increased
2.7, 2.3 and 8.0-folds compared to those of the copolymer.
As in case of copolymer, evolution of H2O is not observed but the production of CO2
and the fragments that can be associated with anhydride units such as C4H6C2O3
(126 Da) are observed. The single ion evolution profile of 126 Da fragment shows
two peaks with maxima at around 399 and 422°C, while those of the copolymer
sample shows a single broad peak with a maximum at around 434°C. The yield of
the 126 Da fragment is increased about 1.4-fold compared to those of the copolymer
which can be attributed to the increase in the anhydride production upon fiber
formation.
139
The relative yields of the CH2C(CH3)CO2COCHCH2C(CO2H)CH2 (211 Da) and
CH2CCO2COCHCH2CCH2 (151 Da) fragments generated as a consequence of
transesterification reactions between MMA and acrylic acid units are increased
about 6.7 and 4.1-folds respectively . The evolution profiles of these products show
the same maxima with those of the copolymer.
Also the maxima observed at around 442°C in the single ion evolution profiles of
(C4H5CH3)2C4H5 (189 Da), (C4H3CH3)3C4H3 (249 Da) fragments are very close to the
corresponding values of the copolymer. The yield of these fragments is also
increase about 3-folds.
The yield of the products obtained due to CH2C(CH3)CHO (70 Da) and
CH2C(CH3)COHOCH3 (101 Da) fragments are about same with those of the
copolymer. Therefore, it can be said that, the γ-H transfer to the carbonyl groups of
MMA from the adjacent BA units is not affected by fiber formation.
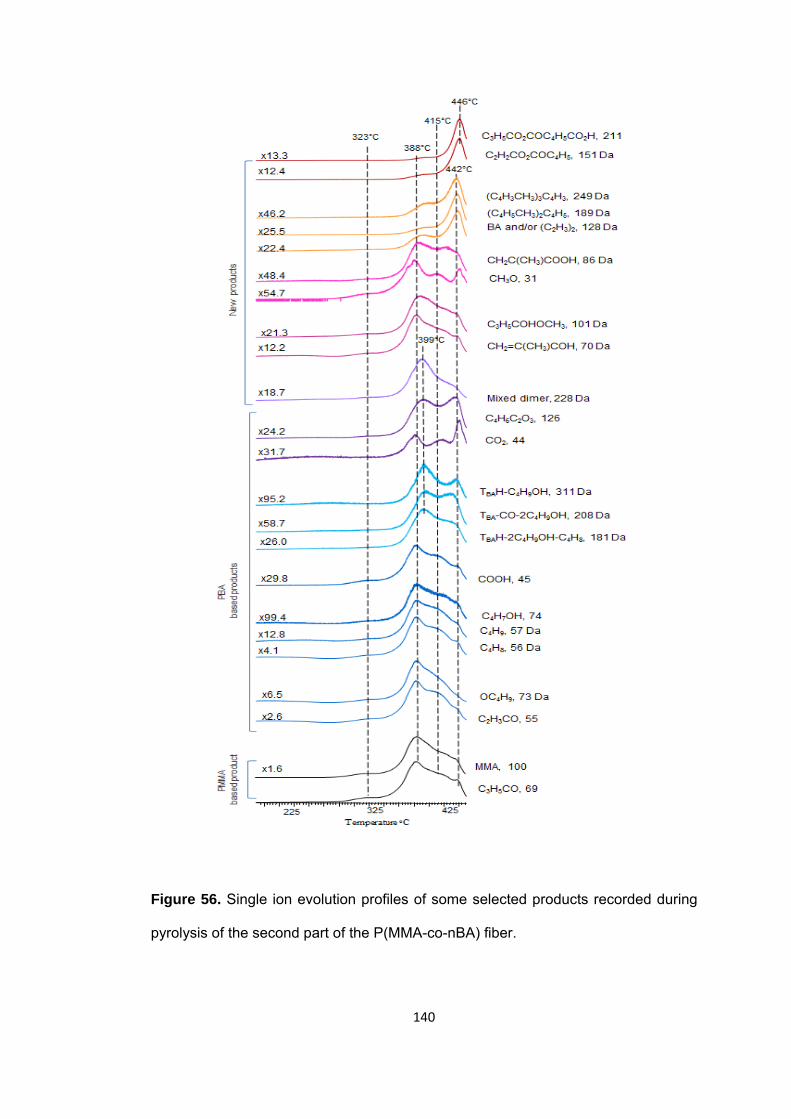
140
Figure 56. Single ion evolution profiles of some selected products recorded during
pyrolysis of the second part of the P(MMA-co-nBA) fiber.
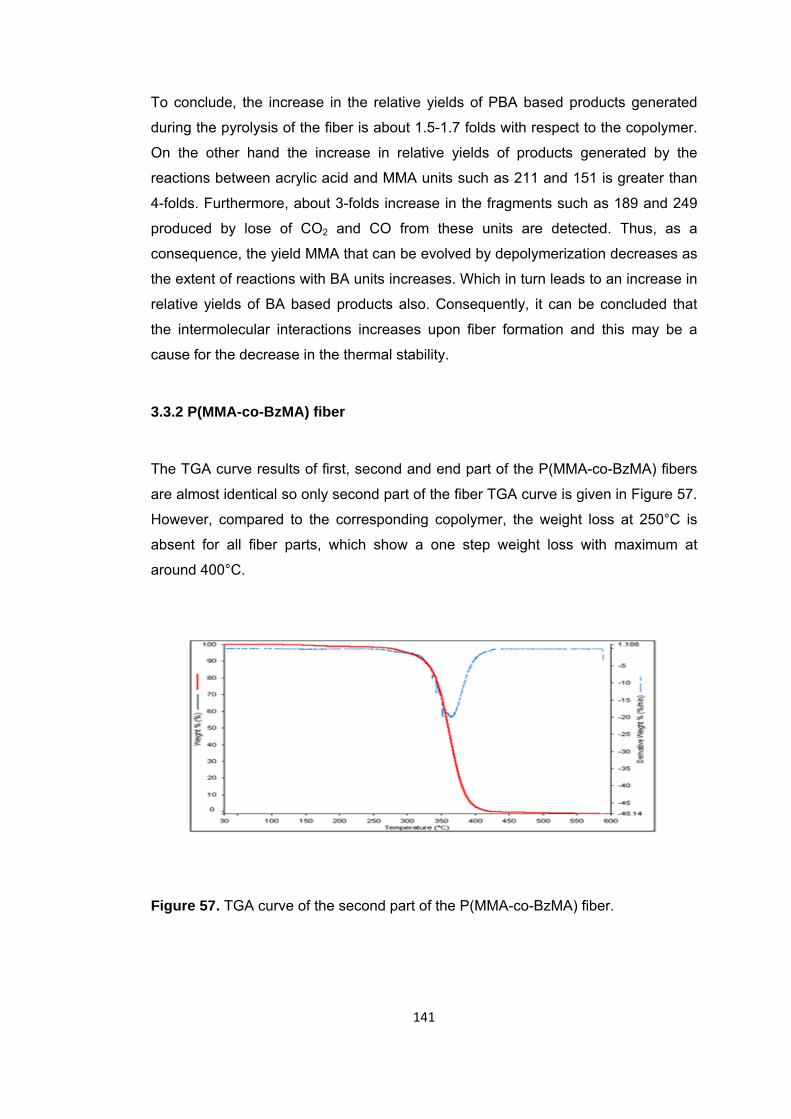
141
To conclude, the increase in the relative yields of PBA based products generated
during the pyrolysis of the fiber is about 1.5-1.7 folds with respect to the copolymer.
On the other hand the increase in relative yields of products generated by the
reactions between acrylic acid and MMA units such as 211 and 151 is greater than
4-folds. Furthermore, about 3-folds increase in the fragments such as 189 and 249
produced by lose of CO2 and CO from these units are detected. Thus, as a
consequence, the yield MMA that can be evolved by depolymerization decreases as
the extent of reactions with BA units increases. Which in turn leads to an increase in
relative yields of BA based products also. Consequently, it can be concluded that
the intermolecular interactions increases upon fiber formation and this may be a
cause for the decrease in the thermal stability.
3.3.2 P(MMA-co-BzMA) fiber
The TGA curve results of first, second and end part of the P(MMA-co-BzMA) fibers
are almost identical so only second part of the fiber TGA curve is given in Figure 57.
However, compared to the corresponding copolymer, the weight loss at 250°C is
absent for all fiber parts, which show a one step weight loss with maximum at
around 400°C.
Figure 57. TGA curve of the second part of the P(MMA-co-BzMA) fiber.
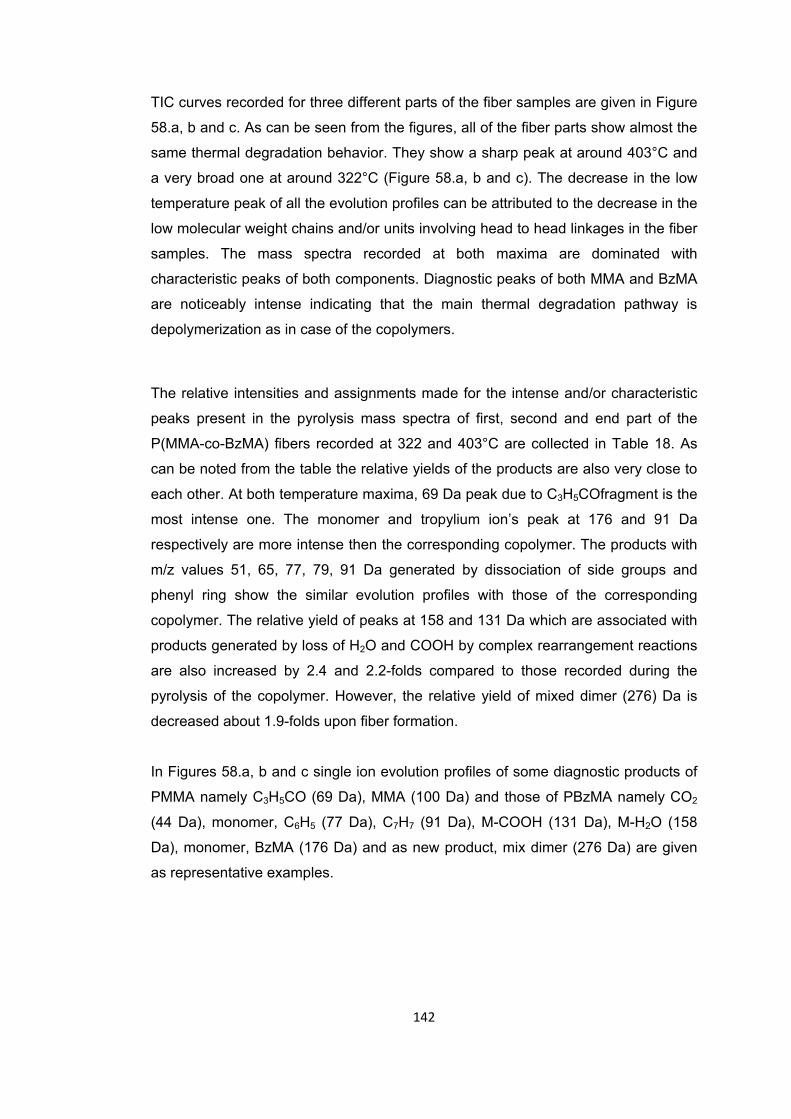
142
TIC curves recorded for three different parts of the fiber samples are given in Figure
58.a, b and c. As can be seen from the figures, all of the fiber parts show almost the
same thermal degradation behavior. They show a sharp peak at around 403°C and
a very broad one at around 322°C (Figure 58.a, b and c). The decrease in the low
temperature peak of all the evolution profiles can be attributed to the decrease in the
low molecular weight chains and/or units involving head to head linkages in the fiber
samples. The mass spectra recorded at both maxima are dominated with
characteristic peaks of both components. Diagnostic peaks of both MMA and BzMA
are noticeably intense indicating that the main thermal degradation pathway is
depolymerization as in case of the copolymers.
The relative intensities and assignments made for the intense and/or characteristic
peaks present in the pyrolysis mass spectra of first, second and end part of the
P(MMA-co-BzMA) fibers recorded at 322 and 403°C are collected in Table 18. As
can be noted from the table the relative yields of the products are also very close to
each other. At both temperature maxima, 69 Da peak due to C3H5COfragment is the
most intense one. The monomer and tropylium ion’s peak at 176 and 91 Da
respectively are more intense then the corresponding copolymer. The products with
m/z values 51, 65, 77, 79, 91 Da generated by dissociation of side groups and
phenyl ring show the similar evolution profiles with those of the corresponding
copolymer. The relative yield of peaks at 158 and 131 Da which are associated with
products generated by loss of H2O and COOH by complex rearrangement reactions
are also increased by 2.4 and 2.2-folds compared to those recorded during the
pyrolysis of the copolymer. However, the relative yield of mixed dimer (276) Da is
decreased about 1.9-folds upon fiber formation.
In Figures 58.a, b and c single ion evolution profiles of some diagnostic products of
PMMA namely C3H5CO (69 Da), MMA (100 Da) and those of PBzMA namely CO2
(44 Da), monomer, C6H5 (77 Da), C7H7 (91 Da), M-COOH (131 Da), M-H2O (158
Da), monomer, BzMA (176 Da) and as new product, mix dimer (276 Da) are given
as representative examples.
143
Figure 58.a TIC curve and single ion evolution profiles of some selected products
recorded during pyrolysis of the first part of the P(MMA-co-BzMA) fiber.
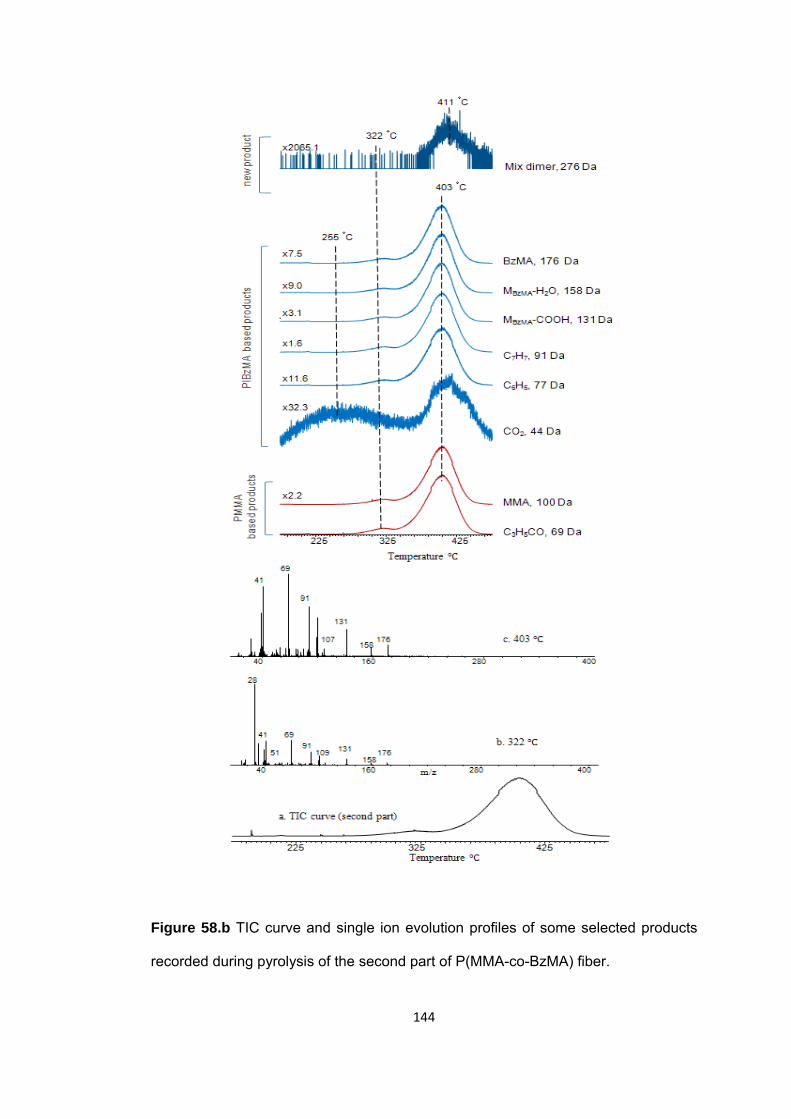
144
Figure 58.b TIC curve and single ion evolution profiles of some selected products
recorded during pyrolysis of the second part of P(MMA-co-BzMA) fiber.
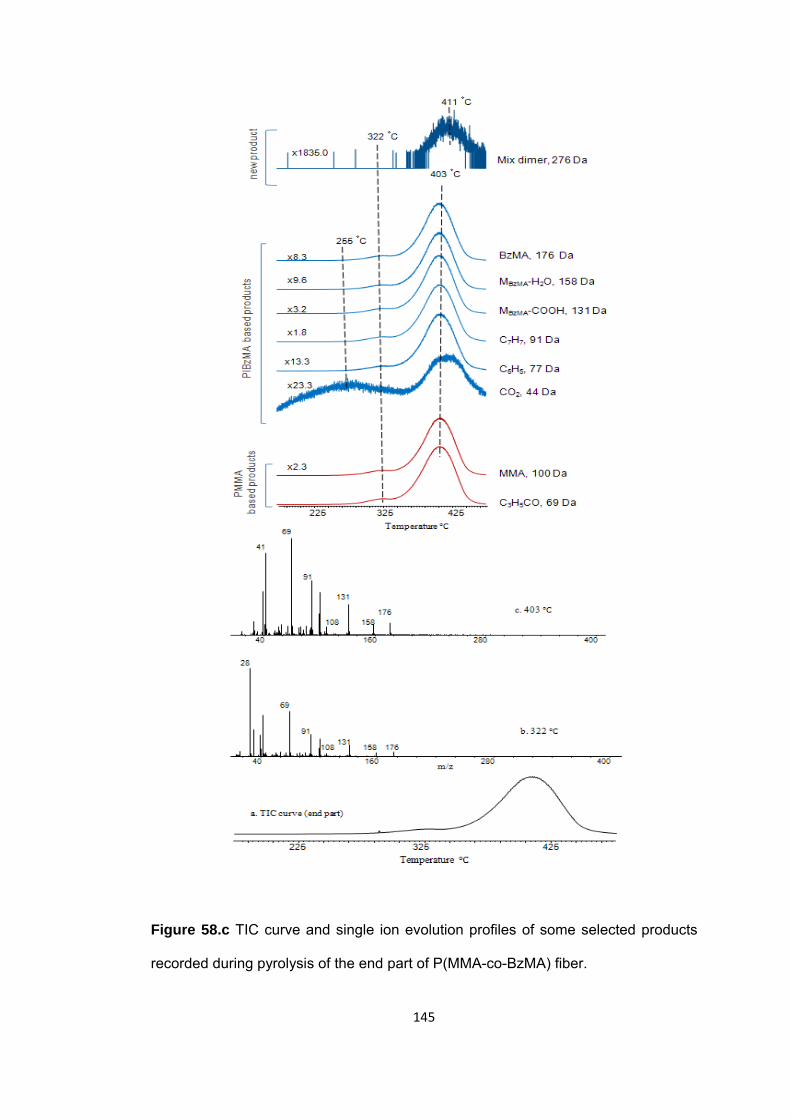
145
Figure 58.c TIC curve and single ion evolution profiles of some selected products
recorded during pyrolysis of the end part of P(MMA-co-BzMA) fiber.
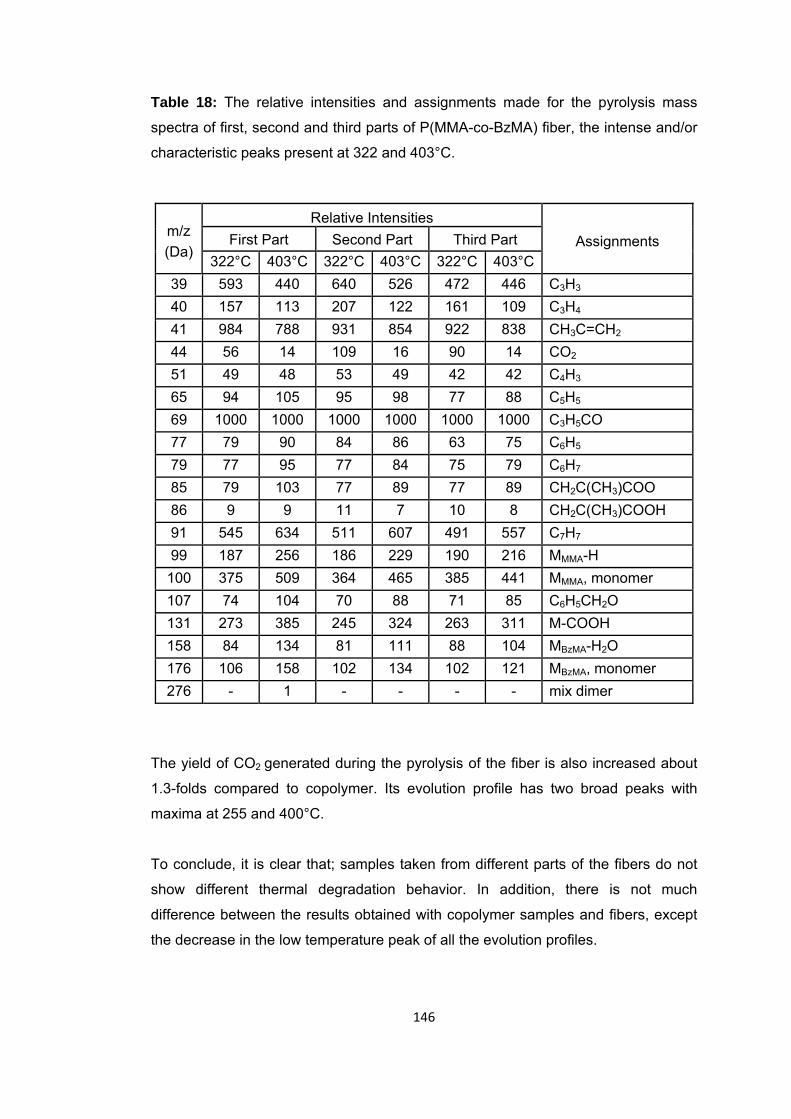
146
Table 18: The relative intensities and assignments made for the pyrolysis mass
spectra of first, second and third parts of P(MMA-co-BzMA) fiber, the intense and/or
characteristic peaks present at 322 and 403°C.
m/z (Da)
Relative Intensities Assignments First Part Second Part Third Part
322°C 403°C 322°C 403°C 322°C 403°C39 593 440 640 526 472 446 C3H3 40 157 113 207 122 161 109 C3H4 41 984 788 931 854 922 838 CH3C=CH2 44 56 14 109 16 90 14 CO2 51 49 48 53 49 42 42 C4H3 65 94 105 95 98 77 88 C5H5 69 1000 1000 1000 1000 1000 1000 C3H5CO 77 79 90 84 86 63 75 C6H5 79 77 95 77 84 75 79 C6H7 85 79 103 77 89 77 89 CH2C(CH3)COO 86 9 9 11 7 10 8 CH2C(CH3)COOH 91 545 634 511 607 491 557 C7H7 99 187 256 186 229 190 216 MMMA-H
100 375 509 364 465 385 441 MMMA, monomer 107 74 104 70 88 71 85 C6H5CH2O 131 273 385 245 324 263 311 M-COOH 158 84 134 81 111 88 104 MBzMA-H2O 176 106 158 102 134 102 121 MBzMA, monomer 276 - 1 - - - - mix dimer
The yield of CO2 generated during the pyrolysis of the fiber is also increased about
1.3-folds compared to copolymer. Its evolution profile has two broad peaks with
maxima at 255 and 400°C.
To conclude, it is clear that; samples taken from different parts of the fibers do not
show different thermal degradation behavior. In addition, there is not much
difference between the results obtained with copolymer samples and fibers, except
the decrease in the low temperature peak of all the evolution profiles.
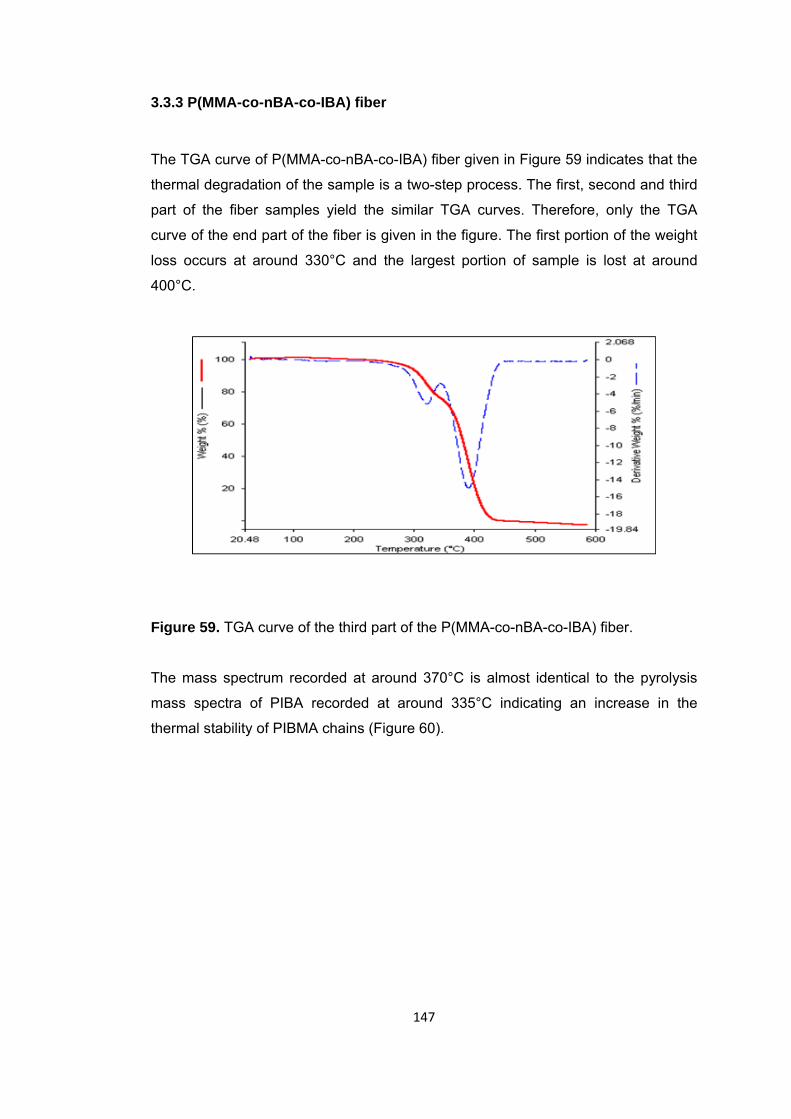
147
3.3.3 P(MMA-co-nBA-co-IBA) fiber
The TGA curve of P(MMA-co-nBA-co-IBA) fiber given in Figure 59 indicates that the
thermal degradation of the sample is a two-step process. The first, second and third
part of the fiber samples yield the similar TGA curves. Therefore, only the TGA
curve of the end part of the fiber is given in the figure. The first portion of the weight
loss occurs at around 330°C and the largest portion of sample is lost at around
400°C.
Figure 59. TGA curve of the third part of the P(MMA-co-nBA-co-IBA) fiber.
The mass spectrum recorded at around 370°C is almost identical to the pyrolysis
mass spectra of PIBA recorded at around 335°C indicating an increase in the
thermal stability of PIBMA chains (Figure 60).
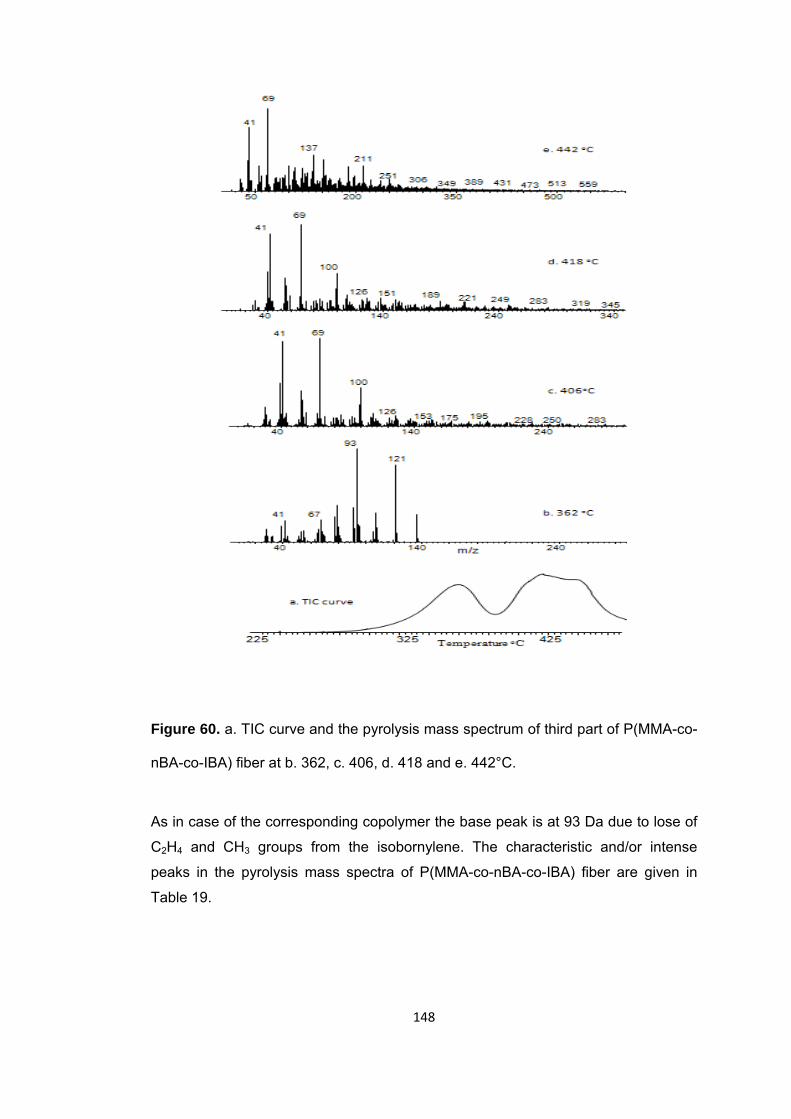
148
Figure 60. a. TIC curve and the pyrolysis mass spectrum of third part of P(MMA-co-
nBA-co-IBA) fiber at b. 362, c. 406, d. 418 and e. 442°C.
As in case of the corresponding copolymer the base peak is at 93 Da due to lose of
C2H4 and CH3 groups from the isobornylene. The characteristic and/or intense
peaks in the pyrolysis mass spectra of P(MMA-co-nBA-co-IBA) fiber are given in
Table 19.
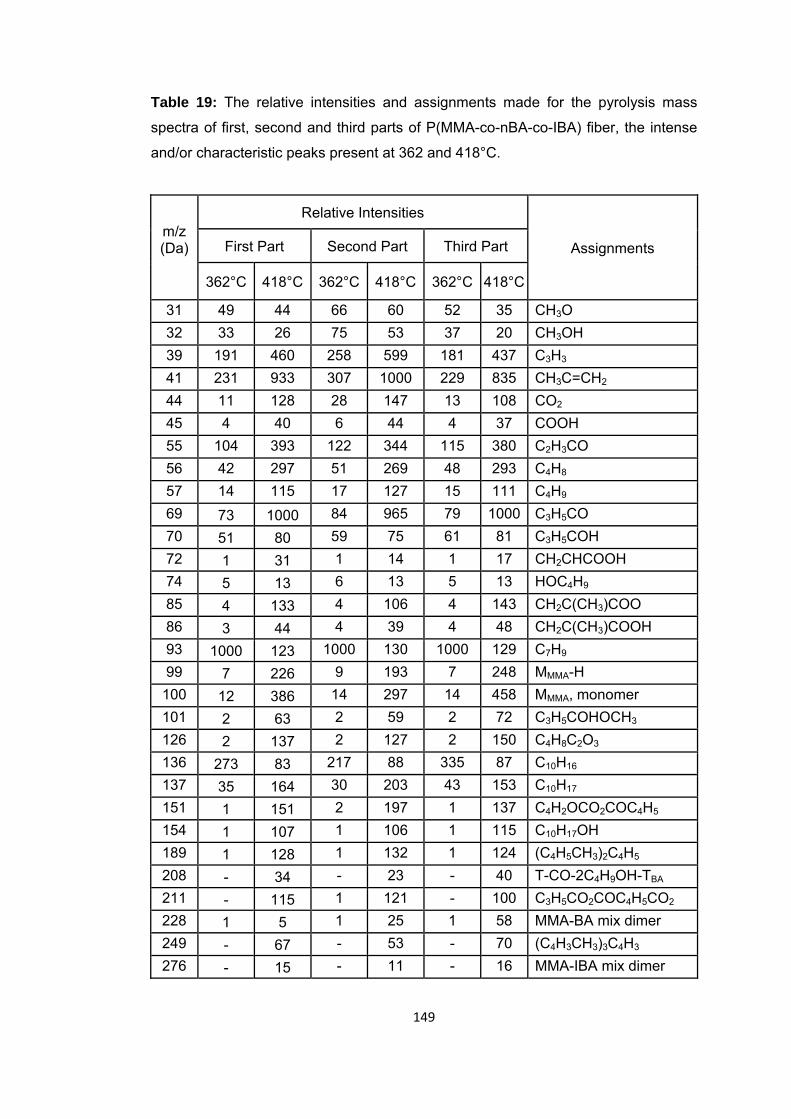
149
Table 19: The relative intensities and assignments made for the pyrolysis mass
spectra of first, second and third parts of P(MMA-co-nBA-co-IBA) fiber, the intense
and/or characteristic peaks present at 362 and 418°C.
m/z (Da)
Relative Intensities
Assignments First Part Second Part Third Part
362°C 418°C 362°C 418°C 362°C 418°C
31 49 44 66 60 52 35 CH3O 32 33 26 75 53 37 20 CH3OH 39 191 460 258 599 181 437 C3H3 41 231 933 307 1000 229 835 CH3C=CH2 44 11 128 28 147 13 108 CO2 45 4 40 6 44 4 37 COOH 55 104 393 122 344 115 380 C2H3CO 56 42 297 51 269 48 293 C4H8 57 14 115 17 127 15 111 C4H9 69 73 1000 84 965 79 1000 C3H5CO 70 51 80 59 75 61 81 C3H5COH 72 1 31 1 14 1 17 CH2CHCOOH 74 5 13 6 13 5 13 HOC4H9 85 4 133 4 106 4 143 CH2C(CH3)COO 86 3 44 4 39 4 48 CH2C(CH3)COOH 93 1000 123 1000 130 1000 129 C7H9 99 7 226 9 193 7 248 MMMA-H
100 12 386 14 297 14 458 MMMA, monomer 101 2 63 2 59 2 72 C3H5COHOCH3 126 2 137 2 127 2 150 C4H8C2O3 136 273 83 217 88 335 87 C10H16 137 35 164 30 203 43 153 C10H17 151 1 151 2 197 1 137 C4H2OCO2COC4H5 154 1 107 1 106 1 115 C10H17OH 189 1 128 1 132 1 124 (C4H5CH3)2C4H5 208 - 34 - 23 - 40 T-CO-2C4H9OH-TBA 211 - 115 1 121 - 100 C3H5CO2COC4H5CO2 228 1 5 1 25 1 58 MMA-BA mix dimer 249 - 67 - 53 - 70 (C4H3CH3)3C4H3 276 - 15 - 11 - 16 MMA-IBA mix dimer
150
In Figure 61.a single ion evolution profiles of some characteristic fragments of
PMMA namely C3H5 (41 Da), C3H5CO (69 Da), monomer, MMA (100 Da) and those
of PIBA namely C10H17 (137 Da), C7H9 (93 Da), C10H16 (136 Da), CH2CHCOOH (72
Da), H2O (18 Da), C4H6C2O3 (126 Da), CO2 (44 Da) and as new products CH3O (31
Da), CH3OH (32 Da), COOH (45 Da), CH2CCH3CO2H (86 Da), C10H17OH (154 Da),
C3H5CHO (70 Da), C3H5COHOCH3 (101 Da), (C4H5CH3)2C4H5 (189 Da),
(C4H3CH3)3C4H3 (249 Da), C2H2CO2COC4H5 (151 Da) and C3H5CO2COC4H5CO2H
(211 Da) are given as representative examples.
In Figure 61.b single ion evolution profiles of some characteristic fragments of
PMMA namely C3H5CO (69 Da), and those of PnBA namely C2H3CO (55 Da),
C4H9O (73 Da), C4H8 (56 Da), C4H9 (57 Da), C4H7OH (74 Da), CO2H (45 Da),
CH2CHCOOH (72 Da), TH-2C4H9OH-C4H8 (181 Da), T-CO-2C4H9OH (208 Da), TH-
C4H9OH (311 Da), CO2 (44 Da), C4H6C2O3 (126 Da) and as new products MMA-BA
mixed dimer (228 Da), CH2C(CH3)CHO (70 Da), CH2C(CH3)COHOCH3 (101 Da),
CH3O (31 Da), CH2CCH3COOH (86 Da), MBA (128 Da), (C4H5CH3)2C4H5 (189 Da),
C2H2CO2COC4H5 (151 Da) are given as representative examples.
In general, upon fiber formation, the single ion evolution profiles of almost all
characteristic products of P(MMA-co-nBA-co-IBA) are sharpened and shifted to
higher temperatures (Figure 61.a-b). The trends observed in the single ion evolution
profiles of PMMA based products recorded during the pyrolysis of the fiber show
small changes compared to those observed during the pyrolysis of all copolymers
under investigation. Upon fiber formation, the low temperature peaks in the evolution
profiles of PMMA based products at around 325°C are again disappeared as in case
of P(MMA-co-nBA).
The peak maxima in the single ion pyrograms of PMMA based products are at
415°C as in case of P(MMA-co-IBA), and are about 10°C higher than the
corresponding copolymer. Fragments due to the pyrolysis of IBA segments are
maximized at around 365°C, indicating also a slight increase in thermal stability with
fiber formation.
151
On the other hand, PBA based products are also maximized at around 420°C, at
slightly higher temperature than the corresponding copolymer during the pyrolysis of
the fiber. Another point that should be noticed is the slight increase in the relative
yields of products associated with thermal degradation of PBA chains upon fiber
formation. As at the same time increases in relative yields of products associated
with reactions of BA segments with MMA units are observed it mat be concluded
that the extent of reactions among BA and MMA chains are enhanced upon fiber
formation.
CH3OH and CO2 show maxima at 382 and 394°C respectively, in their evolution
profiles. The corresponding values are at 370 and 385°C respectively, for the
corresponding copolymer. The second, high temperature peak in the evolution
profiles of CH3OH is disappeared. On the other hand, the high temperature peak in
the evolution profile of CO2 is shifted to 443°C from 416°C. This behavior may be
associated with higher thermal stability of the fiber compared to the copolymer.
Similarly, the evolution of isobornyl alcohol is maximized at around 420°C, slightly
higher temperatures than the corresponding copolymer. In addition, the evolution of
butanol is also shifted about 15°C to high temperature ranges. Thus, it can be
concluded that upon fiber formation the thermal degradation shifts slightly higher
temperatures.
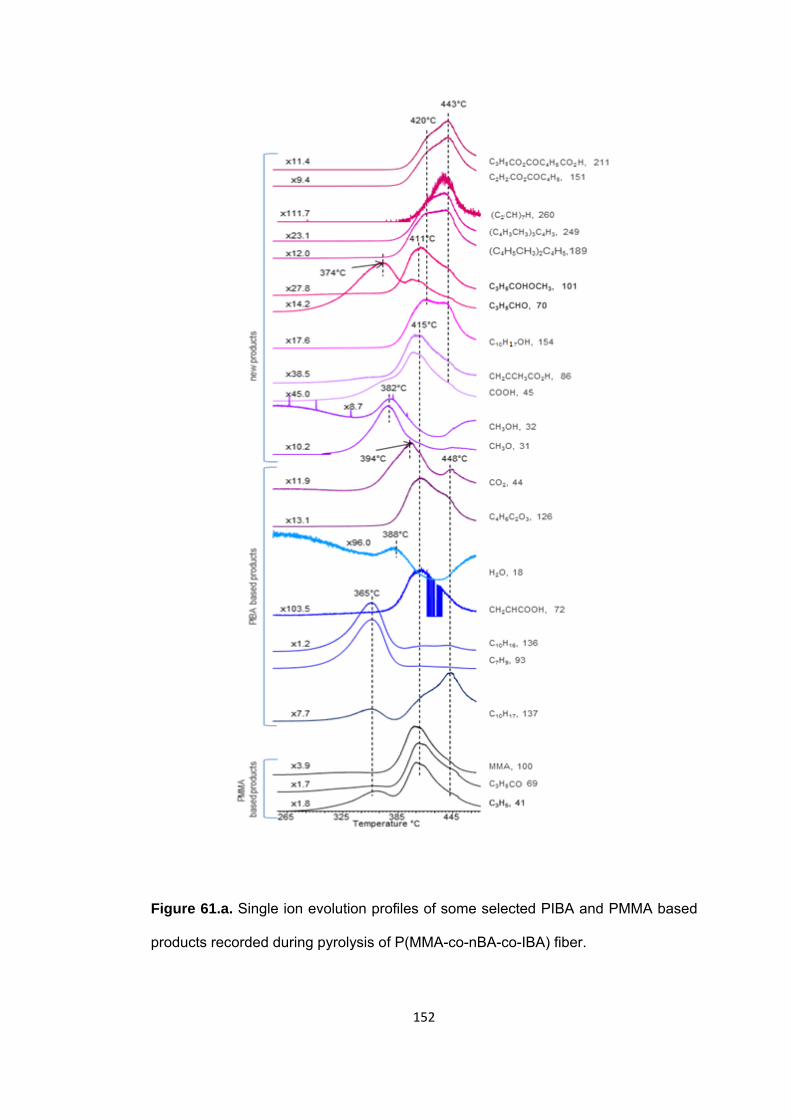
152
Figure 61.a. Single ion evolution profiles of some selected PIBA and PMMA based
products recorded during pyrolysis of P(MMA-co-nBA-co-IBA) fiber.
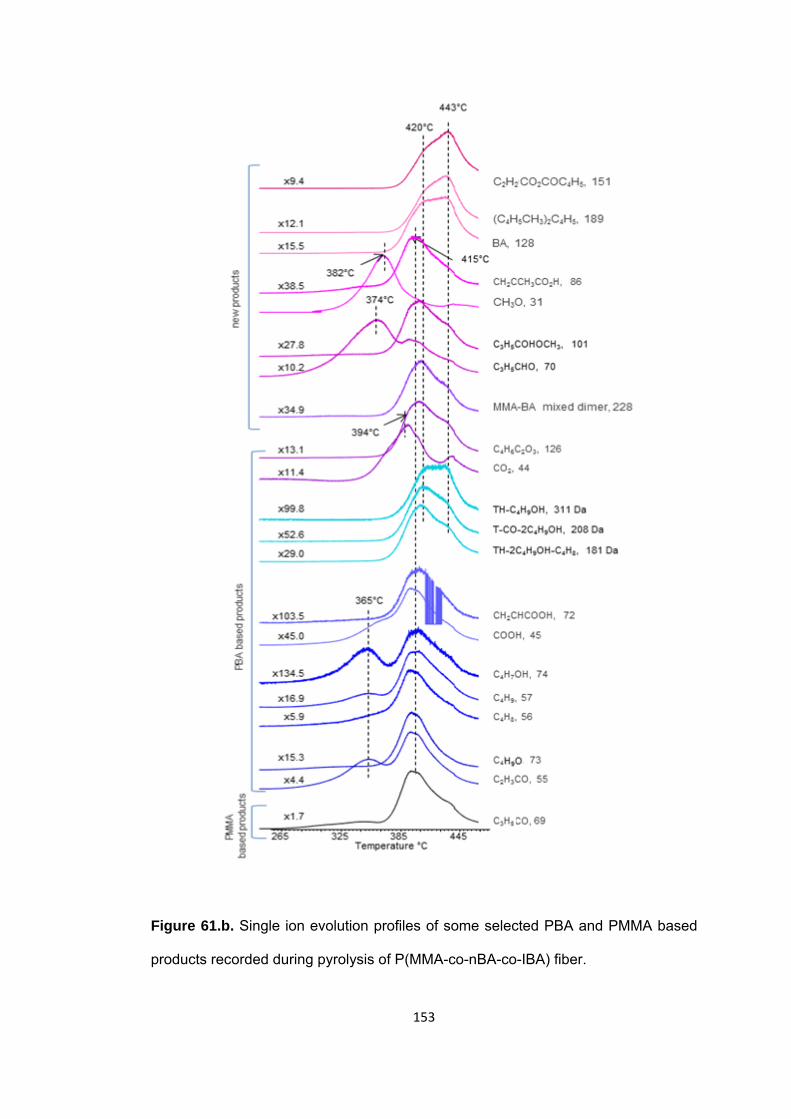
153
Figure 61.b. Single ion evolution profiles of some selected PBA and PMMA based
products recorded during pyrolysis of P(MMA-co-nBA-co-IBA) fiber.
154
The relative yields of CO2 and butyl alcohol are almost identical to the
corresponding values of the copolymer, while slight increases in the relative yields of
anhydride units, butene and isobornyl alcohol are detected.
On the other hand, generation of isobornylene is increased drastically, about more
than 3 folds. About 1.7-folds increase in the relative yield of methyl acrylate-
methacrylic acid (86 Da) is observed. Furthermore, although still very low, acrylic
acid evolution is also recorded.
In summary, it is clear that the evolution of CO2 is enhanced as the IBA composition
increases and fiber formation does not affect its yield noticeably. Similarly, the
change in the yield of isobornyl alcohol seems to depend mainly only on the
percentage of IBA present in the copolymer. On the other hand, the H-transfer
reactions from the isobornyl side chain to the carbonyl group are enhanced upon
fiber formation. As the generation of CH3OH that is only efficient in the presence of
IBA, is significantly enhanced during the pyrolysis of the fiber, it can be concluded
that the trans-esterification reactions between the acrylic acid units and MMA
(Scheme 16) are enhanced during the pyrolysis of the fiber. The increases, though
less pronounced, in the yields of 86 Da’s fragment due to methyl acrylate and/or
methacrylic acid and anhydride units support this proposal.
155
CHAPTER 4
CONCLUSIONS
In this work, thermal degradation characteristics, thermal degradation products and
mechanisms of;
• methacrylate homopolymers; poly(methyl methacrylate) PMMA, poly(butyl
methacrylate) PBMA, poly(isobornyl methacrylate) PIBMA and poly(benzyl
methacrylate) PBzMA,
• acrylate homopolymers: poly(n-butyl acrylate) PnBA, poly(t-butyl acrylate)
PtBA, poly(isobornyl acrylate) PIBA,
• copolymers: poly(methyl methacrylate-co-n butyl acrylate) P(MMA-co-nBA),
poly(methyl methacrylate-co-isobornyl acrylate) P(MMA-co-IBA), poly(methyl
methacrylate-co-benzyl methacrylate) P(MMA-co-BzMA), poly(methyl
methacrylate-co-n butyl acrylate-co-isobornyl acrylate) P(MMA-co-nBA-co-
IBA), and poly(methyl methacrylate-co-n butyl acrylate-co-isobornyl acrylate-
co-benzyl methacrylate) P(MMA-co-nBA-co-IBA-co-BzMA) and
• copolymer fibers: poly(methyl methacrylate-co-n butyl acrylate) P(MMA-co-
nBA)f, poly(methyl methacrylate-co-benzyl methacrylate) P(MMA-co-
BzMA)f, and poly(methyl methacrylate-co-n butyl acrylate-co-isobornyl
acrylate) P(MMA-co-nBA-co-IBA)f,
are analyzed via direct pyrolysis mass spectrometry.
156
The effects of substituents on the main and side chains, each component of the
copolymer on thermal characteristics of the other and fiber formation on thermal
stability, degradation characteristics and thermal degradation mechanisms are
investigated.
• In general, depolymerization mechanism yielding mainly the monomer is the
main thermal decomposition route for methacrylate polymers. On the other
hand, thermal degradation of acrylate polymers starts by H-transfer reactions
from the main chain to the carbonyl groups. However, when the alkoxy group
involves γ-H, then, H-transfer reactions from the alkoxy group to the CO group
also takes place and usually thermal degradation proceeds through competing
reactions leading to a complex thermal degradation mechanism;
• PnBMA degrades mainly via depolymerization associated with generation of
a tertiary radical upon cleavage of the CH3C-CH2 bond.
• PnBA degradation proceeds through simultaneous and subsequent
processes, γ-hydrogen transfer from the main chain to carbonyl group,
transesterification reactions causing loss of butanol, and generation of six-
membered products stabilized by cyclization reactions being among the
major decomposition routes.
• PtBA thermal degradation starts by elimination of C4H8 by γ-hydrogen
transfer reactions from the t-butyl groups to the carbonyl groups producing
poly(acrylic acid) chains that forms anhydride linkages by condensation
reactions and unsaturated units by subsequent loss of CO2 and CO that
decompose at elevated temperatures.
• PIBA degrades via complex degradation mechanism and γ-H transfer from
the isobornyl ring to the carbonyl group. Evolution of isoborylene yields
polyacrylic acid that eliminates water by inter and intra molecular interactions
and forms anhydride units capable of crosslinking by lose of CO2 and CO.
157
• PIBMA also shows similar characteristics with PIBA, indicating that presence
of methyl substituent does not affect thermal degradation behavior as it does
in case of PMMA.
• Like PMMA, thermal degradation of PBzMA occurs by depolymerization
reaction yielding mainly the monomer.
• In general, during the thermal degradation of copolymers of MMA intermolecular
interactions between the components become effective.
• For poly(methyl methacrylate-co-n butyl acrylate), P(MMA-co-BA) sample,
although the presence of butyl acrylate does not affect the thermal stability of
PMMA chains in a considerable manner, the butyl acrylate chains are
stabilized to some extend by the presence of methyl methacrylate chains.
Furthermore, H-transfer reactions from the butyl group to the CO group
become preferential compared to H-transfer reactions from the main chain.
Anhydride formation followed by evolution of CO2 generates unsaturated
and/or crosslinked units. Strong evidences for trans-esterification reactions
between H2O and MMA and BA yielding methacrylic and acrylic acid
segments and reactions between CH3OH and acrylic acid yielding
methacrylate segments are also detected.
• For, poly(methyl methacrylate-co-isobornyl acrylate), P(MMA-co-IBA),
thermal degradation mechanism is again affected by intermolecular
interactions between PIBA and PMMA. Based on evolution of methanol, a
transesterification reaction between the MMA and acrylic acid units
generated by loss of isobornylene from PIBA chains is proposed. The
relative yields of acrylic acid and products due to transesterification reactions
are noticeably higher than those of the poly(MMA-co-BA) sample, indicating
that transesterification reactions of acrylic acid and H2O with MMA seem to
be more likely for the copolymer involving IBA, as confirmed by the increase
in relative yields of related products during the pyrolysis of poly(MMA-co-
IBA).
158
• Thermal degradation characteristics of poly(methyl methacrylate-co-benzyl
methacrylate), P(MMA-co-BzMA), copolymer does not show a drastic
changes compared to those of the corresponding homopolymers.
• The DP-MS findings for the poly(methyl methacrylate-co-n butyl acrylate-
co-isobornyl acrylate) P(MMA-co-nBA-co-IBA) involving 5 % nBA and 5
% IBA separately, indicate that thermal decomposition of IBA and BA
shifts to high temperature ranges when both of them are present as a
component in the copolymer involving 90 % MMA, compared to the
corresponding homopolymers and copolymers involving only 10.0 % IBA
or 12.5 % BA. As the percentage of IBA decreases from 12.5 to 5 %, the
temperature ranges at around which the elimination of side chains occur
increases. The increase in the thermal stability of these segments may be
associated with the higher thermal stability of PMMA chains and the
decrease in the probability of degradation routes involving H-transfer
reactions from the main chain as the percentage of IBA decreases. On the
other hand, the increase in thermal stability of PMMA chains when the
percentage of IBA decreases from 10 to 5 % may be attributed to
presence of unsaturated and crosslinked units generated by elimination of
CO2 and CO from the anhydride units formed by condensation of the
acrylic acid units.
• In general, for the poly(methyl methacrylate-co-n butyl acrylate-co-
isobornyl acrylate) P(MMA-co-nBA-co-IBA) involving 15 % nBA and 15
% IBA separately, besides the decrease in thermal stability, noticeable
changes are detected in product distributions. Compared to P(MMA-co-
BA) and P(MMA-co-BA-co-IBA) containing only 5 % BA and IBA, increase
in the probability of H-transfer reactions from the main chain, competing
with H-transfer reactions from the side chains, as in case of homopolymer
PnBA is detected.
The generation of isobornylene is enhanced as the percentage of IBA is
increased from 5 to 15 %. however, it is still lower than the value for the
P(MMA-co-IBA). The results indicate that almost all acrylic acid produced
159
is reacted and generated anhydride linkages that eliminate CO and CO2
and produce unsaturated units. Thus, it can be concluded that when the
IBA percentage increases thermal stability of the copolymer decreases,
degradation starting with H-transfer reactions from the isobornyl group to
carbonyl group proceeds through several trans-esterification reactions
generating methanol, isobornyl and butyl alcohols.
• In general, upon fiber formation; samples taken from different parts of the
fibers do not show different thermal degradation behavior. However,
changes in the thermal degradation characteristics are detected upon fiber
formation.
• In general, significant increase in the relative yields of products
generated by the reactions between acrylic acid and MMA units pointing
out enhancement of the intermolecular interactions upon fiber formation
is detected. These interactions may be the reason of the decrease in the
thermal stability.
• For poly(methyl methacrylate-co-n butyl acrylate-co-isobornyl acrylate)
P(MMA-co-nBA-co-IBA) fiber; the H-transfer reactions from the isobornyl
side chain to the carbonyl group and the reactions with acrylic acid and
MMA changes are enhanced at relatively low temperatures, decreasing
the thermal stability of MMA chains. On the other hand, the reactions
among PBA and MMA units are diminished during the pyrolysis of the
fiber most probably due to the decrease in thermal stability of MMA
chains.
160
REFERENCES
1) Drews, M. J., Barker, R. H., Hatcher, J. D., Fiber-Forming Polymers, Applied Polymer Science, 1985; 285, 441-467.
2) D’Alelio, G. F., Fundamental Principles of Polymerization, John Wiley & Sons,
New York, 1952; 27-28.
3) Ahluwalia, V. K., Mishra, A., Polymer Science Textbook, Ane books India,
2008; 139-140.
4) Oswald, T. A., Understanding Polymer Processing, Hanser publications,
Germany, 2011; 137-138.
5) Walczak, Z. K., Prosses of Fiber Formation, Elsevier Ltd., New York, 2002; 135.
6) Salem, D. R., Structure Formation in Polymeric Fibers, Hanser Publishers, Munich, 2001; 397-398.
7) Hacaloğlu, J., Direct insertion probe mass spectrometry (DIP-MS) of polymer, Advances in Polymer Science, 2011; 248, 69-103.
8) Chatloff, R. P., Sircar, A.K., Thermal Analysis of Polymer, Encyclopedia of Polymer Science and Technology, John Wiley & Sons, 2005.
9) Fares, M. M., Hacaloğlu, J., Suzer, S., Characterization of degradation products of polyethylene oxide by pyrolysis mass spectrometry, European Polymer Journal, 1994; 30, 845-850.
10) Gupta, M. C. Viswanath, S. G., Role of Metal Oxides in the Thermal Degradation of Poly(vinyl chloride), American Chemical Society, Ind. Eng. Chem. Res., 1998; 37 (7), 2707–2712.
11) Reich, L., Lee, H.T., Levi, D., Kinetic Parameters in Polymer Degradation by Dynamic Thermogravimetric Analysis, Journal of Applied Polymer Science, 1965; 9, 351-358.
161
12) Schild, H. G., Application of TGA/ FTlR to the Thermal Degradation Mechanism of Tetrafluoroethylene-Propylene Copolymers, Journal of Polymer Science: Part A: Polymer Chemistry, John Wiley &Sons, Inc., 1993; 31, 1629-1632.
13) Raemaekers, K.G.H., Bart, J.C.J., Applications of simultaneous thermogravimetry-mass spectrometry in polymer analysis, ThermochimicaActa, 1997; 295, 1-58.
14) McNeill, I. C., Thermal Volatilization Analysis: A New Method for the Characterization of Polymers and the Study of Polymer Degradation, Journal of Polyme Science, 1966; 4 (1), 2479-2485.
15) Guo, X., Huang B., Dyakonov T., Chen Y., Padron L., Thayne V. T., Kun J., HodkiewczJ.,Stevenson W. T. K, Thermal Volatilization Analysis: A Versatile Platform for Spectroscopic Investigations of Polymer Degradation Processes, Applied Spectroscopy, 1999; 53(11), 1403-1410.
16) Menczel, J. D., Judovits, L., Prime, R. B.,Bair, E. H., Reading, M. and Swier, S., Thermal Analysis of Polymers, John Wiley & Sons, Inc., 2009;7-9.
17) Pielichowski, K., Njuguana J., Thermal Degradation of Polymeric Materials, Rapra Technology Ltd., 2005; 19.
18) Irwin, W. J., Dekker, M., Analytical Pyrolysis: A Comprehensive Guide, New York, 1982.
19) Hacaloğlu, J., Yalçın T., Mass Spectrometry in Polymers Research, Applied Mass Spectroscopy Handbook, editted by Mike Lee, John Wiley & Sons, Inc., Chap 46, 2012; 1119-1142.
20) Hacaloğlu, J., Pyrolysis Mass Spectrometry for Molecular Ionization Methods, The Encyclopedia of Mass Spectrometry: Ionization methods, Eddited by Michael L. Gross& Richard M. Caprioli. Elsevier Science Ltd, 2007; 6, 925-938.
21) Zhang, S., Shin, Y. S., Mayer, R., Basile, F., On-probe pyrolysis desorption electrospray ionization (DESI) mass spectrometry for the analysis of non-volatile pyrolysis products , Journal of Analytical and Applied Pyrolysis, 2007; 80, 353.
162
22) Whitson, S. E., Erdodi, G., Kennedy, J. P., Lattimer, R. P., Direct probe-atmospheric pressure chemical ionization mass spectrometry of cross-linked copolymers and copolymer blends, Analytical Chemistry, 2008; 80, 7778.
23) "polyacrylate" Encyclopædia Britannica. Encyclopædia Britannica Online Academic Edition. Encyclopædia Britannica Inc., 2012. Web. 01 Aug. 2012. <http://www.britannica.com/EBchecked/topic/1551195/polyacrylate>.
24) Czech, Z., Pełech, R., Thermal degradation of poly(alkyl methacrylates), Jornal of Thermal Analaysis and Calorimetry, 2010; 101, 309–313.
25) Mahalik,J. P., Madras, G., Effect of the Alkyl Group Substituents on the Thermal and Enzymatic Degradation of Poly(n-alkyl acrylates), Ind. Eng. Chem. Res., 2005; 44(12).
26) Soeriyadi, A. H., Bennet, F., Whittaker, M. R., Barker, P.J.,Kowollik, C. B.,Davis, T. P., Degradation of Poly(Butyl Methacrylate) Model Compounds Studied via High-Resolution Electrospray Ionization Mass Spectrometry, Jornal of Polymer Science: Part A: Polymer Chemistry, 2011; 49, 848–861.
27) Jakubowski, W., Juhari, A., Best,A., Koynov, K., Pakula, T., Matyjaszewski, K., Comparison of thermomechanical properties of statistical, gradient and block copolymers of isobornyl acrylate and n-butyl acrylate with various acrylate homopolymers, Science Direct, 2008; 49, 1567-1578.
28) Kurt, A., Kaya, E., Synthesis, Characterization and Thermal Degradation Kinetics of the Copolymer Poly(4-methoxybenzyl methacrylate-co-isobornyl methacrylate), Journal of Applied Polymer Science, 2010; 115, 2359–2367.
29) Konaganti, V. K.,Madras, G., Photocatalytic and Thermal Degradation of Poly(methyl methacrylate), Poly(butylacrylate) and Their Copolymers, Ind. Eng. Chem. Res, 2009; 48, 1712–1718.
30) Vinu, R., Madras, G., Photocatalytic degradation of methyl methacrylate copolymers, Polymer Degradation and Stability, 2008; 93, 1440–1449.
31) Grassie, N., Recent work on the thermal degradation of acrylate and methacrylate homopolymers and copolymers, Department of Chemistry, University of Glasgow, Glasgow W2, Scotland.
163
32) Grassie, N., Torrance, B. J. D., Thermal Degradation of Copolymers of Methyl Methacrylate and Methyl Acrylate. Products and General Characteristics of the Reaction, Journal of Polymer Science, 1968; 6(1), 3303-3314.
33) Grassie, N., Torrance, B. J. D., Thermal Degradation of Copolymers of Methyl Methacrylate and Methyl Acrylate. Chain Scission and the Mechanism of the Reaction, Journal of Polymer Science, 1968; 6(1), 3315-3326.
34) Manring, L.E., Thermal degradation of poly(methly methacrylate). 4. Random side group scission, Macromolecules, 1991; 24, 3304–3309
35) Holland, B.J., Hay J.N., The kinetics and mechanisms of the thermal degradation of poly(methyl methacrylate) studied by thermal analysis-Fourier transform infrared spectroscopy, Polymer 2001; 42, 4825–4835.
36) Lehrle, L., Place, E.J., Degradation mechanism of poly(methyl acrylate)s I. An assessment of the participation of random chain scissions. PolymDegrad Stab 1997; 56, 215.
37) Lehrle, L., Place, E.J., Degradation mechanism of poly- (methyl acrylate)s II.
The contribution of depropagation with intramolecular transfer. PolymDegrad Stab 1997; 56, 221.
38) Lehrle, L., Place, E.J., Degradation mechanism of poly(methyl acrylate)s III. An assessment of the participation of secondary reactions from the dependence of pyrolysis yields on sample thickness. PolymDegrad Stab. 1997; 57, 247.
39) Bertini, F., Audisio, G., Zuev, V., Investigation on the thermal degradation of poly-n-alkyl acrylates and poly-n-alkyl methacrylates (C1–C12). PolymDegradStab., 2005; 89, 233-239.
40) Manring, L. E., Thermal Degradation of Poly(methyl methacrylate). 4. Random Side-Group Scission, Macromolecules, 1991; 24, 3304-3309.
41) Czech, Z., Pelech, R., Zych, K., Swiderska, J., Thermal degradation of copolymers based on selected alkyl methacrylates J Therm Anal Calorim. 2012; 109, 573-576.
42) Czech, Z., Pelech, R., Thermal degradation of butyl acrylate-methyl acrylate-
acrylic acid-copolymers. J Therm Anal Calorim., 2009; 96, 583-586.
164
43) Murphya, R. E., Schureb, M. R., Foley, J. P., Quantitative analysis of poly(methyl methacrylate–butyl acrylate) copolymer composition by liquid chromatography–particle beam mass spectrometry, Journal of Chromatography, 1998; 824, 181–194.
44) Konaganti, V.K., Madras, G., Photooxidative and pyrolytic degradation of methyl methacrylate-alkyl acrylate copolymers, Polymer Degradation and Stability, 2009; 94, 1325–1335.
45) Leskovac, M., Fles, V. K. R., Hace, D., Thermal Stability of Poly(Methyl Methacrylate-co-ButyI Acrylate) and Poly(Styrene-co-Butyl Acrylate) Polymers, Poymer Engineering and Science, 1999; 39(3), 600-608.
46) Haken, J. K., Tan, L., Thermal Degradation of Isomeric Poly(propyl Acrylate)s and Poly(butyl Acrylate)s Using Pyrolysis Gas Chromatography-Mass Spectrometry,Journal of Polymer Science: Part A: Polymer Chemistry, 1987; 25, 1451-1456.
47) Lazzari, M., Chiantore, O., Thermal-ageing of paraloid acrylic protective polymers. Polymer 2000; 41, 6447-6455.
48) Soeriyadi, A.H.,Trouillet, V.,Bennet, F., Bruns, M.l.,Whittaker, M.R.,Boyer, C.,Barker, P.J.,Davis, T.P., Barner-Kowollik, C., A Detailed Surface Analytical Study of Degradation Processes in Methacrylic Polymers. J Polym Sci Part A: Polym Chem, 2012; 50, 1801–1811.
49) Chiantore, O., Trossarelli, L., Lazzari, M., Photooxidative degradation of acrylic and methacrylic polymers. Polymer, 2000; 41, 1657-1668.
50) Chiantore, O., Lazzari, M., Photo-oxidative stability of paraloid acrylic protective polymers. Polymer, 2001; 42, 17-27.
51) Goikoetxea, M., Barandiaran, M.J., Asua J., Mechanisms of n-Butanol Formation in Butyl Acrylate Latexes, Journal of Polymer Science: Part A: Polymer Chemistry, 2007; 45, 5838–5846.
52) Daraboina, N., Madras, G., Thermal and Photocatalytic Degradation of Poly(methyl methacrylate), Poly(butyl methacrylate), and Their Copolymers, Ind. Eng. Chem. Res., 2008;47, 6828–6834.
165
53) Arribas, C., Masegosa, R. M., Salom, C., Arevalo, E., Prolongo, S. G., Prolongo, M. G., Epoxy/poly (benzyl methacrylate) blends: miscibility, phase seperation on curing and morphology, Journal of Thermal Analysis and Calorimetry, 2006; 86(3), 693–698.
54) Tsai, Y., Wang, W., Polybenzyl Methacrylate Brush Used in the Top-Down/ Bottom-Up Approach for Nanopatterning Technology, Journal of Applied Polymer Science, 2006; 101, 1953–1957.
55) Ishikawa, M., Noguchi, T., Niwa, J., Controlled release of theophylline from plasma-irradiated double-compressed tablet composed of a wall material containing polybenzylmethacrylate, Chemical & Pharmaceutical Bulletin, 1995; 43(12), 2215-2220.
56) Dervax, B., Camp, W., Renterghem, L., Duprez, F. E., Synthesis of Poly(isobornyl acrylate) Containing Copolymers by Atom Transfer Radical Polymerization, Wiley Inter Science, 2007.
57) Schnell, M., Borrajo, J., Williams, R. J. J., Wolf, B.A., Isobornyl Methacrylate as a Reactive Solvent of Polyethylene, Macromolecular Materials Engineering, 2004; 289, 642–647.
58) Matsumoto, A., Mızuta, K., Otsu, T., Synthesis and Thermal Properties of Poly (cycloalkyl methacrylate)s Bearing Bridged- and Fused-Ring Structures, Journal of Polymer Science, 1993; 31, 2531-2539.
59) Doğan, F., Kaya, İ., Yürekli, M., Kinetic of thermal degradation of
poly(isobornyl methacrylate), Catalysis Letters, 2007; 114, 1–2.
60) Ferriol, M., Gentilhomme, A., Cochez, M., Oget, N., Mieloszynski, J. L., Thermal degradation of poly(methyl methacrylate) (PMMA): modelling of DTG and TG curves, Polym. Deg. Stab., 2003; 79(2), 271.
61) Hu, Y. H., Chen, C. Y., The effect of end groups on the thermal degradation of poly(methyl methacrylate), Polym. Deg. Stab., 2003; 82, 81-88.
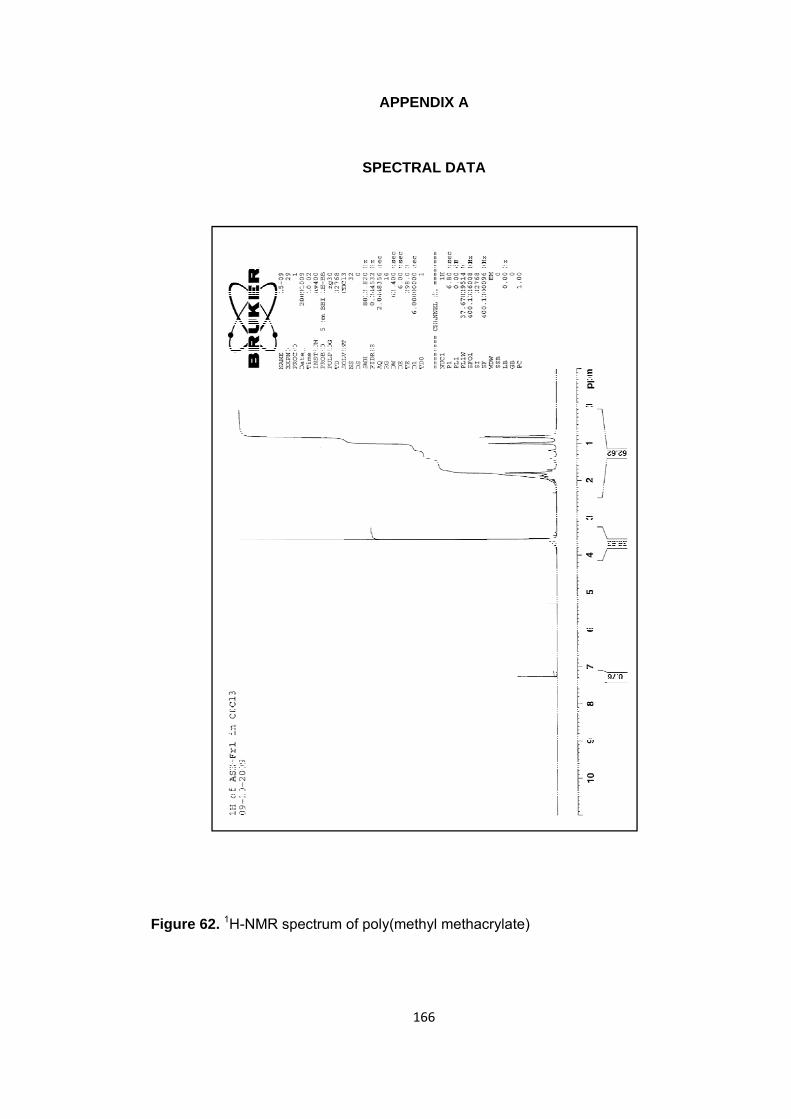
166
APPENDIX A
SPECTRAL DATA
Figure 62. 1H-NMR spectrum of poly(methyl methacrylate)
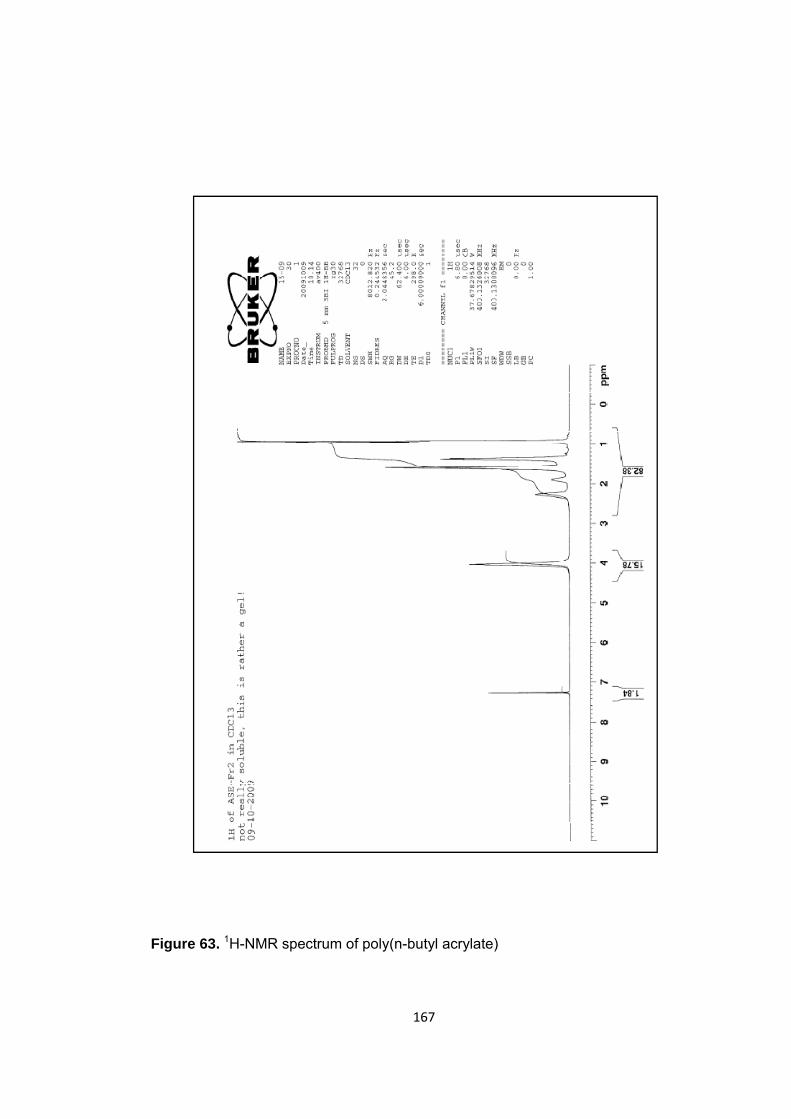
167
Figure 63. 1H-NMR spectrum of poly(n-butyl acrylate)
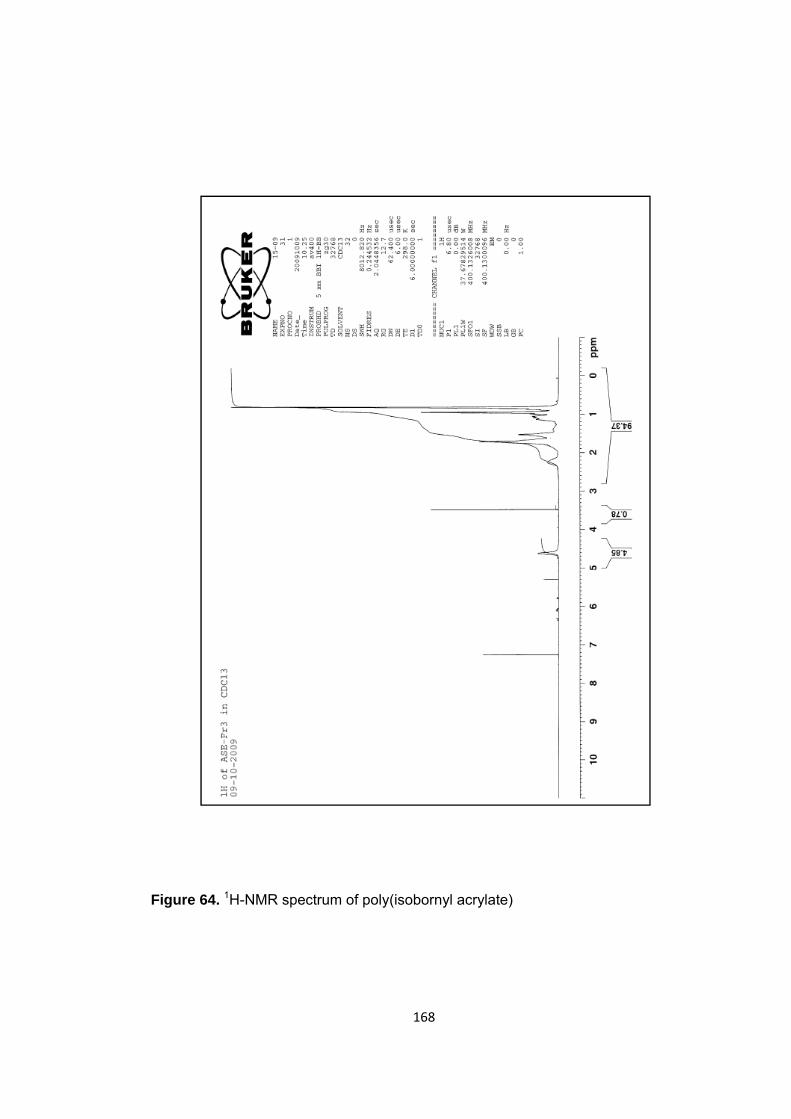
168
Figure 64. 1H-NMR spectrum of poly(isobornyl acrylate)
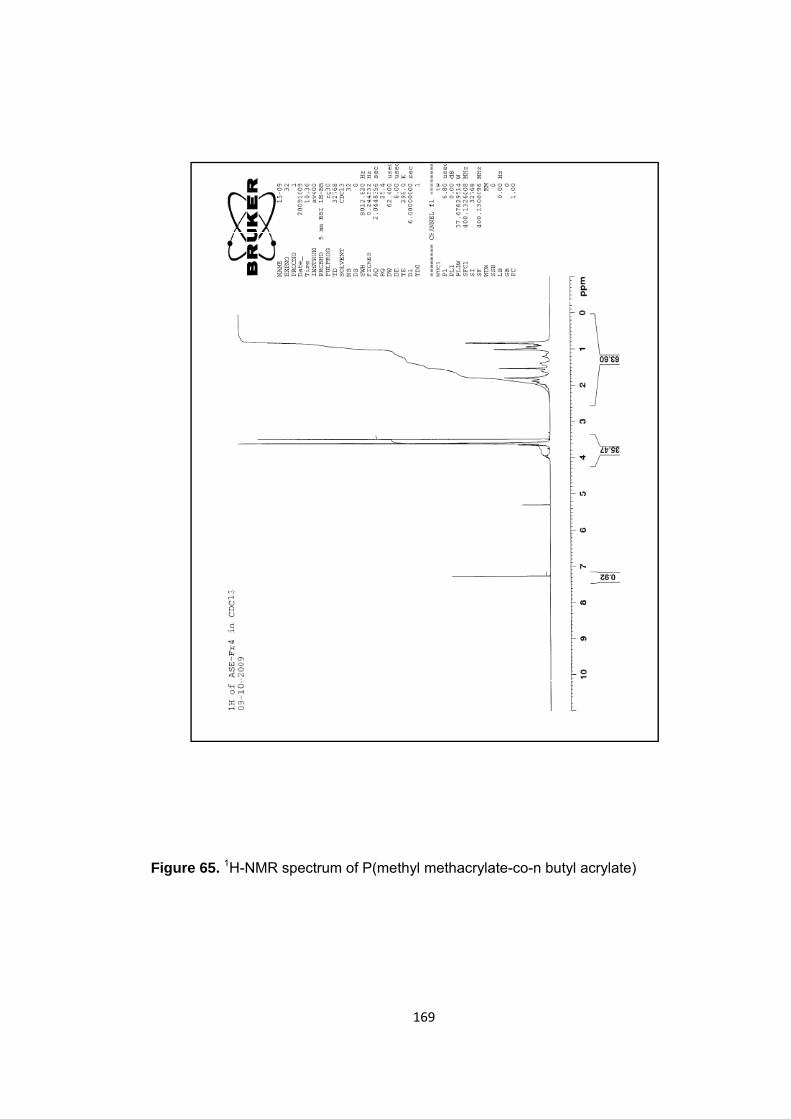
169
Figure 65. 1H-NMR spectrum of P(methyl methacrylate-co-n butyl acrylate)
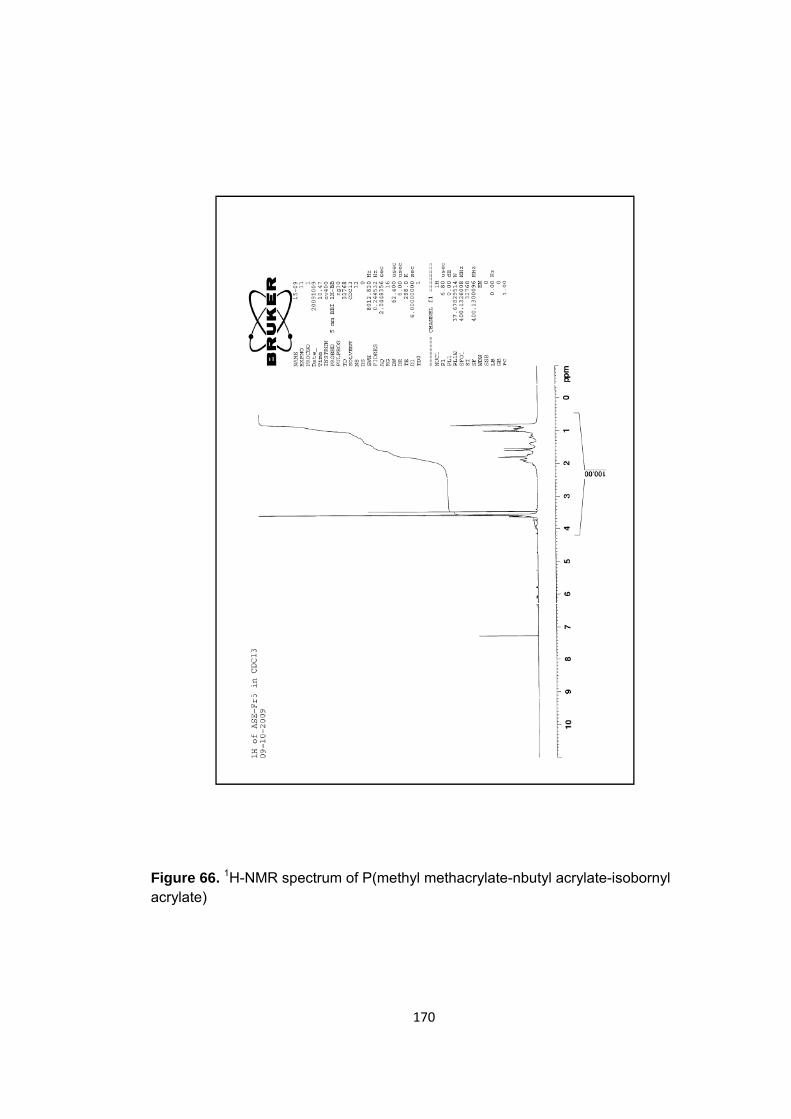
170
Figure 66. 1H-NMR spectrum of P(methyl methacrylate-nbutyl acrylate-isobornyl acrylate)
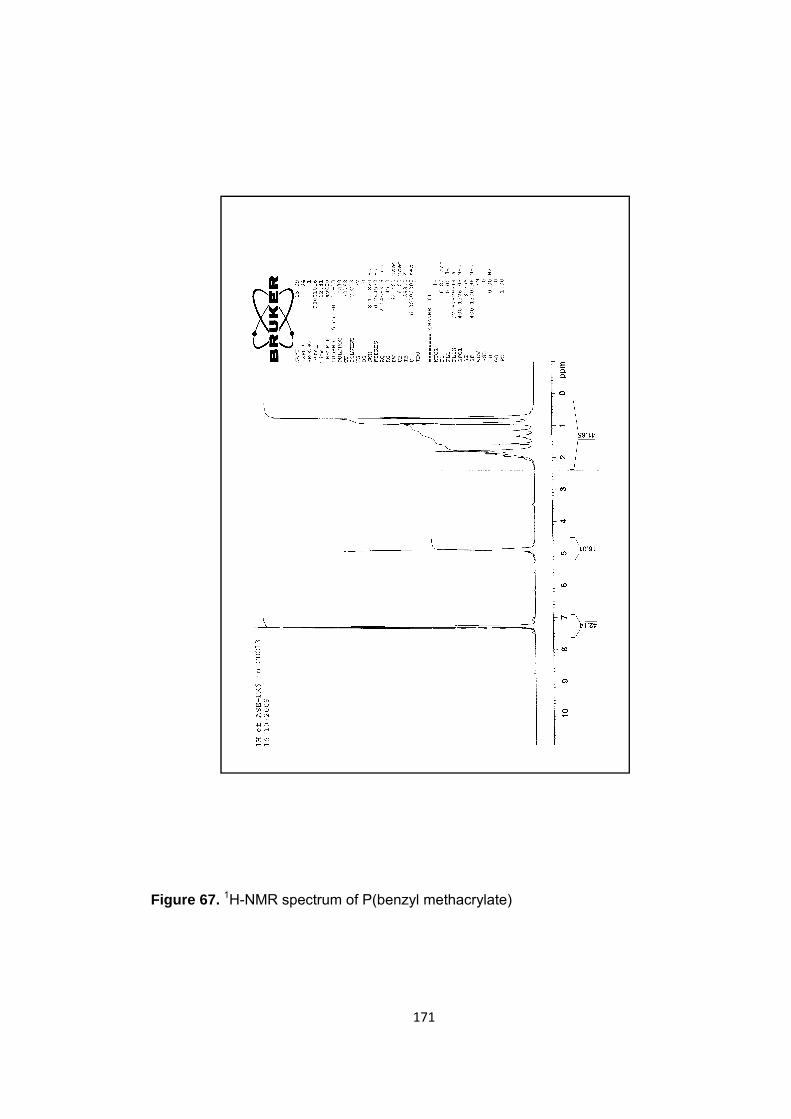
171
Figure 67. 1H-NMR spectrum of P(benzyl methacrylate)
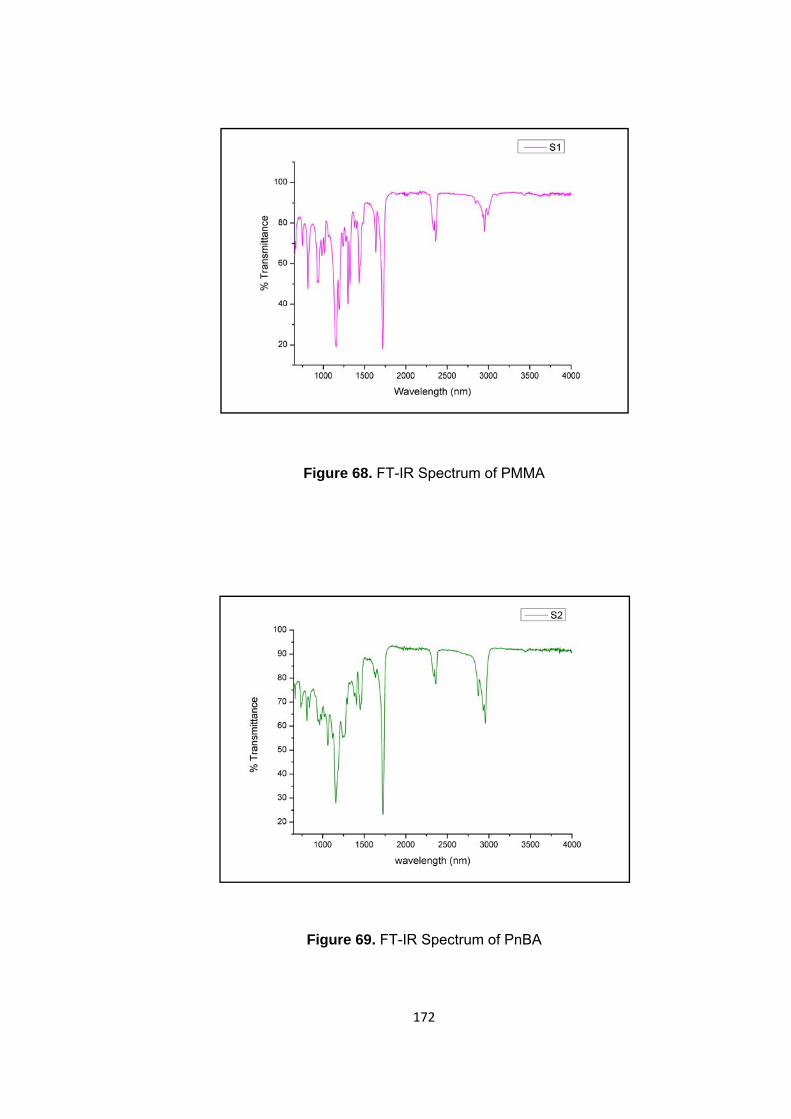
172
Figure 68. FT-IR Spectrum of PMMA
Figure 69. FT-IR Spectrum of PnBA
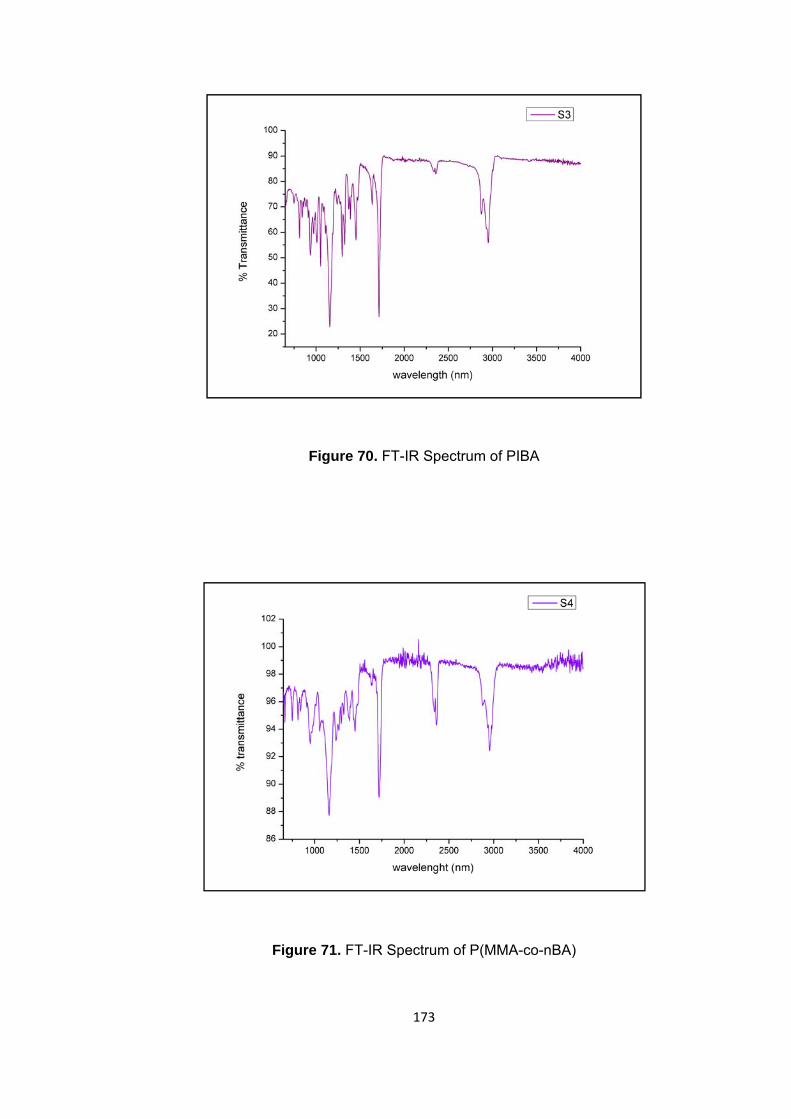
173
Figure 70. FT-IR Spectrum of PIBA
Figure 71. FT-IR Spectrum of P(MMA-co-nBA)
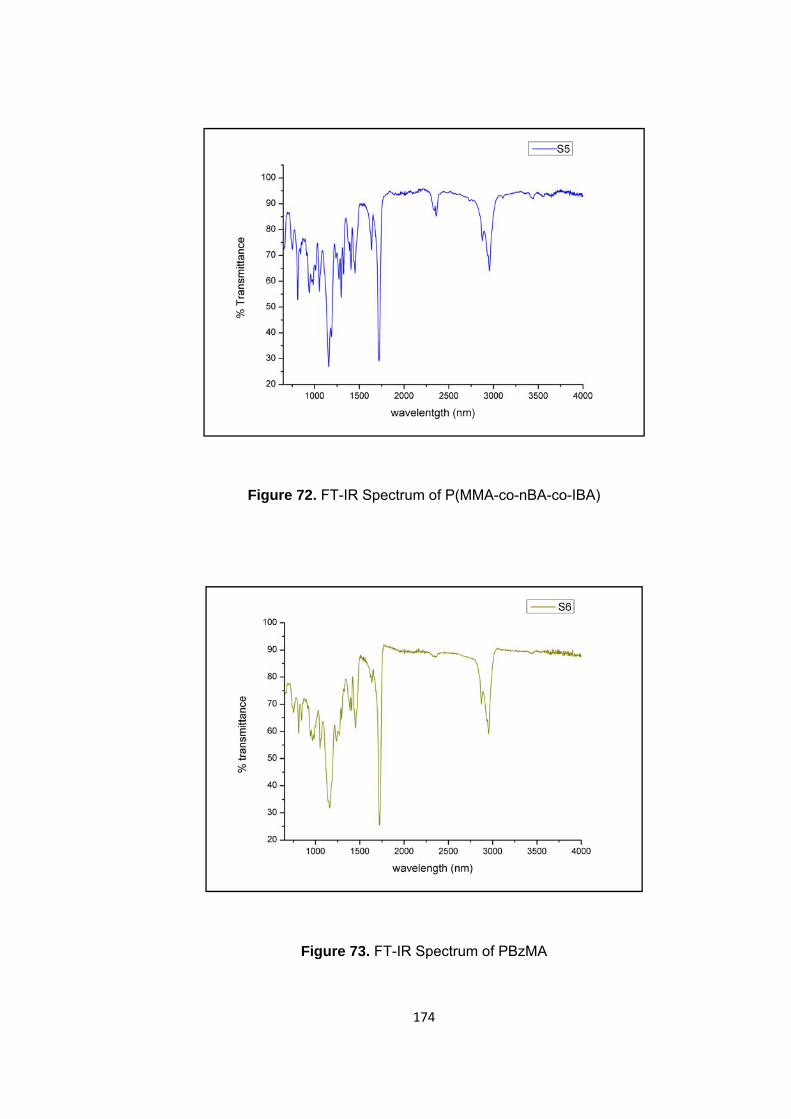
174
Figure 72. FT-IR Spectrum of P(MMA-co-nBA-co-IBA)
Figure 73. FT-IR Spectrum of PBzMA
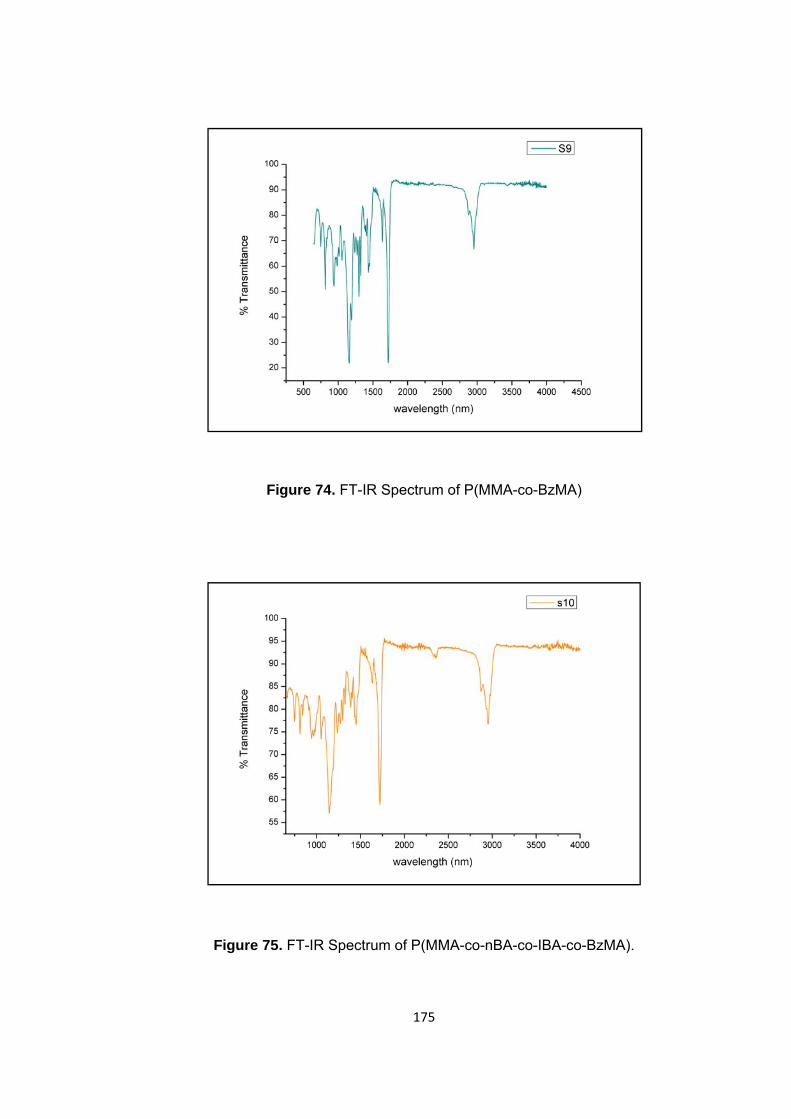
175
Figure 74. FT-IR Spectrum of P(MMA-co-BzMA)
Figure 75. FT-IR Spectrum of P(MMA-co-nBA-co-IBA-co-BzMA).
176
CURRICULUM VITAE
PERSONAL INFORMATION
Name-Surname: Suriye Özlem Gündoğdu
Date of Birth: 19.02.1983
Place of Birth: Kırcaali/ Bulgaria
Nationality: Turkish
Marital Status: Married
e-mail: [email protected]
EDUCATION
Degree
Institution
Year
M.Sc.
METU, Chemistry Dept.
2006-2008
B.Sc.
METU, Chemistry Dept.
2001-2006
High School
Bursa Girl’s High School
1997-2001
WORK EXPERIENCE
Place Position Year
İLKO R&D Center R&D Specialist 2012-present
METU, Chemistry Dept. Research Assistant 2006-2012
FOREIGN LANGUAGE
English, Bulgarian
COMPUTER SKILLS
177
Excel, Word, Power Point, ChemDraw, Paint, MastRe-C, Photoshop, Science
Finder, Origin and Internet.
METU HIGH HONOUR LIST
2006- 2007 (Spring)
2005- 2006 (Spring)
2005- 2006 (Fall)
PUBLICATIONS
1. Ozlem, S., Hacaloğlu, J., Thermal Degradation of poly(n-butyl methacrylate), poly(n-butyl acrylate) and poly(t-butyl acrylate) J Anal. Appl. Pyrol. 2012. submitted.
2. Ozlem, S., Gürel, E.A., Rossi, M. R., Hacaloğlu, J., Thermal Degradation of Poly(isobornyl acrylate) and Its Copolymer with Poly(methyl methacrylate)via Pyrolysis Mass Spectrometry. J Anal. Appl. Pyrol. 2012.http://dx.doi.org/10.1016/j.jaap.2012.10.024
3. Ozlem, S., Iskin, B., Yilmaz, G., Kukut, M., Hacaloğlu, J., Yağcı, Y., Synthesis and pyrolysis of ABC type miktoarm star copolymers with polystyrene, poly(lactic acid) and poly(ethylene glycol) arms, European Polymer Journal, 2012; 48, 1755-1767.
4. Ozlem, S., Akkaya, E. U., Thinking Outside the Silicon Box: Molecular AND Logic as an Additional Layer of Selectivity in Singlet Oxygen Generation for Photodynamic Therapy, JACS, 2009; 131, 48-49. (featured in C & EN News, Science and Technology Concentrates, January 19, 2009)
Articles in preparation
1. Gundogdu-Ozlem, S., Gürel, E.A., Hacaloğlu, J., Thermal Degradation of poly(methyl methacrylate-co-n-butyl acrylate-co- isobornyl acrylate) copolymers.
2. Gundogdu-Ozlem, S., Gürel, E.A, Hacaloğlu, J., Thermal Degradation of poly(methyl methacrylate-co-benzyl methacrylate) copolymer and copolymer fiber.
3. Gundogdu-Ozlem, S., Gürel, E.A., Hacaloğlu, J., Thermal Degradation of copolymers of methyl methacrylate fibers.


![SYNTHESIS AND SWELLING BEHAVIOR OF BENTONITE …umpir.ump.edu.my/2465/1/CD5500_AINUN_JARIAH_BINTI_SANSURI.pdf · Poli(asid akrilat-co-akrilamida)[poli(AA-co-AM)] SPC berasakan Bentonite](https://static.fdocuments.us/doc/165x107/5cada45b88c993ab638b52be/synthesis-and-swelling-behavior-of-bentonite-umpirumpedumy24651cd5500ainunjariahbinti.jpg)