The Characteristics of Solar X-Class Flares and CMEs: A ...
22
Solar Phys (2016) 291:1761–1782 DOI 10.1007/s11207-016-0923-0 The Characteristics of Solar X-Class Flares and CMEs: A Paradigm for Stellar Superflares and Eruptions? Louise K. Harra 1 · Carolus J. Schrijver 2 · Miho Janvier 3 · Shin Toriumi 4 · Hugh Hudson 5 · Sarah Matthews 1 · Magnus M. Woods 1 · Hirohisa Hara 4 · Manuel Guedel 6 · Adam Kowalski 7 · Rachel Osten 8 · Kanya Kusano 9 · Theresa Lueftinger 6 Received: 22 December 2015 / Accepted: 22 May 2016 / Published online: 27 June 2016 © The Author(s) 2016. This article is published with open access at Springerlink.com Abstract This paper explores the characteristics of 42 solar X-class flares that were ob- served between February 2011 and November 2014, with data from the Solar Dynamics Observatory (SDO) and other sources. This flare list includes nine X-class flares that had no associated CMEs. In particular our aim was to determine whether a clear signature could be identified to differentiate powerful flares that have coronal mass ejections (CMEs) from those that do not. Part of the motivation for this study is the characterization of the solar paradigm for flare/CME occurrence as a possible guide to the stellar observations; hence we emphasize spectroscopic signatures. To do this we ask the following questions: Do all erup- tive flares have long durations? Do CME-related flares stand out in terms of active-region size vs. flare duration? Do flare magnitudes correlate with sunspot areas, and, if so, are erup- tive events distinguished? Is the occurrence of CMEs related to the fraction of the active- region area involved? Do X-class flares with no eruptions have weaker non-thermal signa- tures? Is the temperature dependence of evaporation different in eruptive and non-eruptive flares? Is EUV dimming only seen in eruptive flares? We find only one feature consistently associated with CME-related flares specifically: coronal dimming in lines characteristic of B L.K. Harra [email protected] 1 UCL-Mullard Space Science Laboratory, Holmbury St Mary, Dorking, Surrey, RH5 6NT, UK 2 Lockheed Martin Solar and Astrophysics Laboratory, 3251 Hanover Street, Palo Alto, CA 94304, USA 3 Institut d’Astrophysique Spatiale, UMR8617, Univ. Paris-Sud-CNRS, Université Paris-Saclay, Bâtiment 121, 91405 Orsay Cedex, France 4 National Astronomical Observatory of Japan, 2-21-1 Osawa, Mitaka, Tokyo 181-8588, Japan 5 SUPA School of Physics and Astronomy, University of Glasgow, Glasgow, UK 6 Department of Astrophysics, University of Vienna, Türkenschanzst. 17, 1180 Vienna, Austria 7 Department of Astronomy, University of Maryland, College Park, MD, 20742, USA 8 Space Telescope Science Institute, 3700 San Martin Drive, Baltimore, MD 21218, USA 9 Solar–Terrestrial Environment Laboratory, Nagoya University, Furo-cho, Chikusa-ku, Nagoya, Aichi 464-8601, Japan
Transcript of The Characteristics of Solar X-Class Flares and CMEs: A ...

Solar Phys (2016) 291:1761–1782DOI 10.1007/s11207-016-0923-0
The Characteristics of Solar X-Class Flares and CMEs:A Paradigm for Stellar Superflares and Eruptions?
Louise K. Harra1 · Carolus J. Schrijver2 · Miho Janvier3 · Shin Toriumi4 ·Hugh Hudson5 · Sarah Matthews1 · Magnus M. Woods1 · Hirohisa Hara4 ·Manuel Guedel6 · Adam Kowalski7 · Rachel Osten8 · Kanya Kusano9 ·Theresa Lueftinger6
Received: 22 December 2015 / Accepted: 22 May 2016 / Published online: 27 June 2016© The Author(s) 2016. This article is published with open access at Springerlink.com
Abstract This paper explores the characteristics of 42 solar X-class flares that were ob-served between February 2011 and November 2014, with data from the Solar DynamicsObservatory (SDO) and other sources. This flare list includes nine X-class flares that hadno associated CMEs. In particular our aim was to determine whether a clear signature couldbe identified to differentiate powerful flares that have coronal mass ejections (CMEs) fromthose that do not. Part of the motivation for this study is the characterization of the solarparadigm for flare/CME occurrence as a possible guide to the stellar observations; hence weemphasize spectroscopic signatures. To do this we ask the following questions: Do all erup-tive flares have long durations? Do CME-related flares stand out in terms of active-regionsize vs. flare duration? Do flare magnitudes correlate with sunspot areas, and, if so, are erup-tive events distinguished? Is the occurrence of CMEs related to the fraction of the active-region area involved? Do X-class flares with no eruptions have weaker non-thermal signa-tures? Is the temperature dependence of evaporation different in eruptive and non-eruptiveflares? Is EUV dimming only seen in eruptive flares? We find only one feature consistentlyassociated with CME-related flares specifically: coronal dimming in lines characteristic of
B L.K. [email protected]
1 UCL-Mullard Space Science Laboratory, Holmbury St Mary, Dorking, Surrey, RH5 6NT, UK
2 Lockheed Martin Solar and Astrophysics Laboratory, 3251 Hanover Street, Palo Alto, CA 94304,USA
3 Institut d’Astrophysique Spatiale, UMR8617, Univ. Paris-Sud-CNRS, Université Paris-Saclay,Bâtiment 121, 91405 Orsay Cedex, France
4 National Astronomical Observatory of Japan, 2-21-1 Osawa, Mitaka, Tokyo 181-8588, Japan
5 SUPA School of Physics and Astronomy, University of Glasgow, Glasgow, UK
6 Department of Astrophysics, University of Vienna, Türkenschanzst. 17, 1180 Vienna, Austria
7 Department of Astronomy, University of Maryland, College Park, MD, 20742, USA
8 Space Telescope Science Institute, 3700 San Martin Drive, Baltimore, MD 21218, USA
9 Solar–Terrestrial Environment Laboratory, Nagoya University, Furo-cho, Chikusa-ku, Nagoya,Aichi 464-8601, Japan
1762 L.K. Harra et al.
the quiet-Sun corona, i.e. 1 – 2 MK. We do not find a correlation between flare magnitudeand sunspot areas. Although challenging, it will be of importance to model dimming forstellar cases and make suitable future plans for observations in the appropriate wavelengthrange in order to identify stellar CMEs consistently.
Keywords Corona · Flares, dynamics · Flares, magnetic fields
1. Introduction
Solar flares are among the most energetic phenomena in our solar system, and there contin-ues to be a large international effort to understand the physical processes that release suchvast amounts of energies in minutes. Coronal mass ejections (CMEs), which are often as-sociated with solar flares, have comparable energies, and can release large amounts of mass(up to 1016 g) into the heliosphere. These ejecta and associated high-energy particles maystrongly affect planetary environments (e.g. Gosling et al., 1991)
Over the years, the ever-improving observations have helped provide evidence (or other-wise) for a solar CME-associated flare model which assumes a twisted magnetic structureor flux rope rising in the corona, stressing the surrounding field lines and causing magneticreconnection to occur; this then would heat the local coronal plasma and accelerate the par-ticles. This model as developed by Carmichael (1964), Sturrock (1966), Hirayama (1974)and Kopp and Pneuman (1976) (hence CSHKP for short) appeared in the 1960s and 1970sand has since been extended. The thick-target model of electron transport then hypothesizesparticle heating of the chromospheric footpoints, leading to the observed “evaporation” ofplasma into the reconnected magnetic field and “condensation” of material toward the foot-points. The heated plasma that rises into the corona radiates predominantly in the XUVspectral range, with temperatures of 10 – 20 MK, much hotter than the chromospheric tem-peratures at which the majority of the energy is emitted. These coronal flare loops then cooldown and become visible in the lower temperature emissions (see e.g. Forbes and Acton,1996; Tsuneta, 1996).
Many observational features match this CSHKP scenario: the flare ribbons separate asreconnection occurs higher in the atmosphere, evaporation (up-welling blue-shifted plasma)occurs in the ribbons, non-thermal particles appear at footpoint regions within the ribbons(see e.g. Fletcher et al., 2011 and references therein). Finally, recent numerical simulationshave helped to adapt this standard model more fully to three dimensions (3D), and to de-scribe some of its observational features, such as the change of shear in subsequent genera-tions of cooling flare loops and the shape of flare ribbons (see e.g. Janvier et al. (2014) andreferences therein).
In this paper we study the 42 solar X-class flares that were observed between February2011 and November 2014, basically to ask several questions that may lead to a system-atic understanding of their properties, and especially to provide a modern view of the solarparadigms that might be applied to similar activity in other stars. We would like to be ableto identify the presence or absence of a CME from “Sun-as-a-star” observations, notingthat stellar observations of CMEs are difficult (Leitzinger et al., 2014) but important for thequestion of exoplanet habitability and long-term stellar angular momentum loss. This eventlist generally has the best observational database available, since it is recent, and the X-classflares are the most powerful solar events, approaching in terms of energy the low end of theenergy range for which stellar flares are detectable.

X-Class Flares and CMEs 1763
At present, there is much discussion relating the morphology of flares and CMEs toemerging flux, sheared fields, magnetic cancellation, interacting coronal loops, sigmoidstructures, etc., but all of these properties tend to be qualitative in nature. As such, theaim of the present study is to question the possibility of a statistical study on the largestflares recorded at high spatial and temporal resolution with the Solar Dynamics Observa-tory (SDO; Pesnell, Thompson, and Chamberlin, 2012) to provide more clues to constrain ageneric model. In this overview, we suggest the possibility of two categories of flares: erup-tive flares and non-eruptive flares. This softens the category of “compact” flares (Pallavicini,Serio, and Vaiana, 1977), because we have learned over the past decades that non-eruptiveflares do not need to be physically compact – and eruptive flares may be. We also avoid thewording “confined eruptions” as this does not distinguish flares that do not display evidenceof the presence of a flux rope, either during the flare or prior to the flare (e.g. sigmoids)from “failed eruptions”, for which the motion of rising prominences and filaments appearsto stall, with material subsequently falling back to the Sun instead of erupting into the he-liosphere (Ji et al., 2003). These failed eruptions have no CME association, but they tend tohave the other properties of an eruptive flare. It is difficult to predict whether a flare will beconfined or eruptive from the observations, and so the exploration of this issue is a majorobjective of this study. Schrijver (2009) provides a review of what drives flares, associatedwith flux-rope signatures, and with or without CMEs. This review highlights two appar-ently dominating aspects of flare energy conversion that appear to dictate whether or notthey are confined or can erupt freely. The first important factor is that of the internal twistof the emerging flux rope. The next factor is that of the properties of the embedding andsurrounding magnetic field. To understand these factors in detail could benefit from detailedmodeling of each individual event, but this is far beyond the scope of the discussion hereand may in most cases be premature, given the limitations of the observational material.
2. Flares, CMEs, and X-Class Flares Without CMEs
Generally CMEs represent the heliospheric manifestations of magnetic energy conversionat the Sun, and flares the radiation effects. These phenomena often appear simultaneously,especially for major events (the X-class flares). It is unusual, but not unheard of, for X-classflares to have no associated CME; our list of 42 X-class flares (Table 1) contains nine suchevents (note that six of these were from a single active region). The X-class flare SOL2011-11-03 is a good example of a major flare without a CME (Liu et al., 2014). The eventwas compact in low-temperature spectral bands of Atmospheric Imaging Assembly (AIA;Lemen et al., 2012) on SDO, and showed a cusp-shaped feature in the high-temperaturecoronal bands. Such a cusp, in an eruptive flare, would provide evidence of ongoing mag-netic reconnection in the current sheet formed in the aftermath of a flux-rope expulsion, butin this case it requires a different interpretation. There are two arcades involved in the event,one of which has a filament that does not erupt – possibly due to the strong confining field– and a long-duration flare. These properties also usually point to the standard flare modelof an eruptive flare, with reconnection continuing to extract energy from the field and causethe formation of the arcade of flare loops. In this case, Liu et al. (2014) suggested that newemergence of magnetic field in the region of the second arcade triggered the events.
More recently a remarkable active region in October 2014, NOAA 12192, produced a se-ries of X-class flares that were non-eruptive. Thalmann et al. (2015) analyzed these events,and found, by using global magnetic field modeling, the existence of a strong north–southlarge-scale magnetic field that could serve to confine the flare process to the core of the active
1764 L.K. Harra et al.
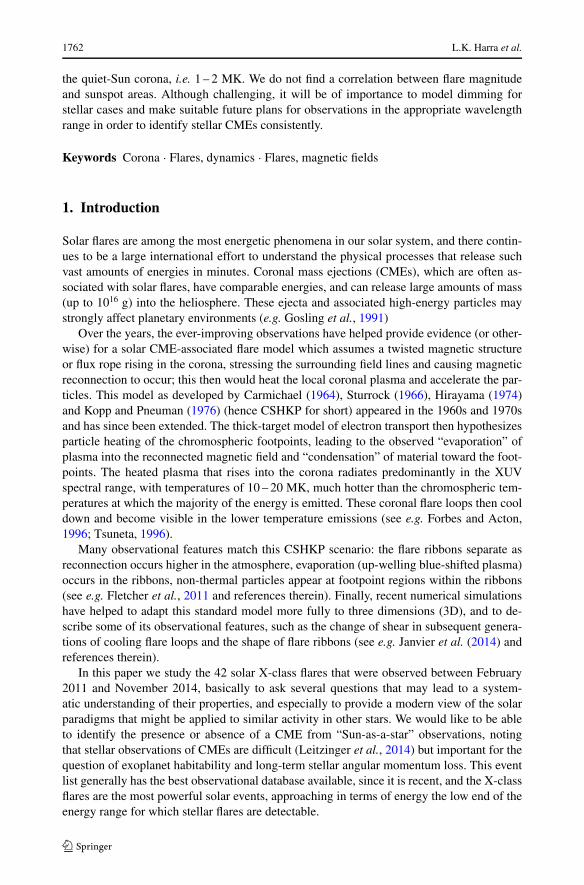
Table 1 The X-class flare sample.
IAU GOES Location AR Areaa Eruptive? SEP?
SOL2011-02-15T01:56 X2.2 S20W10 1158 450 Yes Yes
SOL2011-03-09T23:23 X1.5 N08W09 1166 550 No No
SOL2011-08-09T08:05 X6.9 N17W69 1263 450 Yes Yes
SOL2011-09-06T22:20 X2.1 N14W18 1283 220 Yes Yes
SOL2011-09-07T22:38 X1.8 N14W28 1283 200 Yes Yes
SOL2011-09-22T11:01 X1.4 N11E60 1302 480 Yes Yes
SOL2011-09-24T09:40 X1.9 N12E60 1302 840 Yes Yes
SOL2011-11-03T20:27 X1.9 N22E63 1339 560 No No
SOL2012-01-27T18:37 X1.7 N27W71 1402 270 Yes Yes
SOL2012-03-05T04:09 X1.1 N17E52 1429 700 Yes Yes
SOL2012-03-07T00:24 X5.4 N17E15 1429 1120 Yes Yes
SOL2012-03-07T01:14 X1.3 N22E12 1430 1120 Yes Yes
SOL2012-07-06T23:08 X1.1 S13W59 1515 670 Yes Yes
SOL2012-07-12T16:49 X1.4 S15W01 1520 1320 Yes Yes
SOL2012-10-23T03:17 X1.8 S10E42 1598 370 No No
SOL2013-05-13T02:17 X1.7 N12E67 1748 250 Yes Yes
SOL2013-05-13T16:05 X2.8 N11E85 1748 250 Yes Yes
SOL2013-05-14T01:11 X3.2 N12E67 1748 250 Yes No
SOL2013-05-15T01:48 X1.2 N12E64 1748 310 Yes Yes
SOL2013-10-25T08:01 X1.7 S08E59 1882 100 Yes Yes
SOL2013-10-25T15:03 X2.1 S08E59 1882 100 Yes Yes
SOL2013-10-28T02:03 X1.0 N04W66 1875 790 Yes Yes
SOL2013-10-29T21:54 X2.3 N06W91 1875 770 Yes No
SOL2013-11-05T22:12 X3.3 S12E46 1890 830 Yes No
SOL2013-11-08T04:26 X1.1 S14E15 1890 920 Yes No
SOL2013-11-10T05:14 X1.1 S14W13 1890 660 Yes No
SOL2013-11-19T10:26 X1.0 S13W79 1893 480 Yes Yes
SOL2014-01-07T18:32 X1.2 S12W08 1944 1415 Yes Yes
SOL2014-02-25T00:49 X4.9 S12E82 1990 250 Yes No
SOL2014-03-29T17:48 X1.0 N11W32 2017 150 Yes No
SOL2014-04-25T00:23 X1.3 S17W91 2035 70 Yes No
SOL2014-06-10T11:42 X2.2 S15E80 2087 0 Yes No
SOL2014-06-10T12:52 X1.5 S17E82 2087 0 Yes No
SOL2014-06-11T09:06 X1.0 S18E65 2087 100 Yes No
SOL2014-09-10T17:45 X1.6 N14E02 2158 420 Yes Yes
SOL2014-10-19T05:03 X1.1 S13E42 2192 1240 No No
SOL2014-10-22T14:28 X1.6 S14E13 2192 2410 No No
SOL2014-10-24T21:46 X3.1 S16W21 2192 2740 No No
SOL2014-10-25T17:08 X1.0 S16W31 2192 2510 No No
SOL2014-10-26T10:56 X2.0 S18W40 2192 2570 No No
SOL2014-10-27T14:47 X2.0 S17W52 2192 2750 No No
SOL2014-11-07T17:26 X1.6 N15E33 2205 360 Yes No
aSpot area in millionths of the solar hemisphere (3 × 1012 cm2), at 00:00 UT.

X-Class Flares and CMEs 1765
region. The flare ribbons had large separations early in the process, suggesting reconnectionhigh in the corona and remote from the photospheric inversion line. As with SOL2011-11-13, the light curves give the appearance of a LDE (a “long-duration” or “long-decay” event;see e.g. Kahler, 1992). Thalmann et al. (2015) suggested that the non-thermal electron dis-tribution was very steep during the entire flare, and that the total energy was relatively highfor its GOES class. Sun et al. (2015) also studied this unusual region and found that althoughit was physically very large, its core had only weak non-potentiality, again suggesting thatthe over-lying field was relatively strong.
Another non-eruptive event (SOL2004-07-14) shows an extended period of contractionof over-lying loops in an extended (≈ 30-min) pre-impulsive phase (Kushwaha et al., 2015).The contraction coincided with plasma heating. This was followed by a normal impulsivephase during which the eruption of a flux rope occurred. The flux rope, however, remainedconfined beyond a certain height: such events are typically referred to as failed eruptions(e.g. Zirin et al., 1969; Ji et al., 2003; Gilbert, Alexander, and Liu, 2007; Joshi et al., 2015).In SOL2004-07-14, multiple coronal microwave sources are detected along the trajectory,possibly caused by the interaction of the contracting magnetic flux rope with the surround-ing magnetic field (cf. Fárník et al., 2003). Both the pre-flare situation and the over-lyingmagnetic field strength and orientation appear to play key roles in determining whether ornot a full eruption can occur.
3. Implications for CMEs from Other Stars
One of our interests in studying X-flares is that they are the largest flares seen on the Sunand the closest in energy to stellar flares seen in G-type stars. The largest ever flare to-tal bolometric energy released on the Sun is of the order of 1032 erg (Kretzschmar, 2011;Schrijver et al., 2012). However, flares on other solar-type stars have an energy which is 10to 104 times that of the largest solar flare (Schrijver and Beer, 2014). The Sun is observedcontinuously by a fleet of spacecraft and we can determine, after the event, whether there isa CME associated with the flare or not, and the potential impact on the Earth’s environment.It is obviously not a trivial task to determine whether another solar-type star has produceda CME with a large flare, but understanding that is of great importance to understandingthe likely environment around exoplanets. (Drake et al., 2013) made comparisons of so-lar power-law relationships to stellar energies to extrapolate what mass loss may be possiblefrom solar-like stars. It is clear that there is potential for significant mass loss (see also Ostenand Wolk, 2015).
Only some limited indirect evidence has been reported for stellar CMEs. One signaturemay be excessive absorption during X-ray flare events (e.g. Ottmann and Schmitt, 1996;Tsuboi et al., 1998), perhaps due to the presence of cool material from erupting filaments.Blue-shifted Hα emission during flares, indicating velocities of order 100 km s−1, also sup-port the presence of CMEs (Montes et al., 1999; Fuhrmeister and Schmitt, 2004). Complexbehavior of optical and ultraviolet lines during a large flare on the M dwarf AD Leo wasinterpreted in terms of various phases of a mass ejection including motion of filaments,chromospheric condensation, prominence oscillations, and the prominence eruption itself(Houdebine et al., 1993). The CME was suggested to be ejected at a velocity of 5800 km s−1,carrying a kinetic energy ≈ 300 times larger than the total emitted UV energy, or 5×1034 erg(Houdebine, Foing, and Rodono, 1990).
The recent results from Kepler have allowed a larger statistical study of large flares onother solar-type stars. For example, Maehara et al. (2015) have studied 187 ‘super flares’

1766 L.K. Harra et al.
and found a power-law distribution of the occurrence frequency and flare energy which isnot too dissimilar to equivalent power-laws on the Sun (see e.g. Figure 3 in Schrijver et al.,2012). In addition they found a relationship between the flare duration and the flare energy.Some physical processes on solar-type stars may be similar to those on the Sun, with theadditional complexity that many of the G-type stars will be faster rotators and the sunspotgroups may be larger (Candelaresi et al., 2014). What certainly is not clear is under whatsituations a CME is produced on other stars.
In this paper we explore 42 X-class solar flares that have been observed since SDO waslaunched in 2010 until November 2014. Our aim was to determine whether there was anyparticular characteristic that could distinguish between large eruptive flares and non-eruptiveflares, with the end goal of applying that knowledge to stellar flares.
4. Data Analysis
We have used multiple instrument data from multiple spacecraft in order to probe the X-flares and seek answers to the questions we have posed. The data sources that we used aresummarized here, and their implications for our questions are addressed in Section 5.
4.1. GOES
The solar flare classification we use throughout this paper is that derived from the X-rayspectrometers (XRS) on the GOES spacecraft (1 – 8 Å band). This defines flares logarith-mically as A, B, C, M, and X, where the peak fluxes are in the range 10−7 – 10−2 W m−2.Each logarithmic X-ray class is divided into a linear scale from 1 to 9 (e.g., X3 means3 × 10−4 W m−2). The GOES energy itself represents only a small fraction, typically below1 %, of the total flare energy (e.g. Emslie et al., 2012), and the GOES spectral responsepeaks at photon energies well above kT , where T is the dominant flare temperature (e.g.White, Thomas, and Schwartz, 2005).
We have used the parent 2-s GOES data sampling to define time scales for each event:e-folding rise and decay times, and durations at half maximum (FWHM) of the 1 – 8 Å band.These time scales are not the standard ones that NOAA reports, but have less dependenceon the probably unrelated background flux level. This is also a measurement made on stellarlight curves and is typically used in the optical band.
4.2. The Hinode EUV Imaging Spectrometer (EIS)
The Hinode/EIS (Culhane et al., 2007) is a scanning slit spectrometer observing in two wavebands in the EUV: 170 – 210 Å and 250 – 290 Å. The spectral resolution is 0.0223 Å pixel−1,which allows velocity measurements of a few km s−1. We analyzed data from EIS to explorethe temperature at which the flows change from red-shifted to blue-shifted during a flare. Thestandard calibration was used through the routine eis_prep. Additionally, the slit tilt and theorbital variation of the line position were corrected. For each pixel we fitted the line usinga single Gaussian profile producing an intensity and Doppler-velocity “sparse image” foreach raster scan.

X-Class Flares and CMEs 1767
4.3. SDO/EVE
The Extreme ultraviolet Variability Experiment (EVE; Woods et al., 2012) onboard SDOmeasures the solar EUV irradiance from 6 to 105 nm with spectral resolution (0.1 nm),at 10 s cadence available for most of the interval we study. These data and those fromGOES/XRS represent simple Sun-as-a-star observations with no image resolution.
4.4. Areas
An active region typically consists of sunspots and their associated plage, both of whichindicate the presence of intense magnetic fields. We make use of spot areas from NOAA andSDO here, noting that the spot/plage area fractions of an active region vary by a large factorduring the evolution of a given region (e.g. LaBonte et al., 1984).
4.5. SDO/AIA
SDO/AIA observes the Sun in seven EUV and three UV channels with a pixel size of 0.6 arc-sec and a time cadence of 12 s. AIA data were analyzed to study the light curves of the flaringregions, and to study the temporal and spatial changes with temperature of the X-flares.
4.6. Hard X-Rays and γ -Rays
There are two sources of hard X-ray and γ -ray data during our interval of interest, theReuven Ramaty High-Energy Solar Spectroscopic Imager (RHESSI; Lin et al., 2002) andthe Fermi Gamma-ray Space Telescope (FERMI; Atwood et al., 2009), neither of whichhave complete time coverage because of orbit properties. FERMI is designed mainly toprobe non-solar high-energy phenomena, whereas RHESSI is optimized for the Sun. Whilenot a solar-dedicated facility, FERMI has detected many solar flares since its launch. Itcarries two instruments: the Large Area Telescope (LAT), which provides observations ofgamma rays in the energy range 20 MeV to 300 GeV, and the Gamma-ray Burst Monitor(GBM), which is sensitive to energies between 8 keV and 40 MeV. We make use of the LATdata only to determine whether or not a flare had an associated high-energy gamma-raysignature.
4.7. SOHO/LASCO
The Large Angle Spectroscopic Coronagraph (LASCO; Brueckner et al., 1995) is a coron-agraph package which carries two externally occulted coronagraphs that observed from 1.5to 30 solar radii. We made use of the LASCO CME catalog1 in order to determine whetherthe X-flares had CMEs associated with them.
5. The Flares
We choose a time period from when SDO/AIA data were available in May 2010 untilNovember 2014. During this period 42 X-flares occurred and nine had no CMEs of any sig-nificance. Table 1 summarizes the X-flares. The CMEs were determined from the LASCO
1http://cdaw.gsfc.nasa.gov/CME_list/index.html

1768 L.K. Harra et al.
Figure 1 Flare magnitudescompared with the sunspot areas(in millionths of solarhemisphere, MSH) in the sourceregions. The blue points are theevents without CMEs, and the redpoints are those with CMEs. Allregions have longitudes within±75◦ of central meridian; boxedpoints come from AR 2192.
catalog. The events were thus described as either eruptive or non-eruptive. Note, however,that this is an extreme case of small-number statistics, since 6/9 of the non-eruptive flaresin our sample came from the single region NOAA 12192. We also determined whether theevents had solar energetic particles (SEPs) related to them or not. It is generally acceptedthat SEPs can be accelerated through two methods (Masson, Antiochos, and DeVore, 2013)– through impulsive flare that inject particles in the heliosphere via open field lines andthrough CMEs through which shock fronts play an important role in the acceleration pro-cess (Reames, 2013). There were many examples of there having been an eruption but noSEPs found. There were no examples where there was no eruption but SEPs were found.
As a simple overview of these events, we show the correlation between flare magnitudeand sunspot area in Figure 1. Indeed there is no apparent correlation, in spite of the fact thatour sample contains as many as 42 events. Thus we confirm that X-class flares can occur inregions with minimal sunspot area. The next subsections describe the questions we aim toaddress in order to challenge preconceptions of the behavior of X-flares and also to searchfor a signature distinguishing feature between flares with and without associated eruptions.
5.1. Do All Eruptive Flares Have Long Durations?
Some CME-associated flares have distinctly long decay times in soft X-rays, a fact reflectedin the Pallavicini classification and described, for example, by Kahler (1992). On the otherhand, some highly impulsive flares, with short decay times, also have CME associations. Werevisit this question for our X-class flare sample here. The LDE association could reflect theinfluence of the large-scale field on eruptive flares. The CSHKP model envisions the gradualreconnection of higher and higher fields, with correspondingly longer time scales. The clearpresence of loop arcades and soft X-ray cusp structures in many such events encourages thisview (e.g. Svestka, 1986).
Several statistical studies have already tackled this question. Harrison (1995) exploredthis relationship in detail to examine the view that the brighter and longer-duration flaresare more likely to be associated with CMEs. He found that CME onsets are associated withflares of any duration with ≈ 6 % of flares having less than 1 hour duration and 60 % undertwo hours. The peak GOES intensities of CME-associated flares could be of any value, butthey are systematically larger than for the average solar flare. Andrews (2003) also carriedout a statistical study of 311 M and X-class flares and their SOHO/LASCO and EIT datasets.
X-Class Flares and CMEs 1769
This study found that 40 % of the M-class flares did not have an associated CME. This alsosupports the work of (Harrison, 1995) where the intensity and duration of flares were foundnot to guarantee a CME association. More recent statistical work also making use of theSOHO/LASCO data was carried out by (Yashiro et al., 2005) who analyzed 1301 X-rayflare events. These authors found that the CME-associated flares increased monotonicallywith flare GOES class from about 20 % for C-class flares to 100 % above the X3 level. Oursample (see Table 1) has extended this limit very slightly, noting the X3.1 event SOL2014-10-24. Yashiro et al. (2005) found that CMEs associated with the X-flares were faster andhave wider extents, measured as the opening angles, than those associated with the weakerC-class flares.
In this section we explore the durations of X-flares for those with and without CMEsby analyzing the GOES X-ray data. The NOAA time scales have an ad hoc definition ofthe 1 – 8 Å onset time, and take the return to 50% of the peak flux as the end time. Thesedefinitions have obvious systematic biases in terms of physical properties. Here we insteaddefine the rise and fall times as logarithmic derivatives of the flux S, or τ = S/S, taken at thehalf-maximum times. These definitions also have systematic biases, in that they ignore theinteresting complexity of the GOES light curves, but they definitely reduce the biases in theNOAA definitions. Our method takes the pre-flare minimum (also an ad hoc assumption)and computes the FWHM and e-folding rise and fall times based on the excess 1 – 8 Å fluxabove this background level. One remaining systematic bias in this approach is that manyevents show a two-stage exponential time decay; measuring the e-folding decay time at thehalf-maximum point may systematically miss the longer time scale, if present, but it doesreflect the energetics of the flare (the impulsive phase) more closely.
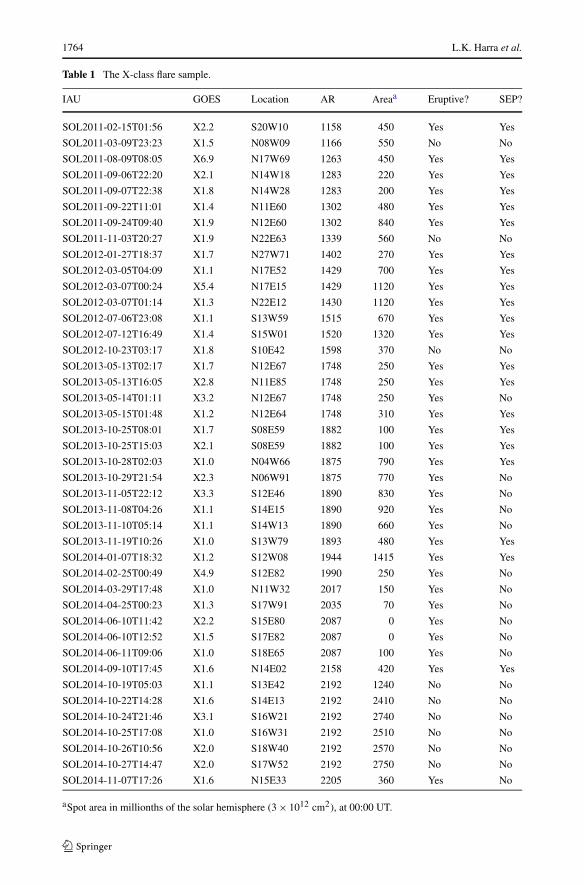
Figure 2 shows the results of using the new time-scale definitions. The flare duration withflare date (top panel) shows a clearly non-random pattern, but there is no clear discriminationbetween events with and without CMEs. The lower figure shows the FWHM decay time vs.the FWHM rise time. In this case there is an approximate linear relationship between therise and decay times, with a longer rise time leading to a longer decay time. However, thereis again no distinguishing behavior for the flares with no associated CME. Figures 3 and 4
Figure 2 Top panel: flareduration (FWHM) vs. date ofevent. Crosses indicate eruptiveevent, diamonds non-eruptive.Bottom panel: decay time vs. risetime. These correlate, but theyreveal no distinguishingdifference between the twoclasses of events.

1770 L.K. Harra et al.
Figure 3 GOES soft X-ray light curves for four eruptive flares, each plot with the same 9 h time range.
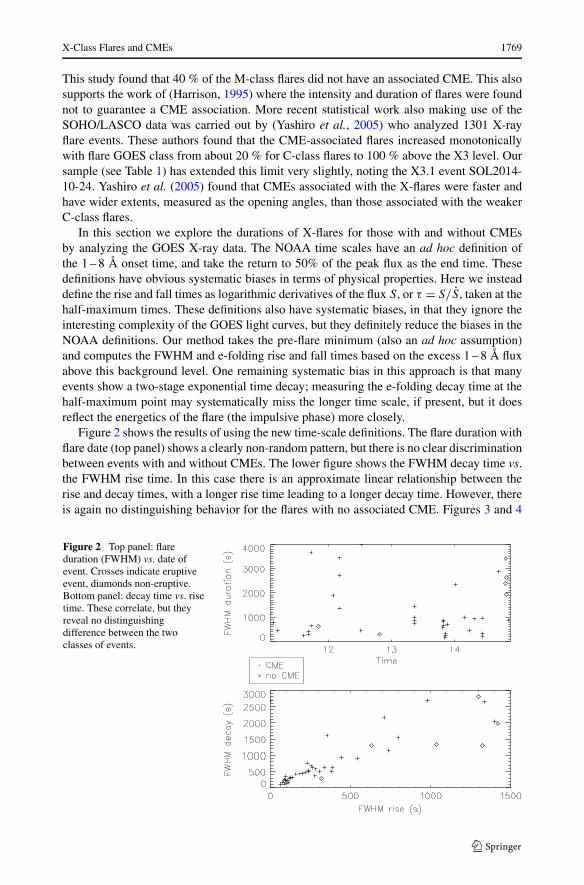
show examples of GOES lightcurves for events that are eruptive and those that are not. Itclear that in both cases the behavior can be either very impulsive and short-lived or long-duration, but not always with an extended tail in both categories.
The lack of correlation between duration and eruptive behavior is maybe unexpectedwhen the ‘standard’ flare model is considered. As discussed in the introduction, this may bedue to the fact that the over-lying field is important in the process. The flaring process itself,in the core of the active region, will determine whether or not an eruption occurs. It is alsoclear that to understand each individual case, detailed modeling is required.
The statistical conclusions cannot be strong ones here, both because of the small samplebut also because of the clear non-randomness of the occurrence of events: the 41 eventscome from only 21 unique active regions, with the unusual region NOAA 12192 producingsix of the 41 events.
5.2. Does Spot Area Correlate with Flare Magnitude?
Figure 1 shows that no spot area–flare magnitude correlation exists within our database, yetit is widely believed that active regions with the most complex and largest sunspot groupsare more likely to produce more powerful flares (Sammis, Tang, and Zirin, 2000). Such
X-Class Flares and CMEs 1771
Figure 4 GOES soft X-ray light curves for four non-eruptive flares, with the same time scale as that ofFigure 3.
characteristics are measured in flares and used as input into space weather flare forecasts,and so it is important to understand clearly what is meant – our result seems to contradictthe conclusions of Sammis, Tang, and Zirin (2000). The explanation probably lies in the factthat Sammis, Tang, and Zirin (2000) used the maximal flare and maximal area for a givenregion, ignoring the time variation; their resulting correlation presumably relates more tothe availability of a magnetic field than to its organization into sunspots per se.
5.3. Does a Larger Spot Area Mean a Longer Duration Flare?
As discussed in the previous subsections, the duration of the flare is important in terms ofthe amount of energy emitted in the X-ray and EUV. Here, we measure the size of the activeregions in which the X-flares occurred using HMI continuum data. Only active regions thatwere within 45◦ of disk center were analyzed. After subtracting the center-to-limb variation(so-called limb darkening) and the projection effect, the area was assumed to be that withintensity less than 0.85〈IQS〉, where 〈IQS〉 is the averaged intensity of the quiet Sun. This isequivalent to the total area of umbrae and penumbrae. Figure 5 shows the results. There isa general relationship between the duration of the flare and the area of the sunspot group

1772 L.K. Harra et al.
Figure 5 Flare duration vs.sunspot area, weakly suggestinga correlation. The pluses showactive regions that had eruptiveflares and the diamonds, mostlyfrom AR 2192, non-eruptiveflares.
with scatter. Although only two active regions for events that are non-eruptive are shown(ARs 11166 and 12192), most of them are seen toward the right-hand side of the plot. Thismay indicate that if the active region is larger, it may have stronger over-lying magneticfields, which could inhibit the ascending filament from becoming a CME (Sun et al., 2015).
5.4. What Fraction of an Active Region is Involved in a Flare?
Following on from the previous section, the area of the active region actually involved inthe flare is explored. This is determined by analyzing the size of the flare ribbons. Previousstudies of flaring active regions have shown that only a fraction of their field is involved inthe conversion of energy. This can be estimated by measuring the area swept by the flareribbons, since they delimit the area where the magnetic flux has reconnected. For example,Qiu et al. (2007) and Kazachenko et al. (2012) reported on a dozen of flaring events andfound that the percentage of an active region involved in a flare ranged between 10 % and30 %, on average. How does this proportion compare with our set of X-class flares?
The active region itself is defined from the HMI magnetograms where Bz > 100 gauss(G). Several other thresholds have been chosen for comparison, but this value is chosenfor consistency between the different X-flare regions. It is also the threshold of backgroundtransverse field error or noise estimated in Wiegelmann and Inhester (2010). The HMI mag-netograms are used. In these cases only the disk active regions were analyzed to avoid issueswith line-of-sight effects. Figure 6 shows an example of how the flaring region was defined.Table 2 summarizes the results. There is a range from 7 % to 41 % flaring region as a per-centage of the total active region. It might be expected that the larger the area delimited bythe flare ribbons, the higher altitude reconnection will take place (from the standard flaremodel scenario). If this is the case, then it might be expected that the higher altitude recon-nection takes place, the more chance there is for plasma to find a means to escape from theSun and form a CME. However, there is no significant difference between the eruptive andnon-eruptive case. This may support the idea that the behavior of flare ribbons also dependson the flux surface they interact with: in some cases the flare ribbons of the leading, com-pact polarity do not move much, while the ones in the trailing polarity do. An example ofextended flare ribbons right at the start of the flare was described by Thalmann et al. (2015).
Studying the ratio of the surface that is typically involved in the flare for an active regioncan also help estimate the energy associated to stellar flares. As was discussed in Aulanieret al. (2013), the size of an active region as well as the magnetic field intensity concentratedin a main bipole can help obtain an upper limit on solar as well as stellar flares. Such es-timations may be tested in the future with more accurate estimations of active region onstars (or starspots) as well as the magnetic field intensity obtained with spectropolarimetricobservations.

X-Class Flares and CMEs 1773
Figure 6 Active region NOAA 1520. On the left shows the flare ribbons as seen in the 1700 Å bandpass,and the right shows the magnetogram. The magnetogram is shown in the solar local coordinates. The red boxhighlights the area that the flare ribbons encompass. This was an eruptive X-class flare.
Table 2 A table summarizing the date, location, GOES class, whether or not there was a CME, and the ratioof the region of the active region involved in flaring defined by the flare ribbons relative to the total area ofthe active region.
Date Location GOES class CME? Area fraction (%)
SOL2011-02-15T01:56 S20W10 X2.2 yes 12
SOL2011-03-09T01:56 N08W11 X1.5 no 16
SOL2011-08-09T08:05 N14W69 X6.9 yes 9.3
SOL2011-09-06T22:20 N14W18 X2.1 yes 4
SOL2011-09-07T22:38 N14W31 X1.8 yes 41
SOL2012-03-07T00:24 N18E31 X5.4 yes 36
SOL2012-03-07T01:14 N15E26 X1.3 yes 13
SOL2012-07-12T16:49 S13W03 X1.4 yes 13
SOL2013-11-08T04:26 S14E15 X1.1 yes 7
SOL2013-11-10T05:14 S14W13 X1.1 yes 7
SOL2014-10-22T14:28 S14E13 X1.6 no 12.7
SOL2014-10-24T14:28 S16W21 X3.1 no 15.5
5.5. Do X-Flares with No Eruptions Have More Non-thermal Energy?
The energy conversion that occurs in a flare has, in a very simplistic way, three routes tobe expended (e.g. Canfield et al., 1980; Wu et al., 1986; Emslie et al., 2012). The first isnon-thermal energy, observed through hard X-ray and gamma-ray emission, the second isthermal emission, observed through heating of the plasma, and the last is via the bulk motionobserved if there is an ejection or CME. A high percentage of the non-thermal energy willbe converted into thermal energy at a later stage. Some of this can be observed through theevaporation process, again to be radiated at a later stage. This will be discussed in the nextsection. In this section we study whether the non-eruptive flares have more non-thermalenergy relative to eruptive flares of a similar GOES class. To investigate this premise wefitted the FERMI data over the range 15 – 150 keV using a combination of a thermal and athick-target model, and from this we derived the associated non-thermal energy. Only 22 ofthe 42 X-flares were observed by FERMI, and Figure 7 illustrates the non-thermal energyderived from the spectral fitting as a function of time and also with GOES intensity. As

1774 L.K. Harra et al.
Figure 7 The top plot shows theflare non-thermal energy versustime, with the eruptive andnon-eruptive flare identified. Thelower plot shows the non-thermalenergy versus the GOESintensity.
was pointed by Thalmann et al. (2015) the October 2014 X-flares have some of the highestenergies measured. However, the other regions that have no eruptions showed lower non-thermal energies and regions that have eruptions also reach similar non-thermal energiesthan those with no eruptions. Once again, there appears to be no clear distinction betweenthe eruptive and non-eruptive flares.
5.6. Evaporation in Flares – Is This Different in Eruptive and Non-eruptiveFlares?
As discussed in the introduction, evaporation of chromospheric plasma is expected follow-ing the impact of a non-thermal energy beam in the chromosphere. In the work by Milliganand Dennis (2009) was found evidence of evaporated plasma in emission lines with tempera-tures from 2 – 16 MK. The up-flow velocity was found to scale with temperature. The lowertemperature lines from 0.5 – 1.5 MK were found to be red-shifted (down-flows) and wereinterpreted as being characteristic of explosive evaporation. These down-flows were foundto occur at temperatures higher than expected before, which needs to be understood. In astudy by Doschek, Warren, and Young (2013) evaporation of the hotter emission was foundin multiple locations. Interestingly, observations were by chance made at the site close to thesite of particle impact onto the chromosphere and the hotter emission had a source with noblue-shifted components, but with strong down-flows seen in cooler lines, such as Fe XIII
and Fe XIV. It was hypothesized that this was due to a downward shock produced during thereconnection process. Recent results from the IRIS mission have also shown similar resultsbut with strong down-flows seen in Fe XXI spatially coincident with the loop top – consistentwith hot-retracting loops for example (Tian et al., 2014). Sadykov et al. (2015) found evapo-ration flows in the Fe XXI ion in a flare. Polito et al. (2015) found that after this blue-shiftedplasma was observed, the Fe XXI intensity slowly moved from the footprints to the top of theflare loops. The location of the flows during a flare and the temperature they appear at areclearly important in order to try to understand the physical processes going on. Followingon from the previous section, we studied the temperature at which the flows change from

X-Class Flares and CMEs 1775
Figure 8 An example of the temperature behavior of the Doppler flows for an X-flare which is not-eruptiveis shown in (a) and (b). The black and white image is a 193A image. The black contours are the 12 – 25 keVRHESSI maps. (a) shows red contours which are Doppler velocity for the EIS Fe XII ion. (b) shows bluecontours which are Doppler velocities for the EIS Fe XV ion. The red contours indicate red-shifted plasmaand the blue indicate blue-shifted plasma. The velocity ranges between 20 - 60 km s−1. (c) and (d) show thesame plots for an eruptive flare. The same behavior is seen in the red- and blue-shifted plasma.
red-shift to blue-shift in each of the X-flares that had EIS observations. The number of flaresis limited due to the small field of view of the spectrometers, but we have examples of flaresthat are both eruptive and non-eruptive. We tested whether in non-eruptive flares the flowsmay appear at different temperatures due to different partition of energy. There were threeexamples for eruptive flares and five for non-eruptive flares. Figure 8 shows an example ofa non-eruptive flare and of an eruptive flare. As in the paper by Milligan and Dennis (2009)the change between red- and blue-shifted plasma occurs above the temperature of the FeXII ion. There is no difference between the eruptive and non-eruptive examples; hence thereseems to be no difference in the location of the energy deposition.
5.7. Is EUV Dimming Only Seen in Eruptive Flares?
Coronal dimming, suggestive of a CME occurrence, first appeared in day-on-day changesin the white-light corona (Hansen et al., 1974) as “depletions”. The Skylab observationsrevealed sudden changes in the X-ray emission corona as well – “transient coronal holes”(Rust and Hildner, 1976) – well before CMEs had been identified as such. The Yohkoh softX-ray data, with good sampling, revealed that these dimmings of the X-ray corona occurredsystematically and could have a relationship with CMEs (Hudson and Webb, 1997). Sterlingand Hudson (1997) found that the sources of the dimming were predominantly at the endsof a pre-flare sigmoid structure, suggesting that the dimming was caused by an erupting fluxrope.
Thompson et al. (2000) imaged seven events observed in the EUV and found that dim-mings and CMEs coincided in each case. These dimmings can be large scale, reaching largedistances from the active-region core. Using SOHO data, Reinard and Biesecker (2008) car-ried out a statistical study to determine the link between EUV dimmings and CMEs. Theyfound that indeed all such dimmings were associated with CMEs. Conversely not all CMEs

1776 L.K. Harra et al.
were associated with dimmings; these uncorrelated events tended to be related to the slowerCMEs. Spectroscopic observations using SOHO/CDS (Harra and Sterling, 2001) and morerecently Hinode/EIS (Harra et al., 2007), have confirmed that the dimmings are regions ofup-flowing expanding plasma, rather than temperature shifts (cf. Hudson, Acton, and Free-land, 1996). Mason et al. (2014) described SDO/EVE data, which show the major dimmingsclearly in integrated EUV Sun-as-a-star spectroscopy. These data, with 0.1 nm spectroscopicresolution and excellent signal-to-noise ratio, are available for our entire sample. The Masonet al. (2014) analysis used an automated technique to search for dimmings, and it found 263,again concluding that the major explanation of an EUV dimming was an actual ejection ofa part of the pre-flare corona, consistent with the broad-band observations in white light andsoft X-rays.
We illustrate the EVE dimming measurements in Figure 9, which displays light curvesof SOL2012-03-07 in a range of ionization states of iron, Fe IX through Fe XXIV. Dimmingappears in low-excitation states beginning near the peak of the flare in high-excitation states.These time series show all aspects of the flare/CME development insofar as they can berecognized in non-imaging observations. The lines at lowest temperatures, Fe XVIII–Fe XII,have the cleanest dimming signatures, implying that most of the CME material comes fromthe ambient corona rather than the active region itself.
Figure 9 provides an overview of some of the EVE spectroscopy, but may have too muchinformation. Thus we plot more limited sets of data for SOL2012-03-07 and for the non-eruptive event SOL2011-11-03 in Figures 10 and 11, respectively. These select four lines(Fe X, XV, XXI, XXIV) at peak (logarithmic) formation temperatures of [6.0,6.4,7.0,7.3],respectively. The impulsive X-class flare SOL2011-11-03 did not involve a CME or a dim-ming, but within a few hours a remote event on the invisible hemisphere (Gómez-Herreroet al., 2015) produced a CME, SEPs, and apparently also the gradual dimming that one seesin Fe X here (Figure 11) beginning at about 4 November 00:30 UT.
6. Discussion
The aim of the paper was to explore whether there are differences in large flares betweenthose that are eruptive and those that are not eruptive. We studied seven questions that eithercome from preconceptions about large flares, or a physical expectation of how energy willbe distributed in X-flares with or without CMEs. These included:
• Do large sunspot areas correspond to more powerful flares? In our sample, they do not,but averaged over an active-region lifetime, Sammis, Tang, and Zirin (2000) found a rea-sonable correlation. This behavior may suggest that the sunspots themselves have little todo with the flares, while of course the magnetic flux does.
• Do all eruptive flares have a long duration? It appears they do not. Some X-class flareswith CMEs showed a very impulsive rise time, and short durations, and some X-classflares without CMEs were long-duration events.
• Do CME-related flares stand out in terms of active-region size vs. flare duration? Thismight be expected in the sense that if you have more wide-spread magnetic fields, thenthere is a greater volume in which reconnection can take place. There is indeed a roughcorrelation here. Moreover, we found the tendency that for the flare events with the samedurations, CME-poor ARs have larger spot areas. This may be because larger ARs haveover-lying fields to inhibit the CME eruptions.

X-Class Flares and CMEs 1777
Fig
ure
9SD
O/E
VE
light
curv
esfo
rSO
L20
12-0
3-07
.Eac
hpa
nels
how
sa
15-h
time
seri
esof
anem
issi
onlin
ein
adi
ffer
enti
oniz
atio
nst
ate
ofFe
,fro
mFe
XX
IVin
the
uppe
rle
ftto
FeIX
inth
elo
wer
righ
t.T
heve
rtic
alda
shed
line
show
sG
OE
Spe
ak,a
ndth
eho
rizo
ntal
dash
edlin
esh
ows
the
pre-
flare
leve
l(gi
ven
inth
etit
leof
each
pane
lin
irra
dian
ceun
itsm
Wm
−2nm
−1).
The
dim
min
gco
mm
ence
spr
ompt
lyat
the
impu
lsiv
eph
ase
ofth
efla
re,w
hich
also
exci
tes
earl
yem
issi
onin
the
low
-exc
itatio
nlin
es.

1778 L.K. Harra et al.
Figure 10 SDO/EVE light curves for SOL2012-03-07, in a similar format as before to that of Figure 9, butnow with fewer lines and a shorter time interval; also an ion with the peak dimming signature (Fe X) is in theupper left, with the hottest line (Fe XXIV) in the lower right. This event shows prompt dimming and had anaccompanying CME.
• Is the occurrence of CMEs related to the fraction of active-region area involved? Thehypothesis here is that larger flare ribbons would indicate higher altitude reconnection,which might make it easier for eruptions to escape. However, we found no differencebetween those with and without CMEs.
• Do X-flares with no eruptions have greater non-thermal energy? For those flares wherenon-thermal energy was estimated from the FERMI data there was no systematic differ-ence between the flares with and without CMEs.
• Is the temperature dependence of evaporation different in eruptive and non-eruptiveflares? Once again, we found no difference between flares with or without CMEs.
• Is EUV dimming only seen in eruptive flares? Yes – EUV dimming is seen for all eruptiveX-flares and the dimming will start within an hour after the peak of the flare.
The only characteristic that seems to show a consistent difference between flares withand without CMEs is that of coronal dimming. This can be observed distinctly in the spa-tially unresolved EUV light curves from EVE, in principle providing an ideal candidate forcomparison with the stellar case. However, it is difficult to have similar spectral coverage forthe stellar observations. The NASA Extreme Ultraviolet Explorer (EUVE; Bowyer, Malina,and Marshall, 1988), which stopped observing in 2001, had the closest overlap in wavebandscovering 90 – 150 Å, 180 – 350 Å. To our knowledge EUVE data provided no evidence forcoronal dimming events. Modeling and theory should be developed to understand the dim-ming process not only for the Sun, but also for the case of larger sunspot groups, and onfaster-rotating stars. It would be of use to simulate the optimum waveband where dimmingcould be seen, and to plan to cover this range in future stellar missions. In the solar caseit is around 1 MK, but it may well be hotter in other stars (if the phenomenon actually ex-

X-Class Flares and CMEs 1779
Figure 11 SDO/EVE light curves for SOL2011-11-03, in the same format as that of Figure 10. This eventshows no prompt dimming and had no CME.
ists) with hotter quiescent coronae. We would expect this from more extensive and strongermagnetic fields on more active stars.
Acknowledgements The authors thank ISSI for the support of the solar-stellar team. This CME catalogis generated and maintained at the CDAW Data Center by NASA and The Catholic University of Americain cooperation with the Naval Research Laboratory. SOHO is a project of international cooperation betweenESA and NASA. The Solar Dynamics Observatory is a mission in the NASA Living With a Star program.Hinode is a Japanese mission developed and launched by ISAS/JAXA, with NAOJ as domestic partner andNASA and STFC (UK) as international partners. It is operated by these agencies in cooperation with ESA andNSC (Norway). TL acknowledges funding of the Austrian FFG within ASAP11 and the FWF NFN projectS116601-N16. MJ thanks V. Bommier for providing the UNNOFIT-inverted maps used in the active-regionarea calculations.
Open Access This article is distributed under the terms of the Creative Commons Attribution 4.0 Inter-national License (http://creativecommons.org/licenses/by/4.0/), which permits unrestricted use, distribution,and reproduction in any medium, provided you give appropriate credit to the original author(s) and the source,provide a link to the Creative Commons license, and indicate if changes were made.
References
Andrews, M.D.: 2003, A search for CMEs associated with big flares. Solar Phys. 218, 261. DOI. ADS.Atwood, W.B., Abdo, A.A., Ackermann, M., Althouse, W., Anderson, B., Axelsson, M., et al.: 2009, The
large area telescope on the Fermi gamma-ray space telescope mission. Astrophys. J. 697, 1071. DOI.ADS.
Aulanier, G., Démoulin, P., Schrijver, C.J., Janvier, M., Pariat, E., Schmieder, B.: 2013, The standard flaremodel in three dimensions, II: Upper limit on solar flare energy. Astron. Astrophys. 549, A66. DOI.ADS.
Bowyer, S., Malina, R.F., Marshall, H.L.: 1988, The extreme ultraviolet explorer mission – Instrumentationand science goals. J. Br. Interplanet. Soc. 41, 357. ADS.

1780 L.K. Harra et al.
Brueckner, G.E., Howard, R.A., Koomen, M.J., Korendyke, C.M., Michels, D.J., Moses, J.D., Socker, D.G.,Dere, K.P., Lamy, P.L., Llebaria, A., Bout, M.V., Schwenn, R., Simnett, G.M., Bedford, D.K., Eyles,C.J.: 1995, The Large Angle Spectroscopic Coronagraph (LASCO). Solar Phys. 162, 357. DOI. ADS.
Candelaresi, S., Hillier, A., Maehara, H., Brandenburg, A., Shibata, K.: 2014, Superflare occurrence andenergies on G-, K-, and M-type dwarfs. Astrophys. J. 792, 67. DOI. ADS.
Canfield, R.C., Cheng, C.-C., Dere, K.P., Dulk, G.A., McLean, D.J., Schmahl, E.J., Robinson, R.D., Jr.,Schoolman, S.A.: 1980, Radiative energy output of the 5 September 1973 flare. In: Sturrock, P.A. (ed.)Solar Flares: A Monograph from Skylab Workshop II, Colorado Associated Univ. Press, Boulder, 451.ADS.
Carmichael, H.: 1964, A process for flares. In: Hess, W.N. (ed.) AAS–NASA Symposium on the Physics ofSolar Flares, NASA SP-50, 451. ADS.
Culhane, J.L., Harra, L.K., James, A.M., Al-Janabi, K., Bradley, L.J., Chaudry, R.A., Rees, K., Tandy, J.A.,Thomas, P., Whillock, M.C.R., Winter, B., Doschek, G.A., Korendyke, C.M., Brown, C.M., Myers, S.,Mariska, J., Seely, J., Lang, J., Kent, B.J., Shaughnessy, B.M., Young, P.R., Simnett, G.M., Castelli,C.M., Mahmoud, S., Mapson-Menard, H., Probyn, B.J., Thomas, R.J., Davila, J., Dere, K., Windt, D.,Shea, J., Hagood, R., Moye, R., Hara, H., Watanabe, T., Matsuzaki, K., Kosugi, T., Hansteen, V., Wik-stol, Ø.: 2007, The EUV imaging spectrometer for Hinode. Solar Phys. 243, 19. DOI. ADS.
Doschek, G.A., Warren, H.P., Young, P.R.: 2013, Chromospheric evaporation in an M1.8 flare observed bythe extreme-ultraviolet imaging spectrometer on Hinode. Astrophys. J. 767, 55. DOI. ADS.
Drake, J.J., Cohen, O., Yashiro, S., Gopalswamy, N.: 2013, Implications of mass and energy loss due tocoronal mass ejections on magnetically active stars. Astrophys. J. 764, 170. DOI. ADS.
Emslie, A.G., Dennis, B.R., Shih, A.Y., Chamberlin, P.C., Mewaldt, R.A., Moore, C.S., Share, G.H., Vourl-idas, A., Welsch, B.T.: 2012, Global energetics of thirty-eight large solar eruptive events. Astrophys. J.759, 71. DOI. ADS.
Fárník, F., Hudson, H.S., Karlický, M., Kosugi, T.: 2003, X-ray and radio observations of the activation stagesof an X-class solar flare. Astron. Astrophys. 399, 1159. DOI. ADS.
Fletcher, L., Dennis, B.R., Hudson, H.S., Krucker, S., Phillips, K., Veronig, A., Battaglia, M., Bone, L.,Caspi, A., Chen, Q., Gallagher, P., Grigis, P.T., Ji, H., Liu, W., Milligan, R.O., Temmer, M.: 2011, Anobservational overview of solar flares. Space Sci. Rev. 159, 19. DOI. ADS.
Forbes, T.G., Acton, L.W.: 1996, Reconnection and field line shrinkage in solar llares. Astrophys. J. 459, 330.DOI. ADS.
Fuhrmeister, B., Schmitt, J.H.M.M.: 2004, Detection and high-resolution spectroscopy of a huge flare on theold M 9 dwarf DENIS 104814.7-395606.1. Astron. Astrophys. 420, 1079. DOI. ADS.
Gilbert, H.R., Alexander, D., Liu, R.: 2007, Filament kinking and its implications for eruption and re-formation. Solar Phys. 245, 287. DOI. ADS.
Gómez-Herrero, R., Dresing, N., Klassen, A., Heber, B., Lario, D., Agueda, N., Malandraki, O.E., Blanco,J.J., Rodríguez-Pacheco, J., Banjac, S.: 2015, Circumsolar energetic particle distribution on 2011November 3. Astrophys. J. 799, 55. DOI. ADS.
Gosling, J.T., McComas, D.J., Phillips, J.L., Bame, S.J.: 1991, Geomagnetic activity associated with earthpassage of interplanetary shock disturbances and coronal mass ejections. J. Geophys. Res. 96, 7831.DOI.
Hansen, R.T., Garcia, C.J., Hansen, S.F., Yasukawa, E.: 1974, Abrupt depletions of the inner corona. Publ.Astron. Soc. Japan 86, 500. DOI. ADS.
Harra, L.K., Sterling, A.C.: 2001, Material outflows from coronal intensity “dimming regions” during coronalmass ejection onset. Astrophys. J. Lett. 561, L215. DOI. ADS.
Harra, L.K., Hara, H., Imada, S., Young, P.R., Williams, D.R., Sterling, A.C., Korendyke, C., Attrill, G.D.R.:2007, Coronal dimming observed with Hinode: outflows related to a coronal mass ejection. Publ. Astron.Soc. Pac. 59, 801. DOI. ADS.
Harrison, R.A.: 1995, The nature of solar flares associated with coronal mass ejection. Astron. Astrophys.304, 585. ADS.
Hirayama, T.: 1974, Theoretical model of flares and prominences, I: Evaporating flare model. Solar Phys. 34,323. DOI. ADS.
Houdebine, E.R., Foing, B.H., Rodono, M.: 1990, Dynamics of flares on late-type dMe stars, I: Flare massejections and stellar evolution. Astron. Astrophys. 238, 249. ADS.
Houdebine, E.R., Foing, B.H., Doyle, J.G., Rodono, M.: 1993, Dynamics of flares on late-type dMe stars, 3:Kinetic energy and mass momentum budget of a flare on AD Leonis. Astron. Astrophys. 278, 109. ADS.
Hudson, H.S., Webb, D.F.: 1997, Soft X-ray signatures of coronal ejections. In: Crooker, N., Joselyn, J.A.,Feynman, J. (eds.) Coronal Mass Ejections, AGU Geophysics Monograph 99, 27. DOI. ADS.
Hudson, H.S., Acton, L.W., Freeland, S.L.: 1996, A long-duration solar flare with mass ejection and globalconsequences. Astrophys. J. 470, 629. DOI. ADS.

X-Class Flares and CMEs 1781
Janvier, M., Aulanier, G., Bommier, V., Schmieder, B., Démoulin, P., Pariat, E.: 2014, Electric currents inflare ribbons: observations and three-dimensional standard model. Astrophys. J. 788, 60. DOI. ADS.
Ji, H., Wang, H., Schmahl, E.J., Moon, Y.-J., Jiang, Y.: 2003, Observations of the failed eruption of a filament.Astrophys. J. Lett. 595, L135. DOI. ADS.
Joshi, A.D., Forbes, T.G., Park, S.-H., Cho, K.-S.: 2015, A trio of confined flares in AR 11087. Astrophys. J.798, 97. DOI. ADS.
Kahler, S.W.: 1992, Solar flares and coronal mass ejections. Annu. Rev. Astron. Astrophys. 30, 113. DOI.Kazachenko, M.D., Canfield, R.C., Longcope, D.W., Qiu, J.: 2012, Predictions of energy and helicity in four
major eruptive solar flares. Solar Phys. 277, 165. DOI. ADS.Kopp, R.A., Pneuman, G.W.: 1976, Magnetic reconnection in the corona and the loop prominence phe-
nomenon. Solar Phys. 50, 85. DOI. ADS.Kretzschmar, M.: 2011, The Sun as a star: Observations of white-light flares. Astron. Astrophys. 530, A84.
DOI. ADS.Kushwaha, U., Joshi, B., Veronig, A.M., Moon, Y.-J.: 2015, Large-scale contraction and subsequent disrup-
tion of coronal loops during various phases of the M6.2 flare associated with the confined flux ropeeruption. Astrophys. J. 807, 101. DOI. ADS.
LaBonte, B.J., Chapman, G.A., Hudson, H.S., Willson, R.C. (eds.): 1984, Solar Irradiance Variations onActive Region Time Scales, NASA CP-2310. ADS.
Leitzinger, M., Odert, P., Greimel, R., Korhonen, H., Guenther, E.W., Hanslmeier, A., Lammer, H., Kho-dachenko, M.L.: 2014, A search for flares and mass ejections on young late-type stars in the opencluster Blanco-1. Mon. Not. Roy. Astron. Soc. 443, 898. DOI. ADS.
Lemen, J.R., Title, A.M., Akin, D.J., Boerner, P.F., Chou, C., Drake, J.F., Duncan, D.W., Edwards, C.G.,Friedlaender, F.M., Heyman, G.F., Hurlburt, N.E., Katz, N.L., Kushner, G.D., Levay, M., Lindgren,R.W., Mathur, D.P., McFeaters, E.L., Mitchell, S., Rehse, R.A., Schrijver, C.J., Springer, L.A., Stern,R.A., Tarbell, T.D., Wuelser, J.-P., Wolfson, C.J., Yanari, C., Bookbinder, J.A., Cheimets, P.N., Caldwell,D., Deluca, E.E., Gates, R., Golub, L., Park, S., Podgorski, W.A., Bush, R.I., Scherrer, P.H., Gummin,M.A., Smith, P., Auker, G., Jerram, P., Pool, P., Soufli, R., Windt, D.L., Beardsley, S., Clapp, M., Lang,J., Waltham, N.: 2012, The Atmospheric Imaging Assembly (AIA) on the Solar Dynamics Observatory(SDO). Solar Phys. 275, 17. DOI. ADS.
Lin, R.P., Dennis, B.R., Hurford, G.J., Smith, D.M., Zehnder, A., Harvey, P.R., Curtis, D.W., Pankow, D.,Turin, P., Bester, M., Csillaghy, A., Lewis, M., Madden, N., van Beek, H.F., Appleby, M., Raudorf,T., McTiernan, J., Ramaty, R., Schmahl, E., Schwartz, R., Krucker, S., Abiad, R., Quinn, T., Berg, P.,Hashii, M., Sterling, R., Jackson, R., Pratt, R., Campbell, R.D., Malone, D., Landis, D., Barrington-Leigh, C.P., Slassi-Sennou, S., Cork, C., Clark, D., Amato, D., Orwig, L., Boyle, R., Banks, I.S., Shirey,K., Tolbert, A.K., Zarro, D., Snow, F., Thomsen, K., Henneck, R., McHedlishvili, A., Ming, P., Fivian,M., Jordan, J., Wanner, R., Crubb, J., Preble, J., Matranga, M., Benz, A., Hudson, H., Canfield, R.C.,Holman, G.D., Crannell, C., Kosugi, T., Emslie, A.G., Vilmer, N., Brown, J.C., Johns-Krull, C., As-chwanden, M., Metcalf, T., Conway, A.: 2002, The Reuven Ramaty High-Energy Solar SpectroscopicImager (RHESSI). Solar Phys. 210, 3. DOI. ADS.
Liu, R., Titov, V.S., Gou, T., Wang, Y., Liu, K., Wang, H.: 2014, An unorthodox X-class long-duration con-fined flare. Astrophys. J. 790, 8. DOI. ADS.
Maehara, H., Shibayama, T., Notsu, Y., Notsu, S., Honda, S., Nogami, D., Shibata, K.: 2015, Statisticalproperties of superflares on solar-type stars based on 1-min cadence data. Earth Planets Space 67, 59.DOI. ADS.
Mason, J.P., Woods, T.N., Caspi, A., Thompson, B.J., Hock, R.A.: 2014, Mechanisms and observations ofcoronal dimming for the 2010 August 7 event. Astrophys. J. 789, 61. DOI. ADS.
Masson, S., Antiochos, S.K., DeVore, C.R.: 2013, A model for the escape of solar-flare-accelerated particles.Astrophys. J. 771, 82. DOI. ADS.
Milligan, R.O., Dennis, B.R.: 2009, Velocity characteristics of evaporated plasma using Hinode/EUV imagingspectrometer. Astrophys. J. 699, 968. DOI. ADS.
Montes, D., Saar, S.H., Collier Cameron, A., Unruh, Y.C.: 1999, Optical and ultraviolet observations of astrong flare in the young, single K2 dwarf LQ Hya. Mon. Not. Roy. Astron. Soc. 305, 45. DOI. ADS.
Osten, R.A., Wolk, S.J.: 2015, Connecting flares and transient mass-loss events in magnetically active stars.Astrophys. J. 809, 79. http://stacks.iop.org/0004-637X/809/i=1/a=79.
Ottmann, R., Schmitt, J.H.M.M.: 1996, ROSAT observation of a giant X-ray flare on Algol: Evidence forabundance variations? Astron. Astrophys. 307, 813. ADS.
Pallavicini, R., Serio, S., Vaiana, G.S.: 1977, A survey of soft X-ray limb flare images – the relation betweentheir structure in the corona and other physical parameters. Astrophys. J. 216, 108. DOI. ADS.
Pesnell, W.D., Thompson, B.J., Chamberlin, P.C.: 2012, The Solar Dynamics Observatory (SDO). Solar Phys.275, 3. DOI. ADS.
1782 L.K. Harra et al.
Polito, V., Reeves, K.K., Del Zanna, G., Golub, L., Mason, H.E.: 2015, Joint high temperature observation ofa small C6.5 solar flare with IRIS/EIS/AIA. Astrophys. J. 803, 84. DOI. ADS.
Qiu, J., Hu, Q., Howard, T.A., Yurchyshyn, V.B.: 2007, On the magnetic flux budget in low-corona magneticreconnection and interplanetary coronal mass ejections. Astrophys. J. 659, 758. DOI. ADS.
Reames, D.V.: 2013, The two sources of solar energetic particles. Space Sci. Rev. 175, 53. DOI. ADS.Reinard, A.A., Biesecker, D.A.: 2008, Coronal mass ejection-associated coronal dimmings. Astrophys. J. 674,
576. DOI. ADS.Rust, D.M., Hildner, E.: 1976, Expansion of an X-ray coronal arch into the outer corona. Solar Phys. 48, 381.
DOI. ADS.Sadykov, V.M., Vargas Dominguez, S., Kosovichev, A.G., Sharykin, I.N., Struminsky, A.B., Zimovets, I.:
2015, Properties of chromospheric evaporation and plasma dynamics of a solar flare from IRIS. Astro-phys. J. 805, 167. DOI. ADS.
Sammis, I., Tang, F., Zirin, H.: 2000, The dependence of large flare occurrence on the magnetic structure ofsunspots. Astrophys. J. 540, 583. DOI. ADS.
Schrijver, C.J.: 2009, Driving major solar flares and eruptions: A review. Adv. Space Res. 43, 739. DOI. ADS.Schrijver, C.J., Beer, J.: 2014, Space weather from explosions on the Sun: how bad could it be? Eos 95, 201.
DOI. ADS.Schrijver, C.J., Beer, J., Baltensperger, U., Cliver, E.W., Güdel, M., Hudson, H.S., McCracken, K.G., Os-
ten, R.A., Peter, T., Soderblom, D.R., Usoskin, I.G., Wolff, E.W.: 2012, Estimating the frequency ofextremely energetic solar events, based on solar, stellar, lunar, and terrestrial records. J. Geophys. Res.117, 8103. DOI. ADS.
Sterling, A.C., Hudson, H.S.: 1997, Yohkoh SXT observations of X-ray “dimming” associated with a halocoronal mass ejection. Astrophys. J. Lett. 491, L55. DOI. ADS.
Sturrock, P.A.: 1966, Model of the high-energy phase of solar flares. Nature 211, 695. DOI. ADS.Sun, X., Bobra, M.G., Hoeksema, J.T., Liu, Y., Li, Y., Shen, C., Couvidat, S., Norton, A.A., Fisher, G.H.:
2015, Why is the great solar active region 12192 flare-rich but CME-poor? Astrophys. J. Lett. 804, L28.DOI. ADS.
Svestka, Z.: 1986, On the varieties of solar flares. In: Neidig, D.F. (ed.) The Lower Atmosphere of SolarFlares; Proceedings of the Solar Maximum Mission Symposium, National Solar Observatory, Sunspot,332. ADS.
Thalmann, J.K., Su, Y., Temmer, M., Veronig, A.M.: 2015, The confined X-class flares of solar active region2192. Astrophys. J. Lett. 801, L23. DOI. ADS.
Thompson, B.J., Cliver, E.W., Nitta, N., Delannée, C., Delaboudinière, J.-P.: 2000, Coronal dimmings andenergetic CMEs in April–May 1998. Geophys. Res. Lett. 27, 1431. DOI. ADS.
Tian, H., Li, G., Reeves, K.K., Raymond, J.C., Guo, F., Liu, W., Chen, B., Murphy, N.A.: 2014, Imaging andspectroscopic observations of magnetic reconnection and chromospheric evaporation in a solar flare.Astrophys. J. Lett. 797, L14. DOI. ADS.
Tsuboi, Y., Koyama, K., Murakami, H., Hayashi, M., Skinner, S., Ueno, S.: 1998, ASCA detection of asuperhot 100 Million K X-ray flare on the weak-lined T Tauri star V773 Tauri. Astrophys. J. 503, 894.DOI. ADS.
Tsuneta, S.: 1996, Structure and dynamics of magnetic reconnection in a solar flare. Astrophys. J. 456, 840.DOI. ADS.
White, S.M., Thomas, R.J., Schwartz, R.A.: 2005, Updated expressions for determining temperatures andemission measures from GOES soft X-ray measurements. Solar Phys. 227, 231. DOI. ADS.
Wiegelmann, T., Inhester, B.: 2010, How to deal with measurement errors and lacking data in nonlinearforce-free coronal magnetic field modelling? Astron. Astrophys. 516, A107. DOI. ADS.
Woods, T.N., Eparvier, F.G., Hock, R., Jones, A.R., Woodraska, D., Judge, D., Didkovsky, L., Lean, J.,Mariska, J., Warren, H., McMullin, D., Chamberlin, P., Berthiaume, G., Bailey, S., Fuller-Rowell, T.,Sojka, J., Tobiska, W.K., Viereck, R.: 2012, Extreme Ultraviolet Variability Experiment (EVE) on theSolar Dynamics Observatory (SDO): Overview of science objectives, instrument design, data products,and model developments. Solar Phys. 275, 115. DOI. ADS.
Wu, S.T., de Jager, C., Dennis, B.R., Hudson, H.S., Simnett, G.M., Strong, K.T., Bentley, R.D., Bornmann,P.L., Bruner, M.E., Cargill, P.J., Crannell, C.J., Doyle, J.G., Hyder, C.L., Kopp, R.A., Lemen, J.R.,Martin, S.F., Pallavicini, R., Peres, G., Serio, S., Sylwester, J., Veck, N.J.: 1986, Flare energetics. In:Kundu, M.R., Woodgate, B. (eds.) Energetic Phenomena on the Sun, Proceedings of the Solar MaximumMission Workshop, NASA CP-2439, 5. ADS.
Yashiro, S., Gopalswamy, N., Akiyama, S., Michalek, G., Howard, R.A.: 2005, Visibility of coronal massejections as a function of flare location and intensity. J. Geophys. Res. 110, 12. DOI. ADS.
Zirin, H., Ingham, W., Hudson, H., McKenzie, D.: 1969, De-occultation X-ray events of 2 December, 1967.Solar Phys. 9, 269. DOI. ADS.