The Characteristics of High Attainers - TTRB3.org.uk · high professional standards. They ......
125
Bulletin Statistics of Education: The Characteristics of High Attainers June 2007
Transcript of The Characteristics of High Attainers - TTRB3.org.uk · high professional standards. They ......

Bulletin
Statistics of Education:
The Characteristics of High Attainers
June 2007

2
© Crown copyright 2007 Applications for reproduction should be made in writing to The Copyright Unit, Her Majesty’s Stationery Office, St. Clements House, 2–16 Colegate, Norwich NR3 1BQ Contact points For enquiries about this publication, contact: Tanya McCormack Tel: 020 7925 6408 E-mail: [email protected] For general enquiries about National Statistics contact: National Statistics Public Enquiry Service on 0845 601 3034 (Switchboard) E-mail: [email protected] Fax: 01633 652747 Letters: Room DG/18, 1 Drummond Gate, London SW1V 2QQ Information about National Statistics can be found on www.statistics.gov.uk/ You can also find more statistics about Education and Training on www.dfes.gov.uk/statistics/ A National Statistics publication Official statistics bearing the National Statistics logo are produced to high professional standards. They undergo regular quality assurance reviews to ensure that they meet customer needs. They are produced free from any political interference.

3
Contents
1. Introduction
2. What Are the Characteristics of High Attaining Pupils?
3. To What Extent is High Attainment Sustained through Secondary Education?
4. Do High Attainers in One Subject Do Well in All
Subjects?
5. What Are the Subjects Chosen by High Attainers?
6. What Kinds of Secondary Schools Do High Attaining Pupils Enter?
7. Which Pupils and Schools Tend to Take Higher Tier
Papers?
8. What Are the Characteristics of Early Takers and AS Level Entrants in Key Stage 4?
9. To What Extent Are High Attaining Pupils Classified as
Gifted and Talented? References Appendix A: Additional Tables and Charts Appendix B: Calculation of Fine Grade Point Scores Appendix C: Cluster Analysis of Subjects at Key
Stage 4

4
1. Introduction 1.1 Background This bulletin discusses the characteristics of pupils defined as ‘high attaining’: their prior attainment in terms of Key Stage tests, their subject choices, their current attainment, and the schools they attend. There is no standard classification of high attainment and, for the purposes of this bulletin, a variety of measures are explored, including pupils identified as gifted and talented (G&T) by schools, early GCSE and AS entrants, and those entered for higher tier papers. However, the high attainment measures focused on are the top 10% of pupils in terms of attainment at Key Stage 2 and Key Stage 3 using finely graded average point scores, and the top 10% of pupils at Key Stage 4 using capped GCSE point score. Coverage is maintained mainstream schools in England, unless otherwise stated. In common with other one-off statistical bulletins, the intention here is to provide a range of useful statistics around a broad theme. High attainers are the focus this year as recent bulletins have addressed low attaining pupils (DfES, 2005b) and trends in attainment gaps (DfES, 2006b). It is recognised that disadvantaged pupils are currently under-represented in the high attaining groups, indicating they are achieving beneath their potential. Through its focus on narrowing attainment gaps, the Department is working to ensure deprived pupils are more fairly represented in the high attaining group in the future. The bulletin is not intended to answer one specific question or provide figures that will be updated on a regular basis. The majority of the analysis is based on the National Pupil Database and most of the figures are already in the public domain and the data are accessible to researchers. 1.2 Measures of High Attainment The majority of the bulletin concentrates on Key Stage 2 (age 11) and Key Stage 4 (age 16) attainment in order to provide analyses for both primary and secondary school pupils. Additional results are presented for Key Stage 3 (age 14) to address the extent to which high attainment is sustained through secondary education and to consider which pupils, in which schools, enter higher tier papers. The 2006 Year 8 cohort is used for analysis of the G&T population, and data from the Longitudinal Survey of Young People in England are incorporated when the characteristics and attitudes of high attaining pupils are addressed.

5
For Key Stage 2 and Key Stage 3, the main measures of high attainment are the top 10% of pupils in (i) finely graded1 English point score (ii) finely graded mathematics point score and (iii) an average of mathematics and English finely graded point scores. For Key Stage 4, pupils who achieve within the top 10% of capped average point scores are defined as high attainers. However, it was not possible to identify exactly 10% of pupils for each of these high attaining groups since, even with finely graded point scores, the same number of points is obtained by a high number of pupils; this is particularly true for the earlier Key Stages where the range of potential marks is lower. Therefore, the cut-off for each high attaining group was defined as the closest percentage above 10 percent of pupils2. For Key Stage 4, only the high attaining group in 2006 is analysed. However, for Key Stage 2, the high attaining groups in 2001 and 2003, alongside 2006, are of interest for the purpose of tracking the same cohort over time. Similarly, for Key Stage 3, the high attaining group in 2004 as well as in 2006 is useful. All analyses in the bulletin specify the year of data used for any Key Stage 2 or Key Stage 3 tables and charts.
Identification as Gifted and Talented3 is another indicator of high attainment yet it is important to recognise that high attainment and being identified as gifted and talented is not the same thing. The national gifted and talented population includes pupils who are under-achieving and may not be demonstrating their ability through attainment measures; it also includes pupils who demonstrate talent in areas requiring visio-spatial skills or practical abilities, such as in drama or art.
1 An example flow diagram is provided in appendix B to show how finely graded point scores relate to marks. 2 Cut-off values of finely graded/ capped point scores for all high attaining groups, alongside the percentage of pupils within each group, are provided in the annex.
3 Schools are required to indicate which of their pupils are gifted and talented in their school census return. For detailed information on Government policy and identification of gifted and talented learners visit http://www.standards.dfes.gov.uk/giftedandtalented/
6
1.3 Bulletin Content Chapter 2 explores the characteristics of high attaining pupils at Key Stage 4 and Key Stage 2 and uses data from the Longitudinal Study of Young People in England to analyse pupil and parent responses to opinion and attitude based questions. Chapter 3 begins by examining the extent to which high attaining pupils at Key Stage 4 in 2006 were likely to have been high attainers in Key Stage 3 in 2004 and in Key Stage 2 in 2001. The second part of the chapter examines the factors which affect pupils’ chances of being a high attainer at Key Stage 4 using information on the relationship between high attainment and pupil characteristics and prior attainment in Key Stage 2. Chapter 4 addresses a series of subject-based questions including whether high attaining pupils in mathematics or English are more likely to be high attaining overall. The percentage of high attainers at Key Stage 2 and Key Stage 3 remaining in the top 10% of attainers at Key Stage 4 is also addressed. Chapter 5 looks at the subjects and qualifications chosen by high attainers in their Key Stage 4 programme of study. The effect of subject selection on a pupil’s probability of becoming a high attainer or being classified as gifted and talented at the end of Key Stage 4 is also addressed, alongside the number of qualifications attempted and the pattern of grades observed. Later sections of the chapter consider similar questions for high attaining pupils at the end of Key Stage 4, including which subjects they go on to study at A-level. Chapter 6 focuses on high attainers at the end of Key Stage 2 and describes the characteristics of the schools they join for their secondary education. Chapter 7 draws together analysis on the prior attainment and characteristics of the pupils, and schools, who enter the highest tier of mathematics paper in Key Stage 3. Chapter 8 considers which factors influence pupils to complete Key Stage 4 early or to take an AS-level qualification during Key Stage 4. Chapter 9 analyses those pupils who are recognised as high attainers within their schools by being identified as gifted and talented. This chapter initially focuses on the degree of overlap between pupils selected as G&T and pupils who achieve within the national top 10% at the relevant Key Stage. Since it is not necessary that these two populations equate, the chapter turns to consider pupil and school characteristics and the prior attainment of those pupils flagged as gifted and talented.
7
1.4 Key Results
• At Key Stage 2 and Key Stage 4, girls, pupils who are not eligible for free school meals (non-FSM), pupils living in more affluent areas, and pupils from the following ethnic groups: Chinese, White and Asian, Indian, any other White background, any other Mixed background, any other Asian background and Irish, are highly represented in the 10 percent of highest attainers for both Key Stages.
• Data from the Longitudinal Survey of Young People in England
(LSYPE) revealed that Key Stage 4 high attaining pupils’ most-liked subjects in Year 9 were physical education and art; least favoured subjects were modern languages and mathematics.
• 3% of pupils stay in the high attaining group throughout Key Stages 2,
3 and 4; 83% of pupils never enter the high attaining group and pupils with prior attainment scores above 32 at Key Stage 2 are more likely than not to be in the high attaining group at Key Stage 4.
• Pupils eligible for FSM, pupils living in deprived areas, or pupils with an
identified special educational need (SEN), were considerably less likely to be high attainers at Key Stage 4, compared with other pupils with similar prior attainment. Conversely, pupils with English as an additional language (hereafter EAL) were more likely to be high attainers at Key Stage 4, and Chinese pupils, pupils from other Asian backgrounds, Bangladeshi, Indian, Pakistani, Black African and other White pupils were between 2 and 4 times more likely to be high attainers than White British pupils.
• The majority of high attainers in English at Key Stages 2 and 3 are
female, at approximately 65%, and the majority of high attainers in mathematics at Key Stage 2 and Key Stage 3 are male, at nearly 60%. A similar percentage of females and males are high attainers on the overall measure.
• Between 47% and 66% of the groups of high attaining pupils at Key
Stage 2 and Key Stage 3 remain high attainers at Key Stage 4.
• At Key Stage 4, 91% of mathematics A* grades and 89% of English A* grades are achieved by high attainers. Among Key Stage 4 high attainers, 77% achieved grade A or A* in mathematics and 78% achieved these grades in English, whereas the equivalent rates for the rest of the cohort are 5% and 6%.
• After English, English literature, mathematics and science, modern
foreign languages are the next most popular subject choice for high attaining pupils in Key Stage 4. For the rest of the cohort, the next most popular choice is design and technology.

8
• 25% of high attainers take a combination of subjects that include a modern foreign language and two of: creative arts, humanities and technology; this compares with 16% of the rest of the cohort.
• High attainers take, on average, 2 more full GCSEs than the rest of the
cohort, and 1 more A-level.
• The rate of high attainers varies by school type, from around 7% of the intake to Academies, to 51% of the intake to Grammar schools.
• The majority of schools (97%) had at least one high attainer in their
2006 GCSE cohort although, for just under two thirds of schools, less than 10% of the cohort were classified as high attaining.
• Schools with relatively large shares of high attainers have, on average,
relatively high attainment at Key Stage 4 and relatively high Key Stage 2–4 contextual value added (CVA) scores; CVA is a measure of progress over a period of time.
• Schools with fewer than 9% of pupils eligible for free school meals
account for 45% of high attainers.
• FSM pupils joining City Technology Colleges (CTCs) and Voluntary Aided schools are more likely to be high attainers than FSM pupils entering other types of schools.
• 92.8% of Key Stage 2 maintained mainstream high attainers remained
in the same sector for their secondary education, whilst 7.2% transferred to an independent school. For other pupils who took their Key Stage 2 tests in maintained mainstream schools only 1.9% moved to independent schools.
• The majority of the 18.6% of pupils with point scores of 32-36 in Key
Stage 2 mathematics enter the highest tier in mathematics (tier for Levels 6-8) at Key Stage 3.
• Fewer FSM pupils with the same high attainment at Key Stage 2 as
non-FSM pupils take the highest tier paper. The largest difference in percentage is 17.5 percentage points for a prior attainment score of 33. Fewer girls than boys with a point score of 35 or 36 in mathematics at Key Stage 2 take the highest tier paper.
• Once differences in prior attainment were taken into account, girls,
pupils who had EAL and pupils from most ethnic backgrounds other than White British had high odds of being entered for the 6-8 tier.

9
• When prior attainment was not controlled for, EAL pupils, other Black pupils, Black Caribbean and summer-born pupils were now less likely to be entered for the 6-8 tier. Chinese, Indian and Mixed White and Asian pupils had even higher odds and pupils with special educational needs, living in moderately or highly deprived areas or eligible for FSM were even less likely to be entered.
• Roughly 18% of pupils were entered for the 6-8 tier in Key Stage 3
mathematics; 43% of the pupils sitting this paper achieved the top level.
• High attainers in Academies (schools which have above average FSM
eligibility rates) have relatively high entry rates to the highest tier Key Stage 3 mathematics paper, bucking the trend for high FSM schools.
• Early takers in Key Stage 4 and pupils who take the AS qualification in
Key Stage 4 perform considerably better than the rest of the cohort in terms of point score and threshold indicators. These pupils are also characterised by high prior attainment
• High attainers at Key Stage 3 who take specific subjects early in Key
Stage 4 do not generally perform better than high attainers who take the subject at the end of the Key Stage. Mathematics and Statistics are the two subjects most commonly taken early.
• Modern foreign languages other than French, Spanish and German are
the subjects most commonly taken as AS levels in Key Stage 4.
• 23,300 pupils were identified by teachers as G&T and were in the top 10% of high attaining pupils; a further 40,700 were simply flagged as G&T and 20,300 were high attainers only.
• In January 2006, the average percentage of pupils identified as gifted
and talented for all schools was 10.5% and 22% of schools did not return any G&T information; the average percentage of pupils identified as G&T for all schools identifying G&T pupils was 13.3%. Relatively fewer pupils were identified in Years 7 and 11. Since January 2006, the number of secondary schools identifying G&T pupils has increased 12 percentage points to 90% of schools in January 2007.
• Just over half of G&T pupils in Year 8 had Key Stage 2 points of 33,
equivalent to straight Level 5s; high Key Stage 2 attainment was the single greatest predictor of gifted and talented identification.
• After controlling for other factors, pupils were much more likely to be
identified as G&T if they were: not eligible for FSM, living in more affluent areas or from Bangladeshi, Black Caribbean, any other White background, mixed White and Asian backgrounds or mixed White and Black African backgrounds.

10
2. What Are the Characteristics of High Attaining Pupils?
____________________________________________________________________ Summary
• At Key Stages 2 and 4, girls, pupils who are not eligible for free school meals (non-FSM), pupils living in areas of low deprivation and pupils from the following ethnic groups: Chinese, White and Asian, Indian, any other White background, any other Mixed background, any other Asian and Irish, are highly represented in the top 10 percent of attainers in both Key Stages.
• Key Stage 4 pupils who fell into one or more of the deprived categories: eligible for FSM, attending a high-FSM school, or living in a highly-deprived area, were most likely to achieve within the high attaining group if they only attended the most deprived schools.
• Data from the Longitudinal Survey of Young People in England (LSYPE) showed that Key Stage 4 high attaining pupils’ most-liked subjects in Year 9 were physical education and art; least favoured subjects were modern languages and mathematics.
_______________________________________________________________ The characteristics of high attaining pupils at Key Stage 4 and Key Stage 2 are explored in this chapter. For Key Stage 4, these pupils are defined as those who achieve in the top 10% of capped GCSE point score; for Key Stage 2, these are pupils who achieve in the top 10% of an average of mathematics and English finely-graded point scores. 2.1 Key Stage 4 2.1.1 Characteristics of High Attaining Pupils at Key Stage 4 Table 2.1 shows the composition of the high attaining group by basic pupil characteristics. Groups that are shown to be under-represented in the population of high attaining pupils are: boys, pupils eligible for free school meals (FSM), pupils with an identified special educational need (SEN)4, pupils born in the summer5, and pupils with an Income Deprivation Affecting Children Index (IDACI) score which is greater than the median6 score.
4 Special educational needs are broken down into two categories: those with a statement or identified as School Action Plus and those classified as School Action. 5 Month of birth has been grouped into three periods, corresponding to pupils who are born in the autumn (September-December), those born in the spring (January-April) and those born in the summer (May-August). 6 Further information on measures of deprivation is cited in DfES (2006b). The 2006 national median for the Income Deprivation Affecting Children Index was 0.15 (2 d.p.)

11
Table 2.1: Composition of High Attaining Group at Key Stage 4 in 2006 by Pupil Characteristics and Rates of High Attaining Pupils
High Attaining Pupils (nearest
100) Composition of High Attaining Group (%)
Rate of High Attainers (% of
Cohort) All High Attaining Pupils 58,900 10.0 Gender
Boys 23,600 40.1 7.9 Girls 35,300 59.9 12.2
Free School Meals
Non-FSM 56,900 96.7 11.2 FSM 1,800 3.1 2.4
Special Educational Needs
No identified SEN 57,700 97.9 11.9 Statement/ Action Plus 400 0.6 1.0
School Action 700 1.2 1.2 First Language
English 53,000 89.9 10.0
Other than English 5,800 9.8 10.8 Information not obtained 40 0.1 4.3
Month of birth
Autumn 21,500 36.5 11.3 Spring 19,300 32.8 10.1
Summer 18,100 30.1 8.7 Deprivation (IDACI quartiles)
Least deprived 25,700 43.9 17.7 Q2 17,100 29.2 11.8 Q3 10,300 17.5 7.1
Most deprived 5,500 9.4 3.8 Within this table, the ‘composition of high attaining group’ column provides the percentage of high attainers with each characteristic out of the total number of high attainers so, for example, 90% of all high attaining pupils speak English as their first language. ‘Rate of high attainers (% of cohort)’ takes into account the size of the group so, continuing the example, it compares the number of high attaining pupils whose first language is English to the number of non-high attaining pupils whose first language is English. In this case the total population used is all pupils whose first language is English and so 10% of all English pupils are high attainers.

12
Deprivation, as measured by FSM eligibility and IDACI score, is shown to significantly influence a pupil’s likelihood of achieving within the top 10% of Key Stage 4 results nationally. Only 2.4% of FSM-eligible pupils are high attainers, compared with 11.2% of non-FSM pupils; similarly, using the IDACI measure, 17.7% of pupils living in the least deprived areas are high attainers, whereas only 3.8% of pupils living in the most deprived areas are in this group. The relationship between these two measures of deprivation is considered further in a later part of this chapter. Pupils whose first language is English and pupils whose first language is other than English appear, relatively equally, well-represented in the high achieving subset. However, from Table 2.2 it is evident that not all ethnicities7 are equally represented in the high attaining group. Table 2.2: Composition of High Attaining Group at Key Stage 4 in 2006
by Pupil Ethnicity
High Attaining
Pupils Composition of High Attaining Group (%)
Rate of High Attainers (% of Cohort)
White White British 47,228 80.2 9.9
Irish 319 0.5 15.0 Traveller Of Irish Heritage 3 0.0 2.6
Gypsy / Roma 2 0.0 0.7 Any Other White 1,729 2.9 14.7
Mixed
White & Black Caribbean 230 0.4 4.7 White & Black African 126 0.2 10.3
White & Asian 471 0.8 19.6 Any Other Mixed 592 1.0 13.2
Asian
Indian 2,378 4.0 17.8 Pakistani 949 1.6 7.0
Bangladeshi 462 0.8 8.1 Any Other Asian 719 1.2 17.5
Black
Black Caribbean 252 0.4 3.0 Black African 639 1.1 6.2
Any Other Black 109 0.2 4.2 Chinese 681 1.2 31.0 Any Other Group 576 1.0 11.8 Not Obtained 1,441 2.4 8.8
7 For the purposes of this analysis, ethnicity has been broken down into 18 ethnic groups; further breakdowns are available, but these result in low numbers of pupils per category.

13
Chinese, White and Asian, Indian, any other Asian, Irish, any other White and any other Mixed pupils are highly represented in the high attaining group; Black Caribbean, any other Black, Black African, Mixed White and Black Caribbean, Pakistani and Bangladeshi are under-represented8. Further analysis on Key Stage 4 high attaining pupils from different ethnic backgrounds is reported in section 2.3.2, where there is a comparison with the performance of each ethnic group at Key Stage 2. 2.2 Key Stage 2 2.2.1 Characteristics of High Attaining Pupils at Key Stage 2 Table 2.3 shows the composition of the high attaining group at Key Stage 2, alongside the rate of this group as a percentage of the cohort, by basic pupil characteristics. As with the Key Stage 4 results, boys, pupils eligible for free school meals, pupils with an identified special educational need, pupils born in the summer, and pupils with an IDACI score which is greater than the median score are shown to be under-represented in the population of high attaining pupils. However, at Key Stage 2, first language and month of birth have more of a pronounced effect on the rate of high attaining pupils than at Key Stage 4, with pupils whose first language is other than English now being under-represented in the group. Table 2.4 breaks down the first language variable to look at the composition of the high attaining group by ethnicity. Once again, Chinese, White and Asian, Indian, any other Asian, Irish, any other White and any other Mixed pupils are well represented in the high attaining group; Black Caribbean, any other Black, Black African, Mixed White and Black Caribbean, Pakistani and Bangladeshi are under-represented. However, at Key Stage 2, the extent to which certain groups are over/under-represented differs to the extent they are at Key Stage 4; this is considered further in section 2.3.2.
8 The numbers of ‘Travellers of Irish heritage’ or ‘Gypsy/ Roma’ pupils are too small to base judgements on.

14
Table 2.3: Composition of High Attaining Group at Key Stage 2 in 2006 by Pupil Characteristics and Rates of High Attaining Pupils
High Attaining Pupils
(nearest 100)
Composition of High Attaining
Group (%)
Rate of High Attainers (% of
Cohort) All High Attaining Pupils 58,000 10.2 Gender
Boys 27,700 47.7 9.5 Girls 30,300 52.3 10.8
Free School Meals
Non-FSM 55,300 95.4 11.6 FSM 2,600 4.4 2.7
Special Educational Needs
No identified SEN 56,900 98.2 13.0 Statement/ Action Plus 400 0.7 0.8
School Action 500 0.9 0.7 First Language
English 53,000 91.4 10.5 Other than English 4,900 8.4 7.5
Information not obtained 25 0.0 7.8 Month of birth
Autumn 24,800 42.8 13.0 Spring 18,300 31.6 9.9
Summer 14,900 25.6 7.5 Deprivation (IDACI quartiles)
Least deprived 23,600 41.0 16.7 Q2 16,600 28.8 11.7 Q3 10,900 18.9 7.7
Most deprived 6,500 11.3 4.6 2.3 Key Stage 2 and 4 2.3.1 Comparison of the Characteristics of High Attaining Pupils
at Key Stage 2 and Key Stage 4 Chart 2.1 compares the rate of high attaining pupils at Key Stage 2 and Key Stage 4, as a percentage of the relevant cohort. For both Key Stages, the rate of high attaining pupils is shown to be greatest for those who live in the least deprived IDACI quartile. However, the lowest rates of high attaining pupils are not seen in the most deprived IDACI quartile but in those with special educational needs.

15
Table 2.4: Composition of High Attaining Group at Key Stage 2 in 2006 by Pupil Ethnicity
High Attaining
Pupils Composition of High Attaining Group (%)
Rate of High Attainers (% of Cohort)
White White British 47,590 82.1 10.5
Irish 319 0.6 15.9 Traveller Of Irish Heritage 6 0.0 1.8
Gypsy / Roma 8 0.0 1.0 Any Other White 1,544 2.7 11.7
Mixed
White & Black Caribbean 459 0.8 7.2 White & Black African 176 0.3 10.1
White & Asian 625 1.1 17.6 Any Other Mixed 782 1.3 12.6
Asian
Indian 1,707 2.9 13.4 Pakistani 739 1.3 4.4
Bangladeshi 389 0.7 5.4 Any Other Asian 599 1.0 13.0
Black
Black Caribbean 336 0.6 3.9 Black African 627 1.1 4.8
Any Other Black 117 0.2 4.7 Chinese 509 0.9 25.4 Any Other Group 476 0.8 8.6 Not Obtained 975 1.7 9.0
Chart 2.1: Rates of High Attaining Pupils at Key Stage 2 and 4 in 2006
by Pupil Characteristics
0
2
4
6
8
10
12
14
16
18
Boys Girls NonFSM
FSM NonSEN
SEN English Other AutumnBorn
SpringBorn
SummerBorn
IDACIQ1
IDACIQ2
IDACIQ3
IDACIQ4
Characteristics of High Attainers
% o
f Coh
ort
KS2 KS4

16
Further to Tables 2.1 and 2.2, chart 2.1 shows a higher rate of high attaining girls at Key Stage 4 than Key Stage 2 and the gender gap widens in the secondary school Key Stage. However, for the majority of these characteristics, the gap between the levels of the characteristics appears to decrease slightly, rather than widen, between Key Stages 2 and 4. This is the case for first language, month of birth and special educational needs. 2.3.2 Comparison of High Attaining Pupils at Key Stage 2 and
Key Stage 4 by Ethnicity Earlier in the chapter it was observed that pupils with English as a first language and pupils whose first language is other than English, hereafter EAL, appear relatively equally represented in the high achieving subset at Key Stage 4. However, first language has a greater impact at Key Stage 2, where a lower rate of EAL pupils are in the high achieving group at this point in their education. The analysis of first language is taken a step further and Chart 2.2 compares the representation of the 18 ethnic groups in the high attaining groups at Key Stages 2 and 4. Chart 2.2: Rates of High Attaining Pupils at Key Stage 2 and 4 in 2006
by Pupil Ethnicity
0
5
10
15
20
25
30
35
Whit
e Briti
sh Irish
Travell
er Of Ir
ish H
eritag
e
Gypsy
/ Rom
a
Any O
ther W
hite
White &
Black C
aribb
ean
White &
Black A
frican
White &
Asian
Any O
ther M
ixed
Indian
Pakist
ani
Bangla
desh
i
Any O
ther A
sian
Black C
aribb
ean
Black A
frican
Any O
ther B
lack
Chines
e
Any O
ther G
roup
Not Obta
ined
Rate of Ethnic Group
% o
f Coh
ort
KS2 KS4 The chart reveals Chinese pupils to be most highly represented in the high attaining groups by a significant margin. There is more than a 10 percentage point difference between the rate of Chinese pupils and the next most highly represented group, Mixed White and Asian, at Key Stage 4; the equivalent difference at Key Stage 2 is still very high, at 8 percentage points. Other groups that are well-represented at both Key Stage 2 and 4 are Irish, any other White, any other Mixed, Indian and any other Asian. At Key Stage 2, 13% of Indian pupils and pupils from any other Asian background were in the top 10% of attainment and this increased to 18% for both groups by Key Stage 4.
17
Ethnic groups shown to be under-represented in the high attaining group at both Key Stage 2 and 4 include Mixed White and Black Caribbean, Pakistani, Bangladeshi and all Black ethnic groups9. Of the eight ethnic groups where rates of high attaining pupils for Key Stage 2 and 4 are not within 2 percentage points of each other, only Mixed White and Black Caribbean show a decrease in the rate of high attainment at Key Stage 4 compared with the rate at Key Stage 2. 2.4 Interaction of deprivation at pupil, school and local level Deprivation has been shown to have a significant influence on the probability of a pupil being in the high attaining groups. Therefore, analysis has been conducted on the high attaining pupils at Key Stage 4 to see which measure of deprivation (pupil, school or local level) may have the greatest effect on the pupil’s performance. 2.4.1 Using Venn Diagrams to Demonstrate Interactions for Key Stage 4 Of the 587,000 pupils in maintained mainstream schools in 2006, around 75,000 were FSM pupils. A similar number of pupils were selected using the IDACI code linked to pupils’ postcodes; these pupils can be labelled as those living in the most deprived areas. Furthermore, a similar sized group of pupils who attend the most deprived schools can be identified in terms of the percentage of FSM pupils within the school. Within a given year, a pupil can fall into none, one, two or all three of these groups. The Venn diagram in Chart 2.3 shows the overlap for these three groups, both in terms of pupil numbers for 2006 and percentage of pupils within the high attaining group at Key Stage 4. As an example, the three-way interaction shows that 16,385 pupils in 2006 were entitled to FSM, attended a deprived school and lived in a deprived area; 2.5% of these pupils were in the high attaining group, compared with a rate of 12.4% of high attainers pupils who were in none of the three groups. 9 The ethnic groups ‘Travellers of Irish Heritage’ and ‘Gypsy/Roma’ are also under-represented but they have very low numbers of pupils and so judgements based on this are unreliable.

18
Chart 2.3: Interaction between Deprivation Factors for High Attaining Pupils at Key Stage 4 in 2006
The pupils least likely to be high attainers were those who were both deprived and living in the most deprived areas; within this group, pupils in the most deprived schools had a slightly better chance than those in the less deprived schools: 2.5% compared with 2.1%. Previous analysis has shown that pupils in schools with high FSM rates10 can outperform pupils in other schools (Chart 4.6, DfES, 2006b) and that there is an overlap between ethnicity and deprivation (ibid). The likelihood of being a high attainer was higher for non-FSM pupils than for any group of FSM pupils. For the non-FSM pupils, the chance of being a high attainer for those living in the most deprived areas and attending the most deprived schools was 3.3%. Non-FSM pupils had a slightly higher chance of reaching the high attaining group if they only lived in the most deprived areas: 4.2%. However, non-FSM pupils were most likely to achieve within the high attaining group if they only attended the most deprived schools: the rate in this case was 5.2%. Nevertheless, this percentage is still considerably lower than the 12.4% of high attainers who were not deprived, did not attend deprived schools or live in deprived areas
10 High school FSM rate analysis is continued in chapter 6 of this bulletin.
Total Pupils: 587,415 pupils* Numbers in the chart show all pupils in each group; percentages show the chances of these being in the top 10% of attainers
Non FSM Pupil/Non High FSM School/Non High IDACI pupil: 433,743
12.4%
FSM Pupils
High FSM Schools
High IDACI Pupils
34,6362.5%
16,3852.5%
12,6572.5%
11,1022.1%
29,9684.2%
17,3283.3%
28,3355.2%

19
2.5 Data from the Longitudinal Study of Young People in England The Longitudinal Study of Young People in England (hereafter LSYPE) aims to identify the major factors affecting young people’s transitions from compulsory education into further education, higher education and the labour market. Wave 111 of LSYPE was drawn from a population of all pupils12 in Year 9 in England in 2003/4 but the survey sample was designed to over-represent both pupils in the main ethnic minority groups13 and pupils at schools with higher levels of deprivation. For approximately 15,000 households, interviews with the pupil, main parent, second parent and history interviews were conducted. Wave 1 provides data on pupils’ experiences of school and out of school activities, educational aspirations and relations with parents; data from parents includes family composition, behaviour of the young person and parental expectations. Since this is a longitudinal survey, interviews are conducted on an annual basis and the proposal is that the selected pupils will be interviewed until they are 25 years of age. Data from the National Pupil Database was merged with the LSYPE to provide information on individual pupils’ attainment. For the purposes of this chapter, responses from the first wave of data collection are used; these pupils are the current Year 11s and, as such, they must have achieved at least 410 GCSE points two years after interview to be in the high attaining group. 2.5.1 Interview Responses from Pupils in the Sample Of the 14,050 pupils who were interviewed, 1,470 went on to achieve results in the high attaining group in 2006. This section provides some of the responses made by high attainers and non-high attainers to opinion and attitude based questions. Chart 2.4 reveals the responses that were made by both sets of pupils when they were asked to select a favourite subject; chart 2.5 provides the answers made when they were asked to select a least liked subject14. Chart 2.6 and table 2.5 show reactions to extended attitudes towards school and the future.
11 LSYPE involves a 2-stage sample: at stage 1 schools are sampled using a modified probability proportional to size design and, at stage 2, year 9 pupils within selected schools are sampled. 12 This excludes pupils in very small schools, boarders and foreign nationals residing in England for the sole purpose of attending school 13 Approximately 1,000 each of Indian, Black African, Black Caribbean, Bangladeshi, Pakistani and Mixed origin. 14 There is further discussion of subject choice in chapter 4.

20
Chart 2.4: Favourite Subject of Pupils as Provided in LSYPE in 2004
0
5
10
15
20
25
30
Physic
al Edu
catio
n Art
Scienc
e
History
Mathem
atics
English
Music
Drama/
Media
Modern
Lang
uage
sIC
T
Geogra
phy
Design
and T
echn
ology
Home E
cono
mics
Religio
us Stud
ies
Busine
ss Stud
ies/ E
cono
mics
Human
ities/
Social
/ Voc
ation
alOthe
r
Subject
%
Not High Attainers High Attainers For both sets of Year 9 pupils, physical education was most favoured, by 27% of non-high attaining pupils and 17% of high attaining pupils. Art is a similarly favoured choice by high attaining pupils, at roughly 17%; this is also the second most popular choice for non-high attaining pupils, at 16%. Subjects that were noticeably more popular in Year 9 for high attainers at Key Stage 4 than for non-high attainers were science, history, mathematics, English, music and modern languages. Conversely, drama/ media, ICT and design and technology were more favoured by non-high attainers. Chart 2.5: Least Liked Subject of Pupils as Provided in LSYPE in 2004
0
5
10
15
20
25
30
Modern
Lang
uage
s
Mathem
atics
Religio
us Stud
ies
Scienc
e
Physic
al Edu
catio
n
History
Geogra
phy
Music
English Art
Design
and T
echn
ology IC
T
Drama/
Media
Human
ities/
Social
/ Voc
ation
al
Home E
cono
mics
Busine
ss Stud
ies/ E
cono
mics
Other a
nswers
Subjects
%
Not High Attainers High Attainers

21
For both sets of pupils, modern languages and mathematics were the least liked subjects in Year 9: 17% and 15% of high attainers responded to this question with these subjects; the equivalent percentages for non-high attainers were 18% and 19%. English stands out as being generally more disliked by non-high attainers than high attainers. Chart 2.6: Attitudes to School and Future As Provided in LSYPE in
2004
0
10
20
30
40
50
60
70
80
90
100
Non-HA HA Non-HA HA Non-HA HA Non-HA HA Non-HA HA
Raising a family in the future isimportant to me
Having a job or career in thefuture is important to me
I don't really think much aboutwhat I might be doing in a few
years' time
I am happy when I am atschool
I work as hard as Ican in school
Attitudes
%
Agree strongly Agree a little Disagree a little Disagree strongly Don't know Over 60% of high attaining pupils strongly agree that raising a family in the future is important to them, which is 9 percentage points higher than the response provided by non-high attaining pupils. Furthermore, having a job or career in the future is very important to both sets of pupils: nearly 100% of both sets of pupils strongly agree or agree with this statement. More high attaining pupils strongly agree that they are happy when they are at school than their peers, but only 40% strongly agree that they work as hard as they can at school. However, LSYPE research also showed that the most common number of school nights that a high attaining pupil works is five, whereas it is only three for a non-high attaining pupil.

22
Further differences in attitudes to school were explored through the creation of a summary measure for overall school satisfaction. This measure was produced separately for pupils defined to be high attainers and those who were not from the responses given to the following 12 statements:
1. I am happy when I am at school. 2. School is a waste of time for me. 3. Work is worth doing. 4. Most of the time I don't want to go to school. 5. People think my school is a good school. 6. On the whole I like being at school. 7. I work as hard as I can in school. 8. In a lesson, I often count the minutes till it ends. 9. I am bored in lessons. 10. The work I do in lessons is a waste of time. 11. The work I do in lessons is interesting to me. 12. I get good marks for my work.
The statistic produced is a summated score of the responses15, where responses were recoded on a scale of 0 to 4, with 0 being the most negative, 4 being the most positive and "don't knows” being given a neutral score of 2. Therefore, the maximum possible score is 48. Results of this analysis are presented in table 2.5 and the table shows that the average (mean) school score is over 4 points higher for high attaining pupils, at 37.4 points. Table 2.5: School Satisfaction Score for Pupils in Year 9 in 2004 High Attainers Non-High Attainers Average School Satisfaction Score 37.4 33.2
2.5.2 Interview Responses from Main Parents in the Sample This section provides some of the responses made by the main parents16 of high attainers and non-high attainers to opinion and attitude based questions. Charts 2.7 and 2.8 reveal information about the socio-economic backgrounds of the relevant families: Chart 2.7 compares the National Statistics Socio-Economic Classification, hereafter NS-SEC, of the household for both sets of parents and Chart 2.8 presents their current accommodation type.
15 Average scores for each of the 12 measures separately are available in the annex. 16 The parent who is most involved in their child’s education; this is obtained through the following question: “One of the aims of the study is to find out about (name of sample young person)’s time at school… Can I check then, which one of you would you say is most involved in (name of young person)’s education?”

23
Chart 2.7: NS-SEC Class of Household in 2004 Split by High Attaining/ Non-High Attaining Groups
0
5
10
15
20
25
30
35
40
HigherManagerial and
professionaloccupations
Lowermanagerial and
professionaloccupations
Intermediateoccupations
Small employersand own account
workers
Lowersupervisory and
technicaloccupations
Semi-routineoccupations
Routineoccupations
Neverworked/long term
unemployed
NS-SEC Class
%
Non-High Attaining Group High Attaining Group 70% of high attaining pupils come from households either classified as ‘higher managerial and professional occupations’ or ‘lower managerial and professional occupations’. This is twice the percentage of households who are in these categories from the non-high attaining group. Non-high attaining pupil households are between 2 and 9 percentage points more likely than high attaining pupil households to be in all other NS-SEC classifications. The fact that high attaining pupils generally come from households with more disposable income may partly explain why 17% of these families paid for private tuition in the last 12 months in subjects also taught at school. However, 11% of pupils from the non-high attaining group also received private classes. Chart 2.8: Accommodation in 2004 Split by High Attaining/ Non-High
Attaining Groups
0
10
20
30
40
50
60
70
80
Owned outright Being bought on amortgage/ bank loan
Rented from a Councilor New Town
Rented from a HousingAssociation
Rented privately Some otherarrangement
Current Accommodation
%
Non-High Attaining Pupils High Attaining Pupils

24
The majority of both sets of families have bought their current accommodation on a mortgage/ bank loan: 73% of high attainers’ families and 59% of non-high attainers’ families. Of the former group, 8% more also bought their property outright, at 18%. Of the latter group, 5 times more families rent their properties from a council or new town. Current accommodation type can also be dependent on family situation and 25% of the non-high attaining pupils interviewed for LSYPE live in single parent households; the equivalent percentage for high attaining pupils is less than half of this, at 11%. Family expectation has repeatedly been shown to influence children’s performance at school. LSYPE collects data on what main parents would like their children to do at 16 and what they expect them to do; table 2.6 shows the responses made by both groups of parents to these questions. Table 2.6: Aspirations of Main Parent in 2004 for Young Person when
Age 16
Non-HA: Parent
Aspiration
Non-HA: Perceived
Pupil Aspiration
HA: Parent
Aspiration
HA: Perceived
Pupil Aspiration
Continue in full time education 76.5 65.3 96.8 96.2
Start learning a trade/ Get place on a training course 11.0 13.1 1.1 1.3
Start an apprenticeship/ Get a full-time paid job 8.8 12.6 0.4 0.9 Something else 1.5 2.3 1.0 0.5 Don't know 2.3 6.8 0.8 1.2
Of the main parents of high attaining pupils, 97% would like their child to continue in full time education; they also perceive that their child will agree with this. Only 77% of the parents of non-high attaining pupils would like their child to continue in full time education and only 65% believe this is what their child intends to do. The majority of the others would like their child to start learning a trade/ get a place on a training course. Five times as many parents of non-high attaining pupils do not know what their child is considering doing after Year 11, at 7%.17 A relationship between poverty, neighbourhood factors and low parental expectations on pupils’ attainment at Key Stage 3 has also been found (Jenkins and Levacic, 2006). 17 The March 2007 latest ‘Further Education, Work-based Learning for Young People, Train to Gain and Adult and Community Learning - Learner Numbers in England - October 2006’ SFR updates data on learners by age (under 19, 19 and over), gender, sector subject area (SSA), ethnicity and level. For FE learners, figures show more detailed age breakdowns of learners by institution type and mode of attendance. For WBLYP, breakdowns by programme of study of learners are provided, alongside Train to Gain figures.

25
3. To What Extent is High Attainment Sustained through Secondary Education?
____________________________________________________________________ Summary
• 4% of pupils stay in the high attaining group throughout Key Stages 2, 3 and 4; 83% of pupils never enter the high attaining group.
• Pupils with prior attainment scores above 32 at Key Stage 2 are more likely than not to be in the high attaining group at Key Stage 4.
• Compared to other pupils with similar prior attainment, pupils eligible for FSM, pupils living in deprived areas, or pupils with an identified special educational need, were considerably less likely to be high attainers at Key Stage 4. Conversely, pupils with EAL were more likely to be high attainers at Key Stage 4; Chinese pupils, pupils from other Asian backgrounds, Bangladeshi, Indian, Pakistani, Black African and other White pupils were between 2 and 4 times more likely to be high attainers than White British pupils.
_____________________________________________________________________ The extent to which high attaining pupils at Key Stage 4 in 2006 were likely to have been high attainers in Key Stage 3 in 2004 and Key Stage 2 in 2001 is considered in the first part of this chapter. The second part of the chapter examines the chance of being a high attainer at Key Stage 4 using information on the relationship between high attainment and pupil characteristics and prior attainment in Key Stages 2 and 3. 3.1 Movement In and Out of High Performance Across the Key Stages Chart 3.1 provides data for pupils taking Key Stage 4 in 2006, where these pupils’ results have been matched back to their Key Stage 2 and Key Stage 3 finely graded point scores. The chart shows the movement in and out of the high attaining group (top 10%) at each stage. 4% of pupils stayed in the high attaining group throughout, whilst 83% of pupils never entered this group. As Key Stage 3 is longer than Key Stage 4, we would expect movement in and out of high attainment to vary between them: perhaps assuming that the longer the Key Stage, the less likely pupils are to stay in a given group. Chart 3.1 shows 63% of high attaining pupils at Key Stage 2 remained high attainers three years later, whereas 72% of Key Stage 3 high attainers continued to be high attainers at Key Stage 4. After taking account of the length of the Key Stage, the chances of remaining a high attainer between Key Stage 3 and 4 is lower than between Key Stage 2 and 3; this may reflect the fact that there is more test data at Key Stage 4, which covers more than the core subjects; therefore, there is wider scope for a pupil to move out of the high attaining group.

26
Of the high attaining pupils at Key Stage 2, half are in the high attaining group at Key Stage 4 as well. Of the half who are no longer in the top 10% at Key Stage 4, they are roughly equally split between those moving out between Key Stages 2 and 3, and those moving out between Key Stages 3 and 4. Conversely, looking at the high attaining pupils at Key Stage 4, half were high attainers at Key Stage 2 and the remainder are roughly equally split between those entering the high attaining group between Key Stages 2 and 3 and those entering during Key Stages 3 and 4. Where pupils were high attainers at Key Stages 2 and 4, there were also very likely to be high attainers at Key Stage 3. 3.2 Modelling the Chances of Being a High Attaining Pupil Logistic regression18 allows one to calculate the effect a characteristic has when all other entered characteristics are taken account of. Therefore, this was used to consider the relationship between prior attainment in Key Stage 219, pupil characteristics, and the chances of being a high attaining pupil at Key Stage 4. 10% of all Key Stage 4 pupils were classified as high attainers, which equates to odds of 1:9, which is written as an odds ratio of 1/9 = 0.11. The odds of being a high attainer vary for different levels of prior attainment since, as the previous section showed, high attainment in Key Stage 2 is more likely to suggest high attainment in Key Stage 4. Table 3.1: Odds Ratios of Being In the High Attaining Group in Key
Stage 4 in 2006 Given Prior Attainment in Key Stage 2 Key Stage 2 APS 15 19 23 25 27 29 31 32 33 34 35 36Odds 0.00 0.00 0.00 0.00 0.01 0.07 0.35 0.82 1.91 4.42 10.24 23.73
Table 3.1 shows that pupils achieving a Key Stage 2 average point score above 33 have high odds of being in the high attaining group in Key Stage 4, whilst pupils with a Key Stage 2 point score below 29 have low odds of being in this group. Pupils with a finely graded point score a little above 29 actually have above average odds of being a high attainer: above 0.11. For prior attainment scores above 32, the odds ratios surpass 1, at which point it becomes more likely than not that a pupil will be in the high attaining group. For pupils with a point score of 36, their odds are approximately 24:1 so the logistic model predicts that there is a 24/25 chance of a pupil with this prior attainment being in the high attaining group at Key Stage 4. 18 The model used here is based on the ordinary least squares method although a multi-level approach could also be taken. 19 Key Stage 3 prior attainment could also have been used

27
Chart 3.1: Chance of Remaining or Becoming a High Attaining Pupil between Key Stage 2 (2000) and Key Stage 3 (2003) Using Finely-Graded APS and Key Stage 4 (2006).
Key Stage 2 Key Stage 3 Key Stage 4 average point score
average point score point score
97% Not in High 83%
Attaining Group
96% Not in High 86% Attaining Group In High 3% Attaining Group 3%
Not in High 90%
Attaining Group 45% Not in High 2%
Attaining Group
4% In High
Attaining Group 4% In High 55% Attaining Group 2%
79% Not in High 3%
Attaining Group
37% Not in High 4% Attaining Group In High 21% Attaining Group 1%
In High 10%
Attaining Group 28% Not in High 2%
Attaining Group
63% In High
Attaining Group 6% In High 72% Attaining Group 4%

28
It is possible to fit a model with Key Stage 2 finely-graded average point score alongside the Key Stage 2 English and Mathematics point score deviations and a range of pupil characteristics. Chart 3.2 shows the effect of each characteristic, where the effect sizes relate to pupil characteristics after prior attainment has been taken into account. Although the following variables are illustrated on the chart, they were found not to have a significant effect at the 95% significance level: Traveller of Irish Heritage, Gypsy/ Roma and other Black Background. Chart 3.2: The Effect of Pupil Characteristics on the Odds of Being a High Attainer at Key Stage 4 in 2006
0.00 0.50 1.00 1.50 2.00 2.50 3.00 3.50 4.00 4.50
Gender (Girl)
Summer born
Autumn born
Irish
Traveller of Irish heritage
Gypsy Roma
Other white
White/Black Caribbean
White/Black African
White Asian
Other mixed
Indian
Pakistani
Bangladeshi
Other Asian
Black Caribbean
Black African
Other Black
Chinese
Other ethnic group
FSM
IDACI Q2
IDACI Q3
IDACI Q4
EAL
School Action
SEN statement/action plus
Effect on odds
More likelyLess likely
Where a characteristic has a factor of more than one, a pupil is more likely to be a high attaining pupil at Key Stage 4, all other things being equal. For example, being female has a factor of 1.70, which means that the odds of being a high attainer are 70% higher for girls than boys with similar prior attainment and characteristics. Where a characteristic is shown as having a factor of less than one, this characteristic is associated with a pupil being less likely to be a high attainer at Key Stage 4. For example, pupils who are eligible for FSM have a factor of 0.55, which means that the odds of being a high attainer are 45% lower among FSM pupils than among non-FSM pupils with similar prior attainment and characteristics.

29
In summary, the chart shows that deprived pupils, that is those eligible for FSM or living in deprived areas, were considerably less likely to be high attainers at Key Stage 4, compared with other pupils with similar prior attainment. Pupils with special educational needs were also less likely to be high attainers. Conversely, pupils with EAL were more likely to be high attainers at Key Stage 4; this may reflect some under-performance at Key Stage 2 by able pupils whose English is still developing. Chinese pupils were 4 times more likely to be high attainers than White British pupils; pupils from other Asian backgrounds were 3.5 times more likely; Bangladeshi and Indian pupils were 2.5 times more likely; Pakistani, Black African and other White pupils were twice as likely, and pupils from other Mixed backgrounds, White and Asian, mixed White and Black African and Irish pupils were about 1.5 times more likely.20 For a pupil with a combination of characteristics, the individual factors are multiplied together to find the overall effect. For example, the combined effect of being a Chinese girl is to increase the odds by 570%, since 3.94*1.70 = 6.70, while the combined effect of being a Mixed White and Black Caribbean pupil with a SEN statement is to reduce the odds of being a high attainer at Key Stage 4 in 2006 by 65%, since 0.71*0.49 = 0.35.
20 Coefficients and the R-square statistic are provided in the annex.

30
4. Do High Attainers In One Subject Do Well In All Subjects?
____________________________________________________________________ Summary
• At Key Stage 2, if a pupil is in the high attaining group for mathematics, but not English, then they are quite likely to be in the high attaining group for the overall measure: a 48% chance. If a pupil is in the high attaining group for English, but not mathematics, then they are less likely to be in the high attaining group for the overall measure: a 36% chance. For Key Stage 3 these chances become 51% and 41%.
• The majority of high attainers in English at Key Stages 2 and 3 are female, at approximately 65%, and the majority of high attainers in mathematics at Key Stages 2 and 3 are male, at nearly 60%. A similar percentage of females and males are high attainers overall.
• Between 47% and 66% of the groups of high attaining pupils at Key Stages 2 and 3 remain high attainers at Key Stage 4.
• At Key Stage 4, 91% of mathematics A* grades and 89% of English A* grades are achieved by high attainers. Among Key Stage 4 high attainers, 77% achieved grade A or A* in mathematics and 78% achieved these grades in English, whereas the equivalent rates for the rest of the cohort were 5% and 6%.
__________________________________________________________________ Are high attaining pupils in Key Stage 2 mathematics or English more likely to be high attaining overall21? Is this result the same for Key Stage 3? What percentage of high attainers in English, mathematics and on the overall measure are in the top 10% of attainers at Key Stage 4? Is high attainment at Key Stage 2 or 3 more likely to predict high attainment at Key Stage 4? These are all questions that are addressed within this chapter, which proceeds chronologically, beginning with assessment of high attainment at Key Stage 2. 4.1 Key Stage 2 Approximately 10 percent of pupils are in the defined high attaining groups for English and mathematics; of these, 4 percent were in both groups. The 10 percent of pupils in the ‘overall’ group were high attainers based on adding together marks for English and mathematics and averaging: this group represents the high attainers on a combined measure. Pupils with a finely graded point score above 31.9 in English, 33.4 in mathematics and 32.3 on the overall measure were defined as high attaining. The maximum point score reached in each of the specified measures was 35.8. Chart 4.1 shows the distribution of high attaining pupils’ point scores for mathematics and English.
21 The ‘Overall’ measure for Key Stage 2 is an average of Key Stage 2 mathematics result and Key Stage 2 English result

31
Chart 4.1: Distribution of Marks of High Attaining Pupils in Key Stage 2 Mathematics and English in 2006
0
1,000
2,000
3,000
4,000
5,000
6,000
7,000
8,000
9,000
10,000
31.92 32
.132
.3432
.52 32.7
32.88 33
33.12 33
.333
.4233
.4833
.66 33.9
34.08 34
.234
.2634
.4434
.6234
.6834
.8634
.9234
.9835
.0435
.22 35.4
35.46
35.64
35.76
35.82
Finely Graded Point Score
Freq
uenc
y
English Maths
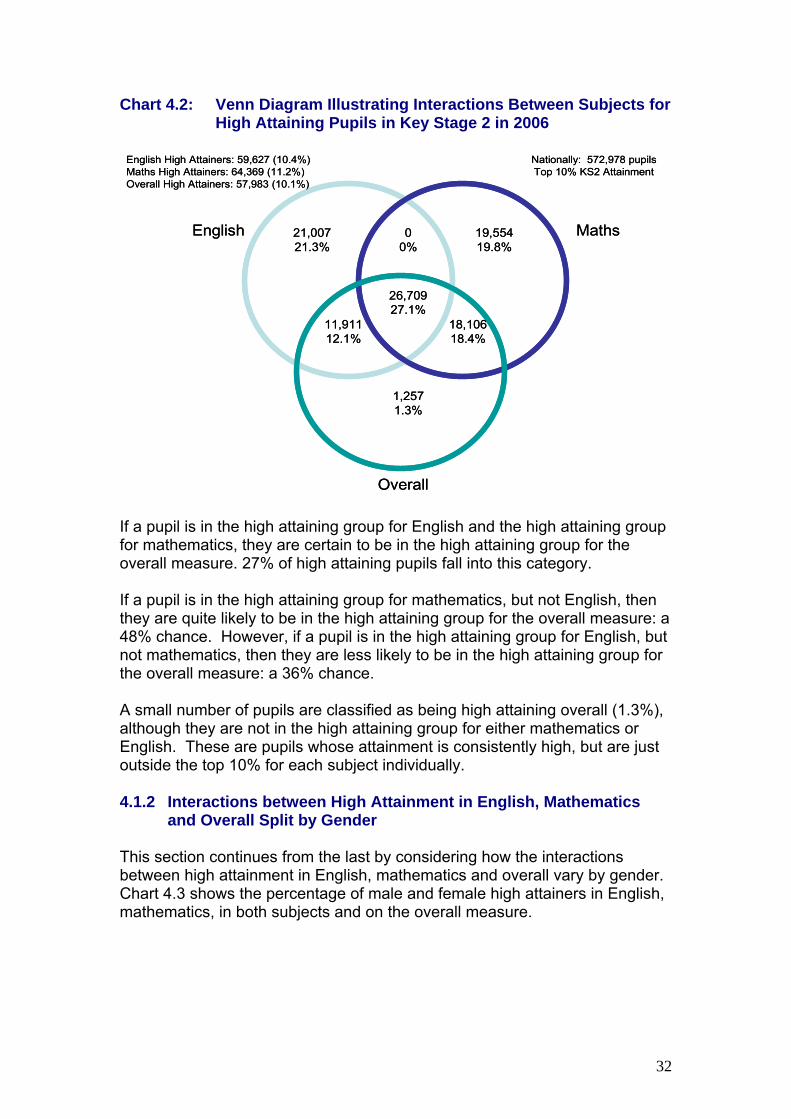
The cut-off to achieve within the top 10% of finely graded point scores in mathematics is roughly 1.5 points higher than for the equivalent measure in English. Furthermore, the spread of high attaining pupils’ results in mathematics cover a smaller range of point scores than high attaining pupils in English: 2.3 points versus 3.9 points, respectively. For both mathematics and English high attainers, a greater proportion of pupils achieve scores at the lower end of the range of finely graded point scores. 4.1.1 Interactions between High Attainment in Key Stage 2 English, Mathematics and Overall in 2006 In this section, the degree of overlap between high attaining pupils in mathematics, English and on the overall measure is considered. Furthermore, the question of whether one subset of high attaining pupils has a greater likelihood of also being in the high attaining overall group is addressed. Of the 573,000 pupils in maintained mainstream Primary schools in 2006, three groups of around 60,00022 were classified as high attaining in English, mathematics and overall. The Venn diagram in Chart 4.2 shows the overlap of these three groups of pupils, both in terms of pupil numbers and percentages of the total number of pupils in any of the Venn groups, for 2006. 22 It is not possible to get the same number in each group due to pupils achieving the same mark at subject cut-offs.
32
Chart 4.2: Venn Diagram Illustrating Interactions Between Subjects for High Attaining Pupils in Key Stage 2 in 2006
If a pupil is in the high attaining group for English and the high attaining group for mathematics, they are certain to be in the high attaining group for the overall measure. 27% of high attaining pupils fall into this category. If a pupil is in the high attaining group for mathematics, but not English, then they are quite likely to be in the high attaining group for the overall measure: a 48% chance. However, if a pupil is in the high attaining group for English, but not mathematics, then they are less likely to be in the high attaining group for the overall measure: a 36% chance. A small number of pupils are classified as being high attaining overall (1.3%), although they are not in the high attaining group for either mathematics or English. These are pupils whose attainment is consistently high, but are just outside the top 10% for each subject individually. 4.1.2 Interactions between High Attainment in English, Mathematics
and Overall Split by Gender This section continues from the last by considering how the interactions between high attainment in English, mathematics and overall vary by gender. Chart 4.3 shows the percentage of male and female high attainers in English, mathematics, in both subjects and on the overall measure.
English High Attainers: 59,627 (10.4%)Maths High Attainers: 64,369 (11.2%) Overall High Attainers: 57,983 (10.1%)
Nationally: 572,978 pupilsTop 10% KS2 Attainment
English Maths
Overall
21,00721.3%
26,70927.1%
00%
11,91112.1%
1,2571.3%
18,10618.4%
19,554 19.8%
English High Attainers: 59,627 (10.4%)Maths High Attainers: 64,369 (11.2%) Overall High Attainers: 57,983 (10.1%)
Nationally: 572,978 pupilsTop 10% KS2 Attainment
English Maths
Overall
21,00721.3%
26,70927.1%
00%
11,91112.1%
1,2571.3%
18,10618.4%
19,554 19.8%

33
Chart 4.3: High Attainment Split by Subject and Gender in 2006
0%
10%
20%
30%
40%
50%
60%
70%
80%
90%
100%
English Maths Both Overall
High Attainment
Female Male
The stacked bar chart shows that the majority of high attainers in English at Key Stage 2 were female, at over 65%, and the majority of high attainers in mathematics at Key Stage 2 were male, at nearly 60%. The gender spilt for being a high attainer in both mathematics and English and on the overall measure (an average of Key Stage 2 mathematics and English scores) was much more equal, and approaches a 50:50 split. The high attaining groups are represented on the Venn diagrams in Charts 4.4 (a) and (b). These charts are similar to Chart 4.2, only showing the overlap of the three high attaining groups for females and males separately. The percentages correspond to the number in each section as a proportion of the total number of pupils within the Venn diagram. The Venn diagrams demonstrate that female pupils are most likely to be high attaining at only English, and male pupils are most likely to be high attaining at only mathematics. Chart 4.4(a): Venn Diagram Illustrating Interactions Between Subjects
for High Attaining Females in Key Stage 2 in 2006
English High Attainers: 39,063Maths High Attainers: 26,514 Overall High Attainers: 30,299
Nationally: 281,038(49%) femaleTop 10% KS2 Attainment
English Maths
Overall
16,10631.2%
14,06528.3%
00%
8,35216.2%
6601.3%
6,68212.9%
5,227 10.1%
English High Attainers: 39,063Maths High Attainers: 26,514 Overall High Attainers: 30,299
Nationally: 281,038(49%) femaleTop 10% KS2 Attainment
English Maths
Overall
16,10631.2%
14,06528.3%
00%
8,35216.2%
6601.3%
6,68212.9%
5,227 10.1%

34
Chart 4.4(b): Venn Diagram Illustrating Interactions Between Subjects for High Attaining Males in Key Stage 2 in 2006
A similar percentage of female and male pupils are high attaining in all three measures: 28.3% and 25.8% respectively. However, females are over three times more likely to be high attaining at only English than only mathematics, and males are nearly three times more likely to be good at only mathematics than only English. If a female pupil is in the high attaining group for mathematics, but not English, then they are more likely than not to be in the high attaining group for the overall measure: a 56% chance. However, if a female pupil is in the high attaining group for English, but not mathematics, then they are much less likely to be in the high attaining group for the overall measure: a 34% chance. The equivalent percentages for male pupils are much more similar at 44% and 42%: a male is only slightly more likely to be in the high attaining group on the overall measure if they are high attaining in mathematics but not in English. 4.2 Key Stage 3 Pupils with a finely graded point score above 42.0 in English, 46.9 in mathematics and 43.5 on the overall measure were defined as high attaining. However, it is important to note that the maximum possible point score at Key Stage 3 is 54 for mathematics and 48 for English23; Chart 4.5 shows the distribution of high attaining pupils’ marks for mathematics and English.
23 Section 7.1 addresses how tier of paper taken at Key Stage 3 allows for higher marks in mathematics.
English High Attainers: 20,564Maths High Attainers: 37,855Overall High Attainers: 27,684
Nationally: 291,940 (51%) maleTop 10% KS2 Attainment
English Maths
Overall
4,90110.4%
12,10425.8%
00%
3,5597.6%
5971.3%
11,42424.4%
14,327 30.5%
English High Attainers: 20,564Maths High Attainers: 37,855Overall High Attainers: 27,684
Nationally: 291,940 (51%) maleTop 10% KS2 Attainment
English Maths
Overall
4,90110.4%
12,10425.8%
00%
3,5597.6%
5971.3%
11,42424.4%
14,327 30.5%

35
Chart 4.5: Distribution of Marks of High Attaining Pupils in Key Stage 3 Mathematics and English in 2006
0
1000
2000
3000
4000
5000
6000
7000
8000
9000
42.0
42.5
42.8
43.1
43.6
43.9
44.2
44.7
45.1
45.7
46.0
46.6
47.0
47.3
47.7
48.1
48.4
48.7
48.9
49.2
49.5
49.8
50.1
50.3
50.6
51.0
51.4
51.7
52.0
52.3
52.6
52.9
53.2
53.5
53.9
Finely Graded Point Score
Freq
uenc
y
English Maths
A greater proportion of high attaining pupils’ mathematics and, particularly, English scores were at the lower end of the range of scores achieved than towards the upper end. 4.2.1 Interactions between High Attainment in English, Mathematics and Overall at Key Stage 3 in 2006 The degree of overlap between high attaining pupils in mathematics, English and on the overall measure at Key Stage 3 is considered here, alongside the question of whether one subset of high attaining pupils has a greater chance of being in the high attaining overall group. Of the 600,000 pupils at Key Stage 3 in maintained mainstream schools in 2006, three groups of between 57,000 and 59,000 were classified as high attaining in English, mathematics and overall. Chart 4.6 reveals the overlap between these three groups of pupils, both in terms of pupil numbers and percentages of the total number of pupils in any of the Venn groups for 2006.

36
Chart 4.6: Venn Diagram Illustrating Interactions Between Subjects for High Attaining Pupils in Key Stage 3 in 2006
Similarly to the Key Stage 2 results, if a pupil is in the high attaining group for English and the high attaining group for mathematics, they are certain to be in the high attaining group overall: 29% of high attaining pupils fall into this category. If a pupil is in the high attaining group for mathematics, but not English, then they are slightly more likely than not to be in the high attaining group for the overall measure: a 51% chance. However, if a pupil is in the high attaining group for English, but not mathematics, then they are less likely to be in the high attaining group for the overall measure: a 41% chance. Both of these percentages are greater than the equivalent percentages obtained for Key Stage 2 (48% and 36%, respectively), which suggests that high achievement in one subject at Key Stage 3 is slightly more likely to result in a mark within the overall top 10% of marks than high attainment in one subject at Key Stage 2. 4.2.2 High Attainment in English, Mathematics and Overall Split by
Gender Chart 4.7 shows the percentage of male and female high attainers in English, mathematics, in both subjects and on the overall measure.
English High Attainers: 58,900 (10.2%)Maths High Attainers: 58,881 (10.1%) Overall High Attainers: 57,519 (10.1%)
Nationally: 599,841Top 10% KS3 Attainment
English Maths
Overall
18,85920.5%
26,86829.2%
00%
13,17314.3%
1,1761.3%
16,30217.7%
15,711 17.1%
English High Attainers: 58,900 (10.2%)Maths High Attainers: 58,881 (10.1%) Overall High Attainers: 57,519 (10.1%)
Nationally: 599,841Top 10% KS3 Attainment
English Maths
Overall
18,85920.5%
26,86829.2%
00%
13,17314.3%
1,1761.3%
16,30217.7%
15,711 17.1%

37
Chart 4.7: Key Stage 3 High Attainment Split by Subject and Gender in 2006
0%
10%
20%
30%
40%
50%
60%
70%
80%
90%
100%
English Maths Both Overall
High Attainment
Female Male
Similarly to Key Stage 2 results, the stacked bar chart shows that the majority of high attainers in English at Key Stage 2 are female, at nearly 65%, and the majority of high attainers in mathematics at Key Stage 2 are male, at nearly 60%. The gender spilt for being a high attainer in both mathematics and English and on the overall measure is much more equal, although females are 4 percentage points more likely than males to be high attaining in both subjects at Key Stage 3 than at Key Stage 2. Due to the similar gender splits obtained for high attainers at Key Stages 2 and 3, the gender difference is not pursued further for Key Stage 3. 4.3 Subject-Specific Progression of High Attaining Pupils It is important to consider what percentage of those pupils who are identified as high attainers in mathematics, English and overall maintain their high performance in later education. This section first considers the percentage of high attaining pupils in Key Stages 2 and 3 who maintain their high performance in Key Stage 4. Analysis is then turned to the Key Stage 2 subject-specific cohorts in order to gauge what percentage of the high attaining groups achieve in the top 10% of marks at Key Stage 3. 4.3.1 Progression from Key Stages 2 and 3 to Key Stage 4 in 2006 The percentages of those pupils who are defined as high attainers in mathematics, English and overall, at Key Stage 2 in 2001 and Key Stage 3 in 2004, and who maintain their high performance in Key Stage 4 are provided in Table 4.1. This table shows that between 47% and 66% of prior high attaining pupils are still high attaining at Key Stage 4.

38
Table 4.1: Percentage of High Attaining Pupils at Key Stages 2 and 3 who Progress to be High Attainers at Key Stage 4 in 2006
Top 10% %Key Stage 2 English 47.2Key Stage 2 Mathematics 47.3Key Stage 2 Overall 53.0Key Stage 3 English 55.5Key Stage 3 Mathematics 60.3Key Stage 3 Overall 66.2
A high attaining pupil at Key Stage 3 on the overall measure is most likely to be in the high attaining group at Key Stage 4, at 66%. High attainment in mathematics at Key Stage 3 is a better predictor of being high attaining at Key Stage 4 than high attainment in English at Key Stage 3. However, whether a pupil is high attaining in mathematics or English at Key Stage 2 does not contribute differentially to whether they are a high attaining pupil at Key Stage 4, although pupils in the overall measure at Key Stage 2 are 5% more likely to progress to the high attaining Key Stage 4 group than those in either of the subject measures. 4.3.2 Subject Progression from Key Stage 2 in 2003 to Key Stage 3 in
2006 The question of particular interest here is whether subject-specific high attaining groups are more likely to remain fixed between Key Stages 2 and 3 than the overall high attaining group, or not. Chart 4.8 provides the percentage of high attainers in mathematics, English and overall at Key Stage 2 who remain in the high attaining groups at Key Stage 3. Chart 4.8: High Attainers Progression Between Key Stage 2 in 2003
and Key Stage 3 in 2006
0
10
20
30
40
50
60
70
80
90
100
KS2 English KS2 Maths KS2 Overall KS2 English KS2 Maths KS2 Overall KS2 English KS2 Maths KS2 Overall
KS3 English KS3 Maths KS3 Overall
Top 10% of Pupils at KS3
% th
at a
re H
igh
Atta
iner
s at
KS
3

39
The chart shows that high attainment in Key Stage 2 English is most likely to predict high attainment at Key Stage 3 English. Similarly, high attainment in Key Stage 2 mathematics is the best predictor of high attainment at Key Stage 3 mathematics and high attainment in Key Stage 2 overall is the best predictor of high attainment at Key Stage 3 overall. High attainers in Key Stage 2 mathematics were the group that were most likely to progress to a high attaining group, in this case mathematics, at Key Stage 3, at 64%. These Key Stage 2 mathematics high attainers are one percentage point more likely to remain fixed as high attainers (in mathematics) at Key Stage 3 than high attainers in the overall measure at Key Stage 2 are to remain fixed as high attainers (in the overall measure) at Key Stage 3. However, high attainers in Key Stage 2 English are 12 percentage points less likely to remain fixed as high attainers in English at Key Stage 3 than high attainers in the overall measure at Key Stage 2 are to remain fixed as high attainers overall at Key Stage 3. 4.4 Key Stage 4 There is a compulsory set of full GCSE subjects that pupils must undertake National Curriculum programmes of study in, including mathematics, English and science24; these subjects are usually assessed by taking full GCSEs. This section continues to focus on English and mathematics performance, this time at Key Stage 4. However, chapter 5 compares the take-up of all full GCSE subjects by high attaining pupils and the rest of the cohort at Key Stage 4. It also addresses the question of whether there are particular subjects that high attaining pupils do very well at or whether they are high achieving across the majority of GCSE subjects. 4.4.1 Grades Achieved by High Attaining Pupils in English and
Mathematics in Key Stage 4 in 2006 Grades that pupils can be awarded at GCSE range from A*-G and, when a pupil’s performance is categorised to be below a G grade, they are awarded an un-graded GCSE grade: U. Chart 4.9 is a stacked chart, which illustrates the rate of high attaining pupils and the rest of the cohort achieving each grade in their English and mathematics GCSEs.
24 Pupils must also follow National Curriculum programmes of study in physical education, citizenship and information and communications technology and study religious education. A range of full and short course GCSEs are available in these subjects.

40
Chart 4.9: Rate of Grades Achieved in GCSE English and Mathematics in 2006
0
10
20
30
40
50
60
70
80
90
100
HA: Maths Non-HA: Maths HA: English Non-HA: English
GCSE Subject
%Rate of A* Grades Rate of A Grades Rate of B Grades Rate of C Grades Rate of D Grades Rate of E GradesRate of F Grades Rate of G Grades Rate of U Grades
For high attaining pupils, the rate of achievement of A* grades in mathematics and English is 32% and 27%, respectively. A further 45% and 51% of high attainers are awarded A-grades. The combined rate of A* and A grades awarded to high attaining pupils is 77% for mathematics and 78% for English, whereas the equivalent combined rates are only 5% and 6% for non-high attaining pupils. 4.4.2 Proportion of A* Grades Achieved by High Attaining Pupils at Key
Stage 4 The proportion of A* grades that are achieved by high attaining pupils and non-high attaining pupils for GCSE mathematics and English is shown in Chart 4.10. This chart shows that 91% of mathematics A* grades and 89% of English A* grades are achieved by high attainers. Chart 4.10: Proportion of High-Attaining and Non-High Attaining Pupils
gaining A* grades in 2006
0
10
20
30
40
50
60
70
80
90
100
Maths English
GCSE Subject
% A
* G
rade
s
% A* Gained by High Attainers % A*s Gained by Non-High Attainers

41
5. What are the Subjects Chosen by High Attainers?
____________________________________________________________________ Summary
• After English, English literature, mathematics and science, modern foreign languages are the next most popular subject choice for high attaining pupils at Key Stage 4. For the rest of the cohort, the next most popular choice is design and technology.
• 25% of high attainers take a combination of subjects that include a modern foreign language and two of: creative arts, humanities and technology. This compares with 16% of the rest of the cohort.
• High attainers take, on average, 2 more full GCSEs than the rest of the cohort, and 1 more A-level.
_______________________________________________________________ This chapter looks at the subjects and qualifications chosen by high attainers in their Key Stage 4 programme of study. In particular, the following are considered:
- Which are the most and least popular subjects chosen at Key Stage 4 by high attainers at the end of Key Stage 3? How does this compare with the rest of the cohort?
- What is the effect of subject selection on a pupil’s probability of becoming a high attainer/ being classified as gifted and talented at the end of Key Stage 4?
- Which combinations of subjects characterise high attaining pupils? Do high attaining pupils choose a broader curriculum than the rest of the cohort?
- How many qualifications do high attainers attempt at the end of Key Stage 4?
- What pattern of grades is observed for high attainers at the end of Key Stage 4?
The later sections of this chapter consider similar questions for high attaining pupils at the end of Key Stage 4, and which subjects they study at A-level.

42
5.1 Subjects Chosen at Key Stage 4 by High Attainers at Key Stage 3 Table 5.1 shows, for a range of full GCSE subjects and vocational qualifications, the attempt rates of pupils with high attainment at Key Stage 3 compared with the rest of the cohort25. English, Mathematics, English Literature and two sciences are each chosen by over 98% of high attainers. In combination, these subjects are taken by 96% of high attainers; this compares with 67% of the rest of the cohort. For English Literature, particularly, this high uptake may be less to do with the high attainers themselves than the compulsory subjects offered by the types of school they attend. Modern foreign language (MFL) uptake has been falling steadily in recent years. In 2006, just over half (51%) of all pupils at the end of Key Stage 4 attempted an MFL GCSE, a reduction of 17 percentage points from 68% in 2004 and 28 percentage points from 79% in 2000. Design and Technology has now overtaken MFL as the fifth most popular subject choice after English, Mathematics, Science and English Literature. However, 87% of high attainers at Key Stage 3 still attempt at least one MFL GCSE and, for these pupils, MFL remains more popular than Design and Technology. The most popular subject for high attainers beyond the central suite of English, Mathematics, English Literature, Science and MFL is History. Humanities are generally more popular with high attainers than with the rest of the cohort, for whom Design and Technology and Art and Design are the most popular non-core GCSE subjects. The greatest absolute gaps in percentage uptake of subjects between the high attaining group and the rest of the cohort are observed for Physics, Chemistry and Biology, French and History. Few GCSE subjects are taken by a higher proportion of the rest of the cohort than the highest attainers: the most notable of these are Double and Single Award Science, and Design and Technology. There is an alternative method of measuring this gap: using odds ratios rather than simple percentage point differences. For example, is the small difference in high levels of uptake in Mathematics more remarkable than the large difference in low levels of uptake in Statistics?
25 As defined in the Introduction, high attainment at Key Stage 3 is top 10% by average point score in the English and mathematics National Curriculum tests. The cohort is all pupils in maintained mainstream schools in England who reached the end of Key Stage 4 in 2006.

43
Table 5.1: Subjects Chosen at Key Stage 4 in 2006 by High Attainers at Key Stage 3
Percentage of high attainers at Key
Stage 3 attempting subject
Percentage of rest of
cohort attempting
subject
Absolute gap in
percentage points
Observed odds ratio
FULL GCSEs
English 100% 96% 4 18.3 Mathematics 100% 97% 3 11.0
Any science 99% 88% 11 15.0 Any two sciences 97% 76% 21 10.2 Physics 28% 4% 25 10.7 Chemistry 28% 4% 25 10.6 Biology 28% 4% 24 9.9 Science: Double Award 69% 72% -3 0.9 Science: Single Award 2% 12% -10 0.2
English Literature 99% 82% 17 17.3
Any modern foreign language 87% 45% 42 8.0 More than one modern foreign language 18% 4% 15 6.0 French 58% 28% 30 3.5 German 30% 12% 18 3.2 Spanish 15% 6% 8 2.5 Other modern foreign language 4% 3% 1 1.4
English and mathematics 100% 96% 4 15.8 Mathematics and two sciences 97% 75% 22 10.2 English, mathematics and two sciences 97% 75% 22 10.4 English, mathematics, two sciences and English Literature 96% 67% 29 11.8 English, mathematics, two sciences, English Literature and an MFL 84% 37% 47 9.0
History 55% 29% 26 2.9 Geography 41% 27% 14 1.8 Information Technology 19% 14% 5 1.5 Design and Technology 50% 53% -3 0.9 Home Economics 1% 5% -4 0.2 Art and Design 30% 29% 1 1.0 Music 17% 7% 10 2.6 Religious Studies 34% 22% 12 1.8 Drama 15% 15% 1 1.1 Media/Film/TV 6% 9% -3 0.6 Physical Education 21% 26% -5 0.8 Business Studies 15% 13% 3 1.3
VOCATIONAL GCSEs and GNVQs Art and Design 1% 2% -1 0.3 Business 2% 5% -3 0.4 Health and Social Sciences 1% 6% -5 0.1 Leisure and Tourism 0% 4% -3 0.1 Manufacturing and Construction 0% 1% -1 0.4 Science and Engineering 1% 10% -8 0.1 Information Technology 14% 20% -6 0.7 Performing Arts 0% 1% 0 0.4
VRQs, Basic Skills, Key Skills and BTECs 16% 24% -8 0.6

44
In order to calculate the odds ratio, it is first necessary to calculate the odds of an event occurring (in this case, choosing a particular subject at GCSE). The odds are defined as the probability of the event happening divided by the probability of it not happening. Therefore, the odds ratio is defined by the odds of the event happening for one group, divided by the odds for the second group. Here, the odds ratio for the highest attaining pupils relative to the rest of the cohort is:
( )( )RESTREST
HIGHHIGH
pppp
−−
1/1/
An odds ratio of greater than 1 suggests that the subject is associated with high attainment; similarly an odds ratio of less than 1 implies greater association with lower attainment. Table 5.1, then, shows that the subjects most associated with high attainment are English, Mathematics, English Literature, the separate Sciences, and a modern foreign language. All vocational qualifications, and particularly Health and Social Sciences, Leisure and Tourism, and Science and Engineering, are not associated with high attainment. 5.2 Effect of Subject Selection on High Attainment and Gifted and
Talented Table 5.2 summarises the effects of GCSE subject selection on a pupil’s probability of being a high attainer at the end of Key Stage 4 study26. The model used to obtain odds ratios in this instance was a binary logistic regression, with all subjects alongside prior attainment point score at Key Stage 2, entered as explanatory variables. The odds ratios can be interpreted as showing the effect of a particular subject on the odds of high attainment after controlling for the effect of a pupils’ prior attainment. For example, studying and sitting an examination in GCSE English increases the odds of high attainment for similar pupils 22-fold, whereas GCSE mathematics has a much smaller, but still positive effect. However, results for core subjects with very high coverage such as these should probably be treated as spurious (and all results treated with a degree of caution) as there are undoubtedly many other confounding factors contributing to high attainment, other than subject selection and prior attainment. These factors were considered in Chapter 2.
26 Defined as in the Introduction: top 10% by capped point score.

45
Table 5.2: Effect of Subject Selection on High Attainment
GCSE subject
Percentage of students becoming
high attainers
Estimated1
odds ratio English 10.5% 22.46 Other modern foreign language 18.1% 3.47 Mathematics 10.4% 3.17 English Literature 12.0% 1.87 Chemistry 43.4% 1.80 French 19.1% 1.67 Spanish 21.0% 1.62 Geography 15.3% 1.54 German 21.7% 1.49 History 17.7% 1.48 Religious Studies 16.1% 1.46 Music 20.0% 1.26 Media/Film/TV 7.4% 1.14 Art and Design 10.3% 1.13 Drama 10.6% 1.10 Science: Double Award 10.1% 1.01 Physical Education 8.5% 1.00 Design and Technology 9.6% 1.00 Biology 41.6% 0.99 Home Economics 3.4% 0.97 Business Studies 11.3% 0.91 Information Technology 12.5% 0.91 Science: Single Award 2.0% 0.82 Physics 43.5% 0.75 ALL SUBJECTS 10.0% -
1 Parameter estimates from logistic regression. The observed odds show that the separate Sciences deliver by far the highest proportions of high attainers: over 40% of pupils in these subjects are in the top decile by the end of Key Stage 4. However, after controlling for prior attainment, the effect on high attainment of selecting these subjects is greatly reduced: for pupils with similar prior attainment, Biology and Physics both reduce the odds of becoming a high attainer at the end of Key Stage 4. Home Economics, Business Studies, Information Technology and Single Award Science also have an apparently negative effect. Table 5.3 uses the same approach as Table 5.2 for the odds of becoming part of the gifted and talented cohort.

46
Table 5.3: Effect of Subject Selection on Gifted and Talented
GCSE subject
Percentage of students in the G & T
cohort Estimated1 odds ratio
Biology 29.0% 2.00 Music 20.3% 1.72 Science: Double Award 11.6% 1.59 Physical Education 12.7% 1.45 Media/Film/TV 11.4% 1.39 English 11.4% 1.37 History 15.6% 1.30 French 16.2% 1.28 Spanish 17.0% 1.27 Other modern foreign language 12.8% 1.23 Drama 12.7% 1.22 Art and Design 11.7% 1.22 Mathematics 11.3% 1.20 Geography 13.7% 1.19 Physics 29.9% 1.18 Religious Studies 14.1% 1.13 German 16.1% 1.11 Information Technology 13.2% 1.11 Chemistry 29.8% 1.01 Business Studies 11.3% 0.97 Science: Single Award 4.7% 0.96 Design and Technology 10.6% 0.93
1 Parameter estimates from logistic regression. Comparing Table 5.3 with Table 5.2, it can be seen that subject selection is a better predictor of high attainment than of gifted and talented: the odds ratios in general are greater. The greatest difference between the tables is in the order of subjects listed by odds ratio. Traditional academic subjects such as English, MFL and mathematics are the best predictors of high attainment, but gifted and talented is better predicted by creative and vocational subjects such as Music and Physical Education. It should be noted, however, that gifted and talented is not simply a proxy measure for high prior or current academic attainment: it should cover not just those pupils, but also those who excel, for example, in sports or the creative arts. Chart 5.1 shows the differential effect of subjects on high attainment and gifted and talented. The separate Sciences and MFL are more likely to produce high attainers than gifted and talented pupils, while the opposite is true for Single Award Science, Media Studies and Physical Education.

47
Chart 5.1: Differential Effect of Subject Selection on High Attainment and Gifted and Talented
0%
5%
10%
15%
20%
25%
30%
35%
40%
45%
50%C
hem
istry
Phys
ics
Biol
ogy
Ger
man
Oth
er m
oder
n fo
reig
n la
ngua
ge
Span
ish
Fren
ch
His
tory
Rel
igio
us S
tudi
es
Geo
grap
hy
Bus
ines
s S
tudi
es
Mus
ic
Engl
ish
Lite
ratu
re
Info
rmat
ion
Tech
nolo
gy
Engl
ish
Mat
hs
Des
ign
and
Tech
nolo
gy
Art
and
Des
ign
Sci
ence
: Dou
ble
Awar
d
Hom
e Ec
onom
ics
Dra
ma
Scie
nce:
Sin
gle
Awar
d
Med
ia/F
ilm/T
V
Phys
ical
Edu
catio
n
Prob
abili
tyPercentage of high attainers Percentage G & T
In general, the gifted and talented cohort is much less determined by subject (and, by extension, prior attainment) than the high attaining group is. Chart 5.2 shows how subject choice at GCSE affects high attaining pupils at Key Stage 3 in terms of their ability to maintain high attainment; that is, which subjects have greater proportions of higher attainers at the end of Key Stage 4 than at the beginning, and vice versa. Again, there are many potential contributors to these results, so they should not be regarded as a measure of the ‘effectiveness’ of a particular subject. The chart shows that two subject/subject groups greatly increase the probability of high attainment over the course of Key Stage 4: other MFL (over 35% more pupils become high attainers), and Home Economics (25%). The separate Sciences reduce the probability by over 7%. Table 5.4 presents the same data but shows the proportions of pupils taking each subject who maintain high attainment between the Key Stages, and the proportions who drop out of and join the high attainment group. The overall maintenance of high attainment between the Key Stages is considered in Chapter 3: 6.4% of pupils remain high attaining, while 3.2% leave the group and 3.5% join. The spike for ‘other MFL’ in Chart 5.2 can be attributed, for example, to a rate of only 2.3% dropping out from the high attainment group, and 7.5% joining.

48
Chart 5.2: Change in High Attainment Probability by Subject
-10%
-5%
0%
5%
10%
15%
20%
25%
30%
35%
40%
Engl
ish
Mat
hs
Phys
ics
Che
mis
try
Bio
logy
Scie
nce:
Dou
ble
Aw
ard
Scie
nce:
Sin
gle
Aw
ard
Engl
ish
Lite
ratu
re
Fren
ch
Ger
man
Span
ish
Oth
er m
oder
n fo
reig
n la
ngua
ge
Des
ign
and
Tech
nolo
gy
Info
rmat
ion
Tech
nolo
gy
Bus
ines
s St
udie
s
Hom
e Ec
onom
ics
His
tory
Geo
grap
hy
Art
and
Des
ign
Mus
ic
Dra
ma
Med
ia/F
ilm/T
V
Phys
ical
Edu
catio
n
Rel
igio
us S
tudi
es
Perc
enta
ge p
roba
bilit
y ch
ange
Table 5.4: Effect of Subject Selection on Change in High Attainment Proportion of pupils
High attaining at Key Stage 3 and
Key Stage 4
High attaining at Key Stage 3
only
High attaining at Key Stage 4
only English 6.7% 3.4% 3.7% Mathematics 6.6% 3.3% 3.7% Physics 34.0% 12.3% 9.1% Chemistry 33.9% 12.2% 9.1% Biology 32.4% 11.8% 8.7% Science: Double Award 6.0% 3.3% 4.0% Science: Single Award 1.0% 0.8% 1.0% Any science 7.2% 3.6% 3.9% English Literature 7.6% 3.8% 4.2% French 12.9% 5.2% 5.9% German 15.3% 6.4% 6.2% Spanish 14.0% 5.9% 6.8% Other modern foreign language 9.7% 2.3% 7.5% Design and Technology 6.0% 3.2% 3.5% Information Technology 8.3% 4.6% 4.0% Business Studies 7.2% 4.5% 4.0% Home Economics 1.6% 1.1% 1.8% History 11.8% 5.0% 5.7% Geography 9.8% 4.1% 5.3% Art and Design 6.4% 3.4% 3.8% Music 14.2% 5.8% 5.5% Drama 6.6% 3.5% 3.9% Media/Film/TV 4.0% 2.7% 3.3% Physical Education 4.9% 3.1% 3.4% Religious Studies 10.2% 4.2% 5.8% All subjects 6.4% 3.2% 3.5%

49
5.3 Combinations of Subjects Chosen by High Attainers The above sections have considered the numbers and proportions of pupils taking subjects in isolation. The following will consider which combinations of subjects characterise high attaining pupils, and how this differs (if at all) from the rest of the cohort. 5.3.1 Do High Attainers Choose a Broader Curriculum of Study? Table 5.1 showed that the great majority (96%) of high attaining pupils at Key Stage 3 attempted GCSEs in English, Mathematics, English Literature and two Sciences. Similarly, 95% of high attainers attempted GCSEs in English, Mathematics, English Literature and any Science, and furthermore attempted a total of at least 8 GCSEs27. Using these pupils as a base, Chart 5.3 shows the distribution of other subjects making up the 8 GCSEs. Here, ‘creative arts’ is defined as one of Music, Drama or Art and Design; ‘humanities’ as History or Geography, and ‘technology’ as either Design and Technology or Information Technology. The structure of the probability tree in Chart 5.3 is derived as follows:
• Step 1: Proportion taking English, mathematics and science (compulsory subjects) plus English Literature
• Step 2: Proportions following Single Award, Double Award or separate Sciences pathways
• Step 3: Proportions taking combinations of MFL, humanities, creative arts and technology
Chart 5.3 can of course be composed in any number of ways, but the diagram as it is covers all high attaining pupils and does not contain an unwieldy number of branches. The chart shows that the most popular ‘route’ for high attainers includes Double Award Science, one MFL, and two of creative arts, humanities and technology, accounting for 25% of these pupils. 15% of high attainers take a comprehensive course of study that includes at least two sciences, and at least one each of creative arts, humanities and technology28.
27 The study of English, mathematics and science is compulsory at Key Stage 4 (http://www.qca.org.uk/14-19/11-16-schools/110_133.htm, Qualifications and Curriculum Authority, 2004). The study of English Literature, however, is not a statutory requirement. 28 ‘Comprehensive’ as defined purely within the scope of this bulletin: this is not a recognised DfES or QCA definition.

50
Chart 5.3: Probability Tree: GCSE Subject Combinations (High Attainers)
95%
2% 29%69%
12% 18% 17% 39% 14% 10% 20% 14% 39% 17%
2%
Double Science routeSingle Science route Separate Sciences route
1 MFL and 1 of creative arts, humanities and
technology
1 MFL and 3 of creative arts, humanities and
technology
1 MFL and 2 of creative arts, humanities and
technologyNo MFL 2 or more MFL
1 MFL and 3 of creative arts, humanities and
technology
1 MFL and 2 of creative arts, humanities and
technology
1 MFL and 1 of creative arts, humanities and
technology
8% 12% 11% 25% 11% 5%
High attainers at KS3
High attainers at KS3 attempting 8 or more GCSEs including English, maths,
English Literature and any Science subject
9% 3% 5% 4%
No MFL 2 or more MFL

51
Chart 5.4: Probability Tree: GCSE Subject Combinations (All Pupils)
61%
6% 29%85%
35% 7% 11% 31% 16% 21% 14% 12% 35% 18%
3%
Single Science route Double Science route Separate Sciences route
All KS4 pupils
No MFL 2 or more MFL
1 MFL and 3 of creative arts,
humanities and technologyNo MFL 2 or more MFL
1 MFL and 3 of creative arts,
humanities and technology
1 MFL and 2 of creative arts,
humanities and technology
18% 4% 6% 16% 2% 1%
All KS4 pupils attempting 8 or more GCSEs including English,
maths, English Literature and any Science subject
1 MFL and 2 of creative arts,
humanities and technology
1 MFL and 1 of creative arts,
humanities and technology
8% 1% 1% 1%
1 MFL and 1 of creative arts,
humanities and technology

Chart 5.4 shows that 61% of the whole cohort take the ‘base’ suite of English, mathematics, English Literature and any science. The most popular route is also Double Science, one MFL and two of creative arts, humanities and technology (16%), while only 7% (compared with 15% of high attainers) take two Sciences and one each of creative arts, humanities and technology. 5.3.2 Cluster Analysis Approach Another way of looking at how subject combinations differ between high attainers and the whole cohort is by performing respective cluster analyses. Rather than the ‘route’/’pathway’ approach of the previous section, a cluster analysis reduces a collection of variables (in this case, GCSE subjects) into smaller ‘clusters’ by examining which variables are most similar in terms of their observed data. In other words, it will identify which subjects are most often taken in combination. The results of this method are in Appendix C. 5.4 Number of Qualifications Taken by High Attainers As might be expected, high attainers at Key Stage 3 proceed to attempt significantly more full GCSEs, on average, than the cohort as whole: a median value of 10 compared with 8. As can be seen from Charts 5.5-5.7, there is also considerably less spread associated with the number of GCSEs taken by high attainers. The cumulative frequencies in Chart 5.7 demonstrate that 90% of high attainers attempt 8 or more full GCSEs, compared with 50% of all pupils. Chart 5.5: Distribution of GCSEs Attempted by High Attainers at Key
Stage 3
0%
10%
20%
30%
40%
50%
0 1 2 3 4 5 6 7 8 9 10 11 12 13 14 15 16
Number of full GCSE entries
Freq
uenc
y

53
Chart 5.6: Distribution of GCSEs Attempted by All Pupils
0%
10%
20%
30%
40%
50%
0 1 2 3 4 5 6 7 8 9 10 11 12 13 14 15 16
Number of full GCSE entries
Freq
uenc
y
Chart 5.7: Cumulative distribution of GCSEs Attempted
Distribution of GCSE entries
0%
10%
20%
30%
40%
50%
60%
70%
80%
90%
100%
0 1 2 3 4 5 6 7 8 9 10 11 12 13 14 15 16
Number of entries
Cum
ulat
ive
freq
uenc
y
High achievers at KS4 Whole cohort
The distributions of other equivalent29 qualifications are not so disparate. The median number of non-full-GCSE qualifications attempted by high attainers is 0.8, compared with 1 for the whole cohort. Charts 5.8 and 5.9 show that, while high attainers generally take fewer of these equivalents, the distributions are broadly similar. The spike at 4 equivalent qualifications corresponds to the effect of taking 1 GNVQ: the GNVQ is equivalent to four full GCSEs. 29 Qualifications approved for pre-16 study by QCA which contribute towards national PSA targets and schools’ measures in the Achievement and Attainment Tables. In addition to full GCSEs, they include short course GCSEs, GNVQs, vocational qualifications, Basic and Key Skills, and entry level qualifications.

54
Chart 5.8: Distribution of GCSE Equivalent Attempts by High Attainers
0%
5%
10%
15%
20%
25%
30%
0
0<=1
1<=2
2<=3
3<=4
4<=5
5<=6
6<=7
7<=8
8<=9
9<=1
0
10+
Number of non-GCSE (equivalent) entries
Freq
uenc
y
Chart 5.9: Distribution of GCSE Equivalent Attempts by Whole Cohort
0%
5%
10%
15%
20%
25%
30%
0
0<=1
1<=2
2<=3
3<=4
4<=5
5<=6
6<=7
7<=8
8<=9
9<=1
0
10+
Number of non-GCSE (equivalent) entries
Freq
uenc
y
5.5 Grades Achieved by High Attainers in Each Full GCSE Subject The following two sections look at high attaining pupils by capped point score at the end of Key Stage 4, and their characteristic grade distributions. Grades that pupils can be awarded at GCSE range from A*-G and, when a pupil’s performance is categorised to be below a G grade, they are awarded an un-graded GCSE grade: U. Chart 5.10 is a stacked chart, which illustrates the rate of high attaining pupils achieving each grade in a GCSE subject; chart 5.11 is the equivalent chart for non-high attainers.

55
Chart 5.10: Rate of Grades Achieved in Each Full GCSE Subject
0
10
20
30
40
50
60
70
80
90
100
Maths
English
English
Liter
ature
Double
Scienc
e
Physic
s
Chemist
ry
Biolog
y
History
Geogra
phy
French
German
Spanis
h
D&T: Elec
tronic
s
D&T: Foo
d
D&T: Grap
hics
D&T: Mate
rials
D&T: Sys
tems
D&T: Tex
tiles Art
Religio
us Edu
catio
n
Physic
al Edu
catio
nDram
a ITMus
ic
Busine
ss Stud
ies
GCSE Subject
%Rate of A* Grades Rate of A Grades Rate of B Grades Rate of C Grades Rate of D Grades
Chart 5.11: Rate of Grades Achieved in Each Full GCSE Subject
0
10
20
30
40
50
60
70
80
90
100
Maths
English
English
Literat
ure
Double
Scienc
e
Physic
s
Chemist
ry
Biolog
y
History
Geogra
phy
French
German
Spanis
h
D&T: Elec
tronic
s
D&T: Foo
d
D&T: Grap
hics
D&T: Mate
rials
D&T: Sys
tems
D&T: Tex
tiles Art
Religio
us Edu
catio
n
Physic
al Edu
catio
nDram
a ITMus
ic
Busine
ss Stud
ies
GCSE Subject
%
Rate of A* Grades Rate of A Grades Rate of B Grades Rate of C Grades Rate of D GradesRate of E Grades Rate of F Grades Rate of G Grades Rate of U Grades
Focussing on chart 5.10, in Double Award Science and Religious Studies, the rate of achievement of A* grades by high attainers is higher than the rate of any other grades achieved, at over 40%. There is also over 40% achievement of A* grades in Geography. The lowest rate of A*s are achieved in Design and Technology (Systems Control), at 20%.

56
In a combined measure of A* and A rates, Geography, History, Design and Technology (Textiles), Double Award Science and Religious Studies are the subjects with the highest rates of achievement for high attaining pupils, at 85% or more. Modern languages (German, French and Spanish) reveal the highest rate of C grades for high attainers, at between 9-11%. High rates of B grades are also awarded in these subjects, alongside Drama, Design and Technology (Graphics), Design and Technology (Systems Control) and Information Technology, at between 21% and 26% of the total. For every subject, less than one percent of high attaining pupils obtain a D grade and less than 0.1% are awarded any grade below a D. Chart 5.11 shows that the rate of A* grades is comparatively very low for non-high attainers: no more than 3% of the awarded marks in a subject are A*s. The rate of A grades is also very low, where no more than 15% of the awarded marks in a subject are A grades. 5.6 Proportion of A* Grades Achieved by High Attaining Pupils This section considers the proportion of A* grades that are achieved by high attaining pupils compared with non-high attaining pupils at the end of Key Stage 4. Chart 5.12 is a stacked bar chart showing the proportion of high-attaining and non-high attaining pupils gaining A* grades. Since these proportions depend on subject take-up to a limited extent, subject take-up lines are superimposed on the graphs. Chart 5.12: Proportion of High Attaining and Non-High Attaining Pupils
Gaining A* Grades
0
10
20
30
40
50
60
70
80
90
100
Maths
Englis
h
Englis
h Lite
rature
Double
Scie
nce
Physic
s
Chemist
ry
Biolog
y
History
Geogra
phy
French
German
Spanis
h
Electro
nics
Food
Graphic
s
Materia
ls
System
s
Textile
s Art
Religio
us E
duca
tion
Physic
al Edu
catio
n
Drama IT
Music
Busine
ss S
tudies
GCSE Subject
% A
* G
rade
s
0
10
20
30
40
50
60
70
80
90
100
Subj
ect T
ake-
Up
Rat
e
% A* Gained by High Attainers % A*s Gained by Non-High AttainersSubject Take-up Rate of High Attainers Subject Take-up Rate of Non- High Attainers

57
For every subject, the majority of A* grades are always obtained by high attaining pupils. The lowest proportions of A* grades obtained by high attainers, at 60%-64% of the total, are in Physical Education, Art and Design and Drama; of these the take-up rate of high attainers and non-high attainers is similar for Art and Drama but 5% lower for P.E. The only subject, apart from Art, where there is a take-up rate above 20% and of within one percentage point between the high attaining and non-high attaining groups is Double Award Science. Of the total number of A* grades awarded for this subject, 96% are gained by high attaining pupils. 5.7 Subjects Chosen at A-level by High Attainers at Key Stage 4 Table 5.5 shows, for a range of A-level subjects, the proportion of those who attempted them who were high attainers at Key Stage 430. 18% of the whole cohort were high attainers, and this is a useful frame of reference for the proportions for individual subjects. Science, MFL and mathematics are the subjects most associated with high attainment. Art and Design and Drama have a high attainment composition similar to the cohort average, while Business and Accounting are among the subjects not associated with high academic attainment. The proportion of girls proceeding to Level 3 qualifications who were high attainers at Key Stage 4 is greater than the equivalent proportion of boys and, in fact, this is still the case even when broken down by subject: there is no A-level subject in which a higher proportion of boys than girls were Key Stage 4 high attainers. 30 The cohort are those pupils included in the Post-16 Achievement and Attainment Tables in 2006. High attainment at Key Stage 4 defined by the 90th percentile of capped point score in maintained mainstream schools in 2004 (the year in which the majority of the cohort completed Key Stage 4).

58
Table 5.5: Proportions of High Attainers at Key Stage 4 by A-level Subject
A level subject
Percentage of all students
with high attainment at Key Stage 4
Percentage of girls with
high attainment at Key Stage 4
Percentage of boys with
high attainment at Key Stage 4
Chemistry 45% 50% 39% German 44% 48% 38% Mathematics (any) 43% 49% 39% French 42% 45% 34% Physics 40% 46% 38% Biology 39% 44% 32% Any modern foreign language 35% 39% 28% General Studies 34% 38% 31% Music 33% 37% 28% Italian 32% 36% 23% Spanish 31% 35% 23% History 30% 37% 24% Geography 27% 34% 21% Economics 27% 30% 25% Computing 24% 27% 24% Religious Studies 23% 25% 18% English 21% 22% 20% Art and Design 20% 23% 15% Any Level 3 qualification 18% 20% 15% Drama 18% 19% 14% Physical Education 16% 23% 12% Business Studies 15% 19% 12% Information Technology 14% 18% 12% Accounting 14% 15% 13% Home Economics 13% 13% 8% Media Studies 10% 13% 7%
Table 5.6 shows the proportions of pupils attempting each subject who gained a high grade (A*, A or B) in the same subject at GCSE. It can be seen that Science, MFL and mathematics each have the highest proportions of pupils with high GCSE grades (over 90%), with Biology students having a slightly smaller proportion of high GCSE grades than Physics or Chemistry students. Over half of MFL students have an A* grade in the same subject at GCSE.
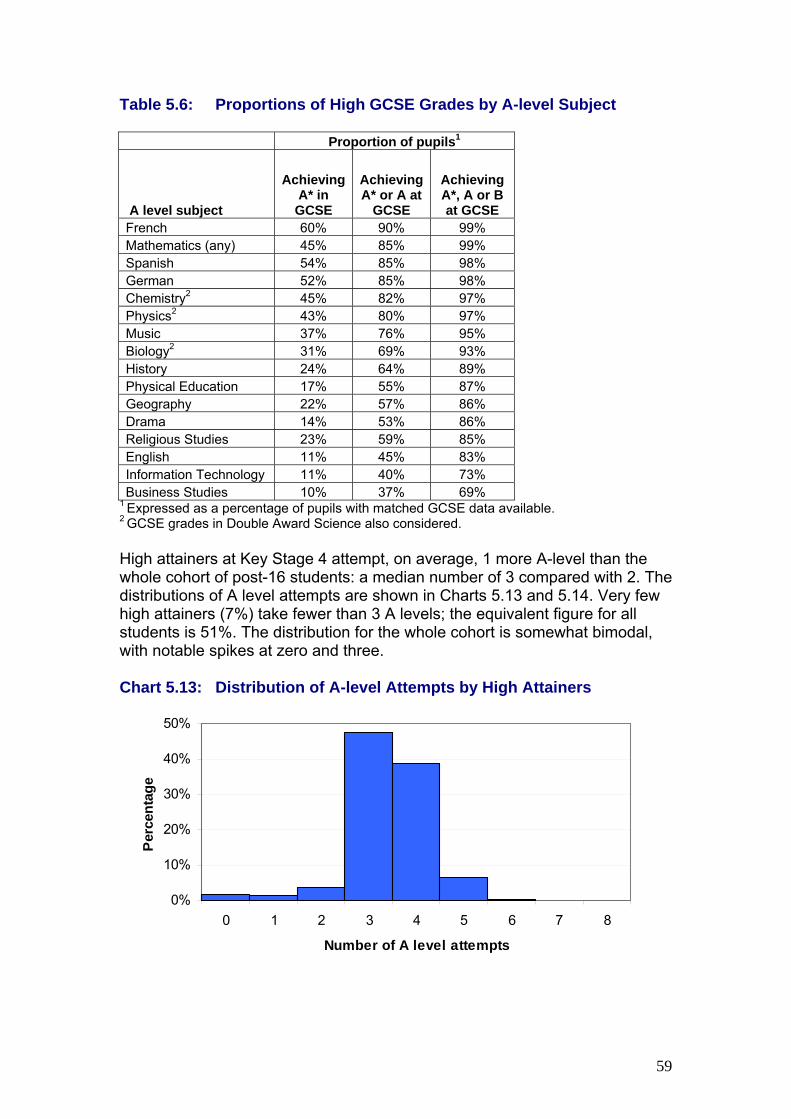
59
Table 5.6: Proportions of High GCSE Grades by A-level Subject Proportion of pupils1
A level subject
Achieving A* in GCSE
Achieving A* or A at
GCSE
Achieving A*, A or B at GCSE
French 60% 90% 99% Mathematics (any) 45% 85% 99% Spanish 54% 85% 98% German 52% 85% 98% Chemistry2 45% 82% 97% Physics2 43% 80% 97% Music 37% 76% 95% Biology2 31% 69% 93% History 24% 64% 89% Physical Education 17% 55% 87% Geography 22% 57% 86% Drama 14% 53% 86% Religious Studies 23% 59% 85% English 11% 45% 83% Information Technology 11% 40% 73% Business Studies 10% 37% 69%
1 Expressed as a percentage of pupils with matched GCSE data available. 2 GCSE grades in Double Award Science also considered. High attainers at Key Stage 4 attempt, on average, 1 more A-level than the whole cohort of post-16 students: a median number of 3 compared with 2. The distributions of A level attempts are shown in Charts 5.13 and 5.14. Very few high attainers (7%) take fewer than 3 A levels; the equivalent figure for all students is 51%. The distribution for the whole cohort is somewhat bimodal, with notable spikes at zero and three. Chart 5.13: Distribution of A-level Attempts by High Attainers
0%
10%
20%
30%
40%
50%
0 1 2 3 4 5 6 7 8
Number of A level attempts
Per
cent
age

60
Chart 5.14: Distribution of A-level Attempts by Whole Cohort
0%
10%
20%
30%
40%
50%
0 1 2 3 4 5 6 7 8
Number of A level attempts
Perc
enta
ge

61
6. What Kinds of Secondary Schools Do High Attaining Pupils Enter?
____________________________________________________________________ Summary • This chapter focuses on high attainers at the end of Key Stage 2 and
describes the characteristics of the schools that these pupils join for their secondary education; specifically, the chapter profiles the type of school that high attainers attend for their Key Stage 4 exams.31
• The rate of high attainers varies by school type from around 7% of the intake to Academies to 51% of the intake to Grammar schools.
• The majority of schools (97%) have at least 1 high attainer in their 2006 GCSE cohort although, for just under two thirds of schools, less than 10% of their GCSE cohort were classified as high attaining.
• Schools with relatively large shares of high attainers have, on average, relatively high attainment at Key Stage 4 and relatively high Key Stage 2 – 4 contextualised value-added (CVA).
• Schools with fewer than 9% of pupils eligible for free school meals account for 45% of high attainers.
• Community Schools account for 71.3% of the intake of all FSM pupils but only 59.2% of high attaining FSM pupils. Nearly 22% of high attaining FSM pupils attend Voluntary Aided schools whereas they only account for 13.3% of the intake of all FSM pupils.
• 92.8% of maintained mainstream high attainers remained in the same sector for their secondary education whilst 7.2% transferred to an independent school. For other pupils who took their Key Stage 2 tests in maintained mainstream schools, 98.1% stayed in this sector whilst only 1.9% moved to independent schools.
____________________________________________________________________ 6.1 Distribution of High Attainers across Maintained Mainstream
Secondary Schools Chart 6.1 shows the distribution of high attainers across maintained mainstream secondary schools. The majority of schools (97.3%) have at least one high attaining pupil attending the school although, for just under two thirds of schools (64.9%), their Key Stage 4 cohorts include fewer than 10% that are high attaining. There are a small number of schools (1.6%) where over 60% of their Key Stage 4 cohort are classified as high attainers.
31 The analysis is based on the Key Stage 4 2006 cohort and identifies those pupils in the cohort that achieved high scores in their Key Stage 2 exams (mostly taken in 2001). Those with Key Stage 2 scores in the top 10% of all scores were classified as high attainers.

62
Chart 6.1: Distribution of High Attainers in Key Stage 4 in 2006
2.7
29.127.3
2.61.4 1.2 1.2 1.6
33.1
0
5
10
15
20
25
30
35
0% 0≤%<5 5≤%<10 10≤%<20 20≤%<30 30≤%<40 40≤%<50 50≤%<60 60≥%
% of High Attainers
% o
f Sch
ools
6.2 Characteristics of Schools Attended by High Attaining Pupils 6.2.1 School Types This section looks at the characteristics of the secondary schools that high attaining pupils in the maintained mainstream secondary sector attend. Table 6.1 presents two sets of statistics: [i] The percentage of high attaining pupils and all pupils attending each type of school in their final year of Key Stage 4: defined as “the composition of the high attaining group” and the “composition of all pupils”. [ii] The percentage of Key Stage 4 pupils in each type of school that are classified as high attainers: the “rate of high attainers”.
There are certain types of schools where the percentage composition of the high attaining group is lower than the percentage composition of all pupils: school types which are under-represented in terms of high attaining pupils. The broad school types include Academies, Community schools, Excellence in Cities Schools, non-Specialists, non-Faith schools and non-Grammar schools. The self governing Foundation and Voluntary Aided schools have slightly higher shares of high attaining pupils than may be expected given their shares of all pupils.

63
Table 6.1: Composition of Key Stage 4 High Attaining Group in 2006 by School Type and Rate of High Attaining Pupils
High Attaining
Pupils Number of All Pupils
Composition of High
Attaining Group (%)
Composition of All Pupils
(%)
Rate of High
Attainers (% of
Cohort) All Maintained Mainstream Schools 56,742 558,486 10.2
School Type
Academies 217 3,102 0.4 0.6 7.0 City Technology College 332 1,845 0.6 0.3 18.0
Community 29,482 356,920 52.0 63.9 8.3 Foundation 13,122 97,422 23.1 17.4 13.5
Voluntary aided 10,933 79,934 19.3 14.3 13.7 Voluntary controlled 2,656 19,263 4.7 3.4 13.8
EiC
Non-EiC 39,692 347,692 70.0 62.3 11.4 Excellence in Cities Schools 17,050 210,794 30.0 37.7 8.1
Specialist Schools
Non-Specialists 5,795 84,772 10.2 15.2 6.8 Specialist 50,947 473,714 89.8 84.8 10.8
Religious Character
Faith Schools 10,427 84,770 18.4 15.2 12.3 Non-Faith Schools 46,315 473,710 81.6 84.8 9.8
Grammar / Not Grammar
Not Grammar 45,895 537,217 80.9 96.2 8.5 Grammar 10,847 21,269 19.1 3.8 51.0
Focusing on the rates of high attainers in the Key Stage 4 cohort, the selective Grammar schools have a significant proportion of high attainers relative to their total share of the Key Stage 4 secondary school cohort. For non-Grammar schools, 8.5% of the cohort are high attainers compared with 51.0% of the intake to Grammar schools. High attainers in Grammar schools account for 19.1% of all high attaining pupils nationally, although their share of the total pupil population is merely 3.8%. 6.2.2 School Attainment and Value Added Table 6.2 shows that the school types that have relatively high proportions of high attainers (as defined by their prior attainment at Key Stage 2) also record relatively high attainment at Key Stage 4. For example, City Technology Colleges and Grammar schools have above average intake rates of high attainers and relatively strong outcomes in terms of the percentage of pupils achieving 5+ A*-C grades at GCSE and in terms of average point score at the end of Key Stage 4. This finding is not surprising given that a pupil’s prior attainment at Key Stage 2 is the key predictor of their performance at Key Stage 4.

64
A school’s contextualised value added (CVA) score represents the average progress that the pupils in that school make, whilst controlling for a host of background factors that influence attainment outcomes; the predecessor was Value Added, which only controlled for prior attainment. Table 6.2 presents the CVA scores for key school types in the maintained mainstream system and shows schools with above average proportions of high attainers not only perform better in terms of raw outcomes but also tend to have high CVA too. This means that the average rate of progress is relatively high in schools with above average intakes of high attainers, even after all the factors in the CVA model are controlled for, including prior attainment, average ability of intake, free school meals eligibility and other pupil characteristics. The correlation between the rate of high attainers and a school’s CVA does not necessarily imply schools with relatively high numbers of high attainers are more effective but, it is a relationship that warrants further investigation. The table also shows that Academies and EiC schools buck the trend given their relatively high CVA and low proportions of high attainers. Table 6.2: Attainment and Contextualised Value Added Key Stage 2 – 4 (2006) by School Type
School Type
Rate of High Attainers
(% of Cohort)
% 5 + A*- C at end of
Key Stage 4
APS (capped) at end of Key Stage 4
Key Stage 2 - Key Stage 4
CVA measure
Community School 8.3 54.4 285.6 998.9 Voluntary Aided School 13.7 66.5 315.8 1,004.7 Voluntary Controlled School 13.8 63.6 311.3 999.5 Foundation School 13.5 64.4 311.8 1,001.5 City Technology College 18.0 88.6 357.0 1,023.4 Grammar Schools 51.0 98.5 404.6 1,003.0 Excellence in Cities (EiC) 8.1 53.2 278.9 1,000.8 Non EiC 11.4 60.0 301.3 1,000.1 Specialist schools 10.8 61.0 302.5 1,001.6 Non Specialist schools 6.8 48.9 270.2 996.0 Academies (new schools & CTC conversions)
7.0 49.8 260.3 1,018.6
All Schools 10.2 58.4 295.5 1000.4
Note: Attainment and CVA data taken from the Statistical First Release “GCSE and Equivalent Examination Results in England 2005/06 (Revised) at http://www.dfes.gov.uk/rsgateway/DB/SFR/s000702/index.shtml School Types are not mutually exclusive (e.g. many Grammar schools have Voluntary Aided status).

65
Chart 6.2 plots the relationship between individual schools’ Key Stage 4 average capped point scores and the proportion of high attainers in their Key Stage 4 cohort based on the top 10% nationally at Key Stage 2. As expected, schools admitting above average proportions of high attainers go on to achieve relatively high average point scores. The chart also shows the spread of Key Stage 4 results is widest for schools with relatively low intake rates of high attaining pupils. Chart 6.2: Percentage of High Attainers and Average Point Score for
all Secondary Schools
0
50
100
150
200
250
300
350
400
450
500
0 10 20 30 40 50 60 70 80 90 100
Percentage of KS4 cohort defined as High Attainers based on their Prior Attainment at KS2
Scho
ol K
S4 A
vera
ge C
appe
d Po
ints
Sco
re
6.2.3 Free School Meal (FSM) Band This section looks at the FSM bands of the secondary schools that high attaining pupils in the maintained mainstream secondary sector attend. Chart 6.3 shows the distribution of high attainers by school FSM band and highlights that schools with fewer than 9% of pupils who are eligible for free school meals account for 45.3% of high attainers in the 2006 Key Stage 4 cohort.

66
Chart 6.3: Distribution of Key Stage 4 High Attainers in 2006 by School FSM band
19.121.7
13.9
11.0
7.6
2.21.0
23.6
0
5
10
15
20
25
30
GrammarSchools
5% or less 5+ to 9% 9+ to 13% 13+ to 21% 21+ to 35% 35+ to 50% Above 50%
FSM Bands
% o
f Hig
h A
ttain
ers
6.3 Free School Meal (FSM) Eligibility of High Attainers by School
Type This section looks at the interaction between the average level of deprivation in a school, proxied by the free school meals (FSM) eligibility rate, and the proportion of the Key Stage 4 cohort who were classified as high attainers at Key Stage 2. 6.3.1 Rate of High Attainers amongst Pupils Eligible for FSM and
Composition of FSM High Attainers by School Type Table 6.3 shows the overall FSM rate and the FSM rate for pupils classified as high attainers by different school types. This highlights that FSM rate is lower for high attainers than for the rest of the cohort for all types of schools. This is as expected since high attainers are less likely to have come from deprived backgrounds. At a national level only 3.9 percent of high attainers are classified as eligible for free school meals, compared with 12.4 percent of all pupils. In Academies, 33.8% of all pupils are eligible for free school meals and 15.7% of high attainers in Academies are eligible for free school meals. The table also shows that Academies have the highest FSM rate amongst high attainers of all school types. The proportion of high attainers joining community schools that are eligible for Free School Meals is 4.4%, compared with 13.8% of the whole cohort joining Community Schools.

67
The columns which present composition statistics show that the composition of high attainers eligible for FSM is not proportionate to the composition of pupils who are eligible for FSM. Community Schools account for 71.3% of the intake of all FSM pupils but only 59.2% of high attaining FSM pupils. In Voluntary Aided and Foundation schools the proportion of high attainers that are eligible for FSM is greater than the proportion of all pupils who are eligible for FSM. Referring back to table 6.2, it appears that schools with a higher proportion of high attaining FSM pupils than expected are schools which have higher CVA scores. Grammar schools account for almost 20% of all high attainers (table 6.1) but when only high attainers who are also eligible for FSM are considered, this reduces to 7.7%. Therefore, fewer high attaining, deprived pupils attend Grammar schools than would be expected. Further analysis of disadvantage for high attaining pupils can be found in a recent study by Centre for Markets and Public Organisation (CMPO): ‘The Result of 11 Plus Selection: An Investigation into Opportunities and Outcomes for Pupils in selective LEAs’ (Atkinson et al, 2006). Table 6.3: FSM Rates by School Type (2006) and Composition of High
Attainers Eligible for FSM by School Type (2006)
Percentage FSM Rate
Percentage FSM rate
(high attainers)
Composition of pupils eligible for
FSM
Composition of high
attainers eligible for
FSM School Type
Academy 33.8 15.7 1.5 1.6City Technology College 11.8 7.9 0.3 1.2
Community School 13.8 4.4 71.3 59.2Foundation School 8.3 2.4 11.7 14.3
Voluntary Aided School 11.5 4.4 13.3 21.8Voluntary Controlled
School 6.5 1.6 1.8 2.0 Grammar/Not Grammar
Not Grammar 12.8 4.4 99.4 92.3Grammar 2.1 1.6 0.6 7.7
All Maintained Mainstream Schools 12.4 3.9 100.0 100.0

68
6.3.2 Interaction between High Attaining Status and Pupils Eligible for Free School Meals for Individual Schools
Chart 6.4 shows the relationship between FSM eligibility rate and intake of high attainers for each school. For schools with an intake of less than 10% high attainers, the FSM eligibility rates are spread across the entire range from 0% to above 50% FSM. As intakes of high attainers increase, in particular to above 20%, school FSM rates drop dramatically with the majority of schools with over 20% classified as high attainers having fewer than 10% of their pupils eligible for free school meals. Chart 6.4: Percentage of High Attainers and Percentage eligible for
Free School Meals in all Secondary Schools (2006)
0
10
20
30
40
50
60
70
80
90
0 10 20 30 40 50 60 70 80 90 100
Percentage of KS4 cohort defined as High Attainers based on their Prior Attainment at KS2
Perc
enta
ge E
ligib
le fo
r Fre
e Sc
hool
Mea
ls(W
hole
Sch
ool)
Note: There is one outlier on the chart which is known to be a school with a very high average level of prior attainment for its FSM rate. For further discussion on the influence of deprivation at pupil, school and local level on the probability of achievement into the high attaining group, see section 2.4. 6.4 Pupils in the in the Independent Sector The coverage in this section is expanded to include analysis of maintained mainstream schools and independent schools. Once again the definition of high attainment that is used is the top 10% of pupils nationally at Key Stage 2 who are in the Key Stage 4 2006 cohort.

69
Using this definition, part “A” of Table 6.4 identifies 5,011 high attaining pupils and 15,442 other pupils who took their Key Stage 2 exams in the independent sector. In the maintained mainstream sector, of those who took Key Stage 2 exams, 59,830 were high attaining pupils and 506,313 were not classified as high attainers32. Part “B” of Table 6.4 shows that 92.8% of maintained mainstream high attainers remained in the same sector for their secondary education whilst 7.2% transferred to an independent school. Comparing these pupils to all other pupils who took their Key Stage 2 tests in maintained mainstream schools, 98.1% stayed in this sector whilst only 1.9% moved to independent schools. Just over 78% of high attainers in independent schools remained in this sector for their secondary education, whilst 22% moved to the maintained mainstream sector. Comparable figures for pupils not classified as high attainers are 75% and 25%. Finally, the table highlights that within the 2006 GCSE cohort, just 5.1% of all pupils were in the independent sector for their Key Stage 4 exams, less than half the proportion of all high attainers who took their Key Stage 4 exams in independent schools (12.7% of all high attainers) Table 6.4: Composition of High Attaining Pupils and All Other Pupils in Maintained Mainstream Schools and Independent Schools (2006)
PART A High Attaining Pupils who took Key Stage 2 tests in:-
All other Pupils who took Key Stage 2 tests in:-
Key Stage 4 exams taken in:-
Mai
ntai
ned
Mai
nstre
am
Sch
ools
Inde
pend
ent
Sch
ools
Tota
l
Mai
ntai
ned
Mai
nstre
am
Sch
ools
Inde
pend
ent
Sch
ools
Tota
l
Total Number of Pupils with Key Stage 2 Results
Maintained Mainstream Schools
55,529 1,098 56,627 496,675 3,833 500,508 558,486
Independent Schools 4,301 3,913 8,214 9,638 11,609 21,247 29,738
Total 59,830 5,011 64,841 506,313 15,442 521,755 588,224
32 This 59,830 total differs slightly from that used in earlier parts of this chapter because it refers to all maintained mainstream pupils with Key Stage 2 results, not just those that were part of the 2006 Key Stage 4 maintained mainstream cohort.
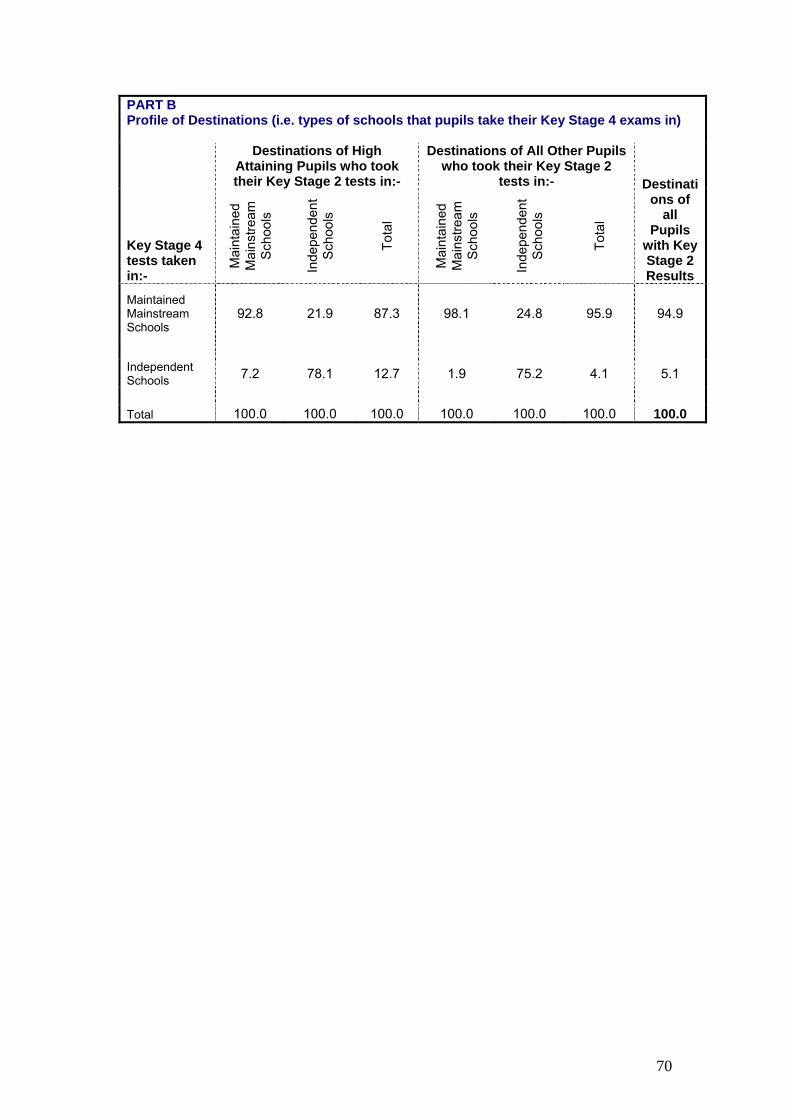
70
PART B Profile of Destinations (i.e. types of schools that pupils take their Key Stage 4 exams in)
Destinations of High
Attaining Pupils who took their Key Stage 2 tests in:-
Destinations of All Other Pupils who took their Key Stage 2
tests in:-
Key Stage 4 tests taken in:-
Mai
ntai
ned
Mai
nstre
am
Sch
ools
Inde
pend
ent
Sch
ools
Tota
l
Mai
ntai
ned
Mai
nstre
am
Sch
ools
Inde
pend
ent
Sch
ools
Tota
l
Destinations of
all Pupils
with Key Stage 2 Results
Maintained Mainstream Schools
92.8 21.9 87.3 98.1 24.8 95.9 94.9
Independent Schools 7.2 78.1 12.7 1.9 75.2 4.1 5.1
Total 100.0 100.0 100.0 100.0 100.0 100.0 100.0

71
7. Which Pupils and Schools Tend to Take Higher Tier Papers?
____________________________________________________________________ Summary
• The majority of the 18.6% of pupils with marks of 32-36 in Key Stage 2 mathematics enter the highest tier in mathematics (tier 6-8) at Key Stage 3
• Fewer FSM pupils with the same high attainment at Key Stage 2 as non-FSM pupils take the highest tier paper. The largest difference in percentage is 17.5% for a prior attainment score of 33
• Fewer girls than boys with a point score of 35 or 36 in mathematics at Key Stage 2 take the highest tier paper
• For prior attainment scores in Key Stage mathematics above 31 it becomes more likely than not that a pupil will be entered for the 6-8 tier
• When entered into a logistic regression model with prior attainment, pupils who were EAL, pupils from most ethnic backgrounds other than White British and girls had high odds of being entered for the 6-8 tier.
• Conversely, when prior attainment was not included in a logistic model, girls, EAL pupils, other Black pupils, Black Caribbean and Summer-born pupils were now less likely to be entered for the 6-8 tier. Chinese, Indian and Mixed White and Asian pupils had even higher odds and pupils with SEN and from deprived backgrounds were even less likely to be entered.
• Roughly 18% of pupils were entered for the 6-8 tier; 43% of the pupils sitting this paper achieved the top level.
• High Attainers in Academies (schools with above average FSM eligibility rates) have relatively high entry rates to the highest tier Key Stage 3 mathematics paper, bucking the trend for high FSM schools.
_____________________________________________________________________ This chapter draws together analysis on the tiers of Key Stage 3 mathematics paper among pupils with different Key Stage 2 attainment. The National Assessment Agency (NAA) produce four Key Stage 3 mathematics papers, which target pupils at levels 3-5, 4-6, 5-7 and 6-8 and where, for example, the level of difficulty of questions on the 6-8 paper for a level 6 must be equivalent to the level of difficulty for a level 6 on the 4-6 paper33. This chapter only focuses on Key Stage 3 mathematics papers since there is currently no choice of subject level tiered papers at Key Stage 2, nor for English at Key Stage 3.
33 Further explanation on tiers of paper can be found on the Qualifications and Curriculum, Authority (QCA) website: http://www.qca.org.uk/

72
7.1 Tier of Key Stage 3 Mathematics Paper Taken in 2006 by Key Stage 2 Attainment in 2003
The percentage of pupils entered for each of the Key Stage 3 mathematics tiers was gathered for every Key Stage 2 mathematics mark, where marks were rounded to the nearest whole point score. The results for all pupils are displayed as stacked bars in chart 7.1. Chart 7.1: Key Stage 3 Mathematics Paper Tier Entered in 2006 by Key
Stage 2 Mark
0
10
20
30
40
50
60
70
80
90
100
15 17 18 19 20 21 22 23 24 25 26 27 28 29 30 31 32 33 34 35 36
KS2 Maths Finely-Graded Point Score (nearest whole number)
%
Tier 3-5 Tier 4-6 Tier 5-7 Tier 6-8 The chart shows what we may generally expect: the lowest performers at Key Stage 2 being entered for the lowest mathematics tiers at Key Stage 3 and the highest attainers being entered for the highest tiers. Pupils featuring in the middle part of the Key Stage 2 point score range are generally entered for the 4-6 or 5-7 tier, dependant on their actual Key Stage 2 score. The majority of the 18.6% of pupils with marks of 32-36 at Key Stage 2 enter the highest tier at Key Stage 3 and merely 5-10% of pupils with a Key Stage 2 point score of 35 or 36 enter the 5-7 tier. 7.2 Tier of Key Stage 3 Mathematics Paper Taken in 2006 by Prior
Attainment and Pupil Characteristics The percentage of pupils entered for the Key Stage 3 mathematics tiers was broken down to produce analyses for non-FSM and FSM pupils. Chart 7.2 reveals the results for these two sets of pupils.

73
Chart 7.2: FSM & Non-FSM Pupils: Key Stage 3 Mathematics Paper Tier Entered in 2006 by Key Stage 2 Mark
0
10
20
30
40
50
60
70
80
90
100
15 17 18 19 20 21 22 23 24 25 26 27 28 29 30 31 32 33 34 35 36
KS2 Mathematics Finely-Graded Point Score (nearest whole number)
%
FSM Pupils: Tier 3-5 FSM Pupils: Tier 4-6 FSM Pupils: Tier 5-7 FSM Pupils: Tier 6-8Non-FSM Pupils: Tier 3-5 Non-FSM Pupils: Tier 4-6 Non-FSM Pupils: Tier 5-7 Non-FSM Pupils: Tier 6-8
Fewer FSM pupils with the same high attainment at Key Stage 2 as non-FSM pupils take the highest tier paper. Although the focus in this chapter is high attaining pupils, it is evident that FSM pupils are less likely to be entered for a higher tier paper than non-FSM pupils across the whole range of Key Stage 2 marks. Table 7.1 provides the difference between the percentages of non-FSM and FSM pupils taking the highest tier for the higher range of Key Stage 2 marks. Table 7.1: Percentage of Non-FSM and FSM Pupils Taking Each Tier of
Key Stage 3 Mathematics Paper in 2006 for High Prior Attainment
Key Stage 2 Mathematics
Mark
Non-FSM Taking 6-8 Tier (%)
FSM Taking 6-8 Tier (%)
FSM Minus Non-FSM % Difference
32 52.8 38.1 -14.7 33 67.6 50.2 -17.5 34 80.4 65.6 -14.9 35 90.0 77.1 -12.9 36 95.4 84.7 -10.8
The largest difference in the percentage of non-FSM and FSM pupils taking the 6-8 tier is 17.5%: for a prior attainment score of 33. From this prior attainment score, the difference between the percentage of FSM and non-FSM pupils taking the 6-8 tier decreases as Key Stage 2 point score increases, although there is still an 11% gap at the highest Key Stage 2 mark.
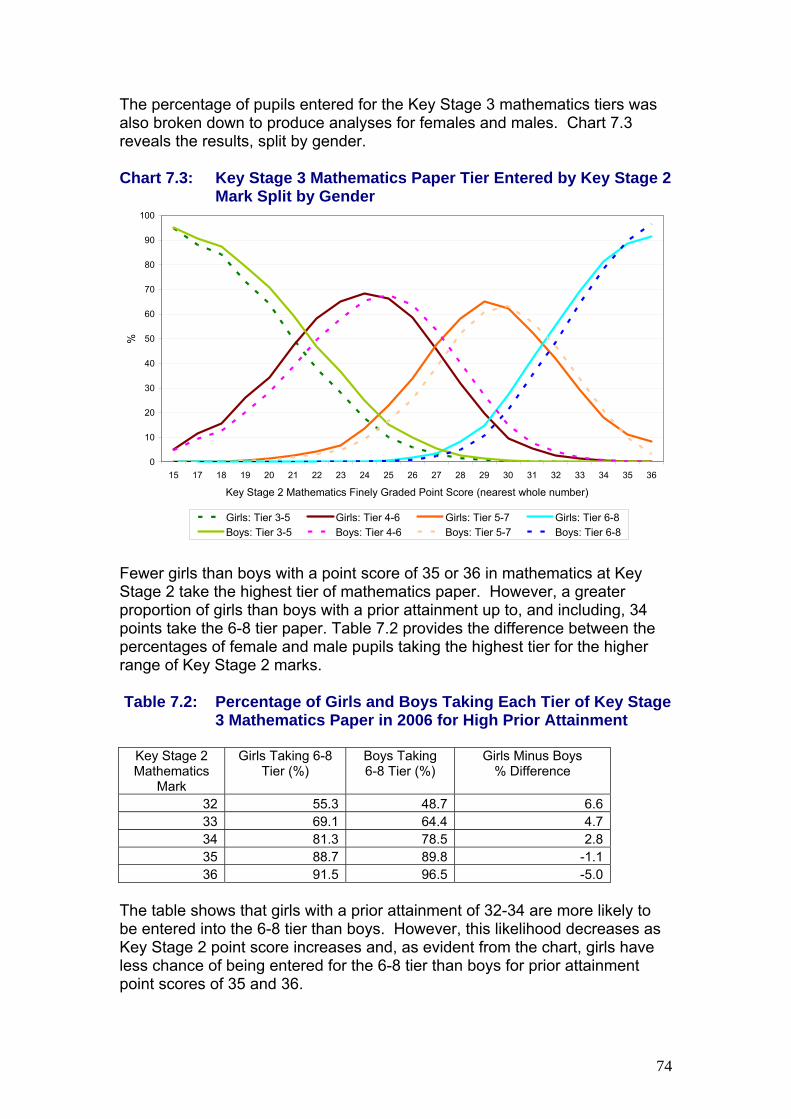
74
The percentage of pupils entered for the Key Stage 3 mathematics tiers was also broken down to produce analyses for females and males. Chart 7.3 reveals the results, split by gender. Chart 7.3: Key Stage 3 Mathematics Paper Tier Entered by Key Stage 2
Mark Split by Gender
0
10
20
30
40
50
60
70
80
90
100
15 17 18 19 20 21 22 23 24 25 26 27 28 29 30 31 32 33 34 35 36
Key Stage 2 Mathematics Finely Graded Point Score (nearest whole number)
%
Girls: Tier 3-5 Girls: Tier 4-6 Girls: Tier 5-7 Girls: Tier 6-8Boys: Tier 3-5 Boys: Tier 4-6 Boys: Tier 5-7 Boys: Tier 6-8
Fewer girls than boys with a point score of 35 or 36 in mathematics at Key Stage 2 take the highest tier of mathematics paper. However, a greater proportion of girls than boys with a prior attainment up to, and including, 34 points take the 6-8 tier paper. Table 7.2 provides the difference between the percentages of female and male pupils taking the highest tier for the higher range of Key Stage 2 marks. Table 7.2: Percentage of Girls and Boys Taking Each Tier of Key Stage
3 Mathematics Paper in 2006 for High Prior Attainment
Key Stage 2 Mathematics
Mark
Girls Taking 6-8 Tier (%)
Boys Taking 6-8 Tier (%)
Girls Minus Boys % Difference
32 55.3 48.7 6.6 33 69.1 64.4 4.7 34 81.3 78.5 2.8 35 88.7 89.8 -1.1 36 91.5 96.5 -5.0
The table shows that girls with a prior attainment of 32-34 are more likely to be entered into the 6-8 tier than boys. However, this likelihood decreases as Key Stage 2 point score increases and, as evident from the chart, girls have less chance of being entered for the 6-8 tier than boys for prior attainment point scores of 35 and 36.
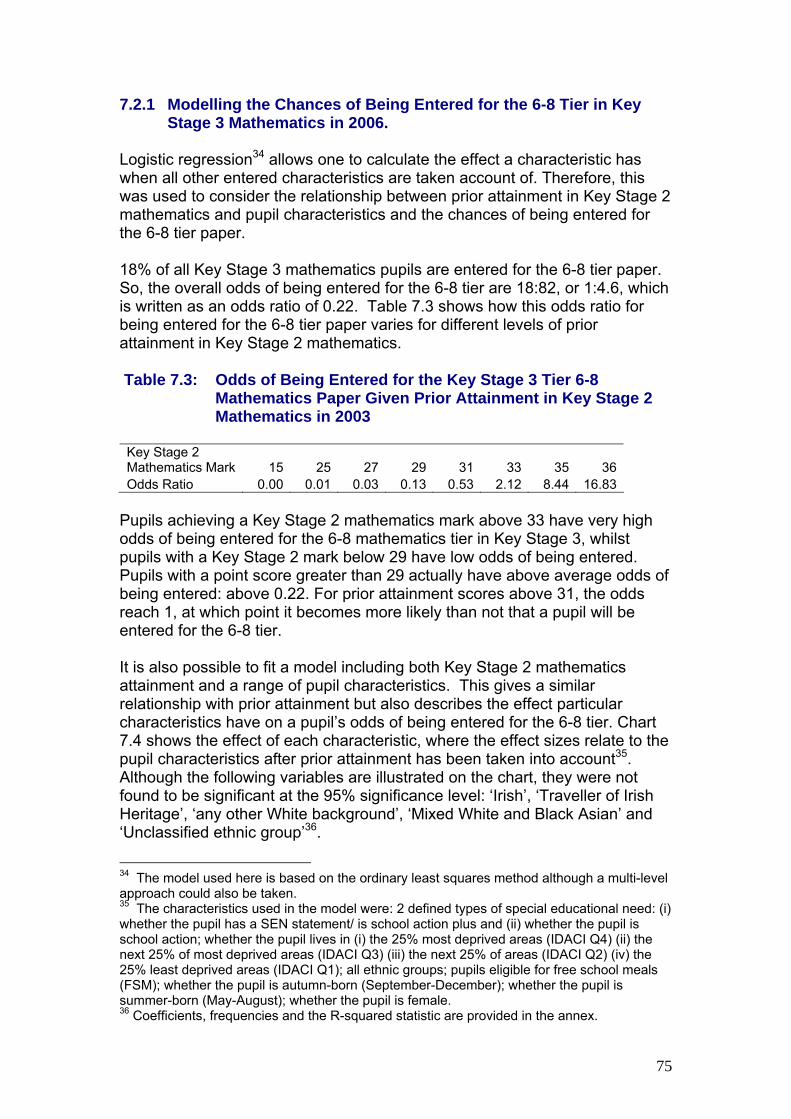
75
7.2.1 Modelling the Chances of Being Entered for the 6-8 Tier in Key Stage 3 Mathematics in 2006.
Logistic regression34 allows one to calculate the effect a characteristic has when all other entered characteristics are taken account of. Therefore, this was used to consider the relationship between prior attainment in Key Stage 2 mathematics and pupil characteristics and the chances of being entered for the 6-8 tier paper. 18% of all Key Stage 3 mathematics pupils are entered for the 6-8 tier paper. So, the overall odds of being entered for the 6-8 tier are 18:82, or 1:4.6, which is written as an odds ratio of 0.22. Table 7.3 shows how this odds ratio for being entered for the 6-8 tier paper varies for different levels of prior attainment in Key Stage 2 mathematics. Table 7.3: Odds of Being Entered for the Key Stage 3 Tier 6-8
Mathematics Paper Given Prior Attainment in Key Stage 2 Mathematics in 2003
Key Stage 2 Mathematics Mark 15 25 27 29 31 33 35 36 Odds Ratio 0.00 0.01 0.03 0.13 0.53 2.12 8.44 16.83
Pupils achieving a Key Stage 2 mathematics mark above 33 have very high odds of being entered for the 6-8 mathematics tier in Key Stage 3, whilst pupils with a Key Stage 2 mark below 29 have low odds of being entered. Pupils with a point score greater than 29 actually have above average odds of being entered: above 0.22. For prior attainment scores above 31, the odds reach 1, at which point it becomes more likely than not that a pupil will be entered for the 6-8 tier. It is also possible to fit a model including both Key Stage 2 mathematics attainment and a range of pupil characteristics. This gives a similar relationship with prior attainment but also describes the effect particular characteristics have on a pupil’s odds of being entered for the 6-8 tier. Chart 7.4 shows the effect of each characteristic, where the effect sizes relate to the pupil characteristics after prior attainment has been taken into account35. Although the following variables are illustrated on the chart, they were not found to be significant at the 95% significance level: ‘Irish’, ‘Traveller of Irish Heritage’, ‘any other White background’, ‘Mixed White and Black Asian’ and ‘Unclassified ethnic group’36.
34 The model used here is based on the ordinary least squares method although a multi-level approach could also be taken. 35 The characteristics used in the model were: 2 defined types of special educational need: (i) whether the pupil has a SEN statement/ is school action plus and (ii) whether the pupil is school action; whether the pupil lives in (i) the 25% most deprived areas (IDACI Q4) (ii) the next 25% of most deprived areas (IDACI Q3) (iii) the next 25% of areas (IDACI Q2) (iv) the 25% least deprived areas (IDACI Q1); all ethnic groups; pupils eligible for free school meals (FSM); whether the pupil is autumn-born (September-December); whether the pupil is summer-born (May-August); whether the pupil is female. 36 Coefficients, frequencies and the R-squared statistic are provided in the annex.

76
Chart 7.4: The Effect of Pupil Characteristics when Prior Attainment is Included on the Odds of Being Entered for the 6-8 Mathematics Tier at Key Stage 3 in 2006
0.00 0.50 1.00 1.50 2.00 2.50 3.00
Gender (Girl)
Summer born
Autumn born
Irish
Traveller of Irish heritage
Gypsy Roma
Other white
White/Black Caribbean
White/Black African
White Asian
Other mixed
Indian
Pakistani
Bangladeshi
Other Asian
Black Carribean
Black African
Other Black
Chinese
Other ethnic group
Unclassified ethnic group
FSM
IDACI Q2
IDACI Q3
IDACI Q4
EAL
School Action
SEN statement/action plus
Effect on odds
More likelyLess likely
Where a characteristic has a factor of more than one, a pupil with this characteristic is more likely to be entered for the 6-8 mathematics tier paper, all other things being equal. For example, Chinese has a factor of 2.64, which means that the odds of being entered for the 6-8 tier are 164% higher for Chinese pupils than for non-Chinese pupils with similar prior attainment and characteristics. Where a characteristic is shown as having a factor of less than one, this characteristic is associated with a pupil being less likely to be entered for the 6-8 tier. For example, pupils who are eligible for FSM have a factor of 0.66, which means that the odds of being entered for the 6-8 tier are 38% lower among FSM pupils than among non-FSM pupils with similar prior attainment and characteristics. However, the absolute odds of any pupil being entered for the 6-8 tier also depends on their prior attainment. For instance, where a pupil has a Key Stage 2 point score of 27, their initial very small odds of being entered for the 6-8 tier are increased if they are EAL, although their overall odds remain low. For a pupil with a combination of characteristics, the individual factors are multiplied together to find the overall effect. For example, the combined effect of being a Chinese girl is to increase the odds by 244%, since 2.64*1.30=3.44, while the combined effect of being a Bangladeshi pupil with a SEN statement is to reduce the odds of being entered for the 6-8 tier by 48%, since 1.19*0.52=0.62.

77
Recent research by Strand (2007) has also considered the odds of entry into higher tier papers, using 2004 data for pupils in the Longitudinal Study of Young People in England and focusing, in particular, on results for different ethnic groups. Chart 7.4 shows that, for the 2006 national data, the odds of being entered for the highest tier in mathematics are higher than White British for all minority ethnic groups except Mixed White/Black Caribbean. However, if the IDACI variable is omitted from the model used here, the odds for the minority ethnic groups are reduced. There are actually significant interactions between IDACI and the ethnic groups, for example Black Caribbean pupils living in deprived areas have a higher odds ratio than Black Caribbean pupils more generally. Furthermore, Strand (2007) finds that when the additional direct pupil/ family measures of deprivation and socio-economic status information available in the LSYPE sample, but not in the National data, are used, the odds ratio for Black Caribbean pupils is reduced37. It is also possible to fit a model with the full range of pupil characteristics but not including prior attainment. This model describes the effect particular characteristics have on a pupil’s odds of being entered for the 6-8 tier when prior attainment is not taken into account. Chart 7.5 shows the effect of each characteristic, where all variables shown on the chart are significant at the 95% significance level.38 Chart 7.5: The Effect of Pupil Characteristics on the Odds of Being
Entered for the 6-8 Mathematics Tier at Key Stage 3 in 2006-
0.00 1.00 2.00 3.00 4.00 5.00 6.00
Gender (Girl)
Summer born
Autumn born
Irish
Traveller of Irish heritage
Gypsy Roma
Other white
White/Black Caribbean
White/Black African
White Asian
Other mixed
Indian
Pakistani
Bangladeshi
Other Asian
Black Carribean
Black African
Other Black
Chinese
Other ethnic group
Unclassified ethnic group
FSM
IDACI Q2
IDACI Q3
IDACI Q4
EAL
School Action
SEN statement/action plus
Effect on odds
More likelyLess likely
37 There is scope for further research on this issue. 38 Coefficients, frequencies and the R-squared statistic are provided in the annex.
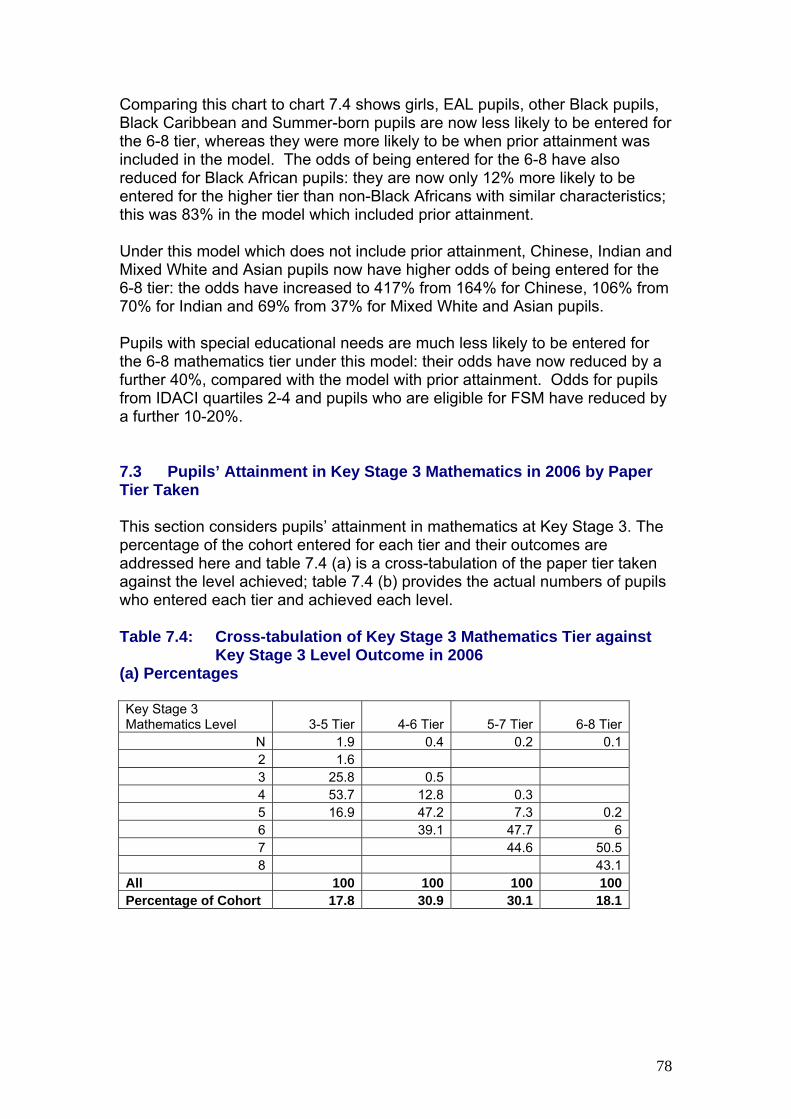
78
Comparing this chart to chart 7.4 shows girls, EAL pupils, other Black pupils, Black Caribbean and Summer-born pupils are now less likely to be entered for the 6-8 tier, whereas they were more likely to be when prior attainment was included in the model. The odds of being entered for the 6-8 have also reduced for Black African pupils: they are now only 12% more likely to be entered for the higher tier than non-Black Africans with similar characteristics; this was 83% in the model which included prior attainment. Under this model which does not include prior attainment, Chinese, Indian and Mixed White and Asian pupils now have higher odds of being entered for the 6-8 tier: the odds have increased to 417% from 164% for Chinese, 106% from 70% for Indian and 69% from 37% for Mixed White and Asian pupils. Pupils with special educational needs are much less likely to be entered for the 6-8 mathematics tier under this model: their odds have now reduced by a further 40%, compared with the model with prior attainment. Odds for pupils from IDACI quartiles 2-4 and pupils who are eligible for FSM have reduced by a further 10-20%. 7.3 Pupils’ Attainment in Key Stage 3 Mathematics in 2006 by Paper Tier Taken This section considers pupils’ attainment in mathematics at Key Stage 3. The percentage of the cohort entered for each tier and their outcomes are addressed here and table 7.4 (a) is a cross-tabulation of the paper tier taken against the level achieved; table 7.4 (b) provides the actual numbers of pupils who entered each tier and achieved each level. Table 7.4: Cross-tabulation of Key Stage 3 Mathematics Tier against
Key Stage 3 Level Outcome in 2006 (a) Percentages Key Stage 3 Mathematics Level 3-5 Tier 4-6 Tier 5-7 Tier 6-8 Tier
N 1.9 0.4 0.2 0.1 2 1.6 3 25.8 0.5 4 53.7 12.8 0.3 5 16.9 47.2 7.3 0.2 6 39.1 47.7 6 7 44.6 50.5 8 43.1
All 100 100 100 100 Percentage of Cohort 17.8 30.9 30.1 18.1

79
(b) Raw Figures Key Stage 3 Mathematics Level 3-5 Tier 4-6 Tier 5-7 Tier 6-8 Tier
N 1,978 656 290 1572 1,738 3 27,590 958 4 57,281 23,687 493 5 18,060 87,233 13,164 2546 72,257 86,137 6,4817 80,425 54,9008 46,858
Total 106,746 184,836 180,524 108,654 Roughly 30% of pupils were entered for tiers 4-6 and 5-7 in Key Stage 3 mathematics and approximately 18% were entered for tiers 3-5 and 6-8. The other 4% of pupils were absent at the time of the test or working below test level. From table 7.4(a) it is evident that of the pupils who take the highest tier, the majority achieve a level 7, at just over 50%. Level 8s are also well-achieved in the 6-8 tier, where 43% of the pupils sitting this paper achieve the top level. Only 6% are awarded a level 6, which is the lowest level that is tested in the 6-8 tier paper. For those sitting the 5-7 tier, the majority of pupils achieve a level 6, at 48%. However, 45% of pupils also achieve the top level on this paper and, therefore, merely 7% are awarded the lowest level measured. Similarly for those sitting tiers 3-5 and 4-6, the majority of pupils achieve the level in the middle of the range of levels tested. However, for the lowest tier, we see a greater percentage of pupils obtaining the lowest level tested than the highest level tested: 26% of pupils are awarded a level 3 compared with 17% who gain a level 5. The majority of pupils achieve the level in the middle of the range of levels tested in the tiered paper they are entered for. However, 39% of those entered for the 4-6 tier and 45% of those entered for the 5-7 tier achieved the highest level; the question of how many of these pupils could potentially have achieved a higher level on the next tier of paper remains unanswered. Of the pupils who sat the 3-5, 4-6, 5-7 and 6-8 tiers merely 1.6%, 0.5%, 0.3% and 0.2%, respectively, were awarded a level below the level of the test paper. Table 7.4 (b) shows that 60% of the level 7s come from taking the 5-7 tier and 40% are achieved in the 6-8 tier. For the level 6s, 52% are achieved in the 5-7 tier, 44% in the 4-6 tier and 4% in the 6-8 tier.

80
25.1
29.5
32.1
30.030.8
34.9
30.1
14.315.6
22.2
27.1
22.521.0
18.1
0
5
10
15
20
25
30
35
40
Academy Community School Voluntary AidedSchool
Voluntary ControlledSchool
Foundation School City TechnologyCollege
All MaintainedMainstream Schools
Type of School
% o
f Pup
ils
Tier 5-7 Tier 6-8
7.4 School Characteristics of High Attaining Pupils at Key Stage 2 by High Tiered Key Stage 3 Mathematics Papers
This section looks at the relationship between school type and entry rates of high attaining pupils into the two highest tiers of mathematics paper at Key Stage 3. Chart 7.6 is based on all pupils rather than just high attainers and shows that the rate at which pupils are entered for the highest tiers of mathematics papers varies by school type. Academies and Community Schools have lower proportions of pupils taking the top tier papers than the national average. Voluntary Aided and CTCs have higher proportions of pupils taking the 5-7 paper and slightly higher proportions taking the 6-8 paper than the national average, whereas Voluntary Controlled and Foundation schools have similar proportions taking the 5-7 tier paper but higher proportions taking the 6-8 tier paper. Chart 7.6 Rate of Pupils by Type of School and High Tier (5-7 and 6-8)
Mathematics Key Stage 3 Papers in 2006
Chart 7.7 is based on high attainers only and again highlights that the entry rates for the higher tier mathematics papers differ according to the type of school attended. Academies, Voluntary Aided and Voluntary Controlled Schools all have lower proportions of high attaining pupils taking the 5-7 tier and higher proportions of pupils taking the 6-8 tier, compared with the national averages for high attainers. Community schools and CTCs have the opposite relationship: they have a higher proportion of pupils taking the 5-7 tier and a lower proportion taking the 6-8 tier.

81
Chart 7.7 Rate of High Attaining Pupils by Type of School and High Tier (5-7 and 6-8) Mathematics Key Stage 3 Papers in 2006
16.5
22.017.8
10.7
18.6
36.1
20.0
81.6
76.0
80.7
87.9
79.7
61.1
78.2
0
10
20
30
40
50
60
70
80
90
100
Academy Community School Voluntary AidedSchool
Voluntary ControlledSchool
Foundation School City TechnologyCollege
All MaintainedMainstream Schools
Type of School
% o
f KS2
Hig
h A
ttain
ing
Pupi
ls
Tier 5-7 Tier 6-8 Chart 7.8 shows how schools with different school-FSM rates differ in terms of the proportion of pupils taking tiers 5-7 and 6-8 when compared with the national picture. The chart shows that schools with less than 9% of pupils eligible for FSM, including Grammar schools, enter a higher proportion of high attaining pupils for the 6-8 tier mathematics Key Stage 3 paper and a smaller proportion for the 5-7 tier than seen nationally. Looking at Charts 7.7 and 7.8 together, it is interesting to note that high attainers in Academies (schools with above average FSM eligibility rates) have high entry rates for the highest tier paper, therefore, bucking the trend for high FSM schools. Chart 7.9 Rate of High Attaining Pupils by Free School Meal Band and
High Tiered (5-7 and 6-8) Mathematics Key Stage 3 Papers
12.715.4
18.2
23.227.4
31.5 32.036.5
20.0
86.783.1
80.5
74.870.4
64.8 63.0
57.9
78.2
0
10
20
30
40
50
60
70
80
90
100
GrammarSchools
5% or LessFSM
5+ to 9% 9+ to 13% 13+ to 21% 21+ to 35% 35+ to 50% Above 50% All MaintainedMainstream
SchoolsSchool FSM Band
% o
f KS2
Hig
h A
ttain
ing
Pupi
ls
Tier 5-7 Tier 6-8
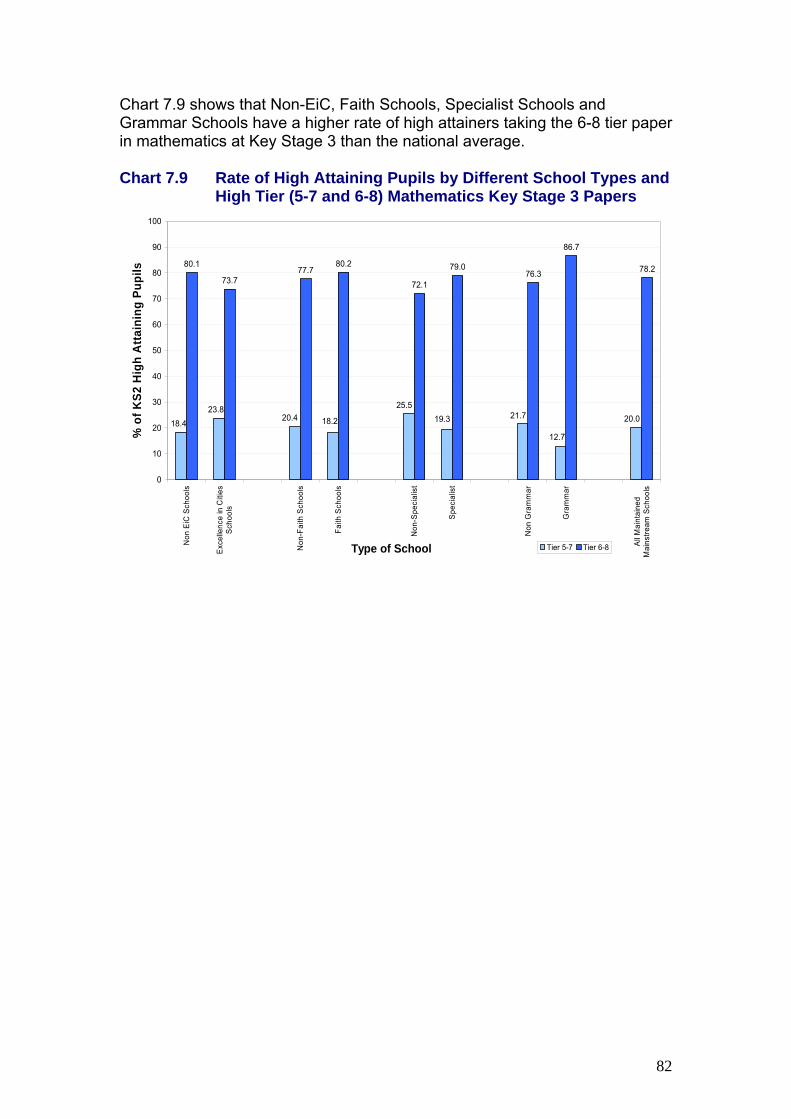
82
Chart 7.9 shows that Non-EiC, Faith Schools, Specialist Schools and Grammar Schools have a higher rate of high attainers taking the 6-8 tier paper in mathematics at Key Stage 3 than the national average. Chart 7.9 Rate of High Attaining Pupils by Different School Types and
High Tier (5-7 and 6-8) Mathematics Key Stage 3 Papers
80.1
73.777.7
80.2
72.1
79.076.3
86.7
78.2
20.0
12.7
21.719.325.5
18.220.418.4
23.8
0
10
20
30
40
50
60
70
80
90
100
Non
EiC
Sch
ools
Exce
llenc
e in
Citi
esSc
hool
s
Non
-Fai
th S
choo
ls
Faith
Sch
ools
Non
-Spe
cial
ist
Spec
ialis
t
Non
Gra
mm
ar
Gra
mm
ar
All M
aint
aine
dM
ains
tream
Sch
ools
Type of School
% o
f KS2
Hig
h A
ttain
ing
Pupi
ls
Tier 5-7 Tier 6-8

83
8. What are the Characteristics of Early Takers and AS Level Entrants in Key Stage 4?
____________________________________________________________________ Summary
• Early takers in Key Stage 4 perform considerably better than the rest of the cohort in terms of point score and threshold indicators. These pupils are also characterised by high prior attainment.
• High attainers at Key Stage 3 who take specific subjects early in Key Stage 4 generally do not perform better than high attainers who take the subject at the end of the Key Stage. Mathematics and Statistics are the two subjects most commonly taken early.
• Pupils who take the AS qualification in Key Stage 4 perform considerably better than the rest of the cohort in terms of point score and threshold indicators. These pupils are also characterised by high prior attainment
• Modern foreign languages other than French, Spanish and German are the subjects most commonly taken as AS levels in Key Stage 4.
_______________________________________________________________ The following chapter will consider which factors, if any, influence pupils to complete Key Stage 4 early or take an AS level qualification in Key Stage 4. 8.1 Definition of Early Takers and Coverage Early takers are defined as pupils aged younger than 15 on 31 August 2005 who reached the end of Key Stage 4 in 2006. As with the rest of this publication, only pupils in maintained mainstream schools in England are considered. Early takers account for a very small proportion of all pupils at the end of Key Stage 4: 588 pupils, or 0.1% of the cohort. These pupils, however, take significantly more GCSEs than other pupils, and achieve significantly better results, as Table 8.1 shows. Table 8.1: Comparison of Early Takers With Other Pupils
Early takers
All other pupils
Mean number of full GCSE entries 8.7 7.5 Mean capped point score 354.9 293.9 Percentage achieving Level 2 81.5% 57.9% Percentage achieving Level 2 including English and maths 76.2% 44.5%
Girls are also significantly overrepresented in this group: 53.7% of early takers are female, compared with 49.4% of all other pupils.

84
47.3% of early takers are in the high attaining group at Key Stage 3, i.e. the top 10% by English and mathematics attainment. However, this performance is not maintained: only 36.7% of early takers remain in the top 10% by attainment at the end of Key Stage 4. This drop-out rate (22%) still compares favourably, however, with the whole cohort, for whom the drop-out rate is 34%, suggesting that completing Key Stage 4 early is not having a negative effect on these pupils’ levels of attainment. 8.2 Schools Attended by Early Takers The majority of early takers in this study attend non-selective schools (79.4%), but this is a significantly smaller proportion than the rest of the cohort, 96.2% of whom attend non-selective schools. Early takers are not clustered in a small number of schools, suggesting that it is the characteristics of the pupils rather than the schools that determine whether they complete Key Stage 4 early. 414 schools (13.3% of all maintained mainstream secondary schools) have at least one early taker, with a mean of 1.4 early takers in these schools. The maximum number in any school is 6, with the exception of one school with 45 early takers. 8.3 Characteristics of Early Takers Prior attainment is expected to be a significant predictor of whether a pupil is an early taker. A logistic regression model, incorporating prior attainment at Key Stage 2 and three other characteristics derived from the pupil-level Annual Schools’ Census (binary indicators for gender, FSM, English first language, and White British ethnicity39) shows that prior attainment is indeed the most significant predictor. First language and gender are excluded as non-significant when the model is reduced using a significance algorithm40. The odds ratios of the included variables demonstrate that early takers are associated more with non-FSM than with FSM, and more with black and minority ethnic pupils than with White British pupils (see Table 8.2). Only 60% of early takers are White British compared with over 80% of the rest of the cohort.
39 A logistic regression model accounts for the effects of a number of explanatory variables (in this case, gender, FSM, etc.) on one binary outcome variable (in this case, whether the pupil is an early taker). The odds ratios derived from such a model give an indication of how much effect each explanatory variable has on the odds of being an early taker. The model above is fairly minimal in comparison to the number of potential effects: larger and more comprehensive logistic regression models have been carried out elsewhere in the bulletin. 40 A model for all main effects (Key Stage 2 point score, gender, White British, FSM and English as a first language) was reduced using the likelihood-ratio test for nested OLS models.

85
Table 8.2: Odds Ratios Associated with Early Taker Predictors
Odds ratio
Significance if removed (L.R. test)
Key Stage 2 average point score 1.34 <0.005 White British 0.57 <0.005 FSM 0.54 0.02 Gender (female) 1.23 0.08 English first language 0.89 0.62
8.4 Early Takers in Specific Subjects More common than pupils completing the entire Key Stage early is the practice of entering pupils in one or more subjects in the year prior to completing the Key Stage. Table 8.3 shows the prevalence of subjects taken early in this fashion. (This table is restricted to subjects with more than 100 pupils taking the examination early).The subjects most often taken early are Mathematics, Statistics, French, English and other modern foreign languages. Table 8.3 shows that Mathematics and Statistics have high proportions of high attainers within these early entrant groups, whereas English only has 10% (i.e. the expected proportion). The last two columns show that, in general, high attainers at Key Stage 3 who take the subject early do not outperform high attainers who wait until the end of Key Stage 4. For Music, French and German (amongst others), however, the opposite is true. 8.5 AS Entrants in Key Stage 4 and Comparison With Other Pupils AS level qualifications contribute towards schools’ threshold percentages at Key Stage 4, counting as twice the size of a full GCSE. The following will consider whether the pattern of these qualifications is determined more by (a) the types of pupils or (b) the types of school.41 As with early takers, there are significant differences between these pupils and the rest of the cohort in terms of attainment. Table 8.4 shows that it is not the case that these pupils take AS levels at the expense of GCSEs; they take on average 1.6 more GCSEs than the rest of the cohort.
41 The above analysis considers only AS qualifications that have been "cashed in"; modules sat by pupils en route to the A2 qualification and not "cashed in" as an AS have not been included. For more information on this process, see http://www.qca.org.uk/7184_7237.html.

86
Table 8.3: Subjects Taken Early at Key Stage 4
Subject
Number of pupils
taking GCSE early
Number of high
attainers at Key
Stage 3 taking subject
early
Proportion of entrants who were Key Stage
3 high attainers
Average points
attained by
entrants who were Key Stage
3 high attainers1
Average points
attained by all Key
Stage 3 high
attainers Science (other) 398 124 31% 45.6 48.3 Music 1567 483 31% 52.2 50.3 Psychology 217 56 26% 47.0 47.4 Statistics 19631 4850 25% 49.2 49.8 Latin 1016 240 24% 47.0 49.6 German 3029 633 21% 50.6 49.0 Mathematics 19635 3683 19% 51.4 51.8 Italian 439 82 19% 52.1 51.0 French 10819 2011 19% 50.8 49.6 General Studies 389 72 19% 50.3 48.1 Information Technology 2999 549 18% 47.2 49.0 Dance 802 138 17% 47.4 48.1 Classical Civilisation 113 18 16% 44.7 49.2 Design and Technology 3874 573 15% 49.5 49.2 Spanish 2144 314 15% 49.1 49.6 Science: Double Award 1757 237 13% 45.7 51.6 Media/Film/Television 1470 193 13% 48.4 50.5 Religious Studies 6365 828 13% 51.5 51.9 History 1312 167 13% 50.9 51.6 Physical Education 1823 232 13% 48.8 50.5 Chemistry 609 74 12% 48.6 50.9 Office Technology 1808 219 12% 48.2 50.6 Drama 1268 150 12% 49.3 49.6 Biology 911 102 11% 48.8 51.1 Sociology 215 23 11% 48.9 50.9 Geography 1231 130 11% 48.0 52.0 English Literature 5592 572 10% 49.0 50.9 Physics 596 60 10% 49.3 51.0 Greek 142 14 10% 48.6 50.1 Other classical languages 498 49 10% 50.9 44.8 Other MFL 8035 777 10% 51.8 51.7 Art and Design 1859 179 10% 46.7 49.5 English 8495 815 10% 50.0 51.5
1 58 points is equivalent to an A* grade, 52 to a A, 46 to a B, and so on.

87
Table 8.4: Comparison of AS Entrants With Other Pupils
AS
entrants All other pupils
Mean number of full GCSE entries 9.4 7.8 Mean capped point score 402.3 292.6 Percentage achieving Level 2 94.9% 57.5% Percentage achieving Level 2 including English and maths 87.5% 44.0%
In total, 6,850 pupils in 949 schools (30.5% of maintained mainstream schools) took at least one AS qualification in Key Stage 4. The majority (650) of these schools entered 5 or fewer pupils for AS levels, but the range is wide: the maximum is 83 pupils and the mean is 7.2 pupils per school. Chart 8.1: Distribution of Number of AS Entrants in Schools
0
100
200
300
400
500
600
700
1-5
6-10
11-1
5
16-2
0
21-2
5
26-3
0
31-3
5
36-4
0
41-4
5
46-5
0
51-5
5
56-6
0
61-6
5
66-7
0
71-7
5
76-8
0
81-8
5Number of pupils taking at least one AS
Num
ber o
f sch
ools
57.0% of these pupils are female. This compares with 49.3% of the rest of the cohort. 43.1% of AS entrants are in the high attainers group at Key Stage 3, i.e. the top 10% by English and mathematics attainment, and 36.2% are in the high attainers group at both Key Stage 3 and Key Stage 4. This drop-out rate between the Key Stages (16%) is considerably better than for the whole cohort. 8.6 School-level and Pupil-level Predictors of AS Entry The long tail of the distribution in Chart 8.1 suggests that there is some influence of school type on AS entry: a small number of schools are choosing to enter large numbers of pupils.
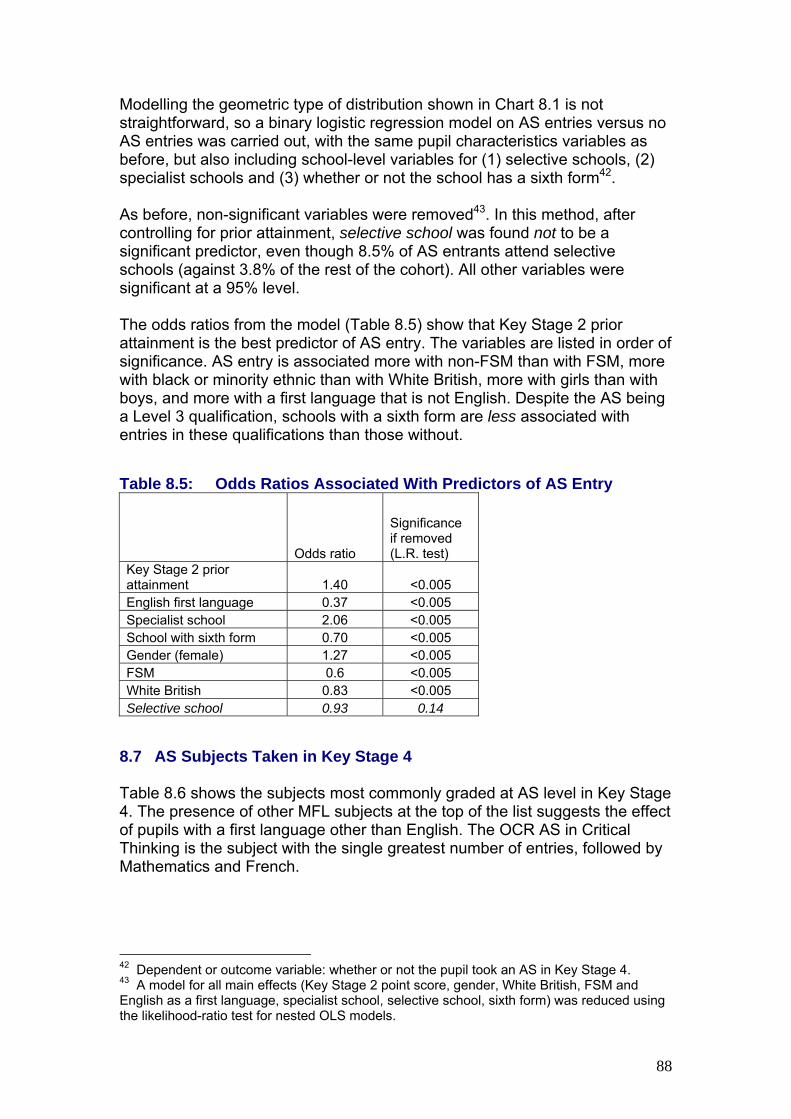
88
Modelling the geometric type of distribution shown in Chart 8.1 is not straightforward, so a binary logistic regression model on AS entries versus no AS entries was carried out, with the same pupil characteristics variables as before, but also including school-level variables for (1) selective schools, (2) specialist schools and (3) whether or not the school has a sixth form42. As before, non-significant variables were removed43. In this method, after controlling for prior attainment, selective school was found not to be a significant predictor, even though 8.5% of AS entrants attend selective schools (against 3.8% of the rest of the cohort). All other variables were significant at a 95% level. The odds ratios from the model (Table 8.5) show that Key Stage 2 prior attainment is the best predictor of AS entry. The variables are listed in order of significance. AS entry is associated more with non-FSM than with FSM, more with black or minority ethnic than with White British, more with girls than with boys, and more with a first language that is not English. Despite the AS being a Level 3 qualification, schools with a sixth form are less associated with entries in these qualifications than those without. Table 8.5: Odds Ratios Associated With Predictors of AS Entry
Odds ratio
Significance if removed (L.R. test)
Key Stage 2 prior attainment 1.40 <0.005 English first language 0.37 <0.005 Specialist school 2.06 <0.005 School with sixth form 0.70 <0.005 Gender (female) 1.27 <0.005 FSM 0.6 <0.005 White British 0.83 <0.005 Selective school 0.93 0.14
8.7 AS Subjects Taken in Key Stage 4 Table 8.6 shows the subjects most commonly graded at AS level in Key Stage 4. The presence of other MFL subjects at the top of the list suggests the effect of pupils with a first language other than English. The OCR AS in Critical Thinking is the subject with the single greatest number of entries, followed by Mathematics and French.
42 Dependent or outcome variable: whether or not the pupil took an AS in Key Stage 4. 43 A model for all main effects (Key Stage 2 point score, gender, White British, FSM and English as a first language, specialist school, selective school, sixth form) was reduced using the likelihood-ratio test for nested OLS models.
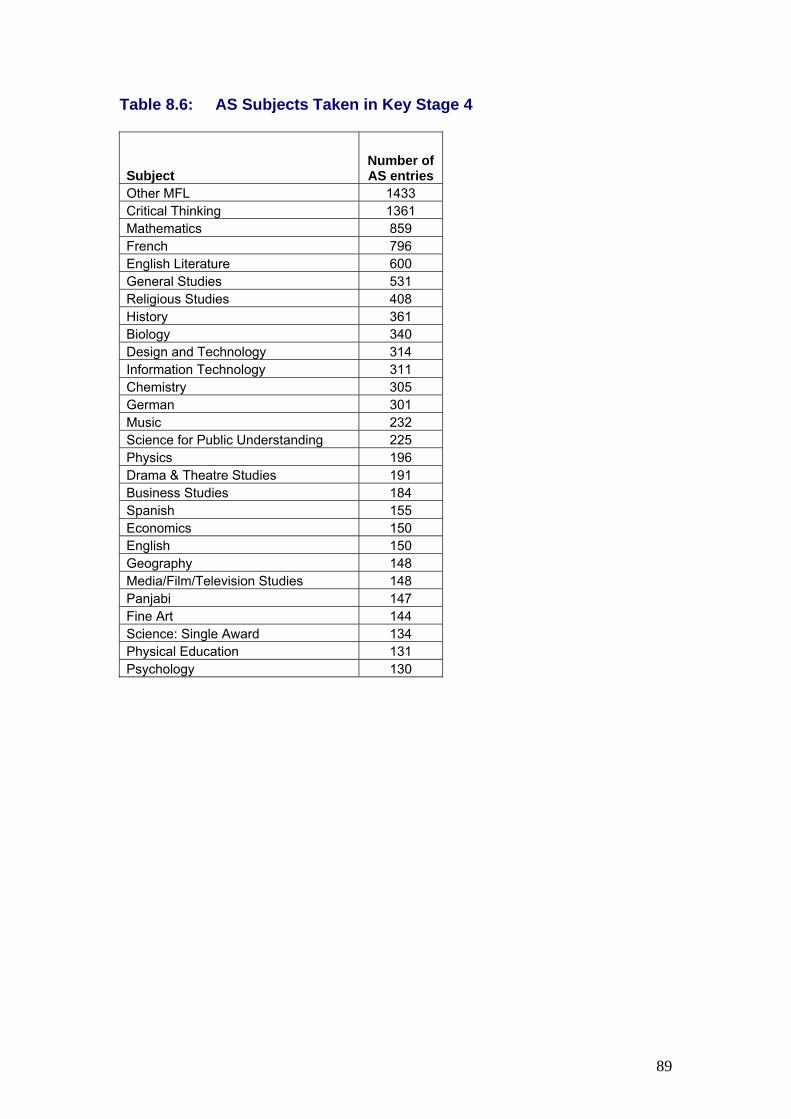
89
Table 8.6: AS Subjects Taken in Key Stage 4
Subject Number of AS entries
Other MFL 1433 Critical Thinking 1361 Mathematics 859 French 796 English Literature 600 General Studies 531 Religious Studies 408 History 361 Biology 340 Design and Technology 314 Information Technology 311 Chemistry 305 German 301 Music 232 Science for Public Understanding 225 Physics 196 Drama & Theatre Studies 191 Business Studies 184 Spanish 155 Economics 150 English 150 Geography 148 Media/Film/Television Studies 148 Panjabi 147 Fine Art 144 Science: Single Award 134 Physical Education 131 Psychology 130

90
9. To What Extent Are High Attaining Pupils Classified As Gifted and Talented?
______________________________________________________________ Summary
• 23,300 pupils were identified by teachers as gifted and talented (G&T) and were in the top 10% of high attaining pupils; a further 40,700 were simply flagged as G&T and 20,300 were only high attainers
• In January 2006, the average percentage of pupils identified as G&T for all schools was 10.5%; the average percentage of pupils identified as G&T for all schools identifying G&T pupils was 13.3%. Relatively fewer pupils were identified in Year 7 (and in Years 11-13).
• Since January 2006, the number of secondary schools identifying G&T pupils has increased 13 percentage points to 91% of schools in January 2007.
• There were regional differences in the percentage of pupils identified as G&T in Year 8: ranging from 10.1% in the East of England to 14.1% in the South-West.
• At school level, the percentage of pupils identified as G&T in Year 8 was higher in specialist schools than non-specialist schools, and higher in both of these than in academies
• Just over half of G&T pupils in Year 8 had 33 Key Stage 2 points; high Key Stage 2 attainment was the single largest predictor of G&T identification
• Using logistic regression to control for the effect of other factors, pupils were much more likely to be identified as G&T if they were not eligible for FSM, low on the IDACI scale, from Bangladeshi, Black Caribbean, any other White, mixed White and Asian or mixed White and Black African backgrounds
______________________________________________________________ In the January 2006 pupil level annual schools census (PLASC), maintained secondary schools44 were required to supply pupil level information45 including identifying which pupils were on their school registers of gifted and talented (G&T) learners. Therefore, listed pupils were recognised as high attainers within their own schools, rather than by comparing them with the national cohort. Each school is actively encouraged to select G&T pupils. However, they are at liberty to define their own selection criteria and elect as many, or few, pupils as they deem appropriate. This chapter initially focuses on the degree of overlap between pupils selected as G&T and pupils who achieve within the national top 10% at the relevant Key Stage. Since it is not necessary that these two populations equate, the chapter then turns to consider pupil and school characteristics and the prior attainment of those pupils flagged as G&T.
44 Maintained secondary schools, city technology colleges and academies 45 Includes pupils with sole and dual main registration
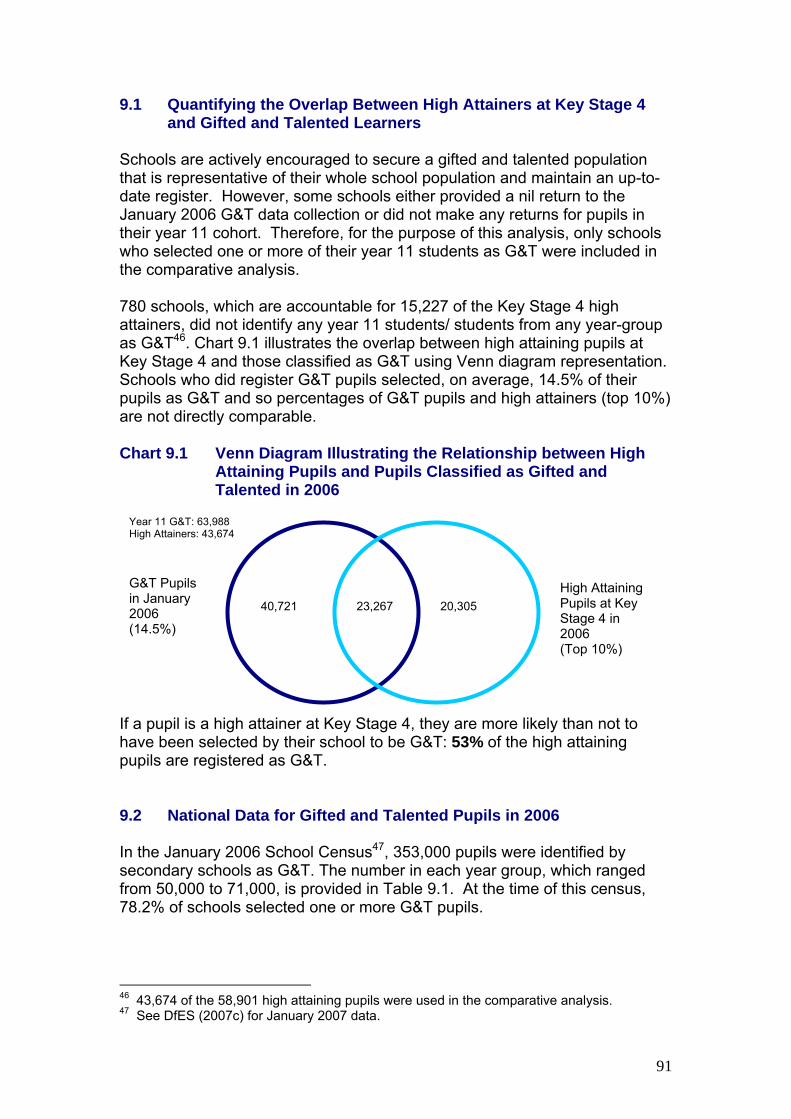
91
9.1 Quantifying the Overlap Between High Attainers at Key Stage 4 and Gifted and Talented Learners
Schools are actively encouraged to secure a gifted and talented population that is representative of their whole school population and maintain an up-to-date register. However, some schools either provided a nil return to the January 2006 G&T data collection or did not make any returns for pupils in their year 11 cohort. Therefore, for the purpose of this analysis, only schools who selected one or more of their year 11 students as G&T were included in the comparative analysis. 780 schools, which are accountable for 15,227 of the Key Stage 4 high attainers, did not identify any year 11 students/ students from any year-group as G&T46. Chart 9.1 illustrates the overlap between high attaining pupils at Key Stage 4 and those classified as G&T using Venn diagram representation. Schools who did register G&T pupils selected, on average, 14.5% of their pupils as G&T and so percentages of G&T pupils and high attainers (top 10%) are not directly comparable. Chart 9.1 Venn Diagram Illustrating the Relationship between High
Attaining Pupils and Pupils Classified as Gifted and Talented in 2006
If a pupil is a high attainer at Key Stage 4, they are more likely than not to have been selected by their school to be G&T: 53% of the high attaining pupils are registered as G&T. 9.2 National Data for Gifted and Talented Pupils in 2006 In the January 2006 School Census47, 353,000 pupils were identified by secondary schools as G&T. The number in each year group, which ranged from 50,000 to 71,000, is provided in Table 9.1. At the time of this census, 78.2% of schools selected one or more G&T pupils.
46 43,674 of the 58,901 high attaining pupils were used in the comparative analysis. 47 See DfES (2007c) for January 2007 data.
40,721
G&T Pupils in January 2006 (14.5%)
20,305 23,267
Year 11 G&T: 63,988 High Attainers: 43,674
High Attaining Pupils at Key Stage 4 in 2006 (Top 10%)
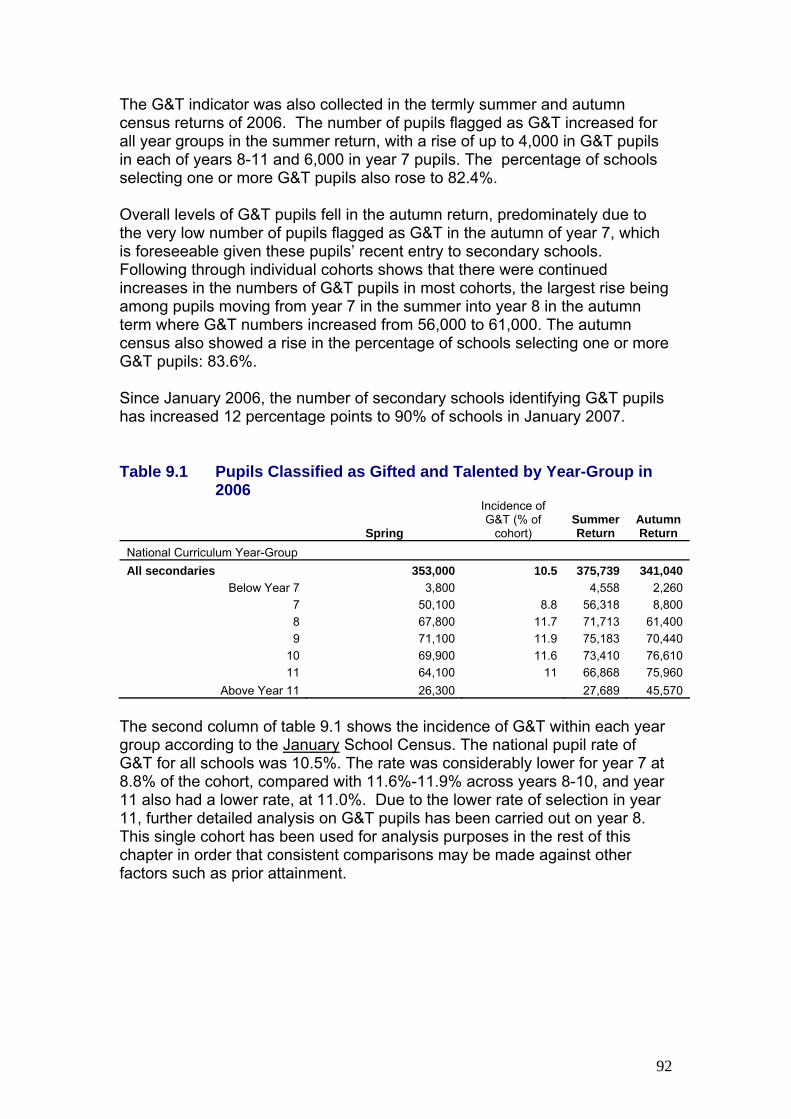
92
The G&T indicator was also collected in the termly summer and autumn census returns of 2006. The number of pupils flagged as G&T increased for all year groups in the summer return, with a rise of up to 4,000 in G&T pupils in each of years 8-11 and 6,000 in year 7 pupils. The percentage of schools selecting one or more G&T pupils also rose to 82.4%. Overall levels of G&T pupils fell in the autumn return, predominately due to the very low number of pupils flagged as G&T in the autumn of year 7, which is foreseeable given these pupils’ recent entry to secondary schools. Following through individual cohorts shows that there were continued increases in the numbers of G&T pupils in most cohorts, the largest rise being among pupils moving from year 7 in the summer into year 8 in the autumn term where G&T numbers increased from 56,000 to 61,000. The autumn census also showed a rise in the percentage of schools selecting one or more G&T pupils: 83.6%. Since January 2006, the number of secondary schools identifying G&T pupils has increased 12 percentage points to 90% of schools in January 2007. Table 9.1 Pupils Classified as Gifted and Talented by Year-Group in
2006
Spring
Incidence of G&T (% of
cohort) Summer Return
Autumn Return
National Curriculum Year-Group All secondaries 353,000 10.5 375,739 341,040
Below Year 7 3,800 4,558 2,260 7 50,100 8.8 56,318 8,800 8 67,800 11.7 71,713 61,400 9 71,100 11.9 75,183 70,440
10 69,900 11.6 73,410 76,610 11 64,100 11 66,868 75,960
Above Year 11 26,300 27,689 45,570 The second column of table 9.1 shows the incidence of G&T within each year group according to the January School Census. The national pupil rate of G&T for all schools was 10.5%. The rate was considerably lower for year 7 at 8.8% of the cohort, compared with 11.6%-11.9% across years 8-10, and year 11 also had a lower rate, at 11.0%. Due to the lower rate of selection in year 11, further detailed analysis on G&T pupils has been carried out on year 8. This single cohort has been used for analysis purposes in the rest of this chapter in order that consistent comparisons may be made against other factors such as prior attainment.

93
9.3 Regional and Local Authority Figures for Gifted and Talented Pupils
9.3.1 Regional Figures The rate of year 8 G&T pupils by region, and the percentage of schools with no G&T pupils, is provided in Table 9.2. Within this table, ‘composition of G&T group’ provides the percentage of G&T pupils in each region out of the total number of G&T pupils so, for example, 5.4% of all G&T pupils were in the North-East region. ‘Incidence of G&T (% of cohort)’ takes into account the size of the region since it compares the number of G&T pupils in a region to the number of non-G&T pupils in that region; in this case the total populations used are the number of pupils in each region so, for example, 11.8% of all pupils in the North-East are classified as G&T. Table 9.2 Pupils Classified as Gifted and Talented by Region in
January 2006
Gifted and Talented Pupils
Composition of G&T group (%)
Incidence of G&T (% of
cohort)
% of schools with no G&T
pupils Year 8 North East 3,574 5.4 11.8 28.4 North West 9,014 13.5 11.0 25.2 Yorkshire and the Humber 6,825 10.2 11.3 20.6 East Midlands 6,647 10.0 13.2 25.8 West Midlands 8,078 12.1 12.7 14.9 East of England 6,413 9.6 10.1 35.8 London 8,787 13.2 12.3 19.9 South East 9,593 14.4 11.0 30.7 South West 7,792 11.7 14.1 19.8
The rate of G&T, as a percentage of the cohort, was greatest in the South West (14%) and East Midlands (13%). The East of England contained the greatest percentage of schools with no G&T pupils: 36%, which corresponded to the lowest rate of G&T of any of the regions, at 10%. 9.3.2 Local Authority Figures Chart 9.2 shows how the incidence of pupils identified as G&T varies by local authority and Table 9.3 reveals the ten local authorities (LAs) with the highest and lowest rates of selected G&T pupils in year 8, according to the January 2006 PLASC48. 48 A full set of rates of G&T pupils by local authority and local authority type is provided in the appendix

94
Chart 9.2 Distribution of % G&T in Year 8 in January 2006 by Local Authority
0
5
10
15
20
25
0 1 2 3 4 5 6 7 8 9 10 11 12 13 14 15 16 17 18 19 20 21 22 23 24 25
% G&T by Local Authority (whole %)
Freq
uenc
y
The modal value of percentage of G&T pupils identified within a LA was 11 and 22 local authorities selected a total of 11%. The range of percentage G&T varied from 5%-25% between local authorities and table 9.3 reveals that the 5% selection rate corresponds to Northumberland and Leeds and the 25% rate to Reading. Table 9.3 The 10 Local Authorities with the Highest and Lowest Rates
of Gifted and Talented Pupils in January 2006
Gifted and Talented Pupils
Incidence of G&T (% of cohort)
Year 8 Reading * 214 24.9 Torbay ** 305 21.5 York 349 20.5 Poole * 281 20.0 Somerset 1,108 20.0 Waltham Forest 493 19.4 Stoke-on-Trent * 482 18.1 North East Lincolnshire 343 17.9 Darlington 208 17.7 Bedfordshire 790 17.4 Windsor and Maidenhead 103 7.0 Tameside 203 6.9 Gateshead 149 6.9 Blackpool 109 6.7 Milton Keynes 165 6.5 Solihull 204 6.5 Knowsley 107 6.5 St. Helens 132 6.2 Leeds 420 5.2 Northumberland 181 4.9
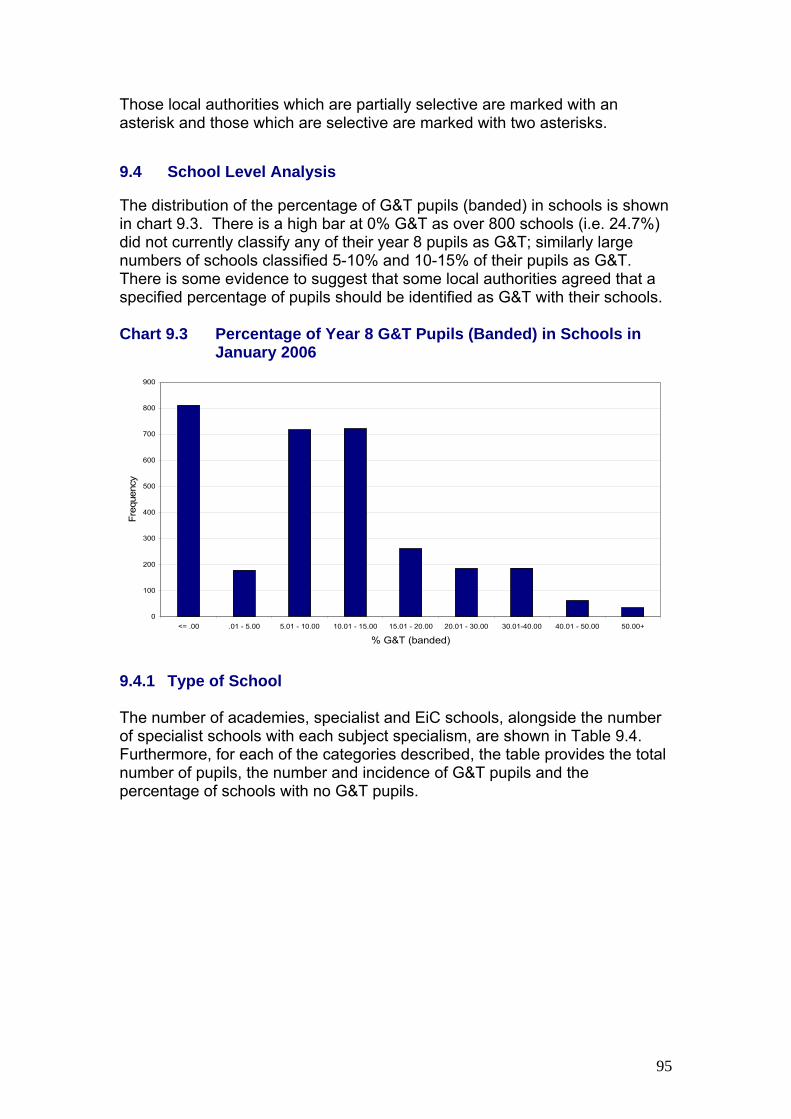
95
Those local authorities which are partially selective are marked with an asterisk and those which are selective are marked with two asterisks. 9.4 School Level Analysis The distribution of the percentage of G&T pupils (banded) in schools is shown in chart 9.3. There is a high bar at 0% G&T as over 800 schools (i.e. 24.7%) did not currently classify any of their year 8 pupils as G&T; similarly large numbers of schools classified 5-10% and 10-15% of their pupils as G&T. There is some evidence to suggest that some local authorities agreed that a specified percentage of pupils should be identified as G&T with their schools. Chart 9.3 Percentage of Year 8 G&T Pupils (Banded) in Schools in
January 2006
0
100
200
300
400
500
600
700
800
900
<= .00 .01 - 5.00 5.01 - 10.00 10.01 - 15.00 15.01 - 20.00 20.01 - 30.00 30.01-40.00 40.01 - 50.00 50.00+
% G&T (banded)
Freq
uenc
y
9.4.1 Type of School The number of academies, specialist and EiC schools, alongside the number of specialist schools with each subject specialism, are shown in Table 9.4. Furthermore, for each of the categories described, the table provides the total number of pupils, the number and incidence of G&T pupils and the percentage of schools with no G&T pupils.

96
Table 9.4 Gifted and Talented Pupils by Type of Secondary School in 2006
Number of schools
Total number of pupils
Number of G&T pupils
Incidence of G&T (% of cohort)
No G&T
Maintained Mainstream, CTCs and Academies 3,289 568,777 66,073 11.6 24.7 Academies 23 3,857 346 9.0 34.8 EiC 1,237 218,439 25,577 11.7 14.9
Non-Specialists 1,046 149,253 16,724 11.2 27.7
Specialists 2,243 419,524 49,349 11.8 23.3 Specialisms Arts 367 71,442 8,630 12.1 22.3
Business and Enterprise 189 33,367 4,201 12.6 20.6
Engineering 39 7,056 807 11.4 20.5 Humanities 57 9,603 1,121 11.7 22.8 Language 204 39,448 4,744 12.0 23.5
Mathematics & Computing 200 36,148 3,990 11.0 24.0
Music 14 2,443 323 13.2 35.7 Science 255 46,408 5,762 12.4 23.5 Sports 314 58,042 6,805 11.7 23.9 Technology 535 103,111 11,374 11.0 23.7 Combined Spec 69 11,506 1,560 13.6
The incidence of G&T pupils in academies was lower than in specialist and EiC schools: 9% compared with 11.8% and 11.7% respectively. However, the information on academies is based on a very small number of schools. The rate of G&T pupils was slightly higher in specialist schools (11.8%) than in non-specialists (11.2%). Within specialist schools, the highest incidence was in combined specialism (13.6%) and music specialism (13.2%) schools. However, the latter percentage is only based on 14 schools. Mathematics & computing and technology specialist schools had the lowest incidence of G&T pupils, at 11.0%. Most specialisms showed similar proportions of schools having no pupils classified as G&T: 20-24%. Schools in Excellence in Cities areas ((EiC), had the highest proportions of schools supplying G&T information, with only 14.9% of these schools having no pupils classified as G&T. This may relate to the fact that G&T policy has been a higher priority in EiC areas. However, the overall incidence of G&T pupils in EiC areas was not noticeably higher than for other schools: 11.7% in EiC compared with 11.6% overall.

97
9.4.2 School FSM-Band The distribution of school G&T rates by school FSM band (including a separate band for grammar schools) is shown in chart 9.4. The mid-figure for each band is approximately 10%, which means that the typical school has identified about 10% of pupils as G&T. Chart 9.4 Percentage of G&T Pupils in 2006 by School FSM Band
0
10
20
30
40
50
60
70
80
90
100
163 484 720 531 562 509 226 94
Grammar <= 5 > 5 & <= 9 > 9 & <= 13 > 13 & <= 21 > 21 & <= 35 > 35 & <= 50 > 50
Secondary School FSM Band and Numbers of Schools
% o
f G &
T in
Sch
ool
For schools in the higher FSM bands, there was a fairly consistent rate of G&T pupils, with many schools clustered around rates of 8-15% and only small numbers of schools having much lower or higher rates.49 This is likely to be an EiC effect since many of the higher-FSM schools are in these areas. EiC areas were originally advised to identify 5-10% of their pupils as G&T and, in many areas, this practice is likely to have persisted. For schools with lower levels of FSM, the pattern of G&T distribution is different: there is a much wider spread of school rates, which is influenced by the large proportions of these schools recording no G&T pupils (25% or more). The most extreme pattern is shown by grammar schools: 36% of grammar schools did not classify any of their pupils as G&T, while 11% classified over half of their pupils as G&T50.
49 Chart 6.2 revealed the percentage of high attainers by school FSM band. Here, greater proportions of high attainers were found in schools with lower numbers of pupils eligible for FSM and grammar schools were shown to account for nearly 20 percent of high attaining pupils. 50 A table of the figures by FSM-band/grammars is provided in the annex.

98
9.4.3 Schools Identifying High Percentages of G&T Pupils To consider the characteristics of schools identifying very high proportions of their Y8 population as G&T, the top 10% of schools (331) were picked out for further analysis. This covers all schools with more than 28.5% of their year 8 pupils classed G&T. This group of “high-G&T” schools were additionally analysed by school FSM-band, region, LA type, school type and local authority. Results for FSM-band and region are provided in tables 9.5 and 9.6 below.51 Table 9.5 Schools with a High Rate of Selection of Gifted and
Talented Pupils by School FSM-band in January 2006
All schools Total High G&T schools
Percent of All High-G&T schools Rate
<=5% 484 59 17.8 12.2 >5 &<=9% 720 70 21.1 9.7 >9 & <=13% 531 50 15.1 9.4 >13 & <=21% 562 48 14.5 8.5 >21 & <=35% 509 34 10.3 6.7 >35 & <=50% 226 17 5.1 7.5 >50% 94 5 1.5 5.3 Grammars 163 48 14.5 29.4 All schools 3289 331 100
Table 9.6 Schools with a High Rate of Selection of Gifted and
Talented Pupils by Region in January 2006
All schools
Total
High G&T schools
Percent of all high-G&T schools
Rate
East of England 391 35 10.6 9.0 East Midlands 287 37 11.2 12.9 London 412 36 10.9 8.7 North East 194 16 4.8 8.2 North West 477 35 10.6 7.3 South East 498 51 15.4 10.2 South West 313 48 14.5 15.3 West Midlands 397 47 14.2 11.8 Yorkshire and the Humber 320 26 7.9 8.1 All schools 3289 331 100
Table 9.5 shows that as the FSM-band of the school increases, the incidence of high-G&T schools generally decreases. 29.4% of grammar schools were in the high-G&T schools group and these accounted for 14.5% of all high-G&T schools.
51 Further results can be found in the annex
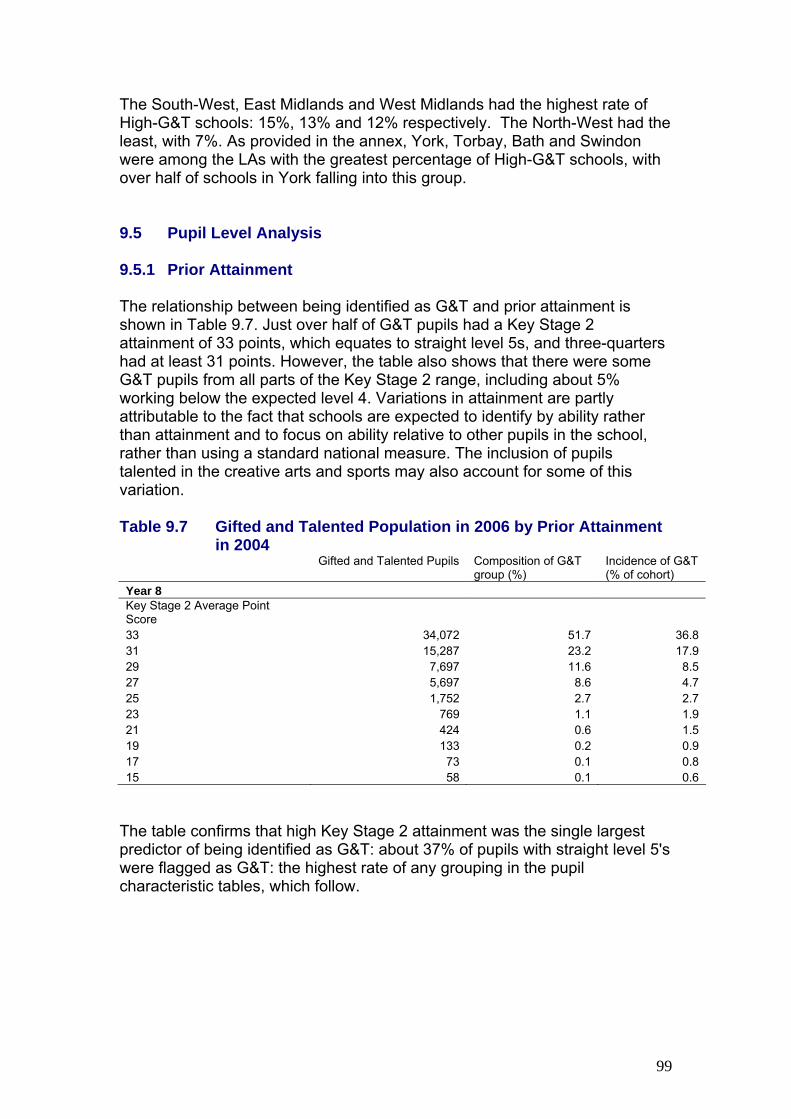
99
The South-West, East Midlands and West Midlands had the highest rate of High-G&T schools: 15%, 13% and 12% respectively. The North-West had the least, with 7%. As provided in the annex, York, Torbay, Bath and Swindon were among the LAs with the greatest percentage of High-G&T schools, with over half of schools in York falling into this group. 9.5 Pupil Level Analysis 9.5.1 Prior Attainment The relationship between being identified as G&T and prior attainment is shown in Table 9.7. Just over half of G&T pupils had a Key Stage 2 attainment of 33 points, which equates to straight level 5s, and three-quarters had at least 31 points. However, the table also shows that there were some G&T pupils from all parts of the Key Stage 2 range, including about 5% working below the expected level 4. Variations in attainment are partly attributable to the fact that schools are expected to identify by ability rather than attainment and to focus on ability relative to other pupils in the school, rather than using a standard national measure. The inclusion of pupils talented in the creative arts and sports may also account for some of this variation. Table 9.7 Gifted and Talented Population in 2006 by Prior Attainment
in 2004 Gifted and Talented Pupils Composition of G&T
group (%) Incidence of G&T (% of cohort)
Year 8 Key Stage 2 Average Point Score 33 34,072 51.7 36.8 31 15,287 23.2 17.9 29 7,697 11.6 8.5 27 5,697 8.6 4.7 25 1,752 2.7 2.7 23 769 1.1 1.9 21 424 0.6 1.5 19 133 0.2 0.9 17 73 0.1 0.8 15 58 0.1 0.6
The table confirms that high Key Stage 2 attainment was the single largest predictor of being identified as G&T: about 37% of pupils with straight level 5's were flagged as G&T: the highest rate of any grouping in the pupil characteristic tables, which follow.

100
9.5.2 Pupil Characteristics School census characteristics of year 8 pupils flagged as G&T are provided in table 9.8. This table shows lower rates of G&T for: boys, pupils eligible for FSM, pupils living in more deprived areas, pupils with SEN, looked-after children and pupils whose first language is other than English. It also shows that summer-born pupils were less likely to be G&T than autumn-born pupils. Table 9.8 Pupil Characteristics of Gifted and Talented Population in
2006 Gifted and
Talented Pupils Composition of G&T group (%)
Incidence of G&T (% of cohort)
Year 8 All Gifted and Talented 66,073 11.1 Gender Boys 30,935 46.8 10.9 Girls 35,138 53.2 12.8 Free School Meals FSM 5,893 8.9 6.8 Non-FSM 60,180 91.1 12.8 Special Educational Needs SEN with a statement 259 0.4 1.9 SEN without a statement-Action Plus 927 1.4 3.0 SEN without a statement-Action 2,537 3.8 3.5 No identified SEN 62,350 94.4 14.1 In Care In care 110 0.2 4.2 Not in care 65,963 99.8 11.9 First Language English 60,775 92.0 12.0 Not known but believed to be English 381 0.6 9.6 Other than English 4,624 7.0 10.5 Not known but believed to be other than English 201 0.3 6.8 Information not obtained 87 0.1 7.4 Month of Birth Autumn 25,293 38.3 12.7 Spring 21,086 31.9 11.7 Summer 19,694 29.8 11.0 Deprivation (IDACI quartiles) Most deprived 12,720 19.1 9.2 Q2 14,861 22.3 10.6 Q3 17,817 26.8 12.7 Least deprived 21,150 31.8 14.9

101
Table 9.9 provides the breakdown by ethnicity. Although it shows that 83% of G&T pupils were White British, it also shows a higher incidence of G&T in Chinese and Mixed White and Asian pupils: 21% and 16%, respectively. The incidence of G&T was low amongst Pakistani pupils (8%) and also under 10% for each of the Black groups. Table 9.9 Gifted and Talented Population by Ethnic Group in 2006 Gifted and Talented
Pupils Composition of G&T group (%)
Incidence of G&T (% of cohort)
Year 8 White White British 54,903 83.1 12.0 Irish 220 0.3 11.7 Traveller Of Irish Heritage 6 0.0 2.6 Gypsy / Roma 21 0.0 4.4 Any Other White Background 1,304 2.0 12.6 Mixed White and Black Caribbean 758 1.1 12.5 White and Black African 199 0.3 13.7 White and Asian 477 0.7 15.9 Any Other Mixed Background 716 1.1 14.1 Asian Indian 1,487 2.3 12.7 Pakistani 1,166 1.8 8.0 Bangladeshi 583 0.9 10.6 Any Other Asian Background 478 0.7 12.2 Black Black Caribbean 764 1.2 9.8 Black African 880 1.3 9.5 Any Other Black Background 223 0.3 9.7 Chinese 365 0.6 21.4 Any Other Ethnic Group 512 0.8 12.1 Information Not Obtained 487 0.7 7.9 Refused 523 0.8 10.2
When the G&T population is broken down by EiC status for each ethnic group, it is evident that there was always a greater rate of G&T pupils in EiC than non-EiC schools for all ethnicities apart from mixed White and Asian. However, Mixed White and Asian is a relatively small group and the rates are high anyway. In non-EiC areas, some ethnic minorities had very low rates: Black Caribbean, Pakistani and any other White background. These findings are displayed in chart 9.5.
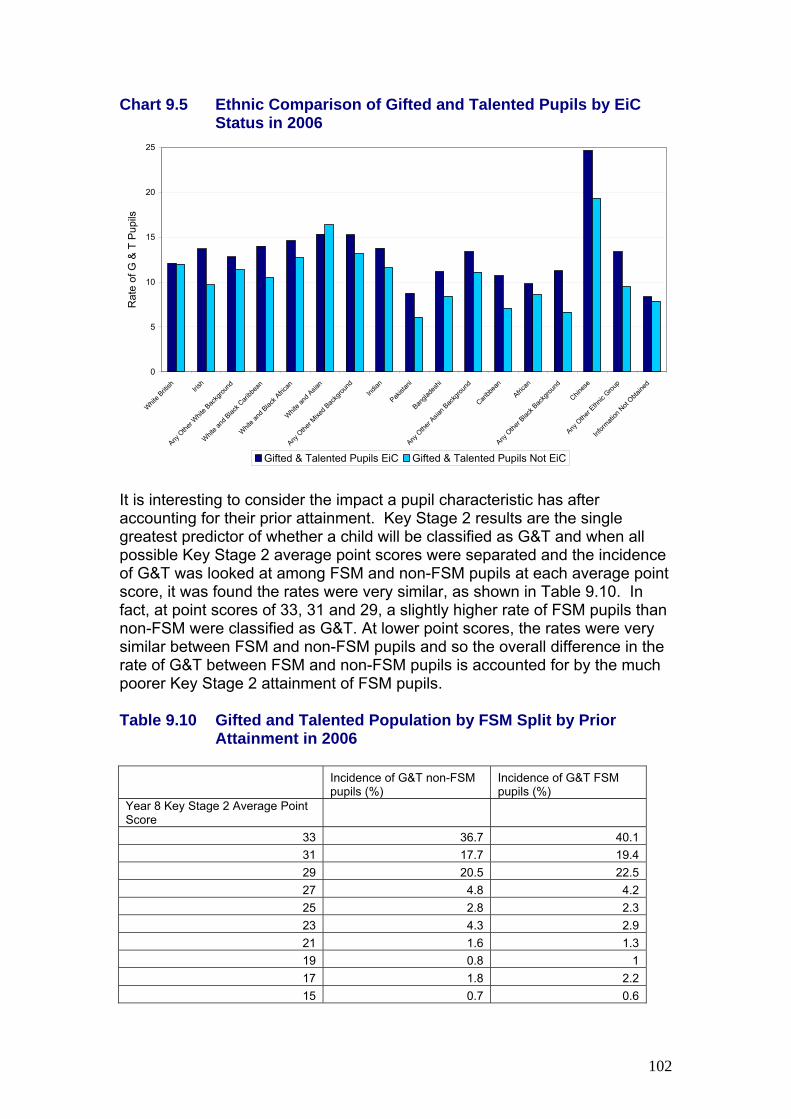
102
Chart 9.5 Ethnic Comparison of Gifted and Talented Pupils by EiC Status in 2006
0
5
10
15
20
25
Whit
e Briti
sh Irish
Any O
ther W
hite B
ackg
round
Whit
e and
Blac
k Cari
bbea
n
Whit
e and
Black A
frican
Whit
e and
Asian
Any O
ther M
ixed B
ackg
round
Indian
Pakist
ani
Bangla
desh
i
Any O
ther A
sian B
ackg
round
Caribb
ean
African
Any O
ther B
lack B
ackg
round
Chines
e
Any O
ther E
thnic
Group
Inform
ation
Not
Obtaine
d
Rat
e of
G &
T P
upils
Gifted & Talented Pupils EiC Gifted & Talented Pupils Not EiC It is interesting to consider the impact a pupil characteristic has after accounting for their prior attainment. Key Stage 2 results are the single greatest predictor of whether a child will be classified as G&T and when all possible Key Stage 2 average point scores were separated and the incidence of G&T was looked at among FSM and non-FSM pupils at each average point score, it was found the rates were very similar, as shown in Table 9.10. In fact, at point scores of 33, 31 and 29, a slightly higher rate of FSM pupils than non-FSM were classified as G&T. At lower point scores, the rates were very similar between FSM and non-FSM pupils and so the overall difference in the rate of G&T between FSM and non-FSM pupils is accounted for by the much poorer Key Stage 2 attainment of FSM pupils. Table 9.10 Gifted and Talented Population by FSM Split by Prior
Attainment in 2006
Incidence of G&T non-FSM pupils (%)
Incidence of G&T FSM pupils (%)
Year 8 Key Stage 2 Average Point Score
33 36.7 40.1 31 17.7 19.4 29 20.5 22.5 27 4.8 4.2 25 2.8 2.3 23 4.3 2.9 21 1.6 1.3 19 0.8 1 17 1.8 2.2 15 0.7 0.6

103
Once prior attainment was taken account of, the case that several groups of pupils with particular characteristics were under-represented in the G&T population was not as strong. For example, more deprived pupils were slightly more likely to be classified as G&T than less deprived pupils when Key Stage 2 average point score was accounted for. To a certain extent, G&T is less biased to pupils from less deprived backgrounds than the high attainment measure and the G&T identification programme is helping to support work on social mobility and narrowing attainment gaps. However, since schools should not rely entirely on attainment in identifying G&T pupils, it is also important to look at patterns of pupil characteristics without taking account of prior attainment. As each pupil can be affected simultaneously by a number of different factors, it is interesting to see how these different factors compare in terms of affecting a pupil’s probability of being identified as G&T. 9.5.3 Logistic Regression Logistic regression is a statistical modelling technique that provides the facility to estimate the likelihood of an event after accounting for a number of characteristics (or factors). In doing so, it becomes possible to simultaneously estimate the effects of each of the characteristics selected for inclusion in the model. Table 9.11 below shows the relative importance of the different factors, in terms of their effect on a pupil’s probability of being identified as G&T.52 Table 9.11 Logistic Regression Results for the Gifted and Talented
Population in 2006 Effect on a pupil’s probability of being identified as G&T
Much more likely
More likely
Average Less likely Much less likely
Deprivation factors:
Non- FSM; Low IDACI
FSM; High IDACI
Gender: Girls Boys Ethnic groups: Bangladeshi;
Black Caribbean; Any other White background; Mixed White and Asian; Mixed White and Black African
Chinese; Indian; Any Other Ethnic Group
Pakistani; Black African
Gypsy/Roma; Mixed White and Black Caribbean; Any other Mixed Background
Any Other Asian Background; Any Other Black Background
52 A full table of logistic regression coefficients, odds ratios, frequencies of groups and the R-square statistic are available in the annex. These results are similar to analysis in the Excellence in Cities Evaluation (NfER, LSE & IFS, 2005, p. 92)

104
9.5.4 Contextualised Value-Added Scores Contextual Value Added ( (CVA) provides a measure of the progress pupils make by comparing their exam results to the results achieved nationally by pupils with similar prior attainment and other contextual factors, such as having special educational needs or living in areas of high deprivation.
It is important to remember that CVA is a measure of progress over a period of time from a given starting point, and not a measure of absolute attainment. CVA scores were published for the first time for each secondary school in the Key Stage 4 Achievement and Attainment Tables on 11 January 2007.53
The progress made by Year 11 pupils between Key Stages 2 and 4 was considered by comparing the Key Stage 2-4 CVA scores for G&T and non-G&T pupils. The mean difference in progress was 22.6 points. This means that, after allowing for Key Stage 2 prior attainment and a range of contextual factors, G&T pupils achieved higher GCSE results than non-G&T pupils by nearly half a grade per subject, on average. Similar analysis was carried out on the year 9 cohort, in terms of their Key Stage 2-3 progress (CVA score). G&T pupils performed ¾ point better than non-G&T pupils; this equates to G&T pupils making extra progress of about a term.
53 Further information on CVA can be found on the Department’s ‘Guide to CVA Methodology’: Guide to CVA

105
References Atkinson, A., Gregg, P. and McConnell, B. (2006), ‘The Result of 11 Plus
Selection: An Investigation Into Opportunities and Outcomes for Pupils in Selective LEAs’, CMPO Working Paper Series No. 06/150
DfES (2003), ‘Statistics of Education: Pupil Progress by Pupil Characteristics: 2002’, Statistics of Education Bulletin 02/04
DfES (2004), ‘Statistics of Education: Variation in Pupil Progress 2003’ Statistics of Education Bulletin 02/05
DfES (2005a), ‘Youth Cohort Study: The Activities and Experiences of 16 Year Olds: England and Wales 2004’, Statistical First Release: SFR04/2005
DfES (2005b), ‘Statistics of Education: The Characteristics of Low Attaining Pupils’, Statistics of Education Bulletin 02/05
DfES (2006a), ‘Longitudinal Study of Young People in England: Wave 1, 2004 (Next Steps)’, SN 5545
DfES (2006b), ‘Statistics of Education: Trends in Attainment Gaps,’ Statistics of Education Bulletin 02/06
DfES (2007a), ‘GCSE and Equivalent Examination Results in England 2005/06 (Revised)’, Statistical First Release: SFR01/2007
DfES (2007b), ‘Further Education, Work-based Learning for Young People, Train to Gain and Adult and Community Learning - Learner Numbers in England - October 2006’, Statistical First Release: ILR/SFR12
DfES (2007c), ‘Pupil Characteristics and Class Sizes in Maintained Schools in England, January 2007 (Provisional)’, Statistical First Release: SFR16/2007
Jenkins, A. and Levacic, R. (2006), ‘The Relationship between Pupil Attainment at Key Stage 3 and Family and Neighbourhood Factors: Evidence from the Longitudinal Survey of Young People in England’, Research Report No.
NfER, LSE and IFS (2005), ‘Excellence in Cities: The National Evaluation of a Policy to Raise Standards in Urban Schools 2000-03’, Research Report 675A
Strand, S. (2007), ‘Minority Ethnic Pupils in the Longitudinal Survey of Young People in England (LSYPE)’, Upcoming
Qualifications and Curriculum Authority: http://www.qca.org.uk/ DfES Standards Site: Gifted and Talented: http://www.standards.dfes.gov.uk/giftedandtalented/ DfES Standards Site: Guidance for contextualised value-added: http://www.standards.dfes.gov.uk/performance/1316367/CVAinPAT2005/

106
Appendix A: Additional Tables and Charts Rather than provide a complete set of tables and charts, this appendix provides those for which there was no space in the main chapters Chapter 1 Table A1.1: Percentage of Pupils in Defined High Attaining Groups and
Point Score Cut-Offs Key Stage Point Score Cut-Off % of Pupils in Defined
High Attaining Group
KS4 2006 410.00 10.02 KS3 2004-English 42.00 10.23 KS3 2004-Mathematics 44.88 10.07 KS3 2004-Average 42.63 10.04 KS2 2001-English 31.38 10.42 KS2 2001-Mathematics 32.70 10.02 KS2 2001-Average 31.59 10.00 KS3 2006-English 42.00 10.11 KS3 2006-Mathematics 46.92 10.22 KS3 2006-Average 43.47 10.08 KS2 2006-English 31.92 10.50 KS2 2006-Mathematics 33.42 11.34 KS2 2006-Average 32.31 10.18
Chapter 2 Table A2.1: Numbers of Evenings Spent Doing Homework for Pupils in
Year 9 in 2004 Taken from LSYPE Number of school nights doing homework Non High-Attainers (%) High Attainers (%) Don't Know 0.7 0.1 0 3.1 0.6 1 15.2 3.9 2 23.4 12.1 3 29.2 26.9 4 13.6 25.2 5 14.8 31.1

107
Table A2.2: School Satisfaction Scores for Pupils in Year 9 in 2004 Taken from LSYPE
School Satisfaction Variable (Scale 0-4) Mean Score
Non High-Attainers Mean Score
High Attainers I am happy when I am at school. 2.94 3.23 School is a waste of time for me. 3.32 3.53 Work is worth doing. 2.57 3.06 Most of the time I don't want to go to school. 2.89 3.22 People think my school is a good school. 2.90 3.24 On the whole I like being at school. 2.68 2.96 I work as hard as I can in school. 2.97 3.44 In a lesson, I often count the minutes till it ends. 3.37 3.72 I am bored in lessons. 2.44 2.90 The work I do in lessons is a waste of time. 1.88 2.21 The work I do in lessons is interesting to me. 2.06 2.47 I get good marks for my work. 3.14 3.39
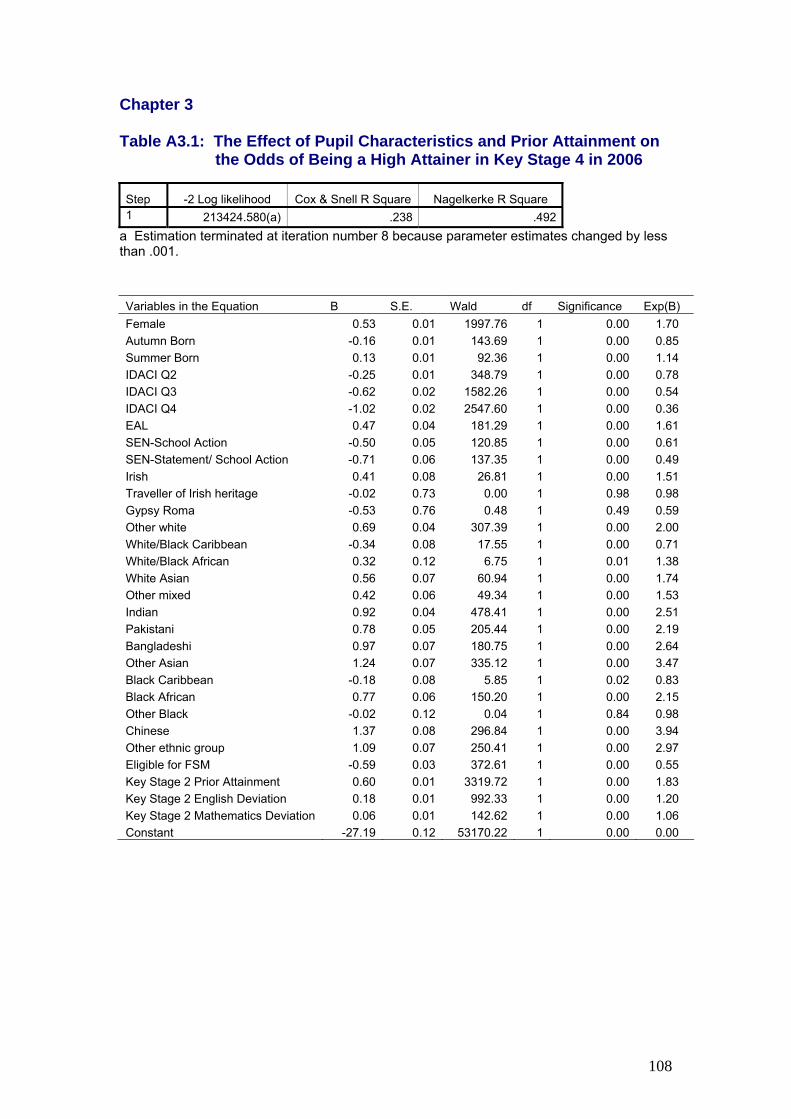
108
Chapter 3 Table A3.1: The Effect of Pupil Characteristics and Prior Attainment on
the Odds of Being a High Attainer in Key Stage 4 in 2006
Step -2 Log likelihood Cox & Snell R Square Nagelkerke R Square 1 213424.580(a) .238 .492
a Estimation terminated at iteration number 8 because parameter estimates changed by less than .001. Variables in the Equation B S.E. Wald df Significance Exp(B) Female 0.53 0.01 1997.76 1 0.00 1.70 Autumn Born -0.16 0.01 143.69 1 0.00 0.85 Summer Born 0.13 0.01 92.36 1 0.00 1.14 IDACI Q2 -0.25 0.01 348.79 1 0.00 0.78 IDACI Q3 -0.62 0.02 1582.26 1 0.00 0.54 IDACI Q4 -1.02 0.02 2547.60 1 0.00 0.36 EAL 0.47 0.04 181.29 1 0.00 1.61 SEN-School Action -0.50 0.05 120.85 1 0.00 0.61 SEN-Statement/ School Action -0.71 0.06 137.35 1 0.00 0.49 Irish 0.41 0.08 26.81 1 0.00 1.51 Traveller of Irish heritage -0.02 0.73 0.00 1 0.98 0.98 Gypsy Roma -0.53 0.76 0.48 1 0.49 0.59 Other white 0.69 0.04 307.39 1 0.00 2.00 White/Black Caribbean -0.34 0.08 17.55 1 0.00 0.71 White/Black African 0.32 0.12 6.75 1 0.01 1.38 White Asian 0.56 0.07 60.94 1 0.00 1.74 Other mixed 0.42 0.06 49.34 1 0.00 1.53 Indian 0.92 0.04 478.41 1 0.00 2.51 Pakistani 0.78 0.05 205.44 1 0.00 2.19 Bangladeshi 0.97 0.07 180.75 1 0.00 2.64 Other Asian 1.24 0.07 335.12 1 0.00 3.47 Black Caribbean -0.18 0.08 5.85 1 0.02 0.83 Black African 0.77 0.06 150.20 1 0.00 2.15 Other Black -0.02 0.12 0.04 1 0.84 0.98 Chinese 1.37 0.08 296.84 1 0.00 3.94 Other ethnic group 1.09 0.07 250.41 1 0.00 2.97 Eligible for FSM -0.59 0.03 372.61 1 0.00 0.55 Key Stage 2 Prior Attainment 0.60 0.01 3319.72 1 0.00 1.83 Key Stage 2 English Deviation 0.18 0.01 992.33 1 0.00 1.20 Key Stage 2 Mathematics Deviation 0.06 0.01 142.62 1 0.00 1.06 Constant -27.19 0.12 53170.22 1 0.00 0.00

109
Chapter 7 Table A7.1: The Effect of Pupil Characteristics when Prior Attainment is
Included on the Odds of Being Entered for the 6-8 Mathematics Tier at Key Stage 3 in 2006
Categorical Variables Codings Frequency
Parameter coding
Irish 0 571,613 0 1 2,007 1Traveller of Irish heritage 0 573,498 0 1 122 1Gypsy Roma 0 573,268 0 1 352 1Other white 0 563,750 0 1 9,870 1White/Black Caribbean 0 567,803 0 1 5,817 1Black African 0 572,239 0 1 1,381 1White Asian 0 570,734 0 1 2,886 1Other mixed 0 568,783 0 1 4,837 1Indian 0 561,539 0 1 12,081 1Pakistani 0 559,940 0 1 13,680 1Bangladeshi 0 568,423 0 1 5,197 1Other Asian 0 570,095 0 1 3,525 1Black Caribbean 0 566,051 0 1 7,569 1Black African 0 572,239 0 1 1,381 1Other Black 0 571,316 0 1 2,304 1Chinese 0 571,944 0 1 1,676 1Other ethnic group 0 569,760 0 1 3,860 1Unclassified ethnic group 0 563,178 0 1 10,442 1IDACI Q2 0 430,303 0 1 143,317 1IDACI Q3 0 431,891 0 1 141,729 1IDACI Q4 0 433,956 0 1 139,664 1Autumn born 0 384,528 0 1 189,092 1
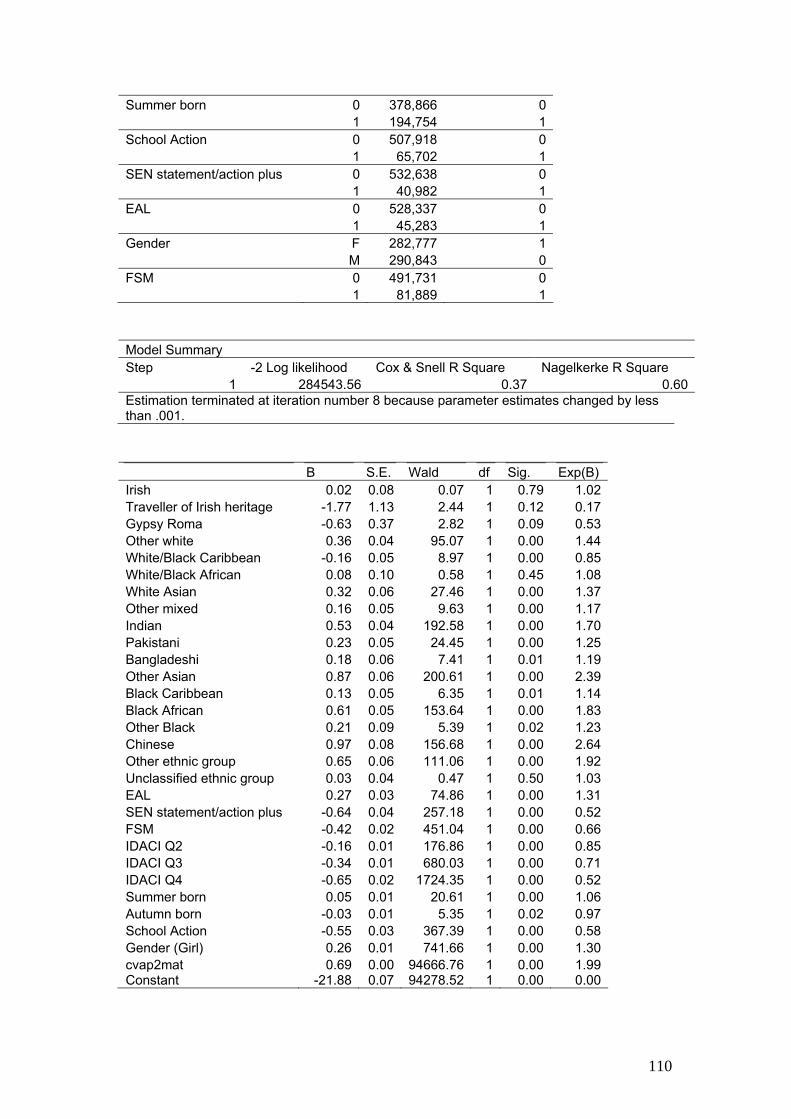
110
Summer born 0 378,866 0 1 194,754 1School Action 0 507,918 0 1 65,702 1SEN statement/action plus 0 532,638 0 1 40,982 1EAL 0 528,337 0 1 45,283 1Gender F 282,777 1 M 290,843 0FSM 0 491,731 0 1 81,889 1
Model Summary Step -2 Log likelihood Cox & Snell R Square Nagelkerke R Square
1 284543.56 0.37 0.60Estimation terminated at iteration number 8 because parameter estimates changed by less than .001.
B S.E. Wald df Sig. Exp(B) Irish 0.02 0.08 0.07 1 0.79 1.02 Traveller of Irish heritage -1.77 1.13 2.44 1 0.12 0.17 Gypsy Roma -0.63 0.37 2.82 1 0.09 0.53 Other white 0.36 0.04 95.07 1 0.00 1.44 White/Black Caribbean -0.16 0.05 8.97 1 0.00 0.85 White/Black African 0.08 0.10 0.58 1 0.45 1.08 White Asian 0.32 0.06 27.46 1 0.00 1.37 Other mixed 0.16 0.05 9.63 1 0.00 1.17 Indian 0.53 0.04 192.58 1 0.00 1.70 Pakistani 0.23 0.05 24.45 1 0.00 1.25 Bangladeshi 0.18 0.06 7.41 1 0.01 1.19 Other Asian 0.87 0.06 200.61 1 0.00 2.39 Black Caribbean 0.13 0.05 6.35 1 0.01 1.14 Black African 0.61 0.05 153.64 1 0.00 1.83 Other Black 0.21 0.09 5.39 1 0.02 1.23 Chinese 0.97 0.08 156.68 1 0.00 2.64 Other ethnic group 0.65 0.06 111.06 1 0.00 1.92 Unclassified ethnic group 0.03 0.04 0.47 1 0.50 1.03 EAL 0.27 0.03 74.86 1 0.00 1.31 SEN statement/action plus -0.64 0.04 257.18 1 0.00 0.52 FSM -0.42 0.02 451.04 1 0.00 0.66 IDACI Q2 -0.16 0.01 176.86 1 0.00 0.85 IDACI Q3 -0.34 0.01 680.03 1 0.00 0.71 IDACI Q4 -0.65 0.02 1724.35 1 0.00 0.52 Summer born 0.05 0.01 20.61 1 0.00 1.06 Autumn born -0.03 0.01 5.35 1 0.02 0.97 School Action -0.55 0.03 367.39 1 0.00 0.58 Gender (Girl) 0.26 0.01 741.66 1 0.00 1.30 cvap2mat 0.69 0.00 94666.76 1 0.00 1.99 Constant -21.88 0.07 94278.52 1 0.00 0.00

111
Table A7.2: The Effect of Pupil Characteristics on the Odds of Being Entered for the 6-8 Mathematics Tier at Key Stage 3 in 2006
Categorical Variables Codings Frequency Parameter coding Irish N 597,736 0 Y 2,105 1Traveller of Irish heritage N 599,681 0 Y 160 1Gypsy Roma N 599,400 0 Y 441 1Other white N 587,505 0 Y 12,336 1White/Black Caribbean N 593,837 0 Y 6,004 1Black African N 589,084 0 Y 10,757 1White Asian N 596,794 0 Y 3,047 1Other mixed N 594,612 0 Y 5,229 1Indian N 586,776 0 Y 13,065 1Pakistani N 585,068 0 Y 14,773 1Bangladeshi N 594,193 0 Y 5,648 1Other Asian N 595,234 0 Y 4,607 1Black Caribbean N 591,855 0 Y 7,986 1Black African N 589,084 0 Y 10,757 1Other Black N 597,242 0 Y 2,599 1Chinese N 597,798 0 Y 2,043 1Other ethnic group N 594,816 0 Y 5,025 1Unclassified ethnic group N 588,702 0 Y 11,139 1IDACI Q2 N 451,625 0 Y 148,216 1IDACI Q3 N 451,440 0 Y 148,401 1IDACI Q4 N 451,378 0 Y 148,463 1Autumn born N 402,464 0 Y 197,377 1Summer born N 395,921 0 Y 203,920 1School Action N 531,025 0 Y 68,816 1SEN statement/action plus N 555,715 0

112
Y 44,126 1EAL N 545,299 0 Y 54,542 1Gender F 295,032 0 M 304,809 1FSM N 512,227 0 Y 87,614 1
Model Summary Step -2 Log likelihood Cox & Snell R Square Nagelkerke R Square
1 515743.69 0.08 0.14Estimation terminated at iteration number 8 because parameter estimates changed by less than .001.
B S.E. Wald df Sig. Exp(B) Irish 0.32 0.06 32.46 1 0.00 1.37 Traveller of Irish heritage -2.61 1.01 6.70 1 0.01 0.07 Gypsy Roma -1.34 0.30 20.35 1 0.00 0.26 Other white 0.28 0.03 120.36 1 0.00 1.32 White/Black Caribbean -0.16 0.04 14.42 1 0.00 0.85 White/Black African 0.20 0.07 7.28 1 0.01 1.22 White Asian 0.53 0.04 145.73 1 0.00 1.69 Other mixed 0.33 0.04 81.75 1 0.00 1.39 Indian 0.72 0.03 772.88 1 0.00 2.06 Pakistani 0.13 0.03 16.01 1 0.00 1.14 Bangladeshi 0.31 0.05 44.35 1 0.00 1.37 Other Asian 0.83 0.04 463.47 1 0.00 2.29 Black Caribbean -0.31 0.04 58.89 1 0.00 0.73 Black African 0.12 0.03 11.76 1 0.00 1.12 Other Black -0.15 0.07 5.15 1 0.02 0.86 Chinese 1.64 0.05 1077.70 1 0.00 5.17 Other ethnic group 0.55 0.04 175.16 1 0.00 1.73 Unclassified ethnic group -0.08 0.03 7.81 1 0.01 0.93 IDACI Q2 -0.30 0.01 1130.19 1 0.00 0.74 IDACI Q3 -0.63 0.01 4233.70 1 0.00 0.53 IDACI Q4 -0.98 0.01 7256.68 1 0.00 0.37 Summer born -0.16 0.01 346.25 1 0.00 0.85 Autumn born 0.19 0.01 502.52 1 0.00 1.21 School Action -1.98 0.02 7951.16 1 0.00 0.14 Gender (Girl) 0.26 0.01 1386.29 1 0.00 1.30 EAL -0.14 0.02 46.25 1 0.00 0.87 FSM -0.77 0.02 2640.77 1 0.00 0.46 SEN statement/action plus -2.22 0.03 5094.35 1 0.00 0.11 Constant -1.00 0.01 13756.50 1 0.00 0.37

113
Chapter 9 Table A9.1: Rate of G&T Pupils by Local Authority Gifted and
Talented Pupils Incidence of G&T (% of cohort)
Year 8 Reading 214 24.9 Torbay 305 21.5 York 349 20.5 Poole 281 20.0 Somerset 1,108 20.0 Waltham Forest 493 19.4 Stoke-on-Trent 482 18.1 North East Lincolnshire 343 17.9 Darlington 208 17.7 Bedfordshire 790 17.4 Kensington and Chelsea 103 17.2 Wiltshire 799 16.6 Rutland 77 16.5 North Somerset 364 16.2 Northamptonshire 1,265 16.2 Swindon 349 16.1 Havering 482 16.0 Buckinghamshire 811 15.9 West Berkshire 311 15.9 Enfield 557 15.9 Wolverhampton 435 15.9 Islington 229 15.7 Sandwell 551 15.7 Bath and North East Somerset 340 15.7 Redcar and Cleveland 295 15.6 Bromley 536 15.5 Derby 441 15.4 Hartlepool 184 15.3 Isle of Wight 226 15.2 Bexley 485 15.2 Bury 336 15.1 Plymouth 444 15.1 Leicestershire 1,097 15.0 Stockton-on-Tees 356 14.9 Newcastle upon Tyne 399 14.7 Lambeth 216 14.6 Wakefield 592 14.6 Worcestershire 880 14.6 Rochdale 370 14.5 Nottinghamshire 1,311 14.4 Southampton 317 14.4 Warwickshire 823 14.4 Salford 337 14.3 Sheffield 799 14.2 Durham 793 14.1 Birmingham 1,684 14.1 Halton 210 14.1 Cheshire 1,095 14.1 Calderdale 366 14.1

114
Warrington 354 14.0 Luton 317 13.9 Redbridge 410 13.8 Haringey 275 13.8 Wandsworth 250 13.6 Gloucestershire 891 13.5 Greenwich 299 13.3 Devon 985 13.2 Hammersmith and Fulham 128 13.1 Sunderland 450 13.0 Dudley 510 13.0 North Yorkshire 876 13.0 Wigan 499 12.8 West Sussex 1,016 12.8 Coventry 429 12.5 Wokingham 209 12.5 Oxfordshire 759 12.4 Trafford 325 12.3 East Sussex 612 12.2 Newham 395 12.2 Derbyshire 1,061 12.0 Brent 299 12.0 Kingston upon Hull, City of 356 12.0 Hillingdon 336 11.9 Shropshire 365 11.8 South Gloucestershire 360 11.7 Manchester 498 11.7 Camden 160 11.5 Wirral 436 11.5 Hounslow 283 11.5 Barnsley 301 11.4 Tower Hamlets 260 11.3 North Lincolnshire 225 11.3 Lewisham 239 11.3 Hackney 143 11.3 Hertfordshire 1,409 11.2 Dorset 494 11.2 Ealing 287 11.1 Brighton and Hove 240 11.0 Richmond upon Thames 152 10.9 South Tyneside 202 10.8 Bracknell Forest 115 10.7 Oldham 320 10.7 Bolton 362 10.6 Bradford 607 10.6 Kirklees 493 10.6 Barnet 315 10.5 Bournemouth 168 10.5 Westminster 134 10.5 Lancashire 1,422 10.5 Southend-on-Sea 209 10.5 Peterborough 230 10.5 Blackburn with Darwen 182 10.4 Walsall 375 10.3 Nottingham 287 10.3 Cumbria 604 10.1 Telford and Wrekin 212 10.1 Essex 1,572 10.1
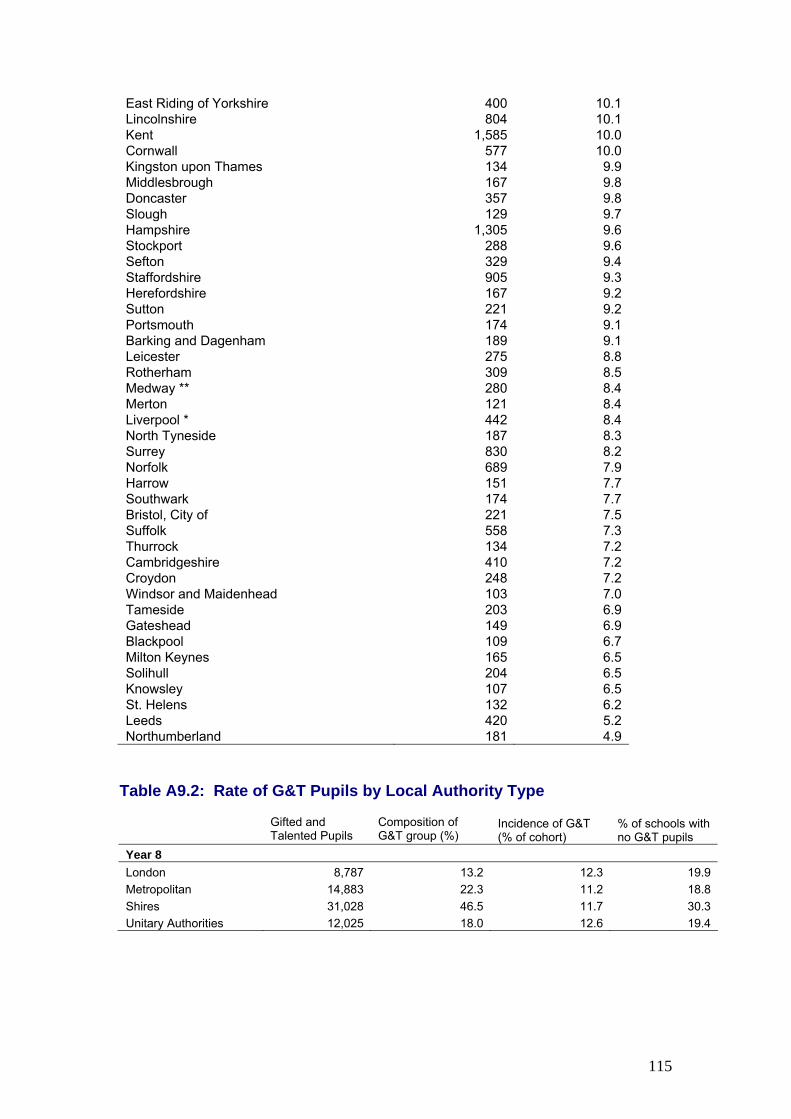
115
East Riding of Yorkshire 400 10.1 Lincolnshire 804 10.1 Kent 1,585 10.0 Cornwall 577 10.0 Kingston upon Thames 134 9.9 Middlesbrough 167 9.8 Doncaster 357 9.8 Slough 129 9.7 Hampshire 1,305 9.6 Stockport 288 9.6 Sefton 329 9.4 Staffordshire 905 9.3 Herefordshire 167 9.2 Sutton 221 9.2 Portsmouth 174 9.1 Barking and Dagenham 189 9.1 Leicester 275 8.8 Rotherham 309 8.5 Medway ** 280 8.4 Merton 121 8.4 Liverpool * 442 8.4 North Tyneside 187 8.3 Surrey 830 8.2 Norfolk 689 7.9 Harrow 151 7.7 Southwark 174 7.7 Bristol, City of 221 7.5 Suffolk 558 7.3 Thurrock 134 7.2 Cambridgeshire 410 7.2 Croydon 248 7.2 Windsor and Maidenhead 103 7.0 Tameside 203 6.9 Gateshead 149 6.9 Blackpool 109 6.7 Milton Keynes 165 6.5 Solihull 204 6.5 Knowsley 107 6.5 St. Helens 132 6.2 Leeds 420 5.2 Northumberland 181 4.9
Table A9.2: Rate of G&T Pupils by Local Authority Type Gifted and
Talented Pupils Composition of G&T group (%)
Incidence of G&T (% of cohort)
% of schools with no G&T pupils
Year 8 London 8,787 13.2 12.3 19.9 Metropolitan 14,883 22.3 11.2 18.8 Shires 31,028 46.5 11.7 30.3 Unitary Authorities 12,025 18.0 12.6 19.4

116
Table A9.3: School Level Information for G&T Pupils
Number of schoolsTotal number of pupils
Number of G&T pupils
Incidence of G&T (% of cohort) No G&T
0-10% G&T
10-20% G&T
20-50% G&T
50%+ G&T
Maintained Mainstream, CTCs and Academies 3289 568777 66073 11.6 24.7 27.2 29.9 17.2 1.0
Academies 23 3857 346 9.0 34.8 17.4 39.1 8.7 0.0
Specialists 2243 419524 49349 11.8 23.3 27.5 30.9 17.0 1.3
Specialisms Arts 367 71442 8630 12.1 22.3 26.7 32.2 16.9 1.9Business and Enterprise 189 33367 4201 12.6 20.6 23.3 33.3 22.2 0.5Engineering 39 7056 807 11.4 20.5 30.8 25.6 23.1 0.0Humanities 57 9603 1121 11.7 22.8 31.6 28.1 14.0 3.5Language 204 39448 4744 12.0 23.5 31.4 25.5 18.1 1.5Maths & Computing 200 36148 3990 11.0 24.0 31.5 27.5 15.0 2.0Music 14 2443 323 13.2 35.7 14.3 28.6 21.4 0.0Science 255 46408 5762 12.4 23.5 23.5 32.9 17.6 2.4Sports 314 58042 6805 11.7 23.9 27.7 29.6 18.5 0.3Technology 535 103111 11374 11.0 23.7 27.5 34.2 14.0 0.6Combined Spec 69 11506 1560 13.6
EiC 1237 218439 25577 11.7 14.9 31.5 39.6 13.3 0.6
FSM Bands 5% or less FSM 484 88051 10827 12.3 29.1 23.6 25.8 20.5 1.05+ to 9% 720 134673 15173 11.3 25.1 29.9 26.5 18.2 0.39+ to 13% 531 95831 10296 10.7 26.9 29.2 27.3 16.0 0.613+ to 21% 562 98376 10873 11.1 24.4 26.0 32.4 16.9 0.421+ to 35% 509 82995 9429 11.4 20.8 27.9 35.0 15.7 0.635+ to 50% 226 35205 4026 11.4 14.6 30.1 44.7 10.2 0.4Above 50% 94 14293 1677 11.7 12.8 30.9 41.5 14.9 0.0Grammar Schools 163 19353 3772 19.5 36.0 16.1 13.0 23.6 11.2
Chart A9.1: School % G&T by Ethnic Minority Band of School
0
10
20
30
40
50
60
727 909 865 794
<5 >= 5 & < 10 >= 10 & < 25 >=25
Secondary School Ethnic Minority Band and Numbers of Schools
% o
f G &
T in
Sch
ool

117
Table A9.4: Local Authority and School Type Information for Schools Identifying High Percentages of G&T Pupils
Local Authority Type for top 10% of schools selecting the most G&T pupils
All schools Total Number of schools in the top 10% Rate
London 412 36 8.7Metropolitan 724 52 7.2Shires 1611 182 11.3Unitary Authorities 542 61 11.3 School Type for top 10% of schools selecting the most G&T pupils
All schools Total Number of schools in the top 10% Rate
Academies 27 2 7.4City Technology College 10 1 10.0Community 2077 201 9.7Foundation 523 72 13.8Voluntary aided 545 40 7.3Voluntary controlled 107 15 14.0 Local Authority for top 10% of schools selecting the most G&T pupils
LA
Number of schools
Number of schools in the top 10% Rate
York 11 6 54.5Torbay ** 8 3 37.5Rutland 3 1 33.3Bath and North East Somerset 13 4 30.8Swindon 10 3 30.0Darlington 7 2 28.6Reading * 7 2 28.6Somerset 35 10 28.6Buckinghamshire ** 34 9 26.5Kensington and Chelsea 4 1 25.0Poole * 8 2 25.0Southend-on-Sea ** 12 3 25.0Wiltshire * 29 7 24.1Waltham Forest 17 4 23.5Stoke-on-Trent * 17 4 23.5Newcastle upon Tyne 13 3 23.1Dudley 22 5 22.7Northamptonshire 40 9 22.5Bromley * 18 4 22.2Bury 14 3 21.4Herefordshire 14 3 21.4Bexley * 15 3 20.0

118
North Somerset 10 2 20.0Bedfordshire 42 8 19.0Warwickshire * 37 7 18.9Worcestershire 44 8 18.2Enfield * 17 3 17.6Sandwell 18 3 16.7Trafford ** 18 3 16.7Wakefield 18 3 16.7Hartlepool 6 1 16.7North East Lincolnshire 12 2 16.7Warrington 12 2 16.7Medway ** 19 3 15.8Barnet * 20 3 15.0Sheffield 27 4 14.8Rochdale 14 2 14.3Southampton 14 2 14.3Peterborough 14 2 14.3Gloucestershire * 42 6 14.3Lincolnshire * 63 9 14.3Tower Hamlets 15 2 13.3Calderdale * 15 2 13.3Birmingham * 76 10 13.2Leicestershire 39 5 12.8West Sussex 39 5 12.8Derbyshire 47 6 12.8Nottinghamshire 47 6 12.8Hammersmith and Fulham 8 1 12.5Westminster 8 1 12.5Merton 8 1 12.5Richmond upon Thames 8 1 12.5Redbridge * 17 2 11.8Plymouth 17 2 11.8Kent ** 104 12 11.5Cheshire 44 5 11.4Lancashire * 88 10 11.4Islington 9 1 11.1Havering 18 2 11.1Brighton and Hove 9 1 11.1Wokingham 9 1 11.1Isle of Wight 18 2 11.1Coventry 19 2 10.5Hertfordshire 79 8 10.1Kingston upon Thames * 10 1 10.0South Tyneside 10 1 10.0Bournemouth * 10 1 10.0Suffolk 60 6 10.0Wigan 21 2 9.5Cumbria * 42 4 9.5Lambeth 11 1 9.1Wandsworth 11 1 9.1Haringey 11 1 9.1Redcar and Cleveland 11 1 9.1North Yorkshire * 44 4 9.1Shropshire 22 2 9.1

119
Oxfordshire 34 3 8.8Hampshire 71 6 8.5Luton 12 1 8.3Durham 36 3 8.3Devon * 37 3 8.1Lewisham 13 1 7.7East Sussex 27 2 7.4Sutton * 14 1 7.1Stockton-on-Tees 14 1 7.1North Lincolnshire 14 1 7.1Derby 14 1 7.1Salford 15 1 6.7South Gloucestershire 15 1 6.7Kingston upon Hull, City of * 15 1 6.7Northumberland 46 3 6.5Dorset 31 2 6.5Cornwall 31 2 6.5Bolton 16 1 6.3Essex * 80 5 6.3Hillingdon 17 1 5.9Doncaster 17 1 5.9Surrey 53 3 5.7Wolverhampton * 18 1 5.6Sunderland 18 1 5.6Wirral * 22 1 4.5Manchester 23 1 4.3Kirklees * 30 1 3.3Cambridgeshire 30 1 3.3Staffordshire 62 2 3.2Leeds 40 1 2.5Norfolk 52 1 1.9
Those local authorities which are partially selective are marked with an asterisk and those which are selective are marked with two asterisks. Table A9.5: Rate of G&T Pupils by School Type Gifted and Talented Pupils Composition of
G&T group (%) Incidence of G&T (% of cohort)
Year 8 Community 44,616 67.5 11.7 Voluntary aided 12,067 18.3 11.7 Voluntary controlled 7,326 11.1 12.9 Foundation 2,064 3.1 11.9

120
Table A9.6: The Effect of Pupil Characteristics on the Odds of Being Entered Identified as Gifted and Talented
Model Summary Step -2 Log likelihood Cox & Snell R Square Nagelkerke R Square
1 403750.98 0.01 0.02Estimation terminated at iteration number 6 because parameter estimates changed by less than .001.
B S.E. Wald df Sig. Exp(B) White Asian 0.73 0.06 153.39 1 0.00 2.07 Bangladeshi 0.38 0.05 58.55 1 0.00 1.47 Refused 0.35 1.06 0.11 1 0.74 1.42 Any Other White Background 0.30 0.08 15.18 1 0.00 1.35 Caribbean 0.29 0.04 51.21 1 0.00 1.34 White Black African 0.27 0.05 31.87 1 0.00 1.31 Indian 0.24 0.04 28.68 1 0.00 1.27 gender (girl) 0.19 0.01 503.72 1 0.00 1.20 Information Not Obtained 0.14 0.05 7.91 1 0.00 1.15 Any Other Ethnic Group 0.13 0.03 19.07 1 0.00 1.14 Chinese 0.10 0.03 12.50 1 0.00 1.10 Pakistani 0.04 0.04 1.23 1 0.27 1.04 African 0.03 0.07 0.22 1 0.64 1.03 Traveller Of Irish Heritage 0.03 0.07 0.15 1 0.70 1.03 Irish -0.01 0.04 0.05 1 0.82 0.99 Any Other Mixed Background -0.13 1.07 0.02 1 0.90 0.88 Gypsy Roma -0.22 0.03 47.72 1 0.00 0.81 White Black Caribbean -0.28 0.03 74.26 1 0.00 0.75 FSM eligible -0.56 0.02 1404.46 1 0.00 0.57 Any Other Black Background -0.82 0.22 13.36 1 0.00 0.44 IDACI -0.84 0.03 928.40 1 0.00 0.43 Any Other Asian Background -1.25 0.41 9.10 1 0.00 0.29 Constant -1.87 0.01 57945.60 1 0.00 0.15

121
Appendix B: Calculation of Fine Grade Point Scores
This note details the algorithm for how Key Stage 2 finely graded scores are calculated. Compensatory level 2 additional notes Note (1) Assign these pupils the middle mark of the compensatory 2 range and then apply the algorithm in note (3). Note (2) (i) If the mark is lower than the minimum mark for the compensatory level 2 range then assign the minimum mark of the compensatory level 2 range then apply the algorithm in note (3). (ii) If the mark is higher than the maximum mark of the compensatory level 2 range then assign the maximum mark of the compensatory level 2 range then apply the algorithm in note (3). Note (3) The difference in fine grade of one mark is extended from level 3 range.
⎭⎬⎫
⎩⎨⎧
+−−−=
1mark 3 levmin mark 3 levmax markmark 3 levmin 0.3 grade Fine
Variable outputs from this process fgpte : Fine grade point score for KS2 English fgptm : Fine grade point score for KS2 mathematics fgpts : Fine grade point score for KS2 science fgnum: Number of fine grade point score results (0 – 3). Calculating Average Point Score The fine grade APS is the mean of a pupil’s fine grade point scores.
fgnumfgptsfgptmfgptefgaps ++=
which should be rounded to two decimal places. Treatment of Disapplieds Pupils who achieved all disapplied results (or a mixture of disapplied and disregarded results) at Key Stage 2 should be given a fgaps of 15.00 regardless of attainment at Key Stage 4.

Calculating Fine Grades at Key Stage 2
Does the pupil have a valid final level? (B, N, 2 – 6)
Pupil does not get given a fine grade
Is it a level 6? Fine grade is 6.0
Does the pupil have a main test mark and is it within the mark range of the paper?
Fine grade is mid-point of level B, N = 2.50. Compensatory 2 see additional note (1) 3 = 3.5, 4 = 4.5, 5 = 5.5.
Is the mark consistent with the level?
For levels 3, 4, and 5.
level1min level -max level
min levelmark Grade Fine ++
−=
For compensatory level 2s see additional note (3)
START
Calculate fine grade point score Grade Fine6 scorePoint ×=
then round to 2 d.p.
If the level is N fine grade = 2.50 If the level is compensatory level 2 see additional note (2) If the level is higher than the mark then fine grade = level (i.e. 3.0, 4.0 or 5.0). If the level is lower than the mark then the fine grade is obtained from the maximum mark in that level
level1min level-max level
min levelmax level Grade Fine ++
−=
YES
YES
YES
YES
NO
NO
NO
NO
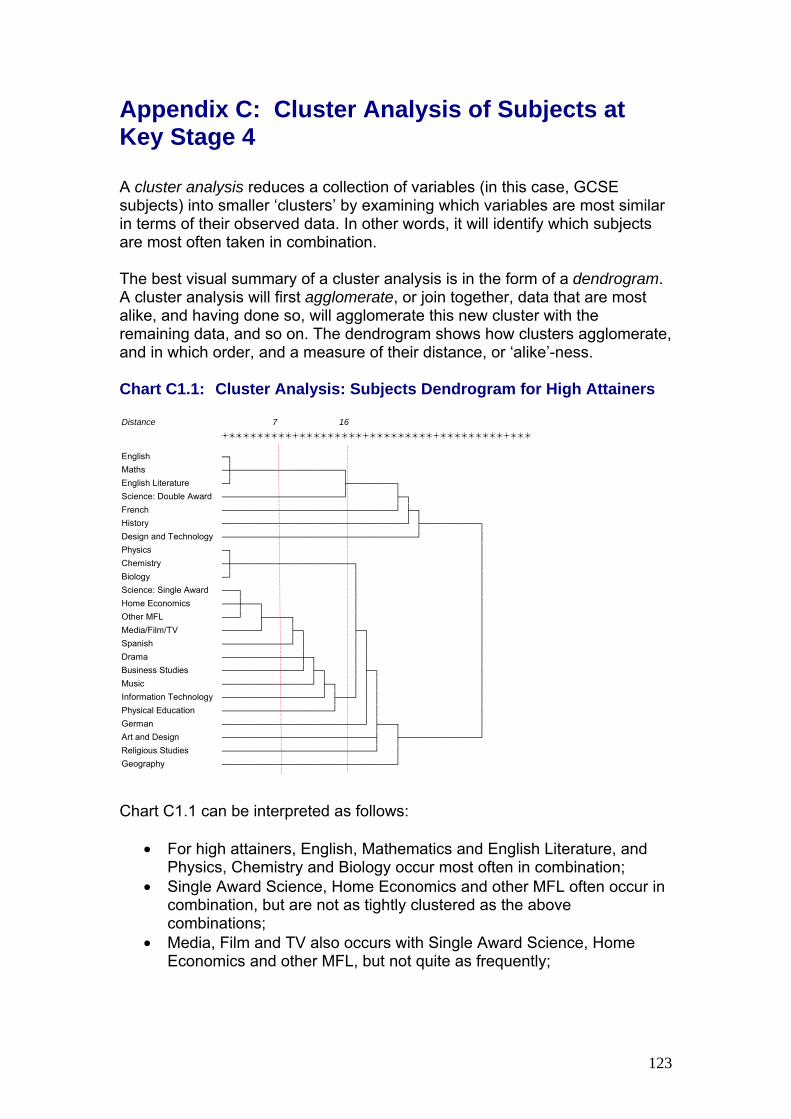
123
Appendix C: Cluster Analysis of Subjects at Key Stage 4 A cluster analysis reduces a collection of variables (in this case, GCSE subjects) into smaller �clusters� by examining which variables are most similar in terms of their observed data. In other words, it will identify which subjects are most often taken in combination. The best visual summary of a cluster analysis is in the form of a dendrogram. A cluster analysis will first agglomerate, or join together, data that are most alike, and having done so, will agglomerate this new cluster with the remaining data, and so on. The dendrogram shows how clusters agglomerate, and in which order, and a measure of their distance, or �alike�-ness. Chart C1.1: Cluster Analysis: Subjects Dendrogram for High Attainers
Chart C1.1 can be interpreted as follows:
• For high attainers, English, Mathematics and English Literature, and Physics, Chemistry and Biology occur most often in combination;
• Single Award Science, Home Economics and other MFL often occur in combination, but are not as tightly clustered as the above combinations;
• Media, Film and TV also occurs with Single Award Science, Home Economics and other MFL, but not quite as frequently;
Distance 7 16+---------+---------+---------+---------+---
English òøMaths òôòòòòòòòòòòòòòòòòòòòòòøEnglish Literature ò÷ ùòòòòòòòòòøScience: Double Award òòòòòòòòòòòòòòòòòòòòòòò÷ ùòøFrench òòòòòòòòòòòòòòòòòòòòòòòòòòòòòòòòò÷ ùòøHistory òòòòòòòòòòòòòòòòòòòòòòòòòòòòòòòòòòò÷ ùòòòòòòòòòòòøDesign and Technology òòòòòòòòòòòòòòòòòòòòòòòòòòòòòòòòòòòòò÷ óPhysics òø óChemistry òôòòòòòòòòòòòòòòòòòòòòòòòø óBiology ò÷ ó óScience: Single Award òòòø ó óHome Economics òòòôòòòø ó óOther MFL òòò÷ ùòòòòòø ó óMedia/Film/TV òòòòòòò÷ ùòø ùòø óSpanish òòòòòòòòòòòòò÷ ó ó ó óDrama òòòòòòòòòòòòòòòôòø ó ó óBusiness Studies òòòòòòòòòòòòòòò÷ ùòø ó ùòø óMusic òòòòòòòòòòòòòòòòò÷ ùòø ó ó ó óInformation Technology òòòòòòòòòòòòòòòòòòò÷ ùòòò÷ ó ó óPhysical Education òòòòòòòòòòòòòòòòòòòòò÷ ó ó óGerman òòòòòòòòòòòòòòòòòòòòòòòòòòò÷ ùòòòø óArt and Design òòòòòòòòòòòòòòòòòòòòòòòòòòòòòú ùòòòòòòòòòòòòòòò÷Religious Studies òòòòòòòòòòòòòòòòòòòòòòòòòòòòò÷ óGeography òòòòòòòòòòòòòòòòòòòòòòòòòòòòòòòòò÷

124
• The broadest cluster analysis reduces the data to two sets of variables: English, Mathematics, English Literature, Double Award Science, French, History and Design and Technology, and all other subjects.
• The less alike two clusters, the longer the branch of the dendrogram: for example, the English, Mathematics and English Literature cluster has a long branch, so is less associated with Double Award Science than, say, the Single Award Science/Home Economics/other MFL cluster is with Media, Film and TV.
At a distance of 7, there are only three clusters, with all other subjects unagglomerated. At a distance of 16, the Single Award Science/Home Economics/other MFL cluster has grown to 10 subjects, but there are still only three clusters, and 7 subjects are unagglomerated. Chart C1.2: Cluster Analysis: Subjects Dendrogram for All Pupils
Chart C1.2 shows that agglomeration occurs more rapidly for the whole cohort, but that the variables in the clusters are largely the same. At a distance of 16, only four subjects remain unagglomerated. In conclusion:
• Clustering occurs more rapidly for all pupils than for high attainers, so more subjects remain unagglomerated for high attaining pupils. This poorer association between subjects suggests that subject choice for high attainers is not as dependent on existing choices, and as a result, they are more likely to take a broader course of study.
Distance 7 16+---------+---------+---------+---------+---
Physics òøChemistry òôòòòòòøBiology ò÷ óOther MFL òòòòòûòôòøHome Economics òòòòò÷ ó óSpanish òòòòòòò÷ ùòøMusic òòòòòòòòòú ùòøMedia/Film/TV òòòòòòòòò÷ ó óScience: Single Award òòòòòòòòòòò÷ óBusiness Studies òòòòòòòòòòòòòôòøGerman òòòòòòòòòòòòòú ùòòòøInformation Technology òòòòòòòòòòòòò÷ ó ùòøDrama òòòòòòòòòòòòòòò÷ ó ùòøReligious Studies òòòòòòòòòòòòòòòòòòò÷ ó ùòøPhysical Education òòòòòòòòòòòòòòòòòòòòò÷ ó óGeography òòòòòòòòòòòòòòòòòòòòòòò÷ óArt and Design òòòòòòòòòòòòòòòòòòòòòòòòòôòòòòòòòòòòòòòòòòòòòòòòòøFrench òòòòòòòòòòòòòòòòòòòòòòòòòú óHistory òòòòòòòòòòòòòòòòòòòòòòòòò÷ óEnglish òûòòòòòòòø óMaths ò÷ ùòòòòòòòòòø óEnglish Literature òòòòòòòòò÷ ùòòòòòòòòòòòø óScience: Double Award òòòòòòòòòòòòòòòòòòò÷ ùòòòòòòòòòòòòòòòòò÷Design and Technology òòòòòòòòòòòòòòòòòòòòòòòòòòòòòòò÷

125
• There is, however, a wider core of subjects for high attainers. The
dendrogram shows that there are seven subjects (English, Mathematics, English Literature, Double Award Science, French, History and Design and Technology) which are both clustered and set apart from other subjects. For all pupils, this core contains only five subjects and excludes French and History.