Socio-economic & IT Changes in Korea, and KOSTAT’s Responses

“The Changes in the Socio-Economic Structure of Cuba: Income, Labor Markets and Consumption”
Viviana Togores González
(CIPS) International Seminar “Equity and Social Mobility: Theory and Methodology with Applications to
Bolivia, Brazil, Cuba, and South Africa.” UNDP/IPC, Brasilia, January 11-13, 2007
Built over three decades, Cuba’s social structure was seriously affected by the crisis of the
1990s and the solutions adopted during the subsequent adjustment process. A series of effects surfaced during this period, including the widening of inequality gaps and differentiation among population groups, territories and/or regions of the country, the reduction of the state’s role in generating employment, and the emergence of a new set of economic actors. These have left behind important aftereffects on social mobility and equity. This work attempts to summarize the most notable research that has been carried out with regards to the impact of these changes in terms of income, labor markets and access to consumption and when data permit to analyze these changes including racial and gender aspects.
Background, crisis and economic adjustment measures Starting from the 1960s and over the course of the next three decades, Cuba developed an
investment policy that transformed its economy from one that was totally based on agro-industry to one with a greater degree of industrial development. That was made possible through the commercial relations that Cuba maintained with the socialist camp, through CAME and, especially with the Soviet Union. This integration permitted economic development despite the difficult restrictions imposed by the global market on national products, as well as access to soft loans, preferential prices and secured markets for exports and raw materials and energy. Such advantages protected the national economy while maintaining a high level of investment and social development.
The new context (when the relations of exploitation were suppressed and social considerations predominated over economic criteria) was marked by remarkable achievements in the social sphere based, essentially, on the elimination of the great social inequalities and the equitable access by the population to a set of opportunities rooted in the development of individual capacities. As Espina, Moreno and Núñez (2003) explain“…the exploitative sources of inequality were eliminated, the social pyramid was compressed (...) the socio-economic asymmetries were diminished and a process to change the social structure was produced, (...) where the most notable tendencies are given by the progressive reduction and disappearance of unjust inequalities (17).” As these cited authors confirm, equity became a social norm while the differentiation among individuals and groups became primarily based on difference in educational qualifications and type of employment. Social groups were no longer separated by significant distances.
However, from the beginning of the 1980s, the first symptoms of the economic crisis that would lead to the fall of the socialist camp began to emerge (see Box 1). The events in Eastern Europe trigged a profound economic crisis during the 1990s. From that point onwards, the situation of the Cuban economy became more complex due to the economic blockade and difficult financial conditions arising from the loss of its major commercial and financial partners.1 Taken together, these elements resulted in the abrupt fall of the gross domestic product starting in 1990 whose decent only stopped in 1994, when the country achieved a small economic recovery of 0.7% in GNP. An upward trend in growth was maintained from that point onwards, but 1989 levels have still not been attained. This reactivation of the economy resulted from a number of reforms and 1 For more explanatory detail on this crisis, see Triana (2001).
1

domestic economic transformations that were put in place in order to mollify the effects of the crisis, adapt the economy to the new global conditions into which Cuba had to insert itself if it was to avoid collapse, and build the basis for future development (See Box 2).
These measures and transformations left their mark upon the socio-economic structure of the country. Acting in a very direct and rapid way, some of them modified the social structure in Cuba by stratifying it. The important ones include the following: a) redesign of the property regime, b) modification of the state’s role in the economy with the expansion of market mechanisms and the protection of strategic planning, c) enterprise reform with the modification in the system of payments and work incentives, d) restructuring of types of employment and sources of income, e) development of new economic sectors like tourism and biotechnology, f) legalization of foreign exchange holdings and remittances from overseas, and g) monetary duality in the economy (Espina, Moreno and Núñez, 2003:17).
During the crisis and the process of adjustment, different social actors have acted and made decisions in the areas of political economy, commercial, labor and even family life which have influenced the new patterns of income distribution. In turn, these transformations have produced inequality in the access to consumption, standards of living and seizing opportunities. They have also created or expanded social gaps as well as resulted in changes in the dynamics, forms and strategies of social mobility. Nowadays, we can observe a process that goes much beyond a simple social restratification.
The crisis and adjustment in Cuba, albeit less traumatic than in other countries due to the social commitment in the political economy, brought a set of problems that require urgent solution and greatly challenge the development strategy of the country (Togores, 2004:200). These include:
a) The impoverishment of vast sectors in the labor force; b) The materialization of a working elite; c) The appearance of living standards that are divorced from the fruits of work, with
the consequential loss in values created and nurtured in the past; d) The exclusion of important segments of the population from consumption in certain
markets, or at least the reduction in access to a very limited numbers of products; and,
e) Social restratification. As Ferriol (2003) summarizes,
“…Crisis and reform have been processes with differentiated impacts upon the the social groups (...) and it is those families who have succeeded in tapping into the activities generating foreign exchange that have benefited from the most opportunities. In general, family units used diverse strategies to stem the fall in their living standards and to achieve social integration with varying degrees of success depending upon their characteristics and potentialities. No doubt, the economic recovery has not reached everyone with the same magnitude. For some, the crisis lies in the past; for others, the crisis continues… (1).” Income Levels: Changes in their Distributive Tendency as an Operating Element of
Social Mobility Income levels are a very important element in the analysis of social mobility given their
widespread use across the globe as a referential parameter measuring inequality levels. These monetary resources determine household demand, consumption in the different markets and capacity to make use of the set of opportunities offered by a society which in the end operate to increase the material resources and well-being of the population. The changes in income levels produced in the diverse social groups may be utilized as referential parameters in the patterns of stratification due to their impact upon the remaining variables that constitute the social placement of individuals and their families. This is reason enough for this research study to use it as a central element in the analysis of socio-structural dynamics and in its inherent social mobility processes.
2
When the revolution triumphs, the existence of an enormous inequality in the distribution of wealth that was inherited from the previous regime2 is contradicted by the precepts offered in the new economic and social development project for the country, which seeks and intends to eliminate inequality and social injustice of the society. In this way, an ambitious social development project is launched upon new foundations. In it, human beings become the center of the problem with distributional equity as one of the main objectives to fulfill. For its achievement, important transformations were needed to eliminate the roots of inequality, particularly those related to the ownership of property and employment.
The magnitude of the changes is already apparent by 1959–1960. The income of the bourgeoisie decreased by 15% and the standards of living among the general population increased between 15% and 20% (Rodríguez, 1979: 148). Subsequent transformations in labor markets between 1960 and 1970 permitted the incorporation of close to one million persons into the formal labor force, something which meant from an economic viewpoint an increase of 58.5% in the labor force of the country with the attendant increment in salaries and their proportional contribution in the income structure of the population.3 These changes induce a new dynamic in national income which rose an average of 4.8% per year between 1958 and 1980. These figures are maintained in real terms because of the stability in prices that is achieved in the basic products (CEE, 1981:14). During the decade of the 1980s, the state sector absorbed 1.1 million new workers. The investment in education resulting in several thousand university graduates is thereby materialized with massive employment; a fact that negatively affected the levels of salaries. The funds dedicated for the payment of salaries, which during that decade was 71.7%, were devoted almost totally to cover the increase in new workers and pay the augmented salary scales (See Table 1).
Until 1989, income could be characterized by four fundamental aspects. First, income had primarily meant wages, which together with social security payments has represented an average of 87% of income during the period. Second, growth was based on the expansion in the labor force with the peculiarity that the material benefits have always been insufficient in relation to income levels.4 Third, differences among social groups were small and were derived from varying qualification and productivity levels5 so that their contribution to social inequality was small –this result was re-enforced by secondary redistribution of income that is produced at the margin of markets. Finally, the entrance to the highest income group depended upon acquired qualifications.
With wages becoming the fundamental source of income for the population, the transformations in the ownership regime of practically all the means of production caused these to become “(...) the central axis in the structuring and generation of legitimate inequalities (…) (Nerey, 2004:7).” “…The measures adopted to achieve equality produced the “waging (salarización)” of income... (Alonso 2003: 21).” In this manner, 95% the population in the workforce received their income from the state sector in 1989. The alterations in the labor force that took place based on the social ownership of the means of production caused great transformations in the social structure and income levels among the different groups. The state became the universal employer while becoming the main provider of professional training programs meant to provide access into the labor force for disadvantaged groups. The gaps between the extreme groups given by income levels were reduced in
2 According to some studies the population with the highest 10% in income concentrated 38.8% of the total, while the population with the lowest 20% in income only had 2.1% in 1953 (Brundenius and Zimbalist, 1989). 3 During the 1960s they constituted 71.6% of the household income on average, a number that was raised to 77% during the 1970s and to 75% during the 1980s. 4 This was due to three basis factors: a) the deficient response to the domestic production of consumption goods, b) the lack of financial resources to cover the supply deficit with the importation of goods and, c) insufficient provision of services. 5 “(...) The maximum theoretical difference possible was from 1 to 5( ...).” (Espina, Moreno and Núñez, 2003:33).
3
percentage levels to approach a value close to the average. To this may be added the policy that access to all social services are basically the same or proportionally equal for all social groups.6
Crisis and adjustment The onset in 1989 of the most severe economic crisis experienced by the island during the last
century marked a new phase in the changes and reconfigurations of the social structure. In this phase, income trends began to vary in their tendencies and resulting outcomes. We can detect a clear diminution of the state’s role in the economy as it cedes spaces to the private, cooperative and joint venture sectors, and the significant apparition of remittances and the receipt of foreign exchange as income sources.
Contrary to what happened in the rest of the variables constituting the population’s income, the decline in wages (15.6%) during the first four years in the 1990s generated a process that diminished the total income of the population.7 This tendency expresses the consequences of the paralysis and semi-paralysis of numerous enterprises where the bulk of the workers began to receive only 60% of their salaries on top of the cancellation of incentives and other forms of payments. These impacts could have been more severe if in the design of the economic adjustment program the maintenance of employment and salaries had not been preserved as priorities. In fact, the restructuring of employment and the gradual adjustment protecting workers through subsidies and relocation assistance to other areas of the economy succeeded in halting the unemployment rate and prevented deeper income losses. In contrast, the rest of the variables integrating income increased from 25% to 70% (see Box 1).
Real income fell at an even greater rate (75.2%) with an annual average drop of 24.3% during this period. This drop is confirmed along with the depression seen in the supply of goods and services which was practically reduced to two markets: the regulated market as the unique legal option and with extremely limited supply levels and the black market with its insufficient quantity and quality of products sold at prices that were inaccessible to the majority of the population (see Box 2).
In the period between 1994 and 2004, income sources became more diversified while levels recovered to some extent.8 This phenomenon was related to the changes in the structure of the labor market based on the changes that took place in ownership and employment regimes (see Table 2). The enlargement of private and cooperative employment opportunities had the most significant result seeing an increase of 251%9, a figure that is even more positive when viewed in light of the low level of positions created in the state sphere. This caused a significant displacement of income toward non-state market sources, placing private producers and intermediaries in an advantageous position. Another source that became important is given by “other income” with a 237.9% increase which included significant increases in pension payments, student benefits, and social security. These social assistance programs stemmed the reduction in nominal income caused by the rise in prices and aided low-income groups, particularly those with students pursuing higher-education. Although less significant in impact, salaries experienced an increase of 56% due primarily to the rise in the wages of workers in the service sectors and in the enterprises within the emerging and upgrading sectors of the economy.
During this period, the holding of foreign currency was de-penalized and, thus, remittances became a primary source for the increases seen in income levels. Workers in the tourism industry and 6 According to several studies, income distribution in Cuba qualified as equitable with a Gini coefficient of 0.25 in 1989. 7 Between 1989 and 1994, income levels are cumulatively decremented by 4.1%, which occurs at an average annual rate of 0.8%. 8 During the decade, it incremented by 114.6%, this in real terms means an increment of 315.4%, which occurred at an average annual rate of 7.9% and 15.3%, respectively. 9 Income levels for workers in the private sector increases in higher proportion than those in the cooperative sector and, thus, contributed to a greater extent in the resulting income rise. Income in the cooperative sector increases primarily due to the addition of new members arising from the creation of Basic Units of Cooperative Production (UBPC).
4

the foreign exchange-based employment networks generated after the July 1993 reforms also benefited from the liberalization of foreign exchange (legal or not). Even though the author has not gained access to numerical information, the foreign exchange rate that was established could become an indicative element of great importance of this assertion10 (see Table 3).
With respect to income levels and the impacts upon socio-structural mobility, the reforms can be separated into two phases. In the first phase, economic transformations occurred as a result of adjustment measures and manipulations in specific economic sectors (leading and emerging). These created disproportionate differences which stimulated a migration towards those with economic advantages and generated social differences heretofore invisible. The second phase attempted to redress these imbalances through several actions (increases in the basic salaries of state enterprises and retirement payments). Without knocking down the good intentions present in these measures, parallel actions were not executed to improve purchasing power. Thus, the effects of the first phase were rendered nil by the effects of the second.11 As a result, social mobility and differences did not budge from the changes already seen in the previous phase.
The trends in income levels during the period analyzed demonstrate that, in opposition to what happened in the phase previous to the crisis, the market has gained important spaces in the generation of income. Monetary income has increased its role in determining and creating living conditions and this has established new patterns in the processes of social differentiation on the basis of a predominant income-consumption model.
Transformations in the Structure and Distribution of Income During the period analyzed, salaries in the state sector diminished their formerly overwhelming
participation in the income of the population from 78% in 1989 to 50% in 2004. In contrast, salaries in the private sector increased from 5.3% to 15.6%, while the category of “other income” went from 16.7% to 34.3% (see Box 3). As Espina, Moreno and Núñez (2003) confirm“… the principal pillars in the socialist transition in Cuba (workers, intellectuals, executives and peasants), which formerly were articulated around state property and derived salaries with little differentiation, are now experimenting a high degree of heterogeneity coming from new ownership regimes …” (33).
These changes are largely the result of transformations within the labor markets distributing the labor force by type of property regime. Different dynamics are established according to the occupational sector to which a worker belongs, which are a key element in income differentiation and have turned into a primary motive driving workers into these sectors, which are for the most part outside the state.12 Tied to other measures, it has generated a strong social differentiation and changes in the patterns of social mobility13(see Box 3 and Table 2).
10 As an example, we can infer the increase in the income levels provided by foreign exchange through the increase of 18.3% in the sale of merchandise and services offered in foreign currency, which reached 627 million of dollars by 1996. In addition, the number of savings accounts in foreign currency also increased (Beruff, 1997). 11 The prices outside of the regulated market, which apply to a set of goods and services indispensable for subsistence, such as food stuffs, shoes and clothing, are high. 12 The sector outside the state includes: workers employed in joint ventures, cooperative workers employed in the agricultural sector, which includes the members of Agricultural Production Cooperatives (CPA) and the Basic Units of Cooperative Production (UBPC), as well as independent farmers. In addition, the non-state sector includes independent workers, artists, and transportation and furnished room service providers. 13 Social mobility is a process of individual and collective displacements up and down through a stratified socio-structural hierarchy in a given society and historical moment. It may be taken as a condensed expression of equality because it explains which groups (from which positions) have access to the most advantageous positions in the social hierarchy, and for which ones these are denied or made impossible to gain access to. It also measures the degree to which a society’s social policy creates conditions of ascending social mobility for the numerous social sectors. Social mobility offers a dynamic perspective of equity by permitting the
5

The widening in the spread of income levels becomes one of the most significant elements of differentiation of the period “…If in 1989 workers with varied income sources obtained an income which on the average was 35% higher than those receiving only salaries, this proportion increased to 500% during the crisis period and then decreased to 200% in 1999. This widening can be seen even within salaried workers. The average salaries in the exporting sectors such as tourism, for instance, doubled the average renumerations of those received in the non-exporting [employment] sectors... (Ferriol, 2003:3)”
As a result of the crisis and adjustment, the occupational structure changed dramatically, transferring an important number of state workers to the non-state sectors of the economy. Towards the end of the 1980s, the state sector provided 95% of the employment. This decreased to 76.2% by 2003. In the same year, the non-state sectors reach 23.8% of the economy after offering only 5% in 1989 (see Table 2). These transformation have multiple origins: a) in some cases these were determined by government policies, as was the case with the creation of the Basic Units of Cooperative Production (UBPC) which, using as basis the old state agricultural enterprises, transferred these workers to the cooperative sector; b) in state restructuring processes or enterprise reorganization , and, c) in personal decisions made by workers to transfer within or across sectors in search of better salaries and working conditions.
The changes in the labor market arising from new ownership and management relations created new possibilities which, for the most part, have been attractive to those seeking employment even if not all those seeking to insert themselves into these opportunities have succeeded. And achieving this insertion, or not, translates into being able to tap, or not, into the ascending currents of the process of restructuring of the social pyramid. To achieve this objective, the socio-demographic characteristics inherent to individuals and social groups have had a determinant weight in the restrictions to access and the social inequalities that generate inequity. These aspects will be touched upon later in this study.
Sources of Income and Their Differentiating Role on Social Structure Wages and other income Despite the transformations seen in the income structure, wages continue to be a very
important component for the majority of the population given the great proportion still employed in the state sector, particularly school-age minors and adolescents. The average nominal salary has had an ascending trend until it reached 284 pesos in 2004, a figure which doubles that existing in 1989. However, this nominal increase hardly compensates the inflationary impact upon the real salaries (purchasing power adjusted), which decreased by 27% between 1989 and 2004, going from 131 pesos to 96 pesos, even though the nominal salary growth was significant after 1999. Overall, real salaries increased 73 pesos in 6 years.
This gap is generated by multiple factors. On the one hand, the ascending behavior of prices which nullify a good portion of the desired effects from social policies geared to increment incomes. On the other hand, the lack of liberalization in salaries (unitary system with minimal variation) creates a situation where workers are dissatisfied with their work, something which cannot be remedied by incentive systems or by special payments which, in reality, cannot be made available to all state workers. Emerging from all this, wages can no longer satisfy all basic necessities not only for the worker himself or herself but also, as pointed out by Karl Marx, “the family’s means of living” (Marx, 1965:134) and those dependent upon it as their most important source of income are placed in a dire situation (see Graph 4).
observation of the socio-structural process in it’s inter and intra generational aspects, as well as the alterations experienced within a given period (Espina, 2005).
6
Several studies corroborate that, in the analyzed period, salaries on their own did not provide access to a basic consumption basket in goods and services even though it is an important source of income for the great majority of the families.14 Other evaluations15 estimated that the minimum salary levels needed for a worker to afford a basic food consumption basket was 432 pesos in 1995, 315 pesos in 1996 and 231 pesos in 1997. These results demonstrate the existence of a wide gap between average salaries and the necessary minimum levels16 (Nerey, 2000). Based on the same set of assumptions, for 1998, it was estimated that the proportion of the population receiving income levels incapable of affording them basic necessities with quality17 such as food, and using a basic nutrition basket worth 156 pesos per capita18, left at least 48.4% of the population at or below this limit(see Table 5). Other studies carried out in 2006, which include other indispensable goods and services besides food in the minimum consumption basket, corroborate that this period continues to present a deficit even though the average income levels of the population have been incremented dramatically through a set of policies augmenting salaries, pensions and social assistance (García and Anaya, 2006) (see Table 5).
The ongoing loss of relevance during this period of work and salaries as sources of income capable of meeting the basic necessities of the majority of the Cuban families have forced the activation of a social discipline designed to augment the scarce resources, monetary or otherwise, needed for subsistence. Field studies prove the formation of new social perceptions when people no longer feel that satisfying their necessities is contingent upon work, something which seriously distorts the social value of work (Días et. al., 2001).
Then again, the majority of the technical and professional workforce of the country is dependant on salaries. In previous periods, these segments were associated with the highest incomes and ascending social mobility. From the start of the crisis, they have seen a deterioration in their purchasing power and a consequent worsening in their living standards, and levels of personal satisfaction and stability. Trying to improve their position, they have migrated to other sectors and other countries. Often, those migrations are achieved at the very high cost mortgaging the social and personal investments that have been made to produce certain skill levels. And these are only some of the techniques employed by the population as they search for ways to increase their incomes.
The loss in the value of money and the exhaustion of financial reserves have motivated the generation of innumerable alternative strategies to earn enough money to cover the most basic necessities by households. Among these we find: the centralization of household resources, the search for employment with better salaries or with access to various incentives and tips, the incorporation of more household members into the labor force which may degrade the degree of scholastic achievement or professional preparation, the emigration to foreign countries as well as the provincial capitals, and actions tied to illegal activities. The latter refer to actions tied to the purchase of goods in the black
14 This basket includes a list of goods and services which go beyond the regulated market and foodstuffs. 15 For that a dependency rate was generated indicating how many people on the average depend upon a single salaried worker. It was calculated as the proportion between the EAP, and the summation of the senior citizens without pensions, the population not economically active, and minors less than 17 years of age. 16 On this subject, see Togores, Viviana. "Cuba: efectos sociales de la crisis y el ajuste económico de los 90" and “Algunas consideraciones acerca del acceso al consumo en los noventa: factores que los determinan”. Centro de Estudios de la Economía Cubana, 1997. 17 “Physical survival and personal autonomy are the preconditions of any individual action in all cultures and, hence, constitute one the most basic human necessities: those which must be satisfied to some degree before the actors may participate in their way of life striving to reach other valuable goals.” Later, it is made clear that “survival is not sufficient and that what constitutes the basic human necessity is physical health” (Doyal L. and Gough, I. 1991:54). 18 On this subject, see Togores, Viviana. “Algunas consideraciones acerca del acceso al consumo en los noventa: factores que los determinan” Centro de Estudios de la Economía Cubana, 1998.
7

market, as well as the robbery and sale of state resources and illegal personal employment. The list is endless (Días et. al., 2001:120- 132).
While some of these actions search for upward mobility in the social pyramid and others for mere survival, all such practices in the end affect productive efficiency and social conduct. The consequences, in turn, must be confronted not only in their visible effects (the actions) but also in the elimination of causes (the value of work and its degree of meaningfulness to the families). In this sense, different incentive systems have been put in place which, although far from resolving the situation, seek to stimulate better productive performance in certain sectors. In 2000, for example, nearly two million workers were beneficiaries of the incentive systems which elevated average monthly salaries around 100 pesos19 (Rodríguez, 2000). Positive changes along the same lines are occurring in the enterprise sector where a wider degree of prerogative is afforded to senior management in regards to the use of funds to salaries and in the determination of contents and salary groups of the employees that they employ. These flexibilities will allow managers to adequate job specifications and pay according to the contribution and/or importance of labor performed.20 Lastly, in 2006, the salaries of state workers were incremented according to the process providing guidelines for such adjustments. The qualifications needs for the functions in each state entity were likewise adjusted.
Although these actions have improved incomes and, as a consequence, expanded the levels of consumption and satisfaction of necessities among the population, they have not resolved the deterioration found in the purchasing power of incomes. Besides, some of these changes create a wider dispersion in income, however just, in the salaries which produce further internal differentiation within each group. As Nerey (2000) concludes “(...) although significant, these advances are insufficient without a doubt, first due to their limited extension among our enterprises; secondly, because they reproduce to some extent certain vices such as centralization and verticalism; and thirdly, because social structure has experienced deep regressive changes which the advances, in their present form, cannot contribute in redressing… .”
Income in the non-state sector During the 1990s, the state sector stops providing certain services and producing certain
products using an excess of workers. This validates the search for alternative non-state means to partially solve the production and employment problems. A process is thereby started seeking important transformations in the generation of employment as well as in the supply and distribution of income (see Graph 5).
Income of the cooperative and private sectors Income in the cooperative and private sectors increased its participation within the total
income from 5.3% to 15.6% between 1989 and 2004. This growth has been fostered by the measures implemented during this period with respect to employment options. The policies include the establishment of UBPCs, the widening of self-employment, the delivery of land for utilization (as opposed to private property), and others which have opened up new income earning options. In the macroeconomic context of the crisis, these measures have had collateral effects deleterious to income distribution (see Graph 6 and 7).
19 … “Real income of the salaried workers was increased by 3.4% starting in 1993, primarily through the application of special payment systems associated with activities that generated foreign exchange, the increase in salaries for teachers, doctors and other social sectors (…); by 2002, thousands of salaried workers were receiving labor incentives in the form of foreign currency payments”… (Ferriol, 2003:3). 20 This process occurs within a salary framework that is approved in a centralized way.
8

Income of the cooperative and private sectors in agriculture With the creation of UBPCs, a significant number of state agricultural workers were
migrated to the cooperative sector, which provoked a rise of 391.3% in employment for the entire period. Nonetheless, a corresponding increase in income was not seen or, to be more precise, not to the degree that was anticipated given the number of workers and the extensions of land that were transferred. What could be explanation for this contradictory state of affairs, particularly if we compare the results with the income generated by other producers in the same sector? The explanation is that, even though the market for agricultural products does not discriminate against any producer, in the case of UBPC, their participation in it is limited by their commitments with the state to first and foremost fulfill commitments to supply the regulated and subsidized market. This market affords UBPC farmers inferior income levels compared to those possible in the free market. Hence, although they retain equal rights in accessing the agricultural market to sell their production, in practice, they face restrictions and limitations in accessing this market while other producers have better conditions to make use of the opportunities. All these are elements in the differentiation at the inter and intra-group level (see Graph 8).
During the first five years in the existence of this market, the private sector dominated over the remainder of competitors. This situation only began to change starting in 2000 with the opening of a network of so-called topado markets21 and other forms of state commercialization. Even so, sales leadership has remained in the private sector in terms of quality, variety and in the sale of meats. This (advantageous) situation guarantees private farmers an important part of the income if the foodstuffs market. They accumulate nearly 50%22 of the income in this sector despite their reduced number in proportion to those affiliated to the UBPC. This is clearly seen when comparing the income trends for both groups (see Graph 9). Estimates of the average annual income per private farmer point to 1500 pesos per month (García A, 2003).23 This number is five times as large as the rest of the participants in this sector which shows, in addition, the differentiated behavior by activity and geographical zone (see Graph 10).
Income in the private sector outside of agriculture This sector is yet another that has experienced a significant increase in income in national
currency. According to the income and expenditures balance of the population, this segment almost doubled its participation within the total income in the private sector, increasing from 16% to 30% between 1990 and 2004. Within this group, we must mention “self-employment (trabajo por cuenta propia)” which up until 2004 has increased by 562% in the number of employed persons, and became an important source of employment for those who had been unleashed from other positions. As an example, we see that in 1997 these displaced workers represented 60.3% of the total employed in this sub-sector. Other workers attracted to the sub-sector were retirees and homemakers who in that year were 23.5% and 26.3%, respectively24 (see Graph 11). This sub-sector was also utilized by workers who wanted to augment their incomes. A poll taken in Havana indicated that nearly 90% of these people had broken their links with the state and only 10%
21 In this market, products have a pre-established top price. 22 This refers to the income that is reported in the Balance of Income and Expenditures of the population. 23 This calculation was made using the number of farmers reported by the Asociación Nacional de Agricultores Pequeños (365,000) and the annual income trends for the sector offered by ONE on the basis of its relationship with the state. The estimated average annual income per farmer was 4,300 pesos per year, equivalent to roughly 360 pesos per month. To this figure we must add the estimated income derived from sales in the agricultural market which, estimating an average profitability rate of 30%, renders 4,650 pesos in average annual income or 400 pesos per month. Considering that this segment maintains the least amount of contractual relations with the state, their dealings are primarily with the private sector. This led her to believe that the figure was in the order of 1,500 pesos per capita each month. 24 For more information, consult Togores Viviana in “El Trabajo por Cuenta Propia. Desarrollo y Peculiaridades en la Economía Cubana”. Boletín del Centro de Estudios de la Economía Cubana, 1996.
9
showed a desired to re-establish them despite the improvement in the national economy. The research also shows the high concentration in this sub-sector in five provinces (more than 60%), as well as in the most lucrative activities (50%) (Hernández A, 2006).
According to tax data provided by the Oficina Nacional de Administración Tributaria (ONAT), the rapid increase demonstrated in this sub-sector starting in 2000 can be explained by the number of people renting homes and rooms, whose taxable contributions25 increased nearly 10% between 2000 and 2001, as well as artists and intellectuals, whose contributions increased over 15%. The property renters with the greater incomes are not distributed homogeneously throughout the country but, rather, concentrated in provinces such as Ciudad de La Habana, Cienfuegos, Sancti Spiritus, Santiago de Cuba, Guantanamo, Pinar del Rio and Isla de la Juventud, which represent 46.6% of the provinces in the country. This means that a little over half the country has not been able to seize this type of opportunity and the advantages of the benefits thereby generated. This concentration is determined by the existence of historical and tourist attractions in those provinces which, in turn, means that the distribution within also lacks homogeneity and the activities tend to be conglomerated in certain municipal zones. As a result, workers migrate among the different zones towards those offering the most advantageous set of services for the informal work market (such as domestic, security and maintenance services) in order to capture some of the dividends offered by this sector. It is interesting that Matanzas, where one of the most important tourist zones of the country is located (Varadero Beach), is one of the provinces with the least amount of rental activity. In this case, statistics hide a very different reality. Inferring by observation and expert analysis, there exists a black rental market which is not taxed and another which, albeit legal, under reports their income. This is due to the specific restrictions and special regulations which operate in this territory (see Graph 12).
In the case of artists and intellectuals, there is an increase not only in their income but in the number of taxpayers. As is the case in other groups already examined, they are concentrated in certain territories, such as La Habana and Las Tunas, Ciego de Ávila and Isla de la Juventud, (although the last two do not show nearly as high concentrations). It is interesting that in Havana’s case, the majority of writers, sculptors and musicians appear as taxpayers for this province and not for the City of Havana. This is due to their progressive migration to the better housing and more open spaces outside of the populous city26 (see Graph 13).
In summary, the income of self-employed workers is much higher than that of salaried workers and shows no interior homogeneousness whatsoever. Some activities within this segment have especially high incomes determined by their own characteristics; for instance, owners of small restaurants and private farmers and intermediaries in the agricultural market; all of whom, by virtue of the dynamic situation and poor functioning of the economy, have succeeded in garnering large sums of money. All of this has contributed to the enlargement of illegitimate social inequalities and the polarization of wealth, generating a process of social restratification with deleterious effects for the now inverted social pyramid.
Non-labor Income (remittances, inheritances, wire transfers) Among income sources not due to labor, remittances from abroad represent a very important
factor due to the effects that they can have upon the quantity of money in the country. From the time that the holding of foreign currency became de-penalized in 1993, and despite all the restrictions imposed by the United States government, remittances have gained a high ranking as a government revenue source as well as for the population. In economic terms, they have become the country’s third largest source of foreign exchange, only surpassed by exports and tourism. Remittances are also an unquestionable source of monetary support in households for their consumption of goods and services (see Graph 14).
25 This is measured in equivalent dollars. 26 This finding is derived from the author’s research on this topic.
10

Due to the characteristics of the Cuban economy,27 remittances represent a newfound source of foreign exchange for the state which captures them through the foreign exchange markets and the network of currency exchange stores (CADECA). All of these form redistribution networks which under the conditions mentioned before multiply the impact of remittances in the stratification of consumption. Some studies estimate the effect of remittances upon certain elements related to household consumption and upon consumption itself (Sánchez Egozcue, 2006). They demonstrate that historical consumption patterns have more weight upon household consumption than economic growth and that the effect of remittances doubles household consumption. In the case of imports (as one of the determinant elements of consumption in Cuba), the inertia factor built into the imports of the previous period M (t-1) is the most important for current economic growth and its effect increases slightly when remittances are considered. This evidence implies that recipients of remittances have important advantages over those who receive none.
The existence of a domestic market in foreign currency and relatively protected markets that operate and sustain themselves on the basis of remittance flows have afforded the government an opportunity to manage the costs of adjustment in an improved fashion. However, remittances have also brought forth a set of negative consequences in other spheres of social life such as, for instance, certain types of exclusion and social differentiation as well as the deterioration of the values and work ethic created in periods prior to the crisis.
The quantity of remittances cannot be determined exactly because the bulk of them do not enter the country through banking intermediaries. The estimates put forward in the literature show the existence of differences conditioned not only by “the informational difficulties associated with estimating the phenomenon (…) but also by the adoption of different assumptions which are not necessarily well articulated (Monreal, 2003: 90).” Thus, the trajectories followed by other indicators such as, for example, the foreign currency held by the population and its use in foreign exchange markets and in the Foreign Currency Recuperation Stores (Tiendas de Recuperación de Divisas (TRD)), are commonly employed as referential variables when studies assert the ascendant behavior of remittances. According to the Economic Commission for Latin America (ECLAC), remittances reached a level of around 3 billion dollars between 1989 and 1996 (ECLAC, 1997). Other studies estimate these remittances to be in the order of 300 million and 1.1 billion of dollars annually (see Table 6).
At the same time, other sources of foreign exchange in addition to remittances also exist by way of services for foreign and national tourists whether in state installations (tips) or in self-employed activities. These flows also increase the purchasing power of the population and contribute to the increase and circulation or redistribution of such benefits. Research to determine the quantity of foreign currency existing in the country concluded that, by the end of 1994, there were around 310 to 510 million dollars in circulation. In addition, this same study estimated that remittances comprised 75% of the domestic foreign currency market. Such status was maintained in the projections for 1996 and 1998, although in these years the income derived from tourism (tips, rentals and contractual services), from Cuban personnel working abroad (who send their earnings back to their families) and the increment in special incentive forms became more significant. Nonetheless, these income earning activities did not imply essential differences with the estimates made in 1994 (Marquetti: 2000).One estimate of the foreign exchange generated from tourist expenditures in private lodgings (from a total of more than 90,000 tourists in 1998) determined that more than fifty million dollars had entered just for rental and collateral services.28 At the same time, the income generated from tips alone measured between five and ten million (see Table 10).
The figures in Table 10 also take into account the increase in bank accounts held in foreign currency as well as the reserve margins which are fixed spontaneously by the same currency
27 In an economy where the state is the main protagonist in the economic process, one works on the basis of central planning which places a priority on social guarantees and the existence of markets with regulated prices and subsidized products. Then again, a dual monetary system and market segmentation also exist. 28 This explains in part why it was decided to issue a special decree to regulate room rentals for these ends.
11
holders. This explains in some measure the growth experienced in the income levels reported in this market segment. This becomes even more relevant when it is realized that 3.8% of the GNP is generated in this market.
This potential liquidity for the internal market enters in the circular movement of money from the demand side not from the productive process. As a consequence, its return to the market of goods and services must take an extra amount of time influenced by the movement of inflation rates. It is important to underscore that this inflation rate, both the share generated by the domestic economy and the foreign one, impacts the amount of reinvestment in resources that are possible and, consequently, the purchasing and consumption capacity of the population.
Some official sources estimate that between 30% and 60% of the population hold a certain amount of foreign currency. But even if the number of people with access to foreign currency or convertible pesos has increased, this population segment is not homogeneous and shows a high degree of concentration and polarization in terms of geographical zones and the means to gain access to this resource. There exists another population segment which lacks access to foreign exchange sources or must exchange their salary via the CADECAS at elevated exchange rates.29 Studies in the City of Havana demonstrate the great polarization that exists among different population groups in the access to income denominated in foreign currency (Añé, Ferriol and Ramos, 2004: 54). Household surveys show that the highest income deciles (8th, 9th and 10th) concentrate 59.1% of those receiving remittances, 83.7 of those receiving foreign currency from travel abroad, 63% of those receiving foreign currencies as remuneration for labor, 78% of those receiving tips, and 57% of those receiving gifts in foreign currency from friends. At the same time, only 19.3% of those who receive remittances, 4.3% of those receiving foreign currency from travel abroad, 8% of those receiving foreign currencies as remuneration for labor, and 18.2% of those receiving gifts in foreign currency from friends are in the 1st, 2nd and 3rd deciles (see Graph 19).
Thus, for the low-income groups, access to foreign currency is achieved by means of purchasing them in the foreign exchange market with the corresponding costs that are foregone for having to purchase foreign currency at current rates.30 This rate, then, becomes an element of great importance in the creation of inequalities and gaps among those who own or not own foreign currencies because it multiplies or diminishes monetary resources, access to consumption, and establishes social differentiation (see Graph 15).
From a geographical viewpoint, we have mentioned the unequal income distribution that exists among those employed in the private non-agricultural sector as well as the polarization in predetermined zones. To this we can add other arguments such the location of the CADECAS and the concentration of tourist installations (see Graph 16).
Monetary circulation, liquidity and income concentration The dual circulation of currency is an element which did not exist prior to the 1990s. The
legalization of foreign currency circulation in July of 1993 imposed a new dynamic and behavioral pattern in the income of the population, determining a good deal of its distribution. Before the 1990s, there was a single issuer and a single receptor of money. Today, the issuer continues to be 29 This elevated rate reduces the attractiveness of carrying out these transactions and further complicates estimation of foreign currency holding. 30 The national currency has appreciated in the foreign exchange market, going from 78 pesos to the dollar in 1993 to 19.2 in 1996 (lowest figure). This rate has oscillated around a flotation band between 20 and 26 pesos to the dollar, and has showed certain stability around 24 pesos to the dollar in the last few years. This stability, which occurs at the margin of supply and demand correlations for good and services and slow economic growth in the last years can be explained by the influx of remittances received by the population plus payments made by the state in CUC as a stimulus to various sectors, have been able to maintain a close correlation with monetary supply in both currencies, thus avoiding the depreciation of the exchange rate. It is worth mentioning that in the informal exchange rate market in Cuba there is the paradoxical situation of a market exchange rate below the one offered by the state.
12

the state. However, monetary duality and the peculiar characteristics found in how foreign currencies enter the circular monetary flow limit the state’s control over these flows and how they are disseminated among the population. This situation provokes movements in the income structure and readjustments in its distribution with a concentration of liquidity found in the hands of certain population segments.
The measures adopted to decrease liquidity had a recessionary character in the domestic money supply, thereby contributing to the reduction of this indicator by around 20% in two years’ time. Among the consequences of this contraction were the increase in the prices of non-essential products, the elimination of free services and the increase in tariffs for certain services. However, in the remainder of the decade, money with high expansive power did not demonstrate evidence of inflationary pressures and did not undergo significant changes. Accordingly, its quantity was maintained in a stable and moderate manner.
By the beginning of the new millennium and despite having maintained a certain stability in the exchange rate, monetary liquidity again increased due to the strong pressures on circulating cash. This is evidence of the exhaustion of the measures taken to keep it under control or at least at the same levels of the 1990s. Such quantity is qualified by some specialists as very close to the one truly required by the economy, under present conditions, for the viability of all transactions. In regards to savings accounts, the fundamental aspect is not their size but their degree of concentration given that they do not show any appreciable quantitative changes (Nerey, 2003).31
The balances in banking accounts have undergone a very strong process of concentration during the years of the crisis. In fact, between 1994 and 2002, it is possible to see that while the proportion of accounts with larger balances has been maintained at around 14% of the total number of accounts, their total balance concentrated in them is ever larger, going from 77.8% to 86%. This is indicative of the wide gap that is opening up among savers and which, in turn, could reflect the behavior or pattern that is taking place with respect to the distribution of income of the population. These tendencies explain an important type of inequality given the ability to make use of opportunities. Until a decade ago, this ability did not depend on income differences which, in fact, exist in all social systems, but on the just social and economic opportunities from which individuals departed (see Table 9 and Graph 17). The differences in income levels have turned into a break for some and opportunities for others.
One example is that, in Cuba, education as an essential pillar in the ability to make use of opportunities had not depended on the economic position of the individual and for this very reason social policy had been designed using instruments where education was not associated with income levels. However, during the crisis period, these two have co-existed, at least in tertiary education, and income has determined to some extent the utilization of this service. In this way, the connection between income and access to equality have resurfaced, thus reducing the effects that social policies can generate on equity due to it being “one of the indirect mechanisms of social restructuration and mobility” (Espina, Moreno and Núñez, 2003:10).
Given the meritocratic character of higher education, those who aspire to it must pass rigorous entrance exams for which an extra amount of preparation is needed. There are not equality of opportunities available for everyone as the preparation to enter higher education requires not only individual dedication (hours of study, personal effort), but income to pay the “repasadores” (tutors) which in the informal market can charge about 10 pesos for each class. In this case, personal effort is insufficient if the family cannot cover the extra costs as well. For this reason, by the end of the 1990s, certain affirmative action programs were created to benefit disadvantaged groups in order to help bridge the differences in the ability to utilize this universal right. In sum, Cuban society has seen, during this period, signs of a relationship between income and access to universal provided
31 The measures that were taken reduced the amount of cash in circulation, but not savings levels. The latter represent 60% of the accumulated liquidity.
13
public goods. People with lower income levels cannot afford certain informal costs and thus, benefit less from such opportunities. This aspect is intertwined with territorial and racial differences.32
Other Determinant Factors of Inequality The distribution of income in the population is made up of several factors including
revenues,33 but also others that are equally important which are related to the socio-demographic characteristics of the individual and the group (race, gender, size and composition of households, number of working individuals and their dependents). All together, these elements will determine the distribution of income in the population. Statistics in Cuba have lacked, at least insofar as publicly available information is concerned, data on income distribution by deciles or quintiles that would permit a sizing up of the distance among different social strata.
This vacuum has prompted a number of studies to make their own estimations. Some of them are collected in this work (see Table 10). One of these studies, which is based on a qualitative methodology utilizes small sample surveys and in-depth interviews, has revealed a substantial increase in the differences or distances among the highest and lowest income levels in Havana that oscillate between 17.4 and 27.8 times. These figures cannot be generalized for the entire country, but they represent interesting arguments which, when compared to those obtained in earlier periods, allow the estimation of the inequality and inequity that have been generated (Espina, 2003: 11-12) (see Table 11).
Other studies confirm the incidence of the socio-demographic factors already mentioned for the city of Havana (Ferriol, 2003:125). The population in the lowest decile of income tends to live in households with the greater number of members and particularly of children. These households also have a distinctive way of insertion into the labor market, generally occupying the positions with the lowest salaries and pensions. They also tend to have the lowest proportion of working individuals which does not imply that they lack working-age members. The fact that this group receives the lowest pensions represents an indication, to my way of thinking, that the problem is not new, that this type of insertion into the labor market has been their lot during their entire lives and has transcended from generation to generation even when the economic context was more favorable. Thus, inter-generational barriers to social mobility have been reproduced despite the fact that the ability to seize opportunities for advancement has been fairly equitable. When the context has turned more adverse, conditions have prevented these groups from adjusting to the new economic situation and have pushed these groups again into forming part of those who are deemed to be disadvantaged.
Disadvantages in garnering income Among the factors important for analysis, we must highlight race, gender, educational
attainment, zone of residence, and inheritance or capital acquired before the crisis. These characteristics are associated with differentiating behaviors not only from the social but also from the labor market perspective. This explains its value in the analysis of differentiation or inequity in the garnering of income which are generated from the ability to enter into certain work modalities that provide the best advantages, as well as in the research of the processes of socio-structural mobility that surface during economic transformations. Although we cannot explore these topics in depth in this particular research study, it is important to point out that, despite four decades of social 32 Some studies which span different moments in the phase analyzed here have detected the existence of gaps (Domínguez, 1996; Tristá and Iñigo, 1999; and Morales, 2004). With respect to race, Morales talks about the whitening that has occurred in the university. With respect to territory, the studies of Domínguez, and Tristá and Iñigo refer to the different roles that have turned territory into a marker of inequality in the educational levels reached by the students. 33 The income garnered by the population originates from various sources, including wire transfers, inheritances, remittances, farmer incomes, credits, social assistance, payments, salaries and social security, with the latter two being the most important for the Cuban population.
14

development activities designed to eliminate discrimination and differentiation, particularly in terms of race, gender and territory, a number of studies have detected the continued existence of characteristics and conditions that limit the garnering of income and the ability to gain insertion into the ascending social mobility currents. On top of social prejudices, these characteristics and conditions have worsened the situation of certain groups within the social structure, even more so after the crisis and the reform process that has been implemented.
If we consider that the Gini coefficient in 1989 was 0.25 and that during the crisis it reached 0.38, we can posit that, despite the growing gap, Cuban society is fairly egalitarian. Notwithstanding, we can detect important differences within each group and population segment. One of them is ethnic composition of the workers in each type of occupation. In 1995, whites were amply represented in all types of occupations, something rather normal given that they represent the majority of the Cuban population. On the other hand, black men work fundamentally in the spheres of construction, transport or communication, while black women work in the spheres of agriculture, transport and communication. All of these sectors provide the worst income levels (see Table 12).34
In 2001, the Household Survey for Havana showed that the 1st and 2nd income deciles (the lowest income groups) were disproportionately composed of black and mestizo families. In these deciles, 36% and 29% of the families, respectively, had less than 9 years of schooling on average. In contrast, approximately 68% of the families in the 9th decile (containing the highest income groups) were white, and only 18% of households had less than 9 years of schooling on average (Añé, Ferriol and Ramos, 2004).These data prove the presence of blacks in disadvantageous economic conditions due to the inequalities in the ability to gain access to better work opportunities. Evidently, belonging to a given race and having a certain number of years in schooling are weighty considerations which not only determine the insertion of individuals into the labor market, but also exacerbate the limitations caused by other factors and thus widening existing disadvantages. All of this creates a vicious circle from which it is difficult to extricate oneself. The relationship between low household incomes, access to opportunities and school attainment causes one to wonder about the “egalitarian effect for the seizing of opportunities” which the educational system is expected to guarantee.
From the perspective of gender, between 1992 and 2004, the proportions of women were halved in administrative positions and there was a corresponding increase in technical positions with as much as 40% of the total number of employed women. Although there has been a small increase (2%) during this period in the case of female executives, it is still insufficient as they are only 6.9% of the total number of employed women, particularly if one considers their high levels of education and technical preparation (see Graphs 18 and 19). In addition, horizontal and vertical segregation are present in the incorporation of women to salaried positions. When gender is analyzed along with occupation type, horizontal segregation can be seen in the non-homogeneous concentration in technical occupations, where women are a majority of employees in the sector. Vertical segregation is clear in the relatively small share of women in executive positions, where a sector typically dominated by men. To this we must add that some of the spaces gained with a lot of effort and preparation suffered a severe setback during the worst years of the crisis. This resulted from the fact that women occupied a significant portion of the most vulnerable positions in services, industries and other sectors that were the most affected by the lack of raw and energetic resources. Such situation was rapidly reflected in the increase in the number of homemakers (positions which imply a descending movement) and the unemployed. And the consequences, of course, are also reflected in the household income levels and the self-esteem of the people involved (see Graph 20).
By the mid 1990s, the unemployment rate for women reached 12% while they represented 28.7% of the total personnel available. Of these 63% were white and 19% were mestizas (Catasús, Valle and San Marfil, 2000). Between 1997 and 1998, women represented 45% of the personnel that were “rationalized” (Echevarría León, 2004:153). This placed them in a situation of greater 34 For greater detail, see Catasús, Valle and San Marfil (2000).
15
vulnerability, economic disadvantage and a lower position in the social structure. Besides, the raw economic reality forced a reorganization in the family life in order to compensate for the losses in income as women increased the number of hours of “invisible” work with the attendant high costs to their social insertion (Días et. al., 2001). After 1997, the process reincorporating women into the labor market becomes rather apparent. The unemployment rate for women decreased and by the end of 2004 reached 2.2 %. However, we can still find certain disadvantages in this reinsertion process by gender. For instance, of the 29,808 positions offered during the first year of employment growth in the 1990s, only 20.4% (6,079) were secured by women; and of the 2,123 single mothers that applied for jobs, only 6.4% were actually placed. Still, certain advances can be seen by the end of the decade since 44% of the permanent positions created were destined for the female labor force. Much progress remains to be made given that the number of registered homemakers remains close to the levels reached during the worst years of the crisis (see Graph 20).
The state civil sector has been the largest contributor to the employment of women. However, the increase of self-employment in the non-state sector has permitted women to generate income and stay in the workforce even when the statistics miss their presence.35 If one considers that self-employment is a phenomenon dominated by men and that a significant number of the activities where men are registered have been classified by society as being “typically done by women” (for instance, cooking), it is probable then that behind many of the activities executed in this sector are done by women despite the fact that it is men who obtain the licenses. This indicates that the number of women who remain occupationally inactive is much lower and the concern, instead, should be the increasing precariousness found in work performed by females.36
Final considerations The elements described in this article have attempted to offer a wider and clearer vision of
the transformation and increasing complexities in the new social structure that have taken place and to explain the resulting changing social mobility patterns. As Nerey (2004) explains, “new emerging groups are competing with traditional elites in the distribution of wealth and these have resulted in the imposition of a new structural pattern based upon an informal “remercantilization” in contrast to the traditional legitimate mechanisms of resource allocations.” The crisis and readjustment process have altered the landscape and the social mobility channels that were constructed in previous decades. The widening of the role of the market in the access to well-being marks an inflection point in the restructuring processes of socio-structural mobility in which social policies that create spaces of equality and income levels continue to both contribute to the correction of vast differences.
Bibliography Alonso Tejada, Aurelio (2003). “Lidiar con la Pobreza en el Caribe Hispano: En Busca de Claves Efectivas”. Paper presented at the workshop “Poverty and social policy in Cuba: Addressing the Challenges of Social and Economic Change” with the David Rockefeller Center for Latin American Studies, Harvard. E.E.U.U.
35 Between 1994 and 1996, for example, women represented 27% of the workers in this modality, and from these 70% were homemakers before opting for this type of employment. By the following decade, the female representation moves between 23% and 26%. 36 According to international parameters calculated by the OIT, specialists of the Centro de Estudios Laborales del Trabajo have found that for each independent worker another 3.5 are not registered, some of whom may be relative acting as helpers.
16
Añé Lia, Ferriol Angela and Ramos Maribel (2004) “Reforma económica y Población en riesgo de Ciudad de la Habana”. Informe de Investigación. Días Marelen et. al. (2001). “Familia y Cambios Socioeconómicos a las Puertas del Nuevo Milenio”.Informe de Investigación del Departamento de Estudios sobre Familia. Fondos Bibliográficos del Centro de Investigaciones Psicológicas y Sociológicas (CIPS). Doyal L. and Gough I. (1991) “A Theory of Human Need”. MacMillan, Londres. Echevarría, Dayma (2004) “Mujer Empleo y Dirección en Cuba: Algo más que estadísticas.”. En “15 años del Centro de Estudios de la Economía Cubana.” Editorial Félix Varela. Echevarría Dayma, Pérez Isarelis, and Togores Viviana (2006) “La educación superior en Cuba como vía de empoderamiento: un camino en desarrollo”. Caso de estudio elaborado para el Proyecto Alfa “Empoderamiento Femenino”y presentado en el Taller final en Enero 2006. Torino. Italia Espina Prieto Mayra Paula, Martín Posada, Lucy and Lilian Núñez Moreno (2003) “Reajuste Económico y Cambios Socioestructurales”.En “los Cambios en las Estructuras Socioclasistas”. Colectivo de autores. Compilador Manuel Menéndez Díaz. Colección Sociología. Editorial Ciencias Sociales. La Habana Catasús, Valle y San Marfil, 2000) Comité Estatal de Estadísticas (CEE) (1981). “Cuba:desarrollo económico y social durante el período 1958-1980”. La Habana. Diciembre 1981. ______(1989) Anuario Estadísticos de Cuba Ferriol Muruaga, Ángela (1997), “Cuba: situación social y transformaciones en la política social”, en Cuba: investigación económica, Año 3, No. 1, Enero-Marzo. ______ (2000) “Apertura externa, mercado laboral y política socia”l, en Cuba: investigación económica, Año 6, No. 1, Enero-Marzo. (2000). ______ (2001) “El modelo social cubano: una aproximación a tres temáticas en debate”, en Cuba: investigación económica, Año 7, No. 1, Enero-Marzo (2001). ______ (2003) “Acercamientos al Estudio de la Pobreza en Cuba” Articulo del taller “Poverty and social policy in Cuba: Addressing the Challenges of Social and Economic Change” en edición para publicación con el David Rockefeller Centrer on Latin American Studies, Harvard. E.E.U.U. García A, Anaya B. (2006) “Política Social en Cuba, nuevo enfoque y Programas recientes”. Ponencia presentada en el Seminario del Centro de Estudios de la Economía Cubana. Hernández, Aymara (2006) “Estado y Sector Privado en Cuba. Políticas, relaciones y conflictos de un manejo restrictivo”. Ponencia presentada en Taller internacional CIPS y Encuentro Pre- ALAS del Caribe. Ciudad de la Habana. Cuba. (23 al 25 de Octubre 2006) Marx, Carlos (1965) “El Capital” Tomo I. Ediciones Venceremos, La Habana.
17
______ (1975) “Contribución a la Crítica de la Economía Política”. Editorial Ciencias Sociales. La Habana. Cuba. Marquetti Nodarse, Hiram (1996) “Cuba: El desempeño del sector industrial en el periodo 1990 – 1995”. Material inédito del Centro de Estudios de la Economía Cubana. Ciudad de la Habana. Enero /1996. Monreal Pedro. (2003) “Migraciones y remesas familiares: Veinte hipótesis sobre el caso de Cuba”. Revista Economía y Desarrollo. Edición Especial. Año XXXIII. Volumen 134. Nerey Obregón Boris (2004) “Empleo, Seguro Social y los Mercados de Trabajo”. (Paper) Poverty and Social Policy in Cuba: Addressing the Challenges of Social and Economic Change. Part II. La Habana, Cuba. 01/2004 Rodríguez García, José Luís (1979) “Política Económica de la Revolución Cubana (19590-1960)”. En Revista Economía y Desarrollo No.54, La Habana. ______ (1990), “Estrategia de desarrollo económico en Cuba”, Editorial Ciencias Sociales. ______ (1996) “Informe sobre los resultados económicos de 1996”. Periódico Granma 26/12/1996. Cuba. ______ (1996), Informe sobre el plan económico y social para 1997. Granma, La Habana, 27 de diciembre. ______ (1998), Informe sobre los resultados económicos de 1998 y el Plan Económico y Social para 1999, Granma, La Habana, 23 de diciembre. ______ (2000) “Informe sobre los resultados económicos del 2000 y el plan económico y social para el 2001”, en periódico Granma, La Habana, 23 de diciembre 2000. Rodriguez et al. (1999) “Relaciones raciales en la esfera laboral”. Informe de investigación . Fondos del Centro de Antropología. CITMA. Sánchez Egozcue, Jorge Mario (1998), “Cuba, inflación y estabilización”, Ponencia presentada al XXI Congreso de LASA celebrado en Chicago, Illinois. ______ (2006) “Remesas y Consumo en Cuba”. Manuscrito. Sánchez Egozcue, Jorge Mario and Togores González Viviana. (2006) “Efectos de las remesas sobre el consumo y los procesos de diferenciación en la Sociedad Cubana” Ponencia presentada al Taller Internacional CIPS y Encuentro Pre- ALAS del Caribe. . 23 -25 Octubre 2006.La Habana. Cuba. Triana Cordoví Juan P. (2001) “Cuba Transformación económica 1990 – 1997: Supervivencia y Desarrollo del Socialismo Cubano”. Tesis para la obtención del grado de Doctor en Ciencias Económicas de la Universidad de la Habana.
18

Togores,Viviana. (2004) “Ingresos monetarios de la población, cambios en la distribución y efectos sobre el nivel de vida”. En 15 años del Centro de Estudios de la Economía Cubana. Editorial Felix Varela. Cuba. Togores, Viviana y García, Anicia. (2004) “Algunas consideraciones acerca del consumo en los noventa, factores que lo determinan”. En Reflexiones sobre Economía Cubana. Editorial Ciencias Sociales. Togores, Viviana y García, Anicia. (2003) “Consumo, mercados y dualidad monetaria en Cuba”. En Revista Economía y Desarrollo. Edición especial del 2003.
19
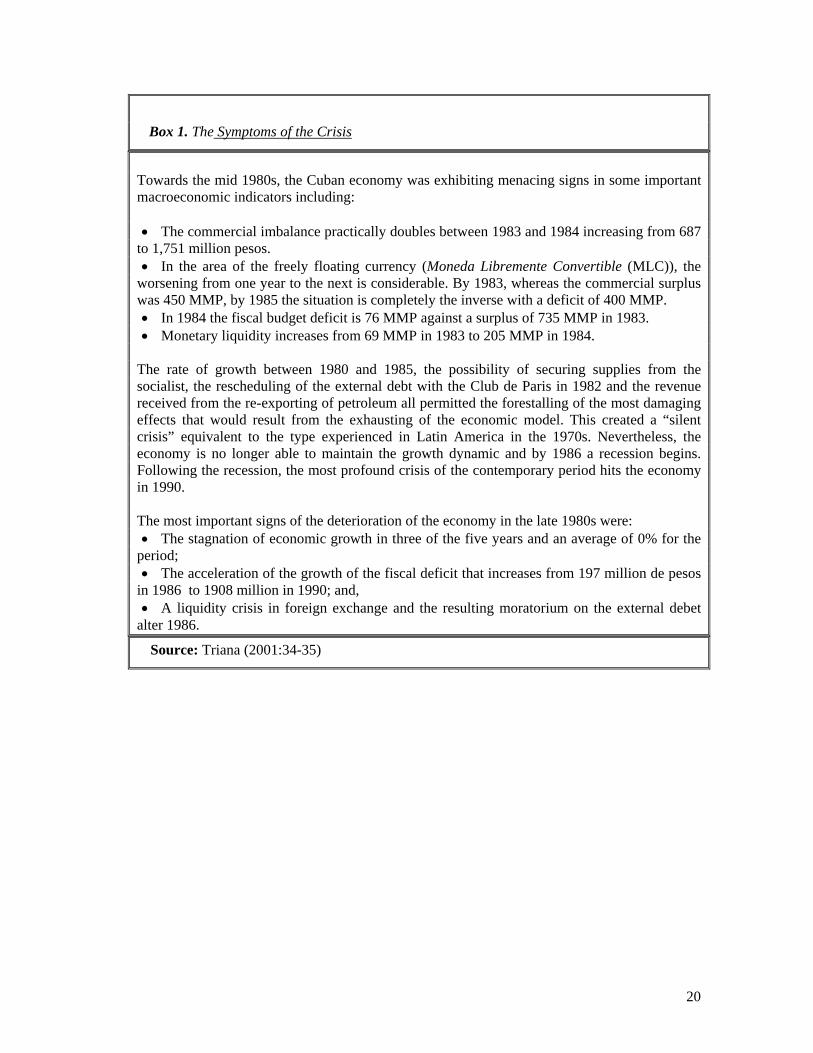
Box 1. The Symptoms of the Crisis
Towards the mid 1980s, the Cuban economy was exhibiting menacing signs in some important macroeconomic indicators including: • The commercial imbalance practically doubles between 1983 and 1984 increasing from 687
to 1,751 million pesos. • In the area of the freely floating currency (Moneda Libremente Convertible (MLC)), the
worsening from one year to the next is considerable. By 1983, whereas the commercial surplus was 450 MMP, by 1985 the situation is completely the inverse with a deficit of 400 MMP. • In 1984 the fiscal budget deficit is 76 MMP against a surplus of 735 MMP in 1983. • Monetary liquidity increases from 69 MMP in 1983 to 205 MMP in 1984.
The rate of growth between 1980 and 1985, the possibility of securing supplies from the socialist, the rescheduling of the external debt with the Club de Paris in 1982 and the revenue received from the re-exporting of petroleum all permitted the forestalling of the most damaging effects that would result from the exhausting of the economic model. This created a “silent crisis” equivalent to the type experienced in Latin America in the 1970s. Nevertheless, the economy is no longer able to maintain the growth dynamic and by 1986 a recession begins. Following the recession, the most profound crisis of the contemporary period hits the economy in 1990. The most important signs of the deterioration of the economy in the late 1980s were: • The stagnation of economic growth in three of the five years and an average of 0% for the
period; • The acceleration of the growth of the fiscal deficit that increases from 197 million de pesos
in 1986 to 1908 million in 1990; and, • A liquidity crisis in foreign exchange and the resulting moratorium on the external debet
alter 1986.
Source: Triana (2001:34-35)
20

Box 2. Economic and Social Transformations
The economic and social transformations that were executed as part of the adjustment
package included:
• The de-penalization of the holding of foreign currency; • The opening to FDI; • The geographic reorientation and decentralization of trade; • The widening of self-employment; • The cooperativization of agriculture with the creation of the UBPC and the initialization
of the “Third Agrarian Reform”; • The restructuring of state enterprises; • The institutional and normative reorganization of the key central administrative bodies
of the state; • The restructuring of economic and financial practices; • New wage regime for the available workforce (Resolution No. 6/94 of the MTSS). • The opening of agricultural markets; • The opening of the small industrial and artisan markets; • The decentralization of decision-making and greater autonomy at the level of the
nation in the search for solutions; • The implementation of new social programs; and, • The maintaining of socialist principles such that (....) tensions between the purpose of adapting the economy to new conditions and the desire to preserve the social achievements previously achieved would be maintained. This resulted in the predomination of social considerations over economic ones. The gradualism of changes, the need to have political consensus and to maintain the active participation of the state in the economy were also affirmed.
Box 3. Factors that characterize labor and income policies
• The gradual redistribution of the surplus labor force through economic resizing and restructuring.
• The protection of workers who can not be reemployed. • The development of employment programs integrated with the economic and social
development plan. • The widening of employment options in the cooperative, as well as private, sector. • The dedication of special attention to vulnerable groups including the handicapped and single-headed female households. • The continuity of policies to ensure that graduates of higher education institutions are
incorporated into the workforce and the maintainence of attention to middle levels of education.
21
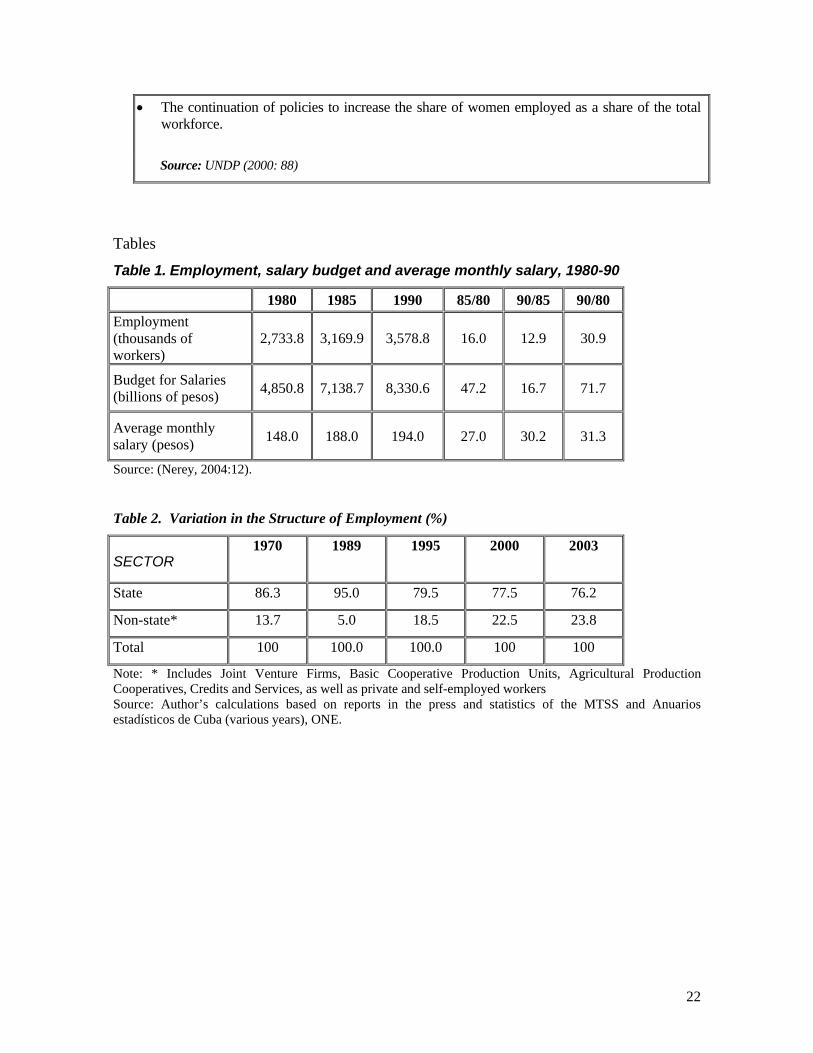
• The continuation of policies to increase the share of women employed as a share of the total workforce.
Source: UNDP (2000: 88)
Tables
Table 1. Employment, salary budget and average monthly salary, 1980-90
1980 1985 1990 85/80 90/85 90/80 Employment (thousands of workers)
2,733.8 3,169.9 3,578.8 16.0 12.9 30.9
Budget for Salaries (billions of pesos) 4,850.8 7,138.7 8,330.6 47.2 16.7 71.7
Average monthly salary (pesos) 148.0 188.0 194.0 27.0 30.2 31.3
Source: (Nerey, 2004:12).
Table 2. Variation in the Structure of Employment (%)
SECTOR 1970 1989 1995 2000 2003
State 86.3 95.0 79.5 77.5 76.2
Non-state* 13.7 5.0 18.5 22.5 23.8
Total 100 100.0 100.0 100 100
Note: * Includes Joint Venture Firms, Basic Cooperative Production Units, Agricultural Production Cooperatives, Credits and Services, as well as private and self-employed workers Source: Author’s calculations based on reports in the press and statistics of the MTSS and Anuarios estadísticos de Cuba (various years), ONE.
22
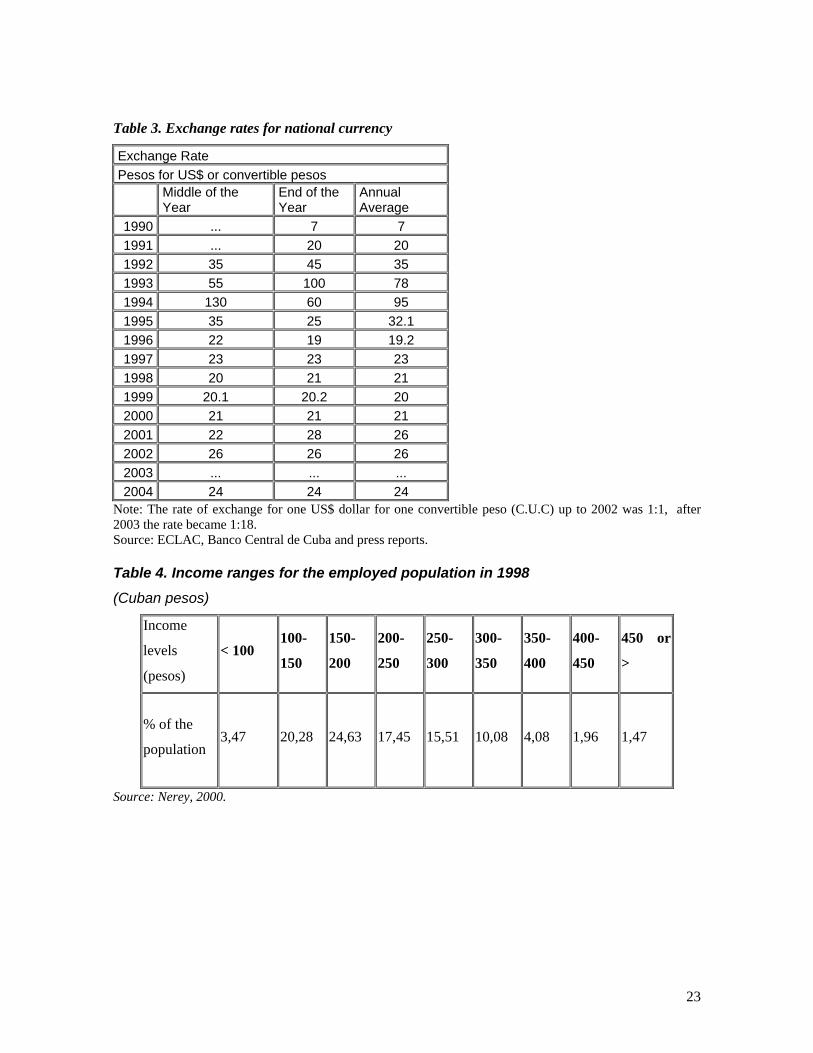
Table 3. Exchange rates for national currency
Exchange Rate Pesos for US$ or convertible pesos
Middle of the Year
End of the Year
Annual Average
1990 ... 7 7 1991 ... 20 20 1992 35 45 35 1993 55 100 78 1994 130 60 95 1995 35 25 32.1 1996 22 19 19.2 1997 23 23 23 1998 20 21 21 1999 20.1 20.2 20 2000 21 21 21 2001 22 28 26 2002 26 26 26 2003 ... ... ... 2004 24 24 24
Note: The rate of exchange for one US$ dollar for one convertible peso (C.U.C) up to 2002 was 1:1, after 2003 the rate became 1:18. Source: ECLAC, Banco Central de Cuba and press reports. Table 4. Income ranges for the employed population in 1998
(Cuban pesos)
Income
levels
(pesos)
< 100 100-
150
150-
200
200-
250
250-
300
300-
350
350-
400
400-
450
450 or
>
% of the
population 3,47 20,28 24,63 17,45 15,51 10,08 4,08 1,96 1,47
Source: Nerey, 2000.
23

Table 5. Basic Consumption Basket calculated based on 2006 data
Basic Consumption Basket
1 wage earner + 1
minor + 1 pensioner 2 wage earners + 1 senior w/o pension
2 wage earners + 1 minor
2 wage earners + 1 pensioner
Food (3356 kcal/day) 693,17 748,13 685,43 748,13
Non-Food Items 175,30 174,47 175,30 174,47
Clothing and Shoes 92,50 91,67 92,50 91,67
Hygiene 82,80 82,80 82,80 82,80
Basic Services 65,34 65,34 65,34 65,34
Other Services 3,70 3,70 3,70 3,70
Monthly spending 937,51 991,64 929,78 991,64
Monthly income 583,74 796,00 796,00 981,74
Deficit 398.77 195.64 133.78 9.9 Source: García and Anaya (2006)
Table 6. Estimations of annual remittance flows
Estimations (millions US$ per year)
ONE Cuba (Balance of Payments
1996)*
743.7
CEPAL (1998) 800
Aguilar (2001) 300 - 735
Marquetti (2002) 800 - 1 100
Monreal (2003) 500
24

Note:*Balance of Payments. Net current transfers.
.
Table 7. Potential foreign currency in circulation in the domestic market
(millions of US$)
CONTRIBUTION 1994 1998 2001
Remittances 250 -400 650-800 790-1050
Special Incentive Compensation1 30 - 50 80-110 80 – 110
Earnings from Tourism2 20 - 50 55-130 80-145
Other 5 -10 30-55 50-75
TOTAL 305 -510 815-1095 1000-1380
Note: 1. All of the different types of incentive schemes are included.
2. This is an estimated value of income that is generated by tourism from room and car rentals, and tips.
Source: Marquetti (2000).
25

Table 8. Estimation Results
Imports
Variables V1 (without Rem) ARMA(0,4)
V2 (with Rem) ARMA(0,4)
Cte -1,38 (-0,97)
-1,29 (-0,97)
LPIBrd 0,47 (2,93)
0,45 (2,92)
LM (-1) 0,60 (3,55)
0,61 (3,55)
MA -0,84 (-5,18)
-0,84 (-5,18)
Adjustment Quality
R2 ajust 0,89 0,89
DW 1,37 1,38 Akaike -1,17 -1,17
Consumption Variables V1 (w/o Rem)
ARMA(0,1) V2 (with Rem) ARMA(0,3)
Cte 1,32 (1,12)
1,79 (2,27)
LPIB 0,61 (3,13)
0,31 (3,09)
LCh(-1) 0,23 (0,95)
0,49 (4,40)
MA 0,91 (13,4)
-0,96 (20)
Adjustment Quality
R2 ajust 0,94 0,97
DW 1,58 1,86
Akaike -2,16 -2,89
Source: Sánchez Egozcue (2006)
26
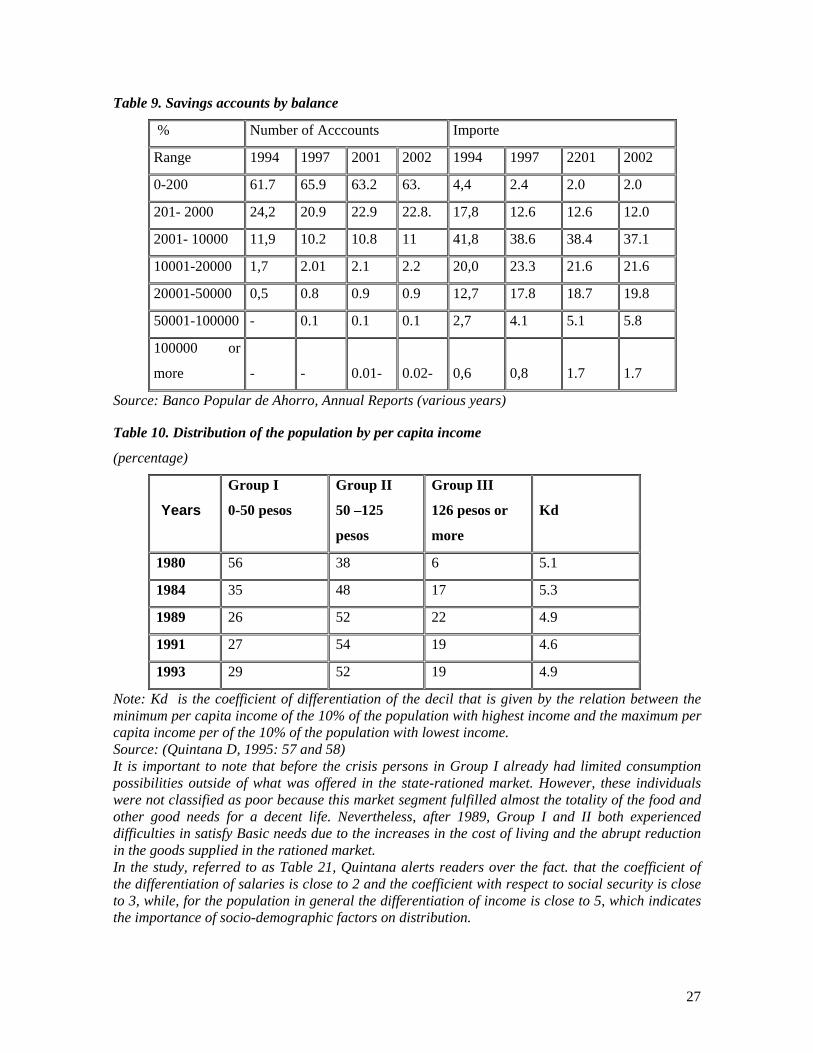
Table 9. Savings accounts by balance
% Number of Acccounts Importe
Range 1994 1997 2001 2002 1994 1997 2201 2002
0-200 61.7 65.9 63.2 63. 4,4 2.4 2.0 2.0
201- 2000 24,2 20.9 22.9 22.8. 17,8 12.6 12.6 12.0
2001- 10000 11,9 10.2 10.8 11 41,8 38.6 38.4 37.1
10001-20000 1,7 2.01 2.1 2.2 20,0 23.3 21.6 21.6
20001-50000 0,5 0.8 0.9 0.9 12,7 17.8 18.7 19.8
50001-100000 - 0.1 0.1 0.1 2,7 4.1 5.1 5.8
100000 or
more - - 0.01- 0.02- 0,6 0,8 1.7 1.7
Source: Banco Popular de Ahorro, Annual Reports (various years) Table 10. Distribution of the population by per capita income
(percentage)
Years Group I
0-50 pesos
Group II
50 –125
pesos
Group III
126 pesos or
more
Kd
1980 56 38 6 5.1
1984 35 48 17 5.3
1989 26 52 22 4.9
1991 27 54 19 4.6
1993 29 52 19 4.9
Note: Kd is the coefficient of differentiation of the decil that is given by the relation between the minimum per capita income of the 10% of the population with highest income and the maximum per capita income per of the 10% of the population with lowest income. Source: (Quintana D, 1995: 57 and 58) It is important to note that before the crisis persons in Group I already had limited consumption possibilities outside of what was offered in the state-rationed market. However, these individuals were not classified as poor because this market segment fulfilled almost the totality of the food and other good needs for a decent life. Nevertheless, after 1989, Group I and II both experienced difficulties in satisfy Basic needs due to the increases in the cost of living and the abrupt reduction in the goods supplied in the rationed market. In the study, referred to as Table 21, Quintana alerts readers over the fact. that the coefficient of the differentiation of salaries is close to 2 and the coefficient with respect to social security is close to 3, while, for the population in general the differentiation of income is close to 5, which indicates the importance of socio-demographic factors on distribution.
27

Table 11. Income per capita monthly in Havana (pesos)
Contribution Minimum
Income
Maximum
Income
Distance between
maximum and minimum
(times)
Type I 69.00 1,200.00 17.4
Type II 37.00 1,025.00 27.8
Type III 50.00 1,200.00 24
Type I belongs to:”Familia y Cambios Económicos a las Puertas del Nuevo Milenio” Departamento de Estudios de Familia. CIPS (2001). Type II belongs to: Espina M, et al.”Componentes Socio-estructurales y Distancias Sociales en la Ciudad. Informe de Investigación. Fondos del CIPS Type III elaborada por Espina con combinación de cifra de Quintana D. (1992) “Vías de acceso de la población en el consumo total de bienes y servicios” INIE and the maximum amount of Type I. Source: Elaborated based on Espina (2003: 11-12)
Table 12. Distribution of the Labor Force by Sector and Gender
Sector
Total number of
workers Men Women
1981
Agriculture 21.07 27.1 10.2
Industry 28.0 31.3 20.8
Services 50.3 41.6 69
1995
Agriculture 23.6 29.9 11.9
Industry 25.3 28.6 19.1
Services 51.1 41.5 69.0
2004
Agriculture 21.7 28.5 9.2
Industry 20.2 22.7 15.7
Services 58.1 48.8 75.1
Source: Catasús, Valle and San Marfil, 2000 and calculations and estimations made by the author based on data from ONE (2005).
28
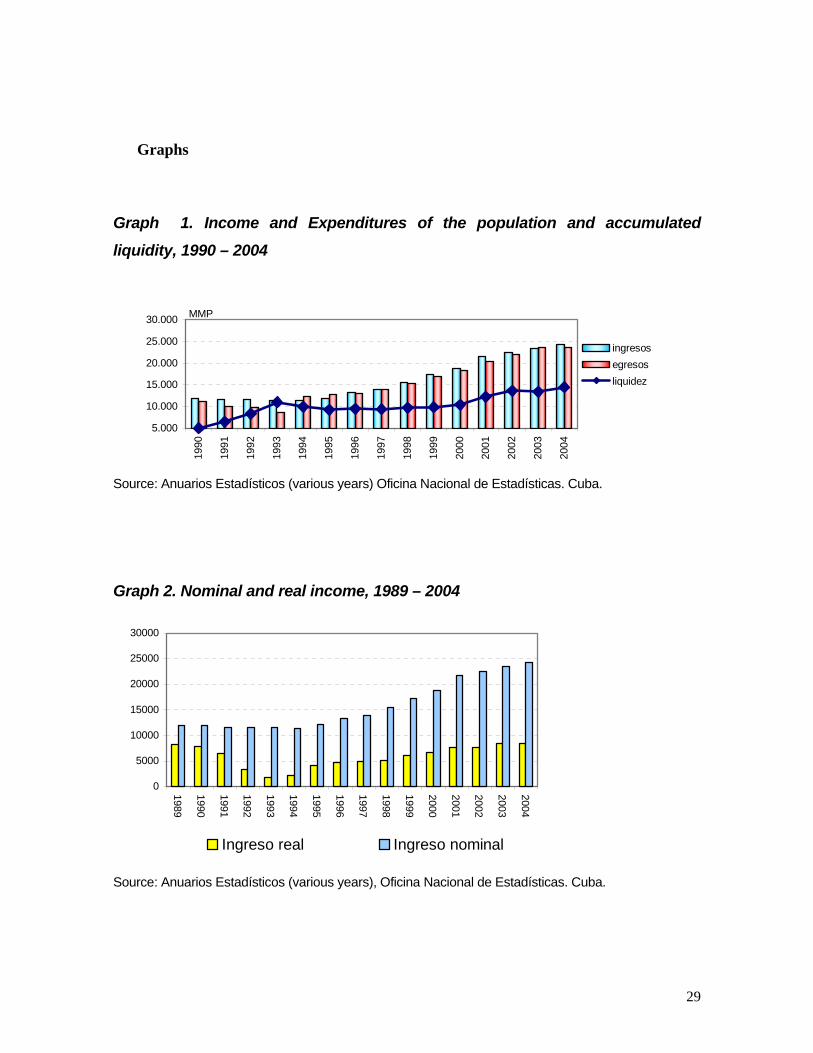
Graphs
Graph 1. Income and Expenditures of the population and accumulated
liquidity, 1990 – 2004
5.000
10.000
15.000
20.000
25.000
30.000
1990
1991
1992
1993
1994
1995
1996
1997
1998
1999
2000
2001
2002
2003
2004
MMP
ingresosegresosliquidez
Source: Anuarios Estadísticos (various years) Oficina Nacional de Estadísticas. Cuba.
Graph 2. Nominal and real income, 1989 – 2004
0
5000
10000
15000
20000
25000
300001989
1990
1991
1992
1993
1994
1995
1996
1997
1998
1999
2000
2001
2002
2003
2004
Ingreso real Ingreso nominal
Source: Anuarios Estadísticos (various years), Oficina Nacional de Estadísticas. Cuba.
29

Graph 3. Sources de Income for the population
0%
20%
40%
60%
80%
100%
1989
1990
1991
1992
1993
1994
1995
1996
1997
1998
1999
2000
2001
2002
2003
2004
Salarios y otras remuneraciones Ingresos sector cooperativo y privado Otros ingresos
Source: Anuarios Estadísticos (various years.), Oficina Nacional de Estadísticas. Cuba.
Graph 4. Average monthly wage: nominal and real, 1989-2004
0
50
100
150
200
250
300
1989
1990
1991
1992
1993
1994
1995
1996
1997
1998
1999
2000
2001
2002
2003
2004
Pes
os
salarioreal
salarionominal
Source: Elaborated by the author based on statistics of the Ministerio de Finanzas and Precios and
estimates made from data published in the national press.
Graph.5. Employment by Sector
30
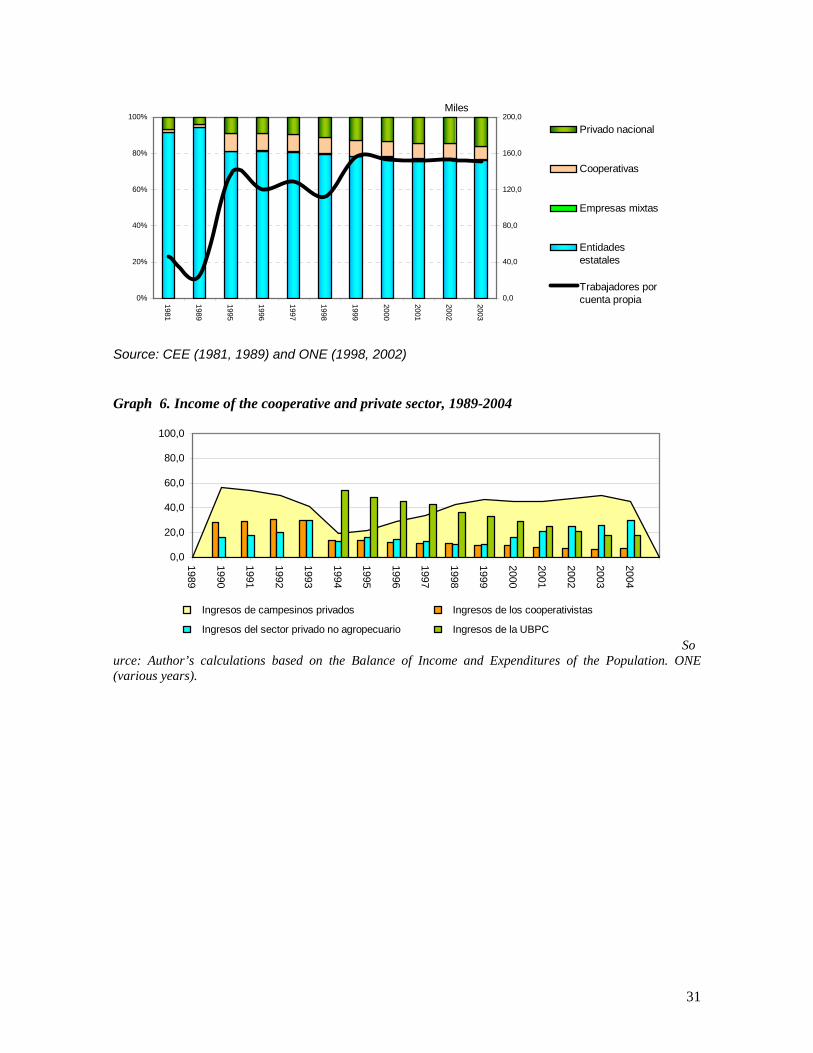
0%
20%
40%
60%
80%
100%
1981
1989
1995
1996
1997
1998
1999
2000
2001
2002
2003
0,0
40,0
80,0
120,0
160,0
200,0Miles
Privado nacional
Cooperativas
Empresas mixtas
Entidadesestatales
Trabajadores porcuenta propia
Source: CEE (1981, 1989) and ONE (1998, 2002)
Graph 6. Income of the cooperative and private sector, 1989-2004
0,0
20,0
40,0
60,0
80,0
100,0
1989
1990
1991
1992
1993
1994
1995
1996
1997
1998
1999
2000
2001
2002
2003
2004
Ingresos de campesinos privados Ingresos de los cooperativistas
Ingresos del sector privado no agropecuario Ingresos de la UBPCSo
urce: Author’s calculations based on the Balance of Income and Expenditures of the Population. ONE (various years).
31
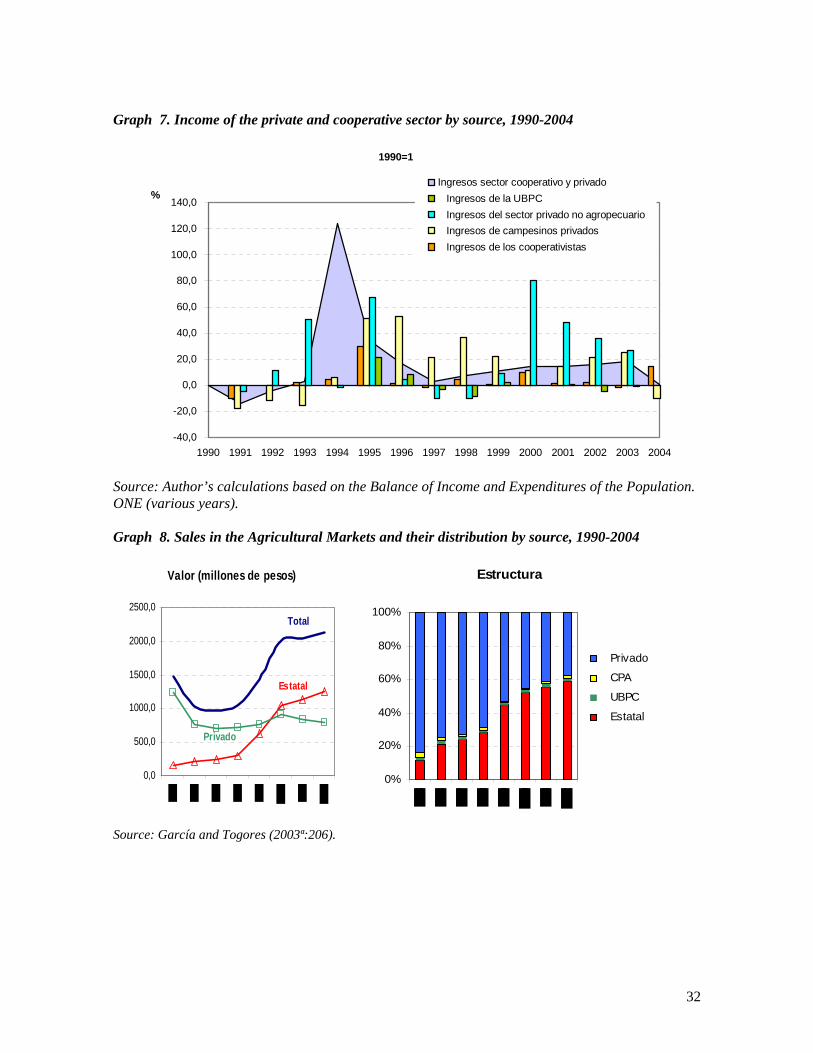
Graph 7. Income of the private and cooperative sector by source, 1990-2004
1990=1
-40,0
-20,0
0,0
20,0
40,0
60,0
80,0
100,0
120,0
140,0
1990 1991 1992 1993 1994 1995 1996 1997 1998 1999 2000 2001 2002 2003 2004
%Ingresos sector cooperativo y privado Ingresos de la UBPC Ingresos del sector privado no agropecuario Ingresos de campesinos privados Ingresos de los cooperativistas
Source: Author’s calculations based on the Balance of Income and Expenditures of the Population. ONE (various years). Graph 8. Sales in the Agricultural Markets and their distribution by source, 1990-2004
Estructura
0%
20%
40%
60%
80%
100%
Privado
CPA
UBPC
Estatal
Valor (millones de pesos)
0,0
500,0
1000,0
1500,0
2000,0
2500,0Total
Privado
Estatal
Source: García and Togores (2003ª:206).
32

Grafico 9. Evolution of Cooperative Incomes, 1990-2004
0
200
400
600
800
1000
1990
1991
1992
1993
1994
1995
1996
1997
1998
1999
2000
2001
2002
2003
2004
Millo
nes
de p
esos
0
10
20
30
40
50
Millo
nes
de d
ólar
es
CPA (enpesos)
UBPC (enpesos)
CPA(equivalenteen dólares)
UBPC(equivalenteen dólares)
Graph 10. Evolution of farmers’ incomes, 1990-2004
y = 10,018x2 - 36,827x + 257,3R2 = 0,9692
y = 123,45x - 196,83R2 = 0,8835
-500
0
500
1000
1500
2000
2500
3000
1990
1991
1992
1993
1994
1995
1996
1997
1998
1999
2000
2001
2002
2003
2004
Millo
nes
de p
esos
Campesinos privados (pesos) Tendencia cuadraticaTendencia lineal LinealTendencia Cuadrática
Source: Elaborated by García (2003) and updated by the author.
33

Graph 11. Evolution of Income of the non-agriculture private sector in Cuba37
,0 100,0 200,0 300,0 400,0 500,0 600,0 700,0 800,0 900,0
1 000,0 1 100,0 1 200,0
1990
1991
1992
1993
1994
1995
1996
1997
1998
1999
2000
2001
2002
2003
2004
Millo
nes
de p
esos
0
5
10
15
20
25
30
35
40
45
50
Millo
nes
de d
ólar
es (e
quiv
.)
Pesos
Dólares
Source: Elaborated by García (2003) and updated by the author.
Graph 12. Estimated monthly income by contributing renter by province, 2001
(equivalent US$)
0
100
200
300
400
500
600
700
800
Pina
r del
Río
La H
aban
a
Ciu
dad
de la
Hab
ana
Mat
anza
s
Villa
Cla
ra
Cie
nfue
gos
Sanc
ti Sp
íritu
s
Cie
go d
e Áv
ila
Cam
agüe
y
Las
Tuna
s
Hol
guín
Gra
nma
Sant
iago
de
Cub
a
Gua
ntán
amo
Isla
de
la J
uven
tud
MínimoMáximoMedio
Source: Elaborated by García (2003).
37 This is based on the income data published by ONE in its income and expenditure of the population balance report which permits one to calculate the relationship between firms and the population, budgeted units and state enterprises. In other words, this report contains that part of income that is received through relationships to the State, but no data is included on the amounts that circulate through other economic ties.
34

Graph 13. Estimated monthly income by artist, professionals and contributing intellectuals by
province
(equivalent US$)
0
100
200
300
400
500
600
700
800
Pin
ar d
el R
ío
La H
aban
a
Ciu
dad
de la
Hab
ana
Mat
anza
s
Villa
Cla
ra
Cie
nfue
gos
San
cti S
pírit
us
Cie
go d
e Á
vila
Cam
agüe
y
Las
Tuna
s
Hol
guín
Gra
nma
San
tiago
de
Cub
a
Gua
ntán
amo
Isla
de
laJu
vent
ud
MínimoMáximoMedio
Source: Elaborated by García (2003).
Graph 14. Income in Foreign Currency
Cuba: Ingresos en Divisas
0
500
1000
1500
2000
2500
1994 1995 1996 1997 1998 1999 2000
millones usd
Exportaciones.TurismoIEDRemesasAsist.Desarrollo
Source: Sánchez Egozcue (2006)
35

Graph 15. Distribution of the recipients of foreign currency income in Havana by economic activity and decile, 2001
0
10
20
30
40
50
60
70
80
90
100
Remesas Divisas porViajes
Divisas del C.Laboral
Divisas dePropinas
Divisas deAmigos
Deciles
%
1 2 3 4 5 6 7 8 9 10
Source: Sánchez Egozcue and Togores González (2006)
36
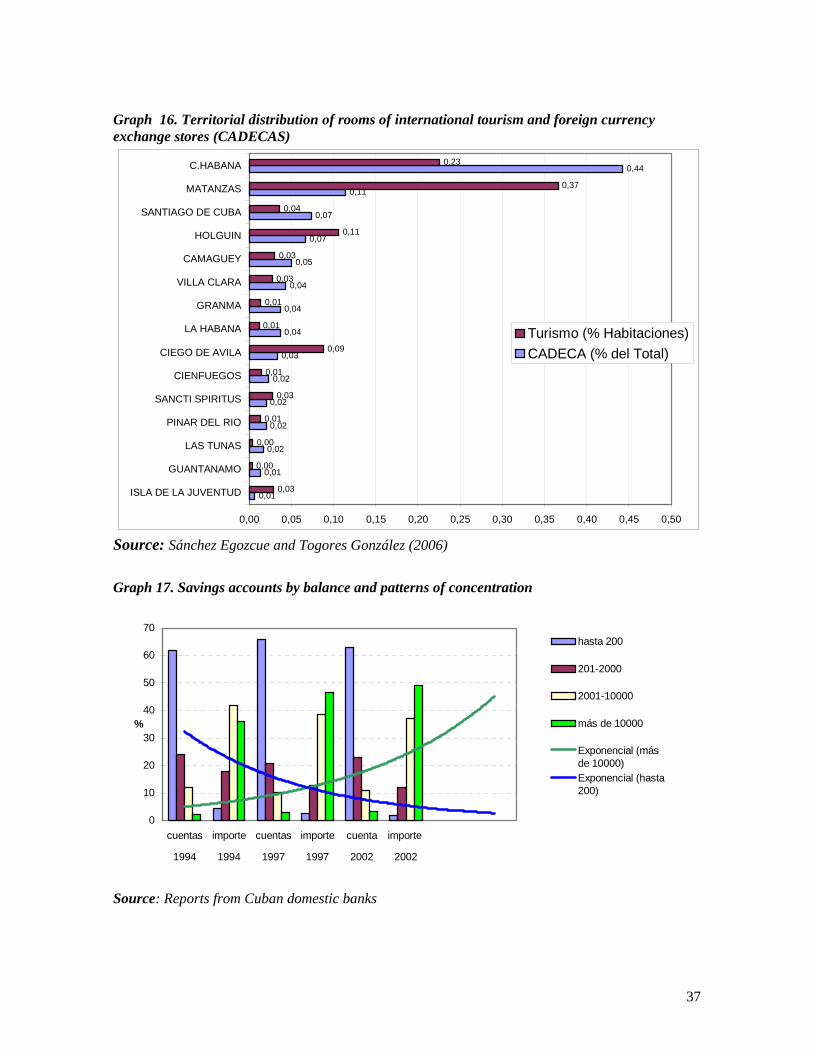
Graph 16. Territorial distribution of rooms of international tourism and foreign currency exchange stores (CADECAS)
0,01
0,01
0,02
0,02
0,02
0,02
0,03
0,04
0,04
0,04
0,05
0,07
0,07
0,11
0,44
0,03
0,00
0,00
0,01
0,03
0,01
0,09
0,01
0,01
0,03
0,03
0,11
0,04
0,37
0,23
0,00 0,05 0,10 0,15 0,20 0,25 0,30 0,35 0,40 0,45 0,50
ISLA DE LA JUVENTUD
GUANTANAMO
LAS TUNAS
PINAR DEL RIO
SANCTI SPIRITUS
CIENFUEGOS
CIEGO DE AVILA
LA HABANA
GRANMA
VILLA CLARA
CAMAGUEY
HOLGUIN
SANTIAGO DE CUBA
MATANZAS
C.HABANA
Turismo (% Habitaciones)CADECA (% del Total)
Source: Sánchez Egozcue and Togores González (2006)
Graph 17. Savings accounts by balance and patterns of concentration
0
10
20
30
40
50
60
70
cuentas importe cuentas importe cuenta importe
1994 1994 1997 1997 2002 2002
%
hasta 200
201-2000
2001-10000
más de 10000
Exponencial (másde 10000)Exponencial (hasta200)
Source: Reports from Cuban domestic banks
37
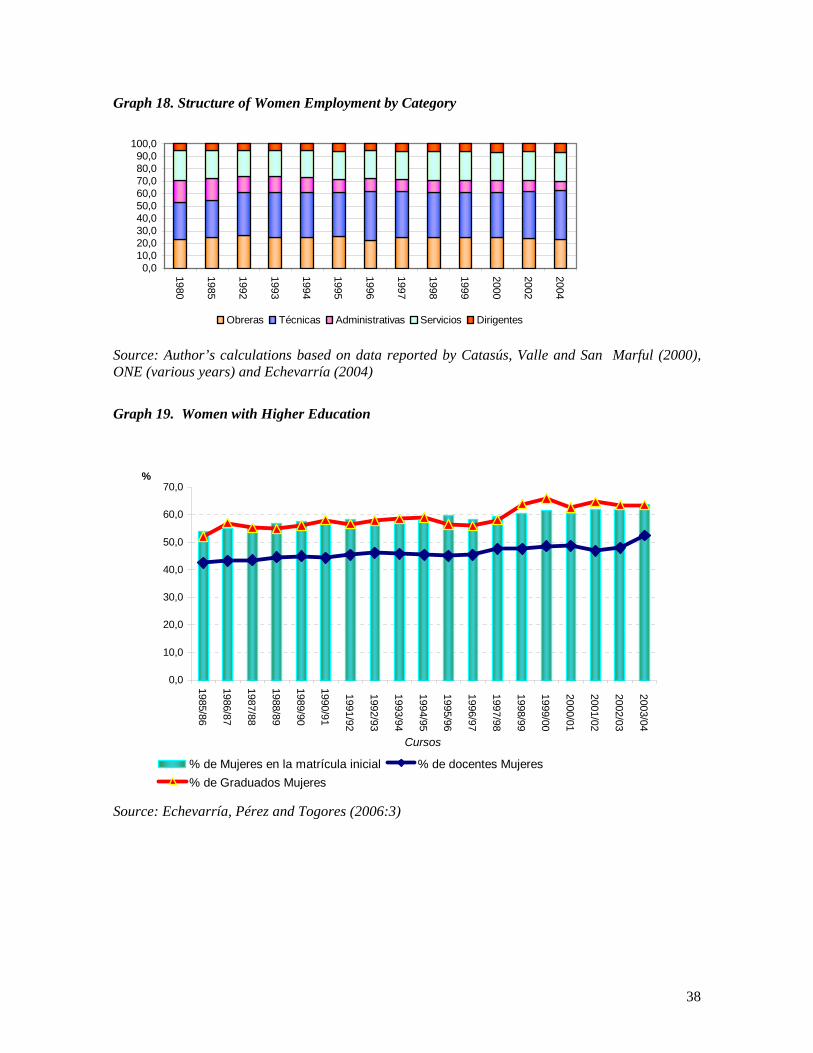
Graph 18. Structure of Women Employment by Category
0,010,020,030,040,050,060,070,080,090,0
100,0
1980
1985
1992
1993
1994
1995
1996
1997
1998
1999
2000
2002
2004
Obreras Técnicas Administrativas Servicios Dirigentes
Source: Author’s calculations based on data reported by Catasús, Valle and San Marful (2000), ONE (various years) and Echevarría (2004)
Graph 19. Women with Higher Education
0,0
10,0
20,0
30,0
40,0
50,0
60,0
70,0
1985/86
1986/87
1987/88
1988/89
1989/90
1990/91
1991/92
1992/93
1993/94
1994/95
1995/96
1996/97
1997/98
1998/99
1999/00
2000/01
2001/02
2002/03
2003/04
Cursos
%
% de Mujeres en la matrícula inicial % de docentes Mujeres% de Graduados Mujeres
Source: Echevarría, Pérez and Togores (2006:3)
38
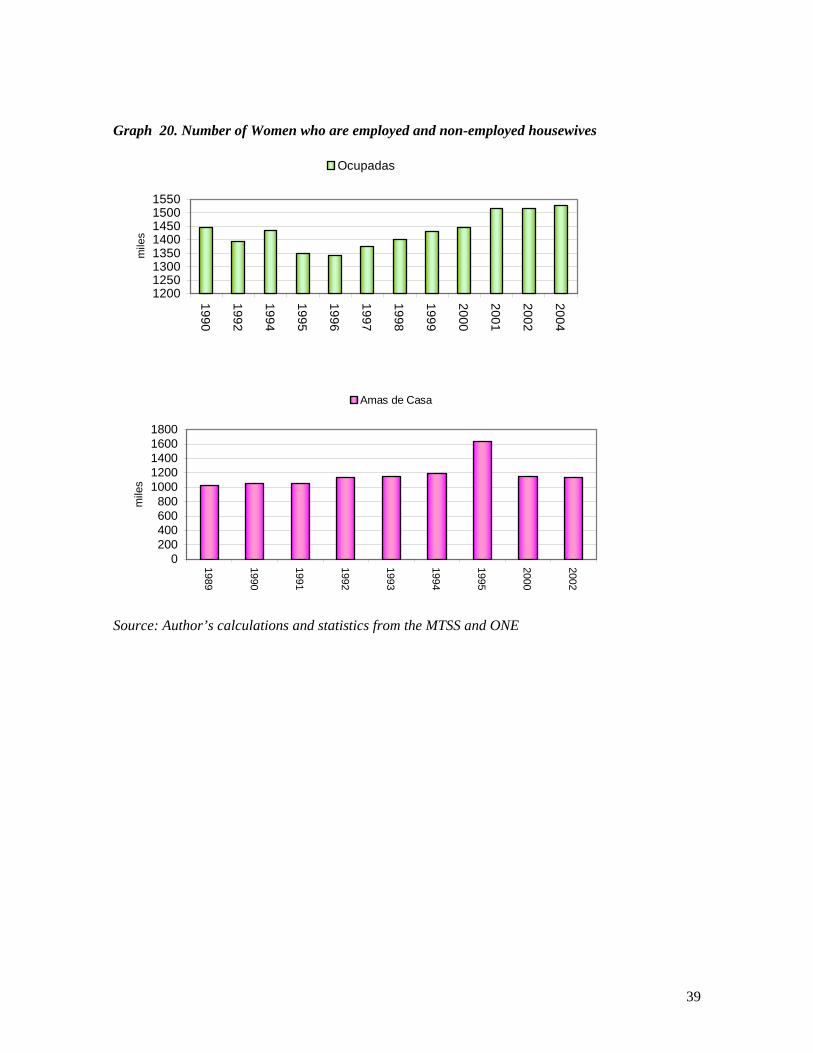
Graph 20. Number of Women who are employed and non-employed housewives
12001250130013501400145015001550
1990
1992
1994
1995
1996
1997
1998
1999
2000
2001
2002
2004
mile
s
Ocupadas
0200400600800
10001200140016001800
1989
1990
1991
1992
1993
1994
1995
2000
2002
mile
s
Amas de Casa
Source: Author’s calculations and statistics from the MTSS and ONE
39