THE CHALLENGES OF FURTHER COST REDUCTIONS …pages.hmc.edu/evans/PipelinesTokyo.pdf · THE...
17
THE CHALLENGES OF FURTHER COST REDUCTIONS FOR NEW SUPPLY OPTIONS (PIPELINE, LNG, GTL) Sylvie Cornot-Gandolphe, International Energy Agency Olivier Appert, International Energy Agency Ralf Dickel, International Energy Agency Marie-Françoise Chabrelie, CEDIGAZ Alexandre Rojey, Institut Français du Pétrole and CEDIGAZ 22 nd World Gas Conference 1-5 June 2003, Tokyo, Japan 22 nd World Gas Conference Tokyo 2003 1
Transcript of THE CHALLENGES OF FURTHER COST REDUCTIONS …pages.hmc.edu/evans/PipelinesTokyo.pdf · THE...
THE CHALLENGES OF FURTHER COST REDUCTIONS FOR NEW SUPPLY OPTIONS (PIPELINE, LNG, GTL)
Sylvie Cornot-Gandolphe, International Energy Agency
Olivier Appert, International Energy Agency Ralf Dickel, International Energy Agency Marie-Françoise Chabrelie, CEDIGAZ
Alexandre Rojey, Institut Français du Pétrole and CEDIGAZ
22nd World Gas Conference 1-5 June 2003, Tokyo, Japan
22nd World Gas Conference Tokyo 2003 1
THE CHALLENGES OF FURTHER COST REDUCTIONS FOR NEW SUPPLY OPTIONS (PIPELINE, LNG, GTL)
Sylvie Cornot-Gandolphe, International Energy Agency
Olivier Appert, International Energy Agency Ralf Dickel, International Energy Agency
Marie-Françoise Chabrelie, CEDIGAZ Alexandre Rojey, Institut Français du Pétrole and CEDIGAZ
1. THE LONG TERM PROSPECTS FOR GAS
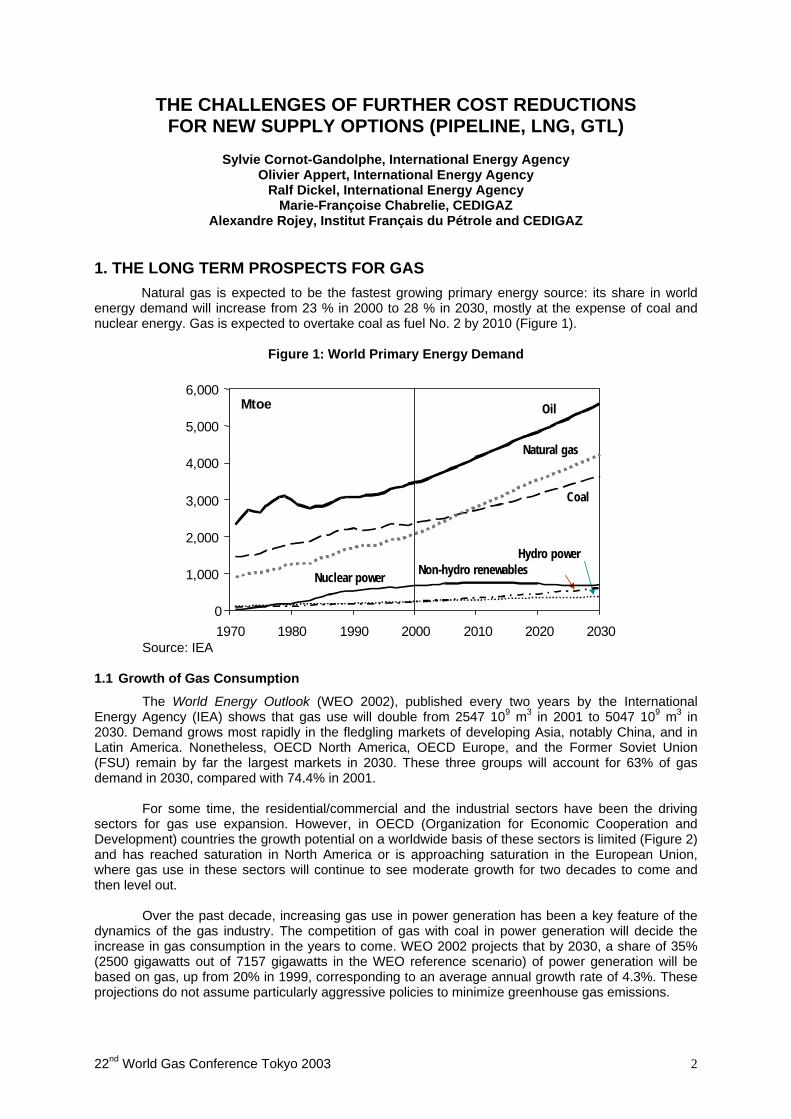
Natural gas is expected to be the fastest growing primary energy source: its share in world energy demand will increase from 23 % in 2000 to 28 % in 2030, mostly at the expense of coal and nuclear energy. Gas is expected to overtake coal as fuel No. 2 by 2010 (Figure 1).
Figure 1: World Primary Energy Demand
Oil
Natural gas
Coal
Nuclear power
Hydro power Non-hydro renewables
0
1,000
2,000
3,000
4,000
5,000
6,000
1970 1980 1990 2000 2010 2020 2030
Mtoe
Source: IEA 1.1 Growth of Gas Consumption
The World Energy Outlook (WEO 2002), published every two years by the International Energy Agency (IEA) shows that gas use will double from 2547 109 m3 in 2001 to 5047 109 m3 in 2030. Demand grows most rapidly in the fledgling markets of developing Asia, notably China, and in Latin America. Nonetheless, OECD North America, OECD Europe, and the Former Soviet Union (FSU) remain by far the largest markets in 2030. These three groups will account for 63% of gas demand in 2030, compared with 74.4% in 2001.
For some time, the residential/commercial and the industrial sectors have been the driving sectors for gas use expansion. However, in OECD (Organization for Economic Cooperation and Development) countries the growth potential on a worldwide basis of these sectors is limited (Figure 2) and has reached saturation in North America or is approaching saturation in the European Union, where gas use in these sectors will continue to see moderate growth for two decades to come and then level out.
Over the past decade, increasing gas use in power generation has been a key feature of the dynamics of the gas industry. The competition of gas with coal in power generation will decide the increase in gas consumption in the years to come. WEO 2002 projects that by 2030, a share of 35% (2500 gigawatts out of 7157 gigawatts in the WEO reference scenario) of power generation will be based on gas, up from 20% in 1999, corresponding to an average annual growth rate of 4.3%. These projections do not assume particularly aggressive policies to minimize greenhouse gas emissions.
22nd World Gas Conference Tokyo 2003 2
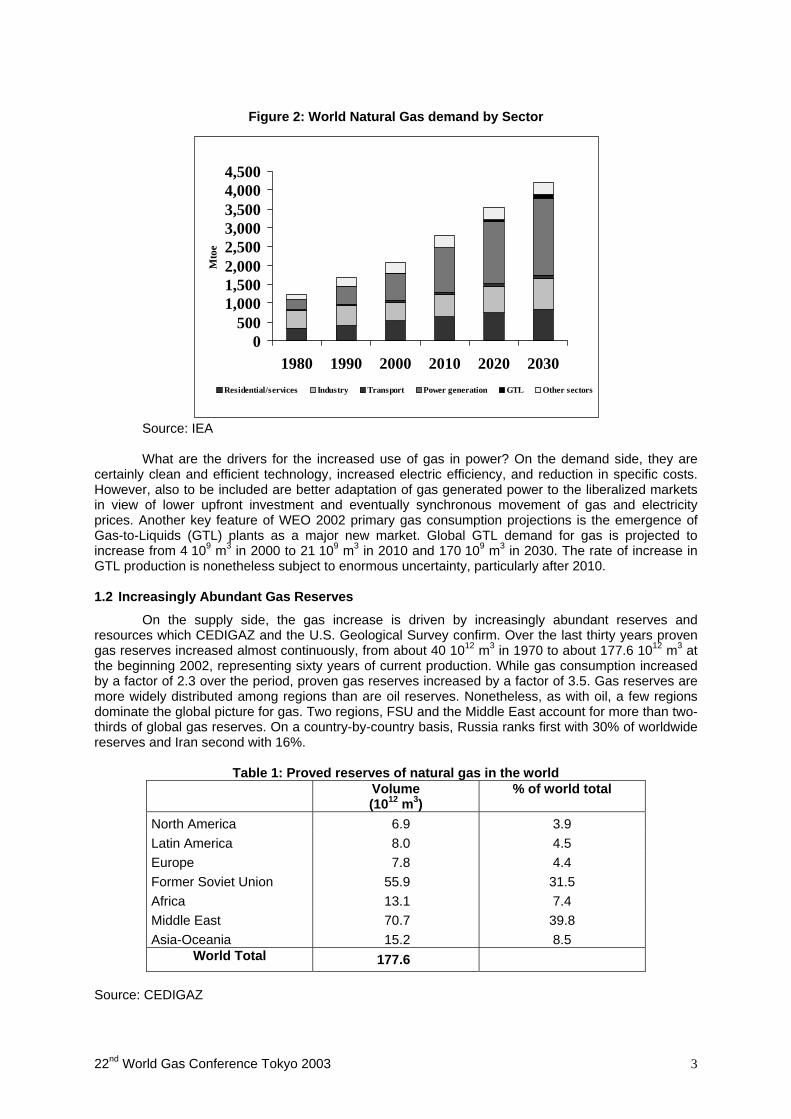
Figure 2: World Natural Gas demand by Sector
0500
1,0001,5002,0002,5003,0003,5004,0004,500
1980 1990 2000 2010 2020 2030
Mto
e
Residential/services Industry Transport Power generation GTL Other sectors
Source: IEA
What are the drivers for the increased use of gas in power? On the demand side, they are certainly clean and efficient technology, increased electric efficiency, and reduction in specific costs. However, also to be included are better adaptation of gas generated power to the liberalized markets in view of lower upfront investment and eventually synchronous movement of gas and electricity prices. Another key feature of WEO 2002 primary gas consumption projections is the emergence of Gas-to-Liquids (GTL) plants as a major new market. Global GTL demand for gas is projected to increase from 4 109 m3 in 2000 to 21 109 m3 in 2010 and 170 109 m3 in 2030. The rate of increase in GTL production is nonetheless subject to enormous uncertainty, particularly after 2010. 1.2 Increasingly Abundant Gas Reserves
On the supply side, the gas increase is driven by increasingly abundant reserves and resources which CEDIGAZ and the U.S. Geological Survey confirm. Over the last thirty years proven gas reserves increased almost continuously, from about 40 1012 m3 in 1970 to about 177.6 1012 m3 at the beginning 2002, representing sixty years of current production. While gas consumption increased by a factor of 2.3 over the period, proven gas reserves increased by a factor of 3.5. Gas reserves are more widely distributed among regions than are oil reserves. Nonetheless, as with oil, a few regions dominate the global picture for gas. Two regions, FSU and the Middle East account for more than two-thirds of global gas reserves. On a country-by-country basis, Russia ranks first with 30% of worldwide reserves and Iran second with 16%.
Table 1: Proved reserves of natural gas in the world
Volume (1012 m3)
% of world total
North America 6.9 3.9 Latin America 8.0 4.5 Europe 7.8 4.4 Former Soviet Union 55.9 31.5 Africa 13.1 7.4 Middle East 70.7 39.8 Asia-Oceania 15.2 8.5
World Total 177.6 Source: CEDIGAZ
22nd World Gas Conference Tokyo 2003 3
All regions but OECD North America and Europe are pretty comfortable at today’s reserves to production ratio. The Middle East, which accounts for almost 40% of global reserves, holds a reserves/production ratio of 260 years, significantly higher than for any other region, clearly illustrating the scale and potential for exploiting these largely untapped reserves and probably under-explored gas resources.
However, perhaps as much as a third of global gas reserves is stranded and would not be bookable as an asset according to SEC (Securities and Exchange Commission) rules, but those volumes will become viable as costs to mobilize them drop. For instance, a large part of FSU gas is landlocked and has to get out by pipes, but those are very long pipes. The majority of untapped reserves are in the Middle East. These reserves offer some degree of transport flexibility as there are located close to deep waters.
Apparently, even if for the time being some of the gas reserves have to be considered as stranded gas, there is an interest by the companies and the states as owners of the resources to make them valuable. 1.3 Growing imbalances between supply and demand
Although recent gas discoveries have affected all the continents, their distribution is far from harmonious with the size and growth of the regional markets. This creates growing regional imbalances between production and demand, at the continental scale, and even more, at the local scale of the countries. Gas production is projected to increase from 2500 109 m3 in 2000 to almost 5100 109 m3 in 2030. The projected trends in regional gas production reflect to a large extent the location of reserves. WEO 2002 projects that production will grow most in absolute terms in the transition economies and the Middle East. Output also increases quickly in Africa and Latin America. In consequence, the major industrialized countries are forced to rely increasingly on the international gas trade, just like the most advanced emerging countries of Asia and Latin America.
The projected 2,600 109 m3 increase in production from 2000 to 2030 will require massive investment in production facilities and transport infrastructure. In general, the share of transportation in total supply costs is likely to rise as reserves located closest to markets are depleted and supply chains lengthen. Technology-driven reductions in unit production and transport costs will, however, offset the effect of distance on total supply costs to some extent.
2. INTERNATIONAL GAS TRADE 2.1 The rise in international gas trade
The geographical mismatch between resource endowment and demand means that international trade should witness a sustained expansion in the next thirty years, and that the main growth markets for gas are going to become much more dependent on imports. International trade already represented 682 109 m3 in 2001, and could approach 1300 109 m3 in 2020, about 30% of world production and 1700 109 m3 in 2030 (Figure 3). In absolute terms, the biggest increase in imports is projected to occur in OECD Europe.
22nd World Gas Conference Tokyo 2003 4
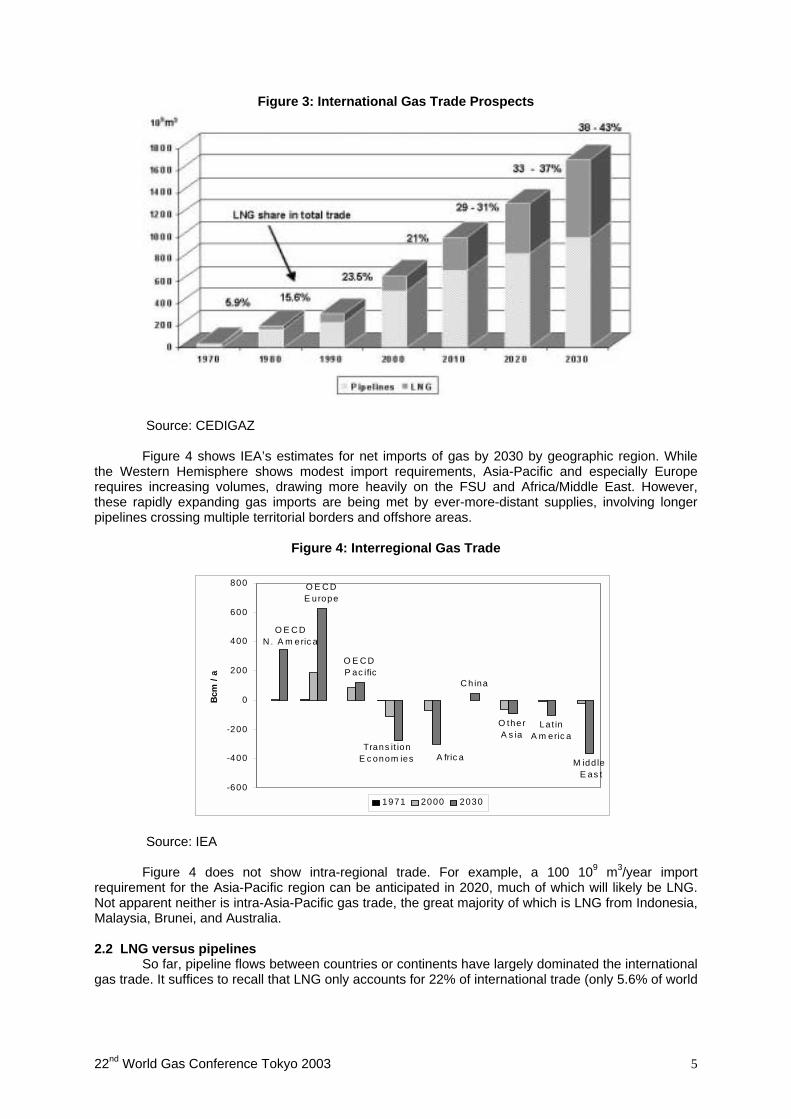
Figure 3: International Gas Trade Prospects
Source: CEDIGAZ
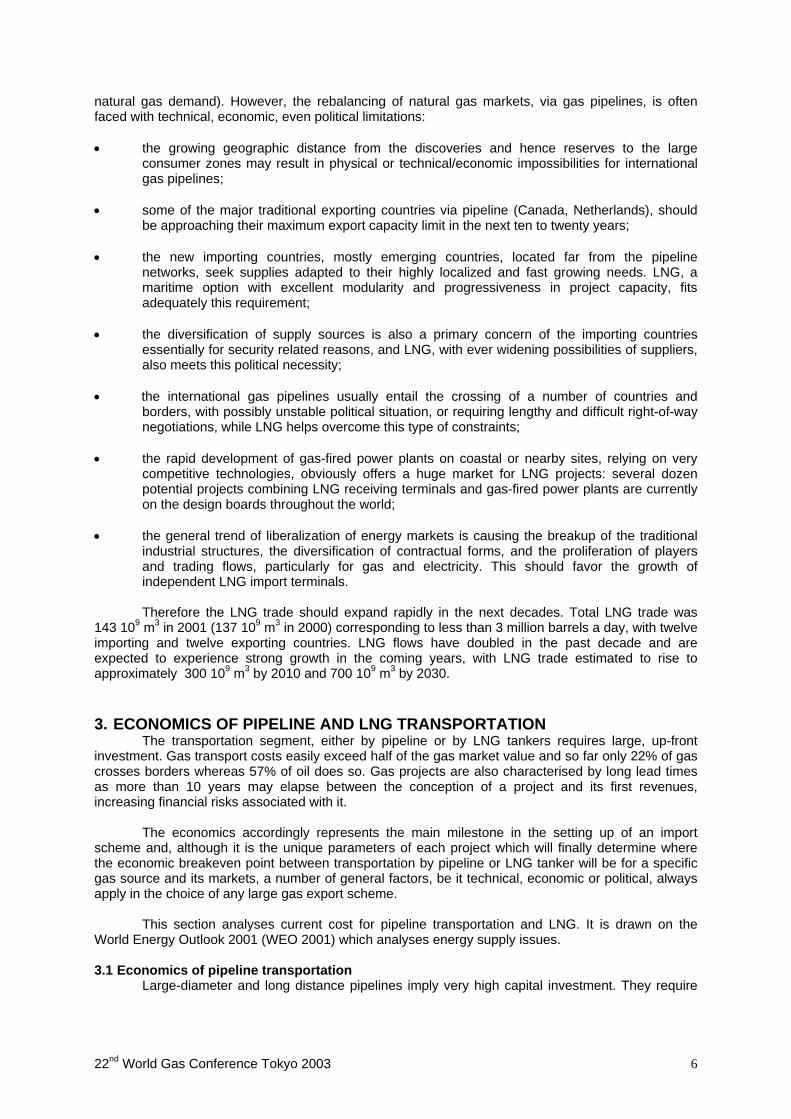
Figure 4 shows IEA’s estimates for net imports of gas by 2030 by geographic region. While the Western Hemisphere shows modest import requirements, Asia-Pacific and especially Europe requires increasing volumes, drawing more heavily on the FSU and Africa/Middle East. However, these rapidly expanding gas imports are being met by ever-more-distant supplies, involving longer pipelines crossing multiple territorial borders and offshore areas.
Figure 4: Interregional Gas Trade
C hina
O E C D E urope
O E C D N . A m eric a
O E C D P ac ific
Trans it ion E c onom ies A fric a
O therA s ia
La t inA m eric a
M idd le E as t
-600
-400
-200
0
200
400
600
800
Bcm
/ a
1971 2000 2030
Source: IEA
Figure 4 does not show intra-regional trade. For example, a 100 109 m3/year import requirement for the Asia-Pacific region can be anticipated in 2020, much of which will likely be LNG. Not apparent neither is intra-Asia-Pacific gas trade, the great majority of which is LNG from Indonesia, Malaysia, Brunei, and Australia.
2.2 LNG versus pipelines
So far, pipeline flows between countries or continents have largely dominated the international gas trade. It suffices to recall that LNG only accounts for 22% of international trade (only 5.6% of world
22nd World Gas Conference Tokyo 2003 5
natural gas demand). However, the rebalancing of natural gas markets, via gas pipelines, is often faced with technical, economic, even political limitations: • the growing geographic distance from the discoveries and hence reserves to the large
consumer zones may result in physical or technical/economic impossibilities for international gas pipelines;
• some of the major traditional exporting countries via pipeline (Canada, Netherlands), should
be approaching their maximum export capacity limit in the next ten to twenty years;
• the new importing countries, mostly emerging countries, located far from the pipeline networks, seek supplies adapted to their highly localized and fast growing needs. LNG, a maritime option with excellent modularity and progressiveness in project capacity, fits adequately this requirement;
• the diversification of supply sources is also a primary concern of the importing countries
essentially for security related reasons, and LNG, with ever widening possibilities of suppliers, also meets this political necessity;
• the international gas pipelines usually entail the crossing of a number of countries and
borders, with possibly unstable political situation, or requiring lengthy and difficult right-of-way negotiations, while LNG helps overcome this type of constraints;
• the rapid development of gas-fired power plants on coastal or nearby sites, relying on very
competitive technologies, obviously offers a huge market for LNG projects: several dozen potential projects combining LNG receiving terminals and gas-fired power plants are currently on the design boards throughout the world;
• the general trend of liberalization of energy markets is causing the breakup of the traditional
industrial structures, the diversification of contractual forms, and the proliferation of players and trading flows, particularly for gas and electricity. This should favor the growth of independent LNG import terminals.
Therefore the LNG trade should expand rapidly in the next decades. Total LNG trade was
143 109 m3 in 2001 (137 109 m3 in 2000) corresponding to less than 3 million barrels a day, with twelve importing and twelve exporting countries. LNG flows have doubled in the past decade and are expected to experience strong growth in the coming years, with LNG trade estimated to rise to approximately 300 109 m3 by 2010 and 700 109 m3 by 2030. 3. ECONOMICS OF PIPELINE AND LNG TRANSPORTATION
The transportation segment, either by pipeline or by LNG tankers requires large, up-front investment. Gas transport costs easily exceed half of the gas market value and so far only 22% of gas crosses borders whereas 57% of oil does so. Gas projects are also characterised by long lead times as more than 10 years may elapse between the conception of a project and its first revenues, increasing financial risks associated with it.
The economics accordingly represents the main milestone in the setting up of an import scheme and, although it is the unique parameters of each project which will finally determine where the economic breakeven point between transportation by pipeline or LNG tanker will be for a specific gas source and its markets, a number of general factors, be it technical, economic or political, always apply in the choice of any large gas export scheme.
This section analyses current cost for pipeline transportation and LNG. It is drawn on the World Energy Outlook 2001 (WEO 2001) which analyses energy supply issues. 3.1 Economics of pipeline transportation
Large-diameter and long distance pipelines imply very high capital investment. They require
22nd World Gas Conference Tokyo 2003 6
both large, high-value markets and substantial proven reserves to be economically viable. Capital charges typically make up at least 90% of the cost of transmission pipelines. The key determinants of pipeline construction costs are diameter, operating pressures, distance and terrain. Other factors, including climate, labour costs, the degree of competition among contracting companies, safety regulations, population density and rights of way, may cause construction costs to vary significantly from one region to another.
Pipeline operating costs vary mainly according to the number of compressor stations, which
require significant amounts of fuel, and local economic conditions, especially labour costs. In designing a pipeline, the optimal mix of diameter and compression capacity will depend on the expected load factor. Once a pipeline is built, the average cost per unit of throughput will depend almost entirely on the average rate of capacity utilisation. A high level of utilisation with a high load factor is usually critical to the economic viability of the pipeline.
Globally, the investment required to lay a long distance, large diameter line (46 to 60 inches), enabling a throughput of about 15 to 30 109 m3/year, currently amounts to $1 billion to $1.5 billion/1000 km. The Alliance Gas pipeline between Canada and US for instance (36 inch of diameter, 3686 km long, operated at 120 bar) cost about US$3 billion. Investment for subsea lines are much higher, depending on water depths.
Because pipeline transportation is less complex than the LNG process, cost reductions have
been less impressive. However, substantial improvements have been achieved in optimizing project design and construction, inspection activities, laying and welding methods, steel quality and weight, thus reducing material costs and the period of construction. Increased competition among inspection-service companies also contributed to reduce the overall cost.
Developments over the past decade in offshore pipeline technology have contributed to lower unit costs and have made possible deep-water projects that were previously impossible. The development of a pipe-laying technology capable of laying pipes at 650 metres depth represented a breakthrough in the early 1980s and allowed to lay the Transmed pipeline between Tunisia and Sicily. Offshore pipeline technology also played a big role in the exploitation of North Sea gas resources in the 1970-80s and those more recently in the Gulf of Mexico.
One of the methods most commonly used to install marine pipelines is the S-lay method. This production process leads to a very fast laying rate even when handling large diameter pipes, from 2 up to 6 km / day. For greater depths and larger diameter pipelines the main alternative to S-lay is the J-lay method. It is based on applying the axial force in a near-vertical direction, virtually eliminating any horizontal reaction on the vessel equipment. The most recent example of the J- lay method is its recent application to the construction of the $3.2 billion Blue Stream Project, designed to deliver Russian gas across the Black Sea to Turkey.
As installation and intervention works represent about half of the cost to lay a pipeline over a difficult seabed, these developments have contributed to lower unit costs and have made possible deep-water projects that were previously impossible. 3.2 LNG economics LNG projects are very much capital intensive. The cost of the entire chain from wellhead to the receiving terminal can be around US$4 billion. As in the case of pipelines, economies of scale are very significant:
Liquefaction plants typically consist of one or two processing trains. The economic size of each train is now about 3 to 3.5 million tonnes per year. With this size of project, the capital cost of just the LNG production facility is in the $1-2 billions range. Adding a second train once a plant is built can reduce the overall unit cost of liquefaction by 20-30%. A single-train plant normally costs around $1 billion, although actual costs vary geographically according to land costs, environmental and safety regulations, labour costs and other local market conditions.
Technological progress achieved in the past decades has led to a sharp decrease in investment and operating costs of liquefaction plants. The average unit investment for a liquefaction
22nd World Gas Conference Tokyo 2003 7
plant dropped from some $550 a ton a year of capacity in the 1960s, to approximately $350 in the 1970s and 1980s, and $250 in the late 1990s. For projects starting operation today, the price is slightly under $200 (all in current dollars).
Transport costs are largely a function of the distance between the liquefaction and regasification terminals and the size of the vessel. Using a larger number of smaller carriers offers more flexibility and reduced storage requirements but raises unit shipping costs. The largest LNG carriers today have a maximum capacity of 135,000-138,000 m3. They cost around $170 million to build. Substantial reductions in cost have been achieved over the past decades thanks to economies of scale. Tanker sizes have increased from some 40,000 m3 for the first generation to a range of 130,000 to 140,000 m3 nowadays.
Regasification plant construction costs depend on throughput capacity, land development and labour costs (which vary considerably according to location), and storage capacity. Economies of scale are most significant for storage. These are maximised for storage tank capacities of about 150,000 m3 – the largest feasible at present.
The last five to ten years have seen some major reductions in LNG supply costs. These have come largely from increases in train size, improved fuel efficiency in liquefaction and regasification (mainly from high-efficiency gas turbines in on-site co-generation facilities), improved equipment design, the elimination of gold-plating and better utilisation of available capacity. Liquefaction costs have fallen typically by 25% to 35% and shipping costs by 20% to 30% from 1990 to 2000. The cost of regasification has fallen less than costs for the other parts of the LNG chain since the 1960s. Technology and productivity gains have been largely offset by higher storage costs, the largest single cost component.
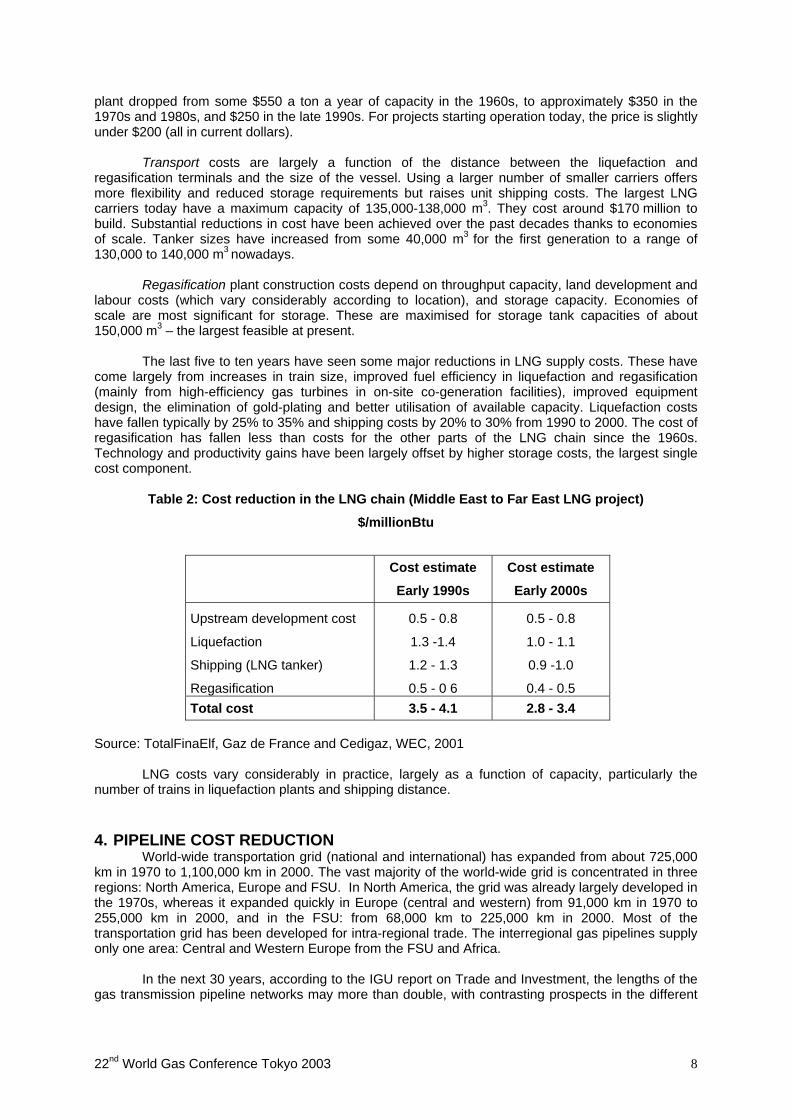
Table 2: Cost reduction in the LNG chain (Middle East to Far East LNG project) $/millionBtu
Source: TotalFinaElf, Gaz de France and Cedigaz, WEC, 2001
Cost estimate Early 1990s
Cost estimate Early 2000s
Upstream development cost
Liquefaction
Shipping (LNG tanker)
Regasification
0.5 - 0.8
1.3 -1.4
1.2 - 1.3
0.5 - 0 6
0.5 - 0.8
1.0 - 1.1
0.9 -1.0
0.4 - 0.5 Total cost 3.5 - 4.1 2.8 - 3.4
LNG costs vary considerably in practice, largely as a function of capacity, particularly the
number of trains in liquefaction plants and shipping distance. 4. PIPELINE COST REDUCTION
World-wide transportation grid (national and international) has expanded from about 725,000 km in 1970 to 1,100,000 km in 2000. The vast majority of the world-wide grid is concentrated in three regions: North America, Europe and FSU. In North America, the grid was already largely developed in the 1970s, whereas it expanded quickly in Europe (central and western) from 91,000 km in 1970 to 255,000 km in 2000, and in the FSU: from 68,000 km to 225,000 km in 2000. Most of the transportation grid has been developed for intra-regional trade. The interregional gas pipelines supply only one area: Central and Western Europe from the FSU and Africa.
In the next 30 years, according to the IGU report on Trade and Investment, the lengths of the gas transmission pipeline networks may more than double, with contrasting prospects in the different
22nd World Gas Conference Tokyo 2003 8
world regions. In South Asia, in the Middle East and in East Asia, the lengths currently in place will increase seven-fold. Two thirds of the 1,400,000 km of additional networks will be laid in three areas: North America (500,000 km), FSU (240,000 km) and Central & West Europe (170,000 km). This development will call for investments ranging from US$ 240 to 600 billion over 2001 - 2030.
Improvement to the transport technology is the key for extending the world-wide gas grid. In the past, the progress has been most rapid in offshore pipeline technology. New technologies have been developed, including automatic laying methods, the use of high tensile steels and high pressure transport. Such technologies may be progressively applied also onshore, with a significant impact on the development of an interconnected grid at the intercontinental scale. Cost reductions can be expected from stronger steels, high-pressure technology, and deepwater pipe-laying.
High pressure (HP) technology is expected to play a major role in reducing the unit cost of large-scale, long-distance pipeline projects. HP technology is more economic than conventional technology for an annual throughput capacity of more than 10 109 m3, and its competitiveness improves linearly with capacity. Cost savings for a transmission system of 5,000 km with a capacity of 15 to 30 109 m3/ year, are estimated at 10% to 30%.
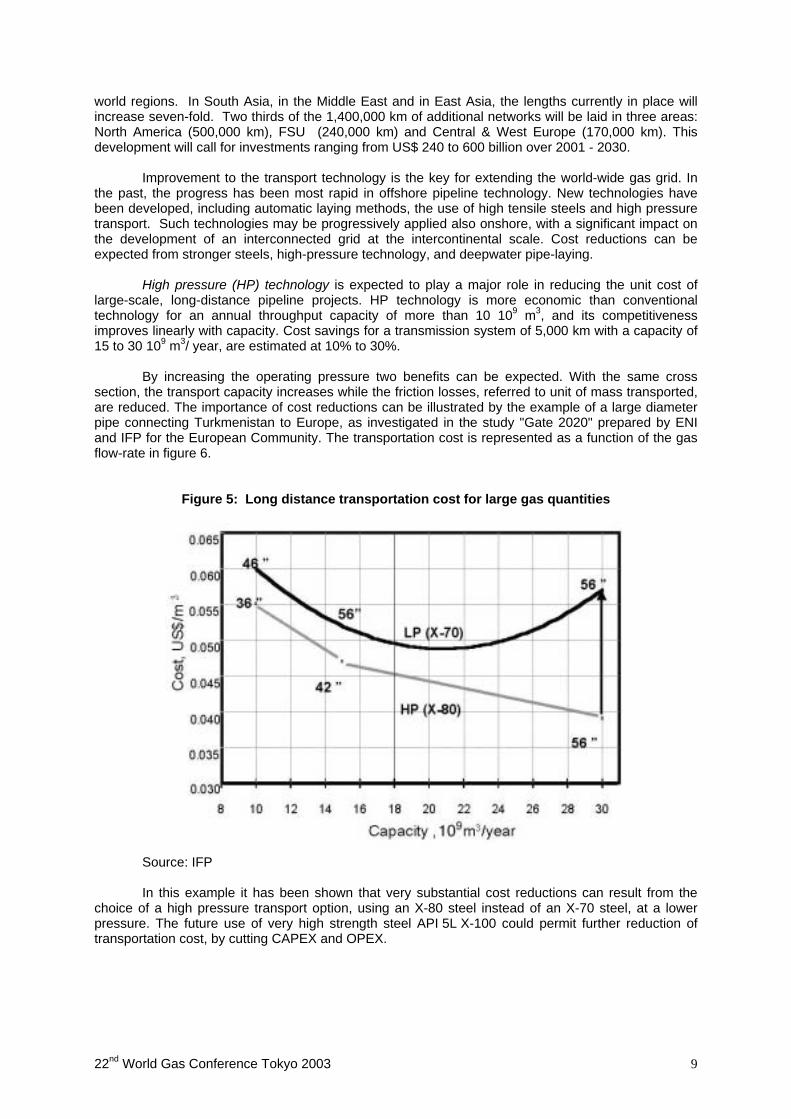
By increasing the operating pressure two benefits can be expected. With the same cross section, the transport capacity increases while the friction losses, referred to unit of mass transported, are reduced. The importance of cost reductions can be illustrated by the example of a large diameter pipe connecting Turkmenistan to Europe, as investigated in the study "Gate 2020" prepared by ENI and IFP for the European Community. The transportation cost is represented as a function of the gas flow-rate in figure 6.
Figure 5: Long distance transportation cost for large gas quantities
Source: IFP
In this example it has been shown that very substantial cost reductions can result from the
choice of a high pressure transport option, using an X-80 steel instead of an X-70 steel, at a lower pressure. The future use of very high strength steel API 5L X-100 could permit further reduction of transportation cost, by cutting CAPEX and OPEX.
22nd World Gas Conference Tokyo 2003 9
Gas pipeline systems are expected to remain the basic transportation system for intra-regional trade (North America, Europe, South America). Some major trunk-lines linking production areas with the expanding markets, are expected to be characterised by:
• very large capacity, from 15 to 30 109 m3/year;
• long distances;
• geological complex and challenging environments.
High-pressure pipelines are the only solution capable of reconciling the transport requirements with the reduction of the transportation costs. According to the Gate 2020 Survey, further progress in deep-water pipeline technology can be expected in the following areas:
• the use of higher grade steels, which reduce pipeline weight (and therefore the amount of steel required) and make pipe-laying quicker and easier;
• improved manufacturing processes, including sophisticated computer techniques for optimising pipe design criteria that allow for reduced pipe-wall thickness and material cost savings;
• large-diameter pipeline-laying techniques such as J-laying, which reduces the curvature of the line and, therefore, stress during laying allowing the use of lighter pipes;
• High Frequency Induced (HFI) pipes, an alternative to seamless pipes, which can be up to 30% cheaper due to reduced construction and welding costs;
• advanced seabed-surveying techniques, which permit optimisation of steel weight, concrete coating and trenching for pipeline stability.
• improved insulation to reduce hydrate problems.
Practical examples of the application of these advances include the Blue Stream pipeline under the Black Sea, which was commissioned at the end of 2002. This project involved the construction of two parallel lines across the sea at a maximum depth of 2,150 metres. Water depths in the range of 3000 to 3500 m seem accessible in the near future. These advances will lower supply costs and contribute to a growing interconnection of the pipeline grid.
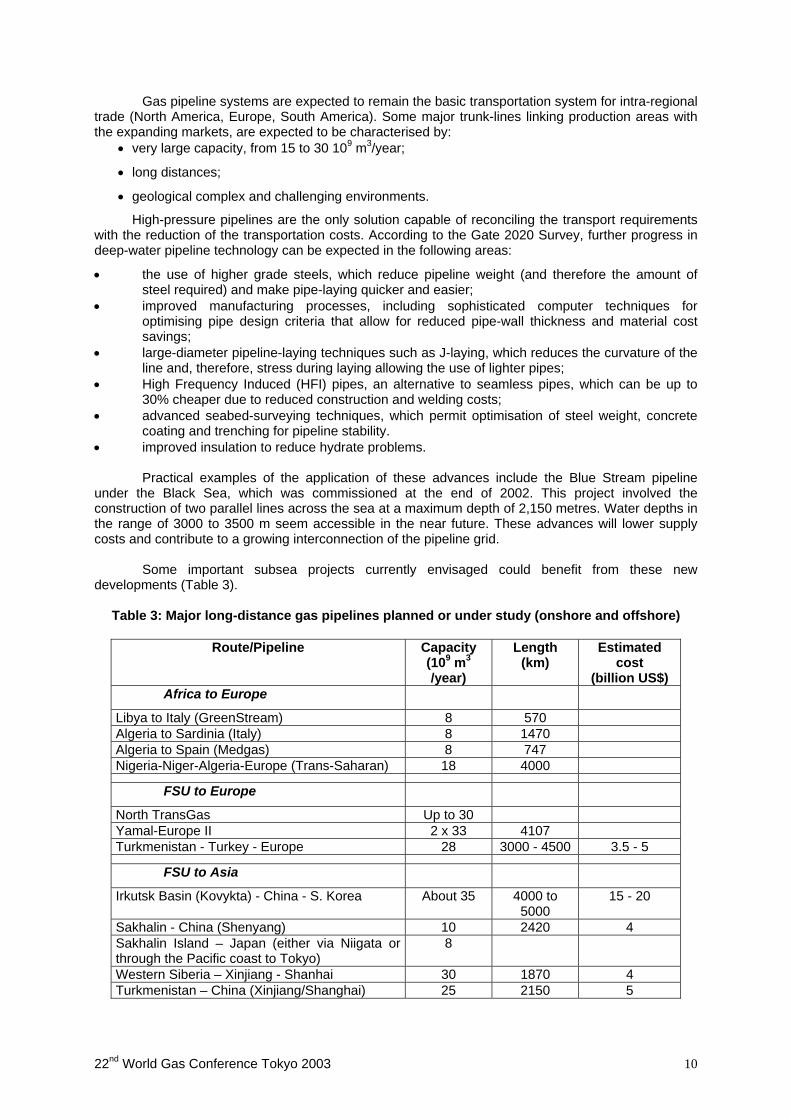
Some important subsea projects currently envisaged could benefit from these new developments (Table 3).
Table 3: Major long-distance gas pipelines planned or under study (onshore and offshore)
Route/Pipeline Capacity (109 m3 /year)
Length (km)
Estimated cost
(billion US$) Africa to Europe
Libya to Italy (GreenStream) 8 570 Algeria to Sardinia (Italy) 8 1470 Algeria to Spain (Medgas) 8 747 Nigeria-Niger-Algeria-Europe (Trans-Saharan) 18 4000
FSU to Europe
North TransGas Up to 30 Yamal-Europe II 2 x 33 4107 Turkmenistan - Turkey - Europe 28 3000 - 4500 3.5 - 5
FSU to Asia
Irkutsk Basin (Kovykta) - China - S. Korea About 35 4000 to 5000
15 - 20
Sakhalin - China (Shenyang) 10 2420 4 Sakhalin Island – Japan (either via Niigata or through the Pacific coast to Tokyo)
8
Western Siberia – Xinjiang - Shanhai 30 1870 4 Turkmenistan – China (Xinjiang/Shanghai) 25 2150 5
22nd World Gas Conference Tokyo 2003 10
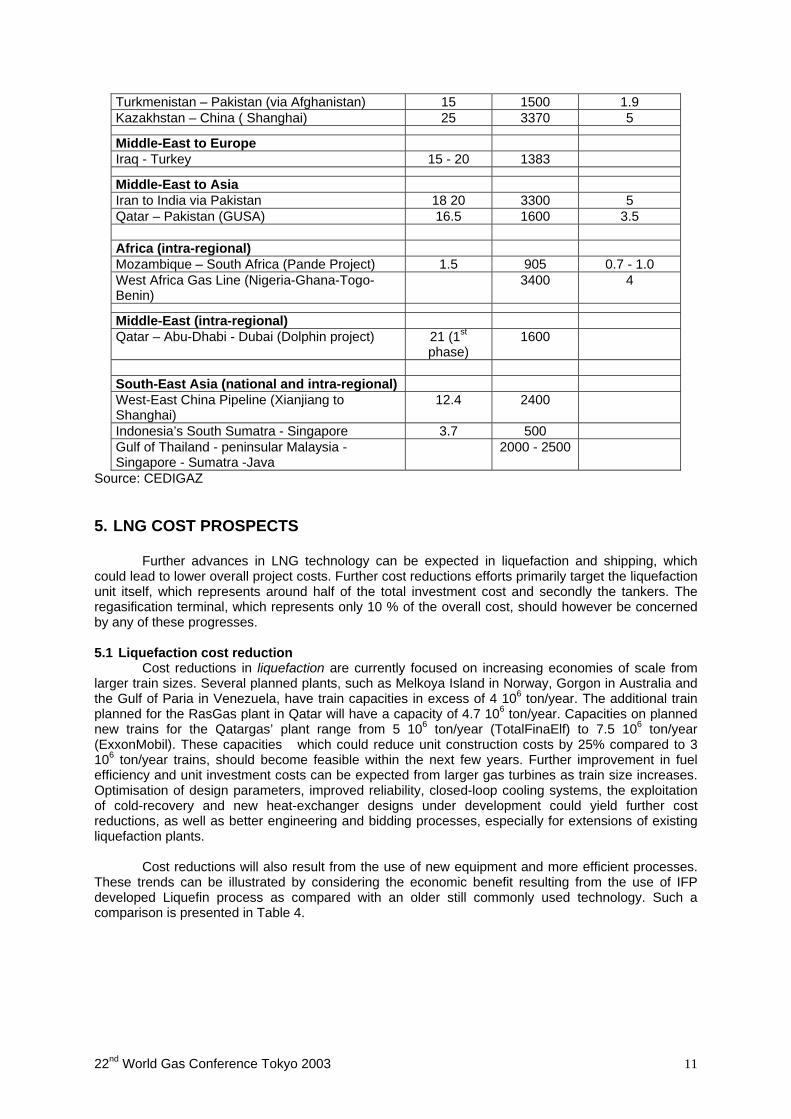
Turkmenistan – Pakistan (via Afghanistan) 15 1500 1.9 Kazakhstan – China ( Shanghai) 25 3370 5
Middle-East to Europe Iraq - Turkey 15 - 20 1383
Middle-East to Asia Iran to India via Pakistan 18 20 3300 5 Qatar – Pakistan (GUSA) 16.5 1600 3.5 Africa (intra-regional) Mozambique – South Africa (Pande Project) 1.5 905 0.7 - 1.0 West Africa Gas Line (Nigeria-Ghana-Togo-Benin)
3400 4
Middle-East (intra-regional) Qatar – Abu-Dhabi - Dubai (Dolphin project) 21 (1st
phase) 1600
South-East Asia (national and intra-regional) West-East China Pipeline (Xianjiang to Shanghai)
12.4 2400
Indonesia’s South Sumatra - Singapore 3.7 500 Gulf of Thailand - peninsular Malaysia - Singapore - Sumatra -Java
2000 - 2500
Source: CEDIGAZ 5. LNG COST PROSPECTS
Further advances in LNG technology can be expected in liquefaction and shipping, which could lead to lower overall project costs. Further cost reductions efforts primarily target the liquefaction unit itself, which represents around half of the total investment cost and secondly the tankers. The regasification terminal, which represents only 10 % of the overall cost, should however be concerned by any of these progresses. 5.1 Liquefaction cost reduction
Cost reductions in liquefaction are currently focused on increasing economies of scale from larger train sizes. Several planned plants, such as Melkoya Island in Norway, Gorgon in Australia and the Gulf of Paria in Venezuela, have train capacities in excess of 4 106 ton/year. The additional train planned for the RasGas plant in Qatar will have a capacity of 4.7 106 ton/year. Capacities on planned new trains for the Qatargas’ plant range from 5 106 ton/year (TotalFinaElf) to 7.5 106 ton/year (ExxonMobil). These capacities which could reduce unit construction costs by 25% compared to 3 106 ton/year trains, should become feasible within the next few years. Further improvement in fuel efficiency and unit investment costs can be expected from larger gas turbines as train size increases. Optimisation of design parameters, improved reliability, closed-loop cooling systems, the exploitation of cold-recovery and new heat-exchanger designs under development could yield further cost reductions, as well as better engineering and bidding processes, especially for extensions of existing liquefaction plants.
Cost reductions will also result from the use of new equipment and more efficient processes. These trends can be illustrated by considering the economic benefit resulting from the use of IFP developed Liquefin process as compared with an older still commonly used technology. Such a comparison is presented in Table 4.
22nd World Gas Conference Tokyo 2003 11
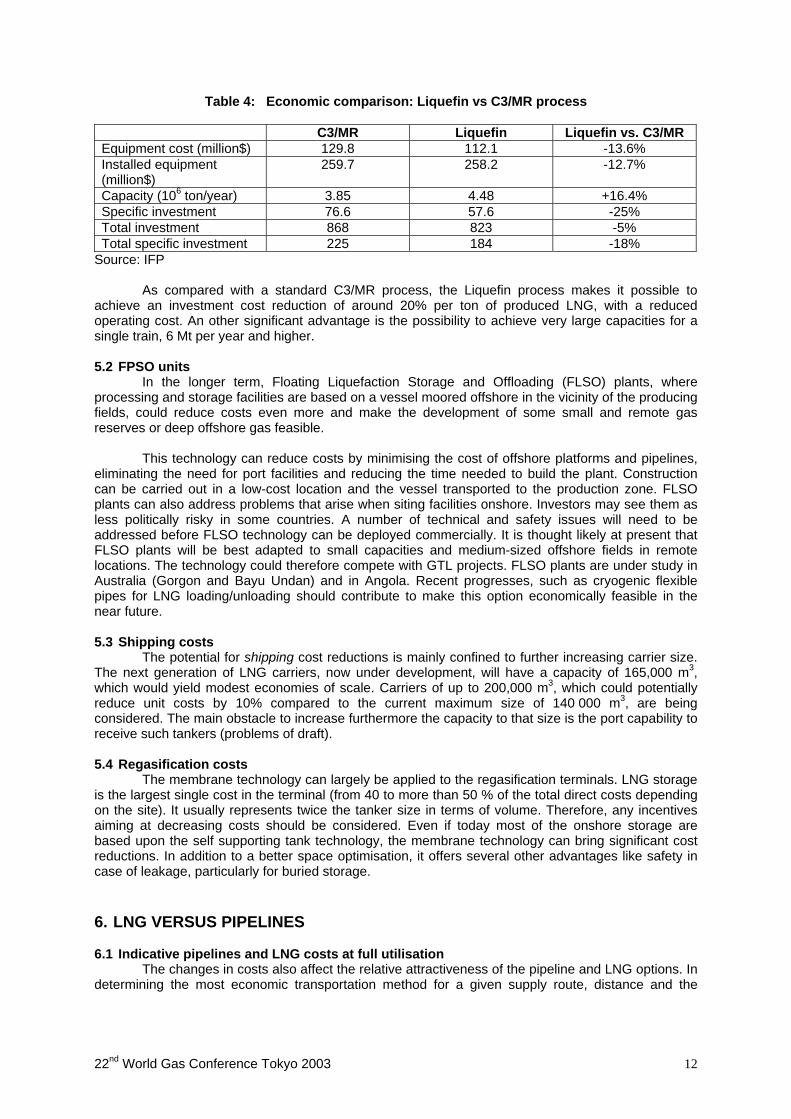
Table 4: Economic comparison: Liquefin vs C3/MR process C3/MR Liquefin Liquefin vs. C3/MR Equipment cost (million$) 129.8 112.1 -13.6% Installed equipment (million$)
259.7 258.2 -12.7%
Capacity (106 ton/year) 3.85 4.48 +16.4% Specific investment 76.6 57.6 -25% Total investment 868 823 -5% Total specific investment 225 184 -18%
Source: IFP
As compared with a standard C3/MR process, the Liquefin process makes it possible to achieve an investment cost reduction of around 20% per ton of produced LNG, with a reduced operating cost. An other significant advantage is the possibility to achieve very large capacities for a single train, 6 Mt per year and higher. 5.2 FPSO units
In the longer term, Floating Liquefaction Storage and Offloading (FLSO) plants, where processing and storage facilities are based on a vessel moored offshore in the vicinity of the producing fields, could reduce costs even more and make the development of some small and remote gas reserves or deep offshore gas feasible.
This technology can reduce costs by minimising the cost of offshore platforms and pipelines, eliminating the need for port facilities and reducing the time needed to build the plant. Construction can be carried out in a low-cost location and the vessel transported to the production zone. FLSO plants can also address problems that arise when siting facilities onshore. Investors may see them as less politically risky in some countries. A number of technical and safety issues will need to be addressed before FLSO technology can be deployed commercially. It is thought likely at present that FLSO plants will be best adapted to small capacities and medium-sized offshore fields in remote locations. The technology could therefore compete with GTL projects. FLSO plants are under study in Australia (Gorgon and Bayu Undan) and in Angola. Recent progresses, such as cryogenic flexible pipes for LNG loading/unloading should contribute to make this option economically feasible in the near future. 5.3 Shipping costs
The potential for shipping cost reductions is mainly confined to further increasing carrier size. The next generation of LNG carriers, now under development, will have a capacity of 165,000 m3, which would yield modest economies of scale. Carriers of up to 200,000 m3, which could potentially reduce unit costs by 10% compared to the current maximum size of 140 000 m3, are being considered. The main obstacle to increase furthermore the capacity to that size is the port capability to receive such tankers (problems of draft). 5.4 Regasification costs
The membrane technology can largely be applied to the regasification terminals. LNG storage is the largest single cost in the terminal (from 40 to more than 50 % of the total direct costs depending on the site). It usually represents twice the tanker size in terms of volume. Therefore, any incentives aiming at decreasing costs should be considered. Even if today most of the onshore storage are based upon the self supporting tank technology, the membrane technology can bring significant cost reductions. In addition to a better space optimisation, it offers several other advantages like safety in case of leakage, particularly for buried storage.
6. LNG VERSUS PIPELINES 6.1 Indicative pipelines and LNG costs at full utilisation
The changes in costs also affect the relative attractiveness of the pipeline and LNG options. In determining the most economic transportation method for a given supply route, distance and the
22nd World Gas Conference Tokyo 2003 12
volumes transported are the key factors. For short distances, pipelines – where feasible – are usually more economic. LNG is more competitive for long distance routes, since overall costs are less affected by distance. The normal breakeven distance for a single-train LNG project against a 42” onshore pipeline (not allowing for transit costs) is around 4,500 km at a cost of around $1.60/millionBtu. The breakeven point has tended to fall over the last decade, as LNG costs have fallen faster than pipeline costs. But technology advances have made possible short-distance offshore pipelines where previously LNG had been the only viable option.
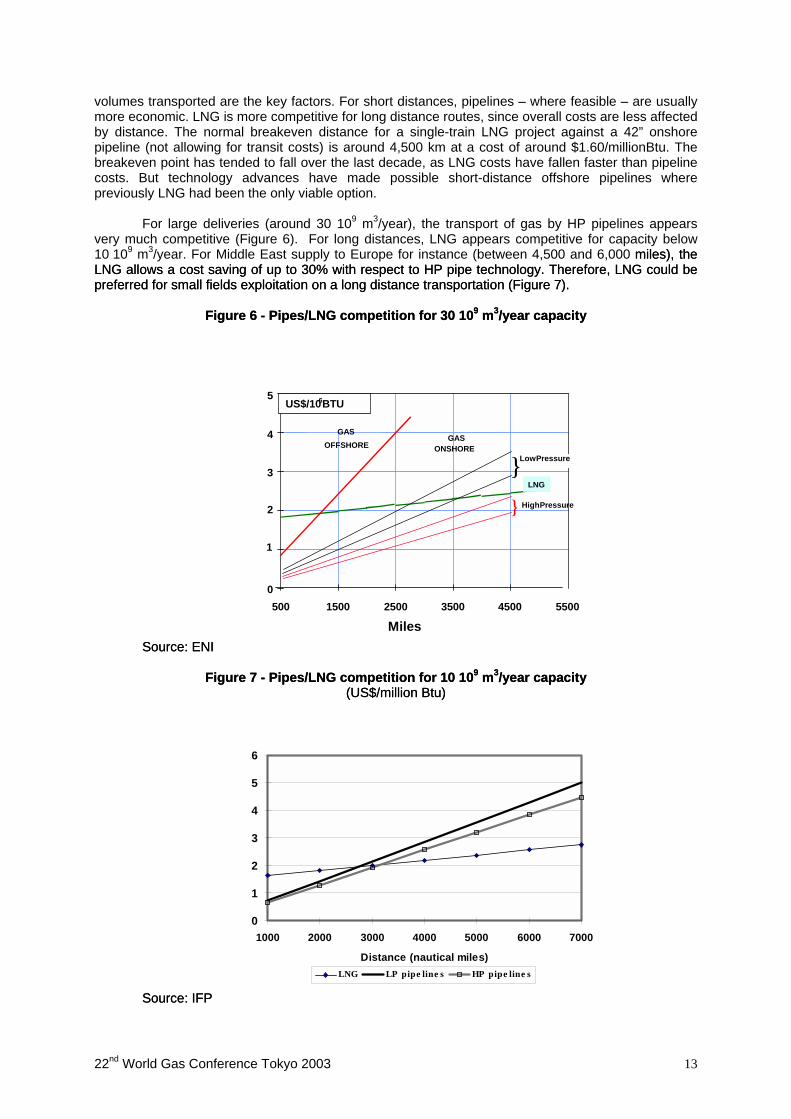
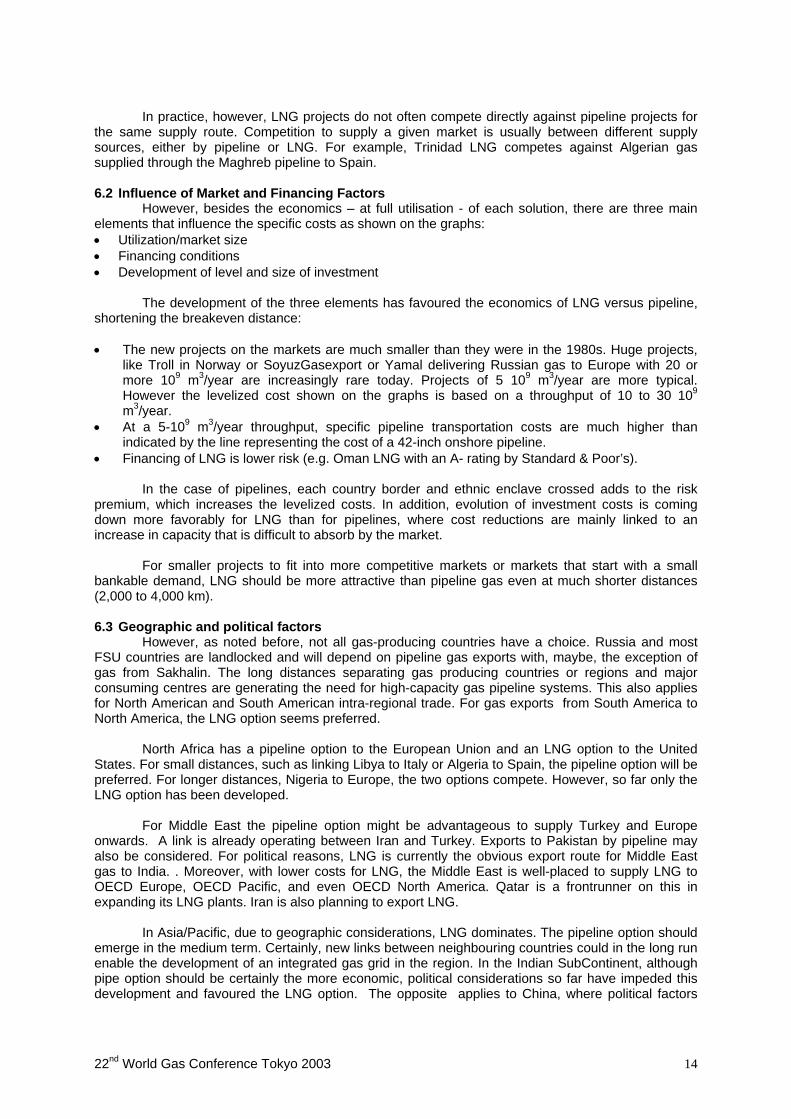
For large deliveries (around 30 109 m3/year), the transport of gas by HP pipelines appears very much competitive (Figure 6). For long distances, LNG appears competitive for capacity below 10 109 m3/year. For Middle East supply to Europe for instance (between 4,500 and 6,000 miles), the LNG allows a cost saving of up to 30% with respect to HP pipe technology. Therefore, LNG could be preferred for small fields exploitation on a long distance transportation (Figure 7).
miles), the LNG allows a cost saving of up to 30% with respect to HP pipe technology. Therefore, LNG could be preferred for small fields exploitation on a long distance transportation (Figure 7).
Figure 6 - Pipes/LNG competition for 30 109 m3/year capacity Figure 6 - Pipes/LNG competition for 30 109 m3/year capacity
5
5500
Miles
0
1
2
3
4
500 1500 2500 3500 4500
GASOFFSHORE
LNG
GASONSHORE
LowPressure
HighPressure
}
US$/106BTU
}
Source: ENI Source: ENI
Figure 7 - Pipes/LNG competition for 10 109 m3/year capacity Figure 7 - Pipes/LNG competition for 10 109 m3/year capacity (US$/million Btu) (US$/million Btu)
0
1
2
3
4
5
6
1000 2000 3000 4000 5000 6000 7000
Distance (nautical miles)LNG LP pipe line s HP pipe line s
Source: IFP Source: IFP
22nd World Gas Conference Tokyo 2003 13
In practice, however, LNG projects do not often compete directly against pipeline projects for
the same supply route. Competition to supply a given market is usually between different supply sources, either by pipeline or LNG. For example, Trinidad LNG competes against Algerian gas supplied through the Maghreb pipeline to Spain.
6.2 Influence of Market and Financing Factors
However, besides the economics – at full utilisation - of each solution, there are three main elements that influence the specific costs as shown on the graphs: • Utilization/market size • Financing conditions • Development of level and size of investment
The development of the three elements has favoured the economics of LNG versus pipeline, shortening the breakeven distance: • The new projects on the markets are much smaller than they were in the 1980s. Huge projects,
like Troll in Norway or SoyuzGasexport or Yamal delivering Russian gas to Europe with 20 or more 109 m3/year are increasingly rare today. Projects of 5 109 m3/year are more typical. However the levelized cost shown on the graphs is based on a throughput of 10 to 30 109 m3/year.
• At a 5-109 m3/year throughput, specific pipeline transportation costs are much higher than indicated by the line representing the cost of a 42-inch onshore pipeline.
• Financing of LNG is lower risk (e.g. Oman LNG with an A- rating by Standard & Poor’s).
In the case of pipelines, each country border and ethnic enclave crossed adds to the risk premium, which increases the levelized costs. In addition, evolution of investment costs is coming down more favorably for LNG than for pipelines, where cost reductions are mainly linked to an increase in capacity that is difficult to absorb by the market.
For smaller projects to fit into more competitive markets or markets that start with a small bankable demand, LNG should be more attractive than pipeline gas even at much shorter distances (2,000 to 4,000 km). 6.3 Geographic and political factors
However, as noted before, not all gas-producing countries have a choice. Russia and most FSU countries are landlocked and will depend on pipeline gas exports with, maybe, the exception of gas from Sakhalin. The long distances separating gas producing countries or regions and major consuming centres are generating the need for high-capacity gas pipeline systems. This also applies for North American and South American intra-regional trade. For gas exports from South America to North America, the LNG option seems preferred.
North Africa has a pipeline option to the European Union and an LNG option to the United States. For small distances, such as linking Libya to Italy or Algeria to Spain, the pipeline option will be preferred. For longer distances, Nigeria to Europe, the two options compete. However, so far only the LNG option has been developed.
For Middle East the pipeline option might be advantageous to supply Turkey and Europe onwards. A link is already operating between Iran and Turkey. Exports to Pakistan by pipeline may also be considered. For political reasons, LNG is currently the obvious export route for Middle East gas to India. . Moreover, with lower costs for LNG, the Middle East is well-placed to supply LNG to OECD Europe, OECD Pacific, and even OECD North America. Qatar is a frontrunner on this in expanding its LNG plants. Iran is also planning to export LNG.
In Asia/Pacific, due to geographic considerations, LNG dominates. The pipeline option should emerge in the medium term. Certainly, new links between neighbouring countries could in the long run enable the development of an integrated gas grid in the region. In the Indian SubContinent, although pipe option should be certainly the more economic, political considerations so far have impeded this development and favoured the LNG option. The opposite applies to China, where political factors
22nd World Gas Conference Tokyo 2003 14
have favoured the development of an East-West pipeline. However, the LNG option is also in progress.
The transport of gas by pipeline will maintain a primary role in the intra-regional gas trade. Despite the development of intercontinental gas pipelines, LNG should play a growing role in inter-regional trade. It allows supply diversification and provides increased flexibility in gas trade. 7. NEW TECHNOLOGIES 7.1 CNG and hydrates
LNG and pipelines are not the only options to transport natural gas. New developments (Coselle, Enersea…) are under way, using dedicated gas carriers to transport Compressed Natural Gas (CNG). The CNG technology may have the potential to challenge LNG transportation for some niche markets, namely for short distances and small markets (such as the Caribbean market, for instance). However, the feasibility and economics of this new technology still needs to be tested. Another option which is also explored, with similar purposes, consists in transporting natural gas in the form of hydrates. 7.2 Gas-to-Liquids Technology
As the outlets for the LNG and GTL chains are completely different, their markets appear complementary rather than competing. LNG is aimed at gas markets, while GTL is meant for a fuel market. The approach taken in this section is therefore not to compare the cost of GTL versus LNG, but rather to consider GTL as an alternative way of exploiting gas reserves in remote gas rich areas where no local market exits.
Advances in technology, increases in reserves in remote locations and higher oil prices have recently stimulated a surge in interest in developing GTL projects. GTL plants produce conventional oil products as well as specialist products. All the plants already in operation, under construction or planned are based on the Fischer-Tropsch technology originally developed in Germany in the 1920s. Recent technical advances, including improved catalysts, have significantly improved liquid yields and reduced both capital and operating costs. GTL technology is now seen as a potential alternative to LNG as a way of exploiting gas reserves in remote locations.
Three commercial scale GTL plants in the world have been designed and built under special economic circumstances: Mobil MTG in New Zealand, Mossgas in South Africa and Bintulu in Malaysia. The technology has now reached a decisive turning point. Two commercial plants - one already fully financed - are moving forwards to scheduled on stream dates in 2005; Qatar is evaluating a raft of proposals for GTL plants based on competing technologies; and projects are under active study in seven other countries. Shell plans four 75,000- barril per day (b/d) plants, possibly in Egypt, Indonesia, Iran and Trinidad and Tobago.
Output of liquids from GTL plants is projected to jump from 43,000 b/d now to around
300,000 b/d by 2010 and 2.3 million b/d by 2030. These projections are highly dependent on oil-price developments and the successful demonstration of emerging technologies. Beyond 2010, GTL plants could potentially lead to the development of a large volume of gas reserves. In WEO 2002, global GTL demand for gas is projected to increase from 4 109 m3 in 2000 to 21 109 m3 in 2010 and 170 109 m3 in 2030. The rate of increase in GTL production is nonetheless subject to enormous uncertainty, particularly after 2010.
The economics of GTL processing are highly dependent on plant construction costs, product types and yields and the energy efficiency of the plant, as well as the market prices of the liquids produced and the cost of the gas feedstock. GTL plants are complex and capital-intensive, requiring large sites and construction lead times of two-and-a-half to three years. They are also very energy-intensive, consuming up to 45% of the gas feedstock. This characteristic raises concerns about CO2 emissions. On the other hand, GTL plants generally produce a range of middle distillates with good environmental qualities, demand for which is rising.
22nd World Gas Conference Tokyo 2003 15
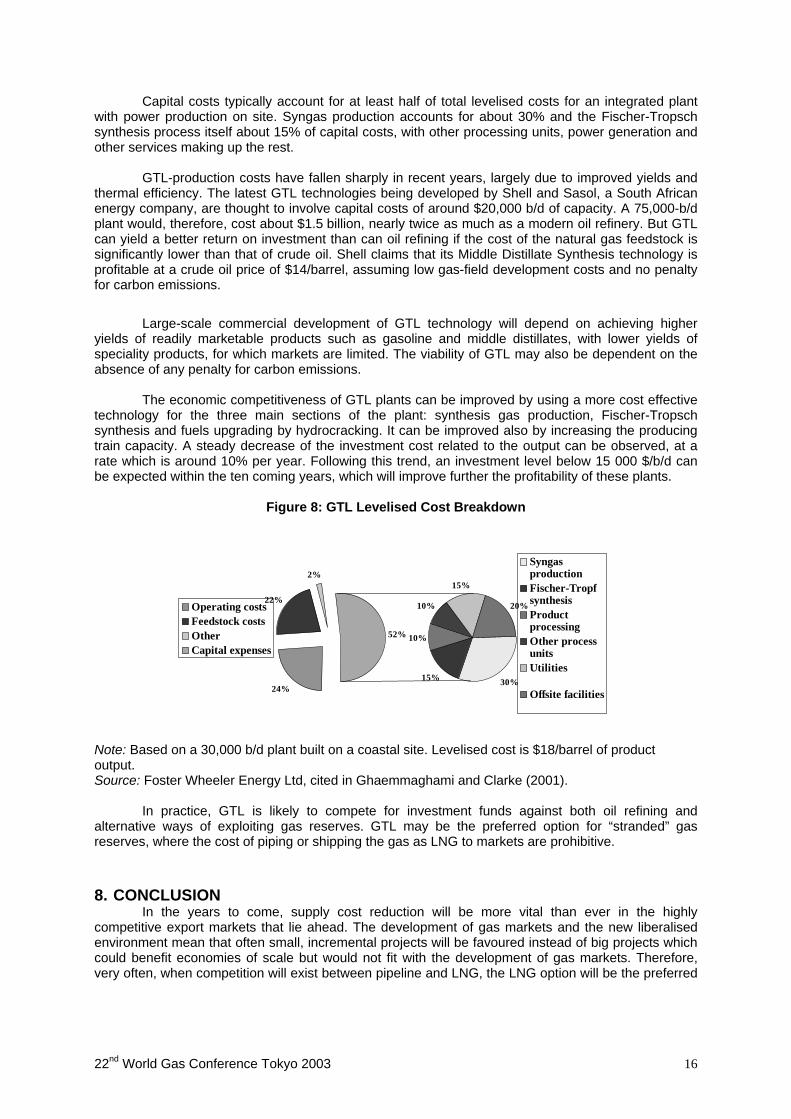
Capital costs typically account for at least half of total levelised costs for an integrated plant with power production on site. Syngas production accounts for about 30% and the Fischer-Tropsch synthesis process itself about 15% of capital costs, with other processing units, power generation and other services making up the rest.
GTL-production costs have fallen sharply in recent years, largely due to improved yields and thermal efficiency. The latest GTL technologies being developed by Shell and Sasol, a South African energy company, are thought to involve capital costs of around $20,000 b/d of capacity. A 75,000-b/d plant would, therefore, cost about $1.5 billion, nearly twice as much as a modern oil refinery. But GTL can yield a better return on investment than can oil refining if the cost of the natural gas feedstock is significantly lower than that of crude oil. Shell claims that its Middle Distillate Synthesis technology is profitable at a crude oil price of $14/barrel, assuming low gas-field development costs and no penalty for carbon emissions.
Large-scale commercial development of GTL technology will depend on achieving higher
yields of readily marketable products such as gasoline and middle distillates, with lower yields of speciality products, for which markets are limited. The viability of GTL may also be dependent on the absence of any penalty for carbon emissions.
The economic competitiveness of GTL plants can be improved by using a more cost effective technology for the three main sections of the plant: synthesis gas production, Fischer-Tropsch synthesis and fuels upgrading by hydrocracking. It can be improved also by increasing the producing train capacity. A steady decrease of the investment cost related to the output can be observed, at a rate which is around 10% per year. Following this trend, an investment level below 15 000 $/b/d can be expected within the ten coming years, which will improve further the profitability of these plants.
Figure 8: GTL Levelised Cost Breakdown
24%
22%
2%
52%
Operating costsFeedstock costsOtherCapital expenses
30%15%
10%
10%
15%
20%
SyngasproductionFischer-TropfsynthesisProductprocessingOther processunitsUtilities
Offsite facilities
Note: Based on a 30,000 b/d plant built on a coastal site. Levelised cost is $18/barrel of product output. Source: Foster Wheeler Energy Ltd, cited in Ghaemmaghami and Clarke (2001).
In practice, GTL is likely to compete for investment funds against both oil refining and alternative ways of exploiting gas reserves. GTL may be the preferred option for “stranded” gas reserves, where the cost of piping or shipping the gas as LNG to markets are prohibitive. 8. CONCLUSION
In the years to come, supply cost reduction will be more vital than ever in the highly competitive export markets that lie ahead. The development of gas markets and the new liberalised environment mean that often small, incremental projects will be favoured instead of big projects which could benefit economies of scale but would not fit with the development of gas markets. Therefore, very often, when competition will exist between pipeline and LNG, the LNG option will be the preferred
22nd World Gas Conference Tokyo 2003 16
22nd World Gas Conference Tokyo 2003 17
one, thanks to its flexibility. Nevertheless, a major part of trans-national trade will be only feasible by long-distance gas pipelines.
Major cost reductions in transportation of gas and LNG are still expected and in particular for HP long-distance pipelines. This should enable a spectacular development of cross-border gas trade. However, the industry is increasingly looking for additional ways to monetize remote reserves (GTL), while further reducing transportation costs. While any gas project is subject to price, volume and regulatory risks, closer co-operation between the players will become more than ever a pre-requisite in order to get projects off the ground. REFERENCES 1. Cedigaz (2002), Natural Gas in the World – 2001 Survey, Rueil Malmaison 2. Cedigaz (2003), Online LNG Worldwide Statistics, Rueil Malmaison 3. Cedigaz News Report, Rueil Malmaison, various issues 4. ENI/IFP (2001), Gate 2020 – Gas Advanced Technology, Brussels; CEC. 5. IGU (2003), Report on Trade and Investments to 2030, IGU Committee 9 (to be published in June
2003) 6. International Energy Agency (IEA) (2002), World Energy Outlook 2002, Paris: Organisation for Economic Cooperation and Development 7. IEA (2002), Natural Gas Information 2002, Paris: OECD 8. IEA (2002), Flexibility in Natural Gas supply and demand, Paris: OECD 9. IEA (2001), World Energy Outlook 2001 Insights - Assessing Today’s Supplies to Fuel Tomorrow’s Growth, Paris: OECD 10. World LNG Prospects: Favorable Parameters For A New Growth Era, 18th World Energy Congress - Buenos Aires - Argentina (October 21 - 25, 2001), VALAIS Michel, TotalFinaElf, France, CHABREL.IE Marie-Françoise, Cedigaz, France, LEFEUVRE Thierry, Gaz de France, France.