The Challenge of Making Universal Prekindergarten a Reality in New York State
27
The Challenge of Making Universal Prekindergarten a Reality in New York State October 2013
-
Upload
gothamschoolsorg -
Category
Documents
-
view
221 -
download
0
Transcript of The Challenge of Making Universal Prekindergarten a Reality in New York State

7/27/2019 The Challenge of Making Universal Prekindergarten a Reality in New York State
http://slidepdf.com/reader/full/the-challenge-of-making-universal-prekindergarten-a-reality-in-new-york-state 1/27
The Challenge of Making
Universal Prekindergarten aReality in New York StateOctober 2013
7/27/2019 The Challenge of Making Universal Prekindergarten a Reality in New York State
http://slidepdf.com/reader/full/the-challenge-of-making-universal-prekindergarten-a-reality-in-new-york-state 2/27
FOREWORD
Founded in 1932, the Citizens Budget Commission (CBC) is a nonprofit, nonpartisan civic organization
devoted to influencing constructive change in the finances and services of New York State and New
York City governments. A major activity of the Commission is conducting research on the financial andmanagement practices of the State and City.
This report was prepared by Elizabeth Lynam, Vice President and Director of State Studies, and Tammy
Gamerman, Senior Research Associate. Research assistance was provided by Research Consultants
Julia Radunsky, Mateusz Zacharski and Gal Fix, and Research Associate Ben Eisen.
The CBC would like to thank the following reviewers for their invaluable comments and suggestions: 1)
De’Shawn Wright, New York State Deputy Secretary for Education; 2) Joseph Conroy, Education
Finance Director, New York State Education Department; 3) Billy Easton, Executive Director, Alliance
for Quality Education; 4) Michael Rebell, Executive Director of the Campaign for Educational Equity at
Teachers College Columbia University, and Jessica Wolff, Policy Director of the Campaign forEducational Equity at Teachers College Columbia University; and 5) Nancy Kolben, Executive Director,
Center for Children’s Initiatives, and Betty Holcomb, Director of Policy, Center for Children’s Initiatives.
The views expressed in the report are solely those of the CBC.
7/27/2019 The Challenge of Making Universal Prekindergarten a Reality in New York State
http://slidepdf.com/reader/full/the-challenge-of-making-universal-prekindergarten-a-reality-in-new-york-state 3/27
CONTENTS
Foreword ................................................................................................................................................ 2
Introduction ............................................................................................................................................ 4
New York’s Current Pre-k Program is Still Far From Universal ................................................................ 5
New York Spends Less per Pupil than National Norms and Neighboring States but Reaches More
Students ............................................................................................................................................... 10
The Fiscal Implications of Fully Funding High-Quality UPK ................................................................... 13
conclusion ............................................................................................................................................. 15
Appendix A: Studies of the Benefits of Pre-K Programs ........................................................................ 16
Appendix B: Cost Estimate Methodology .............................................................................................. 19
Appendix C: Cost Estimates for New York City ..................................................................................... 22
Endnotes............................................................................................................................................... 23

7/27/2019 The Challenge of Making Universal Prekindergarten a Reality in New York State
http://slidepdf.com/reader/full/the-challenge-of-making-universal-prekindergarten-a-reality-in-new-york-state 4/27
The Challenge of Making Universal Prekindergarten a Reality
4
INTRODUCTION
The expansion of preschool opportunities has been receiving attention of late from national, state and
local leaders. President Obama’s 2013 State of the Union Address called for access to high-quality
preschool for every child, and he proposed to make federal funds available to improve preschool accessand quality for children from low- and moderate-income families.1 In New York Governor Andrew
Cuomo created in early 2013 the New NY Education Reform Commission, a 25-member panel tasked
with making recommendations for improving the quality, accountability, and financing of public
education. It has recommended that access to early educational opportunities be increased by
providing full-day prekindergarten (pre-k) to all children in the state’s highest needs school districts. 2
Most recently, New York City mayoral candidate Bill de Blasio has made all day pre-k for all four-year-
olds a centerpiece of his campaign.3
Education advocates, led by the Center for Children’s Initiatives and The Campaign for Educational
Equity, have recently advanced a proposal that calls on State leaders “to recognize explicitly the right of
every three- and four-year-old child to a high-quality, full-day prekindergarten program.”4 This “rights-
based” pre-k program would be phased in over eight years starting with four-year-olds in districts with
high concentrations of low-income households in year one and all four-years-olds in the state in years
two and three. Three-year-olds in high-poverty districts would be added in years six and seven, and in
year eight all three-year-olds would be covered. After a phase-in period state aid for the program would
be added to and distributed through the K-12 funding formulas that require a local contribution, and
the per pupil spending target would be set to include transportation, health, and family support
services.5
If New York is to embrace the ambitious goal of universal pre-k, it must first acknowledge that it will be
costly to achieve. To date New York has not fulfilled the funding targets set for a pre-k programestablished in 1997. Moreover, because the emphasis to date in New York has been on expanding
access rather than enriching services, current per pupil spending on pre-k in New York lags national
norms and falls well below spending per pupil in neighboring states that offer more targeted programs.
If pre-k is to accomplish the lasting benefits for disadvantaged students shown in research studies,
more intensive and expensive programming will be required. (For a discussion of the research studies
see Appendix A.) Finally, because a large majority of children from upper-income families already
attend privately financed pre-k programs, it is questionable whether the significant expenditure
necessary to fund pre-k seats in public schools for these children should be a priority use of scarce tax
dollars.

7/27/2019 The Challenge of Making Universal Prekindergarten a Reality in New York State
http://slidepdf.com/reader/full/the-challenge-of-making-universal-prekindergarten-a-reality-in-new-york-state 5/27
Citizens Budget Commission
5
NEW YORK’S CURRENT PRE-K PROGRAM IS
STILL FAR FROM UNIVERSAL
New York has a history dating to the 1960s of providing some form of public pre-k services. Over the
years the funding formulas and goals of state pre-k programs have changed, and funding has been
repeatedly constrained by budget pressures.
New York’s early pre-k programs were targeted to poor students. In 1966 the half-day Experimental
Prekindergarten (EPK) program, was launched to serve educationally disadvantaged three- and four-
year-olds. The main components of the program were: (1) in-school experience, (2) health services, 6 (3)
social services,7 and (4) parental involvement. Initial annual funding was $5 million, which enabled the
program to serve approximately 7,000 students. The program remained targeted to disadvantaged
students for 30 years. Limited expansion raised the appropriation to $50 million in 1996-97, serving
about 20,840 students.8 In 1994 the EPK program was retitled the Targeted Pre-K program, or TPK,
reflecting that it was no longer an experiment but an established program.
In 1997, as more research emerged on the benefits of pre-k, New York expanded its program. The State
budget adopted in August 1997 included a package of reforms, dubbed LADDER for Learning Achieving
Developing by Directing Education Resources. It contained a plan to establish Pre-k for all four-year-
olds to be phased in over four years, beginning in the 1998-99 school year. The State Education
Department (SED) was charged with administering the program and allocating grants to districts
according to a formula based on district need and number of eligible four-year-olds. School districts
were not required to participate or to provide local financing, although they could opt to supplement
state funds. Those participating were required to subcontract 10 percent of their grant funding to
community based organizations.9 The programs must operate a minimum of two and half hours a day,
five days a week, 180 days a year with no more than 20 students per classroom.10 The enriched funding
in the EPK/TPK program to provide for health, counseling, and case management services was not
continued.
Annual funding for the LADDER program was scheduled to grow from $50 million to $100 million in the
1999-00 school year, $225 million in the 2000-01 school year, and $500 million each year thereafter with
the expectation all four-year olds would be able to access services by 2002.11 Based on this goal the
LADDER program also became known as the Universal Pre-k or UPK program.
Initial UPK grants to school districts ranged from $2,000 to $4,000 per pupil, 12 determined by a formula
that included district wealth (measured by local property values and income) and district need
(measured by the portion of students in poverty).13 Initial school district eligibility was determined
based on the number of four-year-olds who were not already placed in other prekindergarten programs
and by district need.14 In the first year of implementation 130 districts were deemed eligible, but only 68
opted to provide pre-k classes in the 1998-99 school year.15 First year enrollment was 18,176; nearly
14,000 of these students were in New York City. 16 (See Table 1.) Acknowledging the originally
appropriated funding was not sufficient to spark widespread enrollment, the Legislature increased the
program’s budget during the year to $67 million. About $57 million was disbursed in grants in that year.

7/27/2019 The Challenge of Making Universal Prekindergarten a Reality in New York State
http://slidepdf.com/reader/full/the-challenge-of-making-universal-prekindergarten-a-reality-in-new-york-state 6/27
The Challenge of Making Universal Prekindergarten a Reality
6
Funding for the second and third years of the program followed the schedule in the original legislation -
$100 million and $225 million for school years 1999-00 and 2000-01, respectively. 17 But school districts
were slow to initiate or expand programs, and in the 2000-01 year districts used only $183.9 million.
Districts that did not use their full allocation were permitted to place the unused portion in a reserve
fund for use the next year.18
The plan to increase funding for the program in subsequent years was thwarted by the recession that
began with the burst of the dot-com bubble in 2000 and worsened after the terrorist attack on the
World Trade Center. The appropriation for the 2001-02 school year was $204.7 million, less than half of
what had been scheduled in the original legislation. School districts spent $176.8 million that year.
The State’s fiscal troubles continued into the 2002-03 school year. UPK funding was kept at prior year
levels of $204.7 million, and state funds were supplemented with federal funds from the Temporary
Assistance for Needy Families, or TANF, program.19 Funding remained flat at $204.7 million until school
year 2006-07 when an additional $50 million was appropriated.20 In 2006-07 district programs served
62,929 children. (Refer to Table 1.)
School Year
1998-99 $67.4 $57.1 18,176
1999-00 100.1 83.5 27,719
2000-01 225.0 183.9 49,067
2001-02* 204.7 176.8 54,946
2002-03* 204.7 195.3 59,196
2003-04* 204.7 199.6 58,012
2004-05* 204.7 200.7 56,898
2005-06* 204.7 201.0 56,529
2006-07 254.7 241.7 62,929
2007-08** 437.9 348.6 92,173
2008-09 451.2 372.9 100,093
2009-10 414.1 376.8 101,865
2010-11 414.1 380.9 103,287
2011-12 384.3 380.7 103,573
2012-13 385.0 374.4 100,969
2013-14 385.0 NA NA
NA = Not Available
Source: New York State Education Department.
Authorized Grants Grants Paid Children Served
Table 1: New York State Universal Prekindergarten
Grants and Enrollees, School Years 1998-99 to 2013-14
Notes: *From school year 2002 through 2006, the UPK expansion was suspended.
**In school year 2008, a new formula replaced UPK, supplemental UPK, and Targeted
Prekindergarten (TPK) aids.
(dollars in millions)
7/27/2019 The Challenge of Making Universal Prekindergarten a Reality in New York State
http://slidepdf.com/reader/full/the-challenge-of-making-universal-prekindergarten-a-reality-in-new-york-state 7/27
Citizens Budget Commission
7
In 2007-08 the State renewed its expansion commitment and adopted a new allocation formula for UPK
aid.21 Each district received base aid equal to its aid in the 2006-07 school year, but the district could not
serve fewer children than it had the prior year in order to receive the same grant amount. 22 Additional
aid was granted to districts for additional pupils enrolled in the program.23 Although UPK funding was
increased to $437.9 million, only $348.6 million was spent serving 92,173 children.
Further expansion was put on hold in fiscal year 2008-09 as State leaders began to grapple with the
Great Recession. No new districts were allowed to enter the UPK program, and by 2009-10 the
allocation was reduced to $414.1 million.24 Funding for 2010-11 was kept at the prior year level, and in
2011-12 it dropped to $384.3 million. School districts that had supplemented programming with their
own funds cut services because of their own budget pressures. Yonkers and Poughkeepsie, for
example, went from full-day to half-day programs.25
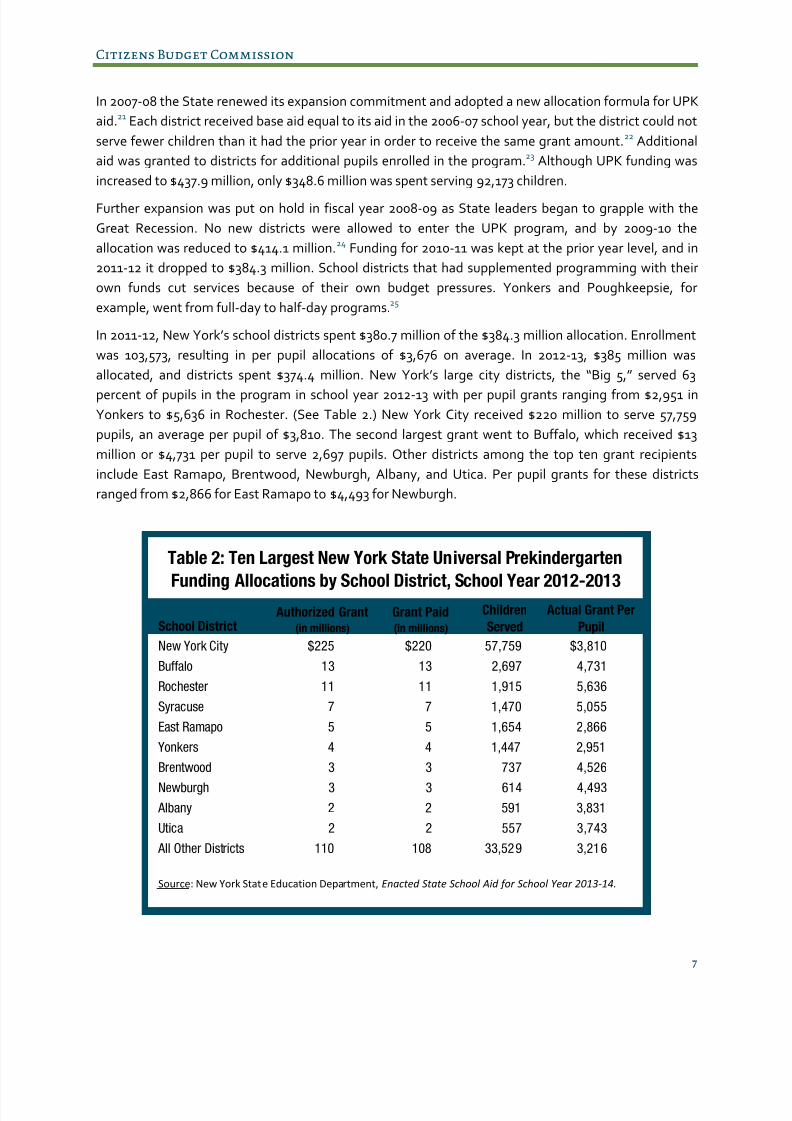
In 2011-12, New York’s school districts spent $380.7 million of the $384.3 million allocation. Enrollment
was 103,573, resulting in per pupil allocations of $3,676 on average. In 2012-13, $385 million was
allocated, and districts spent $374.4 million. New York’s large city districts, the “Big 5,” served 63
percent of pupils in the program in school year 2012-13 with per pupil grants ranging from $2,951 inYonkers to $5,636 in Rochester. (See Table 2.) New York City received $220 million to serve 57,759
pupils, an average per pupil of $3,810. The second largest grant went to Buffalo, which received $13
million or $4,731 per pupil to serve 2,697 pupils. Other districts among the top ten grant recipients
include East Ramapo, Brentwood, Newburgh, Albany, and Utica. Per pupil grants for these districts
ranged from $2,866 for East Ramapo to $4,493 for Newburgh.
School District
New York City $225 $220 57,759 $3,810
Buffalo 13 13 2,697 4,731
Rochester 11 11 1,915 5,636
Syracuse 7 7 1,470 5,055
East Ramapo 5 5 1,654 2,866
Yonkers 4 4 1,447 2,951
Brentwood 3 3 737 4,526
Newburgh 3 3 614 4,493
Albany 2 2 591 3,831
Utica 2 2 557 3,743
All Other Districts 110 108 33,529 3,216
Table 2: Ten Largest New York State Universal Prekindergarten
Funding Allocations by School District, School Year 2012-2013Actual Grant Per
Pupil
Children
ServedGrant Paid(in millions)
Authorized Grant(in millions)
Source: New York State Education Department, Enacted State School Aid for School Year 2013-14.
7/27/2019 The Challenge of Making Universal Prekindergarten a Reality in New York State
http://slidepdf.com/reader/full/the-challenge-of-making-universal-prekindergarten-a-reality-in-new-york-state 8/27
The Challenge of Making Universal Prekindergarten a Reality
8
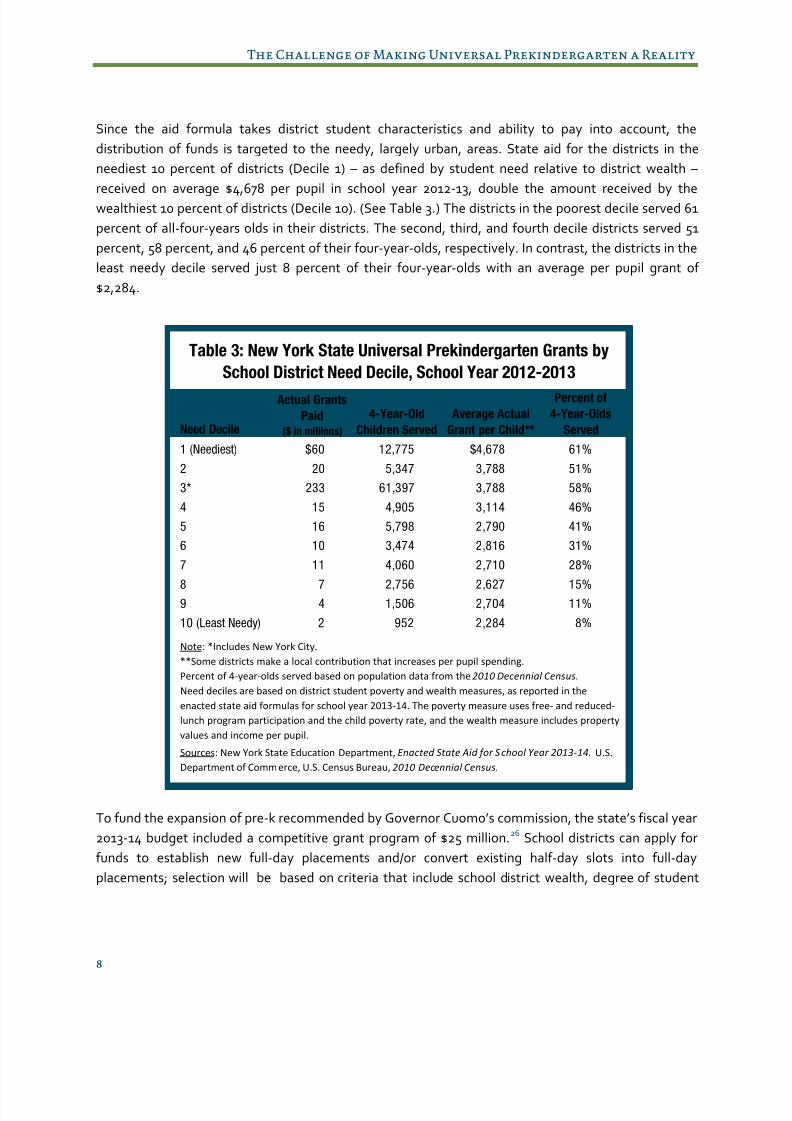
Since the aid formula takes district student characteristics and ability to pay into account, the
distribution of funds is targeted to the needy, largely urban, areas. State aid for the districts in the
neediest 10 percent of districts (Decile 1) – as defined by student need relative to district wealth –
received on average $4,678 per pupil in school year 2012-13, double the amount received by the
wealthiest 10 percent of districts (Decile 10). (See Table 3.) The districts in the poorest decile served 61
percent of all-four-years olds in their districts. The second, third, and fourth decile districts served 51
percent, 58 percent, and 46 percent of their four-year-olds, respectively. In contrast, the districts in the
least needy decile served just 8 percent of their four-year-olds with an average per pupil grant of
$2,284.
To fund the expansion of pre-k recommended by Governor Cuomo’s commission, the state’s fiscal year
2013-14 budget included a competitive grant program of $25 million.26 School districts can apply for
funds to establish new full-day placements and/or convert existing half-day slots into full-day
placements; selection will be based on criteria that include school district wealth, degree of student
Need Decile
1 (Neediest) $60 12,775 $4,678 61%
2 20 5,347 3,788 51%
3* 233 61,397 3,788 58%
4 15 4,905 3,114 46%
5 16 5,798 2,790 41%
6 10 3,474 2,816 31%
7 11 4,060 2,710 28%
8 7 2,756 2,627 15%9 4 1,506 2,704 11%
10 (Least Needy) 2 952 2,284 8%
Table 3: New York State Universal Prekindergarten Grants by
School District Need Decile, School Year 2012-2013
4-Year-Old
Children Served
Percent of4-Year-Olds
Served
Actual Grants
Paid($ in millions)
Average Actual
Grant per Child**
Sources: New York State Education Department, Enacted State Aid for School Year 2013-14. U.S.
Department of Commerce, U.S. Census Bureau, 2010 Decennial Census.
Note: *Includes New York City.
**Some districts make a local contribution that increases per pupil spending.
Percent of 4-year-olds served based on population data from the 2010 Decennial Census.
Need deciles are based on district student poverty and wealth measures, as reported in the
enacted state aid formulas for school year 2013-14. The poverty measure uses free- and reduced-
lunch program participation and the child poverty rate, and the wealth measure includes property
values and income per pupil.

7/27/2019 The Challenge of Making Universal Prekindergarten a Reality in New York State
http://slidepdf.com/reader/full/the-challenge-of-making-universal-prekindergarten-a-reality-in-new-york-state 9/27
Citizens Budget Commission
9
need, number of children to be served, and proposed program quality. These new funds will be added
to the $385 million currently allocated for UPK programs.
In 2013-14 the goal of universality continues to be elusive. Fully 232 districts have not yet begun a UPK
program, and some dropped their programs in the past several years because of budget pressures. SED
estimates that there are approximately 230,000 four-year-olds in the state,27 but the $385 million
appropriated will likely provide funding for less than half that population.28 The additional $25 million
for pre-k expansion in districts that apply for and win competitive grants are not yet distributed.
Although public school pre-k is generally less available in more affluent districts, a high proportion of
children from affluent families attend some pre-k program. Among the poorest children in New York
State (i.e., those in households with income at 50 percent or less of the federal poverty threshold), an
average of 57 percent of four-year-olds attended nursery school or other preschool over the 2007 to
2011 period increasing to 64 percent for children from households with income at 100 to 150 percent of
the poverty level. Interestingly, participation dips to 60 percent for children in the 150 to 200 percent-
of-poverty income bracket – perhaps reflecting the more limited availability of public programs. Above
that income level participation rates climb to 83 percent at the highest income levels. (See Figure 1.)
It is likely participation rates at the lowest income levels are enhanced by the targeted public programs
but these programs do not provide pre-k to every four-year-old. With high participation rates at the
upper-income levels and a very limited number of publicly funded pre-k seats, it is clear that private
funds are supplying preschool programs for most children in those households.
Note: Excludes four-year-olds in kindergarten.
Source: United States Department of Commerce, United States Census, American Community Survey, 5-Year
2007-2011 Public Use Microdata Sample.
57%63% 64%
60%
67% 67%72% 74%
78% 77%83%
0%
10%
20%
30%
40%
50%
60%
70%
80%
90%
Ratio of Family Income to Poverty Threshold
Figure 1: Share of Four-Year-Olds in Nursery School orPreschool by Income, New York State,
Average for 2007-2011

7/27/2019 The Challenge of Making Universal Prekindergarten a Reality in New York State
http://slidepdf.com/reader/full/the-challenge-of-making-universal-prekindergarten-a-reality-in-new-york-state 10/27
The Challenge of Making Universal Prekindergarten a Reality
10
NEW YORK SPENDS LESS PER PUPIL THAN NATIONAL NORMS
AND NEIGHBORING STATES BUT REACHES MORE STUDENTS
Because New York’s UPK program spreads funds over a relatively large number of students, its per
pupil spending is low compared to national norms and neighboring states. In 2012, about 1.3 million
three- and four-year-olds enrolled in public, state-funded pre-k programs in the United States – 1.1
million four-year-olds and 200,000 three-year-olds.29 Across the nation this comprised 28 percent of
four-year-olds and just 4 percent of three-year olds. State spending for pre-k among the 40 states that
offer programs totaled $5.1 billion and average spending per pupil was $3,841. 30 In New York
comparable spending per pupil was $3,707, just below the U.S. average, and enrollment was 102,367.
New York’s per pupil spending ranks 21 among the 40 states that offer public pre-k. The top spender
was New Jersey, which averaged $11,659 per pupil, more than three times the national average. (See
Table 4.) Other neighboring or large states that outspend New York on a per pupil basis include
Connecticut ($8,388), Pennsylvania ($5,474), North Carolina ($5,160), Michigan ($4,422), California
($4,136), Massachusetts ($4,058), and Ohio ($3,980).
In terms of access, as measured by the percentage of the four-year-olds enrolled in state-funded pre-k,
New York ranks higher – 9th of the 40 states that offer programs. In New York 44.2 percent of four-year-
olds attended pre-k in 2012 compared to a U.S. average of 28.0 percent. Notably, the states that rank
% of U.S. 50-State % of 4 yr-old 50-State
Amount Average Rank Number Population Rank
New Jersey $11,659 303.5% 1 31,234 28.2% 16
Connecticut 8,388 218.4% 3 5,396 12.9% 29
Pennsylvania 5,474 142.5% 9 20,712 14.0% 28
North Carolina 5,160 134.3% 11 24,836 19.3% 23
Michigan 4,422 115.1% 15 23,579 19.4% 22
California 4,136 107.7% 16 93,866 18.1% 24
Massachusetts 4,058 105.6% 17 10,714 14.3% 27
Ohio 3,980 103.6% 18 3,564 2.4% 37
New York 3,707 96.5% 21 102,367 44.2% 9
Georgia 3,490 90.9% 25 82,868 58.7% 6
Texas 3,232 84.1% 28 203,143 51.4% 8
Illinois 3,210 83.6% 29 46,897 27.7% 17
Florida 2,281 59.4% 35 175,122 79.4% 1
U.S. Avg/Total $3,841 100% NAP 1,151,653 28.0% NAP
Source: National Institute for Early Education Research, The State of Preschool 2012, State
Preschool Yearbook, 2012.
Table 4: State Prekindergarten Spending and Enrollment,
Select States, 2012
4-Year-Old EnrollmentPer Pupil Spending

7/27/2019 The Challenge of Making Universal Prekindergarten a Reality in New York State
http://slidepdf.com/reader/full/the-challenge-of-making-universal-prekindergarten-a-reality-in-new-york-state 11/27
Citizens Budget Commission
11
higher than New York on the per pupil spending measure – New Jersey, Connecticut, Pennsylvania, and
Massachusetts, for example – enroll a smaller share of their four-year-olds. Large states that spend less
than New York per pupil rank higher in their participation measure – Florida, for example, spends
$2,281 per pupil ranking 35 for spending, but enrolls 79.4 percent of its four-year-olds, a greater share
than any other state.
Three-year-olds are much less likely to receive services. Only 26 states provide state-funded pre-k
programs for them, serving 171,323 students or about 4 percent of the eligible population in school year
2012.31 Three-year-olds in New York are not eligible for UPK, but they may receive services in other
public early childhood programs such as Head Start and/or preschool special education.
New York’s participation rate has exceeded the U.S. average for more than a decade. In 2002, 25
percent of four-year-olds in New York State were enrolled compared to 14 percent nationwide. (See
Figure 2.) Enrollment in New York peaked at 47 percent in 2010 but declined during 2011 and 2012 to 44
percent in the latest year. Enrollment in the U.S. increased over the decade to 28 percent in 2012.
Although enrollment has grown significantly in New York and elsewhere, total spending in real
(inflation adjusted) terms has not kept pace. As a result, U.S. average per pupil spending by states (in
2012 dollars) declined from $5,020 in 2002 to $3,841 per pupil in 2012, a decrease of 23 percent. (See
Figure 3.) In New York state aid per pupil decreased more precipitously, falling from $5,306 per pupil in
2002 to $3,707 in 2012, a reduction of 30 percent. In 2002 New York State spent 104.8 percent of the
U.S. average per pupil and ranked 11 among the 36 states that offered state-funded pre-k in that year. 32
Source: National Institute for Early Education Research, The State of Preschool 2012, State Preschool
Yearbook, 2012.
25%
30% 30% 29% 29%
35%
39%
43%47% 45% 44%
14%16% 17% 17%
20% 22%
24% 25%27% 28% 28%
0%
5%
10%
15%
20%25%
30%
35%
40%
45%
50%
2002 2003 2004 2005 2006 2007 2008 2009 2010 2011 2012
Figure 2: Share of Four-Year-Olds Enrolled in StatePrekindergarten, New York vs. Nation, 2002-2012
New York U.S.

7/27/2019 The Challenge of Making Universal Prekindergarten a Reality in New York State
http://slidepdf.com/reader/full/the-challenge-of-making-universal-prekindergarten-a-reality-in-new-york-state 12/27
The Challenge of Making Universal Prekindergarten a Reality
12
By 2012 state spending per pupil in New York was 96.5 percent of the U.S. average, and New York’s
rank among states dropped to 21. (Refer to Table 4.)
Due to some extent to per pupil state support that has not kept pace with inflation, teacher certification
requirements for New York’s nonprofit preschool providers have been postponed. Initially, public
school-based UPK programs, and New York City Head Start and child care centers, were required to
have a New York State certified teacher; pre-k teachers in private nonprofit organizations outside New
York City were required to have at least 9 credits towards certification and be supervised by a certified
teacher.33 By 2004 all pre-k teachers in nonprofits were to meet the same degree and certification
requirements as teachers in public school programs.34 Legislation passed with the 2012-13 budget
extended the time teachers at nonprofit agencies have to obtain New York teacher certification. 35
These teachers may now provide instruction as long as they meet the qualifications prescribed by the
applicable licensing or registering agency and have a written plan for obtaining a certificate valid in the
early childhood grades within five years of commencing employment, or by June 30, 2017, whichever is
later.36
In addition, standard curricula that would help ensure children receive adequate and appropriatepreparation for kindergarten and first grade are lacking. By law, the pre-k curriculum is left to the
discretion of each school district.37 Nonetheless, SED has tried to promote articulation with the
kindergarten and first grade curriculum by providing guidelines. In 2011 the Board of Regents adopted
the Prekindergarten Learning Standards, which provides a framework to align pre-k and existing K- 12
learning standards. In 2013 the framework was updated to address the new Common Core.38
Source: National Institute for Early Education Research, The State of Preschool 2012, State Preschool
Yearbook, 2012.
$-
$1,000
$2,000
$3,000
$4,000
$5,000
$6,000
2002 2003 2004 2005 2006 2007 2008 2009 2010 2011 2012
Figure 3: State Prekindergarten Spending per ChildEnrolled, New York vs. Nation, 2002-2012 (In 2012 dollars)
New York U.S.
7/27/2019 The Challenge of Making Universal Prekindergarten a Reality in New York State
http://slidepdf.com/reader/full/the-challenge-of-making-universal-prekindergarten-a-reality-in-new-york-state 13/27
Citizens Budget Commission
13
THE FISCAL IMPLICATIONS OF FULLY FUNDING
HIGH-QUALITY UPK
Offering high-quality public pre-k for every three- and four-year-old in New York State would be costly.
Table 5 presents estimates of the incremental costs for the State and for local school districts of several
“universal” options. Each option assumes that 75 percent of eligible four-year-olds and 65 percent of
eligible three-year-olds enroll.39 (See Appendix B for a full description of the assumptions and the
methodology.)
The options differ in the level of per pupil support they provide. One standard is New Jersey’s so-called
Abbott districts, recipients of relatively high per pupil spending as a result of a court order. Most
observers agree these schools provide high quality pre-k programs that are beneficial to students. The
first scenario assumes New York’s pre-k programs would be funded at the average per pupil amount of
$12,846 spent by New Jersey’s Abbott districts in 2012. The second scenario assumes that per pupil
spending for pre-k in each district is equivalent to K-12 general education spending per pupil in thatdistrict.40 It is not unreasonable to assume – given the quality expectations and regulation that New
York would impose if the mandate to provide a public education were extended to all younger children
– that per pupil spending for the pre-k population would equal K-12 general education spending.
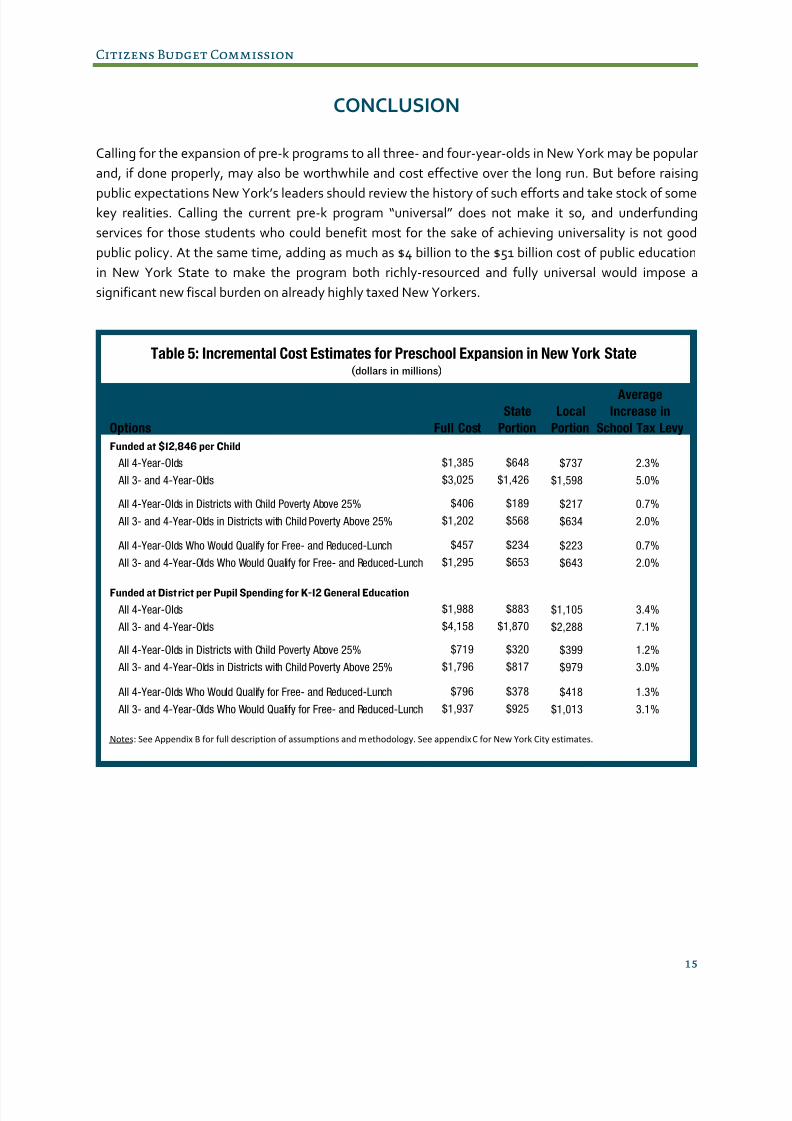
For the four-year-old population, the estimated added cost of Abbott quality programs would be $1.4
billion annually. (See Table 5.) Adding three-year-olds increases that figure to $3.0 billion. Because K-12
per pupil spending in New York is higher than what is spent on pre-k in Abbott districts in New Jersey,
that scenario increases the estimates of incremental cost to $2.0 billion and $4.2 billion for four-year-
olds and three- and four-year-olds, respectively.41
If pre-k becomes an extension of public education in New York, then local districts would likely berequired to fund part of the cost of the service just as they are for grades K-12. If school districts were
required to pay the same proportion as the state’s K-12 foundation aid formulas require, then state
taxpayers would bear $648 million in incremental costs and local taxpayers would bear $737 million for
the expansion to an “Abbott-style” program for all four-year-olds. The estimates increase to $1.4 billion
and $1.6 billion state and local share, respectively, if three-year-olds are included. Again, the figures are
higher using New York school district spending norms. Providing for all four-year-olds at the K-12
general education per pupil spending level would cost the State an estimated $883 million additional
and the school districts $1.1 billion. Adding three-year-olds at the higher spending level would increase
incremental state costs to $1.9 billion and school district costs to $2.3 billion.
The estimated school property tax levy increases needed to fund an expanded local funding mandate
are also shown in Table 5. For an Abbott-style program for all four-year-olds the average school tax levy
increase would be 2.3 percent. Adding three-year-olds increases the estimate to 5.0 percent. If per pupil
spending were equivalent to K-12 general education spending the estimated school levy increase
needed would be 3.4 percent for all four-year-olds and 7.1 percent for three- and four-year-olds.
7/27/2019 The Challenge of Making Universal Prekindergarten a Reality in New York State
http://slidepdf.com/reader/full/the-challenge-of-making-universal-prekindergarten-a-reality-in-new-york-state 14/27
The Challenge of Making Universal Prekindergarten a Reality
14
Two more targeted approaches shown in Table 5: (1) extending pre-k services to every child in districts
with a child poverty rate above 25 percent, and (2) extending services to every child who qualifies for
free or reduced-price lunch. These targeted scenarios are less costly.
The estimated added cost of providing an Abbott-style program for all four-year-olds in districts with
25 percent child poverty rates is $406 million. Offering a program at the K-12 per pupil amounts for
those districts would add an estimated $719 million. The estimated school tax levy increase necessary
to fund these options ranges from 0.7 percent to 1.2 percent.
The second option, a “money follows the child” approach based on free or reduced-price lunch (FRPL)
eligibility, is estimated to add costs of $457 million for four-year-olds and $1.3 billion for three-and four-
year-olds for an Abbott-style program. To fund a program for all FRPL students at average K-12
spending per pupil would add an estimated $796 million for four-year-olds and $1.9 billion for three-and
four-year-olds. School tax levies are estimated to rise from 0.7 percent to 3.1 percent for this
alternative.
Identifying state and local resources of a magnitude needed to support high-quality universal pre-k for
all three- and four-years olds is a challenge. New York State is slowly recovering from the Great
Recession, the worst economic downturn since the 1930s. During the difficult budget years of the crisis
New York’s leaders cut nearly every area of state spending. Education aid for K-12, the single largest
item in the state budget, was no exception; school districts endured cumulative reductions of $2.2
billion from peak to trough over the period.42 Although K-12 school aid has increased in the latest two
years, it has still not returned to pre-recession levels. Structural budgetary problems remain a feature of
New York’s fiscal outlook with budget gaps expected to grow from $1.7 to $3.0 billion by fiscal year
2017-18.43
Local school districts lack the ability unilaterally to raise large sums to finance program expansions. The
state’s statutory property tax cap holds levy increases to 2 percent unless 60 percent of voters approvea larger increase. Federally-mandated special education costs, costs for transporting students, and the
contractually obligated longevity increases for teachers typically cause costs to rise more than
revenues. Local voters have shown themselves to be unsympathetic in districts that have tried to
override the tax cap. Twenty-eight school districts sent budgets that exceeded their tax capped levies
to the ballot box, and all but seven were rejected by voters. 44 Rather than present voters budget
increases that exceed levy caps, the vast majority of school districts have opted to stay under them.
Although state leaders could waive the tax cap for the addition of a new initiative such as expanded pre-
k, they are still likely to run up against the same barrier that made the tax cap popular – New York’s
exceptionally high local tax burden. The local tax burden is $80.60 per $1,000 of personal income – 72
percent higher than the national average and 38 percent higher than New Jersey, which ranks second.45
7/27/2019 The Challenge of Making Universal Prekindergarten a Reality in New York State
http://slidepdf.com/reader/full/the-challenge-of-making-universal-prekindergarten-a-reality-in-new-york-state 15/27
Citizens Budget Commission
15
CONCLUSION
Calling for the expansion of pre-k programs to all three- and four-year-olds in New York may be popular
and, if done properly, may also be worthwhile and cost effective over the long run. But before raising
public expectations New York’s leaders should review the history of such efforts and take stock of somekey realities. Calling the current pre-k program “universal” does not make it so, and underfunding
services for those students who could benefit most for the sake of achieving universality is not good
public policy. At the same time, adding as much as $4 billion to the $51 billion cost of public education
in New York State to make the program both richly-resourced and fully universal would impose a
significant new fiscal burden on already highly taxed New Yorkers.
Options
Funded at $12,846 per Child
All 4-Year-Olds $1,385 $648 $737 2.3%
All 3- and 4-Year-Olds $3,025 $1,426 $1,598 5.0%
All 4-Year-Olds in Districts with Child Poverty Above 25% $406 $189 $217 0.7%
All 3- and 4-Year-Olds in Districts with Child Poverty Above 25% $1,202 $568 $634 2.0%
All 4-Year-Olds Who Would Qualify for Free- and Reduced-Lunch $457 $234 $223 0.7%
All 3- and 4-Year-Olds Who Would Qualify for Free- and Reduced-Lunch $1,295 $653 $643 2.0%
Funded at District per Pupil Spending for K-12 General Education
All 4-Year-Olds $1,988 $883 $1,105 3.4%
All 3- and 4-Year-Olds $4,158 $1,870 $2,288 7.1%
All 4-Year-Olds in Districts with Child Poverty Above 25% $719 $320 $399 1.2%
All 3- and 4-Year-Olds in Districts with Child Poverty Above 25% $1,796 $817 $979 3.0%
All 4-Year-Olds Who Would Qualify for Free- and Reduced-Lunch $796 $378 $418 1.3%
All 3- and 4-Year-Olds Who Would Qualify for Free- and Reduced-Lunch $1,937 $925 $1,013 3.1%
Table 5: Incremental Cost Estimates for Preschool Expansion in New York State
Full Cost
State
Portion
Local
Portion
AverageIncrease in
School Tax Levy
Notes: See Appendix B for full description of assumptions and methodology. See appendix C for New York City estimates.
(dollars in millions)
7/27/2019 The Challenge of Making Universal Prekindergarten a Reality in New York State
http://slidepdf.com/reader/full/the-challenge-of-making-universal-prekindergarten-a-reality-in-new-york-state 16/27
The Challenge of Making Universal Prekindergarten a Reality
16
APPENDIX A: STUDIES OF THE BENEFITS OF PRE-K PROGRAMS
Numerous studies document the diverse benefits of participation in high quality preschool programs,
particularly for economically disadvantaged children. Many find significant returns for every dollar
invested. Less clear is whether these benefits accrue to the same degree for children from middle- andupper-income families. This Appendix provides a brief summary of the most widely cited research on
the benefits of preschool participation.
Three longitudinal studies with sophisticated research designs are often cited as strong evidence of
significant benefits: (1) the High/Scope Perry Preschool Study; (2) the Abecedarian Project preschool
study; and (3) the Chicago Child-Parent Centers (CPC) study. The Perry Preschool project provided a
carefully designed prekindergarten program to poor families in Michigan from 1962 to 1967. The
intensive half-day program offered small classes, teacher home visits, and detailed advice on how
parents could assist with the promotion of cognitive and social development in the home. The program
study, with a sample size of 123, randomly assigned three- and four-year-olds to a “control group” that
received no intervention or to the preschool program. The outcomes for the two groups have been
tracked longitudinally for more than 40 years. The results are impressive; children who participated in
the Perry program were much more likely to graduate from high school and be gainfully employed, and
much less likely to experience teen pregnancies and to commit crimes as adults than children in the
control group.46 The long-term benefits to society exceeded the cost of providing the preschool
program by a ratio of 16.1:1; the benefits for males exceeded those for females due to more
substantially reduced incarceration rates among the males.47 The study identified costs of $17,599 and
benefits of $284,086 per participant (in constant 2006 dollars discounted at 3 percent).48 Fully $198,981
of the benefits resulted from reduced crime costs; 35 percent of the participants were arrested five
times or more in a 20-year period compared to 70 percent in the control group. 49 The costs to the K-12
educational system were reduced by $9,787 per participant and lifetime participant earnings were
increased by $74,878.
The Carolina Abecedarian Project examined full-day, year-round preschool for low-income families that
began in 1972 for poor children aged six weeks to age five in North Carolina. This research project used
a randomized trial design with a sample size of 111.50 The findings are social and cognitive benefits that
persist well into adulthood for participants. However, the cost-benefit ratios were a less dramatic 2.5:1.
The costs were $70,697 per participant compared to $176,284 in cumulative benefits (in constant 2006
dollars discounted at 3 percent). The higher cost than for the Perry study reflect the longer duration of
the intervention.51 Reduced crime costs were not a factor in the benefits. However, the study included
maternal earnings for participants and these increased by $76,547 due to enhanced participation in thelabor force. Costs to the K-12 education system decreased by $9,841 per participant (comparable to
what was seen in Perry), but lifetime earnings increased by a lower $41,801.
The CPC began in 1983, was hosted across many sites, and provided prekindergarten education in
public schools as well as family support services to low-income families in high-poverty neighborhoods.
Services were provided for three- and four-year-olds during the school year. The impact was measured
in a study of 1,539 children, using a quasi-experimental design that compared the social and cognitive
7/27/2019 The Challenge of Making Universal Prekindergarten a Reality in New York State
http://slidepdf.com/reader/full/the-challenge-of-making-universal-prekindergarten-a-reality-in-new-york-state 17/27
Citizens Budget Commission
17
development outcomes for CPC children with other children from similar neighborhoods who were
assigned to random, external preschools. A follow-up study was conducted when the children reached
age 21. CPC preschool participants showed significantly higher rates of school completion, lower rates
of juvenile criminality, and lower rates of grade retention than their peers in alternative programs.
Reductions in spending on special education and social costs from crime were also significant. The
developmental impacts were somewhat smaller than in the Perry program but were still significant and
produced a large net benefit for society.52 The cost-benefit ratio for CPC was 10.1:1; costs per
participant were $8,224 and benefits were $83,511 (in constant 2006 dollars discounted at 3 percent).
Crime costs savings were $41,100 per participant and participant earnings increases were $34,123.
Maternal earnings were not a factor.53
Many state studies of varying design also show positive results, including one conducted in New York.
An evaluation of New York’s Experimental Prekindergarten (EPK) program from 1975 to 1982 found a
$7 return for every $1 invested. The program was most effective for low-income pupils, particularly for
children whose mothers had low educational attainment and children who scored lower on pre-tests.54
Another study examined the effect of targeted prekindergarten in Texas for disadvantaged childrenincluding those who are homeless, spoke limited English, and were eligible for subsidized school
lunches.55 The study showed statistically significant improvements in 3rd grade state test scores with the
greatest positive gains by children both economically disadvantaged and limited English proficient.56 A
meta-analysis of over 120 studies (mostly focused on low-income children) published in 2010 concluded
that preschool interventions – especially ones with high quality services – can provide “a real and
enduring benefit to children.”57 However, the authors also note that more narrowly focused research
was needed to ascertain the benefits attributable to specific kinds of intervention, noting the plethora
of options covered in the studies reviewed.
Less encouraging results emerged from a longitudinal study of the federally-funded Head Start
program, published in 2012. Although multiple studies have shown children participating in Head Start
perform better at the time of school entry than similar children who received no preschool intervention,
the 2012 study showed that these positive effects faded almost entirely by the time the children
reached third grade. After just three years, Head Start children were virtually indistinguishable from the
comparison group.58 Some critics of the study argue that the results are flawed because preschoolers in
the control group were not barred from participating in Head Start, and eventually about 13.8 percent
of four-year-olds and 17.8 percent of three-year-olds spent some portion of the year in Head Start.59
Others note that the quality of Head Start programs varies widely, calling conclusions drawn across the
whole program into question.
More recently, a series of studies have emerged from the intensive, full-day preschool program offeredin the “Abbott” districts of New Jersey for three- and four-year-olds. The Abbott Districts participated
in a class action lawsuit aimed at improving the equity and adequacy of funding for the poorest school
districts. Beginning in 2000-01 residents in the Abbott districts were guaranteed access to high quality
preschool programs as part of the court-ordered package of education services. State-of-the-art
facilities are required, a 1:10 staffing ratio is mandated, and teachers must have a bachelor’s degree
with a prekindergarten specialization.60 The program also offers support services for children and their

7/27/2019 The Challenge of Making Universal Prekindergarten a Reality in New York State
http://slidepdf.com/reader/full/the-challenge-of-making-universal-prekindergarten-a-reality-in-new-york-state 18/27
The Challenge of Making Universal Prekindergarten a Reality
18
families. The programs served 43,543 pre-k children in 2011-12 at an average cost to the State of
$12,846 per pupil.61
Three studies of the program – called the Abbott Preschool Program Longitudinal Effects Study
(APPLES) studies – have been completed with the most recent, released in June 2013, focused on the
results for participants that have now completed 5th grade.62 In 5th grade, the Abbott pre-k program had
a persistent positive impact on math and language scores. The gains were equivalent to six months of
grade-level math and eight months of grade-level language arts. The study also shows children who
received two years of preschool education at ages three and four experienced markedly larger gains
than children with just one year of preschool, suggesting that the intensity and length of preschool
interventions have an impact on their effectiveness. Although these early results across such a large
scale program are encouraging, it remains to be seen whether the longer term outcomes for these
children are similar to those for Perry, Abecedarian, and CPC participants.
Based on the well-designed studies, a case can be made that students from disadvantaged
backgrounds benefit substantially from high quality and robustly resourced preschool programs. Are
these benefits generalizable to students from middle- and upper-income families? Much less is knownabout this question. Some believe that because the Abbott program is offered to all students in the
district and the results are positive, it can be assumed that there are benefits to students from more
affluent backgrounds. This may be true, but it is also true that 70 percent of the students in the Abbott
districts live in households with incomes below the threshold for free- or reduced-priced lunch.63 By
virtue of where it is offered, the Abbott preschool program remains relatively targeted.
Other studies that more directly addressed the question have demonstrated less-than-robust results. A
2005 study used the National Institute of Child Health and Human Development (NICHD) dataset to
evaluate the impact of early childhood interventions across the entire population. For non-poor
children, the study showed some gains in school-readiness, but these benefits dissipated by the third
grade, when no statistically significant effects were found for any cognitive measure.64 A 2004 study
that relied on the Early Childhood Longitudinal Survey Data set also found small school readiness gains
for non-poor children but found that these gains faded sooner, disappearing almost entirely by the end
of the first grade.65 An additional issue calling generalizable benefits into question is that the seminal
longitudinal studies found significant benefits from reduced incarceration. Since children from middle-
and upper-income backgrounds are less likely to go to prison, the magnitude of savings potentially
attributable to preschool interventions is notably less for this group.66
A largely non-economic impact of the universal approach is the value of peer effects on classroom
learning. Some studies show that disadvantaged children achieve better outcomes in classrooms that
include students from higher-income households.67 In addition, there may be larger societal benefitssuch as increased tolerance for diversity to be gained from programs that include children of varied
ability and socioeconomic status.
Future research may add to the evidence that universal pre-k provides substantial, lasting benefits to
society. For now, the evidence shows that investments in high quality pre-k deliver the best long-term
returns when they are made in intensive, high-quality programs for disadvantaged children.

7/27/2019 The Challenge of Making Universal Prekindergarten a Reality in New York State
http://slidepdf.com/reader/full/the-challenge-of-making-universal-prekindergarten-a-reality-in-new-york-state 19/27
Citizens Budget Commission
19
APPENDIX B: COST ESTIMATE METHODOLOGY
Step 1. Specify the per child spending level
Two options are specified:
1. New Jersey Abbott schools level. Spending per child is based on New Jersey’s Abbott
school districts. In 2012, New Jersey spent an average of $12,846 per child in these
districts.68
2. Current K-12 general education level. This is an estimate of school year 2011-12 spending
per pupil for general education, i.e. non-special education services, in each district. General
education spending is derived by subtracting special education spending from total
spending. Special education spending is estimated as 20 percent of total spending for all
districts except New York City, Buffalo, Rochester, Syracuse, and Yonkers, based on
statewide special education spending reported in the New York State School Report Cards,
Fiscal Accountability Supplement from the New York State Education Department (SED)
and statewide total school expenditures reported in SED’s School District Master Files.69
Special education spending as a percent of total spending was calculated for New York City,
Buffalo, Rochester, Syracuse, and Yonkers based on actual special education spending and
total spending for each district.70 General education spending includes fixed costs and
district-wide costs. Some fixed costs, such as capital expenditure, may be less than
estimated if school districts have excess classroom and administrative capacity.
Step 2. Estimate the number of children to be served
1. Universal option.
a. Begin with total number of three- and four-year-olds. The total number of three- and
four-year-olds in each district comes from the 2010 Decennial Census.71
b. Subtract children receiving center-based special education preschool services. The
33,988 three- and four-year-olds receiving State- and county-funded special education
preschool center-based services in 2011-12 are excluded from the enrollment count.72
These children cannot simultaneously enroll in two full-time pre-k programs. For New
York City, the actual number of three- and four-year-olds enrolled in center-based
special education services (16,409) was excluded. For the rest of the state, the number
of children was allocated based on the district’s share of statewide, non-New York City
K-12 enrollment. It is assumed that the 62,944 children receiving non-center-based
special education preschool services would receive a full-day prekindergarten slot.
c. Apply participation rate. The analysis assumes that 65 percent of eligible three-year-
olds and 75 percent of eligible four-year-olds enroll in the program. The participation
estimates are based on SED data for school year 2009-10 and U.S. Census data for
2009, which indicate about 80 percent of New York five-year-olds were enrolled in

7/27/2019 The Challenge of Making Universal Prekindergarten a Reality in New York State
http://slidepdf.com/reader/full/the-challenge-of-making-universal-prekindergarten-a-reality-in-new-york-state 20/27
The Challenge of Making Universal Prekindergarten a Reality
20
kindergarten, which is not mandatory.73 Participation for three- and four-year-olds is
likely to be lower.
2. Needy district option.
a. Begin with total number of three- and four-year-olds. As described above.
b. Include only high-poverty districts. The number of districts with a poverty rate greater
than 25 percent is based on the Census poverty rate of children age five to 17, as used in
SED’s enacted state aid formulas for school year 2013-14.74
c. Subtract children receiving center-based special education preschool services. As
described above.
d. Apply participation rate. As described above.
3. Needy children option.
a. Estimate the total number of three- and four-year-olds who would qualify for the
free- and reduced-lunch program. The estimated number of three- and four-year-oldsin each district who would be eligible for the free- and reduced-lunch program is based
on average 2009 to 2011 participation rates in grades K-6, as used in SED’s enacted
state aid formulas for school year 2013-14.75 This rate is applied to the Census data for
the number of three- and four-year olds in each district.
b. Subtract children receiving center-based special education preschool services and
who would be eligible for the free- and reduced-price lunch program. This estimate
is based on the estimated number of children receiving center-based special education
preschool services by district and the share of K-6 students eligible for free- and
reduced-lunch in the district.
c. Apply participation rate. As described above.
Step 3. Calculate the total cost
Multiply the cost per child by the number of eligible children under each option.
Step 4. Calculate the incremental costs
1. Subtract current state Universal Prekindergarten (UPK) spending. The analysis nets out
state UPK funding of $403 million ($378 million in actual spending for school year 2012-13
and $25 million in new grants for 2013-14). These funds are netted out by district based on
actual spending in 2012-13. The $25 million in new state grants is subtracted from the total
and the state share for each option. The actual allocation for these new grants had not been
announced at the time of this publication. Under the targeted option to provide programs
to only children in districts with poverty rates above 25 percent, the analysis assumes that
districts with less than 25 percent poverty lose existing UPK funding. If the State decided to
hold these districts harmless for existing grants, total cost would rise.
7/27/2019 The Challenge of Making Universal Prekindergarten a Reality in New York State
http://slidepdf.com/reader/full/the-challenge-of-making-universal-prekindergarten-a-reality-in-new-york-state 21/27
Citizens Budget Commission
21
2. Subtract federal Head Start funding. The analysis nets out federal funding of $412 million
for three- and four-year-olds in Head Start. Total estimated Head Start spending is
calculated by multiplying 44,099, the number of children enrolled statewide, by average
spending per Head Start pupil of $9,342, as reported in the National Institute for Early
Education Research’s State of Preschool Yearbook for 2012.76 Estimated Head Start funding
by district is based on each district’s share of children in poverty, as reported in SED’s
enacted state aid formulas for school year 2013-14. In the options including only four-year-
olds, 44 percent of total Head Start funding is excluded, based on Head Start enrollment by
age in New York reported in the Annie E. Casey Foundation, 2012 National Kids Count.77 In
the targeted option to districts with high poverty, only Head Start funding going to those
eligible districts is subtracted.
3. Adjustment for local spending. Some districts also spend local funds on pre-k programs,
but due to data limitations, this funding is not excluded with the exception of New York
City. The inability to account for these funds likely has a minimal impact. The Center for
Children’s Initiatives reported that New York City spent $56 million of local funds on pre-kin 2011.78 These funds are subtracted from the required New York City local share.
Step 5. Allocate the incremental costs between the State and school districts
The analysis assumes that total costs are split between the State and school districts according to the
"State Sharing Ratio" used in the state foundation aid formula for school year 2013-14.79 Existing state
UPK funds are subtracted before determining the split between the State and the school districts.
Under this assumption, districts currently participating in the UPK program would keep existing grants,
and districts that began programs under the new funding formula would be starting without baseline
funding from the State.
Step 6. Calculate the average school tax levy percent increase
The average increase required in the school tax levy is based on the 2012-13 tax levy for school districts,
as reported in SED’s enacted state aid formulas for school year 2013-14.80 The Big 5 cities in New York –
Buffalo, New York City, Rochester, Syracuse, and Yonkers – have fiscally dependent school districts. In
these places, school costs represent only a portion of total local taxes.

7/27/2019 The Challenge of Making Universal Prekindergarten a Reality in New York State
http://slidepdf.com/reader/full/the-challenge-of-making-universal-prekindergarten-a-reality-in-new-york-state 22/27
The Challenge of Making Universal Prekindergarten a Reality
22
APPENDIX C: COST ESTIMATES FOR NEW YORK CITY
Options
Funded at $12,846 per Child
All 4-Year-Olds $439 $204 $235
All 3- and 4-Year-Olds $1,104 $485 $619
All 4-Year-Olds in Districts with Child Poverty Above 25% $439 $204 $235
All 3- and 4-Year-Olds in Districts with Child Poverty Above 25% $1,104 $485 $619
All 4-Year-Olds Who Would Qualify for Free- and Reduced-Lunch $244 $121 $123
All 3- and 4-Year-Olds Who Would Qualify for Free- and Reduced-Lunch $734 $328 $406
Funded at District per Pupil General Education Spending for K-12
All 4-Year-Olds $692 $311 $381
All 3- and 4-Year-Olds $1,584 $688 $896
All 4-Year-Olds in Districts with Child Poverty Above 25% $692 $311 $381
All 3- and 4-Year-Olds in Districts with Child Poverty Above 25% $1,584 $688 $896
All 4-Year-Olds Who Would Qualify for Free- and Reduced-Lunch $441 $204 $236
All 3- and 4-Year-Olds Who Would Qualify for Free- and Reduced-Lunch $1,106 $486 $620
Table C-1: Incremental Cost Estimates for Preschool Expansion in New
York City
Full Cost
State
Portion
Local
Portion
Notes: Assumes that New York City is awarded 40 percent of the new $25 million in state grants, or $10 million.
Estimated per pupil general education spending in New York City is $16,587.
See A endix B for full descri tion of assum tions, methodolo , and sources.
(dollars in mil lions)

7/27/2019 The Challenge of Making Universal Prekindergarten a Reality in New York State
http://slidepdf.com/reader/full/the-challenge-of-making-universal-prekindergarten-a-reality-in-new-york-state 23/27
Citizens Budget Commission
23
ENDNOTES
1The White House, Office of the Press Secretary, Fact Sheet: President Obama’s Plan for Early Education for all
Americans, February 13, 2013, accessed October 14, 2013, http://www.whitehouse.gov/the-press-
office/2013/02/13/fact-sheet-president-obama-s-plan-early-education-all-americans.
2New New York Education Reform Commission, Putting Students First: Education Action Plan, January 2013,
accessed October 14, 2013, http://www.governor.ny.gov/assets/documents/education-reform-commission-
report.pdf .
3Bill de Blasio, Mayoral Campaign, Starting Early, Learning Longer: Education Investments to Keep NYC
Competitive, accessed October 14, 2013,
http://advocate.nyc.gov/files/DeBlasioEducationInvestmentFactSheet.pdf .
4Center for Children’s Initiatives and The Campaign for Educational Equity, Making Prekindergarten Truly
Universal in New York State: A Rights-Based Proposal , August 11, 2013, p. 6, accessed October 14, 2013,
http://onondagacitizensleague.org/ocl_studies/2013/pdfs/Making%20PreK%20Truly%20Universal%20FINAL.pdf .
5
Ibid, p. 7.6 Physical, dental, and nutritional services.
7 Assistance was provided for families to access community resources that would help them become more self-
sufficient.
8National Institute for Early Education Research, The State with Two Prekindergarten Programs: A Look at
Prekindergarten Education in New York State (1928-2003), p. 44, June 2004, accessed October 15, 2013,
http://nieer.org/resources/files/NYCaseStudy.pdf .
9New York State Education Department, Questions and Answers, Including Mid-Year Programs, April 19, 2011,
accessed October 14, 2013, http://www.p12.nysed.gov/upk/faq.html.
10New York State Education Department, Regulations of the Commissioner of Education, Subpart 151-1 Universal
Prekindergarten, accessed October 15, 2013, http://www.p12.nysed.gov/upk/documents/151-1.pdf .11
New York State Comptroller, The 1997-98 Budget: Fiscal Review and Analysis, September 1997, accessed
October 16, 2013, http://www.osc.state.ny.us/reports/budget/1997/9-97.htm#education.
12Ibid.
13 New York State Comptroller, State Education Department Oversight of the Expansion of the Universal
Prekindergarten Program, Report 2000-S-13, May 2001, accessed October 16, 2013,
http://osc.state.ny.us/audits/allaudits/093001/00s13.pdf .
14 Ibid.
15Schuyler Center for Analysis and Advocacy, Universal PreKindergarten Resource Partnership, Universal
PreKindergarten Takes Off in New York State: Preliminary Findings from School Districts Implementing Universal
PreKindergarten in Year One of Eligibility, 1998-99, 1999, p. 4, accessed October 14, 2013,http://www.scaany.org/resources/documents/upk_takesoff_report.pdf .
16 Ibid.
17New York State Education Department, State Support to Public School Districts 1999-00, March 23, 2000,
accessed October 14, 2013, http://www.oms.nysed.gov/faru/Primer/primercomp.htm; New York State Division of
the Budget, Description of 2000-01 New York State School Aid Programs, October 9, 2000, accessed October 14,
2013, http://www.budget.ny.gov/pubs/archive/fy001archive/001schoolaid/001schoolaid.pdf .

7/27/2019 The Challenge of Making Universal Prekindergarten a Reality in New York State
http://slidepdf.com/reader/full/the-challenge-of-making-universal-prekindergarten-a-reality-in-new-york-state 24/27
The Challenge of Making Universal Prekindergarten a Reality
24
18New York State Division of the Budget, Description of 2000-01 New York State School Aid Programs, October 9,
2000, accessed October 14, 2013,
http://www.budget.ny.gov/pubs/archive/fy001archive/001schoolaid/001schoolaid.pdf .
19New York State Division of the Budget, Description of 2002-03 New York State School Aid Programs, October 15,
2002, accessed October 14, 2013,
http://www.budget.ny.gov/pubs/archive/fy0203archive/fy0203schoolaid/0203schlaid_enact.pdf .
20New York State Education Department, State Formula Aids and Entitlements for Schools in New York State,
October 2006, accessed October 14, 2013,
https://stateaid.nysed.gov/publications/handbooks/handbook_2006.pdf .
21National Institute for Early Education Research, The State of Preschool 2008, State Preschool Yearbook, 2008, p.
102, accessed October 14, 2013, http://nieer.org/sites/nieer/files/2008yearbook.pdf .
22New York State Education Department, Memorandum to the State Aid Subcommittee from Ken Slentz,
“Governor’s Proposal on State Aid and State Support for Universal Pre-Kindergarten,” February 6, 2012, accessed
October 14, 2013, http://www.regents.nysed.gov/meetings/2012Meetings/February2012/212sad1.pdf.
23Foundation aid ratios are determined according to student need and district ability to pay.
24 New York State Senate, Budget Bill Supplement 2009-10: School Aid Runs, March 31, 2009, accessed October 14,
2013, http://www.nysenate.gov/report/budget-bill-supplement-2009-10-school-aid-runs.
25Alliance for Quality Education, Citizen Action of New York, and Winning Beginning New York, Early Childhood
Education: Frozen Funding Leads to Cracks in the Foundation, February 7, 2012, accessed October 14, 2013,
http://www.aqeny.org/ny/wp-content/uploads/2012/02/Frozen-Funding-Leads-to-Cracks-in-the-Foundation-
2.8.12.pdf .
26New York State Division of the Budget, 2013-14 Executive Budget: Aid to Localities, January 22, 2013, p.158-9,
accessed October 14, 2013, http://publications.budget.ny.gov/eBudget1314/fy1314appropbills/Local.pdf .
27New York State Education Department, Memorandum to the State Aid Subcommittee from Ken Slentz,
“Governor’s Proposal on State Aid and State Support for Universal Pre-Kindergarten,” February 6, 2012, accessed
October 14, 2013, http://www.regents.nysed.gov/meetings/2012Meetings/February2012/212sad1.pdf.
28 Ibid.
29National Institute for Early Education Research, The State of Preschool 2012, State Preschool Yearbook, 2012, p.
6, accessed October 14, 2013, http://nieer.org/sites/nieer/files/yearbook2012.pdf .
30 Ibid, p. 6.
31 Ibid, p. 15.
32National Institute for Early Education Research, The State of Preschool: 2003, State Preschool Yearbook, 2003,
Table 3, accessed October 14, 2013, http://nieer.org/sites/nieer/files/2003yearbook.pdf .
33 Ibid, p. 104.
34Public school UPK programs require that teachers have a BA degree if hired before 1978 and a MA degree if
hired after 1978 in addition to a NYS teaching certificate. Nonpublic UPK teachers are required to have a BA inearly childhood or related field with a 5-year plan to become certified. See National Institute for Early Education
Research, The State of Preschool 2011, State Preschool Yearbook, 2011, p. 104, accessed October 14, 2013,
http://nieer.org/sites/nieer/files/2011yearbook.pdf .
35New York State Education Department, 2012-13 NYS Universal Prekindergarten Program, May 17, 2012, accessed
October 14, 2013, http://www.p12.nysed.gov/funding/2012-13upk/home.html.
36Ibid.
7/27/2019 The Challenge of Making Universal Prekindergarten a Reality in New York State
http://slidepdf.com/reader/full/the-challenge-of-making-universal-prekindergarten-a-reality-in-new-york-state 25/27
Citizens Budget Commission
25
37New York State Education Department, Questions and Answers, Including Mid-Year Programs, Universal
Prekindergarten, April 19, 2011, accessed October 14, 2013, http://www.p12.nysed.gov/upk/faq.html.
38New York State Education Department, New York State Prekindergarten Foundation for the Common Core,
accessed October 14, 2013, http://www.p12.nysed.gov/ciai/common_core_standards/pdfdocs/nyslsprek.pdf .
39
Pre-k attendance would not be mandatory and it is unlikely that all eligible students would enroll.40
K-12 per pupil spending on general education is less than per pupil spending for students receiving special
education.
41The analysis subtracts $412 million in Head Start spending and $403 million in current UPK spending including
the new $25 million for competitive grants. Total estimated Head Start spending of $412 million is calculated by
multiplying 44,099, the number of children enrolled, by $9,342, average spending per Head Start pupil. See
National Institute for Early Education Research, The State of Preschool 2012, State Preschool Yearbook, 2012, p.
103, accessed October 14, 2013, http://nieer.org/sites/nieer/files/yearbook2012.pdf . The 33,988 three- and four-
year-olds receiving State- and county-funded special education preschool center-based services in 2011-12 are
excluded from the enrollment count.
42Citizens Budget Commission, Improving the Poorly Targeted Proposed School Aid Increase, March 21, 2012,
accessed October 15, 2013, http://www.cbcny.org/cbc-blogs/blogs/improving-poorly-targeted-proposed-school-aid-increase.
43Office of the New York State Comptroller, Report on the State Fiscal Year 2013-14 Enacted Budget and Financial
Plan, July 2013, accessed October 16, 2013,
http://www.osc.state.ny.us/reports/budget/2013/financial_plan0713.pdf .
44New York State School Boards Association, Overall, 95% of School Budgets Pass, May 22, 2013, accessed
October 15, 2013, http://www.nyssba.org/news/2013/05/22/press-releases/overall-95-of-school-budgets-pass/.
45New York State Department of Taxation and Finance, New York State Tax Sourcebook, Table 8, accessed
October 15, 2013, http://www.tax.ny.gov/research/stats/statistics/policy-
special/tax_sourcebook/new_york_state_tax_sourcebook_electronic_toc_tables_excel.htm.
46Schweinhart, Lawrence J., Clive R., Montie, Xiang, Zongping, Barnett, W. Steven, Belfield, Jeanne, and Nores,
Milagros, “The High/Scope Perry Preschool Study Through Age 40: Summary, Conclusions, and Frequently Asked
Questions,” High/Scope Press (2005): p. 5.
47 Ibid, p. 4. Participants in the program committed less violent crimes (32% vs. 48%), property crimes (36% vs.
58%), and drug crimes (14% vs. 34%). For males in the program, the cost to society was $732,894 less over their
lifetimes as a result of the decrease in crime.
48National Institute for Early Education Research, Who Goes to Preschool and Why Does it Matter?, November
2007, p. 11, accessed October 14, 2013, http://nieer.org/resources/policybriefs/15.pdf .
49 Ibid, p. 11.
50Campbell, Frances A., Pungello, Elizabeth P., Burchinal, Margaret, Kainz, Kirsten, Pan, Yi, Wasik, Barbara H.,
Barbarin, Oscar A., Sparling, Joseph J., and Ramey, Craig T., “Adult Outcomes as a Function of an Early Childhood
Educational Program: An Abecedarian Project Follow-Up,” Development Psychology 48 (2012): p. 1033.51
National Institute for Early Education Research. Who Goes to Preschool and Why Does it Matter?, November
2007, p. 11, accessed October 14, 2013, http://nieer.org/resources/policybriefs/15.pdf.
52Reynolds, Arthur J., Temple, Judy A., Robertson, Dylan L., and Mann, Emily A., “Age 21 Cost-Benefit Analysis of
the Title 1 Chicago Child-Parent Centers,” Institute for Research on Poverty (2002).
53National Institute for Early Education Research. Who Goes to Preschool and Why Does it Matter? , November
2007, p. 11, accessed October 14, 2013, http://nieer.org/resources/policybriefs/15.pdf .

7/27/2019 The Challenge of Making Universal Prekindergarten a Reality in New York State
http://slidepdf.com/reader/full/the-challenge-of-making-universal-prekindergarten-a-reality-in-new-york-state 26/27
The Challenge of Making Universal Prekindergarten a Reality
26
54Irvine, David, Evaluation of the New York State Experimental Prekindergarten Program, State Education
Department, 1982.
55Alyssa Haywood, “Scaling Up Preschool in Texas,” Eye on Early Education, April 1, 2013, accessed October 14,
2013, http://eyeonearlyeducation.com/2013/04/01/scaling-up-preschool-in-texas/.
56
Grover J. Whitehurst, “Can We Be Hard-Headed About Preschool? A Look at Universal and Targeted Pre-K,”Brookings Institute, January 23, 2013, accessed October 14, 2013, http://www.brookings.edu/blogs/brown-center-
chalkboard/posts/2013/01/23-prek-whitehurst#_ftn3.
57Camilli, Gregory, Vargas, Sadako, Ryan, Sharon, and Barnett, W. Steven, “Meta-Analysis of the Effects of Early
Education Interventions on Cognitive and Social Development,” Teachers College, Columbia University (2010):
602,http://spot.colorado.edu/~camillig/Papers/38_15440.pdf .
58Puma, Mike, Bell, Stephen, Cook, Ronna, Heid, Camilla, Broene, Pam, Jenkins, Frank, Mashburn, Andrew, and
Downer, Jason, “Third Grade Follow-up to the Head Start Impact Study: Final Report,” U.S. Department of Health
and Human Services Office of Planning, Research and Evaluation (2012): xvi.
http://www.acf.hhs.gov/sites/default/files/opre/head_start_report.pdf .
59 Ibid, p. xv.
60 Ibid, p.97.
61National Institute for Early Education Research, The State of Preschool 2012, 2012, p.97, accessed October 14,
2013, http://nieer.org/sites/nieer/files/yearbook2012.pdf .
62Barnett, W. Steven, Jung, Kwanghee, Youn, Min-Jong, and Frede, Ellen C., “Abbott Preschool Program
Longitudinal Effects Study: Fifth Grade Follow-Up,” National Institute for Early Education Research (2013): p. 17.
63 Ibid, p. 21.
64Fuller, Bruce, “Standardized Childhood: The Political and Cultural Struggle over Early Education,” Stanford
University Press (2007):p. 207.
65Magnuson, Katherine A., Ruhm, Christopher J., and Waldfogel, Jane, “Does Prekindergarten Improve
Preparation and Performance?” National Bureau of Economic Research (2004): p. 2,
http://www.nber.org/papers/w10452.pdf?new_window=1.
66 Political Research Associates, Poverty and the Criminal Justice System, May 2005, accessed October 14, 2013,
http://www.publiceye.org/defendingjustice/pdfs/factsheets/11-Fact%20Sheet%20-%20Poverty.pdf .
67Schechter, Carlota and Bye, Beth, “Preliminary evidence for the impact of mixed-income preschools on low-
income children’s language growth,” Early Childhood Research Quarterly (2007): p. 137,
http://www.lumeinstitute.org/wp-
content/uploads/2011/03/Preliminary_Evidence_for_the_Impact_of_Mixed_Income_Preschools.pdf .
68National Institute for Early Education Research, The State of Preschool 2012, State Preschool Yearbook, New
Jersey Profile, 2012, accessed October 18, 2013, http://nieer.org/sites/nieer/files/New%20Jersey_0.pdf .
69New York State Education Department, School District Master Files for School Years 2010-11 and 2011-12,
accessed October 18, 2013, http://www.oms.nysed.gov/faru/Profiles/profiles_cover.html. New York StateEducation Department, New York State School Report Cards, Fiscal Accountability Supplement, School Year 2011-
12, accessed October 18, 2013, https://reportcards.nysed.gov/.
70 Ibid.
71U.S. Department of Commerce, U.S. Census Bureau, 2010 Decennial Census.
72New York State Education Department.
7/27/2019 The Challenge of Making Universal Prekindergarten a Reality in New York State
http://slidepdf.com/reader/full/the-challenge-of-making-universal-prekindergarten-a-reality-in-new-york-state 27/27
Citizens Budget Commission
73New York State Education Department, Public School Enrollment and Staff, School Year 2009-10, Table 10,
accessed October 18, 2013, http://www.p12.nysed.gov/irs/statistics/enroll-n-staff/TABLE10elementary.pdf . U.S.
Department of Commerce, U.S. Census Bureau, American Community Survey, Population Under 18 Years of Age,
2009, accessed October 18, 2013,
http://factfinder2.census.gov/faces/tableservices/jsf/pages/productview.xhtml?pid=ACS_09_1YR_B09001&prodT
ype=table.74
New York State Education Department, Enacted State Aid for School Year 2013-14.
75 Ibid.
76National Institute for Early Education Research, The State of Preschool 2012, State Preschool Yearbook, 2012, p.
103, accessed October 14, 2013, http://nieer.org/sites/nieer/files/yearbook2012.pdf .
77 Annie E. Casey Foundation, National Kids Count, Head Start Enrollment by Age Group, 2012, accessed October
18, 2013, http://datacenter.kidscount.org/.
78The Center for Children’s Initiatives, CCI Primer 2011: Key Facts About Early Care and Education in New York City,
p. 23, accessed October 18, 2013, http://www.centerforchildrensinitiatives.org/ccinyc/Website_PDF_s/CCI-Primer-
2011_14.pdf .
79 New York State Education Department, Enacted State Aid for School Year 2013-14.
80New York State Education Department, School District Master File for School Year 2011-12, accessed October 18,
2013, http://www.oms.nysed.gov/faru/Profiles/profiles_cover.html.