The challenge of integrating offshore wind power in the U ... Library/Research/Wind Power... · The...
25
Paper submitted to Renewable Energy 2016-03-10 1 The challenge of integrating offshore wind power in the U.S. electric grid. 1 Part II: Simulation of electricity market operations. 2 H. P. Simão 1 , W. B. Powell 1, C. L. Archer 2 , W. Kempton 2 3 1 Department of Operations Research and Financial Engineering, Princeton University 4 2 College of Earth, Ocean, and Environment, University of Delaware 5 Corresponding author: Cristina L. Archer, University of Delaware, Integrated Science and Engineering 6 Laboratory (ISELab) #371, 221 Academy Street, Newark, DE 19716, USA, [email protected], +1 302 831 7 6640 8 Highlights: 9 1. Smart-ISO, a simulator of the PJM planning process, is developed, tested, and evaluated. 10 2. Injecting large amounts of offshore wind power (36 GW) in the current electricity grid is feasible 11 with current planning process and current wind forecast errors simply via additional reserves; 12 3. With perfect wind forecasts, at least twice as much offshore wind power can be integrated with 13 less than half of the reserves than with the current wind forecast errors. 14 Abstract 15 The purpose of this two-part study is to analyze large penetrations of offshore wind power into the grid 16 of a large Regional Transmission Organization (RTO), using the case of the grid operated by PJM 17 Interconnection in the northeastern U.S. Part I of the study introduces the wind forecast error model 18 and Part II, this paper, describes Smart-ISO, a simulator of PJM’s planning process for generator 19 scheduling, including day-ahead and intermediate-term commitments to energy generators and real- 20 time economic dispatch. Using a carefully calibrated model of the PJM grid and realistic models of 21 offshore wind (described in Part I), it is shown that, except in summer, an unconstrained transmission 22 grid can meet the load at five build-out levels spanning 7 to 70 GW of capacity, with the addition of at 23 most 1 to 8 GW of reserves. 24 In the summer, the combination of high load and variable winds is challenging. The simulated grid can 25 handle up through build-out level 3 (36 GW of offshore wind capacity), with 8 GW of reserves and 26 without any generation shortage. For comparison, when Smart-ISO is run with perfect forecasts, all five 27 build-out levels, up to 70 GW of wind, can be integrated in all seasons with at most 3 GW of reserves. 28 This reinforces the importance of accurate wind forecasts. At build-out level 3, energy from wind would 29 satisfy between 11 and 20% of the demand for electricity and settlement prices could be reduced by up 30 to 24%, though in the summer peak they could actually increase by up to 6%. CO 2 emissions are reduced 31 by 19-40%, SO 2 emissions by 21-43%, and NOx emissions by 13-37%. 32
Transcript of The challenge of integrating offshore wind power in the U ... Library/Research/Wind Power... · The...

PapersubmittedtoRenewableEnergy 2016-03-10
1
ThechallengeofintegratingoffshorewindpowerintheU.S.electricgrid.1
PartII:Simulationofelectricitymarketoperations.2
H.P.Simão1,W.B.Powell1,C.L.Archer2,W.Kempton23
1DepartmentofOperationsResearchandFinancialEngineering,PrincetonUniversity4
2CollegeofEarth,Ocean,andEnvironment,UniversityofDelaware5
Correspondingauthor:CristinaL.Archer,UniversityofDelaware,IntegratedScienceandEngineering6Laboratory(ISELab)#371,221AcademyStreet,Newark,DE19716,USA,[email protected],+1302831766408
Highlights:9
1. Smart-ISO,asimulatorofthePJMplanningprocess,isdeveloped,tested,andevaluated.10
2. Injectinglargeamountsofoffshorewindpower(36GW)inthecurrentelectricitygridisfeasible11withcurrentplanningprocessandcurrentwindforecasterrorssimplyviaadditionalreserves;12
3. Withperfectwindforecasts,atleasttwiceasmuchoffshorewindpowercanbeintegratedwith13lessthanhalfofthereservesthanwiththecurrentwindforecasterrors.14
Abstract15
Thepurposeofthistwo-partstudyistoanalyzelargepenetrationsofoffshorewindpowerintothegrid16ofalargeRegionalTransmissionOrganization(RTO),usingthecaseofthegridoperatedbyPJM17InterconnectioninthenortheasternU.S.PartIofthestudyintroducesthewindforecasterrormodel18andPartII,thispaper,describesSmart-ISO,asimulatorofPJM’splanningprocessforgenerator19scheduling,includingday-aheadandintermediate-termcommitmentstoenergygeneratorsandreal-20timeeconomicdispatch.UsingacarefullycalibratedmodelofthePJMgridandrealisticmodelsof21offshorewind(describedinPartI),itisshownthat,exceptinsummer,anunconstrainedtransmission22gridcanmeettheloadatfivebuild-outlevelsspanning7to70GWofcapacity,withtheadditionofat23most1to8GWofreserves.24
Inthesummer,thecombinationofhighloadandvariablewindsischallenging.Thesimulatedgridcan25handleupthroughbuild-outlevel3(36GWofoffshorewindcapacity),with8GWofreservesand26withoutanygenerationshortage.Forcomparison,whenSmart-ISOisrunwithperfectforecasts,allfive27build-outlevels,upto70GWofwind,canbeintegratedinallseasonswithatmost3GWofreserves.28Thisreinforcestheimportanceofaccuratewindforecasts.Atbuild-outlevel3,energyfromwindwould29satisfybetween11and20%ofthedemandforelectricityandsettlementpricescouldbereducedbyup30to24%,thoughinthesummerpeaktheycouldactuallyincreasebyupto6%.CO2emissionsarereduced31by19-40%,SO2emissionsby21-43%,andNOxemissionsby13-37%.32
PapersubmittedtoRenewableEnergy 2016-03-10
2
Thisstudyfindsthatintegratingupto36GWofoffshorewindisfeasibleinthePJMgridwithtoday’s33generationfleetandplanningpolicies,withtheadditionof8GWofreserves.Abovethat,PJMwould34requireadditionalinvestmentsinfast-rampinggasturbines,storageforsmoothingfast-rampingevents,35and/orotherstrategiessuchasdemandresponse.36
Keywords:unitcommitment,powerflow,economicdispatch,uncertainty,PJM.37
1 Introduction38
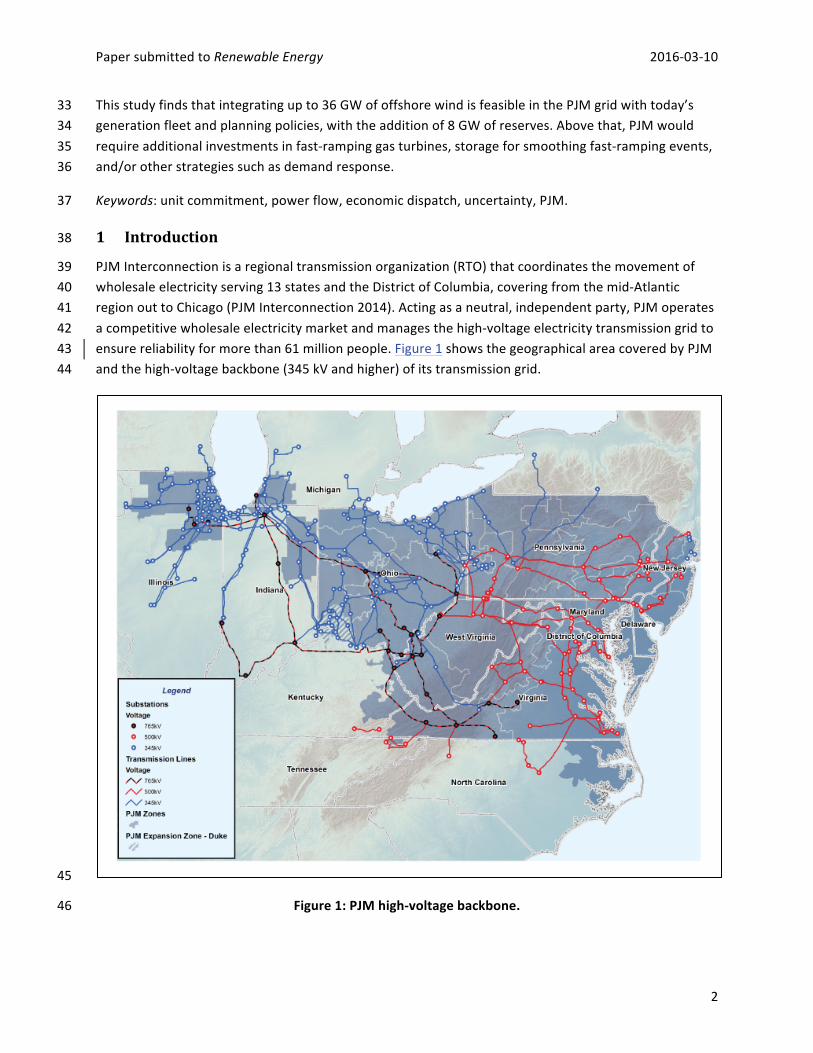
PJMInterconnectionisaregionaltransmissionorganization(RTO)thatcoordinatesthemovementof39wholesaleelectricityserving13statesandtheDistrictofColumbia,coveringfromthemid-Atlantic40regionouttoChicago(PJMInterconnection2014).Actingasaneutral,independentparty,PJMoperates41acompetitivewholesaleelectricitymarketandmanagesthehigh-voltageelectricitytransmissiongridto42ensurereliabilityformorethan61millionpeople.Figure1showsthegeographicalareacoveredbyPJM43andthehigh-voltagebackbone(345kVandhigher)ofitstransmissiongrid.44
45
Figure1:PJMhigh-voltagebackbone.46

PapersubmittedtoRenewableEnergy 2016-03-10
3
Attheendof2013,thetotalinstalledcapacitywithinthePJMmarketwasabout183Gigawatts(GW)47andthepeakloadduringtheyearwasover157GW(MonitoringAnalytics2014).Theyearlygeneration48inPJMbypercentageofeachfuelsourcebetween2010and2013isshowninTableI(Monitoring49Analytics2011,2012,2013,2014).50
TableI:PJMactualgenerationbyfuelsource(%)between2010and201351
FuelSource 2010 2011 2012 2013Coal 49.3 47.1 42.1 44.3Nuclear 34.6 34.5 34.6 34.8Gas 11.7 14.0 18.8 16.3Hydroelectric 2.0 1.9 1.6 1.8Wind 1.2 1.4 1.6 1.9Other 1.2 1.1 1.3 0.9
52
ThebasicfunctionsofPJMcomprisegridoperations(supply/demandbalanceandtransmission53monitoring),marketoperations(managingopenmarketsforenergy,capacityandancillaryservices)and54regionalplanning(15-yearlook-ahead)(PJMInterconnection2014).Theinterestinthispaperisto55analyzetheabilityoftheenergymarketandthetransmissiongridwithinthePJMareatointegratenon-56dispatchablegenerationinquantitiesmuchlargerthanthecurrentlevels.AsindicatedinTableI,in201357windpowercorrespondedtolessthan2%ofthetotalgeneration.TheMid-Atlanticoffshorewindpower58productionproposedandmodeledinPartIofthistwo-partpaper(Archeretal.2016)wouldbringthat59fractiontoasmuchas28%atcertaintimesoftheyear,thusraisingthequestionofhowtomanagethe60generationscheduleandthetransmissiongridcapacityundersuchascenario.61
Inordertoanswerthisquestion,thispaperintroducesSMART-ISO,asimulatorofthemarketoperations62ofPJM,includingthetransmissiongrid.DevelopedatPENSALabatPrincetonUniversity,SMART-ISOisa63detailedmodelofthePJMplanningprocessdesignedspecificallytomodelthevariabilityand64uncertaintyfromhighpenetrationsofrenewables.Itcapturesthetimingofinformationanddecisions,65steppingforwardin5-minuteincrementstocapturetheeffectoframpingconstraintsduringrapid66changesinwindenergy.67
ThehigherlevelsofwindpowerpenetrationinthePJMmarketanalyzedinthisstudyarenotlikelyto68becomerealityforatleastanothertwodecades.Thispapertriestoanswerquestionsabouthowto69managethesysteminthosefuturescenariosbyusingthecurrentstructureofthemarket,namely,the70currentpowersupplysources,transmissiongridandoperatingpolicies.Thoughitisexpectedthatthe71marketstructuremaychangesignificantlyinthattimeframe(e.g.,lesscoal-basedgeneration,more72distributedgeneration,reliefintransmissionconstraints,andimprovedforecastingperformance),73anticipatingthesechangesisbeyondthescopeofthispaper.Theresultsobtainedinthisstudyare74usefulinthattheyrevealsomeofthelimitingfactorsinthecurrentmarketandpointtothedirectionto75followinordertoovercometheselimitations.76

PapersubmittedtoRenewableEnergy 2016-03-10
4
2 TheSMART-ISOmodel77
SMART-ISOisasimulatorofthemarketoperationsofPJMthataimstostrikeabalancebetween78detailedrepresentationofthesystemandcomputationalperformance.Itcomprisesthreeoptimization79modelsembeddedwithinasimulationmodelthatcapturesthenesteddecision-makingprocess:80
1. Day-aheadunitcommitment(DA-UC)model.812. Intermediate-termunitcommitment(IT-UC)model.823. Real-timeeconomicdispatch.83
Accuratemodelingofthenestingofthesethreemodelsisacentral(andpowerful)toolusedbyRTOsto84adapttouncertainty.InSMART-ISOallthreeoptimizationmodelsincludeaDCapproximationofthe85powerflow.Inaddition,anACpowerflowmodelisrunafterboththeintermediate-termUCandthe86real-timeeconomicdispatchmodelsinordertoverifytheelectricalstabilityofthegrid.87
Thesimulatortakesasinputs:88
1. ThelistofgeneratorsavailableforschedulinginthePJMarea(includingallrelevantoperational89andeconomicparameters).90
2. Thetransmissiongrid(busesandlines),includingrelevanttransmissionparameters.913. Historical(and/orsimulated)timeseriesofloads(bothactiveandreactive)atthebuslevelover92
thesimulationhorizon.934. Rollingtimeseriesforecastsofnon-dispatchablegeneration(e.g.wind)overthesamehorizon.945. Historical(and/orsimulated)timeseriesofnon-dispatchablegeneration.95
Theforecastedtimeseriesareusedintheschedulingmodels(day-aheadandintermediate-termUC’s),96whereasthehistoricalorsimulatedtimeseriesareusedintheeconomicdispatchmodel.97
Thelistofgeneratorsavailableinthesimulatorincluded830units,whichcomprised97.8%ofthe98installedcapacityin2010.Thesegeneratorswerepartitionedintofourcategories:(1)must-run,which99includeallnuclear-fueledgeneratorsandthose(predominantlycoal-fueled)withnotificationpluswarm-100uptimesabove32hours;(2)slow,whichincludeallgeneratorswithnotificationpluswarm-uptimes101between2and32hours;(3)fast,whichincludethosewithnotificationpluswarm-uptimesbelow2102hours;and(4)other,whichincludehydro,pumpedstorage,andwind.Thegeneratorsinthecategories103must-runandotherareassumedtobealwayson.Thereforeonlytheslowandfastgeneratorsare104scheduledintheunitcommitmentmodels.105
PJM’stransmissiongridcomprisedover9,000busesand11,500branchesin2010.Thoughfeasible,106runningtheunitcommitmentandeconomicdispatchmodelswithafull-sizeintegratedgridhas107significantcomputationalcosts.Tostrikeabalancebetweengridrepresentationandcomputational108complexity,multipleaggregateversionsofthegridwerecreated,includingonlythebusesatorabovea109givenvoltage.SMART-ISOcanrunthedifferentmodelsatdifferentlevelsofaggregation,butitis110recommendedrunningtheunitcommitmentmodelsathigheraggregationlevel(s)thantheeconomic111dispatchmodel.TableIIdisplaysthelevelsofgridaggregationavailableinSMART-ISO,withtheir112respectivedimensionsintermsofthetotalnumberofbusesandbranches.Intherunsperformedinthis113

PapersubmittedtoRenewableEnergy 2016-03-10
5
study,the315-kVgridwasusedforunitcommitment(bothday-aheadandintermediate-term),andthe114220-kVgridforeconomicdispatch.115
TableII:GridaggregationlevelsavailableinSMART-ISO.Column“0”includesallbusesandall116branches.117
MinimumVoltage(kV) 0 69 72 118 220 315 500#ofBuses 9,154 5,881 4,829 3,950 1,360 354 131#ofBranches 11,840 7,750 6,260 5,210 1,715 454 159
SpecialcarewastakenwithinSMART-ISOtocloselymatchPJM’sleadtimesbetweenwhenadecisionis118made(e.g.whenaunitcommitmentmodelruns)andwhenitisimplemented.Notsurprisingly,lead119timeshighlighttheimportanceofthequalityoftheforecasts,especiallyfortheintermediate-termunit120commitmentmodelwhereevenhour-aheadprojectionscanbequitepoor.Asthisarticlewillshow,121short-termforecastingerrorsprovedtobethemajorfactorlimitingtheabsorptionofhighpenetrations122ofoffshorewind.123
TypicallySMART-ISOrunsforasimulationhorizonof8days,wherethefirstdayisdiscardedtoavoidany124initializationbias.Eachofthethreeoptimizationmodelsisrunsequentiallyovertheentiresimulation125horizon,withtheirdifferentplanninghorizonsandtimescalesnestedandsynchronized.Thesimulation126isrepeatedforasmanysamplepathsoftherandomrealizationsasdesired.Inthenextsubsections127somedetailsofeachoneoftheoptimizationmodelsandthepowerflowmodelsarebrieflydescribed,128aswellasthemainpolicytodealwithuncertaintyinunitcommitment.129
2.1 Day-aheadunitcommitmentmodel130
Theday-aheadUCmodelinSMART-ISOrunsonceevery24hours,atnoon,similarlytohowitactually131runsinPJM.Itsplanninghorizonspans40hoursinhourlytimesteps,startingfromnoononagivenday132until4amontheseconddayfollowing.Historicalloadsandlong-term(day-ahead)forecastsofnon-133dispatchablegenerationareusedinthismodel.Theplanninghorizonisfunctionallysub-dividedinto134fourblocksoftime,asdepictedinFigure2.135
136
Figure2:Planninghorizonofday-aheadUCmodel.137
BlocksAandBcorrespondtotheinitialperiodoftimewhennogeneratorsareturnedonoroffbecause138thosedecisionswouldhavebeenmadeinpreviousunitcommitments,eithertheday-aheadorthe139intermediate-term.DuringthoseblocksoftimetheUCmodelactsjustasaneconomicdispatchmodel;140thatis,itvariestheamountofenergyproducedbyeach(turned-on)dispatchablegenerator,inorderto141
PapersubmittedtoRenewableEnergy 2016-03-10
6
followtheforecastedloadandadjustforthenon-dispatchablegeneration(alsoforecasted).However,in142blockBgeneratorsmaybenotifiedthattheywillhavetogoonoroffstartingfromthebeginningof143blockC.InblocksCandDanysloworfastgeneratorcanbescheduledorunscheduled,butonlythe144notificationandon/offdecisionsinvolvingslowgeneratorsduringperiodsBandCwillbemadeeffective145(thatis,lockedin),whereasdecisionsinvolvingfastgeneratorsarefinalizedintheintermediate-term146model,describednext.BlockDisaddedtothetimehorizontominimizeend-of-horizoneffectsonthe147decisionsmadeattheendofblockC.148
2.2 Intermediate-termunitcommitmentmodel149
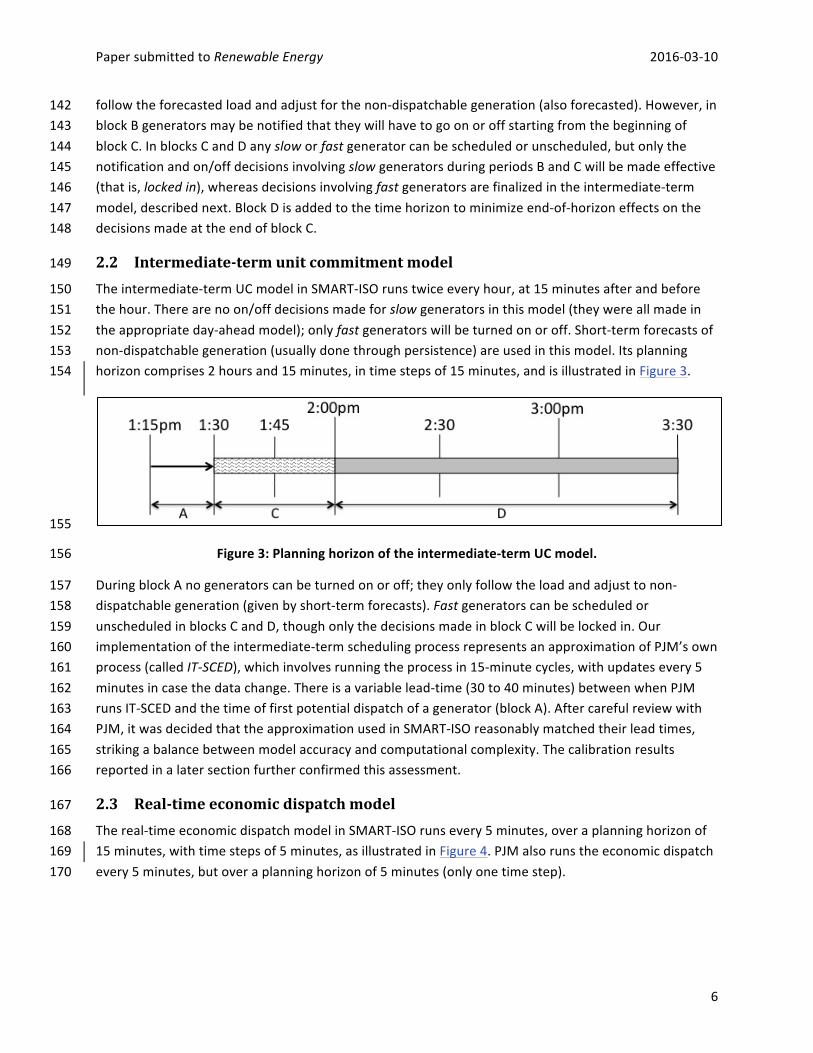
Theintermediate-termUCmodelinSMART-ISOrunstwiceeveryhour,at15minutesafterandbefore150thehour.Therearenoon/offdecisionsmadeforslowgeneratorsinthismodel(theywereallmadein151theappropriateday-aheadmodel);onlyfastgeneratorswillbeturnedonoroff.Short-termforecastsof152non-dispatchablegeneration(usuallydonethroughpersistence)areusedinthismodel.Itsplanning153horizoncomprises2hoursand15minutes,intimestepsof15minutes,andisillustratedinFigure3.154
155
Figure3:Planninghorizonoftheintermediate-termUCmodel.156
DuringblockAnogeneratorscanbeturnedonoroff;theyonlyfollowtheloadandadjusttonon-157dispatchablegeneration(givenbyshort-termforecasts).Fastgeneratorscanbescheduledor158unscheduledinblocksCandD,thoughonlythedecisionsmadeinblockCwillbelockedin.Our159implementationoftheintermediate-termschedulingprocessrepresentsanapproximationofPJM’sown160process(calledIT-SCED),whichinvolvesrunningtheprocessin15-minutecycles,withupdatesevery5161minutesincasethedatachange.Thereisavariablelead-time(30to40minutes)betweenwhenPJM162runsIT-SCEDandthetimeoffirstpotentialdispatchofagenerator(blockA).Aftercarefulreviewwith163PJM,itwasdecidedthattheapproximationusedinSMART-ISOreasonablymatchedtheirleadtimes,164strikingabalancebetweenmodelaccuracyandcomputationalcomplexity.Thecalibrationresults165reportedinalatersectionfurtherconfirmedthisassessment.166
2.3 Real-timeeconomicdispatchmodel167
Thereal-timeeconomicdispatchmodelinSMART-ISOrunsevery5minutes,overaplanninghorizonof16815minutes,withtimestepsof5minutes,asillustratedinFigure4.PJMalsorunstheeconomicdispatch169every5minutes,butoveraplanninghorizonof5minutes(onlyonetimestep).170

PapersubmittedtoRenewableEnergy 2016-03-10
7
171
Figure4:Planninghorizonofthereal-timeeconomicdispatchmodel.172
Nogeneratorsareturnedonoroffinthismodel.Instead,generatorsareonlymodulatedtofollowthe173actual(orsimulated)loadandadjusttonon-dispatchablegeneration(alsoactualorsimulated).The174generationamountssimulatedinblockCarekept,whereastheonessimulatedinblockDarediscarded,175asblockDwasaddedtotheplanninghorizonofthismodelagaintomitigateend-of-horizonbiasesin176thecalculationsinblockC.177
2.4 Powerflowmodels178
ToincorporatetransmissiongridconstraintsintoSMART-ISO,unitcommitmentandeconomicdispatch179modelsthatincludepowerflowmodelingwereimplemented.TheDCapproximationwasusedtosolve180thepowerflowembeddedinthelinearoptimizationproblems.Thisisawidelyusedapproximationfor181thepowerflowintransmissiongrids,sinceitdoesnotrequireiterations(astheACpowerflowdoes)182andtheoptimizationproblemremainslinearandconsequentlylesscomplex(Stottetal.2009,Hedman183etal.2011,Overbyeetal.2004).TheDCapproximationpowerflowmodelconsidersonlyactivepower184andassumesthatthenominalvoltagesremainconstant.185
However,toverifythevoltagestabilityofthegrid,andpossiblycorrectforit,anACpowerflowmodel186thatrunsonceaftereveryintermediate-termUCandonceaftereveryeconomicdispatchmodelinthe187simulationwasalsoimplemented.IftheACpowerflowsolutionafteranintermediate-termUCmodel188showssignificantvoltagedeviationsfromthenominalvalues(where“significant”isdefinedintermsof189observedhistoricalpatterns),asinglefeedbackloopwillmakeartificialadjustmentstolocalbusloads,190andtheintermediate-termUCmodelwillbesolvedagain,aimingtochangetheallocationofpower191generationsoastolessenthevoltagedeviations.192
TheDCapproximationcanbetoorigid,indicatingthatpowerrequirements(whileholdingvoltages193constant)mightnotbemet,whiletheACmodelcanflexvoltagestomeetloads,frequentlyby194increasingcurrents.Highercurrentscanbetoleratedforshortperiodsoftime.Thegreaterflexibilityof195theACpowerflowprovedtobeimportantinthestudiesofnon-dispatchablesourcesthatrequired196adaptationtoshortbutsuddendropsinwind.197
Forthesamereason,theACpowerflowmodelissolvedagainaftereacheconomicdispatchmodelrun,198inordertoassesstheoverallstabilityandfeasibilityoftheoperationofthegrid.Loadgreaterthan199generationwithinPJMisreferredtoas“generationshortfall.”AnRTOwillhandlethisproblemwith200demandmanagement,orbycallinginterruptiblecustomerstoclosedown,orwithtransfersfrom201neighboringRTOs.Ifthereisathreattothestabilityofthelargersystem,theymightshedloadby202unannouncedcutoffs,anemergencyprocedure.WithoutstatinghowPJMwouldrespond,thispaper203

PapersubmittedtoRenewableEnergy 2016-03-10
8
simplycallssuchcases“generationshortfall.”IftheACpowerflowsolutiondoesnotconvergeor204significantvoltagedeviationsaredetected,theoperationofthegridisflaggedas“ACunstable”during205that5-minutetimeperiod.If,however,thereisgenerationshortfallinthesolutionoftheDC-based206economicdispatch(usuallyaninfeasiblesituation),buttheACpowerflowsolutionconvergesandis207voltage-stable,thentheDCgenerationshortfallisdismissed(thatis,theinfeasibilityisignored).Upto20810consecutiveminutesofdismissedDCgenerationshortfallwillbeallowed.Ifthesituationpersistsfor20915minutesorlonger,thenthedismissalisrevertedandthegenerationshortfallisflagged,regardlessof210theACpowerflowstability.211
2.5 Reserves212
RTOssuchasPJMuseavarietyofstrategiestomanagetheuncertaintiesthatariseinanyenergy213system,includingthehedgingofdecisionswiththesequenceofday-ahead,intermediate-term,andreal-214timeplanning,combinedwiththeuseofreservesthatmakeitpossibleforPJMtorespondtochanging215forecastsandreal-timeconditionsthatdeviatefromforecast.Theinterestintestingmuchhigher216penetrationsofwindrequiredthatthesestrategiesbeexploited,buttheexperimentsfocusedprimarily217onincreasingtheavailabilityofsynchronizedreservesthatcouldberamped(upordown)within10218minutes.219
ThebasemodelrepresentedPJM’sdefaultpolicyofprovidingenoughspinningreservetocover220unexpectedpowerimbalanceequivalenttoitslargestgenerator,thatis,1300MW.Additionalreserve221wasthenintroducedintheformoffastgeneratorsthatcouldrampupordown.Up-rampingwasused222tocoverunexpecteddropsinwind,whiledown-rampingwasusedtotakeadvantageofsuddensurges223inwind.Theserampingreserveswereexpressedandtunedassingleparameters,foreachseason,224reflectingthedifferencesinboththeaverageandmaximumloads,butalsothetypesofweather225encounteredineachseason.226
Notsurprisingly,reservesrepresentapowerfulstrategyforhandlinguncertainty,widelyusedbyRTOs.A227significantfindingofthisresearchwasthatthissimpleindustrypracticecouldbeextendedtohandle228dramaticallyhigherpenetrationsofwindthannowexist,asshownbelow.229
Thechallengeofplanningmarketoperationsunderuncertaintyhasattractedconsiderableattention230fromthealgorithmiccommunity,withspecialattentionbeinggiventoasolutionofthe“stochasticunit231commitmentproblem”(Takritietal.1996,Ryanetal.2013).Thisisaparticularalgorithmicstrategy232developedbythestochasticprogrammingcommunity(BirgeandLouveaux2011),whichreplacesa233deterministicforecast(usedbyallRTOs)withasetofscenariosthatapproximatewhatmighthappen.In234thispaper,itisdemonstratedthatthestandardreservepoliciesusedbyRTOsareveryeffectiveat235handlingtheuncertaintyevenfromveryhighlevelsofrenewables.236
3 CalibrationofSMART-ISO237
ThefirsttaskwastocalibrateSMART-ISOagainstabasecasewithnooffshorewindpower.Theyearof2382010waschosenasthebaseyearbecauseitwasthelatestyearforwhichacompletedatasetofthe239PJMnetworkandactualoperationswasavailableatthestartofthisproject.Fourweeksduringtheyear240

PapersubmittedtoRenewableEnergy 2016-03-10
9
werechosenforsimulation,oneineachseason.AprilandOctoberwerechosenasrepresentativeofthe241shoulder(lowestdemand)monthsinspringandfall,respectively.Januarywaschosenasrepresentative242ofthewinterdemand,andJulywaspickedasrepresentativeofthepeaksummerdemand.243
Tofocusonuncertaintyinwindforecasts,othersourcesofuncertaintywereeliminatedfromthe244simulationby(1)usingactual(historical)timeseriesofdemand(loads)ratherthanlong-termorshort-245termforecasts,(2)ignoringonshorewindandsolarproduction,(3)ignoringpotentialgeneratorand246transmissionfailures,and(4)ignoringvariationsduetoneighboringRTOs.Therefore,theonly247uncertaintypresentinthisstudycomesfromtheforecastedoffshorewindpower.Similarly,thesame248levelofsynchronizedreserveusedbyPJM,whichwas1300MW(thesizeoftheirlargestgenerator),was249modeled.Whilethisreservewouldcoverthelossofanyonegenerator,itisusedtorespondto250uncertaintyinwindforecastsaswell.Itwasalsofoundthatmodestreserveswereneededtodealwith251whatmightbecalled“modelnoise”–variationsinthesolutionarisingfrommodeltruncationandfrom252solvinglargeintegerprograms.InthissectionresultsonthecalibrationofSMART-ISOarepresented,253whereasinthenexttheresultsfromtheintegrationstudyarediscussed.254
SMART-ISOwasvalidatedbycomparingtwosetsofstatisticsfromthemodeltohistory:thehourly255generationtypemixandthehourlylocationalmarginalprice(LMP)averagedovertheentiregrid.These256statisticswerecreatedforeachofthefourseasonalweeks.Figure5displaystheplotsofthehistorical257hourlygenerationtypemixforeachoneofthefourweeks(leftcolumn),placedside-by-sidewiththe258correspondingsimulatedmixes(rightcolumn).Thegenerationtypesweregroupedinfourmajor259categories:nuclear,steam,combined-cycle/gas-turbines,andhydroelectric/pumped-storage.260
a) b)
c) d)
e) f)
0"
20"
40"
60"
80"
100"
13)Jan" 14)Jan" 15)Jan" 16)Jan" 17)Jan" 18)Jan" 19)Jan"
GW"
Time"(hours)"
Historical"PJM"Hourly"GeneraDon")"January"2010"
Hydro+Pumped"Combined+Gas"Steam"Nuclear"
0"
20"
40"
60"
80"
100"
13)Jan" 14)Jan" 15)Jan" 16)Jan" 17)Jan" 18)Jan" 19)Jan"
GW"
Time"(hours)"
Simulated"PJM"Hourly"GeneraEon")"January"2010"
Hydro+Pumped"Combined+Gas"Steam"Nuclear"
0"
20"
40"
60"
80"
19)Apr" 20)Apr" 21)Apr" 22)Apr" 23)Apr" 24)Apr" 25)Apr"
GW"
Time"(hours)"
Historical"PJM"Hourly"GeneraEon")"April"2010"
Hydro+Pumped"Combined+Gas"Steam"Nuclear"
0"
20"
40"
60"
80"
19)Apr" 20)Apr" 21)Apr" 22)Apr" 23)Apr" 24)Apr" 25)Apr"
GW"
Time"(hours)"
Simulated"PJM"Hourly"GeneraFon")"April"2010"
Hydro+Pumped"Combined+Gas"Steam"Nuclear"
0"
30"
60"
90"
120"
22(Jul" 23(Jul" 24(Jul" 25(Jul" 26(Jul" 27(Jul" 28(Jul"
GW"
Time"(hours)"
Historical"PJM"Hourly"GeneraDon"("July"2010"
Hydro+Pumped"Combined+Gas"Steam"Nuclear"
0"
30"
60"
90"
120"
22(Jul" 23(Jul" 24(Jul" 25(Jul" 26(Jul" 27(Jul" 28(Jul"
GW"
Time"(hours)"
Simulated"PJM"Hourly"GeneraEon"("July"2010"
Hydro+Pumped"Combined+Gas"Steam"Nuclear"

PapersubmittedtoRenewableEnergy 2016-03-10
10
g) h)Figure5ComparisonofhistoricalversussimulatedPJMhourlygenerationmixesin2010.Thescaleof261thevaluesshownintheverticalaxis(generatedpower)variesfrommonthtomonth.262
Itshouldbenotedthatwhiledetailedactualgenerationandloaddataatthebuslevelwereavailable,it263wasnotpossibletomapallbusestoactualgenerators.Asaresult,theaccountingofthetotalhistorical264generationisbelowthetotalloadbyabout10%(thisexplainsthehigherlevelofgenerationdisplayedin265thesimulationplots).However,itisstillpossibletocomparethepatternsofthehourlygenerationmix266withineachmonth;theyshowagoodmatchbetweenhistoricalandsimulatedresults.Itisnoteworthy267alsothattheproportionofsimulatedgenerationfromcombined-cycleandgasturbinesinthelow-268demandmonths(AprilandOctober)islowerthantheactualhistoricalvalues,possiblyduetothefact269thatSMART-ISOdoesnottakeintoconsiderationlong-termcontractsthatmayexistbetweensomefast270generationsuppliersandPJM,butschedulesallfastgenerationonanhourlybasisandasneeded(note271thisissueisnotpresentinthehigher-demandmonthsofJanuaryandJuly).Whilethisintroducesa272modesterror,itisimportanttoavoidcapturinglong-termcontracts,becauseitcannotbeassumedthat273thesamecontractswillbeinplaceashighpenetrationsofwindenergyaremodeled.274
Moresignificant,however,aretheresultsshowninFigure6,wherethelocationalmarginalprices(LMPs275–in$/MWhr)producedbythesimulatorarecomparedwiththoseobservedintheactualoperationof276PJM.PleasenotethattheLMPsproducedbySMART-ISOincludetheenergyandthetransmissiongrid277congestioncosts,butnotthecostsduetotransmissionlinelossesortooccasionalcontingencies(a278failureofageneratororofatransmissionline,oroff-gridoutages).Thiswouldexplainwhyhistorical279pricesmightbespikierthansimulatedones.Ingeneral,however,thereisaremarkableagreementin280thepatternsbetweenthenetwork-averagedLMPsproducedbythesimulationandthoseobservedin281historyforthefourtimeperiodsinquestion(Figure6).282
a) b)
0"
20"
40"
60"
80"
14(Oct" 15(Oct" 16(Oct" 17(Oct" 18(Oct" 19(Oct" 20(Oct"
GW"
Time"(hours)"
Historical"PJM"Hourly"GeneraDon"("October"2010"
Hydro+Pumped"Combined+Gas"Steam"Nuclear"
0"
20"
40"
60"
80"
14(Oct" 15(Oct" 16(Oct" 17(Oct" 18(Oct" 19(Oct" 20(Oct"
GW"
Time"(hours)"
Simulated"PJM"Hourly"GeneraFon"("October"2010"
Hydro+Pumped"Combined+Gas"Steam"Nuclear"
0"
50"
100"
150"
200"
13'Jan" 14'Jan" 15'Jan" 16'Jan" 17'Jan" 18'Jan" 19'Jan"
$/MWhr"
Time"(hours)"
PJM"Average"Real'Eme"LMPs"'"January"2010"Simulated"Historical"
0"
50"
100"
150"
200"
19'Apr" 20'Apr" 21'Apr" 22'Apr" 23'Apr" 24'Apr" 25'Apr"
$/MWhr"
Time(hours)"
PJM"Average"Real'Bme"LMPs"'"April"2010"Simulated"Historical"

PapersubmittedtoRenewableEnergy 2016-03-10
11
c) d)Figure6ComparisonofhistoricalversussimulatedPJMaveragereal-timeLMPs.283
Onthebasisoftheseresults,SMART-ISOwasdeemedtocloselymatchthebehaviorofPJM,since284accuratemodelingofLMPsrequiresthatallthecomponentsofthesystemcapturereal-worldbehavior.285Itisfurthernotedthattheseresultswereachievedwithoutusinganytunableparameters.286
4 Mid-AtlanticOffshoreWindIntegration(MAOWIT)Study287
Thispaperaddressesfourquestionsconcerningtheintegrationoflargeamountsofnon-dispatchable288energy(inthiscase,offshorewind)intoagenerationandtransmissionmarket:289
1. Willtheexistinggenerationcapacitybeabletohandlethediscrepancybetweentheforecasts290usedinthecommitmentphaseandtheactualenergyobservedinreal-time?291
2. Willtheplanningprocessbeabletohandlethemuchhigherlevelofvariabilityanduncertainty292(evenifthereisenoughgenerationcapacity)?293
3. Whatreservelevelswillberequiredtohandletheuncertaintyintroducedwithhigh294penetrationsofwind?295
4. Willthetransmissiongridbeabletohandletheadditionalload?296
Inthisstudy,offshorewindpower,infiveincreasinglevelsofbuild-out,isassumedtobeinjectedinto297theeasternsideofthePJMgridthroughsixpointsofinterconnectiononthecoast,stretchingfrom298CentralNewJerseytoVirginia.Therefore,itisalmostcertainthatthetransmissiongridalongtheMid-299Atlanticcoastwillhitcapacitywhensignificantamountsofenergyfromoffshorewindareinjected.300
Toseparatetheissueofgridcapacityfromtheplanningandsupplyofenergywithafleetofgenerators,301thestudywasdividedintotwoparts:1)analysiswithahypotheticalgrid,referredtoasthe302unconstrainedgrid,thathasthesamephysicallinesasthecurrentPJMsystem,butthermalcapacities303andthuselectricpowercarryingcapacities,highenoughtohandleanypenetrationlevel(thisisnotthe304sameasignoringthegrid,whichthispaperdidnotdo);and2)analysiswithagridconstrainedby305currentthermalcapacities.Theresultsofthesetwopartsarereportedintheremainderofthissection.306Pleasenotethat,thoughimportant,thispaperdidnotaddressthequestionofhowmuchextragrid307capacitywouldbeneededtosupporttheinjectionoflargeamountsofoffshorewind,which,therefore,308remainedoutsideofitsscope.309
4.1 Unconstrainedgrid,noramp-upor-downreservesadded310
TheSMART-ISOsimulationswereperformedoverone-weekhorizonsineachofthefourseasonal311months,firstwithoutanyoffshorewind(the“current”situation,alsocalledbuild-outlevel0)andthen312
0"
50"
100"
150"
200"
22&Jul" 23&Jul" 24&Jul" 25&Jul" 26&Jul" 27&Jul" 28&Jul"
$/MWhr"
Time"(hours)"
PJM"Average"Real&Cme"LMPs"&"July"2010"Simulated"Historical"
0"
50"
100"
150"
200"
14'Oct" 15'Oct" 16'Oct" 17'Oct" 18'Oct" 19'Oct" 20'Oct"
$/MWhr"
Time"(hours)"
PJM"Average"Real'Fme"LMPs"'"October"2010"Simulated"Historical"

PapersubmittedtoRenewableEnergy 2016-03-10
12
witheachoneofthefivebuild-outlevelsofoffshorewind.Foreachlevelofbuild-outandeachmonth,313threedifferentweekswerepicked,eachexhibitingdifferentmeteorologicalconditions.Forexample,314differentweeksmightexhibitvariousstormsystemsthatintroduceavarietyoframpingevents315producedbytheWRFmeteorologicalsimulator.Themodelofforecasterrorswasthenusedtogenerate316sevensamplepathsofoffshorewindforeachweek,thustotaling21samplepathsforeachmonth,or84317samplepathsoverall(Archeretal.2016).Theresultspresentedhenceforthwerecompiledfrom318simulationsusingthesesamplepaths.319
TableIIIshowstheresultsofaddingincreasinglyhigherlevelsofoffshorewindintotheunconstrained320PJMgrid.Thepercentageofoffshorewindparticipationinthetotalgenerationatbuild-outlevel1321rangedfrom2.2%inthepeakloadmonthofJulyto4.3%inthewintermonthofJanuary,whereasat322build-outlevel5(thehighest)itrangedfrom16.7%to30%.Thepercentageofwindused,withrespect323towhatwasactuallyavailable,wasashighas94.8%,onaverageovertheseason,atbuild-outlevel1in324January,andaslowas56.4%atbuild-outlevel5inOctober.325
ThemostnoteworthyresultsinTableIII,though,aretheestimatesofthelikelihoodofgeneration326shortfallatsometimeduringonesimulatedweek,duetounexpecteddifferencesbetweenthe327forecastedandactualwindpowergeneration.Atbuild-outlevel1,inJanuaryandJuly,forinstance,328whentheloadsarehigher,theprobabilitiesthatthesystemmayoperatewithoutanygeneration329shortfallduringoneweekaremuchsmallerthanintheshouldermonthsofAprilandOctober.From330build-outlevel2andup,inanyseason,itispracticallycertainthatthePJMsystemascurrentlyoperated331(includingcurrentreserves)willfacegenerationshortfallatleastonceaweek.332
TherearedifferentwaysinwhichthePJMmarketoperationcanbemodifiedtotrytocopewiththe333uncertaintyinthewindpowerforecasts.Oneofthemwastested(theonethatisactuallyalreadyused334bytheRTOstodealwithuncertaintiesinthepowergeneration):theadditionoframp-upandramp-335downreservesfromdispatchable(fast)generation.Thelevelsoftheseadditionalreserveshadtobe336estimatedforeachbuild-outlevelandseasonoftheyear.Inadditiontotheseruns,experimentswere337alsoperformedassumingtheidealizedsituationofhavingaccesstoperfectforecasts,thatis,day-ahead338andintermediate-termwindforecaststhatareequaltotheactualobservedvalues.Theseexperiments339providedasenseofthevalueofbetterforecasting.Thelatterexperimentsarereferredtoastheperfect340forecastcases,whereastherunswiththeoriginalforecastsarereferredtoastheimperfectforecast341cases.342
TableIII:Performancemetricsofthesimulated,unconstrainedPJMgrid,withimperfectforecastsand343noadditionalreserves,afteraddingincreasinglyhigherlevelsofoffshorewindpower.344
Build-outLevel
InstalledCapacity(GW)
Month-Year
GenerationfromOffshore
Wind(%)
UsedWind(%)
LikelihoodThereWillBeGenerationShortfallatSomeTimeDuringOne
Week(%)
AveragePeakGenerationShortfall(GW),WhenThereIs
AnyShortfall
1 7.3
Jan-10 4.3 94.8 38.1 0.6Apr-10 4.0 78.3 9.5 0.3Jul-10 2.2 92.1 81.0 2.3Oct-10 4.0 78.2 9.5 0.6
2 25.3 Jan-10 14.5 93.4 100.0 3.1

PapersubmittedtoRenewableEnergy 2016-03-10
13
Apr-10 15.1 87.7 100.0 3.8Jul-10 7.1 86.9 100.0 6.4Oct-10 15.8 90.0 100.0 2.3
3 35.8
Jan-10 20.8 93.4 100.0 5.2Apr-10 20.4 83.9 100.0 4.3Jul-10 10.3 85.6 100.0 7.7Oct-10 20.8 83.9 100.0 3.2
4 48.9
Jan-10 25.6 84.2 100.0 5.4Apr-10 24.2 74.0 100.0 4.4Jul-10 14.1 80.5 100.0 9.8Oct-10 24.1 72.1 100.0 3.9
5 69.7
Jan-10 30.0 68.7 100.0 7.4Apr-10 29.9 62.9 100.0 5.4Jul-10 16.7 68.1 100.0 12.5Oct-10 27.5 56.4 100.0 3.1
345
4.2 Unconstrainedgrid,withramp-upand-downreservesadded346
Figure7showsthelevelsof10-minuteramp-upanddownreserves(synchronized)thatwereaddedto347thesysteminordertoguaranteethatitwouldoperatewithoutgenerationshortfall.Theselevelswere348estimated(or“tuned”)throughaseriesofsimulationrunswheretheamountofrequiredreserveswas349varieduntiltheapproximateminimumamount,foreachmonthandeachbuild-outlevel,wasfound350suchthatnogenerationshortfallwasobservedinanyofthe21simulationsamplepaths.Thesereserves351areinadditiontotheusualPJMsynchronizedreserve(orspinningreserve),whichiscurrentlysetat1.3352GW(thesizeofthelargestgeneratoroperatinginthesystem).EachplotinFigure7depictsthe353additionalreservelevel(inGW)requiredinthatmonth,foreachoneofthefiveoffshorewindbuild-out354levels,indicatedbytheirrespectiveinstalledcapacities(inGW).Notethatbuild-outlevel“0”355correspondstothecasewithnooffshorewindpower,andthusthezerolevelofadditionalreserves356required.357
a) b)
0"
4"
8"
12"
16"
0" 10" 20" 30" 40" 50" 60" 70"
GW"
Build2out"level"(GW)"
Ramping"Reserves"2"Comparing"Forecasts"January"2010"
Imperfect"Perfect"
0"
4"
8"
12"
16"
0" 10" 20" 30" 40" 50" 60" 70"
GW"
Build2out"level"(GW)"
Ramping"Reserves"2"Comparing"Forecasts"April"2010"
Imperfect"Perfect"

PapersubmittedtoRenewableEnergy 2016-03-10
14
c) d)Figure7Rampingreservesneededforarangeofbuild-outs,comparingthecasesofimperfectand358perfectwindforecasts.FortheJulycase(c),therightaxisisthereferenceforgenerationshortfall359probability.360
TableIVshowsallperformancemetricsofthesimulated,unconstrainedgrid,withadditionalramp-up361anddownreserves,fortheimperfectforecastcase.Withtheexceptionofthepeaksummerloadperiod,362itispossibletomitigatetheuncertaintyintheimperfectwindforecasts,forallbuild-outlevels,withthe363additionofsynchronizedreservesprovidedbyfastgenerators.Asexpected,thehigherthebuild-out364level,thelargertherequiredreserves.ForJuly,theyamountedtoover15GW(>20%ofwindgeneration365capacity).366
Forthesummerpeakmonth,itwasnotpossibletofindaleveloframp-upanddownreservesthatcould367completelyeliminategenerationshortfallforbuild-outlevels4and5,giventheavailablefleetofgas368turbines.Theconjectureisthatthecombinationofaloadincreaseinthemid-daypeakhourswithan369unexpected,steepwindpowerdecreaseatthesametimecreatesasituationwheretheexistingfast370generatorsmightsimplynothaveenoughcapacityorbefastenoughtoavoidgenerationshortfall.This371isillustratedinFigure8,wherethesimulatedwindpowerunexpectedlydropsbyabout25GWwithin40372minutes(bottomplot),atatimewhentheloadisstillincreasing(between1and2pm).Thiscreatesa373generationshortfallforabout35minutes,withapeakpowershortageofabout2.5GW(topplot),after374theadditionalreservesof13GWhavealreadybeenexhausted.375
TableIV:Performancemetricsofthesimulated,unconstrainedPJMgridwithimperfectforecastsafter376addingincreasinglyhigherlevelsofoffshorewindpowerandspecificramp-upandramp-down377reserves.378
Build-outLevel
InstalledCapacity(GW)
Month-Year
RampingReserves(GW)
GenerationfromOffshore
Wind(%)
UsedWind(%)
LikelihoodThereWillBeGenerationShortfallatSomeTimeDuringOne
Week(%)
AveragePeakGenerationShortfall(GW),WhenThereIs
AnyShortfall
1 7.3
Jan-10 1.2 4.3 95.0 0.0 0Apr-10 0.5 3.9 77.2 0.0 0Jul-10 2 2.3 92.5 0.0 0Oct-10 0.5 4.0 77.2 0.0 0
2 25.3Jan-10 4 14.0 90.1 0.0 0Apr-10 5 13.5 78.6 0.0 0Jul-10 5 7.4 86.0 0.0 0
0"
4"
8"
12"
16"
0" 10" 20" 30" 40" 50" 60" 70"
GW"
Build2out"level"(GW)"
Ramping"Reserves"2"Comparing"Forecasts"October"2010"
Imperfect"Perfect"

PapersubmittedtoRenewableEnergy 2016-03-10
15
Oct-10 3 15.1 85.6 0.0 0
3 35.8
Jan-10 5 20.0 90.3 0.0 0Apr-10 6 16.1 67.3 0.0 0Jul-10 8 10.8 86.2 0.0 0Oct-10 3.5 18.4 73.9 0.0 0
4 48.9
Jan-10 5.5 24.6 81.4 0.0 0Apr-10 4 21.0 62.5 0.0 0Jul-10 13 14.7 82.1 23.8 1.6Oct-10 3.5 20.5 61.2 0.0 0
5 69.7
Jan-10 8 27.8 63.8 0.0 0Apr-10 5.5 23.4 49.0 0.0 0Jul-10 15 17.4 69.6 19.1 1.0Oct-10 5 21.2 43.3 0.0 0
379
Figure7cshowsontheright-handverticalaxistheincreasingprobabilitythattherewillbeageneration380shortfallinoneweekofoperationinthepeaksummermonth.Thesameplotalsoshowstheaverage381peakgenerationshortfall,whenthereisanyshortfall.Forbuild-outlevel3inJulyweobservedno382generationshortfall.Thereforeonecansaythatthemaximumbuild-outlevelofoffshorewindthatthe383currentPJMmarketcantake–withoutanygenerationshortfall–andwithadditionalsynchronized384rampingreservesofupto8GW,is3,whichcorrespondstoaninstalledcapacityof35.8GW.385
Ontheotherhand,iftheunitcommitmentplanninghadaccesstoperfectwindforecasts,itwouldbe386possibletohandleallbuild-outlevelsofwind,includinginthesummer,withjustnominalamountsof387additionalsynchronizedreserves,asshownintheplotsofFigure7.Intherealworldtherewillobviously388neverexistperfectwindforecasts.However,theseresultssuggestthatafuturecombinationofforecast389improvementswithadditionalsynchronizedreserves(andcorrespondinginvestmentsinthegrid)could390potentiallyallowthePJMsystemtooperatewithoutgenerationshortfall,forlevelsofinstalledoffshore391capacityofuptoabout70GW(whichwouldprovideforabout30%ofthedemandforelectricityinthe392winter,forexample).Theseresultshighlighttheimportanceofconsideringuncertaintywhenmanaging393energyfromwind.394

PapersubmittedtoRenewableEnergy 2016-03-10
16
395
Figure8:Totalsimulatedpower,actualload,andwindduringa35-minutegenerationshortfallevent396causedbyanunexpected,sharpdecreaseinactualwindthatwasnotpredictedbyeithertheday-397aheadforecast(DA-Predicted)ortheshort-termforecast(IT-Predicted).398
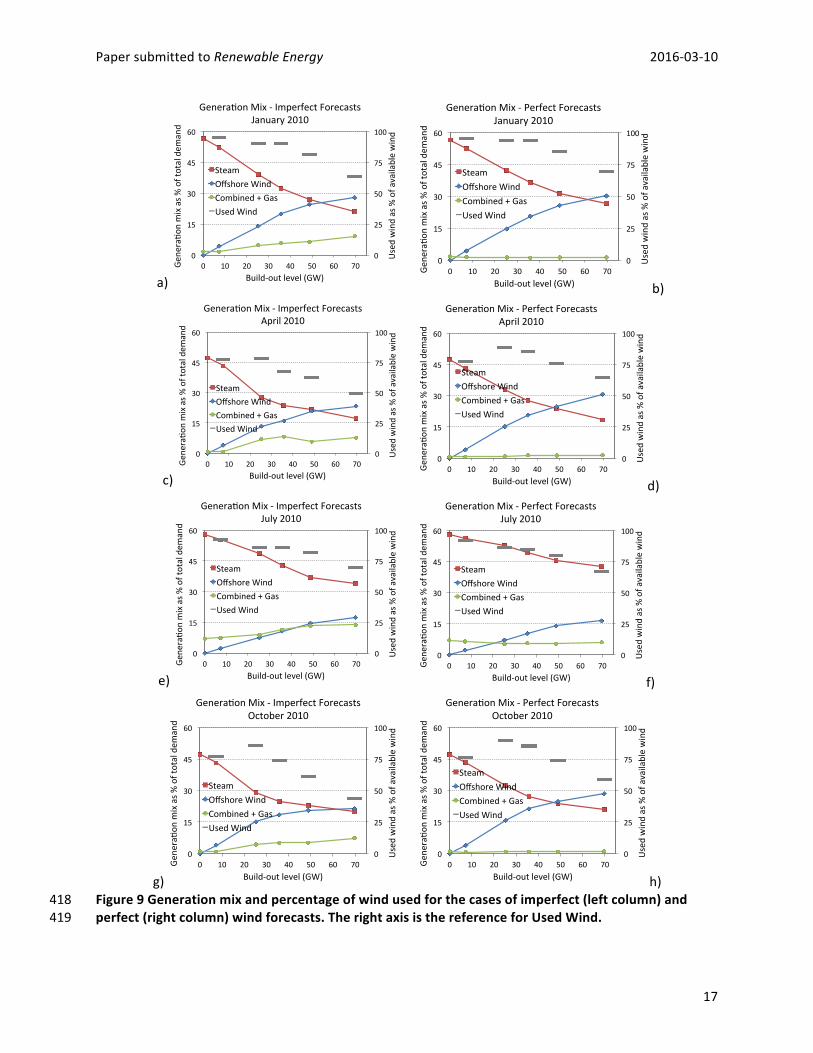
Figure9showsplotswiththegenerationmixontheleft-handverticalaxisandusedwindasa399percentageofavailablewindontheright-handverticalaxis.Inthegenerationmix,thepercentagesof400energyproducedbysteamgenerators,combined-cycle/gas-turbinesandoffshorewindfarmsonlyare401displayed,sincethesearetheformsofgenerationthataremostlyaffectedbytheintroductionof402offshorewind.Theplotsontheleftcolumndepicttheresultsforthecaseofimperfectforecasts,403whereastheonesontherightcolumndepicttheonesforperfectforecasts.404
Themaindifferencebetweentheimperfectandperfectforecastcasesistheusageofcombined-405cycle/gas-turbines.Intheimperfectcase,thisusageprogressivelyincreaseswiththewindbuild-out406level,asfast(gas)generatorsareemployedmoreastheadditionalreserveneededtoguaranteethe407generationshortfall-freeoperationofthesystem.Inthecaseofperfectforecasts,though,theusageof408combined-cycle/gasgenerationremainsessentiallyflatwiththewindbuild-out,sinceslow(steam)409generationcanbeusedtobalancethe(perfectlyforecasted)variabilityofwind.410
Itisalsonotedthatwindutilizationtendstodecreaseathigherpenetrationlevels.Aswindincreases,a411largernumberofdispatchablegeneratorsrunningattheirminimumoperationallevelsisneeded,in412ordertoguaranteethatthesystemwillbefreeofgenerationshortfallswhenthewindpowervaries.As413aresult,lessoftheavailablewindendsupbeingused.Also,forthesamelevelofwindandforthe414shouldermonths(thatis,thetimesoftheyearwhenthedifferencebetweenlowestandhighest415demandwithinadayissmaller),perfectwindforecaststendtoproducehigherwindusagethan416imperfectforecasts.417
0"
20"
40"
60"
80"
100"
7:00" 8:00" 9:00" 10:00" 11:00" 12:00" 13:00" 14:00" 15:00"
GW"
Time"
Total"Power,"Wind,"and"Load"during"Load"Shedding"Event"BuildEout"4"E"25"Jul"2010"
Actual"Total"Load"Simulated"Total"Power"Available"Wind"ITEPredicted"Wind"DAEPredicted"Wind"
PapersubmittedtoRenewableEnergy 2016-03-10
17
a) b)
c) d)
e) f)
g) h)Figure9Generationmixandpercentageofwindusedforthecasesofimperfect(leftcolumn)and418perfect(rightcolumn)windforecasts.TherightaxisisthereferenceforUsedWind.419
0"
25"
50"
75"
100"
0"
15"
30"
45"
60"
0" 10" 20" 30" 40" 50" 60" 70"
Used"wind"as"%"of"available"wind"
Gene
ra:o
n"mix"as"%
"of"total"dem
and"
Build@out"level"(GW)"
Genera:on"Mix"@"Imperfect"Forecasts""January"2010"
Steam"Offshore"Wind"Combined"+"Gas"Used"Wind"
0"
25"
50"
75"
100"
0"
15"
30"
45"
60"
0" 10" 20" 30" 40" 50" 60" 70"
Used"wind"as"%"of"available"wind"
Gen
era:
on"m
ix"as"%"of"total"dem
and"
Build@out"level"(GW)"
Genera:on"Mix"@"Perfect"Forecasts""January"2010"
Steam"
Offshore"Wind"
Combined"+"Gas"
Used"Wind"
0"
25"
50"
75"
100"
0"
15"
30"
45"
60"
0" 10" 20" 30" 40" 50" 60" 70"
Used"wind"as"%"of"available"wind"
Gen
era:
on"m
ix"as"%"of"total"dem
and"
Build@out"level"(GW)"
Genera:on"Mix"@"Imperfect"Forecasts""April"2010"
Steam"
Offshore"Wind"
Combined"+"Gas"
Used"Wind"
0"
25"
50"
75"
100"
0"
15"
30"
45"
60"
0" 10" 20" 30" 40" 50" 60" 70"
Used"wind"as"%"of"available"wind"
Gen
era:
on"m
ix"as"%"of"total"dem
and"
Build@out"level"(GW)"
Genera:on"Mix"@"Perfect"Forecasts""April"2010"
Steam"
Offshore"Wind"
Combined"+"Gas"
Used"Wind"
0"
25"
50"
75"
100"
0"
15"
30"
45"
60"
0" 10" 20" 30" 40" 50" 60" 70"
Used"wind"as"%"of"available"wind"
Gene
ra:o
n"mix"as"%
"of"total"dem
and"
Build@out"level"(GW)"
Genera:on"Mix"@"Imperfect"Forecasts""July"2010"
Steam"Offshore"Wind"Combined"+"Gas"Used"Wind"
0"
25"
50"
75"
100"
0"
15"
30"
45"
60"
0" 10" 20" 30" 40" 50" 60" 70"
Used"wind"as"%"of"available"wind"
Gen
era:
on"m
ix"as"%"of"total"dem
and"
Build@out"level"(GW)"
Genera:on"Mix"@"Perfect"Forecasts""July"2010"
Steam"
Offshore"Wind"
Combined"+"Gas"
Used"Wind"
0"
25"
50"
75"
100"
0"
15"
30"
45"
60"
0" 10" 20" 30" 40" 50" 60" 70"
Used"wind"as"%"of"available"wind"
Gene
ra:o
n"mix"as"%
"of"total"dem
and"
Build@out"level"(GW)"
Genera:on"Mix"@"Imperfect"Forecasts""October"2010"
Steam"Offshore"Wind"Combined"+"Gas"Used"Wind"
0"
25"
50"
75"
100"
0"
15"
30"
45"
60"
0" 10" 20" 30" 40" 50" 60" 70"
Used"wind"as"%"of"available"wind"
Gene
ra:o
n"mix"as"%
"of"total"dem
and"
Build@out"level"(GW)"
Genera:on"Mix"@"Perfect"Forecasts""October"2010"
Steam"Offshore"Wind"Combined"+"Gas"Used"Wind"

PapersubmittedtoRenewableEnergy 2016-03-10
18
4.3 Impactonsettlementpricesandemissions420
Atleasttwoadditionalquestionsarisefromthetrendsobservedinthegenerationmixasthelevelsof421windpowerinthesystemincrease:(1)whatistheoverallimpactonthenetworkaveragesettlement422price(basedonLMPs),and(2)whatistheimpactontheemissionofairpollutants?423
Figure10showsthatthesettlementpricepaidtogeneratorsbyPJM(averagedoverallgenerators)424decreasesasthelevelofoffshorewindpowerinthesystemincreases.Notealsothatthepricesfor425build-outlevels4and5inthesummerseason(July)havebeenaffectedbythepenaltiesimposedforthe426observedgenerationshortfall.Bothintheunitcommitmentandintheeconomicdispatchmodels,large427penaltiesareusedtocurbdemandshortage,ratherthanhardconstraints.Consequently,whenthe428solutionofthoseoptimizationproblemsdoesinvolvegenerationshortfall,themarginalvalueof429additionalavailablegeneration–theLMPs–areartificiallyinflatedbytheactivepenalties.430
ItisimportanttorecognizethatthereductionintheLMPisnotnecessarilyproportionaltototal431consumerorwholesaleelectricitysavings—forexample,itdoesnotincludecapitalcostofeither432existinggenerationornewwindgeneration,whichwouldbereflectedinthecapacitymarket.To433understandconsumersavings,itisnecessarytounderstandtherelativeeffectsofthecostsavings434showninFigure10againstthecostofenergyfromnewwindgenerationandtransmission.To435understandthecostsorsavingstosociety,itisnecessarytounderstandthefactorsaswellasthesocial436costsandsavingsofexternalitiessuchashealthdamagesduetopollutionreductions,likethose437itemizedbelow.Thesetotaleconomiccalculationsarebeyondthescopeofthepresentstudy.438
439
Figure10Networkaveragesettlementpriceforthecasesofimperfectwindforecastsandadded440ramp-upand-downreservesbymonth.441
Figure11showsthereductioninemissionsofcarbondioxide(CO2),sulfurdioxide(SO2)andnitrogen442oxides(NOx),threeofthemainairpollutantsreleasedintheburningoffossilfuelsforthegenerationof443electricity.Asexpected,thehigherthelevelsofwindpowerinthesystem,thegreaterthereductionin444
0"
25"
50"
75"
0" 10" 20" 30" 40" 50" 60" 70"
$/MWhr"
Build5out"level"(GW)"
Network"Average"SeDlement"Price"(LMP)"
July"January"April"October"

PapersubmittedtoRenewableEnergy 2016-03-10
19
theemissionofthesethreepollutants.Furthermore,perfectforecastsyieldhigherreductionsin445emissionsthanimperfectforecasts.446
a) b) c)
d) e) f)
g) h) i)
j) k) l)Figure11Emissionreductionsofairpollutants(CO2,SO2,andNOx)forthecasesofimperfectand447perfectwindforecasts.448
TableVsummarizestheestimatesinthereductionofsettlementpricesandemissionsresultingfromthe449introductionoftheseveralbuild-outlevelsofoffshorewindpower,obtainedwithimperfectwind450forecasts.451
0"
20"
40"
60"
1" 2" 3" 4" 5"
%"
Build/out"level"
CO2"Emission"Reduc<ons""Comparing"Forecasts"/"January""2010"
Perfect"Imperfect"
0"
20"
40"
60"
1" 2" 3" 4" 5"
%"
Build/out"level"
SO2"Emission"Reduc<ons"Comparing"Forecasts"/"January""2010"
Perfect"Imperfect"
0"
20"
40"
60"
1" 2" 3" 4" 5"
%"
Build/out"level"
NOx"Emission"Reduc=ons""Comparing"Forecasts"/"January"2010"
Perfect"Imperfect"
0"
20"
40"
60"
1" 2" 3" 4" 5"
%"
Build/out"level"
CO2"Emission"Reduc<ons""Comparing"Forecasts"/"April"2010"
Perfect"Imperfect"
0"
20"
40"
60"
1" 2" 3" 4" 5"
%"
Build/out"level"
SO2"Emission"Reduc<ons"Comparing"Forecasts"/"April"2010"
Perfect"Imperfect"
0"
20"
40"
60"
1" 2" 3" 4" 5"
%"
Build/out"level"
NOx"Emission"Reduc=ons""Comparing"Forecasts"/"April"2010"
Perfect"Imperfect"
0"
20"
40"
60"
1" 2" 3" 4" 5"
%"
Build/out"level"
CO2"Emission"Reduc<ons""Comparing"Forecasts"/"July""2010"
Perfect"Imperfect"
0"
20"
40"
60"
1" 2" 3" 4" 5"
%"
Build/out"level"
SO2"Emission"Reduc<ons"Comparing"Forecasts"/"July""2010"
Perfect"Imperfect"
0"
20"
40"
60"
1" 2" 3" 4" 5"
%"
Build/out"level"
NOx"Emission"Reduc=ons""Comparing"Forecasts"/"July"2010"
Perfect"Imperfect"
0"
20"
40"
60"
1" 2" 3" 4" 5"
%"
Build/out"level"
CO2"Emission"Reduc<ons""Comparing"Forecasts"/"October"2010"
Perfect"Imperfect"
0"
20"
40"
60"
1" 2" 3" 4" 5"
%"
Build/out"level"
SO2"Emission"Reduc<ons"Comparing"Forecasts"/"October"2010"
Perfect"Imperfect"
0"
20"
40"
60"
1" 2" 3" 4" 5"
%"
Build/out"level"
NOx"Emission"Reduc=ons""Comparing"Forecasts"/"October"2010"
Perfect"Imperfect"

PapersubmittedtoRenewableEnergy 2016-03-10
20
TableV:Summaryofreductionsinsettlementpricesandemissionsforthecaseofimperfectwind452forecasts453
Build-outLevel
InstalledCapacity(GW)
Month-Year
GenerationfromOffshore
Wind(%)
NetworkAverageSettlementPriceReduction(%)
CO2EmissionReduction(%)
SO2EmissionReduction(%)
NOxEmissionReduction(%)
1 7.3
Jan-10 4 9 7 9 5Apr-10 4 2 8 7 7Jul-10 2 5 4 5 5Oct-10 4 1 8 11 8
2 25.3
Jan-10 14 13 26 29 21Apr-10 14 12 31 28 25Jul-10 8 10 13 15 12Oct-10 15 10 33 35 31
3 35.8
Jan-10 20 20 36 37 28Apr-10 16 24 38 37 30Jul-10 11 -6 19 21 13Oct-10 18 24 40 43 37
4 48.9
Jan-10 25 28 45 46 36Apr-10 21 26 46 48 42Jul-10 15 -20 26 26 15Oct-10 21 31 45 49 42
5 69.7
Jan-10 28 41 52 54 40Apr-10 23 39 52 53 46Jul-10 18 -3 30 31 19Oct-10 21 41 48 49 42
454
ItisnoteworthythattheaveragesettlementpricesforthemonthofJuly,forbuild-outlevels3and455aboveactuallyincreased,ratherthandecrease.Thisisprobablydue,atleastpartially,tothesignificantly456higherlevelsofusageofthemoreexpensivefastgenerationasreserves.Theadditionofgeneration457shortfallpenaltiesinbuild-outlevels4and5mayalsohavecontributedtofurtherinflatethesettlement458prices.459
Windbuild-outlevel3,correspondingtoaninstalledoffshorecapacityof35.8GW,isthehighest460capacityatwhichitisestimatedthecurrentPJMmarketcanoperatewithoutanygenerationshortfall,461withadditionalrampingreservesandanunconstrainedtransmissiongrid.Forthislevel,dependingon462theseasonoftheyear,thefollowingestimateswereobtained:463
• Energyfromwindwouldsatisfybetween11and20%ofthedemandforelectricity;464• Settlementpricescouldbereducedbyupto24%(thoughinthepeaksummerseasontheymay465
actuallyincreasebyupto6%);466• CO2emissionsarereducedbetween19and40%;467• SO2emissionsarereducedbetween21and43%;468• NOxemissionsarereducedbetween13and37%.469
4.4 Constrainedgrid,noramp-upor-downreservesadded470
TherewasalsointerestinevaluatingthecapacityofthePJMsystemtointegratethevariousbuild-out471levelsofoffshorewindpowerwiththetransmissiongridconstrainedbyitscurrentthermalcapacities.472

PapersubmittedtoRenewableEnergy 2016-03-10
21
Twoparticularscenariosofconnectionbetweentheoffshorewindfarmsandthesixonshorepointsof473interconnection(POI)weretested:474
• HVDCscenario-Theexistenceofahigh-voltageDC(HVDC)backbonelineunderthesea,along475thecontinentalshelfoftheMid-Atlanticcoast,wasenvisioned.Thefarmswouldbeconnected476tothisline,whichinturnwouldbeconnectedtothesixPOIs.Becausenewmulti-terminalHVDC477technologiesarefullyswitchable,thisscenarioimpliesthateachandeverywindfarmwouldbe478connectedtoeachandeveryPOI,andenergywouldthusbeinjectedinthePOIwhereneeded.479
• ACradialscenario-EachfarmwasenvisionedbeingconnectedbyanACradiallinetoonePOI480only,thenearestonegeographically.481
TheHVDCbackboneline,theACradiallinesandthePOIsthemselveswereassumedtohavethermal482capacitiessufficientlylargethattheydidnotconstraintransmission.483
TableVIshowsstatisticsfortherunswiththeconstrainedgridandtheHVDCbackboneconnection.484TheycanbedirectlycomparedtothosedisplayedinTableIIIfortheunconstrainedcase.Forbuild-out485level1,theamountsofwindpowerusedintheconstrainedgridcase,asapercentageofthetotal486amountavailableineachseason,arecomparabletothoseintheunconstrainedcase;andsoarethe487percentagesofdemandthataresatisfiedbyelectricitygeneratedfromoffshorewind.Thismeansthat488theinjectionoftheserelativelymodestamountsofoffshorewindpower(between2.4and4.0%oftotal489demand,dependingontheseason)donotexceedthetransmissiongridcapacities.Thegeneration490shortfallobservedatthislevelcanbeeasilytakencareofbytheadditionofsomesynchronizedramp-up491anddownreserves;theaveragepeakgenerationshortfall,whenthereisanyshortfall,depictedinTable492VI,offersgoodinitialestimatesofwhatthesereservesshouldbe.493
Movingtobuild-outlevels2andbeyond,offshorewindpowerbecomesseverelycurtailedbythe494currentgridcapacityconstraints,asindicatedbythepercentageofusedwind,whichdropstobetween49537.8and60.7%,asopposedtothe86.9to93.4%rangeobservedintheunconstrainedcase.Thisissue496canonlyberesolvedbyanupgradeintheonshoretransmissionlines,particularlyinthecoastalareas.497Therefore,installingoffshorewindcapacityof25.3GW(level2)ormore,withoutupgradingthePJM498transmissiongrid,wouldnotallowintegrationorefficientuseoftheselargeoffshorewindbuild-out499levels.500
Notealsothat,particularlyforbuild-outlevels2and3,thelikelihoodthattherewillbegeneration501shortfallissmallerthanwhatwasobservedfortheunconstrainedgridcase(TableIII).Thisisduetothe502factthatlessoffshorewindpowerisbeingusedintheconstrainedcase,asaresultofthewindpower503curtailmentinducedbythegridcapacityconstraints.504
Finally,Figure12showsplotswiththepercentageofusedwindobtainedusingtheHVDCbackboneand505theACradialconnectionstolinktheoffshorewindfarmswiththeonshorePJMgrid.ACradial506connectionswillcausesignificantlymorespillingofoffshorewindpower(about20%moreforbuild-out507level1)thananHVDCbackboneconnection.508
509

PapersubmittedtoRenewableEnergy 2016-03-10
22
TableVI:SameasinTableIIIbutfortheconstrainedPJMgridwithanHVDCbackboneconnection.510
Build-outLevel
InstalledCapacity(GW)
Month-Year
GenerationfromOffshore
Wind(%)
UsedWind(%)
LikelihoodThereWillBeGenerationShortfallatSomeTimeDuringOne
Week(%)
AveragePeakGenerationShortfall(GW),WhenThereIs
AnyShortfall
1 7.3
Jan-10 4.1 91.3 47.6 0.7Apr-10 4.0 79.1 9.5 0.4Jul-10 2.4 97.1 52.4 2.2Oct-10 4.2 81.2 0.0 0
2 25.3
Jan-10 6.8 43.7 47.6 1.0Apr-10 7.4 43.2 28.6 1.3Jul-10 5.0 60.7 100.0 3.3Oct-10 6.7 37.8 33.3 0.6
3 35.8
Jan-10 7.2 32.5 57.1 0.8Apr-10 8.0 32.6 38.1 1.0Jul-10 5.7 46.9 100.0 3.9Oct-10 7.2 28.7 52.4 0.9
511
a) b)
c) d)
Figure12PercentagesofusedwindwithHVDC-backboneversusAC-radialoffshoreconnections.512
0"
20"
40"
60"
80"
100"
0" 10" 20" 30" 40"
Used"wind"as"%"of"available"wind"
Build9out"level"(GW)"
Percent"of"Used"Wind"9"Comparing"Offshore"ConnecIons"9"January"2010"
HVDC"Backbone"
AC"Radial"
0"
20"
40"
60"
80"
100"
0" 10" 20" 30" 40"
Used"wind"as"%"of"available"wind"
Build9out"level"(GW)"
Percent"of"Used"Wind"9"Comparing"Offshore"ConnecIons"9"April"2010"
HVDC"Backbone"
AC"Radial"
0"
20"
40"
60"
80"
100"
0" 10" 20" 30" 40"
Used"wind"as"%"of"available"wind"
Build9out"level"(GW)"
Percent"of"Used"Wind"9"Comparing"Offshore"ConnecIons"9"July"2010"
HVDC"Backbone"
AC"Radial"
0"
20"
40"
60"
80"
100"
0" 10" 20" 30" 40"
Used"wind"as"%"of"available"wind"
Build9out"level"(GW)"
Percent"of"Used"Wind"9"Comparing"Offshore"ConnecIons"9"October"2010"
HVDC"Backbone"
AC"Radial"

PapersubmittedtoRenewableEnergy 2016-03-10
23
5 Conclusions513
ThispapershowedthatincreasingamountsofoffshorewindgenerationfromtheMid-Atlanticsection514oftheU.S.canbeintegratedintothePJMmarket,uptoacertainlevel,providedthatadditional515synchronizedreservesbesecuredandthatthetransmissionlinesbeupgraded(orashereinpresented,516thatthegridbeunconstrained).Furthermore,itisalsoshownthatimprovementsinthequalityofthe517windpowerforecastsusedforbothday-aheadandintermediate-termunitcommitmentplanninghave518thepotentialtoenabletheintegrationoflargeramountsofoffshorewindpower,withlessamountsof519requiredadditionalreserves.520
Constrainedbythecurrentcapacitiesoftheonshoretransmissiongrid,inthePJMmarket,itwasfound521that:522
1. Uptoabout7.3GWofinstalledoffshorewindcapacity(build-outlevel1)couldbeintegrated,523withrequiredadditionalsynchronizedramp-upanddownreservesbetween1and2GWinthe524peaksummerperiod.525
2. Windpowercurtailmentwouldrangefrom3to21%,onaverageoveraseason,dependingon526theseasonoftheyear.527
3. UsingACradialconnectionstolinktheoffshorefarmstotheonshoregrid,insteadofanHVDC528backboneconnection,wouldcauseanadditionalwindpowercurtailmentontheorderof20%.529
Assumingthattheonshoretransmissiongridwereappropriatelyupgradedbyincreasingthecapacities530ofsomelines,inthePJMmarketitwasfoundthat:531
1. Uptoabout35.8GWofinstalledoffshorewindcapacity(build-outlevel3)couldbeintegrated,532withrequiredadditionalreservesofabout8GWinthepeaksummerperiod(between3and6533GWintheotherperiods).Thesereservesrangefrom10toover20percentoftheinstalledwind534generationcapacityatbuild-outlevel3.535
2. Inthisscenario,offshorewindpowerwouldsatisfyabout11%oftheloadsinthesummerand536anaverageof18%intheotherseasonsoftheyear.537
3. Windcurtailmentwouldrangefrom10to33%,onaverageoveraperiod,dependingonthe538periodoftheyear.539
Intheidealizedcaseofhavingaccesstoperfectwindpowerforecasts(thatis,forecastsexactlyequalto540theobservedwindpower),thesystemwouldbeabletohandleupto69.7GWofinstalledoffshorewind541capacity(satisfying16%ofdemandinthesummer,andanaverageof30%intheotherseasons).It542shouldbealsonotedthatwindcurtailmentmightbereducedinthefuturethroughtheadditionofsolar543powerintothegenerationmixintheappropriateamount(Andresenetat.2014).544
Finally,evenwiththeadditionofsignificantamountsofsynchronizedramp-upanddownreserves,it545wasshownthatintegratingincreasingamountsofoffshorewindpowerwill,inmostcases,progressively546lowerthenetwork-averagedsettlementpriceofoperatingthePJMmarket,aswellasconsistently547decreasetheemissionsofthethreemostimportantairpollutantsassociatedwiththeburningoffossil548

PapersubmittedtoRenewableEnergy 2016-03-10
24
fuels.Morespecifically,intheaforementionedcaseofintegratingoffshorewindpoweratbuild-out549level3,withadditionalreservesofupto8GWandanunconstrainedonshoretransmissiongrid:550
• Settlementpricescouldbereducedbyupto24%;551• CO2emissions,between19and40%;552• SO2emissions,between21and43%;and553• NOxemissions,between13and37%.554
TheauthorsbelievethatSMART-ISOrepresents,asofthiswriting,anaccuratereproductionofPJM’s555dispatchplanningprocess,withcarefulattentiongiventothemodelingofthevariabilityanduncertainty556ofwind.Ofcourse,anymodel,orsetofsimulations,requiresassumptionsandapproximations.The557mostsignificantassumption,intheauthors’view,isthefocusonusingexistingplanningandforecasting558processes,aswellasbothexistinggenerationtechnologyandthecurrentfleetofgenerators.Thework559describedinthispaperoffersagoodplatformtoundertakestudiesthatcapturetheeffectsofchanges560tothisplanningprocessandofimprovedforecasting,inadditiontoinvestmentsinexistingandnew561technologies.562
6 Bibliography563
Andresen,G.B.,R.A.Rodriguez,S.Becker,andM.Greiner,2014:Thepotentialforarbitrageofwindand564solarsurpluspowerinDenmark.Energy,76,pp.49-58.565
Archer,C.,H.Simão,W.Kempton,W.Powell,andM.Dvorak,2016:Thechallengeofintegrating566offshorewindpowerintheU.S.electricgrid.PartI:Windforecasterror.SubmittedtoRenewable567Energy.568
Birge,J.R.,andF.Louveaux,2011:IntroductiontoStochasticProgramming(2nded.).Springer,New569York,485pp.570
Hedman,K.W.,R.P.O'Neill,E.B.Fischer,andS.S.Oren,2011:Smartflexiblejust-in-timetransmission571andflowgatebidding.IEEETransactionsonPowerSystems,26(1),pp.93-102.572
MonitoringAnalytics,2011:2010StateoftheMarketReportforPJM.Availableat:573http://www.monitoringanalytics.com/reports/PJM_State_of_the_Market/2010.shtml,retrievedJuly9,5742014.575
MonitoringAnalytics,2012:2011StateoftheMarketReportforPJM.Availableat:576http://www.monitoringanalytics.com/reports/PJM_State_of_the_Market/2011.shtml,retrievedJuly9,5772014578
MonitorAnalytics,2013:2012StateoftheMarketReportforPJM.Availableat579http://www.monitoringanalytics.com/reports/PJM_State_of_the_Market/2012.shtml,retrievedJuly9,5802014.581

PapersubmittedtoRenewableEnergy 2016-03-10
25
MonitorAnalytics,2014:2013StateoftheMarketReportforPJM.Availableat582http://www.monitoringanalytics.com/reports/PJM_State_of_the_Market/2013.shtml,retrievedJuly7,5832014.584
Overbye,T.J.,X.Cheng,&Y.Sun,2004:AcomparisonoftheACandDCpowerflowmodelsforLMP585calculations.Proceedingsofthe37thHawaiiInternationalConferenceonSystemsSciences.BigIsland,HI,586USA,IEEEComputerSocietyPress.587
PJMInterconnection,2014:PJM101-TheBasics.Availableat588http://pjm.com/Globals/Training/Courses/ol-pjm-101.aspx,retrievedJuly8,2014.589
PJMInterconnection,2014:WhoWeAre.Availableathttp://www.pjm.com/about-pjm/who-we-590are.aspx,RetrievedJuly7,2014.591
Ryan,S.,R.J.-B.Wets,D.L.Woodruff,C.Silva-Monroy,andJ.Watson,2013:Towardscalable,parallel592progressivehedgingforstochasticunitcommitment.PowerandEnergySocietyGeneralMeeting(PES),5931-5.594
Stott,B.,J.Jardim,andO.Alsac,2009:DCpowerflowrevisited.IEEETransactionsonPowerSystems,59524(3),1290-1300.596
Takriti,S.,J.Birge,andE.Long,1996:Astochasticmodelfortheunitcommitmentmodel.IEEE597TransactionsonPowerSystems,11(3),1497-1508.598
599