THE CASSINI ULTRAVIOLET IMAGING …lasp.colorado.edu/~horanyi/graduate_seminar/UV_Imaging.pdf ·...
63
THE CASSINI ULTRAVIOLET IMAGING SPECTROGRAPH INVESTIGATION LARRY W. ESPOSITO 1,* , CHARLES A. BARTH 1 , JOSHUA E. COLWELL 1 , GEORGE M. LAWRENCE 1 , WILLIAM E. McCLINTOCK 1 , A. IAN F. STEWART 1 , H. UWE KELLER 2 , AXEL KORTH 2 , HANS LAUCHE 2 , MICHEL C. FESTOU 3 , ARTHUR L. LANE 4 , CANDICE J. HANSEN 4 , JUSTIN N. MAKI 4 , ROBERT A. WEST 4 , HERBERT JAHN 5 , RALF REULKE 5 , KERSTIN WARLICH 5 , DONALD E. SHEMANSKY 6 and YUK L. YUNG 7 1 University of Colorado, Laboratory for Atmospheric and Space Physics, 1234 Innovation Drive, Boulder, CO 80303, U.S.A. 2 Max-Planck-Institut f¨ ur Aeronomie, Max-Planck-Strasse 2, 37191 Katlenburg-Lindau, Germany 3 Observatoire Midi-Pyr´ en´ ees, 14 avenue E. Belin, F31400 Toulouse, France 4 Jet Propulsion Laboratory, 4800 Oak Grove Drive, Pasadena, CA 91109, U.S.A. 5 Deutsches Zentrum f¨ ur Luft und Raumfahrt, Institut f ¨ ur Weltraumsensorik und Planetenerkundung, Rutherford Strasse 2, 12489 Berlin, Germany 6 University of Southern California, Department of Aerospace Engineering, 854 W. 36th Place, Los Angeles, CA 90089, U.S.A. 7 California Institute of Technology, Division of Geological and Planetary Sciences, MS 150-21, Pasadena, CA 91125, U.S.A. ( * Author for correspondence: E-mail: [email protected]) (Received 8 July 1999; Accepted in final form 18 October 2000) Abstract. The Cassini Ultraviolet Imaging Spectrograph (UVIS) is part of the remote sensing payload of the Cassini orbiter spacecraft. UVIS has two spectrographic channels that provide images and spectra covering the ranges from 56 to 118 nm and 110 to 190 nm. A third optical path with a solar blind CsI photocathode is used for high signal-to-noise-ratio stellar occultations by rings and atmospheres. A separate Hydrogen Deuterium Absorption Cell measures the relative abundance of deuterium and hydrogen from their Lyman-α emission. The UVIS science objectives include investigation of the chemistry, aerosols, clouds, and energy balance of the Titan and Saturn atmospheres; neutrals in the Saturn magnetosphere; the deuterium-to-hydrogen (D/H) ratio for Titan and Saturn; icy satellite surface properties; and the structure and evolution of Saturn’s rings. Keywords: Cassini, rings, Saturn, spectroscopy on Titan and on Saturn Nomenclature CASPER Cassini Sequence Planner CDS Command and Data Handling Subsystem CEM Channel Electron Multiplier CIRS Composite Infrared Spectrometer CODACON Coded Anode Array Converter (see Lawrence and McClintock, 1996) D/H Deuterium/hydrogen (ratio) DISR Descent Imager/Spectral Radiometer EUV Extreme ultraviolet EUVE Extreme Ultraviolet Explorer FOV Field of view Space Science Reviews 115: 299–361, 2004. C 2004 Kluwer Academic Publishers. Printed in the Netherlands.
Transcript of THE CASSINI ULTRAVIOLET IMAGING …lasp.colorado.edu/~horanyi/graduate_seminar/UV_Imaging.pdf ·...

THE CASSINI ULTRAVIOLET IMAGING SPECTROGRAPHINVESTIGATION
LARRY W. ESPOSITO1,!, CHARLES A. BARTH1, JOSHUA E. COLWELL1, GEORGEM. LAWRENCE1, WILLIAM E. McCLINTOCK1, A. IAN F. STEWART1, H. UWE
KELLER2, AXEL KORTH2, HANS LAUCHE2, MICHEL C. FESTOU3, ARTHUR L.LANE4, CANDICE J. HANSEN4, JUSTIN N. MAKI4, ROBERT A. WEST4, HERBERT
JAHN5, RALF REULKE5, KERSTIN WARLICH5, DONALD E. SHEMANSKY6
and YUK L. YUNG7
1University of Colorado, Laboratory for Atmospheric and Space Physics, 1234 Innovation Drive,Boulder, CO 80303, U.S.A.
2Max-Planck-Institut fur Aeronomie, Max-Planck-Strasse 2, 37191 Katlenburg-Lindau, Germany3Observatoire Midi-Pyrenees, 14 avenue E. Belin, F31400 Toulouse, France
4Jet Propulsion Laboratory, 4800 Oak Grove Drive, Pasadena, CA 91109, U.S.A.5Deutsches Zentrum fur Luft und Raumfahrt, Institut fur Weltraumsensorik und Planetenerkundung,
Rutherford Strasse 2, 12489 Berlin, Germany6University of Southern California, Department of Aerospace Engineering, 854 W. 36th Place,
Los Angeles, CA 90089, U.S.A.7California Institute of Technology, Division of Geological and Planetary Sciences, MS 150-21,
Pasadena, CA 91125, U.S.A.(!Author for correspondence: E-mail: [email protected])
(Received 8 July 1999; Accepted in final form 18 October 2000)
Abstract. The Cassini Ultraviolet Imaging Spectrograph (UVIS) is part of the remote sensing payloadof the Cassini orbiter spacecraft. UVIS has two spectrographic channels that provide images andspectra covering the ranges from 56 to 118 nm and 110 to 190 nm. A third optical path with a solar blindCsI photocathode is used for high signal-to-noise-ratio stellar occultations by rings and atmospheres.A separate Hydrogen Deuterium Absorption Cell measures the relative abundance of deuterium andhydrogen from their Lyman-! emission. The UVIS science objectives include investigation of thechemistry, aerosols, clouds, and energy balance of the Titan and Saturn atmospheres; neutrals inthe Saturn magnetosphere; the deuterium-to-hydrogen (D/H) ratio for Titan and Saturn; icy satellitesurface properties; and the structure and evolution of Saturn’s rings.
Keywords: Cassini, rings, Saturn, spectroscopy on Titan and on Saturn
Nomenclature
CASPER Cassini Sequence Planner
CDS Command and Data Handling Subsystem
CEM Channel Electron Multiplier
CIRS Composite Infrared Spectrometer
CODACON Coded Anode Array Converter (see Lawrence and McClintock, 1996)
D/H Deuterium/hydrogen (ratio)
DISR Descent Imager/Spectral Radiometer
EUV Extreme ultraviolet
EUVE Extreme Ultraviolet Explorer
FOV Field of view
Space Science Reviews 115: 299–361, 2004.C" 2004 Kluwer Academic Publishers. Printed in the Netherlands.

300 L. W. ESPOSITO ET AL.
FUV Far ultraviolet
HDAC Hydrogen-Deuterium Absorption Cell
HSP High Speed Photometer
HST Hubble Space Telescope
HUT Hopkins Ultraviolet Telescope
HV High voltage
HVPS High Voltage Power Supply
IR Infrared
IRIS Infrared Interferometer Spectrometer
ISM Interstellar medium
ISO Infrared Science Observatory
ISS Imaging Science Subsystem
IUE International Ultraviolet Explorer
LISM Local interstellar medium
MAPS Magnetosphere and plasma science
MPAe Max-Planck-Institut fur Aeronomie
NIST National Institute for Standards and Technology
PAD Pulse Amplifier Discriminator
PPS Voyager Photo-Polarimeter Subsystem
RTG Radioisotope Thermoelectric Generator
RSP Remote Sensing Platform
SIRTF Space Infrared Telescope Facility
SMOW Standard mean ocean water
SOHO Solar and Heliospheric Observatory
SSR Solid state recorders
STIS Space Telescope Imaging Spectrometer
UV Ultraviolet
UVIS Ultraviolet Imaging Spectrograph
UVS Voyager or Galileo Ultraviolet Spectrometer
VIMS Visual and Infrared Mapping Spectrometer
WFPC2 Wide Field and Planetary Camera 2
1. Introduction
As part of the Cassini orbiter remote sensing payload, the Ultraviolet Imaging Spec-trograph (UVIS) is coaligned with the cameras (ISS) and the infrared spectrome-ters (CIRS and VIMS; see their chapters in this volume). The spectrograph designdraws on the University of Colorado experience of building UV spectrometers forthe Mariner, Pioneer, and Galileo missions and extends the previous capabilitiesby using two-dimensional CODACON detectors and adding separate channels forhigh speed photometry and for measuring the deuterium-to-hydrogen ratio witha Hydrogen Deuterium Absorption Cell. The spectrographic channels cover thewavelength range from 56 to 190 nm. A special pickoff mirror allows solar oc-cultation observations in the extreme UV. All parts of the experiment are housedin a rectangular case that is rigidly attached to the spacecraft’s Remote Sensing
CASSINI ULTRAVIOLET IMAGING SPECTROGRAPH 301
Platform (RSP). The instrument has its own microprocessor for storing andexecuting commands, and a limited memory to buffer and store observationaldata. Sequences of commands in the instrument memory are initiated by ‘trig-ger’ commands from the spacecraft’s Command and Data Handling Subsystem(CDS). The UVIS microprocessor compresses, formats, and packetizes data forpickup and storage in the spacecraft’s solid-state recorders (SSR) before eventualtelemetry to Earth.
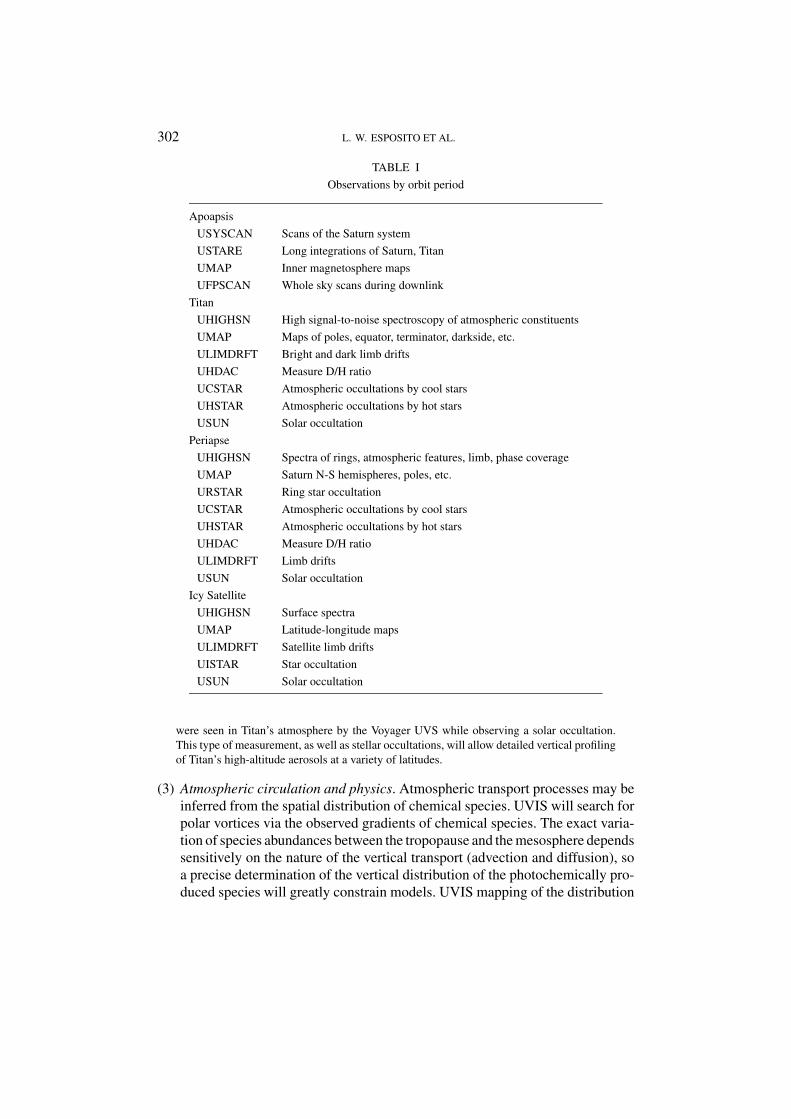
1.1. UVIS OBSERVATIONS
The Cassini orbital tour of Saturn consists of more than 70 orbits of Saturn and 44close passes to Titan (see chapter by Wolf in Vol. 1). Each orbit of Saturn contains anumber of phases: apoapsis, Titan flyby, Saturn periapse, and possible icy satelliteflybys. Table I shows the planned UVIS observations in each of these phases.Detailed descriptions of each observation can be found in the internal document,UVIS Observation Description Handbook (ODH), latest revision 6/99, availablefrom the Principal Investigator.
1.2. UVIS ANTICIPATED RESULTS
We include in this introduction a brief summary of anticipated results. More detailscan be found in the body of our chapter.
1.2.1. Titan(1) Atmospheric abundances. UVIS will determine the altitudinal and latitudinal
distribution and mixing ratios of CH4, C2H6, and C2H2 via the detection ofwell-defined absorption features. Vertical profiles of these molecules will bedetermined from limb observations and solar and stellar occultations. Solarand stellar occultations will yield measurements of H, and H2 as well as N,N2, C2H4, C4H2, Ar, CO, and C2N2. The deuterium/hydrogen ratio will bedetermined. It may be possible to differentiate argon from nitrogen with UVISin its high spectral resolution mode.
(2) Atmospheric chemistry and distribution of species; aerosols. Horizontal andvertical distribution of active species will be detected. The photochemistry of theatmosphere of Titan displays a rich interaction between hydrocarbons, oxygen,and nitrogen species. The overall chemical composition can be understoodin terms of a small number of chemical cycles that generate more complexcompounds from the simple parent molecules (N2, CH4, and H2). UVIS willmake a systematic survey of all the hydrocarbon species from which sourcesand sinks may be deduced.
The UVIS instrument will map the global distribution of UV-absorbing aerosols in Titan’satmosphere in the spectral range 160 to 190 nm. Vertical profiles of high-altitude aerosols
302 L. W. ESPOSITO ET AL.
TABLE IObservations by orbit period
ApoapsisUSYSCAN Scans of the Saturn systemUSTARE Long integrations of Saturn, TitanUMAP Inner magnetosphere mapsUFPSCAN Whole sky scans during downlink
TitanUHIGHSN High signal-to-noise spectroscopy of atmospheric constituentsUMAP Maps of poles, equator, terminator, darkside, etc.ULIMDRFT Bright and dark limb driftsUHDAC Measure D/H ratioUCSTAR Atmospheric occultations by cool starsUHSTAR Atmospheric occultations by hot starsUSUN Solar occultation
PeriapseUHIGHSN Spectra of rings, atmospheric features, limb, phase coverageUMAP Saturn N-S hemispheres, poles, etc.URSTAR Ring star occultationUCSTAR Atmospheric occultations by cool starsUHSTAR Atmospheric occultations by hot starsUHDAC Measure D/H ratioULIMDRFT Limb driftsUSUN Solar occultation
Icy SatelliteUHIGHSN Surface spectraUMAP Latitude-longitude mapsULIMDRFT Satellite limb driftsUISTAR Star occultationUSUN Solar occultation
were seen in Titan’s atmosphere by the Voyager UVS while observing a solar occultation.This type of measurement, as well as stellar occultations, will allow detailed vertical profilingof Titan’s high-altitude aerosols at a variety of latitudes.
(3) Atmospheric circulation and physics. Atmospheric transport processes may beinferred from the spatial distribution of chemical species. UVIS will search forpolar vortices via the observed gradients of chemical species. The exact varia-tion of species abundances between the tropopause and the mesosphere dependssensitively on the nature of the vertical transport (advection and diffusion), soa precise determination of the vertical distribution of the photochemically pro-duced species will greatly constrain models. UVIS mapping of the distribution
CASSINI ULTRAVIOLET IMAGING SPECTROGRAPH 303
of hydrocarbons will reveal the dynamics of the curious seasonal behavior ofTitan’s atmosphere—the asymmetry between the northern and the southernhemisphere at the time of the Voyager encounter, and the polar hood.
(4) Upper atmosphere and relation to magnetosphere. Spectral images of UV ther-mospheric emission of the major nitrogen and hydrogen atmospheric specieson Titan on Saturn will allow partitioning of excitation processes, determina-tion of energy deposition (heating) rates, and ionospheric structure. The peakin emission brightness at the exobase may or may not be due to interaction withthe magnetosphere, and the high spectral resolution of the UVIS EUV channelwill help to answer this question: the spectral resolution of UVIS can provide adefinitive separation of H2C4 bands and N+ emissions, giving direct diagnosticinformation on excitation processes.
1.2.2. Saturn(1) Atmospheric and cloud properties and composition. UVIS will map the global
distribution of UV-absorbing aerosols in Saturn’s atmosphere in the spectralrange 160 to 190 nm. UVIS will determine the altitude-latitude distribution ofthe chemical species H, H2, CH4, C2H6, C2H4, and C2H2.
(2) Synoptic features and processes; winds and eddies. UVIS mapping of the hydro-carbon species will provide a basis for constructing two-dimensional modelsof the photochemistry, radiation and dynamics of Saturn’s atmosphere. Up-welling brings the parent molecule CH4 from the troposphere into the up-per atmosphere, where it undergoes photolytic decomposition. The productswill descend into the lower stratosphere, and may be partially converted intophotochemical aerosols. The distribution of aerosols will be affected by themeridional circulation, which in turn is caused by radiative heating due to thehydrocarbons and the aerosols.
(3) Ionospheric diurnal variations and magnetic control. The aurorae on Saturnshow two distinctly different morphological characteristics. Most of the Voy-ager observations show a high-altitude emission from 80! latitude in the northand south polar regions with an H2-band spectrum that is remarkably similarto the emission for the sunlit equatorial region. The spectra appear to containadditional features that are compatible with transitions in N+. Much brighterspectra from deep in the thermosphere are also observed, showing the same pe-riodicity in apparition as the planetary rotation period. These spectra show theeffects of CH4 absorption, strong self absorption and a very weak H Lyman-!line, characteristic of excitation of H2 with a very low [H]/[H2] mixing ratio.This behavior and the connection to the magnetosphere are not clear, and thebetter resolution of the Cassini UVIS (as compared to Voyager’s UVS) willyield more insight into the primary processes.
(4) Physical and compositional properties and evolution. In bulk composition, Sat-urn is a typical Jovian planet with reducing chemistry. The dominant chemistryin the upper atmosphere is the hydrocarbon chemistry initiated by the photolysis

304 L. W. ESPOSITO ET AL.
of CH4 and leading to the production of C2H6, C2H4, and C2H2. UVIS will makea systematic survey of these major carbon species as well as H atoms. Limbobservations and solar stellar occultations will yield vertical profiles. Sources,sinks, and atmospheric transport processes may also be inferred from the spatialdistribution of these chemical species.
(5) Lightning. Optical searches will be made for lightning in the FUV, in concertwith other remote-sensing instruments.
1.2.3. Rings(1) Configuration and processes. UVIS will provide high spatial resolution, low-
noise stellar occultations, spectroscopy, photometry, and limited imaging of therings. Several high-resolution (10 to 40 m), low-noise occultation opportunitiesat multiple azimuths will be available during each Cassini orbit. Measurement ofthese occultations will reveal ring structures with spatial variability on the scaleof the larger abundant ring particles. The true sharpness, shape, and azimuthalvariability of the many sharp edges in Saturn’s rings will be measured witha spatial resolution of approximately 20 m. Ring thickness will be measureddirectly from oblique occultations of sharp edges. Closely spaced occultationswill show the time development of spiral waves, wakes, and edge waves.
(2) Composition and particle size. With UVIS operating as a spectrograph, scansand drifts will yield the areal variation of UV brightness across the rings, show-ing compositional or age differences and the presence of submicron particlesas postulated to form the spokes. Variations in reflectance can be interpretedin terms of the individual particle properties like albedo and phase function,because the radial profile of extinction optical depth will be known from theoccultations.
(3) Interrelation with satellites. The presence or absence of phase shifts in edgewaves will be determined from closely spaced occultations. The effects ofimbedded or nearby moonlets will be detected in the F ring and in the similarrings in the gaps and the C ring region.
(4) Dust and meteoroid distribution. Photometric and spectroscopic studies willidentify the emissions of H and O near the rings. Since the rings are mostlywater ice, this provides a constraint on ring erosion rates. Submicron dust willbe visible in the UV: the spectral variation of reflected sunlight will establishthe number and size of dust particles near the rings.
(5) Interactions with Saturn magnetosphere, ionosphere, and atmosphere. Saturnreceives oxygen and nitrogen species from the magnetosphere and the rings;thus, CO and HCN are predicted to exist in the upper atmosphere.
1.2.4. Icy Satellites(1) Characteristics and geological histories. Regional units may be differentiated
by their UV reflectance. Darkening in the UV may be an indicator of surfaceage and exposure to radiation.
CASSINI ULTRAVIOLET IMAGING SPECTROGRAPH 305
(2) Mechanisms of modification. UVIS limb drifts and stellar occultations will beused to detect the existence of tenuous, possibly transient atmosphere, whosesource may be surface activity, sputtering, or seasonal sublimation.
(3) Composition and distribution of surface materials, especially dark, organic-rich condensates. UV reflectivity will be used to identify and/or constrain pos-sible composition of surface materials. The overall phase function of surfacematerials, including the UV, is important in determining the fine structure anddegree of compaction of surface materials.
(4) Interactions with magnetosphere and rings. UVIS will map H Lyman-!throughout the Saturnian system as well as emissions from neutrals and ions, byacquiring data during downlink rolls. A full sky map will identify the sourcesof particles being detected in situ by the MAPS (magnetosphere and plasmascience) instruments. Heavy atomic species are known to be present in the mag-netosphere. It has been argued that the heavy ions are mainly O+, derived fromsputtering of the icy satellite surfaces and subsequent H2O chemistry.
1.2.5. MagnetosphereThe mass content of the Saturn magnetosphere is determined almost entirely bysources internal to the Saturn system. The magnetosphere reflects the dynamicprocesses in the atmospheres and surfaces of the planet and satellites, which inturn are influenced by interaction with the magnetosphere in a partially closedsystem. Measurement of the content of neutrals and ions in the magnetospherecan provide critical information on basic atmospheric evolutionary processes aswell as definition of magnetospheric structure. An understanding of this complexinteractive system will clearly require knowledge of the composition, distribution,and dynamics of the magnetospheric particles. Because of the sensitivity to veryweak emissions and ability to observe the entire magnetosphere remotely, UVISwill make a unique contribution to this understanding.
(1) Configuration of magnetic field and relation to Saturn kilometric radiation.UVIS will map H Lyman-! throughout the Saturnian system as well as emis-sions from neutrals and ions by acquiring data during downlink rolls. A full skymap will identify the sources of particles being detected in situ by the MAPSinstruments.
(2) Charged particle currents, compositions, sources and sinks. Atomic H, which ispresent in significant quantities in Saturn’s magnetosphere, has a complex three-dimensional distribution. Lyman-! mapping by UVIS will establish the relativedominance of the hydrogen sources (e.g., Saturn exosphere, Titan, satellites,rings). UVIS will be able to detect emissions from N+, N++, O+, and O++.
(3) Wave-particle interactions and dynamics. None identified.(4) Interactions of Titan’s atmosphere and exosphere with surrounding plasmas.
Spectral images of UV thermospheric emission of the major nitrogen andhydrogen atmospheric species on Titan and Saturn will allow partitioning of

306 L. W. ESPOSITO ET AL.
excitation processes, determination of energy deposition (heating) rates, andionospheric structure. The peak in emission brightness at the exobase may ormay not be due to interaction with the magnetosphere, and the high spectralresolution of the UVIS EUV channel will help to answer this question: thespectral resolution of UVIS can provide a definitive separation of H2C4 bandsand N+ emissions, giving direct diagnostic information on excitation processes.
1.3. SUMMARY
In summary, the UVIS investigation has a broad range of scientific objectives en-compassing the origin and evolution of the planets and their atmospheres, cloudsand aerosols, magnetospheres, thermospheres and exospheres, satellite surfaces andtheir tenuous atmospheres, and ring structure, composition, and histories. Thesevarious objectives overlap—Titan, the rings, and satellites are sources of magne-tospheric neutrals; lost atmospheric gases may be retained in the Saturn system;and magnetospheric constituents bombard and modify the rings and satellites. Fur-thermore, UVIS provides just one segment of the broad range of new scientificinformation to come from the orbiter’s complement of in situ and remote measure-ments and from the Titan measurements by the Huygens probe. A major result ofthe UVIS investigation will be to contribute to the advance of knowledge of theSaturn system from the Cassini-Huygens mission through collaborative studies.
This paper gives a brief description of the UVIS experiment, its science objec-tives, and its planned observations.
2. Instrument Description
In this section, we describe the optical configuration and performance of the UVISthat enables the scientific investigation (McClintock et al., 1992, 1993). The UVISdesign represents a balance between the science objectives and the constraints ofmass, power, volume, and operability for a spacecraft instrument. Figures 1 and 2and Table II summarize the optical and mechanical characteristics of the instrument.UVIS consists of two moderate-resolution telescope-spectrographs covering thewavelength ranges 56 to 118 nm (extreme ultraviolet, or EUV) and 110 to 190 nm(far ultraviolet, or FUV), a sensitive High Speed Photometer (HSP), and a HydrogenDeuterium Absorption Cell (HDAC). The four separate channels are aligned forsimultaneous observation.
To meet the breadth of science objectives, UVIS uses a variety of observationtechniques. These include producing maps and images by moving the slit to asequence of locations through rastering, slewing, and drifting the spacecraft opticalaxis. Limb drifts provide high spatial resolution at the target’s limb. Occultations ofthe sun are observed with the EUV channel; the HSP can observe stellar occultationsin concert with the EUV and FUV channel spectrographs.

CASSINI ULTRAVIOLET IMAGING SPECTROGRAPH 307
Figure 1. UVIS instrument: two spectrographs, a high speed photometer, and a hydrogen absorptioncell.
UVIS will encounter a wide range of signal strengths. Saturn system atmosphericand magnetospheric emissions at wavelengths shorter than 200 nm are very faint,with radiances of the order of 0.1 to 10 Rayleighs in individual emission lines. Incontrast, sunlight scattered from the disk of Saturn and its icy satellites producesradiance in the range of 1 to 10 kR/nm.
2.1. SPECTROGRAPHIC CHANNELS
The basic instrument design adapts proven design concepts using a gratingspectrometer followed by a multi-element detector. We chose to use imaging,

308 L. W. ESPOSITO ET AL.
Figure 2. UVIS optical-mechanical configuration. The four channels share the same boresight. Insolar occultation mode, a pick-off mirror allows sunlight to enter the EUV channel without strikingthe primary.
pulse-counting microchannel plate detectors because of more than a decade ofexperience using this kind of detector equipped with a CODACON readout anode.
2.1.1. CODACON DetectorThe CODACON (Coded Anode Array Converter) acts as a photon locator. For2M " 2N pixels on the anode array, the output electronics generate a logic compat-ible M + N bit address for each detected photon. The located photon counts areaccumulated in an external memory to build a picture that is periodically read outfor transfer to the spacecraft memory and eventually, the ground. The spectrographdetectors have a count rate limit of 105/s, set by the speed of the detection electron-ics. Details of the CODACON operation are described by McClintock et al. (1992)and Lawrence and McClintock (1996).

CASSINI ULTRAVIOLET IMAGING SPECTROGRAPH 309
TABLE IIUVIS spectrographic channels and HSP
FUV EUV
(1115–1912 A) (563–1182 A) HSP
TelescopeFocal length size (mm) 100 100 200Entrance pupil size (mm) 20 " 20 20 " 20 135 " 30Reflecting surface Al + MgF2 Boron carbide Al + MgF2
Toroidal gratingsSize (mm) 60 " 60 60 " 60Grating radii (mm) 300, 296.1 300, 296.8Grating surface A1 + MgF2 Boron carbide 1068 1371Grooves/mm 1068 1371Input angle ! (degrees) 9.22 8.03Out angles " (degrees) ±2.9 #4.08 + 1.72
3-Position slitsSlit widths (microns) 75, 150, 800 100, 200, 800 6 " 6
#$(A) (Extended source) 2.75, 4.8, 24.9 2.75, 4.8, 19.4Field of view (mrad) (.75, 1.5, 8) " 60 (1, 2, 8) " 59
DetectorsPhotocathode CsI KBr CsI% Maximum QE 8 25 10Detector window MgF2 none MgF2
Detector size (mm) 25.6 " 6.4 25.6 " 6.4 11.0 diaPixel format ($ " % ) 1024 " 64 1024 " 64Pixel size (µ) 25 " 100 25 " 100Pulse resolution 10 µsec 10 µsec 50 n sec
UVIS characteristicsMass 15.6 kgVolume (L " W " H) 50.8 cm " 23.5 cm " 30.5 cm
Power 8 W (average), 12 W (peak)
The two-dimensional format for the CODACON detectors allows simultaneousspectral and one-dimensional spatial coverage. The detector format is 1024 " 64(spectral by spatial) with a pixel size of 25 " 100 mm. Two separate detectors spanthe instrument’s wavelength range, as follows. A windowless detector is requiredfor the EUV wavelength range 56 to 118 nm. We chose KBr as the photocathodematerial for this detector because of its ability to withstand a moderate amountof exposure to atmospheric water vapor. CsI was also considered as the EUVphotocathode, but it requires a door with a hermetic seal to protect it before launch.CsI is the photocathode material for the FUV wavelength range, 110 to 190 nm.This detector is enclosed in a separate vacuum housing with a MgF2 window.

310 L. W. ESPOSITO ET AL.
Although other materials such as CsTe are more efficient photocathodes than CsIfor wavelengths longer than 130 nm, we use CsI for the FUV because it is muchless sensitive to longer wavelength scattered light within the spectrograph. Thisscattered light usually dominates and can often obliterate weak planetary FUVemissions when a CsTe or a more red-sensitive photocathode is used.
2.1.2. Optical DesignThe optical requirements for EUV channel spectrometers are unique because thelow reflectivity of optical materials at these wavelengths requires that the number ofoptical elements in the system be as small as possible. Our design is a single-mirrortelescope followed by an entrance slit and a concave grating used in a Rowlandcircle mount.
We found that the EUV channel configuration also provides satisfactory spatialand spectral resolution in the FUV channel. The two channels are identical exceptfor the optical coatings, diffraction grating rulings, and detector photocathodes. Toachieve the desired spectral resolution, the optics must provide image quality inthe spectrograph dispersion direction that is comparable to the CODACON spatialresolution limit of 2 pixels (0.05 mm). Toroidal gratings used with the angle ofdiffraction equal to zero in the center of the detector have the best imaging propertiesbecause, for a given angle of incidence, they produce stigmatic images at twowavelengths in the focal plane.
The FUV channel is shown in Figure 3. This design represents the best compro-mise for spectral resolution, image quality, and instrument size. The EUV channel isidentical to the FUV except that the detector window and ion pump are not present.Each telescope consists of an off-axis section of a parabolic mirror with a 100 mmfocal length. A 20 " 20 mm aperture, which is 133 mm in front of the telescopemirror, acts as a Lyot stop conjugate to the grating. We have equipped the telescope
Figure 3. FUV optical configuration optimizes the trade-off between imaging and spectral resolutionin the available volume.
CASSINI ULTRAVIOLET IMAGING SPECTROGRAPH 311
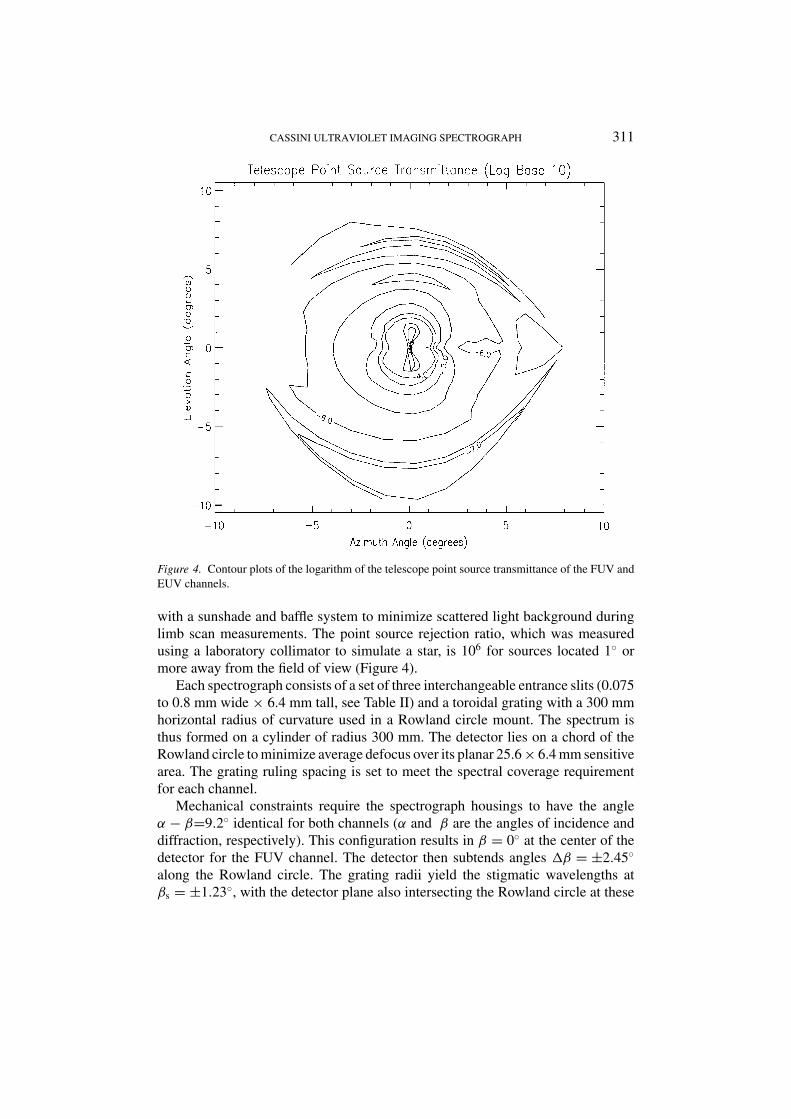
Figure 4. Contour plots of the logarithm of the telescope point source transmittance of the FUV andEUV channels.
with a sunshade and baffle system to minimize scattered light background duringlimb scan measurements. The point source rejection ratio, which was measuredusing a laboratory collimator to simulate a star, is 106 for sources located 1! ormore away from the field of view (Figure 4).
Each spectrograph consists of a set of three interchangeable entrance slits (0.075to 0.8 mm wide " 6.4 mm tall, see Table II) and a toroidal grating with a 300 mmhorizontal radius of curvature used in a Rowland circle mount. The spectrum isthus formed on a cylinder of radius 300 mm. The detector lies on a chord of theRowland circle to minimize average defocus over its planar 25.6 " 6.4 mm sensitivearea. The grating ruling spacing is set to meet the spectral coverage requirementfor each channel.
Mechanical constraints require the spectrograph housings to have the angle! # "=9.2! identical for both channels (! and " are the angles of incidence anddiffraction, respectively). This configuration results in " = 0! at the center of thedetector for the FUV channel. The detector then subtends angles #" = ±2.45!
along the Rowland circle. The grating radii yield the stigmatic wavelengths at"s = ±1.23!, with the detector plane also intersecting the Rowland circle at these

312 L. W. ESPOSITO ET AL.
wavelengths. This configuration thus yields the best average imaging over the entiredetector.
2.1.3. Spectrometer SensitivityThe following equations relate the signal and noise output of the UVIS spectrometerchannels to their design parameters. For viewing extended sources,
S($) = I ($) $ AT($)/F2T $ Apix $ & ($) $ QE($)T (1)
N 2($) = S($) + BT (2)
where S is the signal in counts per pixel, $ the wavelength, I the source radiance inkR (109 emitted photons per square centimeter per 4' steradian per second), AT/F2
Tthe square of the optical system focal ratio, Apix the area of a single detector pixelin square centimeters, & the optical system transmission, QE the detector quantumefficiency; T the observation time in seconds; N the noise in counts per pixel, andB the detector background or ‘dark count’ in counts per pixel per second.
Figure 5 shows the system sensitivity of UVIS for each channel and for thehigh-resolution and low-resolution slit widths (each labeled by its width in µm)and spectral resolution in nm. Curves for the occultation slits (not shown) are afactor of 10.7 higher than the curves for a 75 µm slit. In limb scan mode, weorient the entrance slit parallel to the planet limb and slew the spacecraft to obtainvertical profiles, summing all 64 spatial pixels into a 1024 " 1 spectrum. Mappingmode uses the full 2-dimensional capability of the detector, and we generate aspectral-by-spatial map of 1024 " 64 pixels.
Figure 5. UVIS sensitivity in counts/second/kiloRayleigh. Each curve is labeled by the slit width(µm) and the resolution (nm). Higher sensitivity is available in limb scan mode from adding all the64 picture elements along the slit.
CASSINI ULTRAVIOLET IMAGING SPECTROGRAPH 313
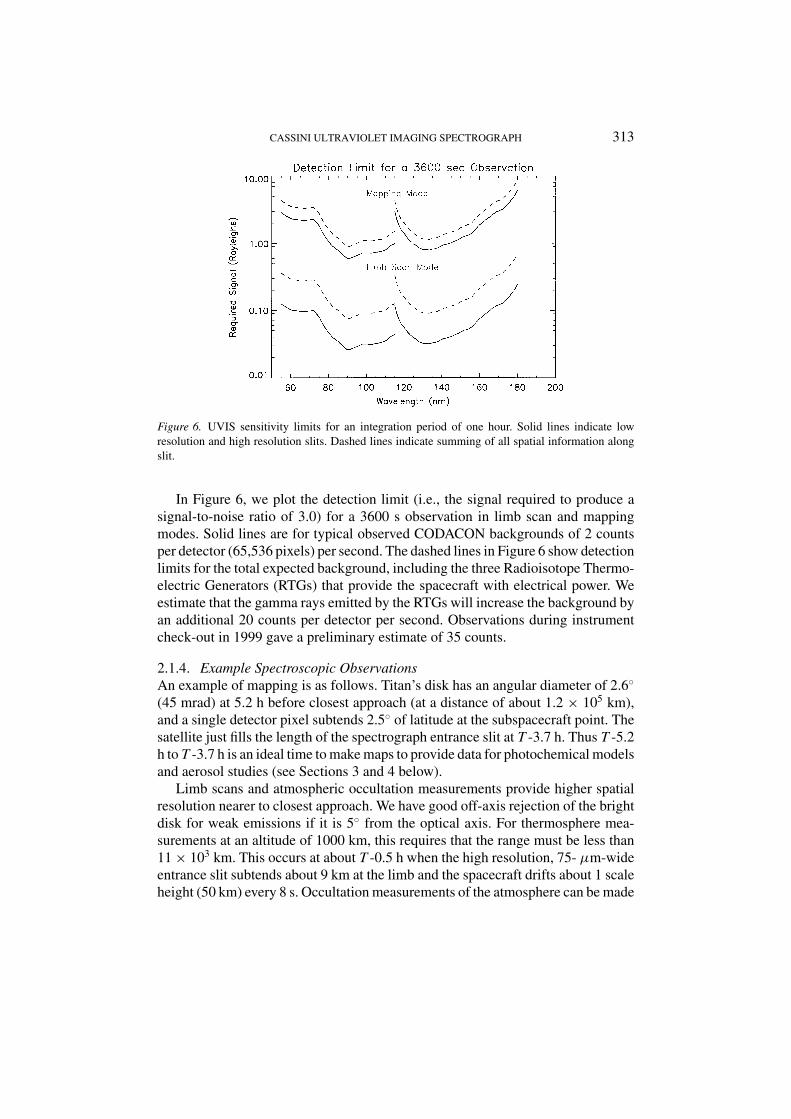
Figure 6. UVIS sensitivity limits for an integration period of one hour. Solid lines indicate lowresolution and high resolution slits. Dashed lines indicate summing of all spatial information alongslit.
In Figure 6, we plot the detection limit (i.e., the signal required to produce asignal-to-noise ratio of 3.0) for a 3600 s observation in limb scan and mappingmodes. Solid lines are for typical observed CODACON backgrounds of 2 countsper detector (65,536 pixels) per second. The dashed lines in Figure 6 show detectionlimits for the total expected background, including the three Radioisotope Thermo-electric Generators (RTGs) that provide the spacecraft with electrical power. Weestimate that the gamma rays emitted by the RTGs will increase the background byan additional 20 counts per detector per second. Observations during instrumentcheck-out in 1999 gave a preliminary estimate of 35 counts.
2.1.4. Example Spectroscopic ObservationsAn example of mapping is as follows. Titan’s disk has an angular diameter of 2.6!
(45 mrad) at 5.2 h before closest approach (at a distance of about 1.2 " 105 km),and a single detector pixel subtends 2.5! of latitude at the subspacecraft point. Thesatellite just fills the length of the spectrograph entrance slit at T -3.7 h. Thus T -5.2h to T -3.7 h is an ideal time to make maps to provide data for photochemical modelsand aerosol studies (see Sections 3 and 4 below).
Limb scans and atmospheric occultation measurements provide higher spatialresolution nearer to closest approach. We have good off-axis rejection of the brightdisk for weak emissions if it is 5! from the optical axis. For thermosphere mea-surements at an altitude of 1000 km, this requires that the range must be less than11 " 103 km. This occurs at about T -0.5 h when the high resolution, 75- µm-wideentrance slit subtends about 9 km at the limb and the spacecraft drifts about 1 scaleheight (50 km) every 8 s. Occultation measurements of the atmosphere can be made

314 L. W. ESPOSITO ET AL.
at larger ranges, especially on Titan’s night side, when there is minimal scatteredlight from the sunlit disk.
2.2. STELLAR AND SOLAR OCCULTATION MODES
The UVIS spectroscopic channels will view stars that are occulted by the atmo-spheres of Saturn and Titan and by Saturn’s rings. Because spacecraft pointingaccuracy is estimated at ±2 mrad, we have set each telescope field of view to be8 mrad wide (using the occultation slit: ‘Occ’) for stellar occultation experiments.The field of view is selected by a three-position slit mechanism in each channel(Figure 2). Two other slit positions are provided: one that is 0.75 mrad wide (FUV)or 1.0 mrad wide (EUV) to give the highest spectral resolution requirements forextended sources (‘Hi-Res’), and one that is 1.5 mrad (FUV) or 2.0 mrad (EUV)wide to provide a larger signal at less resolution (‘Lo-Res’).
We also added a solar occultation capability to the EUV channel; more distantstars are generally not useful at wavelengths shorter than 91.2 nm because interstel-lar atomic hydrogen blocks their radiation. In this observing mode (see Figure 2),light enters the EUV channel through a small aperture located 20! away from thenormal viewing direction, and it is directed toward the telescope mirror by a smallgrazing incidence mirror. A two-position mechanism is used to block the light pathwhen the solar viewing mode is not used.
2.3. HIGH SPEED PHOTOMETER
UVIS contains a High Speed Photometer (HSP) with an integration time of 2.0ms to observe stars occulted by the rings of Saturn. Figure 7 shows the HSP con-figuration, which consists of a telescope mirror that is approximately 10 timesas large as those used in the spectroscopic channels, followed by an aperture to
Figure 7. High Speed Photometer (HSP) layout showing High Voltage Power Supply (HVPS) andPulse Amplifier/Discriminator (PAD).

CASSINI ULTRAVIOLET IMAGING SPECTROGRAPH 315
limit the field of view to 6 mrad, a MgF2 lens, and a Hamamatsu model R1081photomultiplier tube with a CsI photocathode used in pulse-counting mode. Thelens images the telescope mirror onto the photocathode of the photomultiplier.Without this lens, small changes in spacecraft pointing would cause the imageof the star to move around on the nonuniform detector photocathode, resultingin unwanted signal variations. Figure 7 also shows the detector electronics loca-tion, which includes a High-Voltage Power Supply (HVPS) and a Pulse AmplifierDiscriminator (PAD).
The spectral response of the HSP is limited at short wavelengths to about 115nm by the MgF2 detector window and at long wavelengths to about 190 nm bythe work function of the CsI photocathode. We chose CsI for its low sensitiv-ity to solar light, because the spacecraft orbit geometry requires that many of theoccultation observations be made while looking through the sunlit rings. The pho-tometer field of view must be at least 6 mrad to account for pointing errors of±2 mrad. If we used a photomultiplier with either a CsTe or a Bi-alkali photo-cathode with this large a field of view, sunlight reflected from the rings wouldproduce a background at least 100 times larger than the signal from the brighteststars. Figure 8 is a contour plot of the off-axis response of the HSP. The off-axisresponse is roughly symmetric around the HSP boresight and drops off to 10#5 at10! off axis. Using a CsI photocathode, we are limited to stars with spectral class Oand B (effective temperatures in the range 10,000–40,000 K), but the backgroundfrom reflected sunlight is equal to the signal from a B5 star with a visual mag-nitude Mv of 4.5. During the Saturn orbital mission, we expect over 350 stellaroccultation opportunities for the rings with stars that are at least 10 times brighterthan Mv of 4.5.
Figure 8. HSP off-axis response (contours: log10 of sensitivity relative to maximum signal).

316 L. W. ESPOSITO ET AL.
2.4. HDAC DESCRIPTION
The first use of a hydrogen absorption cell for spaceborne remote sensing was byMorton and Purcell (1961). They used the cell as a broadband blocking filter to provethat hydrogen Lyman-! emission was present in the night sky of the Earth. Winterand Chubb (1967) used a hydrogen cell to observe the night-sky hydrogen Lyman-! line shape. In the 1970s, Bertaux flew hydrogen cells to study the line shape ofhydrogen Lyman-! in planetary coronae and the local interstellar medium (LISM).These experiments included OGO-5 at Earth (Bertaux, 1978), the Soviet Veneramissions at Venus (Bertaux et al., 1978), the Soviet Mars missions (Babichenko etal., 1977), and the Soviet Earth orbiters Prognoz 5 and 6 (Bertaux, 1977).
The only successful use of a hydrogen deuterium absorption cell to measurethe deuterium-hydrogen ratio (D/H) in the Earth’s atmosphere is by Bertaux etal. (1984) aboard Spacelab-1. Unsuccessful attempts to measure atomic D/H in-clude Mars (Babichenko et al., 1977) and Venus (Bertaux et al., 1978). The cellsmentioned above were made of glass. The Japanese Nozomi mission to Mars hashydrogen deuterium absorption cells similar to the Bertaux cells (Kawahara et al.,1993). For information on this experiment, also see Kawahara (1994). The fore-runners of the HDAC (stainless steel hydrogen cells) were developed by HansLauche and Wilhelm Barke of the Max-Planck-Institut fur Aeronomie (MPAe) inKatlenburg-Lindau, Germany, as part of the Interzodiac program. The Teflon coat-ing of the HDAC cells allows lighter weight and lower power, since recombinationtimes are longer.
The Cassini HDAC channel (Figures 9 and 10), which was built at the MPAe,consists of a Channel Electron Multiplier (CEM) photodetector equipped with 3absorption cell filters: a hydrogen cell, a deuterium cell, and an oxygen cell. Thecells are separated by MgF2 windows. The oxygen cell was designed to be a static
Figure 9. Conceptual diagram of the Cassini Hydrogen Deuterium Absorption Cell (HDAC). Thetungsten filaments dissociate molecular hydrogen and deuterium inside the cells. The dissociatedatoms resonantly absorb hydrogen and deuterium Lyman-!. Cycling the filament currents in both thehydrogen and deuterium cells gives a direct measurement of the hydrogen and deuterium Lyman-!intensities.

CASSINI ULTRAVIOLET IMAGING SPECTROGRAPH 317
Figure 10. The Cassini HDAC without baffle and cover.
broadband filter from 1150 to 1800 A but was unfortunately vented prior to flightdue to contamination caused by water vapor accumulating in the O2 cell. Thehydrogen and deuterium cells function as adjustable absorption filters, as describedbelow.
In each cell, a hot tungsten filament dissociates the H2 and D2 molecules intoatoms, producing an atomic density dependent on the filament temperature. Theseatoms resonantly absorb the hydrogen and deuterium Lyman-! lines (located at1215.67 A and 1215.34 A) passing through the cells. Cycling the filaments onand off and comparing the differences in signal gives a direct measurement of therelative hydrogen and deuterium signals. For an analysis and calibration of theCassini HDAC absorption cell, see Maki (1996).
The cells are mounted on an anodized aluminum baseplate along with a baffleattached to the front of the hydrogen cell. At the entrance to the HDAC, a singleMgF2 lens focuses the incoming light. The lens and windows are laser-welded intothe ends of the cell bodies, and the cells are connected by flanges. The cells arefilled to approximately 1.2 mbar pressure. Each cell has two filaments controlled byseparate filament current regulators for each cell. The two regulators are essentiallylow-voltage power supplies that set and regulate the power into the filaments. Onlyone filament at a time per cell is used during flight. A Pulse Amplifier Discriminatordetects photoelectrons from the CEM and sends pulses to the UVIS instrument logic.
2.5. MEASURING D/H WITH THE HDAC
The optical depth & of an HDAC cell at line center is & = (nHL , where ( is thephotoabsorption cross section, nH is the number density of the atoms, and L is the

318 L. W. ESPOSITO ET AL.
TABLE IIIHydrogen atom density and the corresponding number of atoms in a 300 K hydrogenabsorption cell for various values of optical depth.
Number of dissociatedAtomic hydrogen hydrogen atoms in a single
Optical depth density (atoms/cm3) HDAC absorption cell
0.5 1.7 " 1011 7.5 " 1012
1 3.5 " 1011 1.5 " 1013
5 1.7 " 1012 7.5 " 1013
10 3.5 " 1012 1.5 " 1014
Note. The number of dissociated atoms is much smaller than the total number ofmolecules in the cell (1018). The maximum optical depth of the HDAC is less than20 (see Section 2.4).
TABLE IVMeasured HDAC flight unit optical depths for the hydrogenand deuterium cells (Maki, 1996)
Hydrogen cell Deuterium cell
Step &H &D &H &D
1 0.15 0.0 0.3 0.022 0.8 0.0 1.5 0.163 1.4 0.0 2.7 0.254 2.1 0.0 4.3 0.375 4.8 0.0 10.0 0.876 6.0 0.0 11.0 1.067 7.0 0.0 13.0 1.28
path length (8.5 cm). For the HDAC hydrogen cell at 300 K, ( = 3.4 " 10#13 cm2.Table III shows the hydrogen atom density for selected values of optical depth. Thetransmission of the cell at line center is given by T = e#& . See Table IV for themeasured values of the flight HDAC optical depth as a function of filament step.Transmission as a function of wavelength is given by
T ($) = e#&)($), where )($) = e# x2
#$2D (3)
where #$D is the Doppler width.Because the HDAC is sensitive to electromagnetic radiation over a wide spectral
range, the signal generated by the HDAC is directly proportional to the integratedintensity of the incoming radiation over this region. The total signal is expressed as
I =! %
#%S($)H ($)T ($) d$ (4)

CASSINI ULTRAVIOLET IMAGING SPECTROGRAPH 319
where I is the signal from the photometer, H ($) is the intensity of the radiation asa function of wavelength, S($) is the sensitivity of the photometer, and T ($) is thetransmission of the filter as a function of wavelength. The ratio of the modulatedintensity I to the unmodulated intensity I0 (assuming no background) is given bythe reduction factor R:
R = II0
=" %#% S($)H ($)T ($) d$" %#% S($)H ($) d$
(5)
When no power is applied to the filament, the absorption cells contain onlymolecules, and the cells are transparent to incoming radiation at Lyman-!. Whenpower is applied to the filament in the cell, the molecules dissociate into absorbingatoms, which block incoming radiation at Lyman-!. This process defines a negativefilter; subtracting this filter profile from unity gives an effective filter, I0 # I , whichis:
I0 # I =!
S($)H ($)(1 # T ($)) d$ (6)
Note that in general, the background level will be unknown and will be determinedby taking the differences between the modulated and unmodulated signals.
In addition to measuring the ratios of the deuterium and hydrogen Lyman-! lines,the Cassini HDAC, as a high resolution spectrometer, has the ability to measurethe Lyman-! line shapes. Because instrument filter functions have different shapesfor each filament level, a full cycle through the filament settings produces a set offilters that probes the line shape of the incoming radiation. Additionally, the rangeof spacecraft Doppler velocities scans these filter functions through the line.
2.6. HDAC CALIBRATION
2.6.1. Lyman-! SensitivityThe sensitivity SLy! of the instrument is the count rate per input flux:
SLy! = 106
4'· QE · * · T 3
W · TL (7)
where SLy! is in units of counts/sec/Rayleigh, QE is the quantum efficiency of thedetector in units of counts/photon, * is the solid angle subtended by the HDACFOV in units of steradians, T 3
W · TL is the transmission of the three windows andthe single lens, and A is the area of the front lens in units of cm2. The value of SLy!
(as measured in the laboratory using a calibrated NIST windowed UV photodiode)is (30 ± 10) counts/sec/Rayleigh.
2.6.2. Broadband SensitivityThe red tail of the HDAC is the sensitivity of the instrument to electromagneticradiation redder than 1216 A. The broadband spectral sensitivity of the HDAC is

320 L. W. ESPOSITO ET AL.
Figure 11. HDAC on-axis red tail sensitivity. Because detector red tails typically decrease with time,this value for the sensitivity is an upper limit. The dash dot and dashed lines represent the modeledsensitivity for an HDAC with a CsI and KBr detector, respectively. The detector in the HDAC FlightModel (FM) has a KBr photocathode, implying that the FM red tail curve may eventually fall onthe modeled curve for KBr. The dotted line at 10#6 counts/photon is the dark count of the detectordivided by the number of photons in the beam, the lowest sensitivity value that could be measured inthis particular experiment.
bracketed on the blue side by the MgF2 windows, which absorb radiation below1150 A. The value for the sensitivity of the instrument from 1750 A to 2400 Ais important, because at this point the UV output of the sun begins to increaserapidly with wavelength. Because the signal from the reflected solar backgroundradiation is an important component in the determination of the signal-to-noiseratio of HDAC data, a KBr (potassium bromide) detector was chosen because itpossesses the combination of low detector sensitivity to solar radiation and highsensitivity to Lyman-!. When making observations of planetary atmospheres, thebackground signal in the red tail region is determined by a competition betweenthe increasing solar output and the decreasing photocathode sensitivity. If thephotocathode efficiency decreases fast enough relative to the solar output, the solarcontribution to the background will be minimal. If however, the photocathodeefficiency decreases too slowly, the background from the sun can dominate andLyman-! observations will be difficult due to the low signal-to-background ratio.Measurements of the HDAC red tail are shown in Figure 11. The red-tail sensitivityof CEM detectors of this type has been known to increase over the timescale of several years (Hans Lauche, personal communication). We are monitoring possiblechanges in the red tail by performing in-flight calibrations. The measurements areabove the predicted KBr response, but may decay to the model curve with use.
CASSINI ULTRAVIOLET IMAGING SPECTROGRAPH 321
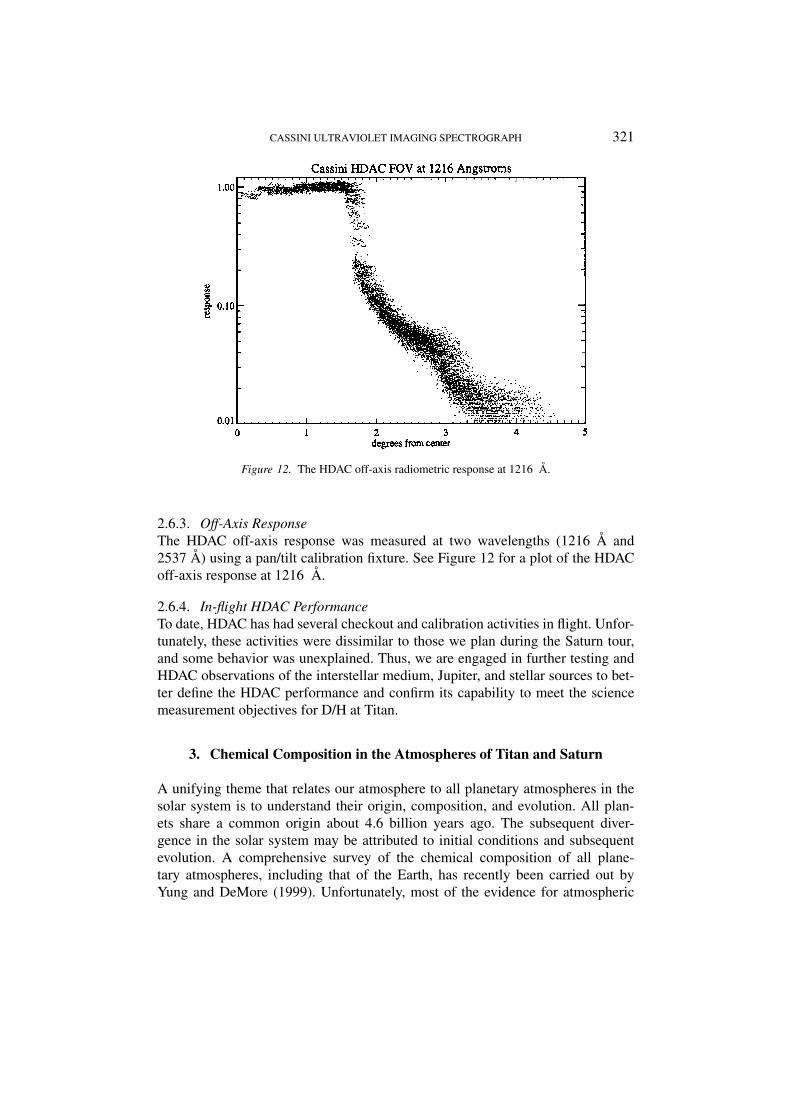
Figure 12. The HDAC off-axis radiometric response at 1216 A.
2.6.3. Off-Axis ResponseThe HDAC off-axis response was measured at two wavelengths (1216 A and2537 A) using a pan/tilt calibration fixture. See Figure 12 for a plot of the HDACoff-axis response at 1216 A.
2.6.4. In-flight HDAC PerformanceTo date, HDAC has had several checkout and calibration activities in flight. Unfor-tunately, these activities were dissimilar to those we plan during the Saturn tour,and some behavior was unexplained. Thus, we are engaged in further testing andHDAC observations of the interstellar medium, Jupiter, and stellar sources to bet-ter define the HDAC performance and confirm its capability to meet the sciencemeasurement objectives for D/H at Titan.
3. Chemical Composition in the Atmospheres of Titan and Saturn
A unifying theme that relates our atmosphere to all planetary atmospheres in thesolar system is to understand their origin, composition, and evolution. All plan-ets share a common origin about 4.6 billion years ago. The subsequent diver-gence in the solar system may be attributed to initial conditions and subsequentevolution. A comprehensive survey of the chemical composition of all plane-tary atmospheres, including that of the Earth, has recently been carried out byYung and DeMore (1999). Unfortunately, most of the evidence for atmospheric

322 L. W. ESPOSITO ET AL.
evolution in the solar system has not been preserved. Since Saturn and Titanwere derived from materials in the same region of the solar nebula, and thetwo atmospheres were subjected to the same solar radiation over the age ofthe solar system, the comparative study of the chemical composition of the at-mospheres of Saturn and Titan offers a unique opportunity to explain planetarycomposition.
3.1. COMPARISON OF SATURN AND TITAN
The atmosphere of Saturn is composed primarily of the lightest elements, hydrogenand helium, which were captured from the solar nebula during formation. The planethas a rocky core made of heavier elements. However, the mass of the gas greatlyexceeds that of the core. Due to the enormous gravity of the giant planet, little masshas escaped from its atmosphere. Hence, the bulk composition is expected to providea good measure of the initial composition of the solar nebula. Recently, significantdepartures (by factors of 2 to 3) from the solar values for the heavy elements C, N, P,and S have been observed for Jupiter and presumably for Saturn (Owen et al., 1999;Atreya et al., 1999; Orton et al., 2000). The enhancement of O is not confirmedbecause the Galileo probe entered an unusually dry part of the atmosphere of Jupiter(Showman and Ingersoll, 1998). An influx of icy planetesimals formed at lowtemperature (T < 30 K) might have been responsible for the enrichment of heavyelements.
Titan was formed in the Saturnian sub-nebula at the time of the formation ofSaturn. Due to the lower temperatures in this region of the solar nebula, ices werecommon, and Titan (like Saturn) accreted material that is rich in ices. As the at-mospheric constituents are photochemically processed and converted into con-densible material, the ices on the surface or outgassing from the interior mustmaintain the supply of gas to the atmosphere. Titan possesses a thick, mildlyreducing atmosphere that is different from the atmosphere of Saturn in at leasttwo aspects. First, there is little H2 in the atmosphere of Titan relative to themost abundant gas, N2. The gravity is low enough that light gases like H andH2 did not accumulate at formation. In contrast, the composition of Saturn isdominated by H2. Second, unlike Saturn, Titan has a cold, solid surface. Organiccompounds that are synthesized in the atmosphere are deposited on the surface,resulting in their permanent sequestration. This implies an irreversible chemicalevolution of the atmosphere and the surface. Titan has no recycling of organicspecies as in Saturn. The atmosphere is being gradually destroyed by photolysisand must be resupplied by primordial ice on the surface or outgassing from theinterior.
The net result of the photochemical destruction of CH4 is its conversion tohigher hydrocarbons. Ultimately the product species gain molecular weight andbecome heavy enough to condense, giving rise to a ubiquitous aerosol layerin the atmosphere known as Axel-Danielson dust. The Titan aerosol chemistry
CASSINI ULTRAVIOLET IMAGING SPECTROGRAPH 323
is augmented by the coupled chemistry of CH4 and N2, resulting in the for-mation of nitrile compounds. The presence of an aerosol layer in the atmo-spheres of Saturn and Titan has profound consequences for the thermal bud-get of the upper atmosphere. Indeed, aerosol heating is a primary cause of thethermal inversion in the atmospheres of Saturn and Titan above the tropopause.The aerosols may also present a surface for possible heterogeneous chemicalreactions.
The previous major advance in our knowledge of Saturn and Titan is from theVoyager encounters, summarized in special issues of Science (Voyager 1, 1981,Voyager 2, 1982) and the Journal of Geophysical Research (Voyager 2, 1983).The Cassini mission offers a unique opportunity to expand the base of knowledgefrom previous missions and Earth-based observations and to make new funda-mental discoveries. One of the most important contributions of the Cassini ob-servations is a comparison of the thermal structure and photochemistry of Titanand Saturn. There are at least three important aspects of the chemistry of Sat-urn and Titan: the hydrocarbon chemistry, the oxygen chemistry, and the nitrogenchemistry.
3.2. THERMAL STRUCTURE
Figures 13a and b show the temperature and bulk number density of the atmo-spheres of Saturn and Titan as a function of altitude. Unless otherwise stated, allSaturn and Titan data in the figures are from Moses et al. (2000) and Yung et al.(1984). The temperature at the top of the Saturn atmosphere is uncertain; two valueshave been reported: 420 K (Smith et al., 1983) and 700 to 800 K (Atreya et al.,1988). The results based on Voyager (see special issues referenced above) revealseveral prominent common features of the thermal structure that are so distinctiveas to be the basis for dividing the atmosphere into regions. The region from thereference level to the temperature minimum is known as the troposphere, wherethe temperature decreases with altitude. The troposphere is characterized by vig-orous convective activities. Above the tropopause is the stratosphere, where thetemperature increases to a maximum around 400 km. The inversion is caused bythe absorption of sunlight by aerosols and has the effect of inhibiting mass exchangebetween the stratosphere and other parts of the atmosphere. Above this, the temper-ature decreases again in the mesosphere to a second minimum near the mesopause(around 800 km). Above the mesopause, the temperature rises again in thethermosphere.
The most interesting aspects of the thermal structure of Saturn and Titan arethe thermal inversions in the stratosphere and the thermosphere. The principal heatabsorbers in the stratosphere are CH4 and the Danielson-Axel aerosols. Titan hasmore aerosols, and its stratosphere is therefore warmer. A quantitative relationbetween the composition and the heat budget remains to be established from moreprecise measurements.

324 L. W. ESPOSITO ET AL.
Figure 13. (a, b) Temperature profiles in the atmospheres of Saturn and Titan. Zero km refers to the1 bar level on Saturn and 1.5 bar (the surface) for Titan. A possible higher temperature of Saturn’supper atmosphere of 700 K to 800 K (Atreya et al., 1988) is not shown.
The hot thermosphere of Saturn is a puzzle (Festou and Atreya, 1982). In theterrestrial atmosphere, the high temperature can be explained by solar heatingbalanced by cooling due to conduction. This appears to be an adequate expla-nation for the thermospheric temperature on Titan, but not for Saturn, becauseit implies a very large eddy diffusion coefficient. An additional heating mech-anism, such as that associated with the viscous damping of upward propagat-ing waves from the troposphere, may be needed to account for the hot thermo-sphere of Saturn (Young et al., 1997). To quantify this mechanism, we needobservations of gravity waves, as manifested in the vertical structure of tem-perature and the vertical profiles of chemical species in the mesosphere andlower thermosphere. This can best be accomplished by UVIS solar or stellaroccultations.

CASSINI ULTRAVIOLET IMAGING SPECTROGRAPH 325
3.3. PHOTOCHEMISTRY
The photochemistry of hydrocarbons in the atmosphere of Jupiter has been studiedin a comprehensive model that includes all the relevant chemistry up to 8 carbonatoms and vertical transport by eddy diffusion (Gladstone et al., 1996). As one ofthe four giant planets, Saturn’s photochemistry should be similar to that of Jupiter.The chemical model for Jupiter has recently been extended to Saturn by Moses etal. (2000). The major changes in the model include the new chemistry of oxygenspecies that have been detected by the Infrared Space Observatory (ISO) (Degraauwet al., 1997). The photochemistry of hydrocarbon, oxygen, and nitrogen species onTitan was modeled by Yung et al. (1984) in a comprehensive chemical model thatincorporated all the observations of the Voyager available at that time. Since then,there have been updates and extensions of that model based on subsequent Voyageranalysis (Coustenis and Bezard, 1995; Coustenis et al., 1989, 1991), and furtheranalysis of data (Lara et al., 1996), as well as laboratory kinetic studies (e.g.,Zwier and Allen, 1996). These results will be briefly discussed in their relation toa comparative study of Saturn and Titan by Cassini.
3.3.1. Hydrocarbon ChemistryFigures 14a and b show the principal hydrocarbon species in the atmosphere ofSaturn. Methane is the parent molecule of all hydrocarbons in the model. Its mixingfollows the bulk density of the atmosphere (see Figure 14a). Rapid destructionoccurs around and above the homopause, which is at an altitude of 1110 km (Atreya,1982). The destruction of CH4 gives rise to the production of radical species, whicheventually recombine to form C2H6, C2H4, C2H2 (Figure 14a) and heavier speciesC3H8, C4H2 and C4H10 (Figure 14b). We note that the alkanes (C2H6, C3H8, C4H10),once formed, are stable; their concentrations are high in the stratosphere. But theunsaturated hydrocarbons (C2H2, C2H4, C4H2) are less stable. They are destroyedbefore they reach the lower stratosphere. All higher hydrocarbon species are rapidlyremoved below the tropopause by rapid transport to the interior of the planet, wherethey are recycled back to the thermodynamically most stable product, CH4. SinceCH4 is originally derived from the deep atmosphere, this constitutes a closed loop;there is negligible loss of even the lightest molecules.
Figures 15a and b show the principal hydrocarbon species in the atmosphere ofTitan. Comparing with Saturn, we note that the efficiency of organic synthesis ismuch higher in Titan, even though the total rate of CH4 photolysis (the primarydriver of photochemistry) is the same. The main reason is that Saturn’s atmosphereis dominated by H2, whereas Titan’s atmosphere is dominated by N2. This willbecome clear if we examine the comparison between atomic hydrogen profiles inthe atmospheres of Saturn and Titan (Figure 16). The lower concentration of Hatoms on Titan is due to their escape from Titan. As a result, the back reaction:
H + CH3 + M & CH4 + M (8)

326 L. W. ESPOSITO ET AL.
(a)
(b)
Figure 14. (a) Number density profiles for the major hydrocarbons in the atmosphere of Saturn: CH4,C2H6, C2H4, C2H2. (b) Number density profiles for the major hydrocarbons in the atmosphere ofSaturn: C3H8, C4H2, C4H10.

CASSINI ULTRAVIOLET IMAGING SPECTROGRAPH 327
(a)
(b)
Figure 15. (a) Number density profiles for the major hydrocarbons in the atmosphere of Titan: CH4,C2H6, C2H4, C2H2. (b) Number density profiles for the major hydrocarbons in the atmosphere ofTitan: C3H8, C4H2, C4H10.

328 L. W. ESPOSITO ET AL.
Figure 16. Number density profiles of H atoms in the atmospheres of Saturn and Titan.
is less important on Titan than on Saturn, and the methyl radicals can proceedto form higher hydrocarbons more efficiently. A careful quantitative comparisonbetween the hydrocarbons and hydrogen from the Cassini mission is expected toreveal major new insights on the carbon chemistry in the outer solar system andto confirm or disprove some of the current models. A major puzzle is the model’sfailure to account for the formation of CH3C2H (not shown), which requires anew chemical pathway for forming this molecule. Although some of the heavyhydrocarbons are not expected to be observable by the UVIS experiment, the modelprovides a reference for future experiments. Also, in polar regions, the hydrocarbonconcentrations may be enhanced due to auroral processes, and the model might haveunderestimated their concentrations.
3.3.2. Oxygen ChemistryThe composition of Saturn and Titan is reducing. The oxygen chemistry is entirelydriven by an exogenic source, the ablation of micrometeoroids in the upper atmo-sphere. Figures 17 and 18 show the concentration profiles of the major oxygenspecies in the atmosphere of Saturn and Titan, respectively. UVIS measures O andCO directly; other species can be inferred indirectly or measured by CIRS. Al-though all the oxygen species are initially derived from a meteoric source, the mostabundant oxygen species is not H2O but CO. The reason is that H2O condensesin the stratosphere and is removed from the middle atmosphere. The ultimate loss

CASSINI ULTRAVIOLET IMAGING SPECTROGRAPH 329
Figure 17. Number density profiles for the major oxygen species in the atmosphere of Saturn.
Figure 18. Number density profiles for the major oxygen species in the atmosphere of Titan.
330 L. W. ESPOSITO ET AL.
mechanism of CO is formation of CO2, followed by condensation at the tropopause.There is an interior sink for CO on Saturn, where CO is eventually converted tothe thermodynamically stable molecules, CH4 and H2O. On Titan, CO is stableon the surface (like N2). This explains the main difference between the verticalprofiles of CO on Saturn and Titan. Our CO concentration for Titan is consistentwith the measurements of Lutz et al. (1983), Muhleman et al. (1984), and Gurwelland Muhleman (1995). However, Marten et al. (1988), Hidayat et al. (1997), andNoll et al. (1996a) found significantly lower values. Since the chemical lifetimeof CO on Titan is on the order of 109 years, we expect CO to be well mixed inthe atmosphere, and there should be little change from year to year. Thus, the dis-crepancies between the observations are puzzling and must be resolved by futuremeasurements. The most interesting question concerning the oxygen species onSaturn and Titan is the origin of the micrometeoroids. Are these interplanetary dustparticles from the Asteroid Belt, the Kuiper Belt, the rings of Saturn; or is debrisfrom the icy satellites transformed to exotic molecules in the atmosphere of Saturnand Titan?
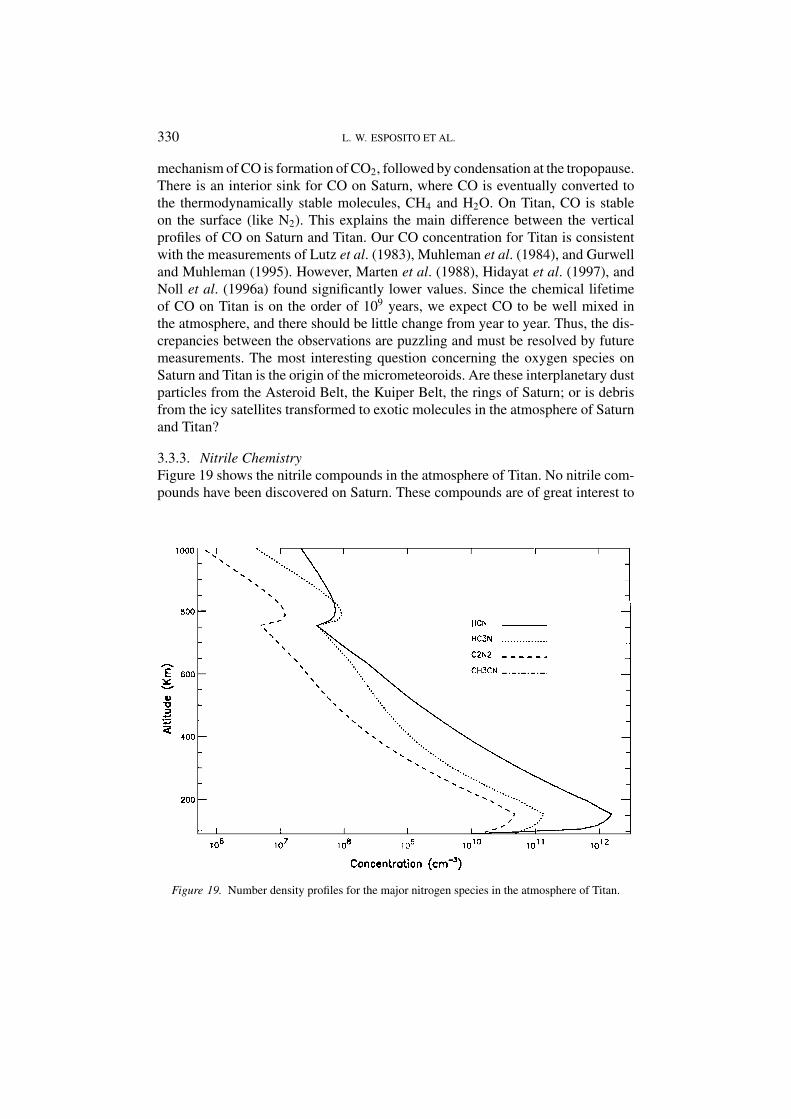
3.3.3. Nitrile ChemistryFigure 19 shows the nitrile compounds in the atmosphere of Titan. No nitrile com-pounds have been discovered on Saturn. These compounds are of great interest to
Figure 19. Number density profiles for the major nitrogen species in the atmosphere of Titan.

CASSINI ULTRAVIOLET IMAGING SPECTROGRAPH 331
the origin of life as the basic constituents of amino acids and precursors to life.They are produced as a result of the photochemistry of nitrogen and hydrocarbons.Both the energy source that drives the nitrogen photochemistry and the chemicalkinetics that generate and recycle these compounds are poorly understood fromprevious observations. For example, the abundance of CH3CN cannot be explainedby chemistry based on measured kinetics.
The model of Lara et al. (1996) is based on the reaction:
CN + CH4 & CH3 + HCN (9)
CN + CH4 & CH3CN + H (10)
While branch (9) is well known, branch (10) has never been measured. Detailedobservations of the altitude profile of CH3CN in the future would provide a test ofthis hypothesis.
In summary, the Cassini UVIS observations will result in major advances in ourunderstanding of the upper atmospheres of Saturn and Titan:
(1) The temperature of the thermosphere and the heating mechanism responsiblefor maintaining the high temperature on Saturn.
(2) The eddy mixing in the atmospheres of Saturn and Titan; comparison of anatmosphere without a surface and a thick satellite atmosphere with surface andpossibly ocean.
(3) The efficiency of organic synthesis in an H2 dominated atmosphere versus thatin an N2 dominated atmosphere.
(4) The impact of hydrogen escape at the upper boundary on atmospheric chemistry.(5) The magnitude and fate of the influx of oxygen in the ablation of micromete-
oroids in the atmospheres of Saturn and Titan.(6) The chemical pathways leading to the formation of Danielson-Axel aerosols in
the atmospheres of Saturn and Titan.
4. Clouds and Aerosols
4.1. STRATOSPHERIC AEROSOLS
The study of aerosols touches on many facets of atmospheric science. Aerosolsare one of the end products of chemistry in the high atmosphere initiated by thebreakup of molecules by photolysis and by charged particle bombardment. Chargedparticle bombardment is thought to be especially important in auroral regions.Aerosols absorb solar radiation and thereby play a role in the energy balance andmeridional circulation of the stratosphere. UV wavelengths are more sensitive thanlonger wavelengths to small particles, which have a long residence time in thestratosphere and can serve as tracers of the circulation and horizontal eddy transport.Observations by UVIS will lead to detailed knowledge of their UV optical properties

332 L. W. ESPOSITO ET AL.
and vertical distribution, which are necessary to estimate solar heating, and can beused along with observations of infrared cooling and heating to derive the meanmeridional circulation, as West et al. (1992) have done for Jupiter’s stratosphere.These observations are also necessary to derive aerosol number density, size, shape,and refractive index, which in turn serve to constrain aerosol/chemical life-cycleand microphysical models.
Ultraviolet wavelengths remotely sense the stratospheres of Saturn and Titan.Molecular scattering by H2 and He provides enough opacity to establish verticaloptical depth 1 at 37 mbar at 190 nm wavelength, decreasing to lower pressureapproximately as $#4. Additional opacity due to gas (mostly hydrocarbons, seeSection 3) and aerosol constituents will push this level to even lower pressures,especially near the poles, which are considerably darkened. In Titan’s stratosphere,an optically thick aerosol haze dominates the opacity at wavelengths down to 180nm and causes Titan’s geometric albedo to be remarkably low (0.02 from 180 to220 nm, McGrath et al., 1998).
4.2. SATURN
Saturn’s banded appearance is the result of cloud and aerosol particles, which aretransported by the zonal wind structure. As on Jupiter, the polar and low-latituderegions are distinctly different. Equatorward of the transition region, the atmosphereis moderately absorbing, but at higher latitudes the concentration of absorbersis much greater. This difference may be attributable to the strong contributionthat auroral energy deposition makes to aerosol formation in the auroral zones,coupled with a dynamical confining mechanism (such as a zonal jet at the transitionlatitude), which inhibits particle transport to lower latitudes. Auroral processeshave been implicated for aerosol formation on Saturn ever since the Voyager 2photopolarimeter experiment showed UV absorbers to be concentrated at highlatitude (Lane et al., 1982; Pryor and Hord, 1991). Jaffel et al. (1995) discoveredan auroral dark oval in the northern polar region. They considered this to be strongevidence for an auroral connection to UV haze production.
Previous work on Saturn’s aerosols and their connection to auroral processesleaves us with a number of questions. What is the nature of the dark feature asso-ciated with the aurora? Does it serve as a tracer for recent (within hours) aerosolformation, or does it reflect processes operating over longer time scales? At whataltitudes do the aerosols begin to form? What dynamical process produces the sharptransition region? Can we see longitudinal contrasts over short spatial scales, andcan they be exploited to reveal the nature of the zonal wind field at mbar pressuresin the polar stratosphere? Are there variations over short or long time scales, andwhat do they imply? What are the sizes and shapes of the particles, and what is thenature of the microphysical processes that govern these parameters? What are thecompositions of the particles at high and low latitude?
CASSINI ULTRAVIOLET IMAGING SPECTROGRAPH 333
The UVIS instrument will provide information uniquely suited to address-ing these questions. It will supply images of Saturn at many wavelengths be-tween about 150 and 190 nm, which will be used to study the morphology ofthe banded structure and of the illuminated polar region. These images will haveseveral advantages compared to what is obtainable from earth orbit, includingbetter viewing angles during high-inclination orbits, better signal-to-noise ratio,frequent temporal coverage over a 4-year period, and phase angle coverage. Phaseangle coverage provides information on the scattering phase function of the par-ticles, which is diagnostic of the particle size distribution. Together with infor-mation at other wavelengths from other instruments, it will help constrain parti-cle shape and the imaginary part of the refractive index (which is diagnostic ofcomposition).
Solar and stellar occultations will be used to measure the vertical profile ofaerosol and gas opacity at the highest altitudes (pressure less than about 0.2 mbar).Solar occultations (with EUV only) provide EUV signal but are rare (at mosta few during the mission), and the spatial resolution is limited by the angularsize of the sun’s disk as projected on the limb. These provide direct measure-ments of the atomic hydrogen density and the thermospheric temperature. Oneor more stellar occultation events (primarily FUV) are expected for every orbit,providing modest latitudinal coverage and high spatial resolution in the vertical.Opportunities to do vertical profiling in and near the auroral region will be partic-ularly interesting, since the altitudes probed coincide with the location of auroralenergy deposition. In addition to aerosol and gas-opacity profiles, these occulta-tion measurements will provide temperature information over one or two scaleheights. An estimate of zonal winds at low pressure is possible within a limitedlatitude range if the latitudinal density of occultations is sufficient to derive isobaricslopes.
4.3. TITAN
The importance of aerosols to atmospheric physics and chemistry is nowhere moreevident than on Titan, and many papers in recent scientific literature have concernedthemselves with Titan aerosols. Titan’s atmosphere contains mostly nitrogen withtrace amounts of hydrocarbons, mostly methane. Destruction of methane by pho-tolysis (Yung et al., 1984) and by charged particle bombardment from Saturn’smagnetosphere, the solar wind, and high-energy cosmic rays leads to the produc-tion of a plethora of hydrocarbons and nitriles (see Section 3). Through a processas yet too complex to model accurately, these molecules lead to the formation ofsmall haze particles high above the surface (in the altitude range 350 to 600 km).Several laboratory studies and theoretical treatments have revealed likely chem-ical pathways and products in this process (Yung et al., 1984; Thompson et al.,1994; Devanssay et al., 1995; Zweir and Allen, 1996; McKay, 1996; Clarke andFerris, 1997).

334 L. W. ESPOSITO ET AL.
Refractive indices of the particles derived from studies of Titan’s geometricalbedo are within a factor of 2 of those produced in the laboratory work of Khare etal. (1984). The particles do not absorb much at red wavelengths but absorb stronglyat UV wavelengths. The particles that formed in several of the laboratory studieswere aggregates of small spheres (Bar-Nun et al., 1988; Scattergood et al., 1992).Aggregate particles can account for the combination of modest forward scattering(near 160! phase angle) and high linear polarization (near 90! phase angle) producedby Titan’s haze (West and Smith, 1991; Lemmon, 1994; Rannou et al., 1997).
Conventional aerosol microphysical models for Titan assumed that the particlesare spheres (e.g., Toon et al., 1992). Tomasko and Smith (1982) proposed a verti-cally inhomogeneous model with an optically thin layer of larger particles at the topof the atmosphere to account for the combination of forward scattering and linearpolarization. Toon et al. (1992) showed how that scenario could be supported witha microphysical model having upwelling at some latitudes. They simultaneouslyaccount for the detached haze layer seen in Voyager images (Rages and Pollack,1983). Haze morphology in the polar region as seen in Voyager images has con-siderable structure, indicating the importance of atmospheric dynamics in aerosolformation and transport.
More recent models of haze microphysics have emphasized the aggregation pro-cess. This work has been carried out mostly by Cabane et al. (1993), Chassefiereand Cabane (1995), and Rannou et al. (1997). These models have become more so-phisticated with time, attempting to account for details of the haze vertical structureas well as the fractal dimension of the particles.
Yet another important facet of Titan aerosol science is the observed north/southcontrast and seasonal variation. Karkoschka and Lorenz (1997) used images ofTitan’s shadow on Saturn to derive a north/south difference in altitude of the opticallimb of the planet, which is close to zero at 337 nm wavelength but is 130 km at 954nm. This implies a hemispheric asymmetry in aerosol size (0.3 µm mean radius inthe north compared to 0.1 µm mean radius in the south). We still don’t have a goodunderstanding of the highly coupled chemical/microphysical/ radiative/dynamicalprocesses that produce the observed asymmetries and their variations with time.
Observations by the UVIS instrument will provide unique and important in-formation to help sort out current questions about Titan aerosols. Maps of Titan’sreflectivity at many latitudes and phase angles at UV wavelengths will put newconstraints on the size distributions and shapes of particles as a function of latitude.At close range (within 20,000 km of Titan), imaging along the limb will resolvestructure whose scale height is much smaller (20 km or less) than the scale height ofthe gas. Because ultraviolet wavelengths are sensitive to small particles, the UVISexperiment will provide critical information on the aerosol formation region (300 to600 km altitude). Solar occultations at Titan can resolve subscale-height structureand provide important information on gas and aerosol opacity at high altitude. Mul-tiple stellar occultations will allow detailed vertical profiling of gas and aerosols atmany latitudes down to an altitude of approximately 350 km.

CASSINI ULTRAVIOLET IMAGING SPECTROGRAPH 335
In concert with Cassini images and IR spectroscopy, this will allow a com-plete picture of Titan’s stratosphere, which can be linked to the Huygens proberesults at lower altitudes from the Descent Imager/Spectral Radiometer (DISR)experiment.
5. Thermospheres and Exospheres
5.1. INTRODUCTION
The unexpectedly high thermospheric temperatures of the giant planets are anunsolved puzzle. Unlike the terrestrial planets, we cannot explain their high tem-peratures (see Figure 20). UVIS can measure the various heating mechanisms bytheir direct and indirect effects on UV thermospheric emissions.
5.2. SATURN
5.2.1. Saturn’s AuroraThe Voyager UVS obtained limited information on Saturn’s aurora, which showedstrong intensity variations in both north and south ovals (Sandel and Broadfoot,1981; cf. Broadfoot et al., 1981; Sandel et al., 1982). More recent measurements
Figure 20. Kinetic temperatures of the atmospheres of the giant outer planets compared to the Earthand Venus. Open circles are the temperatures measured at the tops of the thermospheres (exobase;note range for Saturn). Filled circles are the temperatures predicted through model calculations. Themodeled exobase temperatures for the outer planets are based on solar radiation input and the knownthermal transfer properties of H2. Open squares are the mesospheric temperatures. Altitudes of theexobase are indicated on the plot.
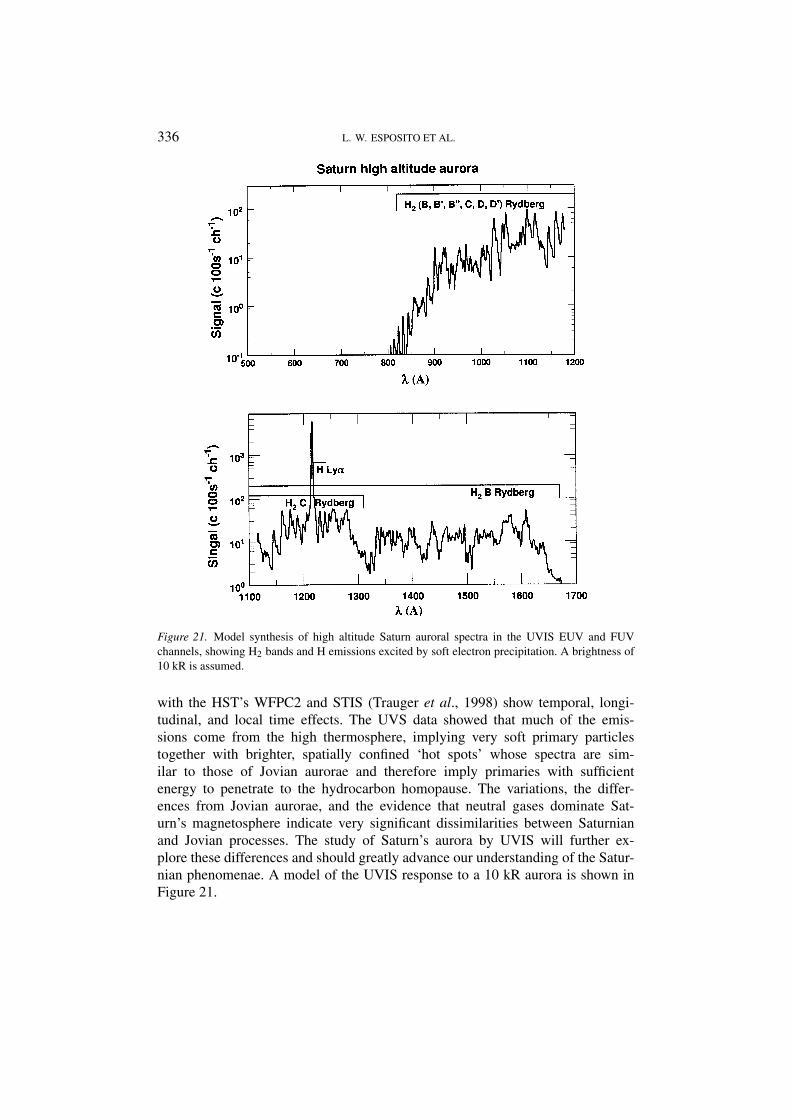
336 L. W. ESPOSITO ET AL.
Figure 21. Model synthesis of high altitude Saturn auroral spectra in the UVIS EUV and FUVchannels, showing H2 bands and H emissions excited by soft electron precipitation. A brightness of10 kR is assumed.
with the HST’s WFPC2 and STIS (Trauger et al., 1998) show temporal, longi-tudinal, and local time effects. The UVS data showed that much of the emis-sions come from the high thermosphere, implying very soft primary particlestogether with brighter, spatially confined ‘hot spots’ whose spectra are sim-ilar to those of Jovian aurorae and therefore imply primaries with sufficientenergy to penetrate to the hydrocarbon homopause. The variations, the differ-ences from Jovian aurorae, and the evidence that neutral gases dominate Sat-urn’s magnetosphere indicate very significant dissimilarities between Saturnianand Jovian processes. The study of Saturn’s aurora by UVIS will further ex-plore these differences and should greatly advance our understanding of the Satur-nian phenomenae. A model of the UVIS response to a 10 kR aurora is shown inFigure 21.
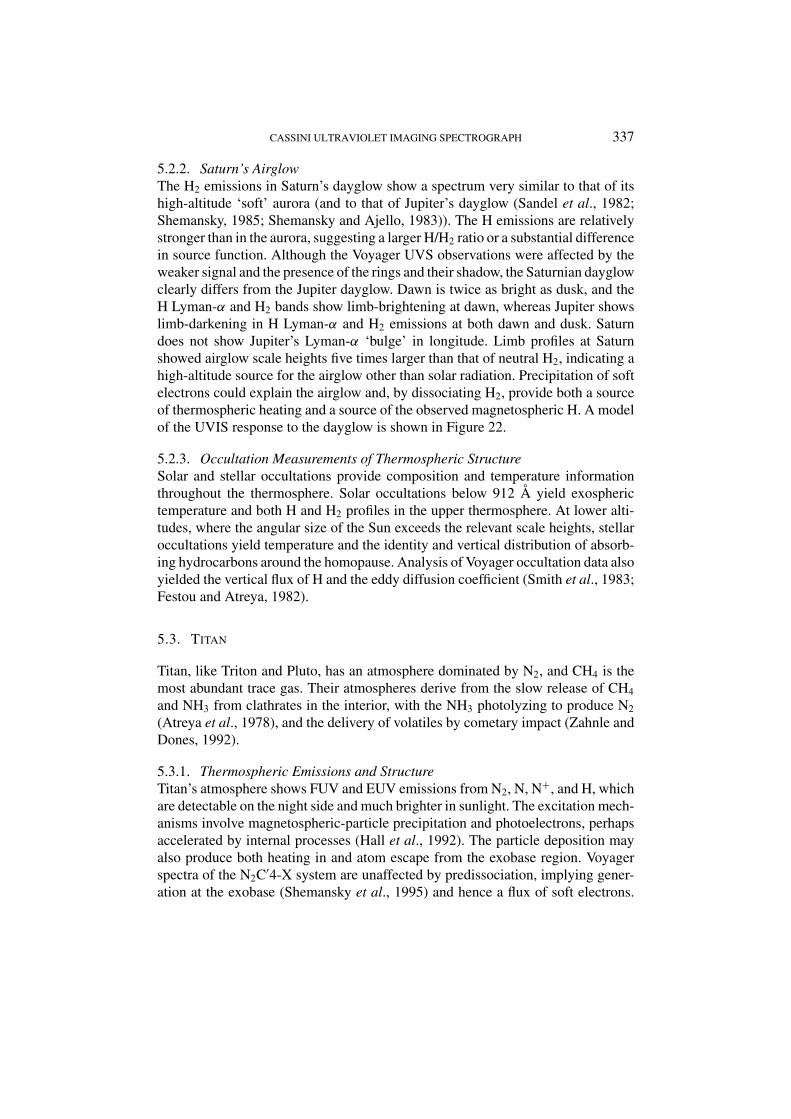
CASSINI ULTRAVIOLET IMAGING SPECTROGRAPH 337
5.2.2. Saturn’s AirglowThe H2 emissions in Saturn’s dayglow show a spectrum very similar to that of itshigh-altitude ‘soft’ aurora (and to that of Jupiter’s dayglow (Sandel et al., 1982;Shemansky, 1985; Shemansky and Ajello, 1983)). The H emissions are relativelystronger than in the aurora, suggesting a larger H/H2 ratio or a substantial differencein source function. Although the Voyager UVS observations were affected by theweaker signal and the presence of the rings and their shadow, the Saturnian dayglowclearly differs from the Jupiter dayglow. Dawn is twice as bright as dusk, and theH Lyman-! and H2 bands show limb-brightening at dawn, whereas Jupiter showslimb-darkening in H Lyman-! and H2 emissions at both dawn and dusk. Saturndoes not show Jupiter’s Lyman-! ‘bulge’ in longitude. Limb profiles at Saturnshowed airglow scale heights five times larger than that of neutral H2, indicating ahigh-altitude source for the airglow other than solar radiation. Precipitation of softelectrons could explain the airglow and, by dissociating H2, provide both a sourceof thermospheric heating and a source of the observed magnetospheric H. A modelof the UVIS response to the dayglow is shown in Figure 22.
5.2.3. Occultation Measurements of Thermospheric StructureSolar and stellar occultations provide composition and temperature informationthroughout the thermosphere. Solar occultations below 912 A yield exospherictemperature and both H and H2 profiles in the upper thermosphere. At lower alti-tudes, where the angular size of the Sun exceeds the relevant scale heights, stellaroccultations yield temperature and the identity and vertical distribution of absorb-ing hydrocarbons around the homopause. Analysis of Voyager occultation data alsoyielded the vertical flux of H and the eddy diffusion coefficient (Smith et al., 1983;Festou and Atreya, 1982).
5.3. TITAN
Titan, like Triton and Pluto, has an atmosphere dominated by N2, and CH4 is themost abundant trace gas. Their atmospheres derive from the slow release of CH4and NH3 from clathrates in the interior, with the NH3 photolyzing to produce N2(Atreya et al., 1978), and the delivery of volatiles by cometary impact (Zahnle andDones, 1992).
5.3.1. Thermospheric Emissions and StructureTitan’s atmosphere shows FUV and EUV emissions from N2, N, N+, and H, whichare detectable on the night side and much brighter in sunlight. The excitation mech-anisms involve magnetospheric-particle precipitation and photoelectrons, perhapsaccelerated by internal processes (Hall et al., 1992). The particle deposition mayalso produce both heating in and atom escape from the exobase region. Voyagerspectra of the N2C'4-X system are unaffected by predissociation, implying gener-ation at the exobase (Shemansky et al., 1995) and hence a flux of soft electrons.
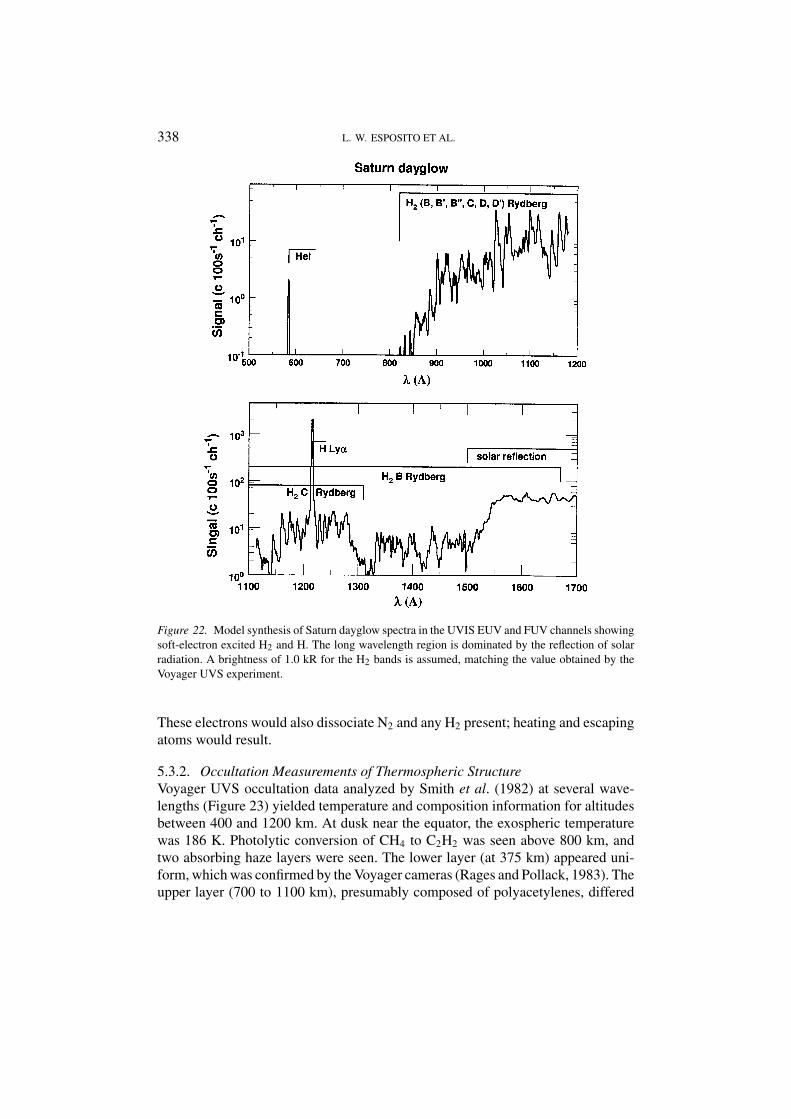
338 L. W. ESPOSITO ET AL.
Figure 22. Model synthesis of Saturn dayglow spectra in the UVIS EUV and FUV channels showingsoft-electron excited H2 and H. The long wavelength region is dominated by the reflection of solarradiation. A brightness of 1.0 kR for the H2 bands is assumed, matching the value obtained by theVoyager UVS experiment.
These electrons would also dissociate N2 and any H2 present; heating and escapingatoms would result.
5.3.2. Occultation Measurements of Thermospheric StructureVoyager UVS occultation data analyzed by Smith et al. (1982) at several wave-lengths (Figure 23) yielded temperature and composition information for altitudesbetween 400 and 1200 km. At dusk near the equator, the exospheric temperaturewas 186 K. Photolytic conversion of CH4 to C2H2 was seen above 800 km, andtwo absorbing haze layers were seen. The lower layer (at 375 km) appeared uni-form, which was confirmed by the Voyager cameras (Rages and Pollack, 1983). Theupper layer (700 to 1100 km), presumably composed of polyacetylenes, differed

CASSINI ULTRAVIOLET IMAGING SPECTROGRAPH 339
Figure 23. Voyager 1 UVS ingress (2.74!N) occultation measurements of optical depth at variousindicated wavelengths as a function of radial distance from the center of Titan (after Smith, et al.,1982).
between ingress and egress. Other nonuniformities in temperature and compositionhave been reported by the Voyager IRIS (Coustenis, 1992). The Cassini UVIS,with much better resolution and sensitivity than the Voyager UVS, should provideinformation to within 100 km of the radio occultation limit of 200 km.
5.4. MAGNETOSPHERE
Both Saturn and Titan may supply neutrals to the magnetosphere. In any case,there is compelling evidence that considerable amounts of water are supplied bysputtering from ices in the system. The Voyager UVS detected H at out to 20 Rs,with a peak density of 100 cm#3 and extending 8 Rs above and below the equatorialplane. HST has detected OH at 4.5 and 6 Rs, with a null result at 8 Rs. There aretheoretical grounds for expecting O in amounts similar to OH. Other sputteringproducts may be present in quantities detectable by UVIS, in addition to the H andO. The large neutral/ion ratios will have a large effect on magnetospheric energeticsand structure.

340 L. W. ESPOSITO ET AL.
5.5. JUPITER
Cassini will fly past Jupiter in December 2000, presenting the opportunity to ex-amine questions raised by earlier observations at similar wavelengths (the VoyagerUVS, the Galileo UVS and EUV, the IUE, the HUT, and the EUVE). The UVIScombination of sensitivity, resolution, wavelength coverage, imaging capability,and potential for extended synoptic coverage in many ways exceeds the sum ofthese earlier instruments.
5.5.1. Jupiter’s AuroraThe auroral spectrum consists of emissions from H2 and H showing the effects ofself-absorption by H2 and of absorption by CH4, C2H2, and perhaps C2H6. X-rayshave been detected (Waite et al., 1994), perhaps originating from the precipita-tion of heavy magnetospheric ions (Cravens et al., 1995; Gladstone et al., 1998).Information on the energy of the precipitating particles can be obtained from theabsorption features and the relative strengths of the Lyman series of H. Galileo andHST images have shown the auroral oval to be narrow (200 km) and structured, withvariable emissions from inside the oval in the dusk sector. System III longitudinaldependence is well studied.
5.5.2. Jupiter’s AirglowAirglow emissions from H, H2, and He have been detected (Shemansky, 1985;Feldman et al., 1993). They are all limb-darkened, as is the reflected solar continuumat 166 A. X-rays from an unknown excitation process have been measured at lowlatitudes (Gladstone et al., 1998). UVIS, with its superior resolution and its spectralcoverage, is well suited to throw light on the excitation and absorption mechanisms.It may also provide a resolution of the controversy surrounding the interpretationof the H2 emissions.
5.5.3. Io’s Plasma TorusDetailed observations of the torus’s radiant output (90% of which falls withinUVIS’s range), ion composition, electron temperature, and structure will providenew information on its energy budget to elucidate its energy sources. UVIS mayalso detect the O and S atoms escaping from the torus and the Jovian system. Figure24 compares a Galileo UVS/EUV spectrum at 35 to 40 A resolution with a modelof the UVIS EUV response to torus emission at 2.4 A resolution.
5.6. SUMMARY
The Cassini UVIS will bring to bear on the Saturn system considerably greatercapabilities than possessed by the Voyager and Galileo UVS/EUV instruments.The long time scale of the Cassini tour will provide opportunities for multiplespectral images and solar and stellar occultations. These will provide the data to

CASSINI ULTRAVIOLET IMAGING SPECTROGRAPH 341
Figure 24. Comparison of modeled UVIS spectrum of Io plasma torus with Galileo observation. Thepredicted UVIS spectrum at 2.4 A resolution obtains higher total signal counts in 1000 s than thoseobtained by the Galileo EUV instrument in 24 h, at a resolution of 40 A.
examine and explain the thermospheric energy balance and to elucidate the supplyof neutrals to Saturn’s unique magnetosphere.
6. Icy Satellite Surfaces and Exospheres
Saturn’s entourage of icy satellites is an important target for the Cassini mission.Most of what we know about Phoebe, Iapetus, Hyperion, Rhea, Dione, Tethys,Enceladus, Mimas, Janus, and Epimetheus (to name just the larger moons) datesfrom the Voyager mission. The distance of the flybys and limited capability of theVoyager ultraviolet spectrometer leave much for the Cassini UVIS to discover.
The moons of Saturn, whose orbits are within Titan’s orbit (except Hyperion, Ia-petus, and Phoebe), are embedded in Saturn’s magnetosphere. Composed primarilyof water ice, they are too small to retain the thick atmosphere of their large sibling,
342 L. W. ESPOSITO ET AL.
Titan. Their surfaces bear the signature, both in terms of radiation damage andevolved chemistry, of long exposure to Saturn’s charged particle environment. Newdiscoveries on the Galilean satellites of oxygen chemistry driven by charged-particlebombardment and UV photolysis of water ice are relevant to Saturn’s moons, also.Molecules sputtered from the icy satellite surfaces may form tenuous atmospheres,and they are a source of matter to Saturn’s magnetosphere.
With UVIS we will use the interaction between the satellite surface and itsmagnetospheric environs to study three key areas of icy satellite science: (1) sur-face age and evolution, (2) surface composition and chemistry, and (3) tenuousatmospheres/exospheres.
6.1. SURFACE AGE AND EVOLUTION
Voyager images suggest complex thermal and geologic histories: for example, clearregional differences in surface age are visible in the Voyager images of Enceladus.Enceladus is speculated to be the source of Saturn’s E ring, possibly implyingthe existence of some sort of geologic activity supplying particles. Intriguing low-resolution images of ‘wispy terrain’ on Rhea and Dione also suggest regional unitsthat have experienced very different thermal histories than are visible in high-resolution images of cratered regions of their surfaces (Smith et al., 1982). Our goalwith UVIS will be to establish the exposure history of surface units by measuringtheir UV albedo, thus addressing regional age.
Saturn’s icy satellites, which orbit within Saturn’s magnetosphere, experiencethe impact of energetic particles onto their surfaces; this bombardment can ejectatoms and molecules from the surfaces, affect surface microstructure, and causechemical alteration (e.g., Cheng et al., 1986; Johnson and Quickenden, 1997;Delitsy and Lane, 1998). Surface UV albedo is affected by radiation darkeningand surface chemistry and thus will vary with the amount of time; a unit has beenexposed to the magnetosphere’s radiation and high energy particles.
Leading-side versus trailing-side asymmetries are to be expected. Bound mag-netospheric plasma orbits faster than the satellites and thus impacts their surfaceon the trailing side. The leading sides of Dione and Rhea are indeed brighter thantheir trailing sides (Nelson and Lane, 1987).
The Galileo discovery at Jupiter that Ganymede certainly, and possibly Europaand Callisto, have internally generated fields and possess their own magnetospheres(Kivelson et al., 1997) is also relevant to our investigation of Saturn’s icy satellites. Amagnetosphere will protect the satellite surface from Saturn’s plasma bombardment.The structure of the satellite’s magnetosphere may affect the geographic distributionof radiation damage by focusing radiation along open field lines (Johnson, 1997).In this case, rather than being able to determine relative surface ages, we may beable to study the structure of the moon’s own magnetosphere.

CASSINI ULTRAVIOLET IMAGING SPECTROGRAPH 343
The fact that the orbits of Hyperion, Iapetus, and Phoebe are well outside Saturn’smagnetosphere, except when they are in the portion of their orbits that carries themthrough Saturn’s magnetotail, gives us the opportunity to compare surfaces withquite different exposure levels.
The Cassini UVIS will acquire full disk albedo maps of each of the Saturniansatellites and spatially resolved spectra for most of the satellites. We will assem-ble the albedo map from observations acquired every 15! of longitude and 10! oflatitude, resolution permitting, for each of the major moons. Three factors deter-mine exposure history: the existence of an internal magnetosphere, the structure ofthe Saturn magnetosphere (e.g., leading- vs. trailing side bombardment), and theamount of time a surface unit has been exposed (which depends on the geologichistory). In order to separate these causes, UVIS data maps will be correlated withimaging data to quantify the relationship between UV darkening and surface age.Cassini magnetometer data for close flybys may determine the existence of internalmagnetospheres. Disk-resolved UV spectra have been used quite successfully bythe Galileo Ultraviolet Spectrometer (UVS) Team to carry out similar investigations(Hendrix et al., 1998).
In addition to relative age, surface evolution can be investigated by lookingat surface microstructure via the phase function. Surface scattering propertiesare determined by the surface microstructure and large-scale roughness. Thephase function will be different depending on whether the surface is smooth orstructured at the scale of the wavelength being investigated, providing insight intothe evolution of the regolith. One fascinating Voyager result is that in spite of thevery different ages and appearance of different regions on Enceladus, the albedo,color, and photometric function properties are uniform, suggesting the possibilityof a thin, ubiquitous layer of geologically fresh frost (Buratti and Veverka, 1984;Veverka et al., 1986; Buratti, 1988).
Cassini will view Enceladus at ±0.01! phase angle, allowing us to measurethe opposition effect, which in turn yields surface porosity. We will acquire phasecurves for all of the Saturnian satellites, from 0! (Enceladus only) or 5! (most ofthe other satellites) to 160!.
6.2. SURFACE COMPOSITION AND CHEMISTRY
The bulk composition of the Saturnian satellites is predominantly water ice. Theirsurfaces are nearly pure water ice (Clark et al., 1984), but with enough composi-tional or morphological differences to cause their spectra and UV/IR color ratiosto be significantly different (Clark et al., 1986; Nelson and Lane, 1987) from eachother and from the Jovian and Uranian satellite families. In spite of these differ-ences, we use the Jovian satellites as predictors of phenomena we may expect tofind in the Saturnian system, adjusted for the colder temperatures.
Investigation of photolysis and radiolysis of water ice is currently a very activearea of research, propelled by recent Galileo results, earth-based observations,

344 L. W. ESPOSITO ET AL.
and laboratory work. UV radiation dissociates H2O into H and OH, and H2. H2,O, and O2 are produced from H and OH. H and H2 are quickly lost to thermalescape. The flux of atomic hydrogen escaping from Ganymede has been measuredby the Galileo UVS (Barth et al., 1997). O and O2 have been detected at Europaand Ganymede (Hall et al., 1995; Spencer et al., 1995; Calvin et al., 1996; Sauret al., 1998); thus, we might expect to detect these species at the Saturnian satellites.Reactions powered by solar UV ice photolysis have significant energy available butonly affect the top tens of monolayers of the satellite surface. Plasma bombardmentpenetrates deeper, and the products may stay in the solid surface long enoughto participate in other reactions, for example, providing the possibility for O2 toform O3. Spectral absorption suggestive of ozone has been detected by the GalileoUVS on Ganymede (Hendrix et al., 1999) and by the Hubble Space Telescope onGanymede, Rhea, and Dione (Noll et al., 1996b; Noll et al., 1997). Laboratoryresults are not entirely consistent with Galilean satellite observations, however(Vidal et al., 1997 and Baragiola and Bahr, 1998), so being able to compare oxygenchemistry at a variety of temperatures and radiation environments will help inunderstanding the processes.
Use of the ultraviolet portion of the spectrum for compositional studies of asurface is difficult, since few solids have features in the UV. If, however, componentatoms and molecules are sputtered or sublimated from the surface, vapor phasespectral features may be detectable. With UVIS, we will look in particular for thespectral signature of O, N, N2, and CO as indicators of CH4, acetylene, ammonia ice,and water ice-oxygen chemistry. An ammonia-water ice composition that wouldhave a lower melting point than pure water has been proposed to explain the younggeology on Enceladus (Stevenson, 1982; Squyres et al., 1983). UVIS compositionaldata may give us insight into whether endogenic or exogenic processes have beenresponsible for the state of the surfaces of Iapetus and Phoebe. Comparison ofcompositional differences from one Saturnian satellite to the next may provideadditional perspective on the formation of the Saturnian satellite system.
6.3. TENUOUS ATMOSPHERES AND EXOSPHERES
It is known that molecules are being sputtered from the surfaces of the Satur-nian satellites from the distribution of neutrals and ions in Saturn’s magnetosphere(Shemansky et al., 1993). It is possible that vapor pressure atmospheres of con-stituents more volatile than water ice exist. Regardless of how these tenuous at-mospheres are produced, they are more properly regarded as exospheres, since theatmospheric density is expected to be extremely low. In the following paragraphsatmosphere and exosphere are used interchangeably.
UVIS objectives are to address the following questions:
(1) Do Saturn’s icy satellites possess extremely tenuous atmospheres due to sput-tering or seasonal sublimation?

CASSINI ULTRAVIOLET IMAGING SPECTROGRAPH 345
(2) What is the composition of these atmospheres? Can we identify trace con-stituents in their vapor phase, which would support the hypothesis that thesatellites’ water ice surfaces contain some amount of methane clathrates orNH3 hydrate?
(3) Do we see any evidence of seasonal volatile transport? Can we detect andmeasure the flux of escaping atomic H produced by photolysis and sputteringof water ice?
(4) Can we identify (on Enceladus, in particular) evidence for transient or localizedvolatiles in the atmosphere associated with eruptive activity such as geysers?Are the constituents of these plumes particulate or gas?
We will employ three different observational techniques to address these ques-tions: limb drifts to search for scattered light, stellar occultations to detect atmo-spheric absorptions, and integrations on the night sides to see atmospheric emission.
Given the low surface temperatures of the Saturnian satellites, a vapor pressureequilibrium water atmosphere is not to be expected at detectable levels using limbdrifts. A sputtered water atmosphere may be detectable (see Cheng et al., 1986for an excellent description of sputtering- vs. sublimation-produced atmospheres).A primary goal is to search for more volatile trace constituents such as NH3 orCH4, implicated to exist in Saturnian satellite surface ices, or N2, the product ofphotolyzed NH3. On Titan, the temperature and pressure of the solar nebula atSaturn could have allowed as much as 15% NH3 or CH4 to be trapped in water iceas hydrates or clathrates during satellite formation (Lunine and Stevenson, 1985;Stevenson, 1991). Clathrates would end up primarily near the surface by subsequentdifferentiation of the satellite. Massive Titan, with its substantial gravity relativeto the icy satellites, is able to retain its volatiles as a substantial atmosphere. Withthe same source surface ices but the much lower gravitational fields of the icysatellites, we may find very much thinner atmospheres. Rough use of Raoult’s lawpredicts that N2 produced by photolysis of NH3 will be easily detectable by UVISat the surface ice temperatures of the Saturnian satellites, with CH4 almost as easilydetectable.
Stellar occultations provide a powerful technique for the study of planetaryatmospheres (e.g., Smith and Hunten, 1990). The Voyager UVS was able to placean upper limit on the surface pressure of a hypothetical Ganymede atmosphere of10#11 bar by observing the occultation of Kappa Centauri, a moderately bright UVstar (Broadfoot et al., 1979) and assuming that a 10% extinction of the starlightwould have been detectable by UVS. With the higher sensitivity of the CassiniUVIS instrument, and given adequate stellar occultation opportunities (i.e., startype, brightness), UVIS will be able to do at least as well at the Saturnian satellites.
The signature of oxygen emission excited by electron impact has been detected atEuropa (Hall et al., 1995) at 130.4 and 135.6 nm. Since we expect similar processesof photolysis and radiolysis of ice to produce O and O2 on Saturn’s other satellites,we will search their night sides for this airglow.

346 L. W. ESPOSITO ET AL.
7. Deuterium in the Saturn System
7.1. SCIENTIFIC BACKGROUND: THE SIGNIFICANCE OF D/H IN THE SOLAR
SYSTEM
Most (perhaps all) of the deuterium in the universe was produced shortly afterthe big bang, when temperatures were high enough to allow its formation. As deu-terium finds its way into stars, it is destroyed in the second step of the proton-protonchain (2
1H + 11H &3
2He + + ). This process, called astration, depletes the universeof deuterium as it cycles its way through star formation, astration, and interstellarinjection. As a consequence, the ratio of deuterium to hydrogen in the interstellarmedium (ISM) has been decreasing since the universe began and currently has avalue of 2 " 10#5 (McCullough, 1992). The mass difference between the two atomscauses different vibrational and rotational energies in H2 and D2 molecules, differ-ent diffusion rates, different thermodynamic characteristics, and slightly differentelectronic energies. For these reasons, the measurement and interpretation of theseisotopic effects yield important clues to understanding the processes involved inthe formation and evolution of the planets.
Measurements of the deuterium-to-hydrogen ratio (D/H) in the solar systemreveal two distinct reservoirs of deuterium, both of which are believed to predatethe solar system itself (Owen et al., 1986). The first reservoir is deuterium enrichedrelative to the second and includes the Earth, Mars, Uranus, Neptune, Titan, andcometary material. The second reservoir consists of Jupiter, Saturn, and the Sun.The general explanation for the differences in D/H between these two reservoirslies in the theory of their formation (Owen, 1994). During the formation of the solarsystem, the cold, deuterium-enriched (D/H ( 2 " 10#4) molecular clouds (Geissand Reeves, 1981) in the interstellar medium accreted to form the cores of the planetsand other solid bodies. These icy/rocky cores outgassed deuterium (generally in theform of deuterated methane) in a process that preserved the deuterium enrichment(Owen, 1994).
The D/H ratio of the second reservoir (Jupiter, Saturn, and the Sun,D/H ( 2 " 10#5) closely matches that of the interstellar medium and the solarnebula (Owen, 1994). If the cores of the accreting material became large enough,they captured gas from the solar nebula and assumed the corresponding D/H ratio.Because Jupiter and Saturn have a low ratio of core mass to total mass (around 0.03to 0.06 for Jupiter and 0.11 to 0.22 for Saturn (Owen, 1994)), they are believedto be primarily derived from the main reservoir of gas in the proto-solar nebula.Measurements of Jovian and Saturnian D/H support this theory.
To date, measurements of D/H in the atmospheres of the outer planets havebeen made by measuring deuterated molecules from Earth-based telescopes and bydirect measurements of Jupiter by the Galileo probe mass spectrometer (Mahaffyet al., 1998) (Table V). A comparison of Saturn hydrogen Lyman-! intensitiesfrom Voyager 1 and 2 with IUE measurements on nearly the same dates show a

CASSINI ULTRAVIOLET IMAGING SPECTROGRAPH 347
TABLE VD/H values and measurement techniques. The majority of these methods utilize deuterated moleculesfor the D/H measurement.
Location D/H value Method Spectral range Reference
Solar wind 2 " 10#5 He3 in situ (solar wind) a
Earth 1.6 " 10#4 Standard mean in situ bocean water (SMOW)
Interstellar 2 " 10#5 Absorption of stellar D and H 1216 A cmedium (ISM) Ly-! lines in the ISM
Interstellar >10#4 HCO+, HCN, H2O Thermal radio bclouds emission
Meteorites 1.6 " 10#4 Hydrated silicates in situ band organic material
Venus 2 "10#2 Pioneer Venus in situ dLNMS HDO 2.3 µm e
Mars 9 " 10#4 HDO 3.7 µm fJupiter 2 " 10#5 CH3D 1.55–1.95 µm g, h, n , r, s
HD, Galileo probe 6063.88 A,56 µm, in situ
Saturn 2 " 10#5 CH3D, HD 1.55–1.95 µm i, n, o56 µm
Uranus 9 " 10#5 CH3D 1.55–1.95 µm j, u5.5 " 10#5 HD 56 µm
Neptune 1.2 " 10#4 CH3D 1.55–1.95 µm k, u
6.5 " 10#5 HD 56 µmTitan 1.6 " 10#4 CH3D 1.55–1.95 µm l, p, q, t
1 " 10#4 8.7 µmHalley 2 " 10#4 HDO (Giotto NMS) in situ m
Note. (a) Geiss and Reeves, 1972, (b) Geiss and Reeves, 1981, (c) McCullough, 1992, (d) Donahueet al., 1982, (e) de Bergh et al., 1991, (f) Owen et al., 1988, (g) Beer and Taylor, 1978, (h) Smithet al., 1989, (i) Fink and Larson, 1978, (j) de Bergh, et al., 1986, (k) de Bergh, et al., 1990, (l) deBergh et al., 1988, (m) Eberhardt, et al., 1987, (n) Encrenaz et al., 1999, (o) Griffin et al., 1996, (p)Orton, 1992, (q) Coustenis et al., 2000, (r) Mahaffy et al., 1998, (s) Lellouch et al., 1997, (t) Taylorand Coustenis, 1998, (u) Feuchtgruber et al., 1999.
descrepancy of a factor of 2 (McGrath and Clarke, 1992). They note that this dis-crepancy may be due to an incorrect value for the interplanetary hydrogen density.These discrepancies, along with the limited Hubble Space Telescope (HST) timededicated to Saturn in the UV, make the observations of D/H at Saturn and Titanan important goal for the Cassini UVIS.
The first observations of the D/H ratio of Titan showed values considerablyhigher than those of Saturn (Table VI). Immediately, the question arose how
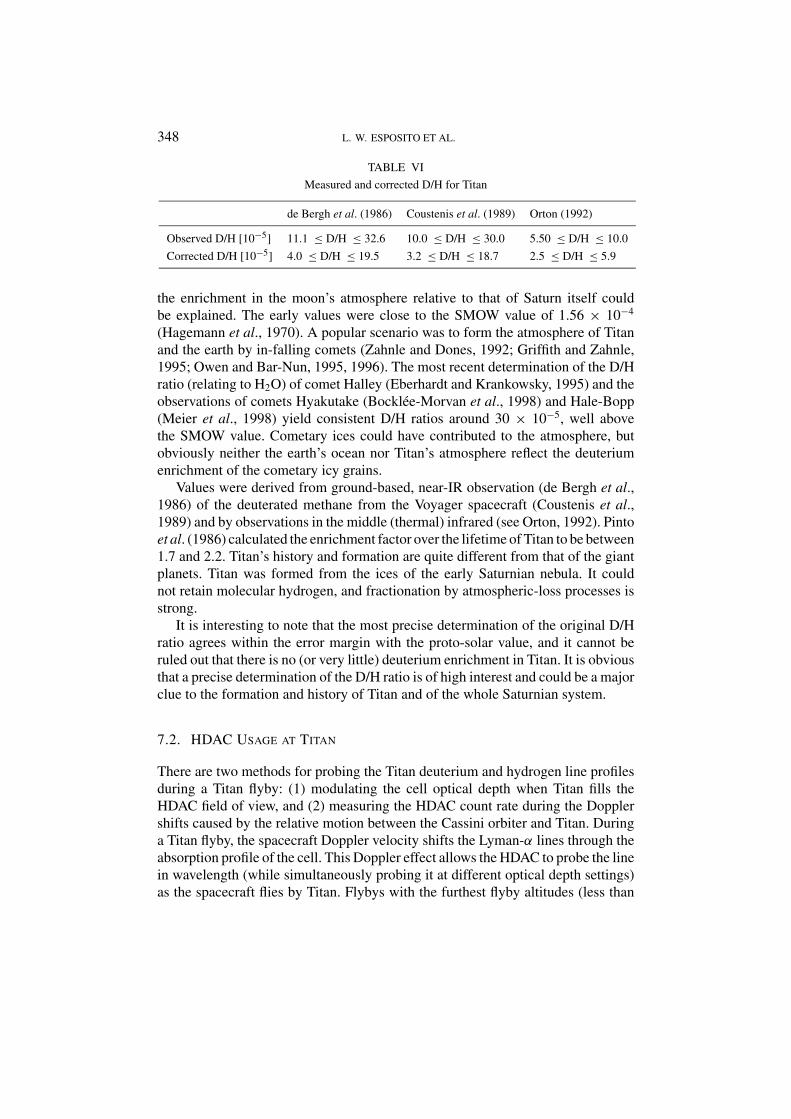
348 L. W. ESPOSITO ET AL.
TABLE VIMeasured and corrected D/H for Titan
de Bergh et al. (1986) Coustenis et al. (1989) Orton (1992)
Observed D/H [10#5] 11.1 ) D/H ) 32.6 10.0 ) D/H ) 30.0 5.50 ) D/H ) 10.0
Corrected D/H [10#5] 4.0 ) D/H ) 19.5 3.2 ) D/H ) 18.7 2.5 ) D/H ) 5.9
the enrichment in the moon’s atmosphere relative to that of Saturn itself couldbe explained. The early values were close to the SMOW value of 1.56 " 10#4
(Hagemann et al., 1970). A popular scenario was to form the atmosphere of Titanand the earth by in-falling comets (Zahnle and Dones, 1992; Griffith and Zahnle,1995; Owen and Bar-Nun, 1995, 1996). The most recent determination of the D/Hratio (relating to H2O) of comet Halley (Eberhardt and Krankowsky, 1995) and theobservations of comets Hyakutake (Bocklee-Morvan et al., 1998) and Hale-Bopp(Meier et al., 1998) yield consistent D/H ratios around 30 " 10#5, well abovethe SMOW value. Cometary ices could have contributed to the atmosphere, butobviously neither the earth’s ocean nor Titan’s atmosphere reflect the deuteriumenrichment of the cometary icy grains.
Values were derived from ground-based, near-IR observation (de Bergh et al.,1986) of the deuterated methane from the Voyager spacecraft (Coustenis et al.,1989) and by observations in the middle (thermal) infrared (see Orton, 1992). Pintoet al. (1986) calculated the enrichment factor over the lifetime of Titan to be between1.7 and 2.2. Titan’s history and formation are quite different from that of the giantplanets. Titan was formed from the ices of the early Saturnian nebula. It couldnot retain molecular hydrogen, and fractionation by atmospheric-loss processes isstrong.
It is interesting to note that the most precise determination of the original D/Hratio agrees within the error margin with the proto-solar value, and it cannot beruled out that there is no (or very little) deuterium enrichment in Titan. It is obviousthat a precise determination of the D/H ratio is of high interest and could be a majorclue to the formation and history of Titan and of the whole Saturnian system.
7.2. HDAC USAGE AT TITAN
There are two methods for probing the Titan deuterium and hydrogen line profilesduring a Titan flyby: (1) modulating the cell optical depth when Titan fills theHDAC field of view, and (2) measuring the HDAC count rate during the Dopplershifts caused by the relative motion between the Cassini orbiter and Titan. Duringa Titan flyby, the spacecraft Doppler velocity shifts the Lyman-! lines through theabsorption profile of the cell. This Doppler effect allows the HDAC to probe the linein wavelength (while simultaneously probing it at different optical depth settings)as the spacecraft flies by Titan. Flybys with the furthest flyby altitudes (less than

CASSINI ULTRAVIOLET IMAGING SPECTROGRAPH 349
90,000 km, the point at which Titan begins to fill the HDAC field of view), are bestfor HDAC observations because these flybys allow the spacecraft to spend moretime near 0 km/s Doppler velocity (where the HDAC absorbs most efficiently).
7.3. LYMAN-! OBSERVATIONS AT SATURN
All measurements of HDAC include observations of the normal atomic hydrogen,either in photometer mode where the total brightness is registered, or with theabsorption switched on when the Lyman-! emission line profile is scanned. Boththe variation of the optical depth within the cell or the change in radial velocitycomponent relative to the emitting atoms (or a combination of both methods) willyield information on the emission-line profiles and hence on the temperature andvelocity distribution of the hydrogen atoms in the Saturn upper atmosphere.
7.4. INTERPLANETARY/INTERSTELLAR HYDROGEN
The solar system is moving through interstellar gas at about 20 km s#1, and neutralhydrogen sweeps through the planetary system as interstellar wind. The sun ionizeshydrogen atoms by its EUV radiation and by charge-exchange with the solar wind.The solar emission in the resonance line at Lyman-! exerts a strong radiation pres-sure force that approximately balances solar gravity. The flow of hydrogen atomscauses an asymmetry of the (interstellar) hydrogen atom density and distributionin the inner planetary system. Lyman-! observations show that the strongest con-tributions upstream come from a distance of about 5 AU, while downstream thecavity extends to about 20 AU. The variation of solar-wind flux and speed withheliocentric latitude studied in detail by SOHO (Bertaux et al., 1997) leads to de-viation from the cylinder symmetry. These effects can be most easily observed ata distance of about 10 AU, the heliocentric distance of Saturn (Lallement et al.,1995).
The density and velocity distribution (temperature) of interstellar hydrogen areinfluenced by the interaction with the Sun and its radiation. The solar wind expandsinto the interstellar plasma until its pressure is balanced by the plasma pressureand interstellar magnetic field defining the heliospheric boundary at around 200AU. When the interstellar protons try to cross this boundary, they are slowed down,compressed in their density, and heated at the same time (Wallis and Ong, 1975).These processes influence the velocity and density distribution of the hydrogenatoms passing through the inner solar system.
Observations of interplanetary Lyman-! emission have two goals: (1) to de-termine the physical parameters of the interstellar hydrogen, such as its density,flow velocity, and temperature, and (2) to learn about the properties of the solarwind, such as its latitudinal dependence of its flux and speed, as well as its EUVemission. Elaborate models of the interaction predict the brightness distribution

350 L. W. ESPOSITO ET AL.
of interplanetary Lyman-! as a function of the looking direction and position ofthe observer. A multitude of parameters and their variation with solar cycle can bederived if the observational set is extensive enough. A recent example is providedby the UV spectrometer onboard the Galileo spacecraft (Ajello et al., 1994).
The HDAC can take advantage of a common spacecraft mode in which theCassini spacecraft slowly rotates during cruise and at Saturn during periods whendata are transmitted to earth. These observations will map the Lyman-! brightnessconsistently over many years. In addition, the absorption of the hydrogen cell canbe used to scan through the emission-line profile whenever the radial velocitycomponent of the atoms along the line of sight relative to the Cassini spacecraft isnear zero.
7.5. SUMMARY
Information about the D/H and hydrogen line shapes will be extracted from a col-lection of HDAC count rates at the various optical depths, Doppler velocities, andviewing geometries. These results will provide a comparison to the infrared mea-surements from ISO and SIRTF for Titan, a key piece of information for theoriesof the origin and evolution of the Saturn system, the Saturn Lyman-! line shape,and the emissions from the local interstellar medium. Long-term observations andappropriate modeling will allow us to determine the Lyman-! background signalwith good accuracy. This is essential in order to measure the foreground contri-butions of features within the Saturnian system (e.g., Titan’s exosphere and torus)with confidence.
8. UVIS Ring Observations
Planetary rings, which just two decades ago were thought unique to the planetSaturn, have now been observed around all the giant planets (for a recent re-view, see Esposito, 1993). These rings are composed of many particles with abroad range in size. The observed rings systems are quite diverse. Jupiter’s ringis optically thin and composed of dustlike small particles (Showalter et al., 1987).Saturn’s rings are broad, bright, and opaque (Cuzzi et al., 1984; Esposito et al.,1984). Uranus has narrow, dark rings among broad lanes of dust that are invis-ible from Earth (French et al., 1991; Esposito et al., 1991). Neptune’s rings in-clude incomplete arcs restricted to a small range of the circumference (Porco etal., 1995). All rings lie predominantly within their planet’s Roche limit, wheretidal forces would destroy a self-gravitating body (Nicholson and Dones, 1991).They are also within the planet’s magnetosphere, and in the case of Uranus, theyare within the upper reaches of the planetary atmosphere. Saturn’s rings are thelargest of any planet’s, and show all the diverse phenomena seen in other ringsystems.

CASSINI ULTRAVIOLET IMAGING SPECTROGRAPH 351
8.1. VOYAGER RESULTS AND CASSINI CAPABILITIES
Voyager 1 and 2 made the closest investigations of Saturn’s rings in 1980 and 1981.These missions provided images, spectra, and radio and stellar occultations as wellas information on the ring environment. Reviews are provided by Cuzzi et al. (1984)and Esposito et al. (1984). The radio occultation, stellar occultation, and sequencesof images each provided complete radial coverage of the ring system (Figure 25).Conversely, the azimuthal coverage is more sketchy. As to temporal coverage, thedata encompass only a few weeks around each encounter, with the best resolutiondata for each from a period of less than a day. The images are all from the VoyagerReticon cameras: the spectral sensitivity of their silicon detectors explains why wehave no pictures in the UV or IR. This information is now supplemented by datafrom the ground, HST, and IUE, which all lack the radial, azimuthal, and temporalresolution provided briefly by the spacecraft encounters. A new data set from thespectacular 1995 ring-plane crossing (see Nicholson et al., 1996; Showalter, 1997)provides information on the more transparent rings. The thickest parts of Saturn’srings were not penetrated by either the radio or stellar occultations.
The Cassini mission provides the opportunity to measure the rings at high res-olution in the radial, azimuthal, and vertical dimensions over a period of 4 years.
Figure 25. Saturn’s rings from the Voyager 2 PPS , Scorpii stellar occultation showing ring radialstructure (Esposito et al., 1983a).

352 L. W. ESPOSITO ET AL.
Observations of the ring environment, magnetosphere, and small nearby satelliteswill determine the interactions of the various parts of the Saturn system with itsrings. The UVIS experiment has the capability for imaging, spectroscopy, and highspeed photometry that can contribute to these scientific objectives.
8.2. RING STRUCTURE
Figure 26 shows observations of density waves in Saturn’s rings from the Voy-ager PPS occultation (Esposito et al., 1983a,b). These features are but one ofa number of dynamic phenomena evident in the ring radial profile. The UVISHigh Speed Photometer (HSP) channel has been optimized to follow up onthe Voyager investigations. The HSP field of view is 6 mrad " 6 mrad, largeenough that no brightness modulations are expected from pointing variations.The CsI photocathode is essentially solar-blind, allowing high signal-to-noiseoccultations of both sunlit and shadowed rings. The HSP is bore-sighted withthe spectroscopic channels, allowing concurrent spectroscopy of the transmittedstarlight from 91 to 190 nm. Simultaneously, we can obtain a long slit image
Figure 26. Density waves seen in the PPS occultation (Esposito et al., 1983b). Compare the resolutionwith Figure 25.

CASSINI ULTRAVIOLET IMAGING SPECTROGRAPH 353
of the occultation point up to a distance ±30 mrad, allowing the observationof diffracted light in the stellar aureole. The time resolution of 2 ms can givespatial resolution of 20 m or better on the rings, comparable to the diffractionlimit.
The large mirror and amplifiers in the HSP allow very high counting rates. Weexpect 2000 counts in 2 ms for the occultation star , Sco. This compares to theVoyager PPS observation of , Sco of 39 counts every 10 ms (Esposito et al.,1983a). Thus the Cassini UVIS HSP can probe structures five times narrower thanVoyager, with 50 times the signal in each integration period. This high sensitivityand resolution will be used to probe wakes, waves, and ring edges.
Occultation tracks at multiple ring longitudes will likely reveal azimuthal asym-metries in the rings, as was seen by the Voyager PPS at Uranus (Colwell et al.,1990) and ground-based stellar occultation observations of Neptune’s rings (Elliotet al., 1985; Covault et al., 1986; French et al., 1993). These asymmetries mayprovide clues to the origin of the ring features and imply the presence of nearbyperturbing satellites. These data will be used to constrain physical models of theirorigin and evolution.
Radial optical depth profiles will be generated from stellar occultation measure-ments (Colwell and Esposito, 1990a,b). Accurate absolute determinations of thelocations of edges, gaps, and wave features in the data will allow the identificationof new ring-satellite resonances, and quite possibly the indirect detection of new,small satellites within the ring system (e.g., Horn et al., 1990). Such satellites arelinked to the evolution and the origin of the rings. Their number and distributionwithin the rings will help constrain theories of ring origin (Colwell, 1994; Sicardyand Lissauer, 1992).
During HSP observations of stellar occultations, the UVIS Far Ultraviolet chan-nel (FUV) will measure ring background brightness. These measurements willalso provide information on the size distribution of small (micrometer-sized) dustparticles in the rings during occultations by the shadowed rings. Dust in Saturn’srings will produce a diffraction aureole detectable by the FUV channel of UVIS.This diffraction signature is sensitive to the characteristic dust particle size. Sizedistributions based on different physical models of the creation, transport, and de-struction of dust will be tested against the observations. The abundance, size, anddistribution of dust in the rings are useful diagnostics for the size distribution, ve-locity distribution, and surface properties of the larger ring particles, which actas sources and sinks of dust in the rings (Colwell and Esposito, 1990a,b). Dataon these larger particles will be obtained from stellar occultations and combiningUVIS reflectance data with images from the Cassini Imaging Science Subsys-tem (ISS) and Visual and Infrared Mapping Spectrometer (VIMS). The FUV datawill also be used to determine the magnitude of the ring background signal to beremoved from the HSP occultation data. Figures 27 and 28 show the multitudeof available opportunities and the progress of a stellar occultation from Cassinitour T18-5.

354 L. W. ESPOSITO ET AL.
Figure 27. Numerous ring stellar occultation opportunities are shown with CASPER (Cassini Se-quence Planner) software in this near-polar view of Saturn and its ring system. Plus symbols indicatestars; larger symbols are brighter stars. The stippled region indicates Saturn’s shadow. The sub-spacecraft point is indicated by a cross on the planet.
8.3. UVIS IMAGES
During remote-sensing ring observations, UVIS will slew its slit to make im-ages of the rings. At a range of 106 km, the UVIS resolution of 1 mrad givesa picture element of 1000 km width. Typical images will be 64 elements tall(along the slit), with the image width determined by the total slew duration.Because UVIS has the shortest wavelength of any of the remote sensing instru-ments, it will be more sensitive to the smallest particles in the rings, with sizesas small as 0.01 to 0.1µ. The images at different UV wavelengths can be com-pared to camera images to determine the dust contribution and extend the sizedistribution. The ring ‘spokes’ are one natural target. By combining the UV ob-servations with CIRS spectra, ISS, VIMS images, and radio occultations, thesize distribution of the ring particles can be measured from submicron to metersizes.

CASSINI ULTRAVIOLET IMAGING SPECTROGRAPH 355
Figure 28. The star ! Cen is occulted by the shadowed rings of Saturn. The FUV occultation slitand the HSP aperture are shown around the star.
8.4. RING COMPOSITION
The reflectance spectrum of Saturn’s rings from IUE and Voyager clearly showsthe water absorption edge at 1650 A. We will map the depth and wavelength ofthis feature across the rings to determine compositional and age variations. Atwavelengths of 1800 to 2000 A, water ice is transparent, and the non-icy ringcomponent may be studied.
During systematic spectroscopy of the Saturn system, UVIS will map theemissions from neutral hydrogen (1216 A) and oxygen (1304 A and 1356A). Emissions near the rings will define the ring atmosphere (Broadfootet al., 1981; Hall, 1996) and the interactions of the ring with its local en-vironment. This will constrain the long-term evolution of the ring particles.UVIS will also measure remotely a number of magnetospheric constituents(particularly H, O, N, and D) that will define the broader ring-magnetosphereinteractions.

356 L. W. ESPOSITO ET AL.
8.5. RING HISTORY
The UVIS and the other remote-sensing and in situ Cassini experiments will providea rich data set on the current state of the rings and their present interactions withother parts of the Saturn system.
A comprehensive model of the origin and large-scale evolution of Saturn’srings will be developed based on the ensemble of Cassini observations at Saturn.Crater statistics on the larger satellites and the anticipated discovery of smallerring moons will allow development of an accurate model of the time-dependentinterplanetary impacting flux at intermediate and large sizes. This flux, whencombined with theoretical and experimental results on catastrophic fragmentation,drives the global evolution of the ring system. Disruption of satellites or ‘rubblepiles’ creates new ring particles. These then undergo orbital evolution, influencedby gravitational perturbations from other satellites, and partial accretion (Canupand Esposito, 1995). Dust is produced within the ring from interparticle collisionsand micrometeoroid bombardment. These processes can be combined into a singleglobal Markov chain simulation of the ring system (Colwell and Esposito, 1993)for time scales of the age of the solar system. Monte Carlo simulations can beconducted using the same transition probabilities in order to create simulatedhistories of the rings system for direct comparison with Cassini observations.
Variations of the abundance of dust between different ring features will provideadditional information on ring particle characteristics, including collision veloci-ties and regolith properties. Dynamically active regions may exhibit different dustabundances than quiescent regions in the rings. Features such as arcs, kinks, braids,and other azimuthal asymmetries may indicate a mode of origin from satellite dis-ruption or complex gravitational interactions with nearby satellites. The distributionof small moons, their resonances, and density waves and gaps within the rings willbe used to characterize the large-scale transport of angular momentum through thesystem for use in global evolution models of the rings.
8.6. SUMMARY
The UVIS ring studies will provide (1) a comprehensive study of features inSaturn’s rings, including their dynamical links to embedded satellites, (2) adetermination of the abundance and size distribution of dust within the rings asa function of location within the rings, (3) modeling of ring processes and systeminteractions at short time scales, and (8) models of the global evolution of the ringsover the age of the solar system.
9. Conclusions
The UVIS investigation aboard the Cassini orbiter will provide key new informationon the chemistry of the Titan and Saturn atmospheres; their clouds and aerosols;

CASSINI ULTRAVIOLET IMAGING SPECTROGRAPH 357
exospheres, thermospheres, and magnetospheres in the Saturn system; satellitesurfaces and atmospheres; Titan’s atomic D/H ratio; and the physics and historyof rings. These results are enabled by the spectroscopic and imaging capabilitiesof UVIS, the long-time coverage allowed by the Cassini orbit, stellar and solaroccultations, multiple phase angles, close-up maps, limb scans, and synergisticinvestigations with other Cassini experiments.
Acknowledgement
This work was supported by the National Aeronautics and Space Administrationunder JPL Contract 961196. The Hydrogen Deuterium Absorption Cell (HDAC)was designed and constructed with support from the Max-Planck-Gesellschaft zurFoerderung der Wissenschaften. Grants were received from the DLR under FKZ50 OH 9201 7. The authors thank Sushil Atreya and an anonymous reviewer fortheir helpful comments.
References
Ajello, J. M., Pryor, W. R., Barth, C. A., Hord, C. W., Stewart, A. I. F., Simmons, K. E., et al.: 1994,Astron. Astrophys. 289, 283.
Atreya, S. K.: 1982, Plan. Space Sci. 30, 849.Atreya, S. K., Donahue, T. M., and Kuhn, W. R.: 1978, Science 201, 611.Atreya, S. K., Waite, J. H., Jr., Donahue, T. M., Nagy, A. F., and McConnell, J. C.: 1988, ‘Theory,
measurements, and models of the upper atmosphere and ionosphere of Saturn’, in Gehrels, T. andMatthews, M. S. (eds.), Saturn, University of Arizona Press, Tucson, p. 239.
Atreya, S. K., Wong, M. H., Owen, T. C., Mahaffy, P. R., Niemann, H. B., de Pater, I., et al.: 1999,Planet. Space Sci. 47, 1243.
Babichenko, S. I., Deregusov, E. V., Kurt, V. G., Romanova, N. N., Skljankin, V. A., Smirnov, A. S.,et al.: 1977, Space Sci. Instr. 3, 271.
Baragiola, R. A. and Bahr, D. A.: 1998, J. Geophys. Res. 103, 25865.Bar-Nun, A., Kleinfeld, I., and Ganor, E.: 1988, J. Geophys. Res. (Atmospheres) 93, 8383.Barth, C. A., Hord, C. W., Stewart, A. I. F., Pryor, W. R., Simmons, K. E., McClintock, W. E., Ajello,
J. M., Naviaux, K. L., and Aiello, J. J.: 1997, Geophys. Res. Lett. 24, 2147.Bertaux, J. L.: 1977, Nature 270, 156.Bertaux, J. L.: 1978, Planet. Space Sci. 26, 431.Bertaux, J. L., Blamont, J. E., Lepine, V. M., Kurt, V. G., Romanova, N. N., and Smirnov, A. S.: 1978,
Planet. Space Sci. 26, 817.Bertaux, J. L., Goutail, F., Dimarellis, E., Kockarts, G., and Van Ransbeeck, E.: 1984, Nature 309, 771.Bertaux, J. L., Quemerais, E., Lallement, R., Kyrola, E., Schmidt, W., Summanen, T., Goutail, J. P.,
et al.: 1997, Solar Phys. 175, 737.Bockelee-Morvan, D., Gautier, D., Lis, D. C., Young, K., Keene, J., Phillips, T. G., et al.: 1998,
Icarus 133, 147.Broadfoot, A. L., Belton, M. J. S., Takacs, P. Z., Sandel, B. R., Shemansky, D. E., Holberg, J. B., et
al.: 1979, Science 204, 979.Broadfoot, A. L., Sandel, B. R., Shemansky, D. E., Holberg, J. B., Smith, G. R., Strobel, D. F., et al.:
1981, Science 212, 206.Buratti, B. J.: 1988, Icarus 75, 113.
358 L. W. ESPOSITO ET AL.
Buratti, B. and Veverka, J.: 1984, Icarus 58, 254.Cabane, M., Rannou, P., Chassefiere, E., and Israel, G.: 1993, Planet. Space Sci. 41, 257.Calvin, W. M., Johnson, R. E., and Spencer, J. R.: 1996, Geophys. Res. Lett. 23, 673.Canup, R. M. and Esposito, L. W.: 1995, Icarus 113, 331.Chassefiere, E. and Cabane, M.: 1995, Planet. Space Sci. 43, 91.Cheng, A. F., Haff, P. K., Johnson, R. E., and Lanzerotti, L. J.: 1986, ‘Interactions of planetary
magnetospheres with icy satellite surfaces’, in Burns, J. A., and Matthews, M. S. (eds.), Satellites,University of Arizona Press, Tucson, p. 403.
Clark, R. N., Brown, R. H., Owensby, P. D., and Steele, A.: 1984, Icarus 58, 265.Clark, R. N., Fanale, F. P., and Gaffey, M. J.: 1986, ‘Surface composition of natural satellites’, in
Burns, J. A., and Matthews, M. S. (eds.), Satellites, Univ. Ariz. Press, Tucson, p. 437.Clarke, D. W. and Ferris, J. P.: 1997,Icarus 127, 158.Colwell, J. E.: 1994, Planet. Space Sci. 42, 1139.Colwell, J. E. and Esposito, L. W.: 1990a, Icarus 86, 530.Colwell, J. E. and Esposito, L. W.: 1990b, J. Geophys. Res. 17, 1741.Colwell, J. E. and Esposito, L. W.: 1993, J. Geophys. Res. (Planets) 98, 7387.Colwell, J. E., Horn, L. J., Lane, A. L., Esposito, L. W., Yanamandra-Fisher, P. A., Pilorz, S. H., et
al.: 1990, Icarus 83, 102.Coustenis, A.: 1992, ‘Titan’s atmosphere: Latitudinal variations in temperature and composition’, in
Symposium on Titan, Conf. Proc. ESA, SP 338, 53.Coustenis, A., and Bezard, B.: 1995, Icarus 115, 126.Coustenis, A., Bezard, B., and Gautier, D.: 1989, Icarus 80, 54.Coustenis, A., Bezard, B., Gautier, D., Marten, A., and Samuelson, R.: 1991, Icarus 89, 152.Covault, C. E., Glass, I. S., French, R. G., and Elliot, J. L.: 1986, Icarus 67, 126.Cravens, T. E., Howell, E., Waite, J. H., and Gladstone, G. R.: 1995, J. Geophys. Res. 100, 17153.Cuzzi, J. N., Lissauer, J. J., Esposito, L. W., Holberg, J. B., Marouf, E. A., Tyler, G. L., et al.: 1984,
‘Saturn’s rings: Properties and processes’, in Greenberg, R. and Brahic, A. (eds.), PlanetaryRings, University of Arizona Press, Tucson, p. 73.
de Bergh, C., Bezard, B., Owen, T., Crisp, D., Maillard, J. P., and Lutz, B. L.: 1991, Science 251,547.
de Bergh, C., Lutz, B. L., Owen, T., Brault, J., and Chauville, J.: 1986, Astrophys. J. 311, 501.de Bergh, C., Lutz, B. L., Owen, T., and Chauville, J.: 1988, Astrophys. J. 329, 951.de Bergh, C., Lutz, B. L., Owen, T., and Maillard, J. P.: 1990, Astrophys. J. 355, 661.Degraauw, T., Feuchtgruber, H., Bezard, B., Drossart, P., and Encrenaz, T.: 1997, Astron. Astrophys.
321, L-13.Delitsy, M. L., and Lane, A. L.: 1998, J Geophys. Res. 103, 31391.Dessler, A. J.: 1981, Planet. Space Sci. 29, 215.Devanssay, E., Gazeau, M. C., Guillemin, J. C., and Raulin, F.: 1995, Planet. Space Sci. 43, 25.Donahue, T. M., Hoffman, J. H., Hodges, R. R., Jr., and Watson, A. J.: 1982, Science 216, 712.Eberhardt, P., Dolder, U., Schutte, W., Krankowsky, D., Lammerzahl, P., Hoffman, J. H., et al.: 1987,
Astron. Astrophys. 187, 435.Eberhardt, P., and Krankowsky, D.: 1995, Astron. Astrophys. 295, 795.Elliot, J. L., Baron, R. L., Dunham, E. D., French, R. G., and Meech, K. J.: 1985, Astron. J. 90,
2615.Encrenaz, T., Drossart, P., Feuchtgruber, H., Lellouch, E., Bezard, B., Fouchet, T., et al.: 1999,
Planet. Space Sci. 47, 1223–1240.Esposito, L. W.: 1993, Ann. Rev. Earth Planet. Sci. 21, 487.Esposito, L. W., Brahic, A., Burns, J. A., and Marouf, E. A.: 1991, ‘Particle properties and processes
in uranus’ rings’, in Bergstralh, J. T., Miner, E. D., and Matthews, M. S. (eds.), Uranus, Universityof Arizona Press, Tucson, p. 410.

CASSINI ULTRAVIOLET IMAGING SPECTROGRAPH 359
Esposito, L. W., Cuzzi, J. N., Holberg, J. B., Marouf, E. A., Tyler, G. L., and Porco, C. C.: 1984,‘Saturn’s rings: Structure, dynamics and particle properties’, in Gehrels, T. and Matthews, M. S.(eds.), Saturn, University of Arizona Press, Tucson, p. 463.
Esposito, L. W., O’Callaghan, M., Simmons, K. E., Hord, C. W., West, R. A., Lane, A. L., et al.:1983a, J. Geophys. Res. 88, 8643.
Esposito, L. W., O’Callaghan, M., and West, R. A.: 1983b, Icarus 56, 439.Feldman, P. D., McGrath, M. A., Moos, H. W., Durrance, S. T., Strobel, D. F., and Davidsen, A. F.:
1993, Astrophys. J., 406, 279.Festou, M. C. and Atreya, S. K.: 1982, Geophys. Res. Lett. 9, 1147.Feuchtgruber, H., Lellouch, E., Bezard, B., Encrenaz, T., deGraauw, T., and Davis, G.: 1999, Astron.
Astrophys. 341, L17–L21.Fink, U. and Larson, H. P.: 1978, Science 201, 343.French, R. G., Maeue, S., Mason, E. C., McGhee, C. A., Nicholson, P. D., Matthews, K., and Roques,
F.: 1993, Bull. Amer. Astron. Soc. 25, 1110.French, R. G., Nicholson, P. D., Porco, C. C., and Marouf, E. A.: 1991, ‘Dynamics and structure
of the uranian rings’, in Bergstralh, J. T., Miner, E. D., and Matthews, M. S. (eds.), Uranus,University of Arizona Press, Tucson, p. 327.
Geiss, J. and Reeves, H.: 1972, Astron. Astrophys. 18, 126.Geiss, J. and Reeves, H.: 1981, Astron. Astrophys. 93, 189.Gladstone, G. R., Allen, M., and Yung, Y. L.: 1996, Icarus 119, 1.Gladstone, G. R., Waite, J. H., and Lewis, W. S.: 1998, J. Geophys. Res. 103, 20083.Griffin, M. J., Naylor, D. A., Davis, G. R., Ade, P. A. R., Oldham, P. G., Swinyard, B. M., et al.:
1996, Astron. Astrophys. 315, L389–L392.Griffith, C. A. and Zahnle, K. Z.: 1995., J. Geophys. Res. 100, 16,907.Gurwell, M. A. and Muhleman, D. O.: 1995, Icarus 117, 375.Hagemann, R., Nief, G., and Roth, E.: 1970, Tellus 22, 712.Hall, D. T.: 1996, Science 272, 516.Hall, D. T., Shemansky, D. E. and Tripp, T. M.: 1992, ‘A reanalysis of Voyager UVS observations
of Titan’, in Symposium on Titan, Conf. Proc. ESA, SP-338, p. 69.Hall, D. T., Strobel, D. F., Feldmann, P. D., McGrath, M. A. and Weaver, H. A.: 1995, Nature 373,
677.Hendrix, A. R., Barth, C. A., and Hord, C. W.: 1999, J. Geophys. Res. (Planets) 104, 14169.Hendrix, A. R., Barth, C. A., Hord, C. W., and Lane, A. L.: 1998,Icarus 135, 79.Hidayat, T., Marten, A., Bezard, B., Gautier, D., Owen, T., Matthews, H. E., et al.: 1997, Icarus 126,
170.Horn, L. J., Yanamandra-Fisher, P. A., and Esposito, L. W.: 1990, Icarus 76, 485.Jaffel, L. B., V’eronique, L., and Sandel, B. R.: 1995, Science 269, 951.Johnson, R. E.: 1997, Icarus 128, 469.Johnson, R. E., and Quickenden, T. I.: 1997, J. Geophys. Res. (Planets) 102, 10985.Karkoschka, E., and Lorenz, R. D.: 1997, Icarus 125, 369.Kawahara, T.: 1994, ‘A Study on Hydrogen/Deuterium Absorption Cell Technique for Spacecraft
Observations of Planetary Atmospheres’, Ph.D. dissertation, Tohoku University, Japan.Kawahara, T., Okano, S., Abe, T., and Fukunishi, H.: 1993, Tohoku Geophys. J. Sci. Rep., ser. 51, 34, 35.Khare, B. N., Sagan, C., Arakawa, E. T., Suits, F., Callcott, T. A., and Williams, M. W.: 1984, Icarus
60, 127.Kivelson, M. G., Warnecke, J., Bennett, L., Joy, S., Khurana, K. K., Linker, J. A., et al.: 1997, J.
Geophys. Res. (Planets) 103, 19963.Lallement, R., Kyroelae, E., and Summanen, T.: 1995, Space Sci. Rev. 72, 455.Lane, A. L., Hord, C. W., West, R. A., Esposito, L. W., Coffeen, D. L., Sato, M., et al.: 1982, Science
215, 537.
360 L. W. ESPOSITO ET AL.
Lara, L. M., Lellouch, E., Lopezmoreno, J. J., and Rodrigo, R.: 1996, J. Geophys. Res. 101, 23261.Lawrence, G. M. and McClintock, W. E.: 1996, Proc. SPIE 2831, 104.Lellouch, E., Feuchtgruber, H., de Graauw, T., Encrenaz, T., Bezard, B., and Griffin, M.: 1997,
‘Deuterium and oxygen in the giant planets’, in Kessler, M (ed.), Proceedings of the First ISOWorkshop on Analytical Spectroscopy, ESA SP-419, Madrid, 6–8 October, p. 131.
Lemmon, M. T.: 1994, Ph.D. dissertation, University of Arizona, Tucson.Lunine J. I. and Stevenson, D. J.: 1985, Astrophys. J. Supp. Ser. 58, 493.Lutz, B. L., de Bergh, C., and Owen, T.: 1983, Icarus 220, 1274.Mahaffy, P. R., Donahue, T. M., Atreya, S. K., Owen, T. C., and Niemann, H. B.: 1998, Space Sci.
Rev. 84, 251.Maki, J. N.: 1996, ‘The hydrogen deuterium absorption cell on the sCassini spacecraft: A remote
sensing instrument for atomic D/H measurements on Saturn and Titan’, Ph.D. dissertation,University of Colorado, Boulder.
Marten, A., Gautier, D., Tanguy, L., Lecacheux, A., Rosolen, C., and Paubert, G.: 1988, Icarus 76, 558.McClintock, W. E., Lawrence, G. M., Kohnert, R. A., and Esposito, L. W.: 1992, Proc. SPIE 1745, 26.McClintock, W. E., Lawrence, G. M., Kohnert, R. A., and Esposito, L. W: 1993, Opt. Eng. 32, 3038.McCullough, P.: 1992, Astrophys. J. 390, 213.McGrath, M. and Clarke, J. T.: 1992, J. Geophys. Res. 97 (A9), 13691.McGrath, M. A., Courtin, R., Smith, T. E., Feldman, P. D., and Strobel, D. F.: 1998, Icarus 131, 382.McKay, C. P.: 1996, Planet. Space Sci. 44, 741.Meier, R., Owen, T. C., Matthews, H. E., Jewitt, D. C., Bockelee-Morvan, D., Biver, N., et al.: 1998,
Science 279, 842.Morton, D., and Purcell, J.: 1961, ‘Rocket Observations of Lyman-! in the Night Sky’, Report of
NRL Progress, June 1961.Moses, J. I., Bezard, B., Lellouch, E., Gladstone, G. R., Feuchtgruber, H., and Allen, M.: 2000,
Icarus 143, 244.Muhleman, D. O., Berge, G. L., and Clancy, R. T.: 1984, Science 223, 393.Nelson, R. M., and Lane, A. L.: 1987, ‘Planetary satellites’, in Kondo, Y. (ed.), Scientific
Accomplishments of the IUE, p. 67.Nicholson, P. D., and Dones, L.: 1991, Rev. Geophys. 29, 313.Nicholson, P. D., Showalter, M. R., Dones, L., French, R. G., Larson, S. M., Lissauer, J. J., et al.:
1996, Science 272, 509.Noll, K. S., Geballe, T. R., Knacke, R. F., and Pendleton, Y. J.: 1996a, Icarus 124, 625.Noll, K. S., Johnson, R. E., Lane, A. L., Dominque, D. L., and Weaver, H. A.: 1996b, Science 273, 341.Noll, K. S., Roush, T. L., Cruikshank, D. P., Johnson, R. E., and Pendleton, Y. J.: 1997, Nature 388, 45.Orton, G.: 1992, ‘Ground-based observations of Titan’s thermal spectrum’, in Symposium on Titan,
Conf. Proc. ESA, SP-338, 81.Orton, G. L., Serabyn, E., and Lee, Y. T.: 2000, Icarus 146, 48–59.Owen, T.: 1994, Astrophys. Space Sci. 212, 1.Owen, T. and Bar-Nun, A.: 1995, Icarus 116, 215.Owen, T. and Bar-Nun, A.: 1996, Earth, Moon, Planets 72, 425.Owen, T., Lutz, B. L., and de Bergh, C.: 1986, Nature 320, 245.Owen, T., Mahaffy, P., Niemann, H. B., Atreya, S., Donahue, T., Bar-Nun, A., et al.: 1999, Nature
402, 269.Owen, T., Maillard, J., de Bergh, C., and Lutz, B.: 1988, Science 240, 1767.Pinto, J. P., Lunine, J. I., Kim, S. J., and Yung, Y. L.: 1986, Nature 319, 388.Porco, C. C., Cuzzi, J. N., Esposito, L. W., Lissauer, J. J., and Nicholson, P. O.: 1995, ‘Neptune’s
ring system’, in Bergstralh, J., Miner, E. D., and Matthews, M. S. (eds.) Neptune and Triton,University Arizona Press, Tucson.
Pryor, W. R. and Hord, C. W.: 1991, Icarus 91, 161.
CASSINI ULTRAVIOLET IMAGING SPECTROGRAPH 361
Rages, K. and Pollack, J. B.: 1983, Icarus 55, 50.Rannou, P., Cabane, M., Botet, R., and Chassefiere, E.: 1997, J. Geophys. Res. 102, 10997.Sandel, B. R. and Broadfoot, A. L.: 1981, Nature 292, 679.Sandel, B. R., Shemansky, D. E., Broadfoot, A. L., Holberg, J. B., Smith, G. R., McConnell, J. C.,
et al.: 1982, Science 215, 548.Saur, J., Strobel, D. F., and Neubauer, F. M.: 1998, J. Geophys. Res. (Planets) 103, 19947.Scattergood, T. W., Lau, E. Y., and Stone, B. M.: 1992, Icarus 99, 98.Shemansky, D. E.: 1985, J. Geophys. Res. 90, 2673.Shemansky, D. E. and Ajello, J. M.: 1983, J. Geophys. Res. 88, 459.Shemansky, D. E., Kanik, I., and Ajello, J. M.: 1995, Astrophys. J. 452, 480.Shemansky, D. E., Matheson, P., Hall, D. T., Hu, H. Y., and Tripp, T. M.: 1993, Nature 363, 329.Showalter, M. R.: 1997, Paper presented at Ring-Plane Crossing Workshop, Wellesley, Massachusetts,
abstracted in Bull. Am. Astron. Soc. 29, 999.Showalter, M. R., Burns, J. A., Cuzzi, J. N., and Pollack, J. B.: 1987, Icarus 69, 458.Showman, A. P. and Ingersoll, A. P.: 1998, Icarus 132, 205.Sicardy, B. and Lissauer, J. J.: 1992, Adv. Space Res. 12, 97.Smith, B. A., Soderblom, L., Batson, R., Bridges, P., Inge, J., Masursky, H., et al.: 1982, Science
215, 504.Smith, G. R. and Hunten, D. M.: 1990, Rev. Geophys. 28, 117.Smith, G. R., McConnell, J. C., Shemansky, D. E., Holberg, J. B., Broadfoot, A. L., and Sandel, B.
R.: 1983, J. Geophys. Res. 88, 8667.Smith, W. H., Schempp, W. V., and Baines, K.: 1989, Astrophys. J. 336, 967.Spencer, J. R., Calvin, W. M., and Person, M. J.: 1995, J. Geophys. Res. 100, 19049.Squyres, S. W., Reynolds, R. T., Cassen, P. M., and Peale, S. J.: 1983, Icarus 53, 319.Stevenson, D. J.: 1982, Nature 298, 142.Stevenson, D. J.: 1991, ‘Interior of Titan’, in Symposium on Titan, Conf. Proc. ESA, SP-338, p. 29.Taylor, F. W. and Coustenis, A.: 1998, Planet. Space Sci. 46, 1085–1097.Thompson, W. R., McDonald, G. D., and Sagan, C.: 1994, Icarus 112, 376.Tomasko, M. G. and Smith, P. H.: 1982,Icarus 51, 65.Toon, O. B., McKay, C. P., Griffith, C. A., and Turco, R. P.: 1992, Icarus 95, 24.Trauger, J. T., Clarke, J., Bellester, G., Evans, R., Burrows, C., Crisp, D., et al.: 1998, J. Geophys.
Res. 103, 20237.Veverka, J. P., Thomas, P., Johnson, T. V., Matson, D., and Housen, K.: 1986, in Burns, J. A., and
Matthews, M. S. (eds.), Satellites, University of Arizona Press, Tucson, p. 342.Vidal, R. A., Bahr, D., Baragiola, R. A., and Peters, M.: 1997, Science 276, 1839.Waite, J. H., Bagenal, F., Seward, F., Na, C., Gladstone, G., Cravens, T., et al.: 1994, J. Geophys.
Res. 99, 14799.Wallis, M. K. and Ong, R. S. B.: 1975, Planet. Space Sci. 23, 713.West, R. A., Friedson, A. J. and Appleby, J. F.: 1992, Icarus 100, 245.West, R. A. and Smith, P. H.: 1991, Icarus 90, 330.Winter, T. C. and Chubb, T. A.: 1967, J. Geophys. Res. 72, 4405.Yelle, R. V., Sandel, B. R., Shemansky, D. E., and Kumar, S.: 1986, J. Geophys. Res. 91, 8756.Young, L. A., Yelle, R. V., and Young, R. E.: 1998, Bull. Am. Astron. Soc. 30, 1075.Young, L. A., Yelle, R. V., Young, R., Seiff, A., and Kirk, D. B.: 1997, Science 276, 108.Yung, Y. L., Allen, M., and Pinto, J. P.: 1984, Astrophys. J. Supp. Ser. 55, 465.Yung, Y. L. and DeMore, W. B.: 1999, Photochemistry of Planetary Atmospheres, Oxford University
Press, New York.Zahnle, K. and Dones, L.: 1992, ‘Impact Origin of Titan’s Atmosphere’, in Symposium on Titan,
Conf. Proc. ESA, SP-338, 19.Zwier, T. S. and Allen, M.: 1996, Icarus 123, 578.