Simplifiying cost and schedule risk analysis with acumen risk

Francisco Cruz, PE, VDC
The Case for
Schedule Risk Analysis
Section MeetingFebruary 19, 2015
Presentation Outline
• The Case for Project Risk Analysis• Risk Analysis Approach • Tools to Treat Risks• Final Remarks
There are lies, there are damned lies, and then there are deterministic schedules
Attributed to Dr. Vivek Puri, PMA’s resident simulation guru
2

Francisco Cruz - Background
• Senior Associate at PMA Consultants• Based in Tampa, Florida• Registered Professional Engineer (P.E.) in FL and PR• BS in Civil Engineering, M.Eng. in Construction Management• Experience of over 10 years spans pharmaceutical,
infrastructure, airports, municipal, and mixed-used projects. • Performing Cost and Schedule Risk Analysis on projects since
2007 on over 50 projects in 3 continents, ranging in size from less than $5 million to over $1 billion
• AACEi member since 2009
3
Risk Management Planning
Risk Management Planning
Assess(Identify & Analyze)
Assess(Identify & Analyze)
Treat (Plan & Implement)
Treat (Plan & Implement)
Control (Monitor &
Communicate)
Control (Monitor &
Communicate)
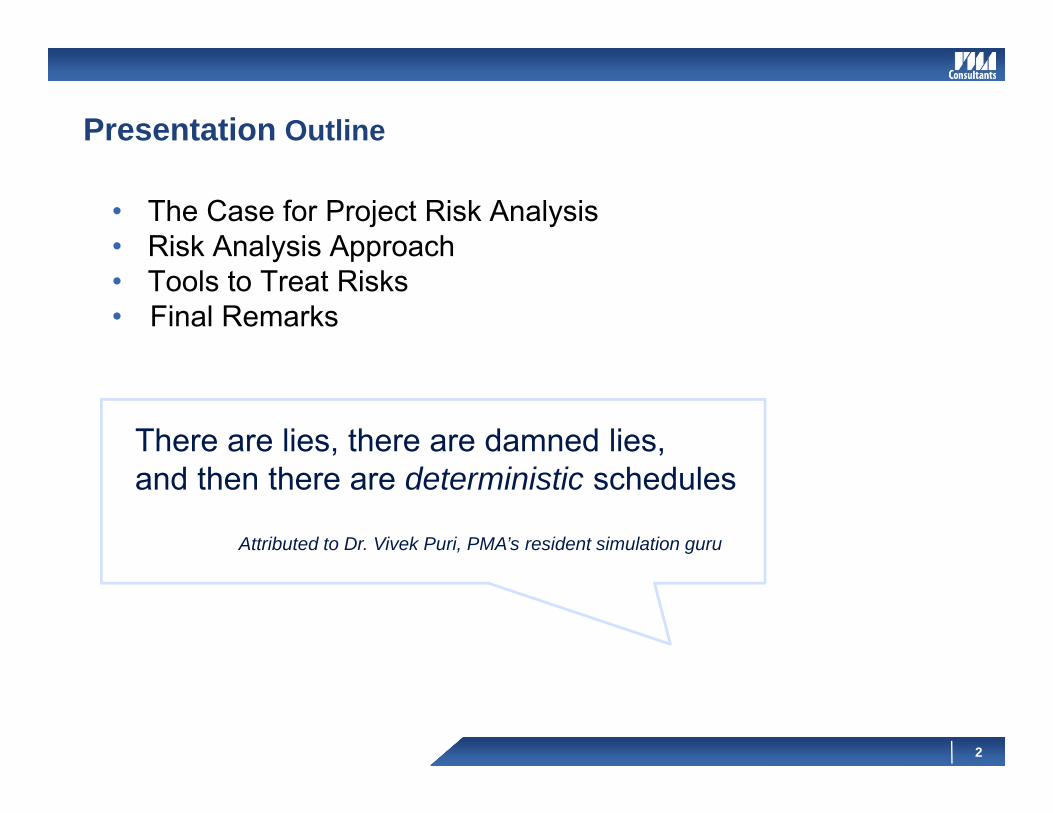
The New Normal in Project Management
Terminology:Risk Management –Soup to nuts strategy for identifying and controlling project or program risks.
*TCM Framework (Section 7.6)
4

The Case for Project Risk Analysis
* KPMG 2008 Global Construction Survey
55%
40%
36%
32%
19%
6%
4%
2%
26%
60%Material Price Escalation
Poorly Defined Scope
Contractual Disputes
Time Delay
Design Creep
Achieving Productivities
Lack of Approvals
Weather
Industrial Relations
Others
What are the three most common causes of cost overruns? *
Material Price Escalation
Poorly Defined Scope
Lack of Approvals
Contractual Disputes
Achieving Productivities
Commissioning Process
57%
36%
34%
21%
17%
15%
13%
2%
19%
57%
Design Creep
Weather
Time Delay
Others
What are the three most common causes of delays? *
According to the Bent Flyvbjerg’s Study on Large Projects,
• 9 out of 10 projects have cost overrun;
• Overrun is found across the 20 nations and five continents.
• Overrun is constant for the 70-year period covered by the study; cost estimates have not improved over time.
5

The Case for Project Risk Analysis
Main causes of underperforming projectsDid you have underperforming projects?
* KPMG Global Construction Survey 2013
What is the current performance in the construction industry?
6

Deterministic vs Probabilistic Schedules
Consider the following simple 2-activity schedule:
Start Activity A(12 weeks)
Activity B(10 weeks)
Finish
Deterministic Schedule
7

Start Activity A(12 weeks)
Activity B(10 weeks)
Finish
% critical = 100%
% critical = 0%
Project always to finish in 12 weeks
Deterministic vs Probabilistic Schedules
Deterministic Schedule
8

Start Activity A(12 weeks)
Activity B(10 weeks)
Finish
10 12 16
8 10 18
OPT MOST PESS
OPT MOST PESS
Activity B has much more variability to the
pessimistic side due to inherent risks of its work
Deterministic vs Probabilistic Schedules
Probabilistic Schedule
9

% critical = 63%
% critical = 37%
P10: 11.3 weeksP50: 13.1 weeksP90: 15 weeks
Start Activity A(12 weeks)
Activity B(10 weeks)
Finish
10 12 16
8 10 18
OPT MOST PESS
OPT MOST PESS
Deterministic vs Probabilistic Schedules
Probabilistic Schedule
10

The New Normal in Project Management
►Brings together and aligns stakeholders
►Vets and improves project scope, schedule and estimate
►Promotes recognition and transparency in project challenges
►Risk treatment reduces potential impacts
►Evaluates feasibility of targets
Risk Assessment process through probabilistic modeling is the next step in Project Management
11

How is the Schedule Contingency Typically Determined?
► Similar Project History
► Expert Judgment (a.k.a. Well-reasoned Heuristics)
► Rule-of-Thumb Guidelines
► Parametric Modeling
► Statistical Methods through Probabilistic Simulations
12

PMA’s Risk Assessment Approach
Qualitative Assessment
Review
IdentifyModel
Range
SimulateCritical & “Risk-sensitive” sequencesProject Risks & Uncertainty
Durations of Risks & Critical Activities
Summary Sequences,Probabilistic Branching
OPRA™NetRisk ™
Identify ModelRange
Simulate
Estimate Issues,Possible Risks & Response Plans
Develop Ranges forVariables: Scope, Price, Productivity, & Duration
Cost Breakdown,Variables, & Distributions
@Risk™ or Crystal Ball
Prioritize
Cost
Schedule
Quantitative Assessment
Summarize
* First Introduced at the 2004 AACEi Annual Meeting
13

Risk Register
Sample Risk Register used to prioritize risks and subsequently input in the quantitative model.
14

Risk Thresholds
Project team defines
thresholds to classify risks and reduce subjectivity
Figure 1: Defined Conditions for Probability Scales of a Risk
Very Low Low Medium High Very High
Probability 0% – 10% 11% to 30% 31% to 50% 51% to 70% >70%
Figure 2: Defined Conditions for Impact Scales of a Risk on Major Project Objectives
Project Objective Very Low Low Medium High Very High
Cost Insignificant Cost Increase
<2% of TPC 2-7% Cost Increase
8-15% Cost Increase
>15% Cost Increase
Time 0-2 Week Time Increase
3-6 Week Time Increase
7-12 Week Time Increase
13-18 Week Time Increase
>18 Week Time increase
Scope
Scope Decrease Barely Noticeable
Minor Areas of Scope Affected
Major Areas of Scope Affected
Scope Reduction Unacceptable to PA
Project Does not Satisfy Original Intent at Completion
Quality
Quality Degradation Barely Noticeable
Only Most Demanding Specs Not Met
Degradation Requires PA Approval
Quality Reduction Unacceptable to PA
Major Re-work Required to Complete Project
15

Prioritization
VH 5.00 5.00 10.00 15.00 20.00 25.00H 4.00 4.00 8.00 12.00 16.00 20.00M 3.00 3.00 6.00 9.00 12.00 15.00L 2.00 2.00 4.00 6.00 8.00 10.00
VL 1.00 1.00 2.00 3.00 4.00 5.001.00 2.00 3.00 4.00 5.00VL L M H VH
Probability-Impact Score Legend
High = > 9Med = 5 - 9Low = 1 - 4
Probability Threats
Impact
• Probability & Impact Matrix (P/I)
• Tolerance Thresholds
Tolerance is used to define
Risk appetite of the organization
16

Output Example: Cumulative Probability Distribution
The project schedule deterministic date of 16-Sep-14 is in the 24th
percentile of the simulation results distribution (including weather effects).
► Pre-treatment Results
► What about post-treatment analysis?
17

Contemporaneous Method /SRA
Tornado Diagram – Risks
4%
7%
12%
14%
15%
26%
36%
40%
41%
46%RD11 - FHWA Design Exception for substandard geometry not received by Q2, 2013
REN4 - NY Environmental permits not received by Q4'12
RD9 - Cash Collection is required in toll Lanes
RC20 - Restricted Work Hours may delay construction
RD2 - Procurement Process w ill take longer than 8 months therefore D/B contract w ill not ...
RC23 - Modif ied Toll Plaza collection not accepted for Toll Plaza delaying Traff ic
RD3 - Program not fully defined by Q1, 2012
RC14 - Relocation of Know n/Unknow n Utilities may cause cost and schedule overruns
RD1 - Design Package for Design Build w ill not be completed in Q2, 2013
RRW7 - ULURP process w ill affect property acquisition in NY
Duration Sensitivity
18

Risk Impact Analysis
19
Variation:175 Variation:111 Variation:73 Variation:82 Variation:144 Variation:19 Variation:128 Variation:13
Variation:127 Variation:72 Variation:59 Variation:25 Variation:119 Variation:85 Variation:54
Variation:5
22/ 09/ 2017 31/ 12/ 2017 10/ 04/ 2018 19/ 07/ 2018 27/ 10/ 2018 04/ 02/ 2019 15/ 05/ 2019 23/ 08/ 2019 01/ 12/ 2019 10/ 03/ 2020 18/ 06/ 2020 26/ 09/ 2020 04/ 01/ 20210%
20%
40%
60%
80%
100%
Cum
ulat
ive
Prob
abili
ty
Distribution AnalyzerRemoving RD1 - Finish DateRemoving RC14 - Finish Date
Removing RC23 - Finish DateRemoving RD2 - Finish Date
Removing RC20 - Finish DateRemoving REN4 - Finish Date
Removing RD9 - Finish DateRemoving RD11 - Finish Date
All Risks - Finish Date
Helps determine impact of each risk on project schedule

Output Example: End Node Diagram of Criticality
► In lieu of an unhelpful table of activities, a graphical representation of the activities most likely to influence project completion is provided.
20

Which percentile would youuse for your project?
• Most public agencies and private companies use the P80 through P90
• Some practitioners use a combination of two percentiles to set the baseline, schedule margin and management reserve (e.g., P50 and P80)
ID Public Agency / Private Company Confidence Level
Aerospace1 NASA 70%
Consultant
2Hulett and Associates (Project Risk Consultants)
80%
Energy3 NorthWestern (Montana, Nebraska, North Dakota) 95%
4US Energy Information Administration (EIA)
90%
Food, Health & Environmental5 FDA & USDA 95‐99%
6Forest Ecology and Management(Australia)
90%
7 Environmental Protection Agency (EPA) 90 & 95%
8 Environmental and Occupational Health ‐ Private Industry 95‐98%
Government9 US Corps of Engineers (CoE) 80%
10US Government Accountability Office (GAO)
70‐80%
11 USGS 90%Military
12 Air Force 80%Nuclear
13 US Nuclear Regulatory Commission (NRC) 90, 95, 98%Oil & Gas
14 British Petroleum (BP)50% (Adjusted Mean)*, 90%*
15 GeoGlobal Resources 90%16 Marathon 80%
Pharmaceutical17 Johnson & Johnson 75‐90%18 AstraZeneca 80%19 Siemens HealthCare 80%
Software20 Palisade @Risk 85‐90%
Transportation21 DOT 95%22 FRA 95%23 FTA 70 & 90%24 MTA 80%25 Wisconsin DOT 80%
26 FHWAMean, Standard Deviation, 90‐95%
27 PANYNJ 90%28 WSDOT 90%
21

Comparing ResultsWhat Do Pre and Post-Treatment Results have in Common?
22

Tools to Treat Risks
• Value Engineering• Constructability Reviews• Project Delivery Systems• Virtual Design and Construction
23

Risk Transfer Through Project Delivery Systems
* CMAA’s An Owner's Guide to Project Delivery Methods
1. Design/Bid/Build (DBB)a. Multiple-Prime Contracting
2. Design/Build (DB)a. Bridging b. Public Private Partnership (P3 or PPP)
3. Construction Management at Risk (CMAR or CM/GC)4. Integrated Project Delivery
24

Risk Allocation Through Contract Types
* RP-67R-11 Contract Risk Allocation
25
26
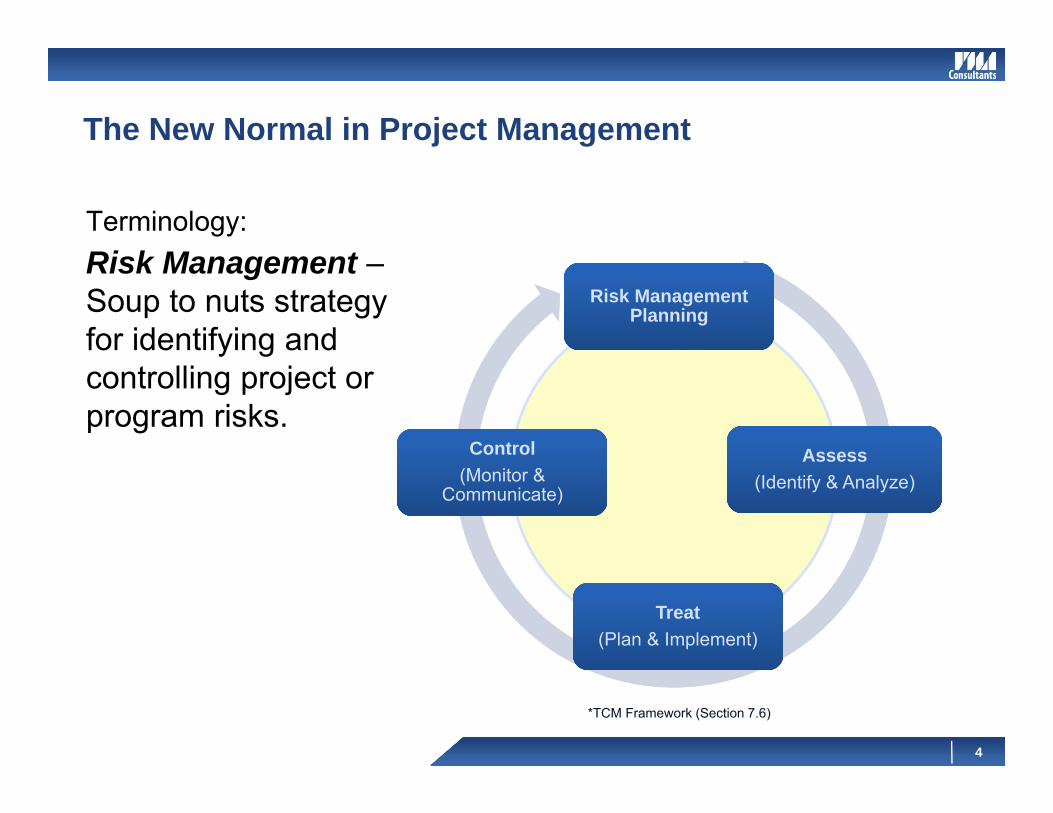
* 2014 Mortenson VDC Construction Analysis Report

Risk Monitoring and Control
27

Final Remarks
28
► Any project or contract schedule that is not risked through its life cycle does not conform to scheduling best practices
► Any schedule that does not expressly reserve reasonable schedule margin does not conform to best practices either
► Most deterministic schedules have less than 20% chance of meeting baseline dates; majority have even less than 1% chance.
► Post-treatment analysis is hardly ever performed; both pre and post-treatment analysis should be performed in tandem
► The use of VE, VDC, Constructability and Risk Management greatly increases the probabilities of project success

29