
The Case Against Fluoridation PART B The Case Against Fluoridation PART B Paul Connett, PhD...
46
he Case Against Fluoridati he Case Against Fluoridati PART B PART B Paul Connett, PhD Paul Connett, PhD Director, Fluoride Action Director, Fluoride Action Network Network Fluoride Fluoride ALERT ALERT .org .org Sydney, Australia, Feb 21, Sydney, Australia, Feb 21, 2015 2015
-
Upload
susan-hampton -
Category
Documents
-
view
215 -
download
0
Transcript of The Case Against Fluoridation PART B The Case Against Fluoridation PART B Paul Connett, PhD...

The Case Against FluoridationThe Case Against FluoridationPART B PART B
Paul Connett, PhDPaul Connett, PhD
Director, Fluoride Action NetworkDirector, Fluoride Action Network
FluorideFluorideALERTALERT.org.org
Sydney, Australia, Feb 21, 2015Sydney, Australia, Feb 21, 2015

Part 1.Part 1.Better ways of Better ways of
fighting tooth decayfighting tooth decay Fluoride is Neurotoxic

The weight of evidence from The weight of evidence from many animal and human studies many animal and human studies is that fluoride is a potent is that fluoride is a potent neurotoxicant – i.e. it can neurotoxicant – i.e. it can interfere with brain chemistry.interfere with brain chemistry.
www.FluorideALERT.org/www.FluorideALERT.org/issues/health/brainissues/health/brain

Animal StudiesAnimal Studies

Over 100 Animal Studies have found Over 100 Animal Studies have found Fluoride Damages the BrainFluoride Damages the Brain
FINDINGS:FINDINGS: Damage to hippocampusDamage to hippocampus Neuronal degenerationNeuronal degeneration Inhibition of cholinesterase Inhibition of cholinesterase Damage to nicotinic receptorsDamage to nicotinic receptors Deceased brain glucose utilizationDeceased brain glucose utilization Increase in oxidative stressIncrease in oxidative stress

30 Animal Studies Have Found 30 Animal Studies Have Found Fluoride Fluoride Impairs Learning/MemoryImpairs Learning/Memory
Learning/Memory StudiesLearning/Memory Studies
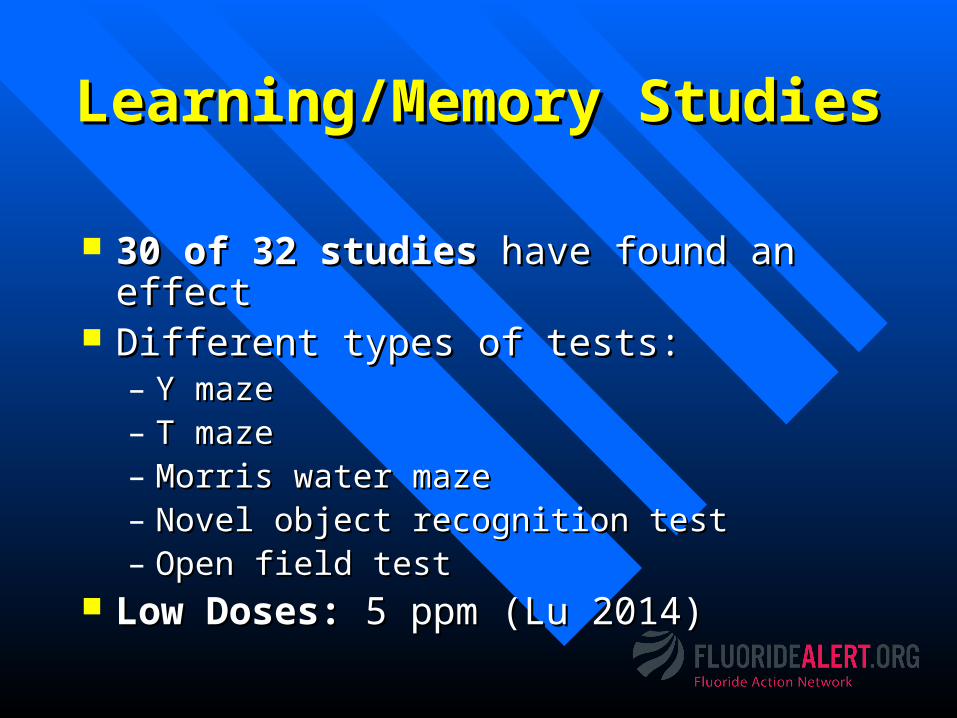
30 of 32 studies 30 of 32 studies have found an effecthave found an effect Different types of tests: Different types of tests:
– Y mazeY maze– T mazeT maze– Morris water mazeMorris water maze– Novel object recognition testNovel object recognition test– Open field testOpen field test
Low Doses: Low Doses: 5 ppm (Lu 2014)5 ppm (Lu 2014)

Human (non-IQ) StudiesHuman (non-IQ) Studies

Rey-Osterrieth Complex Figure Rey-Osterrieth Complex Figure Test Test

Rey Osterrieth Complex Figure TestRey Osterrieth Complex Figure TestRocha Amador (2009)Rocha Amador (2009)
High quality study High quality study – Controlled for key variables (e.g., education, Controlled for key variables (e.g., education,
nutritional status, exposure to other contaminants)nutritional status, exposure to other contaminants)– Individual-based fluoride exposures (urine F Individual-based fluoride exposures (urine F
levels)levels) Findings:Findings:
– ““Approximately Approximately 9 out of 10 children 9 out of 10 children were unable were unable to copy the ROCF as expected for their age.”to copy the ROCF as expected for their age.”
– ““For Immediate Recall, almost For Immediate Recall, almost 6 out of 10 6 out of 10 children children were unable to draw the figure as were unable to draw the figure as expected for their age.”expected for their age.”

IQ studies – the current tallyIQ studies – the current tally
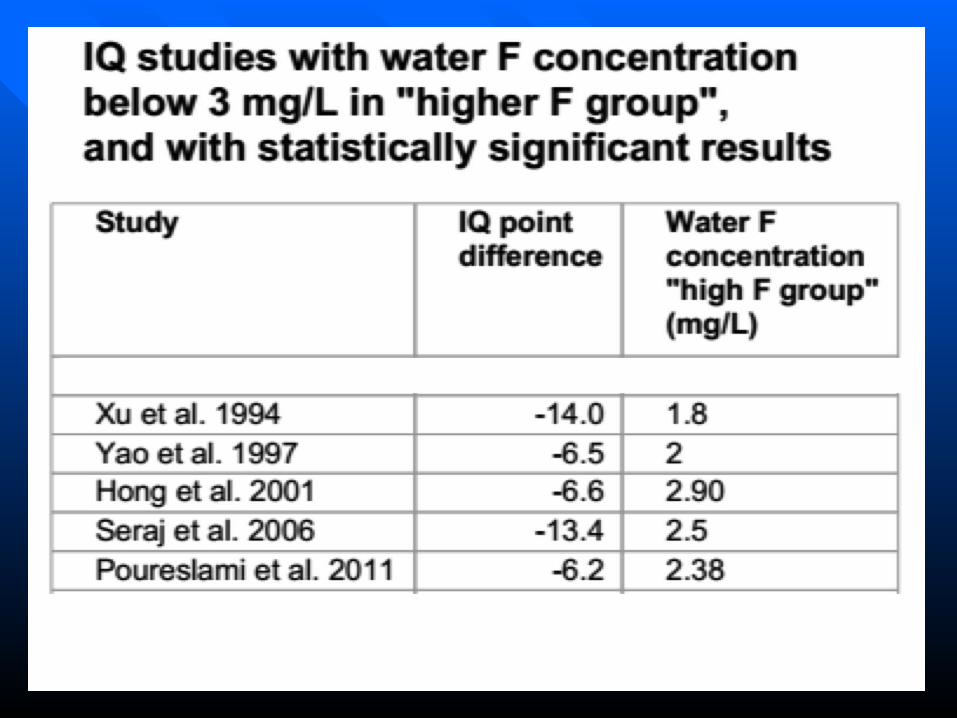
4343 out of 50 studies have found an out of 50 studies have found an association between fairly modest exposure association between fairly modest exposure to fluoride and lowered IQ (China, India, to fluoride and lowered IQ (China, India, Mexico and Iran)Mexico and Iran)
1919 of these studies the fluoride water of these studies the fluoride water concentration was less than 4 ppm (the concentration was less than 4 ppm (the current EPAcurrent EPA safe safe drinking water standard!)drinking water standard!)

Meanwhile…Meanwhile…
One highly publicized study from NZ by One highly publicized study from NZ by Broadbent et al. (2014) reported no difference Broadbent et al. (2014) reported no difference in IQ between a fluoridated and non-in IQ between a fluoridated and non-fluoridated community – however there were fluoridated community – however there were very few subjects in the non-fluoridated very few subjects in the non-fluoridated community, because many were taking community, because many were taking fluoride supplements. There were also other fluoride supplements. There were also other differences between the two communities differences between the two communities which were not taken into account.which were not taken into account.

Harvard Meta-analysis of IQ studiesHarvard Meta-analysis of IQ studies

The Harvard Meta-analysisThe Harvard Meta-analysis
In 2012, Choi et al (the team included In 2012, Choi et al (the team included Philippe Grandjean) published a meta-Philippe Grandjean) published a meta-analysis of analysis of 2727 studies comparing IQ in studies comparing IQ in ““highhigh”” versus versus ““lowlow”” fluoride villages . fluoride villages .
The study was published in The study was published in Environmental Health Perspectives Environmental Health Perspectives (published by NIEHS)(published by NIEHS)

Harvard meta-analysis of 27 studiesHarvard meta-analysis of 27 studies
The Harvard team acknowledged The Harvard team acknowledged that there were weaknesses in many that there were weaknesses in many of the studies, however…of the studies, however…

……the results were remarkably the results were remarkably consistentconsistent
In In 26 of the 27 studies 26 of the 27 studies there was there was lower average IQ in the lower average IQ in the ““highhigh”” versus low-fluoride villages.versus low-fluoride villages.
Average IQ lowering was Average IQ lowering was about 7 about 7 IQ pointsIQ points..

……promoters claim that the promoters claim that the concentrations in the “high concentrations in the “high fluoride” villages were very high – fluoride” villages were very high – and irrelevant to artificial water and irrelevant to artificial water fluoridation (0.7 to 1.2 ppm)fluoridation (0.7 to 1.2 ppm)


More details on one More details on one of the IQ studiesof the IQ studies

Xiang et al. (2003 a,b)Xiang et al. (2003 a,b) Compared IQ of children in two villagesCompared IQ of children in two villages:: Low Fluoride Village Average F in well water = Low Fluoride Village Average F in well water =
0.36 ppm 0.36 ppm (Range = 0.18 -0.76 ppm) (Range = 0.18 -0.76 ppm) High Fluoride Village Average F in well water = High Fluoride Village Average F in well water =
2.5 ppm 2.5 ppm (Range 0.57 – 4.5 ppm)(Range 0.57 – 4.5 ppm) Controlled for lead exposure Controlled for lead exposure and and iodine intakeiodine intake, ,
and other key variables and other key variables Found a drop of 5-10 IQ points across the whole age Found a drop of 5-10 IQ points across the whole age
rangerange The whole IQ curve shifted for both males and The whole IQ curve shifted for both males and
femalesfemales

Xiang et al. (2003 a,b)Xiang et al. (2003 a,b) MALES
Ave. level = 0.36 ppm FAve. Level = 2.5 ppm

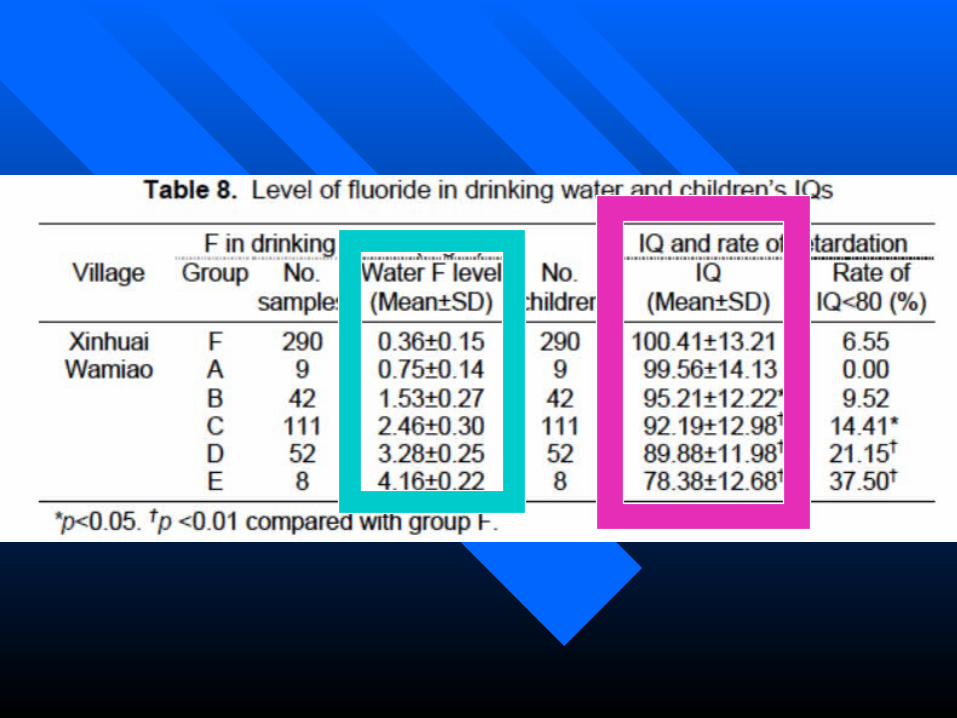


The lowest level that lowered IQ The lowest level that lowered IQ in Xiang studyin Xiang study
See group B, mean fluoride concentration = 1.53 See group B, mean fluoride concentration = 1.53 ppm +/- 0.27ppm +/- 0.27
Some children had IQ lowered at 1.26 ppmSome children had IQ lowered at 1.26 ppm
This leaves no adequate margin of safety to protect This leaves no adequate margin of safety to protect all children drinking water between 0.7 and 1.2 all children drinking water between 0.7 and 1.2 ppm.ppm.
We usually use a safety factor of 10 to account for We usually use a safety factor of 10 to account for the wide range of sensitivity expect to any toxic the wide range of sensitivity expect to any toxic substance in a large population.substance in a large population.

If IQ lowered at 1.26 ppmIf IQ lowered at 1.26 ppm
This leaves NO This leaves NO margin of safety margin of safety to protect all to protect all children from lowered IQ drinking water children from lowered IQ drinking water between 0.7 and 1.2 ppm fluoride.between 0.7 and 1.2 ppm fluoride.
The doses will overlap between a population The doses will overlap between a population drinking (0.7 to 1.2 ppm) and another drinking drinking (0.7 to 1.2 ppm) and another drinking 1.26 ppm).1.26 ppm).
Especially in this case because these rural Especially in this case because these rural Chinese children would have been breast-fed Chinese children would have been breast-fed and probably did not use fluoridated toothpaste.and probably did not use fluoridated toothpaste.

If IQ lowered at 1.26 ppmIf IQ lowered at 1.26 ppm
NO MARGIN OF SAFETY becauseNO MARGIN OF SAFETY because
We usually use a safety factor of 10 to We usually use a safety factor of 10 to account for the wide range of account for the wide range of sensitivity expected for any toxic sensitivity expected for any toxic substance in a large population substance in a large population (i.e. (i.e. INTRA-SPECIES variation, see Dr. INTRA-SPECIES variation, see Dr. Hirzy’s risk assessment)Hirzy’s risk assessment)

Dr. William Hirzy, a Dr. William Hirzy, a former senior scientist former senior scientist at the US EPA at the US EPA and a and a risk assessment risk assessment specialistspecialist, will present , will present his risk assessment for his risk assessment for F and lowered IQ F and lowered IQ next.next.

The US EPA is in the process of The US EPA is in the process of determining a new MCLG (maximum determining a new MCLG (maximum contaminat level goal) for fluoride as contaminat level goal) for fluoride as recommended by the NRC in 2006recommended by the NRC in 2006. .
They say they are using SEVERE dental They say they are using SEVERE dental fluorosis as the most sensitive end point of fluorosis as the most sensitive end point of fluoride’s toxicity. fluoride’s toxicity.
They claim that if they protect for this it will They claim that if they protect for this it will protect against damage to the bone protect against damage to the bone and any and any other tissue.other tissue.

To demonstrate that SEVERE DF is a To demonstrate that SEVERE DF is a more sensitive end point than lowered more sensitive end point than lowered IQ they would have to show that ALL IQ they would have to show that ALL the children in the “High Fluoride” the children in the “High Fluoride” village in all the 40+ studies where village in all the 40+ studies where IQ was lowered IQ was lowered
had only SEVERE DF and not other had only SEVERE DF and not other milder categoriesmilder categories

Group No. Water F IQ Urine F Serum F
0 301 0.50±0.53 99.76±3.50 1.13±0.71 0.044±0.017
1 65 1.88±1.07 94.18±13.77 2.70±1.15 0.071±0.023
2 59 2.44±0.66 93.27±13.10 3.69±1.61 0.082±0.016
3 63 2.67±0.63 91.51±12.84 3.85±1.79 0.085±0.019
4 24 2.89±0.81 95.33±14.64 3.81±1.80 0.084±0.018
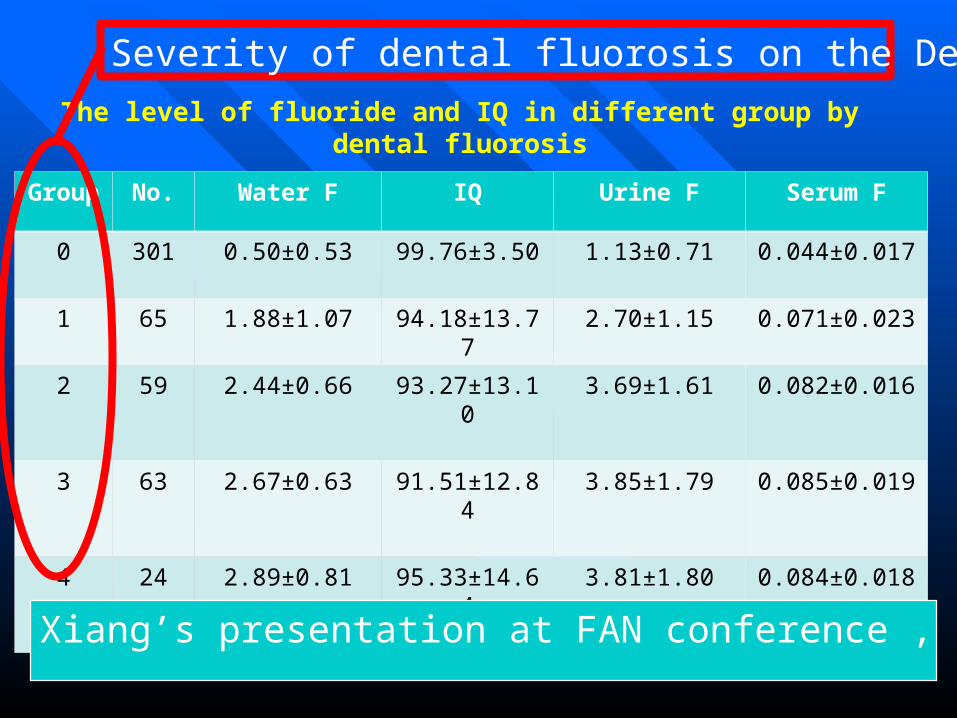
The level of fluoride and IQ in different group by dental fluorosis
Xiang’s presentation at FAN conference , Sept 6, 2014
Group No. Water F IQ Urine F Serum F
0 301 0.50±0.53 99.76±3.50 1.13±0.71 0.044±0.017
1 65 1.88±1.07 94.18±13.77 2.70±1.15 0.071±0.023
2 59 2.44±0.66 93.27±13.10 3.69±1.61 0.082±0.016
3 63 2.67±0.63 91.51±12.84 3.85±1.79 0.085±0.019
4 24 2.89±0.81 95.33±14.64 3.81±1.80 0.084±0.018
The level of fluoride and IQ in different group by dental fluorosis
Xiang’s presentation at FAN conference , Sept 6, 2014
Severity of dental fluorosis on the Dean scale
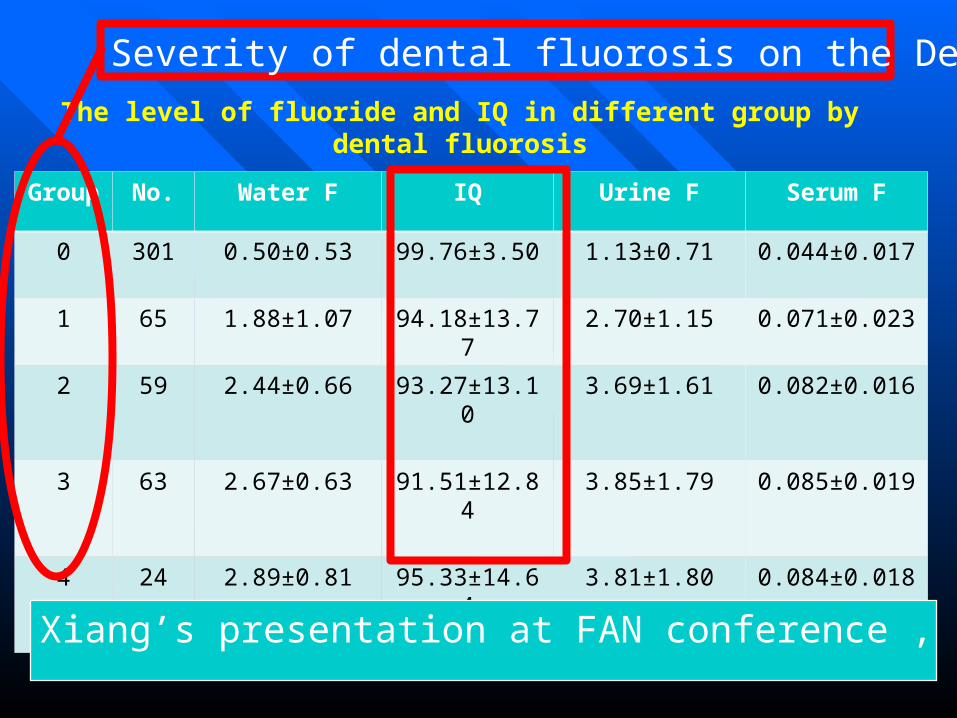

Part 1.Part 1.Better ways of Better ways of
fighting tooth decayfighting tooth decay
Quanyong Xiang, Paul Connett, Chris Neurath and Bill Hirzy outside the EPA Headquarters in Washington, DC Sept 8, 2014

Choi et al., 2015Choi et al., 2015
In a preliminary study of 51 children, the In a preliminary study of 51 children, the children were asked to remember a sequence children were asked to remember a sequence of numbers and report both forwards and of numbers and report both forwards and backwards –backwards –
Children with dental fluorosis performed less Children with dental fluorosis performed less well than those without.well than those without.
(world expert on lead neurotoxicity David (world expert on lead neurotoxicity David Bellenger was involved in the study)Bellenger was involved in the study)

2) CDC’s weak evidence2) CDC’s weak evidence
Choi et al., 2015

Dr. Philippe GrandjeanDr. Philippe Grandjean
““Fluoride seems to fit in with lead, Fluoride seems to fit in with lead, mercury, and other poisons that mercury, and other poisons that cause chemical brain drain.” cause chemical brain drain.” (Harvard Press Release)(Harvard Press Release)
Grandjean is the author of a book Grandjean is the author of a book published this year entitled “Only published this year entitled “Only One Chance”One Chance”

IQ and populationIQ and population
100
Number of KidsWith a
Specific IQ
IQ

IQ and populationIQ and population
Very BrightMentallyhandicapped
100
Number of KidsWith a
Specific IQ
IQ
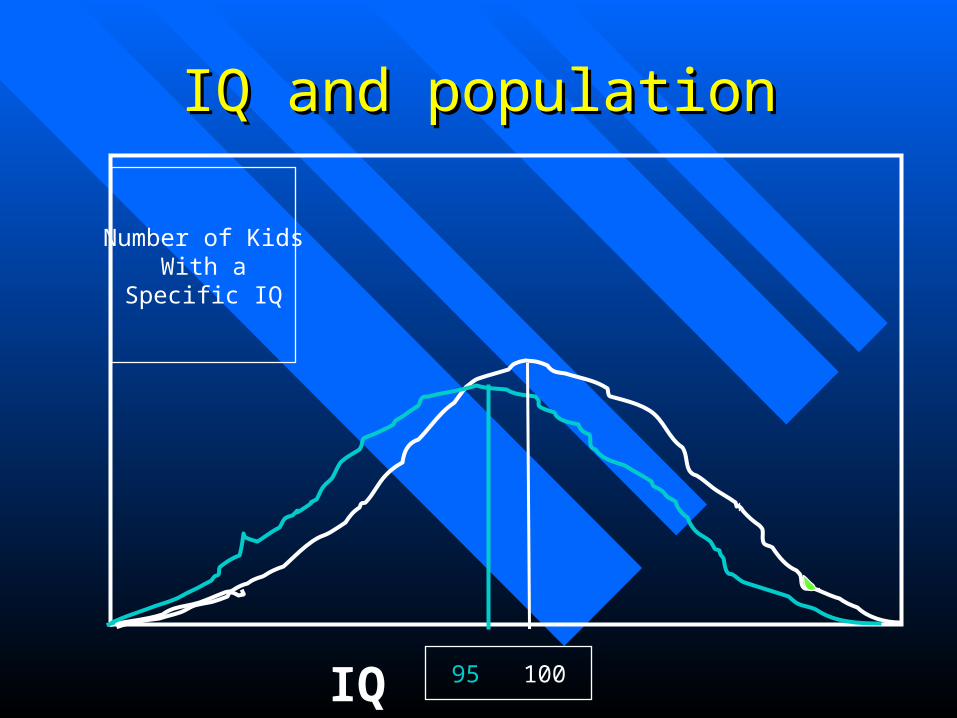
IQ and populationIQ and population
95 100
Number of KidsWith a
Specific IQ
IQ

IQ and populationIQ and population
Very BrightMentallyhandicapped
95 100
Number of KidsWith a
Specific IQ
IQ


