GHG Inventory & GHG Intensity Ranking Cement sector in India
ARTICLESPUBLISHED ONLINE: 19 JANUARY 2015 | DOI: 10.1038/NCLIMATE2491
The carbon footprint of traditional woodfuelsRobert Bailis1*, Rudi Drigo2, Adrian Ghilardi3 and Omar Masera4
Over half of all wood harvested worldwide is used as fuel, supplying ∼9% of global primary energy. By depleting stocks ofwoody biomass, unsustainable harvesting can contribute to forest degradation, deforestation and climate change. However,past e�orts to quantify woodfuel sustainability failed to provide credible results. We present a spatially explicit assessmentof pan-tropical woodfuel supply and demand, calculate the degree to which woodfuel demand exceeds regrowth, andestimate woodfuel-related greenhouse-gas emissions for the year 2009. We estimate 27–34% of woodfuel harvested wasunsustainable, with large geographic variations. Our estimates are lower than estimates from carbon o�set projects, whichare probably overstating the climate benefits of improved stoves. Approximately 275 million people live in woodfuel depletion‘hotspots’—concentrated in South Asia and East Africa—where most demand is unsustainable. Emissions from woodfuels are1.0–1.2Gt CO2e yr−1 (1.9–2.3%of global emissions). Successful deployment and utilization of 100million improved stoves couldreduce this by 11–17%. At US$11 per tCO2e, these reductions would be worth over US$1 billion yr−1 in avoided greenhouse-gasemissions if black carbon were integrated into carbon markets. By identifying potential areas of woodfuel-driven degradationor deforestation, we inform the ongoing discussion about REDD-based approaches to climate change mitigation.
Traditional woodfuels, which include both firewoodand charcoal used for cooking and heating, representapproximately 55% of global wood harvest and 9% of
primary energy supply1,2. The current extent and future evolutionof traditional woodfuel consumption is closely related to several keychallenges to sustainable development. Roughly 2.8 billion peopleworldwide3, including the world’s poorest and most marginalized,burn wood to satisfy their basic energy needs. Woodfuels canimpact public health4, cause deforestation or forest degradation5,and contribute to climate change6–8. Climate impacts arise fromtwo pollutant flows: CO2 is emitted because a fraction of woodfuelis harvested unsustainably; methane (CH4), black carbon andother short-lived climate forcers (SLCFs) are emitted becauseof incomplete combustion, which also emits health-damagingpollutants. Thus, woodfuels present society with two importantlinks between local and global impacts; incomplete combustionreleases pollutants that damage health and warm the atmosphere,and unsustainable harvesting drives both forest degradation andclimate change.
Risks to public health are increasingly well characterized4,whereas impacts on deforestation, degradation and global climateremain highly uncertain. Historically, woodfuel demand wasconsidered a major driver of land cover change9,10 (LCC). However,early research failed to account for regrowth, consumers’ responseto scarcity, and use of trees outside forests11,12. More recent localor regional assessments find conflicting results13–17, suggesting thatgeography is an important determinant of woodfuel sustainability.However, few systematic studies of woodfuel sustainabilityand greenhouse gas (GHG) emissions have been conducted18.The Intergovernmental Panel on Climate Change’s FourthAssessment claimed that 10% of global woodfuel is harvestedunsustainably19,20, and the Fifth Assessment stresses that netemissions from woodfuels are unknown17. Better understanding ofthe contribution of woodfuels to deforestation, forest degradationand climate change is needed to evaluate the impact of the growing
wave of household energy interventions and inform emergingREDD (Reducing Emissions from Deforestation and ForestDegradation) methodologies21,22.
Here we present a spatially explicit snapshot of woodfuel supplyand demand (Supplementary Section 1) throughout tropical regionswhere traditional woodfuel consumption is concentrated. Using2009 as a base year, we quantify the extent to which woodfueldemand exceeds supply, identify specific ‘hotspots’ where harvestingrates are likely to cause degradation or deforestation, quantify thecarbon emissions that result from current woodfuel exploitation,and estimate the emission reductions that could be achieved fromlarge-scale interventions23.
Nearly all landscapes produce a measurable increment of woodybiomass either as new growth or as regrowth from previousdisturbances. This assessment considers supply/demand balanceover one year. If an area is harvested for woodfuel below theannual growth rate, then woody biomass stocks are not depletedand harvesting is sustainable. However, if annual harvestingexceeds incremental growth, it is unsustainable, leading to adecline of woody biomass, forest degradation and net carbonemissions. In this assessment, we define the wood harvestedin excess of the incremental growth rate as non-renewablebiomass24 (NRB).
Pan-tropical woodfuel supply and demandWe treat woodfuel demand as an exogenous factor derived from amix of national and sub-national studies supplemented by data fromthe Food andAgricultureOrganization (FAO), International EnergyAgency (IEA), and United Nations1,25,26 (UN). Woodfuel demandhas subsistence and commercial components. Subsistence demandoccurs primarily in rural areas, where people collect their own fuelusing simple non-motorized forms of transportation from within afew hours of their homes. Commercial demand originates in urbanand some densely populated rural locations and is typically suppliedby motorized transport over much longer distances.
1Yale School of Forestry and Environmental Studies, New Haven, Connecticut 06511, USA. 2Località Collina 5, 53036 Poggibonsi (SI), Italy. 3Center forEnvironmental Geography Research, National Autonomous University of Mexico (UNAM), CP 58190, Morelia, Michoacán, Mexico. 4Center forEcosystems Research, National Autonomous University of Mexico (UNAM), CP 58190, Morelia, Michoacán, Mexico. *e-mail: [email protected]
NATURE CLIMATE CHANGE | ADVANCE ONLINE PUBLICATION | www.nature.com/natureclimatechange 1
© 2015 Macmillan Publishers Limited. All rights reserved.
ARTICLES NATURE CLIMATE CHANGE DOI: 10.1038/NCLIMATE2491
odt per pixel
Commercial woodsheds (visible areas)
Pixel-level balance
01020Km
km
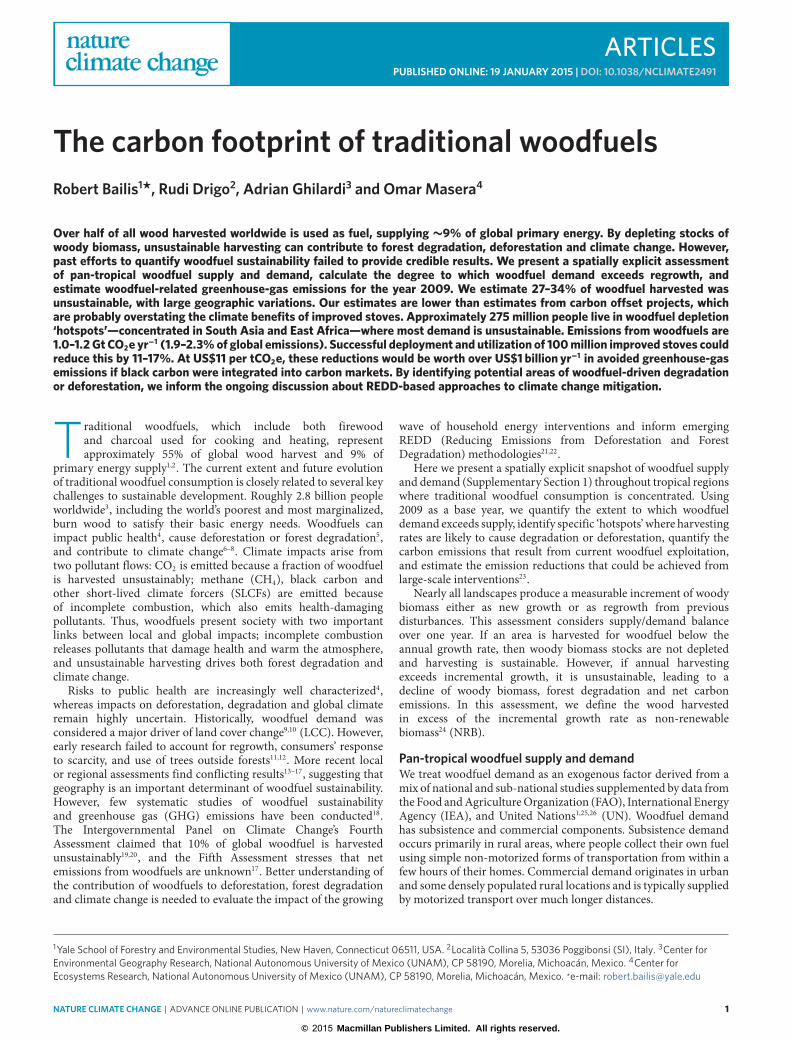
< −40,000−40,000 to −20,000−20,000 to −10,000−10,000 to −500−500 to −100−100 to −25−25 to −5−5 to 55 to 2525 to 5050 to 100> 100
Local balance
Study area
km0.0
a b
c
0 50 100 20012.5 25.0 50.0km
0 500 1,000
Figure 1 | Mapping of a high-deficit zone in East Africa. a, Pixel-level supply-demand balance. b, Local-level balance. c, Commercial balance. odt; oven-drytonnes of woody biomass.
We develop a map of supply–demand balance by estimatingharvesting pressure, first from subsistence and then commercialharvesters (Fig. 1a,b). Areas exploited to satisfy commercialdemand form a ‘woodshed’, which represents the region thatwould satisfy demand if the full mean annual increment (MAI)is used27 (Fig. 1c shows commercial woodsheds for a high-demand area of East Africa; Supplementary Fig. 5 shows theentire pan-tropics).
Woodfuels and LCCMany woodfuel-dependent regions are characterized by highrates of deforestation. Others, particularly parts of China andIndia, have experienced recent afforestation. Although not directlylinked to woodfuel demand, these processes, which we definecollectively as LCC, impact woodfuel supplies. Deforestation createslarge volumes of non-renewable woodfuel28,29, and afforestationaugments renewable woodfuel supplies by adding to the growingstock of ‘dendro-energy biomass’ (DEB). Neither process hasbeen explicitly accounted for in previous woodfuel assessments.When deforestation occurs in regions accessible to woodfuelusers, the cleared woody biomass may be used as timber andwoodfuel. Similarly, afforestation adds DEB equivalent to the MAIof the surrounding land class. However, the degree to whichLCC by-products are actually used as woodfuel is unknown. Toaccommodate this uncertainty, we explore two scenarios, describedin Table 1. In Scenario A, we assume LCC by-products are notused. In Scenario B, we assume they are used, yielding two NRBcomponents (NRBB1 and NRBB2): NRBB1 indicates the use of LCCby-products; NRBB2 indicates the wood harvested in excess of MAIto satisfy the demand that remains after accounting for the use ofthose by-products. In populated regions experiencing high rates of
deforestation, large volumes of DEB are accessible, and NRBB2 maybe zero (Supplementary Section 5).
By combining woodshed mapping of commercial demandwith localized supply–demand balances, we define the minimumquantity of NRB that would be required to meet existing demand(Supplementary Section 5). In this approach, we assume thatwoodfuel consumers manage their resources sustainably to thegreatest extent possible so that unsustainable harvesting occursonly after the sustainable supply in a given location has beenfully exploited. Thus, minimum NRB indicates the degree towhich a given region can sustainably meet woodfuel demandunder ideal management. However, ideal management is unlikely.To simulate suboptimal harvesting, we assume that harvestingsometimes exceeds sustainable levels in some areas even if thesustainable supply in an adjacent accessible area has not been fullyexploited. To estimate the extent of this deviation, we use a proxydefined by the fraction of each country’s forested area under formalmanagement plans (Methods). From this we derive an ‘expected’quantity of NRB, which we also express as a fraction of the totalharvest (fNRB). Both minimum and expected NRB are expressedin absolute terms and as a fraction of the total harvest for a givenregion. We report expected NRB below; minimum NRB is given inSupplementary Information.
Woodfuel sustainabilityWoodfuel demand in 2009 was ∼1.36Gt. If by-products ofLCC were not used (Scenario A), pan-tropical expected fNRBAwas 27–30% (367–413Mt). If by-products of LCC were used(Scenario B), we estimate they contributed 8.3% (113Mt) ofpan-tropical woodfuel supply (fNRBB1). We also find that22–25% (296–340Mt) of the remaining demand was harvested
2 NATURE CLIMATE CHANGE | ADVANCE ONLINE PUBLICATION | www.nature.com/natureclimatechange
© 2015 Macmillan Publishers Limited. All rights reserved.

NATURE CLIMATE CHANGE DOI: 10.1038/NCLIMATE2491 ARTICLES
%0−910−2021−3031−4041−5051−6061−7071−8081−9091−100
Figure 2 | Pan-tropical expected fNRBB2. Shading indicates the percentage fNRB estimated in sub-national units resulting from direct woodfuel harvesting(Scenario B2). The rectangle shows the region illustrated in Fig. 1.
Table 1 |Di�erent assumptions considering the use of LCC by-products.
Assumption Comment
A LCC by-products generated in accessible regions are not used for woodfuel.Woodfuels are harvested entirely from other sources. NRBA is calculated asthe quantity of non-renewable biomass from sources unrelated to LCC.
NRBA is applicable where LCC by-products are inaccessibleto smallholders despite being physically proximate. Thismight be the case if large-scale farming or timber extractiondrives LCC on private land that smallholders cannot enter.
B LCC by-products generated in accessible regions are used as woodfuel. Twoquantities are calculated:NRBB1 refers to the amount of LCC by-products used to meet woodfueldemand in a given region. By-products of deforestation are always considerednon-renewable and by-products of a�orestation are considered renewable.NRBB2 refers to the amount of woodfuel from other sources required to meetdemand after LCC by-products are exhausted. LCC by-products may meet100% of demand so that NRBB2=0.
The sum of NRBB1 and NRBB2 indicates the total quantityof unsustainable woodfuel consumption that occurs whenwoodfuel users have access to LCC by-products. Thesevalues are applicable in regions where LCC is drivenby smallholder agriculture or regions hosting intensecommercial woodfuel extraction. Household energyinterventions can mitigate NRBB2, but it is unclear how theywould a�ect NRBB1.
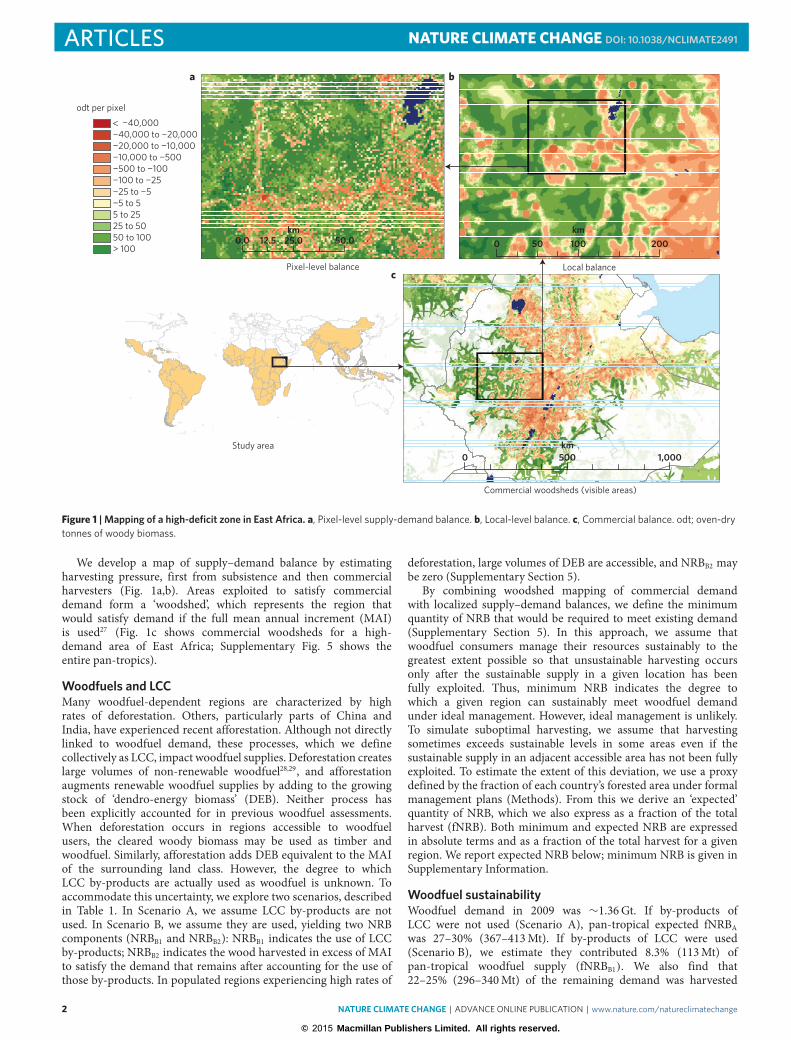
unsustainably (fNRBB2). Adding fNRBB1 and fNRBB2, the totalfraction of NRB using LCC by-products is 30–34%. The uncertaintyresults from uncertain productivity and contribution of plantations(Supplementary Section 6). This is largest in Asia, where forestplantations may be a substantial source of supply, and smallest insub-Saharan Africa, which has few plantations30. Figure 2 shows aglobal map of fNRBB2 (maps of fNRBA and fNRBB1+B2 are shown inSupplementary Fig. 7).
We definewoodfuel ‘hotspots’ as regions inwhich expected fNRBexceeds 50%, that is, regions in which most harvested woodfuelis unsustainable. Hotspots encompass ∼4% of pan-tropical areasand are inhabited by 6% of the pan-tropical population. Thelargest hotspot incorporates a swath of East Africa extendingfrom Eritrea through western Ethiopia, Kenya, Uganda, Rwandaand Burundi. Expected fNRBB2 exceeds 50% in 43 sub-nationalunits throughout this region, encompassing 26% of the region’spopulation. Additional hotspots also occur in western and southernAfrica, but these do not cover large contiguous areas (Fig. 2).Notably, much of sub-Saharan Africa is characterized by fNRBB2below 20% including provinces of Angola, Cameroon, CentralAfrican Republic, Congo, DR Congo, Mali, Mozambique, Nigeria,South Africa, Tanzania, Zambia and Zimbabwe: home to 55% ofsub-Saharan Africa’s population.
In Asia, hotspots occur in parts of Pakistan, Nepal, Bhutan,Indonesia and Bangladesh. Expected fNRBB2 in Pakistan is 79%,
the highest national value in the entire sample. In two Pakistanidivisions, fNRBB2 exceeds 90%. Notably, Asia’s woodfuel hotspotsare distinct from areas of high deforestation. For example,deforestation rates in Indonesia, Malaysia, Cambodia and Laosare among the world’s highest31, largely as a result of agriculturalexpansion16. In contrast, China and India, the largest woodfuel-consuming nations, both experienced net afforestation in recentyears30. At a national level fNRBB2 is 10–22% in China and 23–24%in India. The wide range observed in China is a result of uncertaintyin the productivity of plantation forestry, a potentially large sourceof China’s woodfuel supply (Supplementary Fig. 6).
Latin America hosts the lowest traditional woodfuelconsumption; Haiti is the only nation in which expected fNRBB2exceeds 50%. Still, fNRBB2 exceeds 30% in many sub-nationalunits including most of Dominican Republic and parts of Bolivia,Colombia, Ecuador, El Salvador, Mexico, Paraguay, Peru andVenezuela. As in Asia, high rates of deforestation are due primarilyto agricultural expansion16. By-products of LCC in many parts ofBelize, Brazil, Ecuador, Honduras, Mexico, Nicaragua, Panama,Peru and Venezuela are sufficient to meet most or all woodfueldemand (Supplementary Fig. 6).
Worldwide, over 275 million people live in woodfuel hotspots:nearly 60% in Asia, 34% in Africa, and the remaining 6% in LatinAmerica. Figure 3 shows the regional distribution of population byfNRBB2 decile.
NATURE CLIMATE CHANGE | ADVANCE ONLINE PUBLICATION | www.nature.com/natureclimatechange 3
© 2015 Macmillan Publishers Limited. All rights reserved.
ARTICLES NATURE CLIMATE CHANGE DOI: 10.1038/NCLIMATE2491
40
Latin America and Caribbean
Asia Africa World
30
20
Perc
enta
ge o
f pop
ulat
ion
10
efNRBB2 efNRBB2 efNRBB2 efNRBB2
0
0−1020−30
40−50
60−70
80−900−10
20−30
40−50
60−70
80−900−10
20−30
40−50
60−70
80−900−10
20−30
40−50
60−70
80−90
40
30
20
10
0
40
30
20
10
0
40
30
20
10
0
Figure 3 | Distribution of regional population by expected fNRBB2 decile.
GHG emissionsClimate impacts arise from emissions of well-mixed GHGs, whichinclude CO2 and CH4, and SLCFs, which include black andorganic carbon aerosols, CO and volatile organic compounds(VOCs). Emissions of well-mixed GHGs and SLCFs as a resultof unsustainable harvesting and incomplete combustion fromtraditional woodfuels (Methods) were 1.0–1.2 Gt of CO2 equivalent(CO2e) in 2009: 1.9–2.3% of global emissions and 3.5–4.3% ofemissions in the pan-tropical region32. National emissions varywidely (Supplementary Table 2). India and China have the largestpopulations of traditional woodfuel users and highest overallemissions, but relatively low per capita emissions. In contrast,Kenya, Ethiopia and Uganda, which constitute part of the EastAfrican hotspot, rank among the highest emitters in absolute andper capita terms.
There is geographic variation in the mix of pollutants emittedby traditional woodfuels because of variations in fNRB andin the extent of charcoal use, which has different emissioncharacteristics from fuelwood (Methods). Globally, after accountingfor uptake by the fraction of woody biomass that is sustainablyharvested, CO2 contributes 34–45% of total climate forcing.Black carbon has a similar impact, contributing 35–42%, andCH4, CO and VOCs account for the remaining 31–37%. Thisvariation has policy implications; at present, carbon marketsvalue reductions of CO2, CH4 and N2O, but do not value blackcarbon abatement, which favours interventions in regions withhigh fNRB.
Mitigation potential of e�cient cookstovesInterventions in household energy have been implemented fordecades with multiple objectives33: including forest conservation;health improvements; and climate change mitigation, as well aspoverty alleviation and economic development. TheGlobal Alliancefor Clean Cookstoves (GACC), the largest stove programme so far,proposes to deploy 100 million improved stoves by 2020 (ref. 23).
With large spatial variation in fNRB, impacts of interventionsvary with geographic patterns of stove uptake. We examinethis variation with four intervention scenarios (Methods andSupplementary Section 7).
We optimistically assume that 100 million state-of-the-artimproved cookstoves are successfully disseminated according todifferent scenarios. Resulting emission reductions range from98–161MtCO2e yr−1. The largest reductions result from targetingthe highest per capita woodfuel consumers. This is followed byreductions achieved by targeting consumers in regions with thehighest rates of NRB, although uncertainties in emission reductionsfrom individual stoves make the difference insignificant. Thesmallest reductions result from dissemination in the most business-friendly countries. The emission reductions achieved by prioritizinghealth improvements fall between these extremes (Fig. 4).
Discussion and implicationsOne limitation of the study is a lack of reliable woodfuelconsumption data. When possible, we used national and sub-national data sets. However, for most countries, we relied ondata compiled by international organizations containing unknownuncertainties that make it difficult to communicate the uncertaintyin these results. A second limitation is that the analysis considersa single year and does not account for potential behaviouralchanges among woodfuel users in response to scarcity. Potentialresponses include decreasing consumption, switching to non-woody fuels, or taking measures to increase woody biomass supply.Such responses are site-specific and difficult to model globally,but they could be incorporated in national and sub-nationaldynamic models.
Using the best available data, we estimate that unsustainableharvesting and incomplete combustion contributed 1.9–2.3% ofglobal emissions of well-mixed GHGs and SLCFs in 2009. Globally,emissions were split evenly between CO2, black carbon and otherSLCFs. In 12 nations, emissions from woodfuels were 50% or
4 NATURE CLIMATE CHANGE | ADVANCE ONLINE PUBLICATION | www.nature.com/natureclimatechange
© 2015 Macmillan Publishers Limited. All rights reserved.

NATURE CLIMATE CHANGE DOI: 10.1038/NCLIMATE2491 ARTICLES
−161MtCO2e
−158MtCO2e
−135MtCO2e
−98MtCO2e
BaselineBaselineBaseline Intervention
Uptake of CO2
Charcoal emissions
Fuelwood emissions
Net emissions
1,000
750
500
250
0
−250
−500
−750
InterventionInterventionBaseline Intervention
Best business environmentHighest burden ofdisease from HAP
Highest efNRBAHighest woodfuelconsumption
MtC
O2e
Figure 4 | Annual emissions and emission reductions resulting from fulfilling GACC’s objective of 100 million stoves disseminated through interventionswith di�erent priorities. Bars indicate GHG emissions/uptake, data points show net emissions, error bars indicate standard deviations, and numbersindicate annual reductions achieved by shifting from baseline to intervention.
Highest per capitawoodfuel consumption
Brazil Ghana Paraguay
Highest burden of diseasefrom HAP exposure
Highest rates of NRButilization
EritreaIndonesiaRwandaSudan
Central African RepMalawi
MaliNiger
Timor-Leste
Togo
BurundiBurkina Faso
GambiaHaiti
Pakistan
South AfricaSwaziland
BhutanChad Madagascar
MozambiqueMyanmar
Sierra LeoneTanzaniaZambia
Zimbabwe
DR CongoCôte d’Ivoire
GuineaGuinea-Bissau
LaosLiberia
EthiopiaLesothoSomalia
KenyaNepal
Uganda
GuatemalaGuyana
HondurasPapua New Guinea
ChileCongo
BangladeshDominican Rep
BeninCambodiaCameroon
Figure 5 | Countries with highest per capita woodfuel demand, highest expected fNRBB2, and highest burden of disease from HAP exposure.
more of the country’s total emissions, demonstrating the dominantrole that traditional woodfuels have in places with few industrialemissions (Supplementary Table 2).
Our estimates of fNRB are considerably lower than estimatesused by woodfuel projects in the carbon market. Project revenuesdepend directly on fNRB. A review of 305 carbon projects in 45
NATURE CLIMATE CHANGE | ADVANCE ONLINE PUBLICATION | www.nature.com/natureclimatechange 5
© 2015 Macmillan Publishers Limited. All rights reserved.

ARTICLES NATURE CLIMATE CHANGE DOI: 10.1038/NCLIMATE2491
countries reveals a median fNRB of 90% with minimal regionalvariation (Supplementary Section 6). We identified only fourcountries in which sub-national fNRB exceeds 80% as a result ofwoodfuel demand. Just 8%of existing projects fall within these areas.Thus, project developers are very likely overstating the emissionreduction potential of improved stoves.
Household energy forms a major component of the UnitedNations’ promotion of ‘Sustainable Energy for All’34. However,high upfront costs are a barrier to implementing sustainablesolutions. Despite finding lower fRNB values than market actorsassume, successfully disseminating 100 million state-of-the-artcookstoves would reduce traditional woodfuel emissions by98–161MtCO2e yr−1. At US$11 per tCO2e, the average price ofoffsets from stove projects in 2012 (ref. 35), these reductions wouldbe valued at US$1.1–1.8 billion if black carbon can be integratedinto carbon markets. This far exceeds current investments inhousehold energy in the Global South, which do not garner thesame level of finance as other major health impacts such as malaria,tuberculosis and HIV. In addition, we find that policy objectivesare important determinants of emission reductions, introducingvariation of 60%. Countries with high per capita woodfuel use orhigh NRB rates yield the largest emissions reductions. However,neither group overlaps completely with countries experiencing thehighest disease burden from woodsmoke exposure (Fig. 5). Thus,improved stove dissemination among populations suffering fromthe largest disease burden results in fewer emission reductions thandissemination in regions with high rates of woodfuel consumptionor unsustainable harvesting. However, we identified a smallgroup of countries that rank poorly in all categories (red text inFig. 5). Others rank poorly in two out of three categories (bluetext in Fig. 5). These countries deserve clear prioritization. Thesub-national data set generated by this research can be usedto more accurately identify high-priority areas and pinpointlocations where interventions would have the greatest impact.Moreover, by identifying areas where woodfuel-driven degradationor deforestation is likely to occur, our assessment fills a criticalgap in knowledge about the extent to which woodfuel demandmay contribute deforestation or forest degradation and informsemerging REDD-based approaches to climate change mitigation.
MethodsWe use the WISDOM model36 (Supplementary Section 1) to characterizesustainability and net carbon emissions of traditional woodfuels in 90 developingcountries located primarily in tropical regions, using 2009 as a base year.Woodfuel demand was derived from national and sub-national studies(Supplementary Section 1) supplemented by data from the FAO, IEA and UN(refs 1,25,26). From these data, we mapped subsistence and commercialcomponents of traditional woodfuel demand. Subsistence demand occurs inrural areas, where people use woodfuels they collect themselves or purchaselocally. This wood is harvested within a few hours’ walking distance. Commercialdemand originates in urban and some densely populated rural locations and iscarried using motorized transport over longer distances (SupplementarySection 1).
Woodfuel supply is defined by the productivity of woody biomass, which wemodel as a function of above-ground biomass (AGB) stock. We use recent mapsof land cover and ecological zones37,38 to define a broad system of land units,including cropland and crop mosaic (often neglected in assessments of woodfuelsupply). Each land unit is assigned an AGB stock using three types of source:AGB distribution maps; geo-referenced field plots; and forest inventories fromknown locations for specific forest types (Supplementary Section 1). AGBdistribution was derived from two recent data sets39,40. To accommodatedisagreements in the two data sets, we gathered data from hundreds ofgeo-referenced field plots and forest inventories. We subtract woody componentsnot typically used for woodfuels (twigs, leaves and stumps), to build a map ofDEB stock (Supplementary Fig. 2). We then estimate woodfuel supply as the MAIof DEB, which we model as a functional relationship between ∼2,800 spatiallyexplicit field observations of MAI and corresponding AGB (SupplementarySection 2).
We then make adjustments for potential supply from plantations41,42(Supplementary Section 3) and accessibility. Accessibility has legal and physical
determinants. Legal accessibility is based on IUCN (International Union forConservation of Nature) categorization of ‘Protected Areas’ (SupplementarySection 3). Physical accessibility is a function of the effort required to accesswoody biomass from a consumption site. We use an inverse function of frictionin geographic space for subsistence and commercial demand (SupplementarySection 3) and map the distribution of accessible DEB (Supplementary Fig. 3and Table 1).
LCC is accommodated by estimating the amount of DEB produced bydeforestation and afforestation processes based on data from FAO (ref. 1)distributed spatially using data from Forest Monitoring for Action43. Biomassfrom large-scale deforestation in remote areas of the Amazon or Indonesianrainforests is often burned on site44,45. Only LCC occurring in areas that areaccessible (as defined above) contributes to NRB. The actual quantity of LCCby-products used as fuel is unknown. Even in accessible areas, some materialsmay be burned in situ or left to decay. To accommodate this uncertainty,we explore two variants of LCC by-product utilization (Table 1 andSupplementary Fig. 5).
We combine the commercial and subsistence supply–demand maps to definethe minimum quantity of NRB that would be required to meet existing demand(Supplementary Section 4). This assumes that unsustainable harvesting occursonly after the sustainable supply in a given location has been fully exploited.However, ideal management is unlikely. To simulate more realistic harvesting, weassume that harvesting exceeds sustainable levels in some areas even if thesustainable supply in an adjacent area has not been fully exploited. To estimatethe extent of this deviation, we use a proxy defined by the fraction of eachcountry’s forested area under formal management plans30 (SupplementarySection 5).
We then define local balance assuming subsistence users do not travel morethan a few kilometres to access woodfuels46,47 (Supplementary Section 4, Fig. 1aand Supplementary Fig. 4). Then we assess the commercial supply–demandbalance in urban centres and rural regions with large deficits by defining a‘woodshed’, which represents the region that a commercial demand centre needsto exploit to satisfy demand assuming that the full MAI is used27. We assume athreshold of 12-hour one-way travel. When several consumption sites areconsidered simultaneously, the woodshed is determined by the aggregate demandfrom all sites (Supplementary Section 4, Fig. 1b and Supplementary Fig. 5).
Annual GHG emissions from traditional woodfuels are estimated byaccounting for two flows of GHGs. The first flow consists of combustionemissions including well-mixed GHGs (CO2, CH4 and N2O) and SLCFs (blackcarbon, organic carbon, CO and VOCs). The second flow consists of CO2
sequestered by the renewable fraction of harvested woodfuel. We use 100-yrglobal warming potentials to estimate climate impacts and we derive emissionsfrom published analyses of woodfuel combustion and charcoal pyrolysis48.Sequestered CO2 comes from results of this study (Supplementary Section 4).
To investigate the implications of GACC’s 100 million-stove objective, wedefine scenarios representing broad goals of cookstove dissemination: climatechange mitigation; decreasing dependence on NRB; reducing exposure tohousehold air pollution (HAP); and economic development. Although these arestylized options, we chose these four scenarios to demonstrate that there aretrade-offs between health and environmental policy objectives. We examine theoutcome of focusing specifically on these objectives by targeting stovedissemination at the locations that rank among the highest in one of fourcategories described in Supplementary Section 6.
Received 25 July 2014; accepted 4 December 2014;published online 19 January 2015
References1. FAOSTAT Forestry Production and Trade (UN FAO, 2013);
http://faostat3.fao.org/faostat-gateway/go/to/download/F/*/E2. Renewable Energy Policy Network for the 21st century (REN21)Renewables
Global Status Report: 2013 Update Report No., 177 (REN21 Secretariat, 2013).3. Bonjour, S. et al. Solid fuel use for household cooking: Country and
regional estimates for 1980–2010. Environ. Health Perspect. 121,784–790 (2013).
4. Lim, S. S. et al. A comparative risk assessment of burden of disease and injuryattributable to 67 risk factors and risk factor clusters in 21 regions, 1990–2010:A systematic analysis for the Global Burden of Disease Study 2010. Lancet 380,2224–2260 (2012).
5. Rudel, T. K. The national determinants of deforestation in sub-Saharan Africa.Phil. Trans. R. Soc. B 368, 20120405 (2013).
6. Bailis, R., Ezzati, M. & Kammen, D. M. Mortality and greenhouse gasimpacts of biomass and petroleum energy futures in Africa. Science 308,98–103 (2005).
7. Bond, T. C. et al. Bounding the role of black carbon in the climate system: Ascientific assessment. J. Geophys. Res. 118, 5380–5552 (2013).
6 NATURE CLIMATE CHANGE | ADVANCE ONLINE PUBLICATION | www.nature.com/natureclimatechange
© 2015 Macmillan Publishers Limited. All rights reserved.
NATURE CLIMATE CHANGE DOI: 10.1038/NCLIMATE2491 ARTICLES8. Ramanathan, V. & Carmichael, G. Global and regional climate changes due to
black carbon. Nature Geosci. 1, 221–227 (2008).9. Eckholm, E. The Other Energy Crisis: Firewood Report No. 22
(Worldwatch, 1975).10. Eckholm, E. Fuelwood: The Energy Crisis That Won’t Go Away
(Earthscan, 1984).11. Leach, G. & Mearns, R. Beyond the Woodfuel Crisis: People, Land, and Trees in
Africa (Earthscan, 1988).12. Arnold, J. M. & Dewees, P. A. Farms, Trees and Farmers: Responses to
Agricultural Intensification (Earthscan, 1997).13. Hansfort, S. & Mertz, O. Challenging the woodfuel crisis in West African
woodlands. Hum. Ecol. 39, 583–595 (2011).14. Singh, G., Rawat, G. S. & Verma, D. Comparative study of fuelwood
consumption by villagers and seasonal ‘‘Dhaba owners’’ in the tourist affectedregions of Garhwal Himalaya, India. Energy Policy 38, 1895–1899 (2010).
15. Mayaux, P. et al. State and evolution of the African rainforests between 1990and 2010. Phil. Trans. R. Soc. B 368, 20120300 (2013).
16. Hosonuma, N. et al. An assessment of deforestation and forest degradationdrivers in developing countries. Environ. Res. Lett. 7, 044009 (2012).
17. Smith, P. et al. in Climate Change 2014: Mitigation of Climate Change(eds Edenhofer, O., Pichs-Madruga, R. & Sokona, Y.) 811–922 (IPCC,Cambridge Univ. Press, 2014).
18. Drigo, R.WISDOM Case Studies (2014); http://www.wisdomprojects.net/global/cs.asp
19. Statistics Balances (International Energy Agency, 2012);http://www.iea.org/stats/index.asp
20. Rogner, H-H. et al. in Climate Change 2007: Mitigation of Climate Change(eds Metz, B. et al.) 95–116 (IPCC, Cambridge Univ. Press, 2007).
21. Alliance Mission and Goals (Global Alliance for Clean Cookstoves, 2014);http://www.cleancookstoves.org/the-alliance
22. Angelsen, A. et al. Realising REDD+: National Strategy and Policy Options(Center for International Forestry Research (CIFOR), 2009).
23. Subramanian, M. Global health: Deadly dinners. Nature 509, 548–551 (2014).24. Johnson, M., Edwards, R. & Masera, O. Improved stove programs need robust
methods to estimate carbon offsets. Climatic Change 102, 641–649 (2010).25. IEA World Energy Statistics and Balances (International Energy Agency, 2013);
http://www.oecd-ilibrary.org/statistics26. UN Statistics Division Energy Statistics Database (United Nations, 2013);
http://data.un.org/Explorer.aspx27. Drigo, R. & Salbitano, F.WISDOM for Cities: Analysis of Wood Energy and
Urbanization Using WISDOMMethodology (FAO Forestry DepartmentReport, 2008).
28. Bailis, R. Modeling climate change mitigation from alternative methods ofcharcoal production in Kenya. Biomass Bioenergy 33, 1491–1502 (2009).
29. Mwampamba, T. H., Ghilardi, A., Sander, K. & Chaix, K. J. Dispelling commonmisconceptions to improve attitudes and policy outlook on charcoal indeveloping countries. Energy Sustain. Dev. 17, 75–85 (2013).
30. Global Forest Resources Assessment 2010 (UN FAO, 2010).31. Hansen, M. C. et al.High-resolution global maps of 21st-century forest cover
change. Science 342, 850–853 (2013).32. EDGAR Database (European Commission—Joint Research Centre, 2014);
http://edgar.jrc.ec.europa.eu/overview.php?v=GHGts1990-201033. Simon, G. L., Bailis, R., Baumgartner, J., Hyman, J. & Laurent, A. Current
debates and future research needs in the clean cookstove sector. Energy Sustain.Dev. 20, 49–57 (2014).
34. Bazilian, M., Cordes, L., Nussbaumer, P. & Yager, A. Partnerships for access tomodern cooking fuels and technologies. Curr. Opin. Environ. Sustain. 3,254–259 (2011).
35. Peters-Stanley, M., Yin, D., Castillo, S., Gonzalez, G. & Goldstein, A.Maneuvering the Mosaic: State of the Voluntary Carbon Markets 2013Report No. 105 (Ecosystem Marketplace and Bloomberg New EnergyFinance, 2013).
36. Masera, O., Ghilardi, A., Drigo, R. & Trossero, M. A. WISDOM: A GIS-basedsupply demand mapping tool for woodfuel management. Biomass Bioenergy30, 618–637 (2006).
37. European Space Agency GlobCover Portal (European Space Agency, 2011);http://due.esrin.esa.int/globcover/
38. Global Ecological Zones (UN FAO, 2011); http://www.fao.org/geonetwork/srv/en/metadata.show?id=1255
39. Baccini, A. et al. Estimated carbon dioxide emissions from tropicaldeforestation improved by carbon-density maps. Nature Clim. Change 2,182–185 (2012).
40. Saatchi, S. S. et al. Benchmark map of forest carbon stocks in tropical regionsacross three continents. Proc. Natl Acad. Sci. 108, 9899–9904 (2011).
41. Duku, M. H., Gu, S. & Hagan, E. B. A comprehensive review of biomassresources and biofuels potential in Ghana. Renew. Sustain. Energy Rev. 15,404–415 (2011).
42. Ajoku, K. in Bioenergy for Sustainable Development in Africa (eds Janssen, R. &Rutz, D.) Ch. 12, 131–146 (Springer, 2012).
43. Wheeler, D., Kraft, R. & Hammer, D. Forest Clearing in the Pantropics:December 2005-August 2011Working Paper 283 (Center for GlobalDevelopment, 2011).
44. Carlson, K. M. et al. Committed carbon emissions, deforestation, andcommunity land conversion from oil palm plantation expansion in WestKalimantan, Indonesia. Proc. Natl Acad. Sci. 109, 7559–7564 (2012).
45. Gatti, L. et al. Drought sensitivity of Amazonian carbon balance revealed byatmospheric measurements. Nature 506, 76–80 (2014).
46. An, L., Linderman, M., Qi, J., Shortridge, A. & Liu, J. Exploring complexity in ahuman–environment system: An agent-based spatial model formultidisciplinary and multiscale integration. Ann. Assoc. Am. Geogr. 95,54–79 (2005).
47. Bhatt, B. P. & Sachan, M. S. Firewood consumption along an altitudinalgradient in mountain villages of India. Biomass Bioenergy 27, 69–75 (2004).
48. Jetter, J. et al. Pollutant emissions and energy efficiency under controlledconditions for household biomass cookstoves and implications for metricsuseful in setting international test standards. Environ. Sci. Technol. 46,10827–10834 (2012).
AcknowledgementsThis research was funded by the Global Alliance for Clean Cookstoves, an initiativesupported by the UN Foundation.
Author contributionsR.D., R.B., A.G. and O.M. designed the study; R.D. conducted the pan-tropical WISDOManalysis and constructed the NRB model; R.B. calculated GHG emissions and emissionreductions; R.D., R.B., A.G. and O.M. wrote the paper.
Additional informationSupplementary information is available in the online version of the paper. Reprints andpermissions information is available online at www.nature.com/reprints.Correspondence and requests for materials should be addressed to R.B.
Competing financial interestsThe authors declare no competing financial interests.
NATURE CLIMATE CHANGE | ADVANCE ONLINE PUBLICATION | www.nature.com/natureclimatechange 7
© 2015 Macmillan Publishers Limited. All rights reserved.