The Car in British Society - RAC Foundation
158
The Car in British Society Karen Lucas and Peter Jones
Transcript of The Car in British Society - RAC Foundation

The Car inBritish Society
Karen Lucas and Peter Jones

The Royal Automobile Club Foundation for Motoring Limited is a charity established to promote the environment,economic, mobility and safety issues relating to the use of motor vehicles.
RAC Foundation89-91 Pall MallLondonSW1Y 5HS
Tel no: 020 7747 3445www.racfoundation.org
Registered Charity No. 1002705April 2009 © Copyright Royal Automobile Club Foundation
This report has been prepared for the RAC Foundation by Elizabeth Gilliard, Peter Jones, Scott Le Vine, KarenLucas and John Polak. The report content is the view of the authors and does not necessarily represent the views ofthe RAC Foundation.

The Car inBritish Society
Karen Lucas and Peter Jones

Project team
Elizabeth Gilliard, Independent Consultant.
Peter Jones, University College London.
Scott Le Vine, Imperial College London.
Karen Lucas, University of Oxford.
John Polak, Imperial College London.
Acknowledgements
The authors would like to acknowledge the contribution of Anthony Psaila our focusgroup facilitator and Roselle Thoreau, University College London, for her assistance onthe literature review and expert seminar. We would also like to thank the RoyalAutomobile Club Foundation’s Steering Group for their valuable comments and advice.
Royal Automobile Club Foundation Steering Group
David Holmes CB, Chairman.
Stephen Glaister CBE, Director.
Elizabeth Dainton, Head of Research.
David Leibling, Royal Automobile Club Foundation Public Policy Committee.
Philip Wood, Public Policy Committee Foundation Public Policy Committee.
Thanks also go to the Foundation staff: Jo Abbott, Fiona Coyne and Philip Gomm.

ContentsForeword 7
Executive summary 11
1 Introduction 191.1 Background to the study 201.2 Current policy context 211.3 Study objectives 211.4 Research methods 221.5 Report outline 23
2 The dominance of the car in contemporary British society 252.1 Introduction 262.2 Car and licence ownership 272.3 Patterns of car use in 2006 322.4 Car use among non-car owning households 452.5 Conclusions 50
3 Transport trends over the last two decades 533.1 Introduction 543.2 Car ownership, licensing and availability 553.3 Transport, land uses and journey speeds 613.4 Trends in travel patterns over the last two decades 663.5 Differences in car use by traveller characteristics over time 693.6 Has car use stabilised? 743.7 Conclusions 79
4 Public attitudes towards cars and car use 814.1 Introduction 824.2 Public attitude surveys 834.3 Benefits and disbenefits of car use 914.4 Conclusions 106
5 Car use: a matter of choice or necessity? 1095.1 Introduction 1105.2 Factors influencing car ownership and travel choices 1115.3 The nature of car ‘dependence’ 1155.4 The dynamics of car ‘dependence’ 1185.5 Current degrees of car ‘dependence’ 1195.6 Conclusions 122
RAC Foundation for Motoring The Car in British Society 5

Contents
6 The cost of adjustment to individuals and society in movingto a low Carbon future 1256.1 Introduction 1266.2 Delivering a sustainable transport system 1276.3 Local policy makers’ perspectives 1286.4 Costs of adjustment to significantly reduced car use 1326.5 Public perceptions of the cost of adjustment 1366.6 Conclusions 140
7 Conclusions and recommendations 143
References 147
Appendices 153
6 The Car in British Society RAC Foundation for Motoring

RAC Foundation for Motoring The Car in British Society 77 The Car in British Society RAC Foundation for Motoring
Foreword
Foreword
Royal Automobile Club Foundation
Cars are an integral part of the way we live. Most of our journeys are by car. Overthree-quarters of households have at least one car. Seventy per cent of adults havedriving licences.
The present level of car ownership has developed over the last fifty years. Cars havebrought enormous advantages to people and the economy. They have increased thechoices that people have about where they live, work, are educated and spend theirleisure time. In particular, the growth in car ownership has gone hand in hand with thewidening of opportunities for women. The highest growth in ownership has been seenin households in the lowest income group. And cars are an important form of transporteven for families who do not own one.
The expansion of car numbers has been accompanied by changes in land use –increasingly dispersed patterns of settlement and employment, the spread of out-of-town shopping centres, and the concentration of public services such as hospitals.These changes have made owning a car a necessity for many because such scattereddevelopment is hard for public transport to serve.
The growth in car ownership has had no encouragement from government – central orlocal. Quite the reverse: road building has been cut well below the level of demand;parking has become more difficult and costly in most places; and the cost of running acar (as opposed to buying one) has risen not least because of the price of fuel and thetax levied on it. The attitudes of the authorities in part reflects their appreciation that theunrestrained use of motor vehicles, especially in urban areas, produces real publicdisadvantages in terms of congestion and pollution.
Particularly over the last ten years, Government has supported measures discouragingcar use in favour of walking, cycling and public transport. [It has legislated for trafficreduction targets in local areas]. Such measures have had some success in eradicatingmarginal car journeys. But more radical measures to reduce congestion and changedriver behaviour through pricing schemes have found no popular support and have ineffect been abandoned, the exception being the small area in central London that isuniquely well served by public transport.
It is surprising that such radical policies to fundamentally change the way people livetheir lives should have been embarked on with so little research into the factors thatlead people to own and use cars: what might persuade them to change their behaviour;and what the costs of transition might be.
To stimulate thinking on these complex and critical issues the Royal Automobile ClubFoundation published in 1995 a report on ‘Car Dependence’. Since then, despiteGovernment policies to switch investment into public transport and to encourage its
8 The Car in British Society RAC Foundation for Motoring
Foreword
use, the growth in car numbers has continued unchecked: there are seven millionmore cars now than there were then, and the Government’s forecasts predictfuture increases.
The present report by an independent research team from University College London,Imperial College London and the University of Oxford investigates the changes thathave occurred since the 1995 report. It studies attitudes towards cars, and the placeof the car in today’s society. It looks too at the social and economic consequences ofusing more coercive methods to change behaviour.
Neither the authors nor the Foundation would claim this report is the last word on thesubject of cars and society. But we hope it will stimulate further work and seriousdiscussion on a subject seriously neglected, but central to future transport policy.
David Holmes CBChairmanRoyal Automobile Club Foundation
April 2009
RAC Foundation for Motoring The Car in British Society 9


RAC Foundation for Motoring The Car in British Society 1111 The Car in British Society RAC Foundation for Motoring
Executive Summary

Executive Summary
This report describes a scoping study into the changing nature of car ownership anduse within British society since the previous Car Dependence study, published by theRoyal Automobile Club Foundation in 1995. It draws on a reanalysis of the NationalTravel Survey, a review of international literature and British attitude surveys, andfindings from a small number of exploratory focus groups and professional interviewscommissioned as part of this study.
The study finds that the car is now the dominant mode of travel in most people’s dailylives, and is seen as a major asset by most households. Whilst car use per person hasgrown for nearly half a century, this trend now seems to have come to a halt, althoughthe reasons for this are not clear. Our analysis identifies that since the early 2000s,annual car mileage has grown only in line with increases in the adult population.However, levels of car use are now well above those considered to be sustainablenationally, as outlined in the latest Department for Transport’s Delivering a SustainableTransport Strategy document (2008). Our report raises important issues concerning thepotential economic and social consequences of substantial ‘non voluntary’ reductions incar use in the move towards a low carbon economy.
Key findings
1. Car ownership and use have continued to grow and extend across the populationsince the late eighties and are now embedded into most aspects of daily life inBritain. However, whilst car mode share (driver and passenger), as a percentage ofall person trips, rose from 46% in 1975 to 63% in 2002, it has not increased betweenthen and 2006.
2. Low-income households have experienced most growth in car ownership and useover the last ten years. There has been some convergence in car use between low-income households and the average population, but the difference is still large.Those without regular access to a car have lower overall trip rates and are traveldisadvantaged in a number of respects.
3. Whilst overall road traffic has continued to grow (mainly due to the increasednumber of vans in the fleet), the car and taxi component has grown at a slower ratein recent years, and since 2002 has stabilised on a per adult basis. This may be dueto a number of factors, such as the completion of the major new road capacityprogramme and the associated dispersion of land uses, the changing socio-demographic profile of the car driving population or the growth in traffic congestion;other transport policies may have had some influence, but the evidence is unclear.
4. In national attitude surveys and our focus groups, people regularly referred to theirwork or home location being the main reason for needing a car and said that groceryshopping was the main trip they couldn’t manage without a car. After-school childescort trips were also given as an important reason for many parents needing a car.
12 The Car in British Society RAC Foundation for Motoring

Executive Summary
5. Many people from non-car owning households rely heavily on their friends andfamilies to drive them around in the absence of alternative travel choices. Peoplewho do not own cars or cannot not drive often said they felt isolated and a burdenon their friends and families.
6. Whilst the car is seen to have a wide range of benefits, most people also recognisethe disbenefits of car ownership and use. The most significant are the costs ofownership and use and although some people said they would prefer not to drive,they felt they had no choice.
7. Local transport authority car reduction policies primarily focus on car usemanagement and voluntary behaviour change programmes. Many local authoritiesare taking a more segmented social marketing approach although there appears tobe little certainty amongst their officers about how the Government’s new 80%reductions in CO2 emissions can be met nationally. This study aims to informthat debate.
Current patterns of car ownership and use
Over three quarters of households now own at least one car, and 70% of adults havea driving licence. As a consequence, the car dominates most people’s daily travelpatterns. The average citizen makes two-thirds of trips by car and three-quarters oftheir weekly mileage the same way. Even amongst the lowest household incomequintile where car ownership levels are much lower than for the average population,cars are used for 45% of daily trips and 65% of travel mileage. Forty percent ofhousehold members in this quintile report travelling by car at least once a week;however, they account for only around one-tenth the car trips made by members ofone car households, and they make far fewer trips in a week overall, using any modeof transport.
Trends in car ownership and use since 1989
Car ownership grew throughout the period from 1989 to 2006, both on a per householdand a per capita basis, as did driving licence holding. Reflecting these trends, car usehas extended to all sectors of the population. However, amongst the population as awhole, the growth in per capita car use has stabilised in recent years. The percentageof weekly mileage by car peaked in 1995 since when it has dropped back slightly; themodal share of trips by car has stabilised more recently, since 2002.
Continuing growth in car ownership combined with a stabilisation in car use implies thatthe intensity of use of the average car must have declined over time. In fact, thenumber of car trips has dropped from 30 trips per week per car in 1989 to 24 trips per
RAC Foundation for Motoring The Car in British Society 13

Executive Summary
week per car in 2006 – a 20% drop in all. The pattern for distance is more complex,with a gradual increase from 1989 up to 1996 (up from 142 to 152 miles), followed by agradual decline, down to 132 miles per car per week in 2006.
One possible explanation for this apparent stabilisation may be the result ofconstraining socio-demographic factors, such as the increase in lower income andolder drivers who tend to travel less, bringing the overall averages down. There hasbeen convergence in total car modal shares between men and women. Men makemore trips as drivers whilst women make more as passengers. Amongst drivers agedbetween 16 – 29 years, a reduction in the number of miles travelled by car has beenrecorded. However, the 70+ age group has been responsible for offsetting these figuresby travelling further and more often in recent years. There has been relatively littleincrease in the proportions of trips and distances travelled by car by the top twoincome groups since 1989. However the proportions have increased considerably inthe lower income quintiles over the last ten years, which has led to some convergencein car use between income groups, but the differences are still large.
Other possible explanations for the levelling off in overall car use might include anincrease in the number of people living in larger settlements, with better local access togoods and services by non-motorised modes, and in areas with good public transportaccessibility. However, evidence from the National Travel Survey (NTS) does not showany consistent trends of this type. It might also be associated to some extent withincreasing levels of international travel thereby reducing annual travel rates in the UK,or with an increase in traffic congestion on Britain’s roads; the NTS does suggest adrop in average speeds by car in recent years.
Public attitudes towards the car
Our analysis of the published survey data suggests that people’s attitudes to drivinghave remained fairly consistent over the last twenty years, with between 80 to90 percent of people still saying that they would find it difficult to adjust their lifestylesto living without a car. During the last three to four years there appears to be a slightincrease in the numbers of drivers who say they would be prepared to use their carsless if public transport were better. It is unclear whether this is because people thinkpublic transport is getting worse over time or whether their attitudes towards publictransport have become more positive.
Various surveys have found that the majority of the population (even those who do notthemselves own cars) tends to favour car travel over any other mode for day-to-daytravel. The wide-ranging benefits of car-based travel are discussed in some academicliterature in terms of convenience, coverage, flexibility, security and status. However,there is also a considerable and growing body of literature referring to the disbenefits of
14 The Car in British Society RAC Foundation for Motoring

Executive Summary
mass car ownership. These include traffic congestion, traffic accidents, the effects ofvehicle emissions on climate change and air quality, and poor public health resultingfrom the car replacing walking as a means of travel.
Focus groups which included members of the public broadly supported the findings ofour literature review. It was confirmed that car owners value highly the freedom andindependence having a car offers, as well as wider access to goods and services.Conversely, public transport is seen as being outside personal control and manypeople without cars to whom we spoke were still largely reliant on their car owningfriends and families to get them to the places they needed to go. This sometimes madethem feel a burden and isolated and was a particular problem for the older people,single parents and rural dwellers in the groups.
Many people in the groups acknowledged that there were also disbenefits to carownership and use, both for themselves and their families and wider society. Manypeople noted the considerable expense of maintaining and running a car and therewere at least one or two ‘reluctant drivers’ in each of the five groups. Some said the carmade them lazy and expressed the desire to walk or use public transport more. Theyfelt this was often impossible because these alternatives were not available or theirlives were too busy to allow for such a switch. However, it should be noted that inalmost all cases participants felt the benefits of a car far outweighed its disbenefitseither to themselves or to wider society.
Car use: choice or necessity?
There have been numerous attempts in the literature to understand the theoriesunderlying people’s car use behaviours. It is clear that the influence of the car works atmany levels, both physical and psychological. But in many situations it is not the actualcar that people are dependent on, rather what it delivers for them in the context of timeconstrained, dispersed and highly security conscious lifestyles. Often there arealternative forms of transport available but they are generally perceived by the publicas less convenient and reliable and sometimes more expensive.
In the focus groups, people were able to identify when and where they were using theircars out of choice or convenience and when out of necessity for their own or theirfamily’s well-being. Children’s escort trips were seen as a significant factor in peoplebeing car reliant amongst parents in all the groups (but most of the people we spoke towere dependent on their cars, to varying degrees, for the majority of their trips). Anumber of people said that travelling to work and servicing family needs such asshopping were the prime motivations for using their cars and for which they felt theycould least do without a car.
RAC Foundation for Motoring The Car in British Society 15

Executive Summary
The population collectively engages in a very wide range of activities that support manydifferent lifestyles. Some of these activities are carried out at home but most requiretravel and tend to be accessed by car. In several instances these trips could be madeby non-car modes although with varying degrees of difficulty. In many cases, however,there are currently no reasonable or practicable transport alternatives to car use thatcan sustain the kinds of activity patterns and lifestyles that people have built aroundtheir daily use of the car. These different degrees of car dependence are represented inFigure 1, with the size of each area roughly corresponding to the relative importance ofthat form of car use. The ‘core’ car trips are those where the situation requires a car,due to personal mobility restrictions, or the need to carry heavy loads.
Figure 1: Different degrees of car dependence, across a range of activity patterns andlifestyles
Source: Jones (2008) Working Paper 4: Conceptual Components
Car reliance and dependence tend to grow over time. There is a ‘ratchet effect’, inwhich people start substituting cars for trips where there are modal alternatives, butthey become locked into car use as these transport alternatives are cut back due toreduced levels of use, and people become attracted to other, car-based, destinations. Itbecomes increasingly difficult for them to return to their pre-car travel patterns, and sothey are less responsive to increases in fuel prices or to policies to encouragereductions in car use.
16 The Car in British Society RAC Foundation for Motoring
Structural
“Core” carTrips
Accessible by non-car modes
OBJECTIVECONSTRAINTS
Increasing constraints
Trips made by Car
Situational
Car - Reliant
R A N G E O F A C T I V I T Y PAT T E R N S / L I F E S T Y L E S
Home-based or inclose proximityTele-services
PREFERENCES & SUBJECTIVECONSTRAINTS

Executive Summary
The cost of adjustment to a low carbon future
Currently, national and local policy measures to reduce car use do not fully considerthe impacts they might have on people’s lifestyles and livelihoods, especially for thosewith limited travel alternatives. The empirical evidence relating to the economic andsocial consequences of significantly reducing people’s car use and the wider costs ofsuch an adjustment is limited. There are a few experimental studies suggesting that inthe short term people absorb such costs, but in the medium term some groups mayexperience economic and social hardships. We do not know what the knock-on effectsof reduced ability to travel might have on the wider economy and society as a whole,as this is largely not considered by the literature.
Some useful research has been undertaken in other disciplines about the wider costsof adjustment to economic shocks, which may have lessons that could usefully beapplied to the transport field. Our focus groups demonstrated that many people havealready adjusted their car use and the way they drive in response to recent economicpressures and environmental concerns. However, most people cannot envisage afuture without their cars and most would go to considerable lengths to maintain theirownership and use, although many said they would make more use of public transport.
Recommendations for further research
Whilst there will be scope to explore some of these issues through the re-use ofexisting data sets, detailed empirical research is needed in order to examine fully thekinds of constraints that prevent voluntary reductions in car use, and the nature andextent of the ‘costs of adjustment’ that result from ‘forced’ behavioural change, whereeconomic and political pressures result in households cutting back substantially in caruse, beyond that which they would do voluntarily. Further research should seek toidentify the kinds of measures that could be taken, by both the public and privatesectors, to reduce any undue burden and/or social exclusion arising from pressuresto reduce car use.
RAC Foundation for Motoring The Car in British Society 17


RAC Foundation for Motoring The Car in British Society 1919 The Car in British Society RAC Foundation for Motoring
1Introduction

1 Introduction
1.1 Background to the study
In 1995, the RAC Foundation published its influential Car Dependence report, basedon work led by the ESRC Transport Studies Unit at Oxford University. The studyexamined the travel behaviour and decision making of individuals and households upto the end of the 1980s, following a period of rapid growth in car travel and in thecontext of an emerging policy debate on the need to restrict car traffic in certain places.It found that:
� Car ownership had been growing rapidly in previous decades, spreading morewidely across the population and leading to major increases in car trips and in traveldistances by car;
� Among current car trips, there was a spectrum of dependence on the car, from tripsthat could readily be transferred to other modes, to those which would be totallyimpractical by any other means;
� Attitudes to the car also varied, from a grudging use of the car by some to a strongaffection and association with the car by others and from cars as a source ofdependence to the car providing independence;
� The study identified a group of users and trip purposes (‘the low hanging fruit’) thatcould relatively easily be encouraged to reduce their car use (mainly through transferto other modes), and this subsequently helped inform the development of theGovernment’s Smarter Choices initiative based around voluntary behaviour change.
The Smarter Choices agenda was based on the implementation of a range of 'soft'transport policy measures such as workplace-based travel plans, personalised travelplanning, travel awareness campaigns, teleworking and shopping, and car-club/carsharing schemes, designed to reduce overall levels of car use (Cairns et al, 2004).Based on the evidence of 24 case study initiatives from across the UK and Europe,the study found that, if collectively applied in an intensive fashion, such schemes couldpotentially lead to an average reduction in traffic nationally of around 11% (2-3% in alow intensity scenario).
Over a decade after the publication of the 1995 RAC Foundation report on cardependence, comprehensive behaviour change programmes are achieving short-termmeasured reductions in car use within three medium sized English trial urban areas ofaround 11%-13% (DfT, 2008a). However, overall car ownership and use has continuedto grow nationally since the publication of the 1995 report, and has spread to whatwere traditionally non-driving sectors of the population, including lower incomehouseholds, women between the ages of 18 and 65, and men of 65 years and over.As a consequence, we have become a more car dominated society since the early1990s – and probably a more car dependent society too.
In recent years, the modal share of car trips by men and women has equalised,
20 The Car in British Society RAC Foundation for Motoring

1 Introduction
although men still act as the driver more often than women who are more frequentlyfound in the role of passenger. In the younger age groups (16 to 49), women makemore car trips, on average, than men, which is offset by more male car trips amongthe older age groups. The percentage of household trips by car now exceeds 50% inall but the lowest income quintile, and is significantly higher in rural areas and in areaswith low public transport accessibility, even among non-car owning households.
1.2 Current policy context
Against this background of increasing car use, there are growing policy concerns atgovernmental level about climate change, energy security, social exclusion, and publichealth and well-being. Together with more localised issues such as traffic congestionand air quality hotspots, these are leading to growing pressures on local and centralgovernment to reduce people’s car use by much larger amounts than are likely to beachievable through current voluntary measures.
The Climate Change Act 2008 committed government to reducing CO2 emissions by80% by 2050 (based on 1990 levels) and domestic transport is an important contributorto this (DfT, 2008). It is anticipated that vehicle emission reduction targets will be met inthe long term by improvements in vehicle technology. However, in the short term thereis likely to be pressure to reduce car use overall. At the same time, conditions in theglobal oil markets mean that fuel will probably become substantially more expensiveover time. Together, these conditions are likely to lead to significant economic andpolitical pressures for reductions in car use on a scale not seen before.
In this context, stronger political and economic pressures to reduce people’s car useand to encourage the use of other modes, including walking and cycling, are likely tohave significant impact on people’s lifestyles and livelihoods. This updated study of cardependence aims to further understanding of the current role of the car in society andto identify the likely economic and social consequences of moving towards morecoercive measures to reduce people’s car use over the next decade.
1.3 Study objectives
The study has two primary objectives:
i) To examine recent trends in travel by car, and explore the changing nature, extentand causes of car dependence; and to consider whether this is still a useful way ofcharacterising people’s car use behaviours; and
ii) To explore the likely economic and social consequences of moving beyond currentvoluntary change programmes, towards future policy and economic environmentsthat may pressure people into making more coercive reductions in car use.
RAC Foundation for Motoring The Car in British Society 21

22 The Car in British Society RAC Foundation for Motoring
The work reported here relies primarily on a literature review and a reanalysis ofexisting data, complemented by a small programme of qualitative data collection in theform of five focus groups with the general public and a series of in-depth interviewswith local policy makers and practitioners.
The aim of the study is to highlight recent trends in car use and identify the extent of cardependence, and to stimulate public debate on the future role of the car in society. It ishoped it will assist policy makers and practitioners to understand more fully the economicand social implications of implementing various policy and market measures that might beemployed as part of a transition towards a low carbon economy in the UK.
1.4 Research methods
The main tasks carried out during the study were as follows:
1. A critical review of the literature pertaining to car dependence and the economic andsocial benefits and disbenefits of car use and car restraint policies, which has beenpublished since the previous RAC Foundation report.
2. A refresh analysis of the National Travel Survey (NTS) data between the late 1980sand 2006, in order to identify:� Differences in the amount and characteristics of car use over the past twodecades How the nature and extent of car dependence has changed, in thecontext of wider economic and societal changes;
� Demographic and geographical factors contributing to differences in car use andcar reliance for particular trips.
3. An exploration of the feasibility of re-using the in-depth data from the original RACFoundation study, and emerging longitudinal data sets (such as those producedas a by-product of behaviour change programmes), to gain deeper insights intocar dependence.
4. Exploratory discussions with key professional stakeholders to review theirexperiences in relation to local car-based travel trends and to glean insights withregards to their anticipated future policy directions in this respect. Interviews werelargely conducted face to face and included:� Local authority Chief Officers� Transport and land use planners� Lead transport officers in Government Offices� A property developer� A bus operator
5. Focus groups with randomly selected members of the public who were recruitedaccording to a pre-determined set of criteria as follows:
1 Introduction

RAC Foundation for Motoring The Car in British Society 23
1 Introduction
� ‘Voluntary switchers’ – people of a range of ages who had made a voluntaryswitch from their cars to public transport for some journeys as a result ofreduced fares or free bus tickets that were recently introduced by NottinghamCity Transport;
� ‘Banned drivers’ – people of a range of ages that had received an enforceddriving ban of over six months in the last year;
� ‘Over 75 drivers’ – elderly drivers living in and around Banbury who might beconsidering giving up driving in the near future for reasons of their age;
� ‘New drivers’ – young people between 18 and 25 years old, living in and aroundBanbury, who had passed their tests within the last year;
� ‘Non-car owners’ – people living in and around Banbury in non-car owninghouseholds and without regular access to a car.
6. Identify gaps in existing knowledge and areas where there is need for furtherresearch and make recommendations for future policy.
1.5 Report outline
The main findings of our research are presented in the next six chapters. Workingpapers are available relating to specific aspects of the study, namely (i) Literaturereview; ii) Full National Travel Survey analysis; iii) Policy review; (iv) ConceptualComponents; (v) Expert seminar and (vi) Focus group exercises. These are inelectronic format and can be downloaded from the Royal Automobile Club Foundationwebsite (www.racfoundation.org).
Chapter 2 looks at the current position of the car in contemporary British societyconsidering such issues as how, where and when it is used and by whom. It alsoconsiders the influence of public transport accessibility and settlement sizes.
Chapter 3 then summarises the main trends in car use patterns over the past 20 years,and examines some of the demographic and geographical factors that may account forobserved differences over time.
Chapter 4 turns to the question of what drivers and non-drivers think about theircar use, and what they see as the main benefits and disbenefits of current levelsof car use.
Chapter 5 examines the extent to which current car use patterns reflect personalchoice or structural and situational constraints, and seeks to explore more fully theconcept of ‘car dependence’. It considers why car dependence has grown over time,in response to adjustments in land use patterns and public transport provision.
Chapter 6 reviews the available research evidence on the costs of adjustment in

24 The Car in British Society RAC Foundation for Motoring
situations where car use is restrained in some way, as well as some of the widerliterature on the economic and social cost of adjustment in other circumstances outsidethe field of transport. It also presents findings from the focus groups about how peopleadjusted to the sharp increases in fuel prices during 2007/08 and how they anticipateresponding to other potential restrictions on car use in the future.
Finally, some conclusions and recommendations are set out in Chapter 7.
1 Introduction

RAC Foundation for Motoring The Car in British Society 2525 The Car in British Society RAC Foundation for Motoring
2The dominance of thecar in contemporaryBritish Society

2 The dominance of the car in contemporary British Society
2.1 Introduction
This chapter analyses data from the British National Travel Survey (NTS) to look atcontemporary patterns of car ownership and use among the UK population (using thelatest available data from the 2006 survey). The NTS is based on an annual randomsample of around 8,300 households in Great Britain, with each household memberrecording their trip making over a consecutive seven day time period1. In Chapter 3,we also consider time series data taken from the NTS 1989–2006 and some traffictrends in order to establish how things have changed since the 1995 CarDependence report.
In Section 2.2, we first examine car availability in 2006, in terms of vehicle and licenceownership across Great Britain, and how this varies by population group and type ofarea. Section 2.3 summarises patterns of car use and differences by socio-demographic and geographical characteristics. Section 2.4 looks more closely at thesituation currently faced by non-car owning households.
1 In recent years the DfT has introduced weighting procedures for NTS, to take into account the drop off in tripresponse rates over the diary week, and variations in person response rates across the population. Re-weighted datahas been released for the period 1995 to 2006 only. These data are used in the 2006 analysis presented in this Chapter,but not in the trend analysis reported in Chapter 3, which goes back to 1989. As a consequence, there are somedifferences between the weighted 2006 values reported in this chapter and the un-weighted values for 2006 that arepart of the trends analysed in the next chapter.
26 The Car in British Society RAC Foundation for Motoring
Key messages
� Over three-quarters of households now own at least one car, and 70% of adultshave a driving licence.
� The car dominates most people’s daily travel. Average citizens make two-thirdsof their trips and over three-quarters of their mileage by car; even among thebottom income quintile cars are used for 45% of daily trips and account for 65%of mileage.
� In general, the smaller the settlement size the higher the car ownership rate.Public transport accessibility seems only to be associated with low car ownershiprates in areas of high provision.
� While 40% of members of non-car owning households report travelling at leastonce a week by car, car trip rates are only one-tenth of those of one-car owninghouseholds, and they make far fewer trips overall.
� Rather surprisingly, average car trips rates for the under 16 and 16-29 age groupsare identical at 510 trips per year, although in the latter case two-thirds of trips areas a car driver.
� In the younger adult age groups, women make more trips by car than men. Theconverse applies to older age groups where men aged 50-69 make more trips bycar per year than do women. The number of trips made by women peaks in the30-49 age group.

2 The dominance of the car in contemporary British Society
2.2 Car and licence ownership in 2006
2.2.1 Car ownership levels
In 2006, for most people in Great Britain (82%), living in a car owning household wasthe norm. There was an average of 1.15 cars per household, and 76% of householdsowned at least one car. However, there were large differences in ownership levels bypopulation group and type of area.
Figure 2.1 shows the percentages of households with 0, 1 and 2+ cars, in each of thefive income quintile bands.
In the lowest income quintile, around half of the households own at least one car; thisreaches 90% in the top two income quintiles, suggesting that about 10% of householdsare unlikely to become car owning, for whatever reason, even where income itself isnot a constraint on ownership2. Ownership of 2+ cars exceeds 50% among the topincome quintile households.
2 The proportion of households without a car in rural areas is also around 10% (not illustrated here), again suggestingthat this may represent a base level of non-car ownership.
RAC Foundation for Motoring The Car in British Society 27
100%
80%
60%
40%
20%
0%Lowest 2nd
Income Quintiles
3rd 4th Highest
Number of Cars
Two+OneZero
Per
cen
tag
eo
fh
ou
seh
old
s
Figure 2.1: Distribution of numbers of household cars by income, 2006

2 The dominance of the car in contemporary British Society
Figure 2.2, shows the relationship between average car ownership rates and thecombined effect of residential settlement size and public transport accessibility (seeAnnex to Chapter 2 for definitions), both on a per household and a per adult basis (toallow for the effects of differences in average household size by area).
Household car ownership rates can be seen to be much higher in rural areas thanelsewhere, and these rates are unaffected by levels of public transport accessibility.In general, the smaller the settlement size, the higher the car ownership rate; publictransport accessibility seems only to be associated with lower car ownership ratesin areas of high provision. Similar associations are observed when looking at carsper adult.
2.2.2 Driving licence ownership
Figure 2.3 illustrates the percentage of adults with a driving licence, according to theirgender and age group. This shows several clear patterns:
� In all four age groups, more men have a driving licence than women. This differenceincreases with age, with only 7 percentage points difference among those aged
28 The Car in British Society RAC Foundation for Motoring
Ave
rag
eca
rso
wn
edp
erh
ou
seh
old
Ave
rag
eca
rsp
erad
ult
Public Transport Accessibility
1.5
1.0
0.5
0.0Low Moderate High Low Moderate High
1.0
0.8
0.6
0.4
0.2
0.0
Town SizeRural3K to 25K25K to 250K250K
Public Transport Accessibility
Figure 2.2: Number of cars per household and per adult, by size of residential area andpublic transport accessibility, 2006

2 The dominance of the car in contemporary British Society
16-29, rising sharply to a 35 percentage points difference in the 70+ age group –reflecting social conditions obtaining in previous decades when women were lesslikely to have learned to drive.
� Most licence holders are to be found in the 30-69 age range where for bothgenders they exceed two-thirds of the population, reaching a rate of 90% for menin the 50-69 age group. The rate of licence holding is lowest for men in theyoungest age group (56%) and lowest for women in the oldest age group (31%).Interestingly, there are slightly fewer men who are licence holders in the 30-49age group (at 87%) than in the 50-69 age group (90%), while the opposite isfound for women.
Figure 2.3: Percentage of adults with a driving licence, by age and gender, 2006
Variations in levels of driving licence holding by type of area are much less than wasthe case for car ownership, either in terms of settlement size or public transportaccessibility level, as shown in Figure 2.4.
Licence ownership rates among adults are highest in rural areas (at 85%), and thendrop steadily from 74% in towns up to 25,000, to 66% in the largest category ofsettlement size. In the case of public transport accessibility, the variation is somewhatless, with average rates falling from 80% in the low accessibility areas to 66% in thehigh accessibility areas.
RAC Foundation for Motoring The Car in British Society 29
Per
cen
tag
eo
fad
ult
s
100%
80%
60%
40%
20%
0%
MenWomen
16–29 30–49 50–69 70+Age bands

2 The dominance of the car in contemporary British Society
30 The Car in British Society RAC Foundation for Motoring
Figure 2.4: Percentage of adults with a driving licence, by settlement size andpublic transport accessibility level, 2006

2 The dominance of the car in contemporary British Society
2.2.3 Overall car availability
The extent to which an individual has the opportunity to travel by a household car isinfluenced by a combination of car access within their household and whether or notthey have a driving licence. These two factors are combined into an overall measure ofcar availability in the following two figures, with Figure 2.5 providing a breakdown bygender and Figure 2.6 by income quintile.
Figure 2.5: Car availability across the total population, in terms of licence holdingand household car ownership, by gender, 2006
Across the population as a whole, over half (54%) are the main drivers of a householdor company car, and 30% are non-drivers; only 4% are drivers in a household without acar. There are significant differences by gender (Figure 2.5), with 64% of males beingthe main driver of a car and only 48% of women. Women are twice as likely to be anon-driver in a household with a car than are men (19% vs. 10%).
In terms of income (Figure 2.6), the proportion of people who are the main car driverincreases from 31% in the lowest income quintile to 74% in the top quintile.Conversely, the likelihood of being a non-main driver increases with income, from 8%to 12%, whilst the proportion that are not car drivers in a car owning household dropswith income, from 16% to 6%.
RAC Foundation for Motoring The Car in British Society 31
100%
80%
60%
40%
20%
0%
Percentageof all adults
Percentageof men
Percentageof women
Car availability
Main Driver of Company CarOther Main DriverNot Main Driver ofHousehold CarHousehold Car butNon-DriverDriver but No CarNon Driver and No Car

2 The dominance of the car in contemporary British Society
Figure 2.6: Car availability across the total population, in terms of licence holdingand household car ownership, by income quintiles, 2006
2.3 Patterns of car use in 2006
The car now dominates most people’s daily travel. Across the British population as awhole, over 80% of people reported travelling by car (either as a driver or a passenger)at least once during their diary week. This compares to less than 30% who used a busand around 10% who travelled by rail at least once in their diary week.
2.3.1 Modal share of travel by car
Figure 2.7 shows the percentage of all weekly trips and weekly mileage carried outby car.
32 The Car in British Society RAC Foundation for Motoring
100%
80%
60%
40%
20%
0%Lowest real
incomeSecond
levelThirdlevel
Fourthlevel
Highest realincome
Car availability
Main Driver ofCompany CarOther Main DriverNot Main Driver ofHousehold CarHousehold Car butNon-DriverDriver but No CarNon Driver andNo Car
Income quintiles

2 The dominance of the car in contemporary British Society
Figure 2.7: Percentage of weekly trips and weekly mileage, as a car driver, carpassenger or in non-car modes3, 2006
Here we can see that average citizens made 62% of their trips by car (40% as a driver)and 76% of their mileage by car (49% as a driver). Hence, non-car travel, by all otherdomestic modes of transport, only accounts for 38% of trips and 24% of mileage.Figure 2.8 examines how the modal shares of trips and mileage vary according to thelength of the trip.
3 In all the graphs that follow the category ‘Other’ refers to all non-car modes including public transport, taxis, cyclingand walking.
RAC Foundation for Motoring The Car in British Society 33
100%
80%
60%
40%
20%
0%Percentage of trips Percentage of mileage
Mode of TransportOtherCar PassengerCar Driver

2 The dominance of the car in contemporary British Society
Figure 2.8: Percentage of weekly trips and weekly mileage, as a car driver, carpassenger or in non-car modes, by trip length 2006
34 The Car in British Society RAC Foundation for Motoring
100%
80%
60%
40%
20%
0%
100%
80%
60%
40%
20%
0%
Per
cent
age
of
trip
sP
erce
ntag
eo
fm
ileag
e
Journey Distance
Journey Distance
Mode of TransportOtherCar PassengerCar Driver
Under0.5 miles
0.5-1miles
1-1.5miles
1.5-2miles
2-3miles
3-5miles
5+miles
Under0.5 miles
0.5-1miles
1-1.5miles
1.5-2miles
2-3miles
3-5miles
5+miles

2 The dominance of the car in contemporary British Society
Car use (both as driver and passenger) accounts for only 8% of the trips under half amile in length, rising to 76% of all trips in the 2 – 3 mile band and 80% of trips longerthan 5 miles in length; above 1 mile, more than half of all trips are by car. Trends aresimilar with regard to mileage: cars contribute only 10% of the mileage of trips underhalf a mile in length, rising to 77% of mileage for trips that are 2 miles or longer; again,above 1 mile more than half of all mileage is by car.
Figure 2.9 shows that cars are used for over half of trips for all journey purposes,except education where they account for 30% of total trips and 35% of mileage. It canalso be observed that:
� The highest car modal shares are for ‘escort (other)’, at 84% of trips and 94%of mileage;
� The highest share of car trips and car mileages that are as car passengers are for‘social’ and ‘recreational’ trips, where there is roughly an equal split betweenpassengers and drivers;
� The lowest percentage of car passengers are for ‘commuting’ and ‘business related’trips and mileages.
Socio-demographic factors show the car modal share of total trips and mileage above50% for all age groups and both genders – see Figure 2.10. In terms of trips (Figure2.10a), the 30-49 and 50-69 age groups have the highest car modal shares, and ineach age group both genders have similar percentage modal shares, except for70+ group where the figures for women are slightly lower.
RAC Foundation for Motoring The Car in British Society 35

100%
80%
60%
40%
20%
0%
100%
80%
60%
40%
20%
0%
Per
cent
age
of
trip
sP
erce
ntag
eo
fm
ileag
e
Journey Purpose
Journey Purpose
Mode of TransportOtherCar PassengerCar Driver
Mode of TransportOtherCar PassengerCar Driver
Ed
ucat
ion
Rec
reat
iona
l
Esc
ort
toS
choo
l
Sho
pp
ing
Food
Sho
pp
ing
Com
mut
ing
Per
sona
lBus
ines
s/O
ther
Soc
ial
Bus
ines
s-R
elat
ed
Esc
ort
(Oth
er)
Ed
ucat
ion
Rec
reat
iona
l
Esc
ort
toS
choo
l
Sho
pp
ing
Food
Sho
pp
ing
Com
mut
ing
Per
sona
lBus
ines
s/O
ther
Soc
ial
Bus
ines
s-R
elat
ed
Esc
ort
(Oth
er)
2 The dominance of the car in contemporary British Society
36 The Car in British Society RAC Foundation for Motoring
Figure 2.9: Percentage of weekly trips and weekly mileage, as a car driver, carpassenger or in non-car modes, by trip purpose in 2006

2 The dominance of the car in contemporary British Society
RAC Foundation for Motoring The Car in British Society 37
Figure 2.10a: Percentage of weekly trips as a car driver, car passenger or innon-car modes, by age in 2006
In terms of mileage (Figure 2.10b) the picture is more complex, with the 16-29 agegroup having a lower car modal share than any of the other groups.
Figure 2.10b: Percentage of weekly mileage, as a car driver, car passenger or innon-car modes, by age in 2006
100%
80%
60%
40%
20%
0%
Pe
rce
nta
ge
of
trip
s
Mode ofTransport
OtherCar PassengerCar Driver
Age bands
Women Men All
Under16
16-29
30-49
50-69
70+ Under16
16-29
30-49
50-69
70+ Under16
16-29
30-49
50-69
70+
100%
80%
60%
40%
20%
0%
Pe
rce
nta
ge
of
trip
s
Mode ofTransport
OtherCar PassengerCar Driver
WomenMenAll
Age bands
Under16
16-29
30-49
50-69
70+ Under16
16-29
30-49
50-69
70+ Under16
16-29
30-49
50-69
70+

2 The dominance of the car in contemporary British Society
38 The Car in British Society RAC Foundation for Motoring
Among the bottom income quintile, cars are used for 45% of daily trips and 65% ofmileage (see Figure 2.11). In terms of car driver trip modal shares, this rises in eachsuccessive income band, from 24% in the lowest to 51% in the highest. Conversely,the car passenger modal share is more stable, at 22%/23% for the three middleincome quintiles, dropping back to 20% and 18% in the lowest and highest incomequintiles, respectively.
Figure 2.11: Percentage of weekly trips and weekly mileage, as a car driver, carpassenger or in non-car modes, by income quintile in 2006
100%
80%
60%
40%
20%
0%Lowest real
incomeSecond
levelThirdlevel
Fourthlevel
Highest realincome
Income quintiles
Per
cen
tag
eo
ftr
ips
Mode of TransportOtherCar PassengerCar Driver
2 The dominance of the car in contemporary British Society
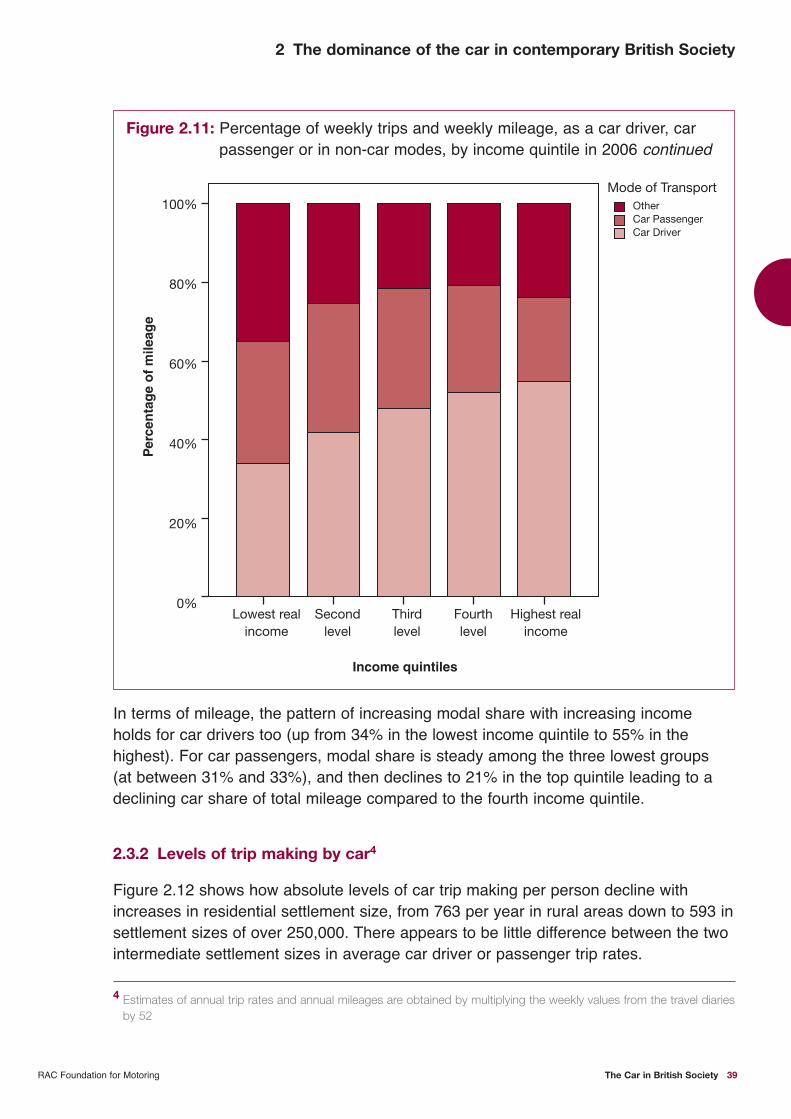
In terms of mileage, the pattern of increasing modal share with increasing incomeholds for car drivers too (up from 34% in the lowest income quintile to 55% in thehighest). For car passengers, modal share is steady among the three lowest groups(at between 31% and 33%), and then declines to 21% in the top quintile leading to adeclining car share of total mileage compared to the fourth income quintile.
2.3.2 Levels of trip making by car4
Figure 2.12 shows how absolute levels of car trip making per person decline withincreases in residential settlement size, from 763 per year in rural areas down to 593 insettlement sizes of over 250,000. There appears to be little difference between the twointermediate settlement sizes in average car driver or passenger trip rates.
4 Estimates of annual trip rates and annual mileages are obtained by multiplying the weekly values from the travel diariesby 52
RAC Foundation for Motoring The Car in British Society 39
100%
80%
60%
40%
20%
0%Lowest real
incomeSecond
levelThirdlevel
Fourthlevel
Highest realincome
Income quintiles
Per
cen
tag
eo
fm
ileag
e
Mode of TransportOtherCar PassengerCar Driver
Figure 2.11: Percentage of weekly trips and weekly mileage, as a car driver, carpassenger or in non-car modes, by income quintile in 2006 continued

2 The dominance of the car in contemporary British Society
40 The Car in British Society RAC Foundation for Motoring
Figure 2.12: Car trips per adult per year, by settlement size, 2006
The next two figures look at variations in car travel, by age and gender. Figure 2.13shows the average number of car trips (as driver and passenger) by people in five agegroups and of each gender in 2006. Rather surprisingly, average car trips rates for theunder 16 and 16-29 age groups are identical at 510 trips per year, although in the lattercase two-thirds of trips are as a car driver. In the younger adult age groups, womenmake more trips by car than men: 90 more per year for those 16-29 and 179 more forthose aged between 30 and 49. The converse applies to older age groups: men aged50-69 make 61 more per year and above 70 this increases sharply to an extra 241annual trips by car. Women’s car trips peak in the 30-49 age group, whilst men agedbetween 50 and 69 make more car trips.
1,000
750
500
250
0
Rural 3K to 25K 25K to 250K 250K+
Car
trip
sp
erp
erso
np
erye
ar
Town Size
Mode of TransportCar PassengerCar Driver

2 The dominance of the car in contemporary British Society
Figure 2.13: Average annual car trips per person, by age and gender, 2006
In Figure 2.14, average car mileage per year is shown for the same five age groups, bygender. For both genders, car mileage increases up to 30-49, and then declines withage. In the three older age groups, car mileage for men is higher than for womenalthough, unlike trip rates, rankings of mileage by age group are the same for bothgenders. A much higher proportion of the male car trips and mileage is as a car driver.
Figure 2.14: Average annual car mileage per person, by age and gender, 2006
RAC Foundation for Motoring The Car in British Society 41
1,000
800
600
400
200
0
Car
trip
sp
erp
erso
np
erye
ar
Age bands
WomenMenAll Adults
Under16
16-29
30-49
50-69
70+ Under16
16-29
30-49
50-69
70+ Under16
16-29
30-49
50-69
70+
Mode ofTransport
Car PassengerCar Driver
10,000
8,000
6,000
4,000
2,000
0
Car
mile
age
per
per
son
per
year
Mode ofTransport
Car PassengerCar Driver
WomenMenAll Adults
Age bands
Under16
16-29
30-49
50-69
70+ Under16
16-29
30-49
50-69
70+ Under16
16-29
30-49
50-69
70+
2 The dominance of the car in contemporary British Society
5 The ‘Under 5,000’ miles band excludes people who do not make any trips by car in their diary week.
42 The Car in British Society RAC Foundation for Motoring
Percentage of people by annual car mileage
No MileageUnder 5K5K-10K10K-15K15K+
8%
10%17%
19%
46%
2.3.3 Difference in car travel patterns by annual mileage
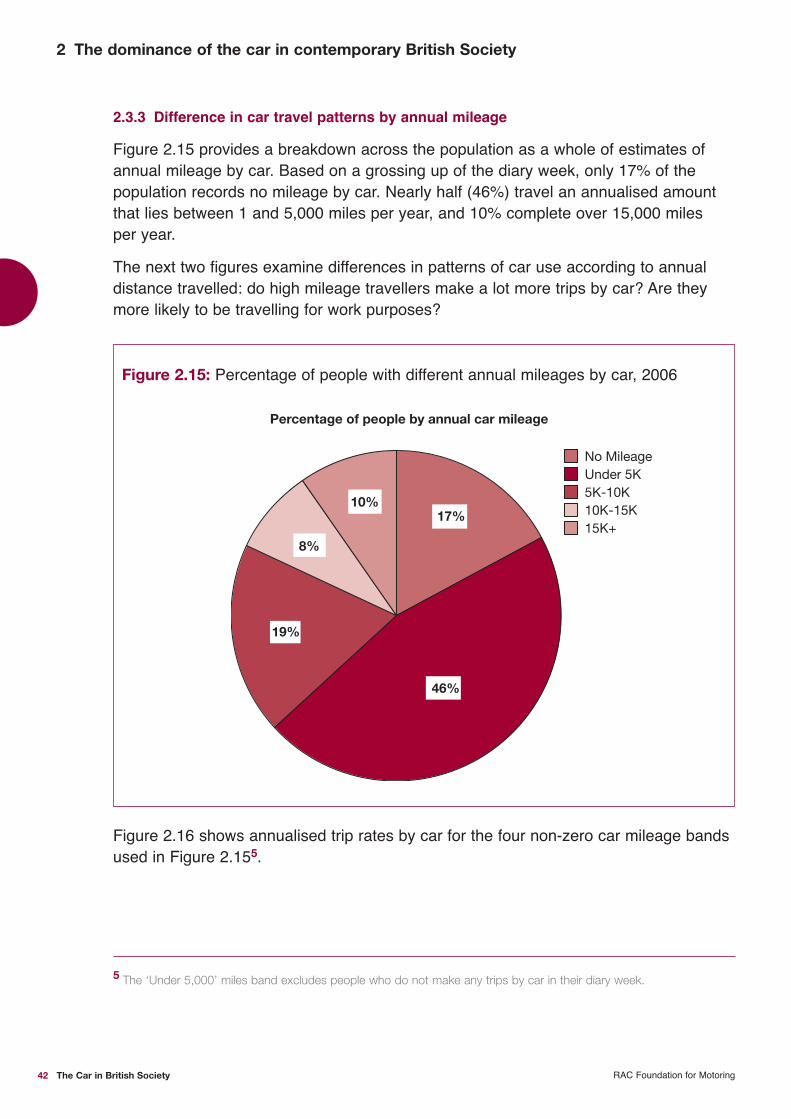
Figure 2.15 provides a breakdown across the population as a whole of estimates ofannual mileage by car. Based on a grossing up of the diary week, only 17% of thepopulation records no mileage by car. Nearly half (46%) travel an annualised amountthat lies between 1 and 5,000 miles per year, and 10% complete over 15,000 milesper year.
The next two figures examine differences in patterns of car use according to annualdistance travelled: do high mileage travellers make a lot more trips by car? Are theymore likely to be travelling for work purposes?
Figure 2.15: Percentage of people with different annual mileages by car, 2006
Figure 2.16 shows annualised trip rates by car for the four non-zero car mileage bandsused in Figure 2.155.

2 The dominance of the car in contemporary British Society
Figure 2.16: Number of car trips per person, by annual mileage band, 2006
As can be seen, there is a near doubling of car trips between the under 5,000 milesband and the 5-10,000 band (i.e. up from 531 to 1,027 car trips). This is entirely due toan increase in car driver trips, but thereafter very little of the increase mileage is due toan increase in trip making by car. What this indicates is that average trip lengths by carare quite similar up to 10,000 miles, after which most of the increased mileage isaccounted for by longer trips rather than further increases in car trip making. Note alsothat, above 5,000 miles, the numbers of car passenger trips decline in each successivemileage band, down from 289 in the 5-10,000 mile band to only 222 car passengertrips in the over 15,000 mile band.
Figure 2.17 examines whether car trips rates at different mileage bands are affected bythe size of residential settlement. For example, within a mileage band, do people makefewer but longer trips in rural areas? In fact, the effects are small, variable and, inplaces, counter-intuitive (e.g. in the 10-15,000 mileage band). Trip rates are onlyinversely related to settlement size in the 15,000+ mileage band.
RAC Foundation for Motoring The Car in British Society 43
1,200
1,000
800
600
400
200
0Under 5K 5K-10K 10K-15K 15K+
Mode of TransportCar PassengerCar Driver
Annual car mileage
Car
trip
sp
erp
erso
np
erye
ar

2 The dominance of the car in contemporary British Society
44 The Car in British Society RAC Foundation for Motoring
Figure 2.17: Car trips per person, by annual mileage and type of residentialarea, 2006
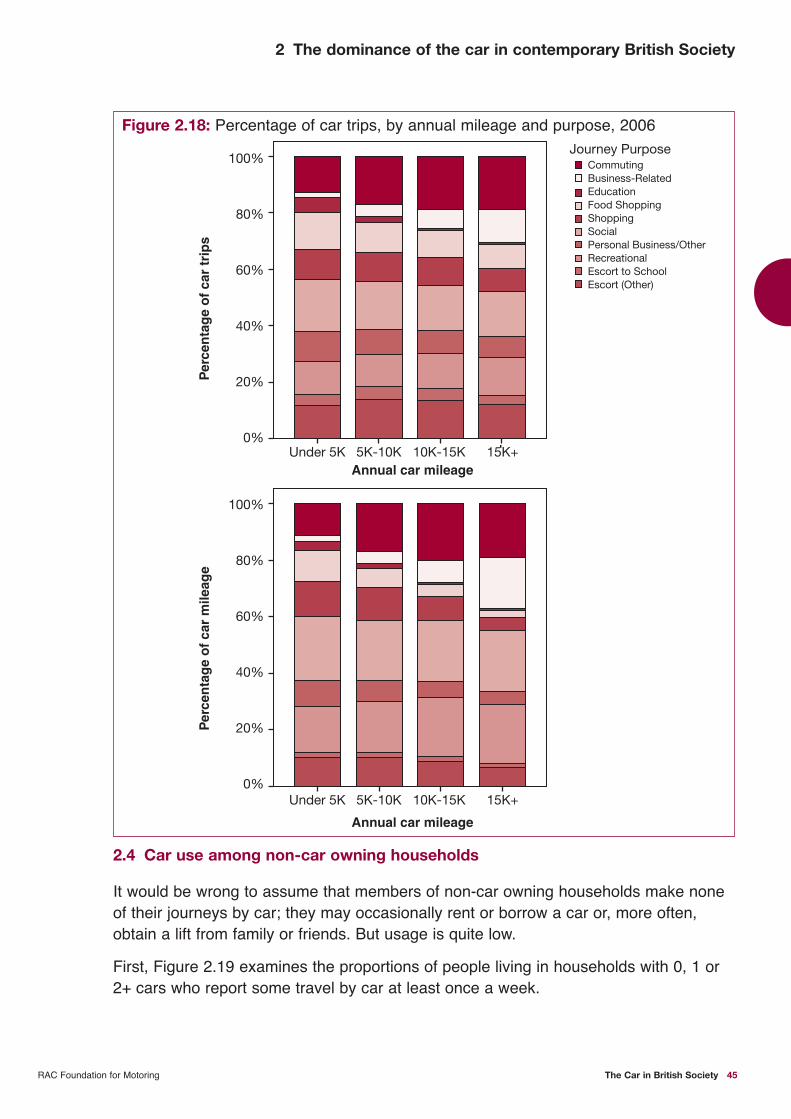
Figure 2.18 Examines how the mix of trip purposes is affected by total annual carmileage, both as a percentage of all car trips and as a percentage of car mileage. Ingeneral, the results are consistent, though not as much as might have been expected.The main effect is in business-related travel which increases from only 2% of trips and2% of mileage for those travelling up to 5,000 miles per year, to 11% of trips and 18%of mileage among those travelling over 15,000 miles per year by car. This is mainlyoffset by reductions in shopping and personal business travel.
1,200
1,000
800
600
400
200
0
Car
trip
sp
erp
erso
np
erye
ar
Annual car mileage
Rural 3K to 25K 25K to 250K 250K+
Population of Town
Und
er5K
5K-1
0K
10K
-15K
15k+
Und
er5K
5K-1
0K
10K
-15K
15k+
Und
er5K
5K-1
0K
10K
-15K
15k+
Und
er5K
5K-1
0K
10K
-15K
15k+
Mode ofTransport
Car PassengerCar Driver
2 The dominance of the car in contemporary British Society
RAC Foundation for Motoring The Car in British Society 45
Figure 2.18: Percentage of car trips, by annual mileage and purpose, 2006
100%
80%
60%
40%
20%
0%
100%
80%
60%
40%
20%
0%
Under 5K 5K-10K 10K-15K 15K+
Under 5K 5K-10K 10K-15K 15K+
Journey PurposeCommutingBusiness-RelatedEducationFood ShoppingShoppingSocialPersonal Business/OtherRecreationalEscort to SchoolEscort (Other)
Annual car mileage
Per
cen
tag
eo
fca
rm
ileag
eP
erce
nta
ge
of
car
trip
s
Annual car mileage
2.4 Car use among non-car owning households
It would be wrong to assume that members of non-car owning households make noneof their journeys by car; they may occasionally rent or borrow a car or, more often,obtain a lift from family or friends. But usage is quite low.
First, Figure 2.19 examines the proportions of people living in households with 0, 1 or2+ cars who report some travel by car at least once a week.

2 The dominance of the car in contemporary British Society
Figure 2.19: Percentage of respondents using each transport mode at least onceper week, by number of cars in the household, 2006
Even in households without a car, well over 40% of household members travel at leastonce a week by car; this compares to around 90% of members of 1 car owninghouseholds and 95% of people in 2+ car owning households.
The opposite result is found for public transport use – both bus and rail. The proportionof people travelling by bus is around 60% in non-car owning households, dropping to14% in 2+ car households. For rail, the corresponding figures drop from 17% innon-car households to 8% in 2+ car owning households.
However, largely due to income constraints, people in non-car owning householdstravel much less intensively by car and other modes except walking. Figure 2.20 showsthat, on average, adults in non-car owning households make only 107 car trips per yearby car, compared to 660 in one car households and 853 in 2+ car owning households.In the first case, nearly all of these are as a car passenger. Proportionate differencesare much greater in terms of annual mileage, where adults in non-car owninghouseholds travel less one tenth the distance by car per year of those in 2+ carowning households (i.e. 800 miles versus 7,897 miles).
46 The Car in British Society RAC Foundation for Motoring
Per
cen
tag
eo
fp
eop
letr
avel
ling
byea
chm
od
e(d
uri
ng
thei
rd
iary
wee
k)
100%
80%
60%
40%
20%
0%
Number of cars
None One Two+
Mode of TransportOtherCar PassengerCar Driver

2 The dominance of the car in contemporary British Society
RAC Foundation for Motoring The Car in British Society 47
Figure 2.20: Person trip rates and mileage, by household car ownership, 2006
Note that total annual travel per person, by all modes, is substantially lower in non-carowning households. Compared to one-car households, those living in householdswithout a car make 74% the annual number of person trips (774 vs. 1051) and only46% of total annual mileage (3040 vs. 6548 miles). The increase in average annualmileage between one and 2+ car owning households is much greater than the increasein average trip numbers.
Figure 2.21 investigates whether the percentage of car trips made for differentpurposes differs according to household car ownership level.
Trip
sp
erp
erso
np
erye
ar
Mile
age
per
per
son
per
year
1,000
800
600
400
200
0
10,000
8,000
6,000
4,000
2,000
0
Number of cars
None One Two+Number of cars
None One Two+
Mode of TransportOtherCar DriverCar Passenger
Mode of TransportOtherCar DriverCar Passenger

2 The dominance of the car in contemporary British Society
Figure 2.21: Percentage of car trips, by purpose and household car ownership, 2006
Figure 2.21 shows that households without a car make a higher proportion of foodshopping and social trips and a lower proportion of escort (other), business andrecreational trips than households with one car. Differences in the distribution of trippurposes by car are relatively small between the one and 2+ car owning households.
Figure 2.22 shows the proportions of households with different levels of car ownershipreporting that the car is their usual mode of travel for their main food shopping. Ascould be expected, 90% of one-car and 96% of 2+ car owning households usuallycarry out their main food shopping by car, but 22% of non-car owning households alsoreport this as their usual mode of transport.
48 The Car in British Society RAC Foundation for Motoring
100%
80%
60%
40%
20%
0%None One Two+
Journey PurposeCommutingBusiness-RelatedEducationFood ShoppingShoppingSocialPersonal Business/OtherRecreationalEscort to SchoolEscort (Other)
Number of cars
Per
cen
tag
eo
fca
rtr
ips

2 The dominance of the car in contemporary British Society
RAC Foundation for Motoring The Car in British Society 49
Figure 2.22: Proportion of households reporting the car as their usual mode for mainfood shopping, by household car ownership level, 2006
Per
cen
tag
eo
fh
ou
seh
old
sre
po
rtin
gca
ras
thei
r“u
sual
mo
de
wh
entr
avel
ling
for
mai
nfo
od
sho
pp
ing
”
100%
80%
60%
40%
20%
0%
Number of cars
None One Two+
Per
cen
tag
eo
fca
rles
sh
ou
seh
old
sre
po
rtin
gca
ras
thei
r“u
sual
mo
de
wh
entr
avel
ling
for
mai
nfo
od
sho
pp
ing
”
50%
40%
30%
20%
10%
0%
Town size Public Transport AccessibilityLowRural 3K-25K 25K-250K 250K+ Moderate High
Figure 2.23: Proportions of non-car owning households with the car as theirusual mode for main food shopping, by type of residentialsettlement and public transport accessibility, 2006

2 The dominance of the car in contemporary British Society
The residential location of non-car owning households travelling by car for their mainfood shopping was investigated to see whether car use for shopping decreases assettlement size increases. The results in Figure 2.23 show that 45% of non-car owningrural households travel by car for their main food shopping, compared to only 17% ofhouseholds living in settlements of over 250,000; although there is no differentiationbetween the two intermediate sized areas. There is a more consistent relationship withpublic transport accessibility, where car use drops from 34% in low accessibility areasto 18% in high accessibility areas.
People using cars for their main food shopping were asked in the 2003 NTS howdifficult it would be for them to use a different mode of transport. Results are shownin Table 2.1.
Table 2.1: Self-Reported Degree of Difficulty in Considering a Switch to Non-CarModes of Travel for Main Food Shopping, 2003
Cars per Very Quite Neither Easy Quite Veryhousehold Easy Easy nor Difficult Difficult Difficult
Zero 8% 24% 6% 22% 41%
One 10% 28% 8% 25% 29%
Two+ 8% 21% 8% 27% 36%
Overall 9% 25% 8% 25% 32%
Nearly two-thirds of food shoppers from non-car owning households reported that itwould be “quite” or “very” difficult to use an alternative mode for their main foodshopping: the same percentage as those in 2+ car owning households.
2.5 Conclusions
The private car now plays a central role in the lives of the large majority of householdsand individuals in Great Britain. Across the population as a whole, in 2006 nearly two-thirds of all daily trips were made by car, and around four fifths of domestic mileagewas by car; in a typical week 80% of the population travelled at least once by car.
50 The Car in British Society RAC Foundation for Motoring

2 The dominance of the car in contemporary British Society
Cars were the most common transport mode for all trips over one mile in length, andthe modal share of all trips by car was above 50% for both males and females acrossall age groups. Among the bottom income quintile, cars were used for 45% of dailytrips and 65% of mileage despite the low car ownership levels of this quintile. However,people living in non-car owning households are placed at considerable disadvantage,as many activities essential to daily economic and social life are now less accessibleto those who cannot travel by car. This is explored further in later chapters.
Whilst it is important to identify the role of the car in present day British society, it isalso important to contextualise it against past trends to capture the dynamic changesin patterns of use over time. This is the subject of the next chapter.
RAC Foundation for Motoring The Car in British Society 51


RAC Foundation for Motoring The Car in British Society 5353 The Car in British Society RAC Foundation for Motoring
3Transport trends overthe past two decades

3 Transport trends over the past two decades
3.1 Introduction
In this chapter we consider broad trends in travel patterns since the previous RACFoundation car dependence study, which reported on trends up to the end of the1980s. This looked back on a period of sustained growth in car ownership and use,when there was an increasing penetration of the car into the daily travel patterns ofsubstantial parts of the population. Since that time we can observe two distinct phasesin the data:
� First, a period of continuing growth and increasing dominance of the car infacilitating personal travel behaviour, followed by
� A period of stabilisation and on some measures a slight reduction in the proportionof the personal travel market involving travel by car.
Section 3.2 considers trends in car ownership, licence holding and car availabilitywithin households. Section 3.3 then looks at accessibility to public transport, motorwaynetworks, land uses and car travel speeds, to consider how these have impacted onoverall car use over time. We then look at trends in general travel patterns (Section3.4) and consider differences in car use by traveller characteristics over time (Section3.5). Finally Section 3.6 addresses the question of whether car use has stabilised inmore recent years as indicated by some of the data.
54 The Car in British Society RAC Foundation for Motoring
Key messages
� While overall car use continued its pattern of strong historical growth throughoutmost of the 1990s, in recent years it has levelled off, and some aspects of cartravel have declined slightly. Depending on the measure used, growth in averagecar use per person ceased at some point between 1995 and 2002.
� Total car traffic continues to grow more slowly than in previous years, and inrecent years has been in line with the growth in the adult GB population.
� If this situation continues, then future aggregate growth rates for car traffic willbe less than has historically been the case and may require a reassessment oflong-term traffic forecasts.
� The fact that average speeds of car trips have declined over the last decade,down from 25.7 miles per hour in 1995 to 24.6 mph in 2006, suggests thepossibility that congestion is one limiting factor that may have contributed tothis situation.
� The changing socio-demographic profile of the driving population may also beaffecting overall travel trends, as car use has spread throughout the population.Lower income and older drivers tend to travel shorter distances, so loweringthe average.

3 Transport trends over the past two decades
3.2 Car ownership, licence holding and car availability
3.2.1 Car ownership
Figure 3.1 shows trends in household car ownership between 1989 and 2006.
Figure 3.1: Distribution of cars per household, 1989-2006
Here we can observe a steady increase in household car ownership, with a gradualdecrease in the percentage of zero-car households, down from 35% to 24%, and acorresponding increase in 2+ car owning households, up from 21% to 31%. During thisperiod, the proportion of 1 car households has generally remained stable, at 44%/45%.
Figure 3.2 looks at differences in trends in household and adult car ownership rates, byincome quintiles. On a household basis, we can observe a stable rate in the top incomegroup of approximately 1.5 cars per household. In all the other four income groups,household car ownership rates have continued to increase year-on-year, right up to 2006,generally with higher rates of growth at lower income levels – so that differences betweenthe highest and lowest household income groups are reducing slowly.
Similar trends are apparent on a per adult basis, although growth rates are moresimilar across all five groups and car ownership continues to grow for the highestincome quintile too – indicating that the number of adults per household has beendeclining more rapidly in the highest income group over this period.
RAC Foundation for Motoring The Car in British Society 55
100%
80%
60%
40%
20%
0%1989 1991 1993 1995 1999 2001 2003 20051997
1990 1992 1994 1996 2000 2002 2004 20061998
Number of CarsTwo+OneZero
Per
cen
tag
eo
fh
ou
seh
old
s
Year

3 Transport trends over the past two decades
56 The Car in British Society RAC Foundation for Motoring
Figure 3.3 shows a clear inverse relationship between size of residential area and carownership, both on a per household and a per adult basis.
Car
sp
erho
useh
old
Year
2.0
1.5
1.0
0.5
0.01990 1995 2000 2005
Income quintiles
Car
sp
erad
ult
1.0
.8
.6
.4
.2
0.0
Year1990 1995 2000 2005
Highest4th
3rd
2nd
Lowest
Highest4th
3rd
2nd
Lowest
Income quintiles
Town sizeRural3K to 25K25K to 250K250K+
Car
sp
erho
useh
old
2.0
1.5
1.0
0.5
0.0
Year1990 1995 2000 2005
Car
sp
erad
ult
0.0
.2
.4
.6
.8
1.0 Town sizeRural3K to 25K25K to 250K250K+
Year1990 1995 2000 2005
Figure 3.2: Average car ownership per household and per adult, by income quintile, 1989-2006
Figure 3.3: Average car ownership per household and per adult, by residential settlementsize, 1989-2006

3 Transport trends over the past two decades
Car ownership has generally grown at a similar rate in all areas over time, althoughdisparities between the rural and other areas seem to have increased.
3.2.2 Licence ownership
Figure 3.4 shows trends in car licence ownership between 1989 and 2006, bothaveraged across all adults aged 16+ and separately by gender. Here we can see anaverage increase from around 60% to 70% of the adult population holding a drivinglicence, comprising a small increase for men and a much larger increase for women,although across the adult population as a whole the latter remain around twentypercentage points lower than men. The percentage of men holding licences peaked in1999 and has dropped slightly since then whereas licence holding among women hascontinued to grow slowly.
Figure 3.4: Percentage of adults with driving licences, 1989-2006
Variations in licence ownership among adults are shown by age in Figure 3.5.Throughout the period, the 30-49 age group has held the highest proportion oflicences, at around 80%, but this has grown relatively little. On the other hand licenceholding amongst the 50-69 age group has increased rapidly, and is now nearly at thesame level as the 30-49 group, suggesting that there has been a saturation rate ofaround 80% licence holding within an age group for several decades. The two agegroup extremes show contrasting trends: the percentage of licence holders in the16-29 age group has dropped over time, from over 60% to 50%; conversely thenumber of people now aged 70+ who hold licences has increased rapidly, and nowmatches the rates of the youngest age group.
RAC Foundation for Motoring The Car in British Society 57
Per
cent
age
of
adul
ts16
+w
ith
dri
ving
licen
ces
Year
GenderMenWomenAll adults
100%
80%
60%
40%
20%
0%1990 1995 2000 2005

3 Transport trends over the past two decades
Figure 3.5: Licence holding by age group, 1989-2006
In the case of income, the trends are more uniform. Figure 3.6 shows that thepercentage of adults with a car driving licence is proportionate to income band, beinghigher for higher income levels.
Figure 3.6: Licence holding by income group, 1989-2006
58 The Car in British Society RAC Foundation for Motoring
Age bands
Per
cent
age
of
adul
ts16
+w
ith
dri
ving
licen
ces
16-2930-4950-6970+
Year
100%
80%
60%
40%
20%
0%1990 1995 2000 2005
Per
cent
age
of
adul
ts16
+w
ith
dri
ving
licen
ses
Year
Income quintiles
0%1990 1995 2000 2005
20%
40%
60%
80%
100%Highest4th
3rd
2nd
Lowest
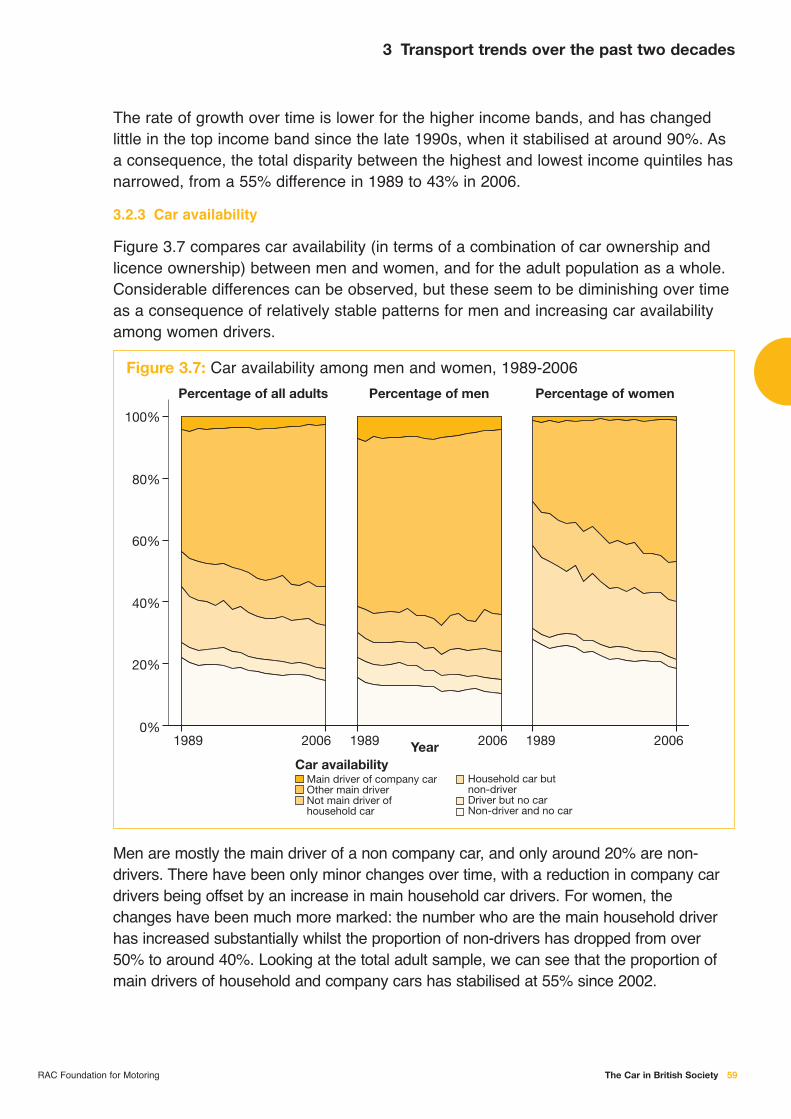
3 Transport trends over the past two decades
RAC Foundation for Motoring The Car in British Society 59
The rate of growth over time is lower for the higher income bands, and has changedlittle in the top income band since the late 1990s, when it stabilised at around 90%. Asa consequence, the total disparity between the highest and lowest income quintiles hasnarrowed, from a 55% difference in 1989 to 43% in 2006.
3.2.3 Car availability
Figure 3.7 compares car availability (in terms of a combination of car ownership andlicence ownership) between men and women, and for the adult population as a whole.Considerable differences can be observed, but these seem to be diminishing over timeas a consequence of relatively stable patterns for men and increasing car availabilityamong women drivers.
Men are mostly the main driver of a non company car, and only around 20% are non-drivers. There have been only minor changes over time, with a reduction in company cardrivers being offset by an increase in main household car drivers. For women, thechanges have been much more marked: the number who are the main household driverhas increased substantially whilst the proportion of non-drivers has dropped from over50% to around 40%. Looking at the total adult sample, we can see that the proportion ofmain drivers of household and company cars has stabilised at 55% since 2002.
100%
80%
60%
40%
20%
0%
Year1989 2006 1989 2006 1989 2006
Percentage of menPercentage of all adults Percentage of women
Car availabilityHousehold car butnon-driverDriver but no carNon-driver and no car
Main driver of company carOther main driverNot main driver ofhousehold car
Figure 3.7: Car availability among men and women, 1989-2006

3 Transport trends over the past two decades
60 The Car in British Society RAC Foundation for Motoring
Car availability
Income quintiles
Lowest 2nd 3rd 4th Lowest
Main driver ofcompany carOther main driverNot main driver ofhousehold carHousehold car butnon-driverDriver but no carNon-driver andno car
100%
80%
60%
40%
20%
0%
Year
1989 2006 1989 2006 1989 2006 1989 2006 1989 2006
Figure 3.8 shows car availability by income quintile. Here some very consistent trendscan be observed:
� The large majority of company car drivers are in the top income quintile, and thisproportion has declined over time.
� The proportions of adults who are main drivers of household cars increase over timein all the income quintiles; conversely, the proportions of non-main drivers inhouseholds with cars has change relatively little – and is greater in the higherincome quintile groups.
� The proportion of non-drivers in non-car owning households has dropped sharplyin the bottom two income quintiles while it has hardly changed at all in the toptwo quintiles.
� Generally speaking, the distribution of car availability in 2006 in one income quintilebroadly matches the distribution in the adjacent higher quintile that existed in 1989.
Figure 3.9 shows differences in car availability by size of residential settlement. Herea steady progression of increasing levels of car availability in different settlement sizescan be observed over time. The proportion of licence holding adults with access toa car at home reaches 84% in rural areas, but only 61% in the largest urban areas,mainly due to a 20% points drop in main drivers of household cars. Adults who aredrivers in a non-car owning household are least common in rural areas and mostcommon in the largest settlement category. Coincidentally, the various percentagesin 1989 roughly correspond to the 2006 values in the next larger settlement size.
Figure 3.8: Car availability by income group, 1989-2006

3 Transport trends over the past two decades
RAC Foundation for Motoring The Car in British Society 61
Car availability
Town size
Year
250K+
100%
80%
60%
40%
20%
0%1989 2006 1989 2006 1989 2006 1989 2006
Per
cent
age
of
adul
ts
25K to 250K Rural3K to 25K
Main driver ofcompany carOther main driverNot main driver ofhousehold car
Household car butnon-driverDriver but no carNon-driver andno car
3.3 Transport, land uses and journey speeds
This section investigates how the characteristics of the transport systems and land usepatterns have changed over time.
3.3.1 Public transport accessibility
Figure 3.10 shows the percentage of households living in areas with high, moderateand low levels of access to public transport services, annually between 1989 and 2006.In the early years there appear to be quite large annual fluctuations (due to smallersample sizes at that time). The proportions in each of the three categories havestabilised since 2002, with around 48% of households experiencing high levels ofpublic transport accessibility – but this is a lower percentage than in most of thepreceding years.
Figure 3.9: Car availability by settlement size, 1989-2006

3 Transport trends over the past two decades
Figure 3.10: Percentage of households with different levels of public transportaccessibility, 1989-2006
3.3.2 Development of the national motorway network
Figure 3.11 shows the increase in the length of the national motorway network,between 1970 and 2006. The fastest rates of growth were in the 1970s, when thelength of motorways increased from around 1,000 kilometres to 2,500 kilometres; butthere were also substantial increases during both the 1980s and the first half of the1990s, since when there has been little additional development.
62 The Car in British Society RAC Foundation for Motoring
Per
cent
age
of
hous
eho
lds
100%
80%
60%
40%
20%
0%
Year
Public transportaccessibility
19891990
19911992
19931994
19951996
19971998
19992000
20012002
2003 20052004 2006
HighModerateLow

3 Transport trends over the past two decades
Figure 3.11: Length of national motorway network
3.3.3 Non-car access to particular facilities
In some years, the NTS asks for an estimate of the time required to reach certainfacilities from the respondents’ homes, on foot or by public transport (whichever isquicker). Figure 3.12 shows overall responses for two facilities: nearest grocers andnearest chemist.
RAC Foundation for Motoring The Car in British Society 63
One
-way
mo
torw
ayki
lom
etre
s
4,000
3,000
2,000
1,000
1970 1975 1980 1985 1990 1995 2000 20050

3 Transport trends over the past two decades
64 The Car in British Society RAC Foundation for Motoring
For both facilities, there has been a tendency for the proportion of households within6 minutes of the facility, on foot or by bus, to decline. In the case of grocers, there hasbeen a corresponding growth in both the 7-13 and the 14-26 minute time bands,whereas for the nearest chemist the growth has mainly been in the 14-26 minutetime band.
As a more general proxy for level of access to goods and services, Figure 3.13 looksat the changing distribution over time of households among four settlement types, fromtowns of over 250,000 population to settlements below 3,000.
There has been considerable fluctuation from year to year, reflecting NTS spatialsampling variations. A slight tendency for a higher proportion of the samples to betaken from larger urban areas and rural areas in recent years and a reduction in the3-25k sample can be observed - but with no consistent overall trend.
Grocers
Year
19891990
19911992
19931994
19951996
19971998
19992000
20012002
20032004
Chemist
Year
19891990
19911992
19931994
19951996
19971998
19992000
20012002
20032004
100%
Households
80%
60%
40%
20%
0%
Walk or busproximity
44 mins or more27-43 mins14-26 mins7-13 ins6 mins or less
Walk or busproximity
44 mins or more27-43 mins14-26 mins7-13 ins6 mins or less
Figure 3.12: Travel time to nearest grocers and chemist

3 Transport trends over the past two decades
Figure 3.13: Percentage of households living in different settlement sizes, 1989-2006
3.3.4 Changes in average travel speeds by car
Finally, by comparing changes in reported trip distances and travel times by car, wecan estimate changes over time in average door-to-door journey speeds by car.Findings are shown in Figure 3.14.
Figure 3.14: Comparison of average driving speed and average distance travelledper car trip, over time, 1975-2006
RAC Foundation for Motoring The Car in British Society 65
Town size
Year
Per
cent
age
of
hous
eho
lds
100%
80%
60%
40%
20%
0%
1989
1990 19
9119
92 1993
1994 19
9519
96 1997
1998 19
9920
00 2001
2002 20
0320
04 2005
2006
250K+25K to 250K3K to 25KRural
Year
Ave
rag
ed
rivi
ngsp
eed
(mile
sp
erho
ur)
Averag
ed
rivingtrip
distance
(miles
per
trip)
30 10
8
6
4
2
0
20
10
01975
Average speed
Average trip distance
1980 1985 1990 1995 2000 2005

3 Transport trends over the past two decades
66 The Car in British Society RAC Foundation for Motoring
As can be seen, the mean speed per trip increased from 20.1 miles per hour in 1975,to 23.1 mph in 1989 and then up to 25.7 mph in 1995, since which time there has beena slight decline in average speeds, to around 24.5 mph. One possible explanationcould be an increase in shorter distance trips by car, on lower speed roads; but Figure3.14 also shows that average car trip distances have stabilised in recent years, ataround 8.5 miles per trip – so it is more likely that speed reductions have been causedby increases in traffic congestion.
3.4 Trends in travel patterns over the past two decades
Having looked at trends in car and licence ownership in public transport provision andaccess to land uses, the net effect of these various changes on patterns of travel willnow be assessed.
3.4.1 Changes in general trip-making patterns over time
In this section aggregate changes in total trip making by all modes of transport areexamined in terms of total trips, distances and travel times.
Figure 3.15 shows a steady decline in total number of trips per person per year acrossthe population as a whole (including children), down from 1103 trips in 1989 to 987trips in 2006. This has mainly resulted from a reduction in non-car trips (down from 519to 382), with car driver and car passenger trips increasing until the late 1990s, sincewhen they have generally stabilised. The decline in the numbers of non-car trips hasmainly been in the non-motorised modes and has halted recently.
The annual distance travelled per person per year (Figure 3.16), increased steadilyfrom 1989 to 1998, mirroring the increase in car trips, since when it has stabilised, witha slight drop in car passenger mileage offset by an increase in average mileage byother modes of transport.
The trends regarding average time spent travelling per annum are different again(Figure 3.17). Here a slight reduction can be observed between 1989 and 1992 (from373 to 361 hours per annum), since when numbers have stabilised. Within this total,the car driver share has increased (from 114 hours in 1989 to 136 hours in 2006),offset by a decline in non-car hours, from 181 to 151 per annum. The car passengerhours have remained broadly stable over this period.

3 Transport trends over the past two decades
Figure 3.15: Average number of trips per person per year, by car and othermodes of transport6, 1989-2006
Figure 3.16: Average mileage travelled per person per year, by car and othermodes of transport, 1989-2006
6 As for the previous chapter, ‘other’ denotes all non-car modes including public transport, taxis, walking and cycling.
RAC Foundation for Motoring The Car in British Society 67
Mode of transport
Trip
sp
erca
pit
ap
erye
ar
Year1990
1,000
800
600
400
200
01995 2000 2005
OtherCar passengerCar driver
Mode of transport
Mile
age
per
cap
ita
per
year
6,000
4,000
2,000
Year1990 1995 2000 2001
0
OtherCar PassengerCar Driver

3 Transport trends over the past two decades
Figure 3.17: Average travel time per person per year, by car and other modes oftransport, 1989-2006
3.4.2 The pattern of car trips by distance
Figure 3.18 illustrates the percentage modal share of trips by car (including bothdrivers and passengers) for different trip distance bands.
Figure 3.18: Car modal share of trips, by distance bands, 1989-2006
68 The Car in British Society RAC Foundation for Motoring
Mode of transport
Year
400
1990 1995 2000 2005
300
200
100
0Tim
esp
ent
trav
ellin
gp
erca
pit
ap
erye
ar(h
our
s)
OtherCar passengerCar driver
Journey distance
Car
mo
dal
shar
e
100%
80%
60%
40%
20%
0%1990 1995 2000 2005
Year
5+ miles3 - 5 miles2 - 3 miles1.5 - 2 miles1 - 1.5 miles0.5 - 1 milesUnder 0.5 miles

3 Transport trends over the past two decades
For any given year between 1989 and 2006, car modal share increases with tripdistance, from under 10% for trips under half a mile to around 80% for trips over5 miles in length. Within most distance bands, the car modal share has increasedsteadily over time until the late 1990s/early 2000s, since when it has dropped slightly.
The distribution of total car trips across the different distance bands since 1989, asshown in Figure 3.197, has shown relatively little change. There has been a slighttendency for trips over 5 miles to take up an increasing share of all car trips – up fromaround 40% in 1989/1990 to 42%+ in 2005/2006 – and trips shorter than 2 miles todrop, as overall average trip lengths have marginally increased.
Figure 3.19: Percentage distribution of car trips, by distance bands, 1989-2006
3.5 Differences in car use by traveller characteristics over time
3.5.1 Trends by gender
In terms of the modal share of all journeys that are made by car (both as a driver andas a passenger), very little difference between the two genders can be detected, eitherby looking at the car share of total trips or at the car share of total distance travelled(see Figure 3.20).
7 Percentages rather than absolute values have been used for ease of comparison as, while numbers fluctuate, theaverage number of car trips per capita has increased very little over this time period.
RAC Foundation for Motoring The Car in British Society 69
Journey distance
Per
cent
age
of
car
trip
s
Year
100%
80%
40%
20%
0%1989
19901991
19921993
19941995
19961997
19981999
20002001
20022003
20042005
2006
60%
5+ miles3 - 5 miles2 - 3 miles1.5 - 2 miles1 - 1.5 miles0.5 - 1 milesUnder 0.5 miles

3 Transport trends over the past two decades
70 The Car in British Society RAC Foundation for Motoring
In 1989 women’s modal share of total trips was about six percentage points below thatof men. After that it increased steadily until 2001 when the modal shares for bothgenders converged and stabilised at roughly the same percentage. When modal shareis examined in terms of total distance travelled, however, we see a different picture.The car distance modal share for men and women was the same from the late 1980suntil about 2000. Since then it has been consistently about three percentage pointshigher for women than for men, with a slight year-on-year percentage reduction forboth groups.
3.5.2 Trends by age group
Car modal shares by five age bands are shown in Figure 3.21, both as a percentage oftrips and of distances travelled. The 30-49 age group has had the highest modal shareof car trips over the period 1989 to 2006, and that this has remained relatively stable,within the range of 63% to 68%. Over this period, the car trip modal share of the 50-69age group has gradually risen, from 54% to 67%, and now equals that of the nextyounger age group. At the start of the period, the 70+ age group had the lowest car tripmodal share, at 37%, but this has grown rapidly to 60% in 2005. By the year 2000, the70+ age group had overtaken the car modal share of the 16-29 age group, which hasbeen largely stable over this period, at between 51% and 55%. The car modal sharefor the under 16s has followed a similar trend to the 70+ age group.
1990 1995 2000 2005Year
Gender
Trips
100%
90%
80%
70%
60%
50%
40%
30%
20%
10%
0%1990 1995 2000 2005
Year
MaleFemale
Gender
Distance
MaleFemale
Figure 3.20: Car modal share of total trips and distance, by gender, 1989-2006

3 Transport trends over the past two decades
A slightly different picture emerges from an examination of car modal share on a totaldistance basis. Here no change can be observed over time for the 30-49 age group,with car modal share fluctuating between 78% and 81%. A small increase can be seenfor the 50-69 age group, from 75% to 80% whilst the car distance modal share for theunder 16 age group has also shown little change since the mid 1990s. For the 16-29age group, the figure has fluctuated between 66% and 71%, with a downward trend inrecent years. In the oldest age group, car distance modal share has grown from 60%to 77% - again overtaking the 16-29 age group. In all cases, the car distance modalshare has dropped slightly in recent years.
3.5.3 Trends by income group
Figure 3.22 shows the trends in car modal share over time by income quintile, both interms of trips and total distance travelled. Here we can observe that modal shareincreases with income, and that the differentials have been narrowing, although therewere still quite large differences in 2006, particularly on a per trip basis: 44% car modalshare of trips in the lowest income quintile versus 70% in the highest quintile – abouttwice the difference found on a distance basis. There has been relatively little increasein modal share among the top two income groups since 1989, but the lower incomequintiles have increased modal share over this period. In all cases, modal shares havestabilised since around the year 2000, with a slight reduction among the top twoincome groups.
RAC Foundation for Motoring The Car in British Society 71
1990 1995 2000 2005Year
Age bands
Distance
100%
90%
80%
70%
60%
50%
40%
30%
20%
10%
0%1990 1995 2000 2005
Year
Under 1616 - 2930 - 4950 - 6970+
Age bands
Trips
Under 1616 - 2930 - 4950 - 6970+
Figure 3.21: Car modal share of total trips and distance, by age group, 1989-2006

3 Transport trends over the past two decades
3.5.4 Car ownership level
The next two figures investigate the effects of car ownership on the modal share oftrips by car over time, first for total trips and then in terms of total distance travelled.
In the case of the car modal share of trips (Figure 3.23), only 12% of daily trips weremade by car in non-car owning households in 1989, and this gradually increased to17% in 2001, since when it has reverted to 14% in 2006; nearly all of these trips wereas a car passenger. In car owning households, there was a stronger growth in carmodal share up to around the year 2000, after which it fell a little. Whilst total carmodal share is higher in households with more than two cars than it is in those whichown only one due to an increase in car driver modal share, car passenger share is thesame in both types of household, and has not increased over time.
The picture is broadly similar for car modal share by distance (Figure 3.24), althoughvalues for non-car owning households are much more volatile. Car distance modalshare is around 30% in non-car households, with no clear trends over time; again, thismainly relates to the car passenger mode. In car owning households, it is around 80%,with only a few percentage points increase in 2+ car owning households. Here, overtime, the car passenger share has decreased slightly and the car driver share ofdistance has increased.
72 The Car in British Society RAC Foundation for Motoring
1990 1995Year
Income quintiles Income quintiles
Trips Distance
2000 2005
Highest4th
3rd
2nd
Lowest
Year
100%
80%
60%
40%
20%
0%1990 1995 2000 2005
Highest4th
3rd
2nd
Lowest
Figure 3.22: Car modal share of total trips and distance, by income group, 1989-2006

3 Transport trends over the past two decades
Figure 3.23: Car modal share of total trips, by household car ownership, 1989-2006
Figure 3.24: Car modal share of total distance, by household car ownership, 1989-2006
RAC Foundation for Motoring The Car in British Society 73
Mode of transport
Zero
100%
80%
60%
40%
20%
0%1990 1995 2000 2005 1990 1995 2000 2005 1990 1995 2000 2005
One
Year
Number of carsC
arm
od
alsh
are
(per
cent
age
of
trip
s)
Two+
All car travelCar driverCar passenger
Mode of transport
Zero
100%
80%
60%
40%
20%
0%1990 1995 2000 2005 1990 1995 2000 2005 1990 1995 2000 2005
One
Year
Car
mo
dal
shar
e(p
erce
ntag
eo
fd
ista
nce)
Two+
All car travelCar driverCar passenger
Number of cars

3 Transport trends over the past two decades
3.5.5 Size of residential settlement
Figure 3.25 shows that, on a per trip basis, car modal share has continued to grow inrural areas, but in the three other areas it has levelled off. In the two intermediate sizedareas it has actually shown a slight decline since 2002. However, the modal share bydistance has shown no significant trends since 1989.
3.6 Has car use stabilised?
The previous RAC Foundation car dependence study, which reported on trends up tothe end of the 1980s, was able to look back on a period of sustained growth in carownership and use and report an increasing penetration of the car into the daily travelpatterns of substantial parts of the population. However, there is some evidence thatthis penetration has now stabilised, at least on a per person basis. As noted in Section2.3, a situation has now been reached where the car is the dominant travel mode formost journey purposes and demographic groups.
3.6.1 Trends in car use per person
Since the late 1980s we can observe two distinct phases:
� A period of continuing growth and increasing dominance of the car in facilitatingpersonal travel behaviour.
� A period of stabilisation, and on some measures a slight reduction in the proportionof the personal travel market involving travel by car.
74 The Car in British Society RAC Foundation for Motoring
Town size
Trip
1990 1995 2000
Year
2005
Rural3K to 25K25K to 250K250K+
Town size
Distance
Rural3K to 25K25K to 250K250K+
100%
0%1990 1995 2000
Year
2005
20%
40%
60%
80%
Figure 3.25: Car modal share of total trips and distance, by settlement size, 1989-2006

3 Transport trends over the past two decades
The timing of this inflection point differs according to whether we are looking at trips ordistances, but in both cases has occurred several years in advance of the sharp fuelprice increases and the current recession. However, during this period absolute carmileage has continued to increase, in line with the growth of the adult population inGreat Britain.
Figure 3.26 shows the modal share of total travel by car per capita (both as a car driverand a car passenger) between 1975 and 2006, as a proportion of total personal tripsand in terms of annual distance travelled, from the National Travel Survey. Anincreasing rate of growth can be observed in the car share of total mileage per personbetween 1975 and 1995, when it reached 82%, after which there was an inflection andsince 2002 the mileage by car has dropped back to around 80%. When measured as amodal share of all trips, growth continues for a longer period until the inflection point isreached in 2002, since when numbers have fluctuated between 63% and 64%.
Figure 3.26: Modal share of travel by car on a trip and distance basis, 1989-2006
3.6.2 Trends in national traffic flow
The evidence from the National Travel Survey that, across the population as a whole,car use has stabilised in recent years seems at first glance to be at odds with datafrom national road traffic counts, which shows a continual (though reduced) rate ofgrowth in road traffic, as can be seen in Figure 3.27.
RAC Foundation for Motoring The Car in British Society 75
% of distance% of total trips
Car
mo
dal
shar
e
Year
80%
70%
60%
50%
80%
1975 1980 1985 1990 1995 2000 2005

3 Transport trends over the past two decades
76 The Car in British Society RAC Foundation for Motoring
Figure 3.27: Growth in road traffic over time, 1974-2007
Closer inspection, however, shows that the two sets of data are consistent, when twofactors are taken into account. First, while total road traffic has continued to increase,the growth in car/taxi traffic has been tailing off, so that it is now a decreasingproportion of all roads traffic, as shown in Figure 3.28. Car and taxi traffic peaked in1993 at 82.1% of all road traffic: in 2007 it was down to 78.8%, which is the same as1978/79 levels.
Second, the population of driving age has been growing at an increasing rate in recentyears. In the twenty years between 1981 and 2001, the population aged 16+ increasedfrom 43.8 million to 47.3m (an increase of 3.5m or 0.4% per annum), while in the sixyears between 2001 and 2007, it increased by a further 2.2m, to 49.5m, at an annualrate of nearly 0.8%.
When this is taken into account, and car-taxi kilometres on a per adult basis areconsidered (in Figure 3.29), it can be seen that the annual average kilometres peakedat 8,265 per adult per annum in 2002, since when it has dropped back slightly. This isconsistent with the NTS data shown in Figure 3.26.
Billion VKT by all road trafficBillion VKT by car/ taxi
Bill
ion
VK
T
Year
600
400
500
300
200
100
01975 1980 1985 1990 1995 2000 2005

3 Transport trends over the past two decades
RAC Foundation for Motoring The Car in British Society 77
Car
-tax
iVK
T/
allr
oad
traf
ficV
KT
85%
84%
83%
82%
81%
80%
79%
78%
77%
76%
75%
1975 1980 1985 1990 1995 2000 2005
Year
“Car
&ta
xi”
VK
Tp
erad
ult
(16+
)
8,000
7,000
6,000
5,000
Year
1975 1980 1985 1990 1995 2000 2005
Figure 3.28: Car/taxi VKT as a percentage of all road traffic VKT, 1975 to 2007
Figure 3.29: Average annual car/taxi kilometres per adult aged 16+

3 Transport trends over the past two decades
78 The Car in British Society RAC Foundation for Motoring
3.6.3 Trends in the broader travel market
Figure 3.30 shows the growth in total annual surface travel in Great Britain by mode,in passenger kilometres, indexed to 1975, together with changes in GDP (grossdomestic product).
Since 1975 there appears to have been a consistent relationship between GDP andtrends in rail passenger kilometres, with a small lag effect: in the early 1980s andthe early 1990s, a drop in GDP was followed by a sharp fall in rail demand. A muchsmaller dampening effect can be observed for travel by car, van and taxi, in the late1970s and early 1990s. Since around 2000, however, this relationship seems tohave changed. While GDP and rail travel have continued to grow strongly, there hasbeen a recent levelling off in passenger kilometres by car, van and taxi (whichcorrelates with the trends in vehicle kilometres shown previously), but which is notmatched by changes in GDP.
Figure 3.30: Growth in total surface travel in Great Britain, indexed to 1975, plusgrowth in GDP
This suggests that recently observed levelling off in car travel is not associated withchanges in economic conditions, but reflects structural changes in the patterns ofcar-based travel behaviour.
Ind
ices
(197
5=10
0)
Year
PKT by car, van & taxiPKT by bus & coachPKT by railGDP200
150
100
501975 1980 1985 1990 1995 2000 2005

3 Transport trends over the past two decades
3.7 Conclusions
This time series analysis, shows that car ownership has continued to grow since thelate 1980s, both on a per household and a per person basis, although among the toptwo income quintiles a saturation level of around 90% of car owning seems to havebeen reached.
In terms of personal characteristics, there has been a convergence in total car modalshares between men and women, although men are recorded as drivers more oftenthan women who are recorded more often as passengers. Amongst drivers agedbetween 16 – 29 years a reduction in the number of miles travelled by car has beenrecorded. However, the 70+ age group has been responsible for offsetting these figuresby travelling further and more often in recent years. There is some convergence in caruse between income groups, but the differences are still large. Licence holding peradult has also levelled off in recent years, at around 80% in the middle age groups,with reductions among younger people being offset by increases among older people.
While overall car use continued its pattern of strong historical growth throughout mostof the 1990s in recent years it has levelled off, and some aspects of personal car travelhave declined slightly. Depending on the measure used, growth in average car use perperson ceased at some point between 1995 and 2002. The halt in the increase inaverage car use per person can be reconciled with a continuing growth in carownership because cars are being used less intensively.
Total national car road traffic continues to grow slowly in line with increases in thenational population of driving age. If this situation continues, then future aggregategrowth rates for car traffic will be less than has historically been the case and maydemand a reassessment of our long term traffic forecasts: car traffic may simply mirrorthe increase in the number of adults in the population.
A recent study of driving patterns in the USA has come to a similar conclusion(Puentes and Tomer, 2008). The per capita vehicle miles travelled (VMT) reached aplateau in the year 2000, and has fallen slightly since 2005 – trends which predate theincreases in fuel prices in 2007 and 2008 and the current recession.
There have been short periods in the past when traffic growth in Great Britain hasstopped, but these have been associated with economic downturn. The recent changehas occurred during a period when the economy has been relatively strong, and railuse – which historically has also correlated with GDP – has continued to grow strongly.There could be several explanations for this phenomenon, including the collectiveimpacts of UK policies to encourage car restraint and modal shift, or the displacementof some travel to overseas destinations – but there is no substantive evidence on thecollective impacts of such effects nationally.
RAC Foundation for Motoring The Car in British Society 79

3 Transport trends over the past two decades
The fact that average car speeds have declined over the last decade, down from25.7 miles per hour in 1995 to 24.6 mph in 2006, suggests the possibility thatcongestion is a limiting factor that may have contributed to the situation. In someplaces, road space reallocation and the rephasing of traffic signals might have led tosignificant reductions in capacity – though, again, it is difficult to gauge what effectthis has had nationally.
Other possible explanations for the levelling off in car use might include an increase inpeople living in larger settlements, with better local access to goods and services bynon-motorised modes, and in areas with good public transport accessibility. However,the evidence from the NTS does not show any consistent trends of this type.
Whatever the reasons, the evidence suggests either that car use has reached a natural‘saturation’ level, with the population as a whole now having achieved its desired orrealisable levels of domestic mobility by car (Metz, 2009), recognising that noteveryone is or will be able to own a car; or that it has reached a level which is inequilibrium with current transport provision and land use patterns – major changes ineither of which could lead to further changes in aggregate patterns of car use.Determining which (if either) of these explanations is correct will have majorimplications for travel forecasting and for the development of British transport policyand responses to sustainability objectives in the coming decades.
80 The Car in British Society RAC Foundation for Motoring

RAC Foundation for Motoring The Car in British Society 8181 The Car in British Society RAC Foundation for Motoring
4Public attitudes towardscars and car use

4 Public attitudes towards cars and car use
4.1 Introduction
The previous chapters have shown that, although in recent years overall car use haslevelled off, this follows a continuing historical pattern of strong growth throughout mostof the 1990s, to the point where the car is now the dominant mode for most people’stravel and has a strong influence on their daily lives.
The next step will be to look at people’s attitudes towards the car and the various rolesit plays in their daily lives. These issues were examined in three ways by the study:
� First, we analysed a number of surveys of public attitudes to car use that have beenconducted at regular intervals in the UK over the last ten years;
� Secondly, we considered the wider literature on the benefits and disbenefits of caruse to individuals, households and society at large; and
� Thirdly, in the focus group discussions we included questions about the value of thecar to people’s livelihoods and lifestyles.
This chapter presents the outcome of these explorations.
82 The Car in British Society RAC Foundation for Motoring
Key messages
� In public attitude surveys, most people said work or home location were the mainreason for having a car and that shopping was the main trip that they could not dowithout a car.
� People enjoyed mostly the freedom, independence, convenience and sense ofpersonal space that the car has to offer them.
� Non-car owning households saw huge benefits in owning and driving cars andmany relied on their friends and families to drive them around in the absence ofalternative travel choices.
� People also recognised the disbenefits of car ownership and use, the mostsignificant of which was the related costs and some people said they would prefernot to drive but felt they had no choice.
� Some people recognised that they often used their cars out of habit and lazinessand that a number of the trips they made were not essential to their well-being.
� Some people who did not own cars or could not drive said they felt isolated andthat they were a burden on their friends and families.
� Although one third of people in attitude surveys said that they could switch towalking or cycling for short trips rather than using their car, nearly half said thatthis would not be possible.
� These remarks were consistent with the findings of our discussions with thepublic, which found that shopping and child escort trips were the most difficult tomanage without a car.

4.2 Public attitude surveys
Several UK surveys have investigated public attitudes relating to car ownership and caruse, in some cases over several decades. In this section we draw on three of thesesurveys: the Lex/RAC Report on Motoring, the British Social Attitudes Survey and astudy for DEFRA in 2007, carried out by the British Market Research Board (BMRB).
Until 2008, the annual Lex/RAC Report on Motoring survey was carried outface-to-face, with annual samples of between 1200 and 2000 regular car drivers,(i.e. those who drive at least once a month). In 2008 an Internet survey was usedfor the first time.
The British Social Attitudes Survey has been conducted annually since 1993. Eachyear around 3,300 randomly selected adults (both drivers and non-drivers) are asked togive their views on an extensive range of topics in a face-to-face interview. The figuresquoted in this section come from the 2008 report, based on data collected in 2006.
The 2007 Survey of “Public Attitudes and Behaviours Towards the Environment” forDEFRA, is based on a representative sample of 3,618 individuals in England duringSpring 2007.
4.2.1 Reasons for having a car
In the 2001 Lex Survey, motorists were asked, “what would you miss most if you didnot have a car?” with the majority of people answering that they would be concernedabout the loss of personal freedom. Responses are shown in Table 4.1. In terms ofimpacts on particular trips, most frequently mentioned was the impact on their abilityto go shopping, followed by commuting trips, leisure activities and visiting relatives.
Table 4.1: What drivers would miss most of they did not have a car
1st mention Other mentions All mentions
Sense of freedom 42 19 61Ability to go shopping 12 29 41Ability to get to work 21 15 36Going to a leisure activity 5 26 31Visiting relatives 5 20 25Going on holiday 1 9 10Taking children to school 2 7 9Source: 2001 Lex Report on Motoring
RAC Foundation for Motoring The Car in British Society 83
4 Public attitudes towards cars and car use

4 Public attitudes towards cars and car use
The 2004 RAC Survey asked motorists for the main reason they needed to retain theircar. The three most common responses are shown below in Table 4.2 by type ofresidential area. In rural areas, half of respondents referred to work or home locationas being the determining factor, whereas in cities it was the convenience of the car thatwas most frequently mentioned. More people in rural and urban areas than in citiesmentioned the unreliability of public transport.
Table 4.2: Main reason for motorists retaining their car
All City Urban Rural
Need car due to nature ofwork/location of home 43 37 40 50
Convenience of car 35 41 34 32
Unreliability of public transport 18 12 19 18Source: 2004 RAC Report on Motoring
4.2.2 Availability of alternatives to cars
In 2004, drivers in the RAC Survey were asked what would be the next best alternativemeans of transport for their car journeys (Table 4.3).
Table 4.3: Best alternative modes to the car for different trip purposes
Shopping Commuting School Social Longer motorwayruns events journeys
Bus 37 33 23 13 7Train 3 18 2 7 59Taxi 32 7 7 59 4Walk 15 8 44 6 0Bicycle 1 8 1 1 0Don't know 12 26 23 15 30Source: 2004 RAC Report on Motoring
As can be seen, the chosen mode varies by purpose, reflecting the importance of bothdifferences in average trip lengths (e.g. commuting vs. school runs) and the nature ofthe activity (e.g. social events). The trip with the highest proportion of ‘don’t know’responses (at 30%) was longer motorway journeys, and the one with the lowestpercentage (12%) was shopping.
The British Social Attitudes Survey asked drivers in 2006 whether they agreed withthe following statement: “Many of the short journeys I now make by car I could easilyswitch”, and how their answer would vary with the alternative mode available.
84 The Car in British Society RAC Foundation for Motoring

4 Public attitudes towards cars and car use
See Table 4.4. Here we can see that around one third agreed that they could walk orcycle instead of going by car, but on the other hand, nearly one half disagreed.Comparable figures for switching to bus travel revealed around 28% agreed and 54%disagreed. So, even for short trips, more car drivers think it would be difficult to switchmode than think it could be done so easily.
Table 4.4: Level of agreement that short car trips could be switched to alternative modes
N=931 Strongly Agree Neither Disagree Strongly Never Can’t N/aagree or agree disagree travel choose
disagree by car
Walk 8 26 8 33 14 7 3 1
Go by bus 4 24 8 34 20 6 2 1
Cycle -if I had 7 28 9 29 17 6 3 2a bikeSource: British Social Attitudes Survey 2008 (2006 data)
The 2001 Lex survey approached this issue in a different way, by asking drivers: “If youcould switch one journey a week from your car to public transport, which journey wouldit be?” The results in Table 4.5 show that shopping was the most frequently mentionedtrip purpose, followed by ‘into town centre’.
Table 4.5: Which one journey a week respondents said they could switch topublic transport
All City Urban Rural
Shopping 21 19 18 28
Into town centre 13 11 16 8
Journey to work 8 9 7 9
To leisure facilities 6 6 8 5
Visit to relative or friend 6 9 6 4
None, wouldn’t, couldn’t 29 24 30 30
Could not specify a journey 14 15 14 12Source: 2001 Lex Report on Motoring
RAC Foundation for Motoring The Car in British Society 85

4 Public attitudes towards cars and car use
There were some differences by type of residential area, though these were relativelysmall, with 39% of people living in cities saying either that they could or would notswitch a car trip, or could not specify a journey, compared to 42% in rural areas.
Some insight into the advantages offered by the car compared to other modes oftransport were obtained from the 2000 Lex Survey, where motorists were asked for anindication of the relative times and costs of making different journeys by car and bypublic transport. The two charts have been reproduced below in Figures 4.1a and 4.1b.
In most cases the car is perceived to be cheaper and quicker than the publictransport alternative, but the time differentials are generally much greater thanthe cost differentials.
On the cost side, average increases incurred by switching from the car to publictransport range from 25% for work (£4.00 versus £3.20) to 120% for escorting children(£1.00 versus £2.20). But in the case of journey times, the increases range from 62.5%for visiting friends and family (65 mins. versus 40 mins.) to 236% for commuting trips(84 mins. versus 25 mins. by car).
4.2.3 Effect of environmental impacts on attitudes to car use
The 2006 British Social Attitudes survey asked a series of questions about attitudes todriving in relation to the environment. People were asked whether current levels of caruse are having a serious effect on the climate? 82% of drivers agreed with thisstatement –a higher percentage than non-drivers at 76%. See Table 4.6.
Respondents were next asked whether they agreed that everyone should reducetheir car use, for the sake of the environment (Table 4.7). 66 per cent of both driversand non-drivers were in agreement with this statement, and around one quarterwere undecided.Table 4.6: Level of concern about environmental impacts of car use
N=3220 Drivers Non-drivers Total
Current level of car use hasserious effect on climate- 82 76 80% agreeing
% Very or fairly concernedabout effect of transport on 84 76 81climate changeSource: British Social Attitudes Survey 2008 (2006 data)
86 The Car in British Society RAC Foundation for Motoring

4 Public attitudes towards cars and car use
Figure 4.1a: Respondents’ estimated comparative journey times for car and publictransport, by trip purpose8
Source: 2000 Lex Report on Motoring
Figure 4.1b: Respondents’ estimated comparative costs for car and public transportjourneys, by trip purpose9
Source: 2000 Lex Report on Motoring
8 It should be noted that the figures in these graphs are based on respondents own estimates of both journey timesand costs and that a large number of people stated that they “did not know” in response to these questions.9 See above.
RAC Foundation for Motoring The Car in British Society 87
160
140
120
100
80
60
40
20
0School
runLeisure Going
shoppingVisitingfriends
Travel forwork
Travel towork
Average timeby public transportAverage timeby car
Journey type
Journey timesM
inu
tes
16
14
12
10
8
6
4
2
0
Average costby public transportAverage costby car
Journey costs
£s
Schoolrun
Leisure Goingshopping
Visitingfriends
Travel forwork
Travel towork
Journey type

4 Public attitudes towards cars and car use
Table 4.7: Support for reductions in car use, for the sake of the environment
N=980 Drivers Non-drivers Total
For the sake of the environment everyoneshould reduce how much they use their car
Agree % 66 66 66Source: British Social Attitudes Survey 2008 (2006 data)
The next two statements in the survey were more negative in tone. The first arguedthat one person changing his or her own car use would make no difference in helpingthe environment (Table 4.8), to which the majority of both groups disagreed. However,it is interesting to note that drivers were more likely to disagree (62%) thannon-drivers (51%).
Table 4.8: Level of agreement with the statement that one person’s reduction in caruse makes no difference
N=980 Drivers Non-drivers Total
Anyone who thinks that reducing his or herown car use will help the environment is wrong.One person doesn’t make any difference
Agree % 13 22 16
Disagree % 62 51 59Source: British Social Attitudes Survey 2008 (2006 data)
Finally, respondents were asked whether they agreed that people should be able touse their cars as much as they liked, even if this causes damage to the environment(Table 4.9). Here 23% of drivers and 24% of non-drivers agreed with the statement.Just under 40% disagreed in both groups, leaving around one third undecided.
Table 4.9: Agreement with view that people should be able to use their car as much asthey like
N=980 Drivers Non-drivers Total
People should be allowed to use their cars asmuch as they like even if it causes damageto the environment
Agree % 23 24 23
Disagree % 39 38 39Source: British Social Attitudes Survey 2008 (2006 data)
88 The Car in British Society RAC Foundation for Motoring

4 Public attitudes towards cars and car use
4.2.4 Willingness to reduce personal car use
The 2007 DEFRA Survey explored the extent to which people would be willing toreduce their own car use. Findings are shown in Table 4.10.
Table 4.10: Support for statements concerning reductions in car use
Agree Disagree
I would like to reduce my car use, but there are nopractical alternatives 45% 21%
It would be easy for me to reduce my car use 24% 45%
Driving my car is too convenient to give up for the sake ofthe environment 30% 30%Source: 2007 Survey of “Public Attitudes and Behaviours Towards the Environment” for DEFRA.
The first two statements consider ease of reducing personal car use, but approach thesubject from opposite directions. Just under one quarter believe that they do havealternatives and could reduce their car use, while 45% in both cases report that reducingcar use would be difficult or impractical. The third statement finds respondents evenlydivided (at 30% each way) on whether they could give up their car for the sake of theenvironment, with the largest proportion (40%) undecided or unwilling to comment.
There are clear differences in agreement levels amongst different types of residentialarea, as shown in Table 4.11. In each case there is a consistent gradation, with big citycar users being most likely to have alternatives to the car and village/rural dwellersbeing least likely to do so. The range is greatest in relation to an acknowledgedavailability of alternatives, at 19% (i.e. 58% vs. 39%), and least in relation towillingness to consider giving up car use for the environment, at 8% (35% vs. 27%).
Table 4.11: Variation in levels of agreement in Table 3.10 by type of area
Agreement
Big City Town/ Village/small city rural area
I would like to reduce my car use,but there are no practical alternatives 39% 44% 58%
It would be easy for me to reduce my car use 27% 25% 16%
Driving my car is too convenient to giveup for the sake of the environment 27% 31% 35%Source: 2007 Survey of “Public Attitudes and Behaviours Towards the Environment” for DEFRA.
RAC Foundation for Motoring The Car in British Society 89

The Lex/RAC Surveys have regularly repeated two general questions that relate to thecar dependence of the current lifestyles of respondents, and their willingness to useimproved public transport services. Figure 4.2 shows that over the past 20 years,between 78% and 90% of respondents believe they would find it very difficult to adjusttheir lifestyle to being without a car. The figures fluctuate from year to year, but there isno overall trend.
The responses to the question about willingness to reduce car use if public transportwere better, revealed a much greater fluctuation from year-to-year, with between 23%and 48% agreeing with this proposition in different surveys. There is probably a long-term upward trend in the proportions agreeing with this statement, though it is notconsistent from year to year.
Figure 4.2: Changes in attitudes to car dependence and willingness to use publictransport, over time
Source: Lex/RAC Report on Motoring surveys
The British Social Attitudes Survey report 2008 identifies a number of different groups,based on their attitudes and views about how easy it would be to cut down on car usefor short journeys:
� Nearly one in two drivers (45%) say they are both willing and able to reduce theircar use. They might benefit from more encouragement and support to make theswitch away from their cars.
� One in nine drivers (12%) are able to reduce their car use, but are unsure whetherthey are willing to do so. They too might benefit from more encouragementand support.
4 Public attitudes towards cars and car use
90 The Car in British Society RAC Foundation for Motoring
100%
90%
80%
70%
60%
50%
40%
30%
20%
10%
0%1988 1990 1992 1994 1996 1998 2000 2002 2004 2006
1989 1991 1993 1995 1997 1999 2001 2003 2005
% agreeing with statement
I would find it very difficult to adjust my lifestyle to being without a car
I would use my car less if public transport were better
Year

4 Public attitudes towards cars and car use
� Nearly one in five drivers (18%) say they are willing to reduce their car use but areunable to do so. This group might benefit from improved public transport andimproved walking or cycling facilities.
� 10% are unsure if they are willing to reduce car use and claim to be unable to usealternatives. 5% are unwilling, but able and 6% are willing but unable.
4.3 The benefits and disbenefits of car ownership and use
There is a large and varied literature on the benefits and disbenefits of car use, whichare briefly summarised in Figure 4.3 below and examined in more detail in the sectionsthat follow.
Figure 4.3: Scorecard of personal and social benefits and disbenefits of car use
Source: Authors’ own.
Car use can be seen as having a wide range of advantages, both for the individual andsociety and the economy as a whole.
� Individual car users benefit from car use in two ways. Firstly, there is the physicaladvantage of being able to access a wider range of goods and services at lowmarginal cost, at any time of the day or night, and in a way that is usually veryconvenient. Secondly, there is a psychological benefit that can be gained from asense of freedom, status, identity and even power.
� Society benefits from the widespread availability of car-based mobility, as thisexpands both labour and customer markets (except perhaps in the central/innerareas of large cities), and facilitates a greater diversity of skills and activities. Thecar industry also represents an important manufacturing and service sector withinthe UK economy.
RAC Foundation for Motoring The Car in British Society 91
Benefits Disbenefits
To users
To society
• Freedom to travel where &when desired
• Cheap travel at point ofuse
• Access to wider range ofgoods and services
• Ease of movement (forpassengersd & goods)
• Sense of power & identity
• Costs of car purchase andmaintenance (if on lowincome)
• Stress of driving• Lack of physical exercise• Chauffeuring requirements• Traffic accidents
• Expands labour andcustomer markets
• Facilities greatere diversityof skills and activities
• Important manufacturingand service sector
• Conjested road networks• Contributions to local air
and noise pollution• Contribution to CO2
emissions• Car-based developments
preclude non-car access

4 Public attitudes towards cars and car use
Conversely, some groups in society, such as low-income households or non-driversmay disproportionately disbenefit from the increasing need to own and drive a car inorder to fully participate in contemporary society. This may be down to the fixed costsof car ownership and maintenance, which would take up a high proportion of theirdisposable income. On the other hand, high levels of car use can also bringdisbenefits, both locally and globally. At a local level, congested roads and air andnoise pollution hotspots arise, whilst at a global level, there are increasing CO2emissions. High levels of car use have also encouraged the construction of residential,commercial and public sector developments that are not readily accessible by non-carmodes. These planning decisions thereby induce a degree of car reliance, and reducethe opportunities for those without access to a car. This effectively leads to a dynamicof car dependence within society.
The remaining sections of this chapter consider the published literature and the evidencefrom our focus groups, in relation to the perceived benefits and disbenefits of car use.
4.3.1 Benefits of car use: findings from the literature
Our literature review identified that there are huge advantages to be gained fromcar-based travel, both in terms of the increased access to key economic and socialactivities it offers the individual driver and to society as a whole, as a result of theseactivities. Numerous textbooks and academic articles refer to this as a deriveddemand, implying that it is not the car travel itself that is the primary benefit, but ratherthe opportunity to access goods and services that it allows.
The intrinsic value of travelling
Mokhtarian et al (2001) on the other hand, argue that travel has an intrinsic positivevalue in and of itself, which is largely overlooked by theorists and practitioners alike.The 21st century however, now witnesses the curtailment of some of these benefits bycongestion, the introduction of speed cameras and traffic calming measures.
Our review found that the more psychological benefits of car-based travel are oftendown-played in the literature on reducing car dependence, but they nevertheless playan important role in the public’s continued reliance on the car. This is evidenced by thefocus group discussions and other case study material.
A recent report from the CSS (previously the Society for County Surveyors) TransportFutures Group (2008), which was compiled from the contributions of a large number ofUK transport academics and practitioners, noted:
‘Travel is part of the way we live our lives and this must be taken into account aswe look ahead to consider the options open to us for how we live within and aspart of our environment’(CSS, 2008: 4)
92 The Car in British Society RAC Foundation for Motoring

4 Public attitudes towards cars and car use
The report concludes, that whilst there is evidence that some people are responding tothe suggestion that a fulfilment of our social responsibility would mean that we use ourcars less, the advantages of the car over other available modes of transport mean thatthe car is unlikely to diminish in importance for the foreseeable future. The authorspoint out that throughout history and in all economic conditions, people on averagehave travelled for around 80 minutes per day; the authors argue that this would allowthe average person to cover about 4 miles walking, 15 miles cycling, and 80 milesdriving or 150 miles by high speed train.
The convenience and flexibility of car travel
Repeated surveys have demonstrated that the majority of today’s population (eventhose who do not themselves own cars) favour car travel over any other mode oftransport. Travel by car allows us to decide when and where we travel and to controlthe microenvironment in which we do it.
In his report for the Reason Foundation, Balaker (2007) succinctly encapsulates themany perceived advantages of the car over public transport:
‘Travelers can reach relatively few destinations directly by transit, but motoristscan go from (almost) anywhere to (almost) anywhere. Transit service frequencyvaries according to schedules, but motorists can travel whenever they like. Theirtravels are not as restrained by fatigue as are walkers and transit users who trekto and from transit stops. Simple conveniences, like trunk-space, make it easier tocarry things and additional seating makes it easier to transport small children, theelderly, and handicapped. The enclosed space of a car can also spare travelersfrom the rain, snow, its own risks, many people feel safer traveling at night orthrough unfamiliar areas within the confines of a car.’(Balaker, 2007: 4)
Different benefits for different people
Clearly, however, different sectors of the population place more or less importance ontheir mobility and hold different values for different types of trips, modes and journeypurposes; this also changes at different life stages. The recent evidence–based reviewon mobility for the Department for Transport (2007) finds that from childhood peoplehave distinct mobility needs and experiences, which can largely be categorised by lifestages. For younger primary school children the escorted trip to and from school(mostly by car or walking) has an important focus, whereas for older children,independent mobility (commonly by public transport) is seen as positive, exciting andadventurous; aspects which are often outweighed for young teenagers by feelings ofdissatisfaction with the level of service.
RAC Foundation for Motoring The Car in British Society 93

4 Public attitudes towards cars and car use
The review finds that as we get older, the need to travel is largely determined by thedemands that are placed upon us: to travel to work, escort children to school, shop,etc. It suggests that the high reliance of parents on their cars reflects the multipledemands on, and time pressures of their busy lives. Gender also plays a big part indetermining the diversity of travel needs and experiences among adults. Men are stillmore likely to have access to a car, make more commuter trips and be less likely thanwomen to be responsible for the home and childcare, including shopping for food andescorting children to school. Declining mobility and health in older age can often meanhaving to give up driving, with associated reductions in the ability of older people toaccess essential services.
Greater independence and well-being for older people and women
In their study of the car use of Finnish men and women over the age of 65, Siren andHakamies-Blomqvist (2004) argue that independent community-related mobility is afundamental factor in the continued well-being of older people. They identify reducedmobility as associated with loss of independence, reduced general activity, poorerhealth and increased depression. Not surprisingly, leisure trips (broken down into thosefor no special purpose, hobby-related and those to access outdoor exercise) andshopping trips are of highest importance to both men and women in this group.The study found that women wanted to undertake more of these trips than men, butwere also often less able to do so. Another main finding of the study was that aftercontrolling for background demographic factors, the lack of a driving licence andgeographic inequalities in infrastructure were the most significant factors contributingto the poor mobility of different sub-groups within the sample.
Improved accessibility
In many ways, therefore, the benefits of car ownership can be identified in directrelation to the accessibility problems people experience when they don’t have regularaccess to private transport. For example, the 2003 Social Exclusion Unit (SEU) studyidentified that job seekers who can drive are twice as likely as non-drivers to secure ajob in the first six months of their unemployment. It also found that getting to hospital isparticularly difficult for people who have to rely on public transport, leading to missedhealth appointments and associated delays in medical intervention; 31 percent ofpeople without a car say they have difficulties travelling to hospital compared with17 percent with a car. People without cars also find it more difficult to access healthyaffordable food and to carry out social and leisure activities; a further contributing factorin determining health inequalities. These problems are particularly acute amongstnon-car owning households in rural areas, but are also prevalent in the urbanperiphery, particularly on social housing estates.
In a recent DfT survey of low-income car drivers in the UK, Taylor et al (2009) find that:
94 The Car in British Society RAC Foundation for Motoring

4 Public attitudes towards cars and car use
‘Car usage performs a demonstrably important role in facilitating access to, andparticipation in, a wide range of key services and opportunities for low incomehouseholds. This helps to account, at least in part, for the perhaps surprisinglevels of car ownership amongst low income groups, given the high financial costassociated with them.’(Taylor et al 2009: 55)
4.3.2 Benefits of cars: findings from the focus groups
In common with the above study’s findings, much of the discussion in this study’s fivefocus groups centred on the benefits of car travel over the transport alternatives thatthe participants saw as available to them.
Personal freedom and independence
A central (and often reported) theme in the focus groups was the sense of personalfreedom and independence their cars gave them. People in the ‘new drivers’ groupvalued their ability to travel at will rather than at set times of the day:
‘If you are having to get the train and it’s at a set time you feel restricted … whenin a car you could just go when you wanted to.’Male participant, new drivers group, Banbury
At the other end of the age spectrum one of the older participants told us:
‘You can’t rely on other people, if you want to shop at our age, you don’t want towalk miles to it. In the country, you really do need a vehicle, a lot more than inthe town.’Male participant, over 75s group, Banbury
Some participants, but surprisingly very few across all the groups, expressed a feelingthat they were psychologically attached to their cars. For example, one man told us:
‘I don’t see myself living in a world where I have no car … I think the problem isat the back of my mind I’ve got this psychological barrier that says I cannotabandon ship.’Male participant, voluntary switchers group, Nottinghamshire
Perhaps understandably, the more emotive comments about the value of a car camefrom a number of people in the ‘banned drivers’ group, where people cited the pleasureof speed and being in control, as well as the enjoyment of driving, purely as an activity,especially if it was a decent car:
‘Just I suppose if you’re going fast it’s like being on a roller-coaster if you’re goingfast but I suppose it’s even more exciting because you’re doing it, you’re
RAC Foundation for Motoring The Car in British Society 95

4 Public attitudes towards cars and car use
controlling it…It makes you feel good the fact that you can drive your car at highspeeds and still be in control’.Male participant, banned drivers group, Nottingham
The most extreme demonstration of love for a car came from a young woman who toldus how she had chosen her car over her boyfriend:
‘I finished with my boyfriend when I started driving … I had better things to do, Iwould just much rather be out in my car than be sat in his house … When I firstpassed my test I was just constantly looking out the window like I really want tobe out in my car and I just found excuses to go and I just had better things to doto be honest. He thought I was really sad … because I was always cleaning it, hesaid I was sad … We actually split up over my car. Yes, I’d much rather enjoy mycar than have a man any day.’Female participant, new drivers group, Banbury
In contrast, a large part of the ‘non-car owners’ group discussion focused on the lack offreedom and independence and the strong social and familial networks that need to bein place in order to survive without a car. The general feeling in the group was that ifthey could, they would get a car. For some of them the sheer pleasure of driving wasreason enough to want a car and a female participant said:
‘When I did have a little car, I just used to go off on my own and play my musicloud - on my own. At night.’Female participant, non-car owners group, Banbury
This was echoed by a male participant in the group who also valued the sense ofhaving his own space that the car offered:
‘Driving and music - a great combination! Cuts everything else out, you’re in yourown space.’Male participant, non-car owners group, Banbury
Improved access to goods and services
However, there were also plenty of less emotive reasons for people’s preference to usetheir car. These were most often expressed in terms of improved access to locations andservices. For most people, travelling to work and servicing family needs, such as goingshopping, were the main journeys that people felt they could least do without a car.
Participants in the ‘banned drivers’ group were more vigorous in their articulation of thefrustration of being without a car, finding their situation irritating and annoying. One ofthe retired participants in the group told us about his experiences travelling by publictransport since the loss of his licence:
96 The Car in British Society RAC Foundation for Motoring

4 Public attitudes towards cars and car use
‘I want to go and see someone who lives 10 miles away. I’ve got to try and get abus and there isn’t one that’s suitable and that’s frustrating.’Male participant, banned drivers group, Nottinghamshire
Another male respondent in the group was physically very isolated by thegeography of his home, which was a two-mile walk from the nearest bus stop. Ittranspired that he lived in a purpose built retirement settlement, from which a buswent twice a week, providing limited transport to local shops. His wife hadconsequently changed her shopping habits and was faced with reduced choice andhigher costs in the local shops.
The single mother in the group had also changed her shopping patterns and now usedmore local, but more expensive and less well-stocked, shops. She told us:
‘I use (a local branch of a supermarket chain). It’s bloody ridiculous, never gotanything in it and it’s very expensive.’Female participant, banned drivers group, Nottinghamshire
4.3.3 Public views on inadequacy of public transport alternatives
Poor access to desired destinations
A commonly held theme regarding public transport use across all five of the groups,was that buses often do not run to the locations where people want to go,particularly in the outlying villages, as explained to us by one woman in the‘voluntary switchers’ group:
‘There are so many buses for Arnold but they don’t go to where I need … I haveto walk another ten minutes [from the bus stop] to get to my house though it’s stillin Arnold.’Female participant, voluntary switchers group, Nottinghamshire
It was felt that bus routes in Banbury do not serve the main supermarkets, which madethem virtually redundant as a means of transport for older people:
‘You can get to town alright, but Sainsbury’s is a mile and a half that way, Tesco'sis a mile and half the other way. There’s no supermarket in the centre of town.’Male participant, over 75s group, Banbury
The most common issues held about public transport were the cost of fares incomparison to the car; personal safety and fear of crime whilst travelling on publictransport; poor bus driver attitudes and behaviour; the general inconvenience of publictransport in terms of poor bus frequencies, particularly at night and on the weekends;bad routeing resulting in the need for multiple interchanges or over-long journey times;lack of timetabling and other information and; non-integrated ticketing.
RAC Foundation for Motoring The Car in British Society 97

4 Public attitudes towards cars and car use
Cost of bus fares
The buses in Nottinghamshire were generally considered pricey for a family to use, nothelped by the lack of an integrated ticket scheme, which meant that people have to paymore than once to complete a single journey if they change bus companies. Forexample one woman told us:
‘… when I’ve got two or three children with me it’s more expensive to get the busand if we go as a family because I’ve got a sixteen year old, my husband, myselfand two younger children, it costs an arm and a leg to get into Nottingham andback, an absolute fortune’.Female participant, voluntary switchers group, Nottinghamshire
This was echoed in the ‘non-car owners’ group in Banbury, where single person busfares were considered relatively cheap (£1.70 return from a village on the edge ofBanbury) but taxis were considered cheaper if you were travelling with others;although the respondents identified that their cab fares had risen recently. We weretold that the cost of a mother with three children on a bus (£7.50) was too expensivecompared to a cab fare and the fact that cab drivers often helped with bags was seenas an extra incentive.
Fear of crime
As is common in such discussions, crime and, more importantly, fear of crime wereraised as important reasons for not using the bus, not only in the evening, as is theusual perception, but also during the day, as described by one participant:
‘I’ve actually had in day time where the bus driver has actually had to stop thebus and go upstairs and sort things out which was a bit unpleasant and I think thedriver should be purely driving the bus, not having to do that, I think it’s awful.’Female participant, voluntary switchers group, Nottinghamshire
Loss of personal control
People also talked a lot about the loss of personal control and independence they feltwhen having to rely on public transport:
‘Yes because it’s out of your control as to what time the bus is going to come,how crowded it’s going to be, if it’s going to come because they do take the oddone off don’t they whereas you choose what time you leave home, what time youget to work and if you leave work early you can walk straight out the door, straightin your car and you’re home.’Female participant, voluntary switchers group, Nottinghamshire
98 The Car in British Society RAC Foundation for Motoring

4 Public attitudes towards cars and car use
The unnotified cancellations of scheduled buses were considered a real disincentive forusing them, particularly in the more rural outskirts of Banbury, where buses were notfrequent anyway and thus a long wait time could ensue. This meant that people did notgenerally rely on the buses for important trips:
‘If I know I’ve got to be somewhere, it’s imperative that I’ve got to be somewhere,then I won’t plan it round a bus route.’Female participant, non-car owners group, Banbury
One woman in the ‘non-car owners’ group said she had a free bus pass, but it was nouse to her because of the lack of buses outside of peak operating hours:
‘Especially if you live in rural areas, because you don’t have a service that takesyou through the night. I’m not that old. If you want to stay out till 10 or 11 at night,you can’t.’Female participant, non-car owners group, Banbury
Some of the participants said they had difficulties using public transport, but whenpushed, articulated that it was a combination of inconvenience, the lack of personalspace, not being able to get onto trams in rush hour and the prohibitive costs of trainsand buses that kept them either walking or not undertaking a trip. One woman told us:
‘I would have to get on a bus to the train station, then get on the train, then fromthe station in Derby get another bus to campus. I hate public transport. I just won’tdo it.’Female participant, banned drivers group, Nottingham
Travelling from one rural area to another, where friends might live, was also describedas very difficult without a car:
‘If you live in villages then it is almost a necessity because the bus comes hereonce every hour and a half and that’s if it turns up and it's not precise on time,it turns up when it wants to then it’s gone.’Male participant, new drivers group, Banbury
People’s expectations of public transport were quite low in all three of theBanbury groups:
‘I don’t expect it to be on time all the time, I don’t expect to be able to get a seatbecause I’ve quite an experience of using the train, I used to use it seven days aweek before I had my car so yes, I don’t expect anything from it and so I don’tfind it disappointing.’Female participant, new drivers group, Banbury
RAC Foundation for Motoring The Car in British Society 99

4 Public attitudes towards cars and car use
It seemed that the local Dial-a-Ride option was not really a viable alternative either,even if you were eligible:
‘You can with a lot of difficulty get a vehicle to fetch you but it’s an all day job,it probably goes round three or four villages, when you get there you might befinished in two hours, you’ve got to wait another four hours if somebody else isin and they’re not done so it’s really [not an option]’Male participant, over 75s group, Banbury
4.3.4 Disbenefits of car use: findings from the literature
There is also a wide-ranging academic and policy literature base focusing on thedisbenefits of car travel. This mostly takes a macro or wider societal perspective,concentrating on the negative externalities of the car on the national economy, theenvironment and public health and welfare. There is more limited case study evidenceof the concerns of drivers and non-car drivers in relation to the negative impacts of car-based travel. From the literature however, it is possible to identify that the mainconcerns are as follows:
� Impact of congested road networks on the national economy� Declining bus use reducing its viability and efficiency outside major cities� Contributions to local air and noise pollution� Contribution to CO2 emissions� Pedestrian and cyclist safety� Car-based developments precluding non-car access� Impact on heritage buildings and quality of the built environment
Some of these concerns are better covered by the literature than others and have moredeveloped policy responses. It is clearly not appropriate to revisit this narrative in full,but the key tenets of the discourse are that rising car ownership, combined with othereconomic and socio-demographic changes in our society, have meant an increasingshift of both populations and our industrial and economic activities from the centre ofcities to edge-of-town or out-of-town developments. In a chicken and egg fashion, thishas encouraged a greater need to own and use a car in order to carry out essentialdaily activities and an increasing demand for car-base development.
Urban congestion
As car ownership and use has spread through the population, it has becomeincreasingly economically and physically impossible to meet the spiralling demand forroad infrastructure. This has meant that many urban and some interurban roads arenow experiencing high levels of congestion. Some of the costs associated withcongestion are borne by employers, for example the costs of inefficiency, missed
100 The Car in British Society RAC Foundation for Motoring

4 Public attitudes towards cars and car use
appointments, late arrivals, and overrun schedules. These costs are currentlyestimated by the Treasury to equal approximately £20 billion and are likely to continueto rise (Wellings and Lispson, 2008).
Declining public transport use outside of London
Car use also had a direct knock-on effect on the use of public transport, particularlybuses. The popularity of car use has led to a fall in bus patronage, which as a result,has led to deterioration in the frequency and quality of services in rural and peripheralurban areas as well as increases in fares. For example, the website of Trent BartonBuses (2009) notes that although just about everything regarding bus services hasimproved dramatically in the last ten years, reliability is still poor and this is the mostimportant thing for encouraging people out of their cars and onto buses. The companyattributes the majority of its unreliability to worsening traffic congestion, but with no twodays ever the same, robust bus scheduling remains problematic.
In recent times, Trent Barton Buses has had to extend journey times considerably toallow for increased traffic, often meaning they must use extra buses (for example theDerby - Sandacre - Nottingham rainbow 4 service used to take twelve buses but nowuses fourteen to deliver exactly the same frequency). Trent Barton Buses estimatesthat each additional bus they employ costs close to £100,000 a year to run. Therefore,congestion impacts heavily upon public transport operating costs, with a knock-oneffect for fares.
Child pedestrian accident rates and obesity
Meanwhile, measures to speed up the flow of the increased volumes of traffic haveoften caused deterioration in the conditions for other ‘softer’ modes, such as walkingand cycling. Children and pensioners are shown to be at greatest risk from road trafficaccidents. The pedestrian fatality rate for children in the UK is the highest in Europeand as with the fatality rate for people over 75 years of age, it is many times higherthan the national average. Children in social class V are five times more likely to beinvolved in a road accident as pedestrians than those in social classes I and II. Thereare nearly 30 times more child pedestrian deaths in the UK than there are deaths ofchild car occupants (Sonkin et al, 2006).
Children from higher income families, who are increasingly being chauffeured by carto their daily activities, are experiencing negative physical and psychological healtheffects. Reduced physical activity is strongly linked with the rapid increases inchildhood (and adult) obesity that have been witnessed in most Western societies inrecent years. Reductions in freedom and independence of movement can alsoundermine children’s mental development (see for example Fyhri and Hjorthol, 2008).
RAC Foundation for Motoring The Car in British Society 101

4 Public attitudes towards cars and car use
Accessibility and social exclusion
More than a quarter of households in the UK still do not have regular access to a car(comprising roughly one fifth of the total population). Non-car owning households areoverwhelmingly concentrated in the lowest income quintile of the population, with lessthan half (47 per cent) owning cars, although car ownership among this quintile isincreasing more rapidly year on year than for the other income quintiles (Departmentfor Transport, 2006).
According to the Department for Transport’s (DfT) National Travel Survey in 2006, aperson in the highest income bracket will travel 11,588 miles per year whilst those inthe lowest income bracket will travel less than half that distance; only 4,124 miles peryear on average. As the CSS report notes, once the benefits of travel are identified,this mobility disparity represents a significant constraint on both the opportunities andquality of life of lower income households.
This was confirmed in a 2002/3 study by the Government’s Social Exclusion Unit (nowthe Social Exclusion Task Force), which found that a lack of transport was a significantcontributing factor in the exclusion of many low-income groups and communities. Thestudy identified that the most significant factor determining someone’s ability toparticipate in society and access its services was car availability within households, i.e.non-car drivers in low-income households found it more difficult to access key servicesthan did their car owning counterparts across all areas of the UK.
In urban and suburban areas, the combination of road and junction design, trafficspeeds, congestion and inappropriately parked vehicles can cause severance ofcommunities and severely limit pedestrian activity. In rural areas, where there are ofteninadequate or non-existent footpaths, walking and cycling is virtually ruled outaltogether in the interests of personal safety. This means that people without access toa car are incrementally disadvantaged in their ability to travel, as services haveincreasingly developed with the majority car user in mind. Furthermore, these tend tobe the very people who are already most economically and socially disadvantagedwithin our society e.g. low-income groups, the elderly, young people (SEU, 2003).
CO2 and greenhouse gas emissions
Over the majority of the past 50 years, travel distances by car have been steadilyincreasing across all income groups, as Chapter 3 of this report demonstrates. Despiteconsiderable improvements in vehicle fuel efficiency, the increasing distances peopleare travelling and the growth in population mean that energy consumption and CO2emissions are still rising and are unlikely to fall without both dramatic innovations invehicle technology and radical reductions in people’s personalised travel demands.Based on the latest data from the Department of the Environment, Food and Rural
102 The Car in British Society RAC Foundation for Motoring
4 Public attitudes towards cars and car use
Affairs (Buchan, 2008), transport is responsible for about 28% of all greenhouse gasemissions produced in the UK and passenger cars are the main source of this,followed by heavy goods vehicles and light duty vehicles, including vans.
The Climate Change Act 2008 commits the UK Government to an 80% reduction inCO2 emissions based on 1990 levels by 2050 and the Secretary of State hascommitted to setting carbon budgets for each sector for three periods of five yearsbeginning with the period 2008-2012. The Department for Transport has not yetproduced a detailed strategy for delivering its carbon budget, but this is likely to rely onfuture technological advancement and innovation over the longer term from 2014–2050and on existing voluntary behavioural change measures. The Department recognisesthat it is unlikely to meet its reduction targets to 2012 (Department for Transport, 2008).
Local air pollution from road traffic
The links between air pollution from road traffic and health are increasingly recognised(WHO, 2005). Since the 1998 Transport White Paper, local authorities have beenrequired to undertake an annual review and assessment of air quality in their area toassist them in carrying out their statutory duty to work towards meeting the national airquality objectives. If a local authority finds any places where the objectives are notlikely to be achieved, it must declare the location an Air Quality Management Area.However, the UK has repeatedly failed to meet the air quality targets laid down by EULaw over the last ten years and in January 2009, the European Commissioner startedlegal proceedings in the EU Court of Law. Air pollution near many roads in British citiesaverages well over twice the World Health Organisation’s maximum recommendedlevel. In addition, the EU has recommended that if Britain is to reduce PM10 levels itwill need to substantially reduce traffic congestion, which could mean unpopularcongestion charging and low emission zones (Vidal, 2009).
4.3.5 Focus group perceptions of the disbenefits of car use
Although we did not specifically set out to examine the disbenefits of driving inthe focus groups, this topic often emerged spontaneously, as identified in thefollowing sections.
Cost of motoring and vehicle maintenance
The most pressing concern for a number of participants, particularly young drivers andthose in the ‘over 75s’ group, was the high cost of running and maintaining a car. Asone male participant commented:
‘I was going to say one thing is that as we all know, when you run a car it’s very,very expensive.’Male participant, over 75s group, Banbury
RAC Foundation for Motoring The Car in British Society 103

4 Public attitudes towards cars and car use
All the participants in the ‘over 75s’ group commented upon how much driving costse.g. insurance and tax, had risen. They felt that this was ‘an awful lot of money’considering what they use the car for. They also commented that recently they had hadto think twice before using their cars. A further observation made by this group was theincreased cost of motor maintenance. One of the men in the group noted:
‘Gone are the days when you could do your own maintenance, because thevehicles are so electronically advanced now, that you just can’t do anythingyourself. You’ve got to go to a garage.’Male participant, over 75s group, Banbury
In a previous study for the Joseph Rowntree Foundation, Lucas et al (2001) identifiedthat, on average, motoring costs account for 24% of the total household expenditure ofUK car owning households in the lowest income quintile.
The stress of driving
The stress of driving was also an issue and there were at least one or two ‘reluctantdrivers’ in each of the five groups. For example, one of the ‘banned drivers’ who wasbeing driven to work by a colleague said that this meant he didn’t have a stressful startto the morning. He realised he had more time to listen to music, watch TV or thinkabout building his career. He also noticed that it was easier on the company car park,which had one less car to deal with. Another man in the ‘new drivers’ group told us:
‘I don’t enjoy driving as much [as my friends], I see it as a means of gettingaround and I don’t enjoy doing it whilst I’m doing it.’Male participant, new drivers group, Banbury
Three of the young women and one young man in this group agreed with him and saidthey would prefer not to drive if they didn’t have to. One woman in the ‘over 75s’ groupalso admitted that she only drove to the local shops and was very unhappy driving longdistances now. She said:
‘To be honest, it’s my age. I feel like I’ve become a little bit of a coward, of gettingin it sometimes and taking it very long distances whereas I used to do muchlonger journeys. I’m a little bit frightened of driving too far.’Female participant, over 75s group, Banbury
Another woman in the group sympathised with this feeling and told us:
‘I’m almost afraid of stopping driving for fear that I won’t want to start again.’Female participant, over 75s group, Banbury
A female driver in the ‘voluntary switchers’ group told us how she was almost lookingfor an excuse to stop driving:
104 The Car in British Society RAC Foundation for Motoring
4 Public attitudes towards cars and car use
‘It was touch and go if it passed its MOT. I thought if it fails I could save myself afortune and I could walk to work and I wouldn’t have to go to the gym and I wasactually working out how I could cope without it and it wasn’t going to be amajor problem.’Female participant, voluntary switchers group, Nottinghamshire
Lack of physical exercise and obesity
Most people were also very aware of the obesity debate and discussed concerns aboutthe effect of their car-reliant lifestyles on both their own and their children’s health andindependence. One woman told us:
‘I think when you get a car, when you have a car you do become idle, you knowjust going to the corner shop, oh I’ll get in the car. Whereas, normally, if youhaven’t got the car you have to walk.’Female participant, voluntary switchers group, Nottinghamshire
A number of people in the ‘banned drivers’ group noted their increased fitness sincetheir ban and one woman said she had lost weight. One of the women in the samegroup has five children and said that losing her car had been ‘a mixed blessing’ wherethey were concerned. She told us that because whilst she could no longer drive theyounger kids to places in the summer, she found very creative solutions for themindoors and allowed them to play in the local area. She that both her and her childrenfound the change satisfying, because they drew on their own resources and felt moreintegrated into the local community.
Damage to the environment
The partner of one participant in the ‘non-car owners’ group was an environmentalscientist. This had led her to have concerns about the health of the planet and she alsofelt that her family benefited from walking and biking. For her, solutions to not having acar arose when necessary and she saw the positives of not being a car owner:
‘The longer it is that you haven’t got a car, the more you adapt to yourcircumstances.’Female participant, non-car owners group, Banbury
Feelings of burden and indebtedness
While highly valuing trips by car, the participants in the ‘non-car owning’ group talkedabout the need to be able to offer something of themselves back in the form ofbabysitting or cooking a nice meal to say thank you, or offering to take friends out for asandwich and a coffee. The feeling of being beholden sometimes came through with ahint of resentment:
RAC Foundation for Motoring The Car in British Society 105

4 Public attitudes towards cars and car use
‘I hate that terrible burden, you know that you, you tend to think that they’re goingoh Christ, B’s going to want a lift again, but they’re not, but you always get thatfeeling that that’s what they’re thinking.’Male participant, non-car owners group, Banbury
4.4 Conclusions
Our analysis of the available attitude survey data suggests that people’s attitudes todriving have remained fairly consistent over the last twenty years, with between 78 to90 percent of people still saying that they would find it difficult to adjust their lifestylesto being without a car (Lex/RAC Report on Motoring surveys). There does appear to bea slight increase in the last three to four years in the numbers of drivers who would beprepared to use their cars less if public transport was better, but it is unclear whetherthis is as a result of perceptions of a worsening of public transport opportunities overtime, a change in people’s attitudes or a change in the survey method over this period.
Repeated surveys have demonstrated that currently, the majority of the population(even those who do not themselves own cars) tend to favour car travel over any othermode of transport and the benefits of car-based travel are reflected in some of theacademic literature. Cars provide flexibility, convenience and freedom, and areassociated with status and self esteem.
However, there is also a growing body of literature referring to the disbenefits of masscar ownership to society as a whole. This is most often expressed in terms of thenegative impacts of current levels of road traffic on the economy from congestion, onclimate change from CO2 emissions and on social well-being and public health, due tothe diminished accessibility of non-car owning households, accidents, local air qualityand sedentary lifestyles.
Our focus groups have indicated that car owners value highly the freedom andindependence having a car offers them, as well as the wider access to goods andservices it can provide. Conversely, public transport is seen as being outside of theircontrol and many of the ‘non- car owners’ we spoke to found themselves largely relianton their car owning friends and families to get them to the places they needed to go.This made them feel a burden and isolated and was a particular problem for the olderpeople, single parents and rural dwellers in the groups.
This is not to say that many people in the groups did not also recognise the disbenefitsof car ownership and use, both for themselves and their families and also for widersociety. Many people noted the considerable expense of maintaining and running a carand there were at least one or two ‘reluctant drivers’ in each of the five groups. Somepeople said having a car has made them lazy and they expressed the desire to walk or
106 The Car in British Society RAC Foundation for Motoring

4 Public attitudes towards cars and car use
use public transport more, but at the same time they felt that this was often impossible,either because there were no suitable alternatives available to them or because theirlives were too busy to allow for such a switch. However, it should also be noted, that inalmost all cases, the participants felt that the benefits of having a car available to themfar outweighed any of the disbenefits, both to themselves and wider society.
RAC Foundation for Motoring The Car in British Society 107


RAC Foundation for Motoring The Car in British Society 109109 The Car in British Society RAC Foundation for Motoring
5Car use – a matter ofchoice or necessity?

5 Car use – a matter of choice or necessity?
5.1 Introduction
The previous chapters have demonstrated that in the large majority of households thecar now dominates people’s daily travel patterns and is central to their lives. While itappears that the historical penetration of the car into daily travel patterns may havereached or be approaching some limit, and that future growth will be driven mainly bypopulation increases, there are also likely to be downward pressures on car use, botheconomically, via higher oil prices and politically, as the Government strives toimplement policies to reduce CO2 emissions associated with road transport. In addition,with an ageing population it is likely that more people will have to give up driving forhealth reasons and will attempt to maintain their lifestyles without such ready accessto a car.
Given this situation, the question arises as to whether households could easily adjustto a reduced level of car use: are current patterns of car use a matter of choice orconstraint? This distinction is crucial to assessing the ease with which society and theeconomy could adjust to a less car-dominated way of life.
110 The Car in British Society RAC Foundation for Motoring
Key messages
� The literature identifies numerous factors underlying people’s choices of travelmode, which include practical and economic considerations as well as personalpreferences, habits, social normalisation and prestige.
� The term car dependence is used in a multiplicity of ways in the academicliterature to describe a broad spectrum of quite different kinds of car usebehaviours and dependencies – which is confusing and unhelpful.
� Discussions with the public found that most people can discriminate between cartrips made for convenience and those made out of necessity. Whilst most peopleare reliant on their cars for trips they deem ‘practical’, the vast majority of peopledo not display any addictive tendencies in this respect.
� Car reliance and dependence tend to grow over time. There is a ‘ratchet’ effect, inwhich households become locked into travelling increasingly by car, due both topersonal factors and changes in public transport and land use. For these reasons,car- owners are relatively unresponsive to many policy measures designed toencourage modal shift, and to sudden increases in the price of fuel.
� From a careful analysis of existing car use patterns, it is possible to identify tripsthat could relatively easily be carried out via another mode. Modal shift however,is unlikely to contribute substantially to the desired level of CO2 reduction nowbeing discussed.

5 Car use – a matter of choice or necessity?
The chapter begins by looking at the factors that influence travel choices (section 5.2)and then considers the concept of car ‘dependence’, as highlighted in the 1995 RACFoundation report of the same name (section 5.3). The dynamics of car dependenceand how this has built up over time are discussed in section 5.4, followed by anassessment of the extent to which current car trips are matters of choice or constraint(section 5.5). Some conclusions are drawn in section 5.6. The chapter draws inparticular on a literature review and findings from the focus groups.
5.2 Factors influencing car ownership and travel choices
Most behavioural theorists adopt an economic ‘rational choice’ model as the startingpoint for a discussion of consumer behaviour. This assumes that individuals makechoices by calculating the outcome with the highest net utility for themselves, based oncalculations of the various costs and benefits that will arise from the different availablecourses of action. In many ways, both car ownership and car use could be seen assimply another form of consumer behaviour. However, for at least some people, the carserves to be much more than simply a utility item, because it also feeds their socialand psychological need, as human beings, to conform to social norms andexpectations and plays a part in their sense of self-esteem and autonomy.
Jackson (2005) identifies two ways in which consumer goods, such as cars, are morethan simply physical devices for helping to meet economic needs; serving many othersocial and psychological functions and becoming pervasive within daily behaviour. Inparticular he notes that:
i) Material goods are important to us not only for their functional uses, but for the hugesymbolic role they play in our lives.
ii) Far from being able to exercise deliberative choices about what we consume, mostpeople most of the time are ‘locked in’ to their existing consumption patterns.
This lock-in occurs through economic and institutional constraints, inequalities ofaccess and restricted choice, as well as personal habits, routines and expectations andwider social norms and cultural values.
5.2.1 The motivations behind people’s travel behaviours
There have been several important attempts in the academic literature to identify themotivations underpinning people’s car use behaviours. For example, Bamberg andSchmidt (2003) applied three different models of general behaviour: Schwartz’s NormActivation Theory (1977), Ajzen’s Theory of Planned Behaviour (1991) and Triandis’sTheory of Interpersonal Behaviour (1977)), to assess which one best explained the caruse behaviours of university students when travelling to their campus in Boston, USA.
RAC Foundation for Motoring The Car in British Society 111

5 Car use – a matter of choice or necessity?
These three models were selected because they consider controversial core issuesraised within the psychology of the behaviours literature, namely:
‘Are pro-environmental behaviors mainly normative, moral behaviors (dueto the norm activation model) or mainly guided by the calculation of personalutility and costs (theory of planned behavior)? Is the enactment of everydayenvironmentally relevant behavior mainly under conscious control (theory ofplanned behavior), or is it activated in a more automatic, habitualized fashion(theory of interpersonal behavior)?’(Bamberg and Schmidt, 2003: 266)
Their main finding is that Triandis’s model proved to be the best predictor of car use,leading them to conclude that habit – the key feature of the model (or rather anhabitual choice process that, although first rooted in initial considerations about prosand cons, then evolves into routine-shaped automatic associations between stimulussituations and habitually chosen options), proved more influential in determining theend behaviour of car use than even the intention to use a car (as contained in Ajzen’sTheory of Planned Behaviour). In addition, the study found that ‘role beliefs’ (what atype of individual like me should do) were much more influential than ‘subjective norms’(what society says I should do) in determining outcomes. The upshot of this analysis isthat, for these university students at least, Schwartz’s moral (including pro-environmental) principles did not have a significant impact.
Partly in contradiction of Bamberg and Schmidt’s findings, in their meta-analysesof 23 unique datasets measuring car use behaviour and/or intentions, Gardnerand Abraham (2008) found that in addition to habit, both intention and personalbehaviour constraint has a large effect on individuals’ decisions on whether or notto drive. Their analysis thus largely endorses Ajzen’s Theory of Planned Behavior(TPB) (1991), which suggests that behaviour is determined by intentions, which inturn inform attitudes based on a person’s perception of the consequences of, andcontrol over, their own actions.
However, they also suggest that:
‘The emphasis of the TPB on rational agency may fail to adequately captureeffects of habit on repeated car use decisions: unlike deliberative cognitions,habits refer to cue-response behaviour initiated outside of awareness [and that,therefore] future TPB applications might benefit from supplementing car usecognitions with measures relating to non-car travel.’(Gardner and Abraham, 2008: 8-9)
Gardner and Abraham go on to suggest that people’s reluctance to adopt alternativetransport modes may result more from the perceived unattractiveness of alternative
112 The Car in British Society RAC Foundation for Motoring

options than the direct appeal of the car. However, they also warn that car drivers mayform negative attitudes towards these alternatives based on imperfect informationand/or lack of personal experience of them.
Figure 5.1 presents a summary of the key factors that have been identified throughthe literature as potentially having an influence on individual travel behaviours and theways in which these are related.
Motivations tend to underlie choice processes, and their influence on behaviouralintentions is mediated through social factors, personal beliefs and attitudes/values –which in turn may be influenced by information and marketing. In common with mostsocio-psychological theories of human behaviour, such frameworks tend to underplaythe physical barriers and constraints on any given behaviour, as these are seen aslying outside of the model; in Figure 5.1 they enter obliquely in the ‘behaviour shaping’box. This is not to say that they are considered unimportant by such theorists butsimply that they lie outside of the individual’s and his/her peer group’s sphere ofinfluence and thus are external to this particular line of enquiry.
Figure 5.1: The personal or internal factors influencing car use behaviours
Source: Jones (2008) Working Paper 4: Conceptual Components
5 Car use – a matter of choice or necessity?
RAC Foundation for Motoring The Car in British Society 113
Information• Mass media• Services• People
Motivations:• Needs• Aspirations
Beliefs:• Normative• Behavioural• Control
Attitudes/Values:
Behaviouralintentions
• Environmental• Modal images• Value systems
Behaviourshaping: Behaviour:• Habits• Constraints
• Car use• Activities
Social factors:• Role identity• Social norms• Social networks

5 Car use – a matter of choice or necessity?
114 The Car in British Society RAC Foundation for Motoring
5.2.2 External influencing factors
There are a number of wider external factors which come into play in determiningpeople’s car purchasing and use behaviours, such as general market forces andconditions, the transport systems available to people, the overarching regulatory andpolicy framework, and wider wealth and social practice considerations. Theseinteractions are typically two-way, and the evolution of patterns of car use is shaped byvarious changes and leads and lags in the state of these factors and their interactionsover time.
Figure 5.2 attempts to capture some of the interactions among these wider externalinfluencing factors. For example, car manufacturers not only meet consumer needs,but also contribute to shaping consumer aspirations; car users demand provision offacilities for various activities in purpose built structures, but the scale and location ofthese are shaped by car availability and transport provision; and there are linksbetween car characteristics and road network provision, both in terms of physicalcontact and the supply of ITS systems. These relationships feed into the temporaldynamics of car dependence, which is considered further in section 5.4.
Figure 5.2: Some wider external factors influencing car use behaviours
Source: Jones (2008) Working Paper 4: Conceptual Components
Regulatory/Policy Context
Wealth/Social Practices
CARUSE
• Consumer demands
• Consumer aspirations
OBJECTS:Cars
Shove’s Co-Evolutionary Triangle
SYSTEMS:Roads
Land use
USERS:Drivers
• ITS interations
• Road surface interactions
• Demands for provision
• Accessibility patterns

5 Car use – a matter of choice or necessity?
Faber Maunsell (2008) examined some of these external influencing factors in a recentstudy for the DfT, examining public perceptions of, and responses, to motorwaycongestion. It found that the main initial reason respondents gave for continuing to usebusy motorways was that there was normally no viable alternative for their journeys.On further discussion, however, it was established that this was not true and that publictransport was available for many of these journeys, but that it was seen as lessconvenient and/or slower than the car.
Generally, sitting in congested traffic conditions was seen as being more comfortablethan waiting for a train or bus and drivers felt more in control. More confident driversreported that they enjoyed driving even in congested conditions, because there wereoften open stretches of motorway where they could pick up speed and enjoy the drivingexperience. Drivers also saw the benefits of time alone, safety and independence andenjoyed the lifestyle benefits of their cars. Nervous motorway drivers tended to bethose with children and, although they said that they would prefer to use publictransport, they didn’t do so because of the lack of seating and storage and the cost ofpaying for more than one fare.
5.3 The nature of car ‘dependence’
One of the key problems with the debates in the academic literature has been that theterm ‘car dependence’ has often been used loosely to describe a broad spectrum ofquite different kinds of car use behaviours and dependencies.
Table 5.1 illustrates some of the different terminology that has been used in theliterature to characterise various degrees of dependence on car use.
In practice, writers refer more frequently to forms of ‘reliance’ than of ’dependence’ andthese can relate to different aspects of the trip or the traveller. Thus, references can befound in the literature to car reliant trips (those where no alternative form of transport isavailable), car reliant locations (which are not served by alternative forms of transport),car reliant activities (those which cannot reasonably be undertaken without a car, suchas shopping trips or complex trip chaining activities), or car reliant people (e.g. whohave mobility restrictions). Where the constraints are less binding, people refer to car‘convenient’ trips.
Other writers use categories that identify car trips which are open to behaviouralchange, but which are currently constrained by intervening factors such as cost, pooralternative transport availability or other barriers; in some cases this can be associatedwith almost addictive driving behaviours.
This list is not exhaustive and the categories are not mutually exclusive, but whatTable 5.1 serves to illustrate is that we need to be clear exactly, which of these
RAC Foundation for Motoring The Car in British Society 115

5 Car use – a matter of choice or necessity?
behaviours we are dealing with, since what motivates one of these behaviours may beentirely different from what motivates another.
The 1995 RAC Foundation report on car dependence points out that, although manypeople depend on their cars for many regular journeys, this is far from the ‘dependencyculture’ that is described in some of the theoretical and policies literature. It notes that:
‘For many people, the word ‘dependence’ does not accurately describe theirperception of how car use helps them to resolve these constraints. Rather, theysee cars as providing independence, with concrete other advantages includingthe immediate convenience to make journeys without planning, real financial
116 The Car in British Society RAC Foundation for Motoring
Table 5.1: An interpretation of the uses of terms associated with the concept of ‘cardependence’ in the international literature
A car reliant trip Where there is no other form of motorised transport availableand the journey distance is too long to walk or cycle.
A car reliant activity or Where it would be very difficult to make the journeyjourney purpose another way because of carrying shopping or other heavy
goods or undertaking a complex multi-destination trip.
A car reliant location Where it is virtually impossible to access a given location byany other mode of transport, or where it is impossible to live inplace without a car (e.g. a deeply rural village with no localfacilities).
A car reliant lifestyle Where it would be difficult to retain existing activity patternsand maintain a current way of life without a car.
A car reliant person Someone who would not be able to get around without a car,because of his or her limited mobility.
A car convenient journey Where the car is most convenient, as the alternatives areperceived as less attractive or unreasonable, due to additionalcost or longer journey time, or escorting young children.
A car dependent person Someone who uses their car as a statement of status or forreasons of self-esteem or identity.
A car addicted person A car fanatic, who talks incessantly about cars and whosewhole life revolves around the need to drive.
A car reliant society High and increasing levels of car use are observed among thepopulation as a whole and where people without cars areexcluded from essential activities.
Source: Lucas and Le Vine (2008) Working Paper 1: Literature Review

5 Car use – a matter of choice or necessity?
RAC Foundation for Motoring The Car in British Society 117
savings (and some illusionary ones), privacy from unpleasant people who mightbe using public transport, enjoyment of a feeling of control over choices affectingtheir daily lives and pleasure in performing active driving tasks.’RAC Foundation, 1995: 9
In their report for Transport for London (TfL), Steer Davies Gleave (2005) describe cardependency as a lifestyle and find that once people have experienced the benefits ofthe car it becomes ever more integrated into their lives. They suggest that this isbecause the car works at many levels, both functional and aesthetic, which incombination lead to its being largely used out of habit with little thought for anyalternatives that might be available. However, they also find that it is not the car itselfthat most people are dependent on, but rather what it delivers in the context of our timeconstrained, spatially dispersed and highly security conscious lifestyles.
In many ways Urry (2000) concurs with this assessment. He describes the car andwhat he terms automobility as a global icon of our times, through which people gainconsiderable social status from its sign-values of speed, home, safety, career success,freedom, masculinity, genetic breeding and sexual desire. He also finds that it is onlyby ‘inhabiting the car’ that we are able to carry out the multiple socialities of family life,community, leisure and work, which society now demands of us. This is because whatFreund (2003) refers to as the ‘structure of auto space’ effectively forces people tocarry out their lives over much greater distances and more fragmented times andspaces than previously.
Society’s move towards hyper-mobility also serves to increasingly disable or excludepeople who are not car drivers (Social Exclusion Unit, 2003) from fully participating inessential activities. Many business and enterprise parks, hospitals, shopping centresand colleges in our towns and cities are extremely difficult to access without a car. Urry(2000, page 4) goes as far as to describe this automobility as:
‘… a Frankenstein-created monster, extending the individual into realms offreedom and flexibility whereby inhabiting the car can be positively viewed, butalso constraining car ‘users’ to live their lives in spatially-stretched and time-compressed ways … Automobility coerces people to juggle fragments of time inorder to assemble complex, fragile and contingent patterns of social life, patternsthat constitute self-created narratives of the reflexive self.’Urry (2000, page 4)
It is difficult to assess from the literature at what point people’s car use transcends intocar ‘reliance’, or when this reliance becomes ‘dependence’ or, indeed, may beconsidered to be a pathological dependency or addiction. Clearly, there is a spectrumof behaviours and a huge degree of subtlety is needed in determining whether anindividual or household is genuinely car reliant or merely wedded to their car, becauseof habits, social norms and other non-physical factors.

5 Car use – a matter of choice or necessity?
5.4 The dynamics of car ‘dependence’
In general, the literature recognises that car dependence is a process that, for manypeople, intensifies over time and across three levels. First, car acquisition often leadsto voluntary and unanticipated changes in household lifestyles (and associatedchanges in travel behaviour) that are perceived to be richer and more flexible as theybecome more car based. Secondly, individuals then become habitualised in their use ofthe car for many of their trips (as identified in section 5.2), so that it is their automaticchoice of mode – unless there are clear constraints to car use (e.g. high parkingcharges) – and their knowledge of modal alternatives declines. Thirdly, as a result ofmany households adopting car-based lifestyles, this in turn has macro economic andsocial effects by influencing aggregate patterns of land use and public transportprovision, which can reduce opportunities to travel conveniently without a car, and solead to a growing structural form of car dependence.
These processes are illustrated schematically in Figure 5.3. A variety of triggersencourage car purchase, such as rising incomes, social aspirations and changingfamily circumstances, as well as declining accessibility by non-car modes.
Figure 5.3: The dynamic development of car dependence within a society over aperiod of time
118 The Car in British Society RAC Foundation for Motoring
More peoplechoose car
reliantdestinations
Generalincrease in carownership/use
in the area
Purchase a car
POPULATION
Suppliersdevelop caraccessible
sitesReduced PTpatronage
Many chosentrips rely oncar access
HOUSEHOLD
Increases their accessibility:
• Higher speeds => greaterdistances
• Greater spatial/temporalcoverage => moredestinations=> Greater choice=> More complex lifestyles
Triggers for car purchase:
• Increasing incomes
• Changing circumstances
• Reductions in non-car access• reduced PT services• more dispersed land uses
New, ‘carreliant’ lifestyle
established
Less scope forvisiting non-car
accessibledestinations
‘Cardependent’
lifestylesreinforced
Source: Jones (2008) Working Paper 4: Conceptual Components
5 Car use – a matter of choice or necessity?
For an individual household, acquiring a car gives enhanced speed and spatialcoverage, and so a much greater range of destination choices, both by time of day andover space; this can lead to new forms of activity/travel patterns that are strongly car-based, with little consideration of the availability of alternatives.
Over time, a car-reliant lifestyle is established, but in the short-term, often still withconsiderable scope for using non-car modes and destinations, if required or preferred.However, over time at an aggregate level, general increases in car ownership amongthe population in an area can result in reductions in public transport service levels, andthe location of new developments at out-of-town sites that are often only accessible bycar. When this happens, what were largely voluntarily chosen car-reliant activity/travelpatterns gradually become car-dependent lifestyles.
There is a ‘ratchet’ effect, and households become inadvertently locked into travellingby car. They are thus relatively unresponsive to many policy measures designed toencourage modal shift, and to sudden increases in the price of fuel.
The car is not the only technological development that has come to fundamentallyshape aspects of daily life for many people during the twentieth century. Anotherhistorical example would be refrigeration (Garnett and Jackson, 2007), which has had amajor domestic influence on household food purchase and storage patterns, and aglobal influence on food distribution logistics.
One participant in the focus groups identified a recent technological development thathas swiftly moved from being a luxury to being a necessity, with increasing socialexclusion implications for those without access:
‘It’s the same as a mobile phone, everyone survived before, never had one beforeand now can’t live without them.’Male participant, new drivers group, Banbury
Findings from Chapter 3 suggest that this process of aggregate public transport andland use adjustments in response to the increasing penetration of car ownership andhigh levels of car use among the population, as a whole has now largely run its course.The next section considers where this has left us, in terms of degrees of cardependence, and hence potential responsiveness to policy measures designed toencourage reductions in travel by car.
5.5 Current degrees of car ‘dependence’
The population collectively engages in a very wide range of activities and displays adiversity of lifestyles. One important group of activities that people regularly take part inare carried out at home, or in close proximity to home; some others can be accessedfrom home via tele-services, but the large majority usually require travel via some
RAC Foundation for Motoring The Car in British Society 119

5 Car use – a matter of choice or necessity?
mechanised form of transport. For car- using households, except those in larger urbanareas, most of these mechanised trips tend to be undertaken by car.
In several cases, these trips could be made by non-car modes, with varying degrees ofdifficulty. As noted in section 5.2, the reasons for car use are partly subjective in nature,for example, a lack of information about alternatives, or image concerns about usingpublic transport. In many cases, however, there are currently no reasonable orpracticable alternatives to car use that can sustain the kinds of activity patterns andlifestyles that people have built around their daily use of the car.
Figure 5.4 illustrates this spectrum of degrees of car dependence and the extent towhich particular activities or trips are either car-preferred or car-reliant, in differentsituations. The size of each part of the diagram broadly reflects its relative importance,as explained in the remainder of this section.
There is a wide variation in extent to which people are or perceive themselves to bereliant on their cars, as well as how they feel about this. This is best conceptualised asa distribution of differences in both journeys and individuals. At the one end are thejourneys where the car is the only available mode, or the individual is constrained fromusing another mode for reason of disability or load carrying requirements. Movingthrough the distribution we find situations where there is a lack of knowledge about theavailable alternatives, or there are strong disadvantages of time or cost in using these.At the opposite end of the distribution, are situations where people are fully aware ofthe alternatives and could easily use them, but actively reject doing so.
Figure 5.4: Different degrees of car dependence, across a range of activity patternsand lifestyles
120 The Car in British Society RAC Foundation for Motoring
“Core” carTrips
Accessible by non-car modes
OBJECTIVECONSTRAINTS
Increasing constraints
PREFERENCES & SUBJECTIVECONSTRAINTS
Trips made by Car
Car - Reliant
R A N G E O F A C T I V I T Y PAT T E R N S / L I F E S T Y L E S
Home-based or inclose proximityTele-services
Structural
Situational
Source: Jones (2008) Working Paper 4: Conceptual Components

5 Car use – a matter of choice or necessity?
10 This analysis only included residents’ car trips that started and ended within their hometown: this excluded betweenone-quarter and one-third of all car trips, and a much higher proportion of car mileage.
RAC Foundation for Motoring The Car in British Society 121
Recent research by Socialdata and others has attempted to quantify the extent towhich car use is a matter of preference or subjective constraint, or is due to objectiveconstraints that make it impractical to use an alternative mode (other than a taxi) for ajourney to that particular location, by that kind of person or group of travellers, for thattype of activity, at that time of day.
Using data from the three DfT Sustainable Travel Demonstration Towns (Socialdataand Sustrans (2004)), Table 5.2 shows the proportions of car trips made within thosetowns10 that have been identified as being either subjectively or objectivelyconstrained, before any awareness raising interventions were carried out.
As can be seen, roughly half of these trips are judged to be subjectively constrained,ranging from 39% in Peterborough to 56% in Darlington. Early indications are that thevoluntary behaviour change initiatives are succeeding in switching between 20% and30% of these subjectively constrained car trips to alternative travel modes (DfT, 2007).
Table 5.2: Proportion of urban car trips that are subjectively constrained andobjectively constrained
Darlington Peterborough Worcester
Subjective car use: alternatives available 56% 39% 46%
Objective constraints: no modal alternatives 44% 61% 54%Source: Socialdata and Sustrans (2004)
Note that the definition of what is a subjective or an objective constraint dependscrucially on what is considered to be a ‘reasonable’ modal alternative. In this analysis,public transport is considered to offer an alternative if it would have taken up to twiceas long as going by car, subject to a maximum increase of 15 minutes travel time.Walking and cycling are seen as possible alternatives if the trip distances are up to2km and 6km, respectively.
Figure 5.4 further divides the objectively defined car trips into two categories:
(i) Structurally constrained: due to patterns of transport service provision and land uselocation that make it impractical for people to use an alternative mode withoutexperiencing undue hardship; in the case of public transport, this may reflect acomplete lack of competitive public transport services to that destination, or a lack ofservice at the chosen/required time of day. (Note that, in principle, many of thesedeficiencies could be removed or reduced).
(ii)Situationally constrained: reflecting the requirements of the traveller or trip itself,such as the need to carry large or heavy items, or to transport people with mobility

5 Car use – a matter of choice or necessity?
122 The Car in British Society RAC Foundation for Motoring
restrictions. Here some form of door-to-door transport is likely to be required, and sothese tend to represent ‘core’ car (or taxi) trips.
The Socialdata analysis also distinguishes between car trips in this way, as shown inTable 5.3.
Table 5.3: Proportion of objectively constrained car trips that have structural orsituational constraints
Darlington Peterborough Worcester
Structurally constrained 73% 78% 72%
Situationally constrained 27% 22% 28%Source: Socialdata (2004)
Here it is apparent that situational constraints (relating directly to the traveller or thepurpose of the car trip) only apply in around one quarter of these cases, indicating that– in principle – it would be possible to provide viable alternatives for the majority of cartrips through changes in transport or land use policies.
5.6 Conclusions
The literature demonstrates that there have been numerous theoretical attempts tounderstand the underlying motivations for people’s car ownership and car usebehaviour. It is clear that the car relates to people’s lives at many levels, both physicaland psychological, but in many cases it is not the car itself that people are dependenton, but rather what it delivers for them in the context of time constrained, dispersedand highly security conscious lifestyles. In many cases, there are alternative forms oftransport available, but they are generally perceived by the public as less convenient orreliable and can also often be more expensive. In general, people prefer to use cars formost of their trips, and this also applies to those people who do not themselvescurrently have access to one.
Discussion groups with members of the public have found that people are able todistinguish between occasions where they are using their cars out of choice orconvenience, and where car use is a matter of necessity, in order to support aparticular employment pattern or lifestyle. In some instances, they recognise that theircar use behaviours are undermining aspects of their well being, for example in terms ofencouraging themselves to carry out the sometimes burdensome task of escorting theirchildren to out-of-school social activities or by way of enabling them to lead largelysedentary lifestyles.

5 Car use – a matter of choice or necessity?
Car dependence is a dynamic process, which builds up over time, both as a result ofpeople becoming personally used to a car-based lifestyle, and as a result of the supplyresponses in terms of reductions in public transport provision and relocation ofamenities to out-of-town sites, that have been made as a result of the large scaleincreases in car availability and use across the population.
Recent research into the nature of car dependence suggests that around half the cartrips that are now made within medium sized urban areas could be substituted by othertransport modes; although existing ‘smarter travel’ initiatives have only been able to taparound a quarter of this potential. But, so far, such initiatives have not extended to thecar trips by urban residents to rural destinations or inter-urban car trips. These accountfor a relatively high proportion of annual car mileage. Around 10% to 15% of all intra-urban car trips are truly car dependent, in that a car is required because of the natureof the trip or the mobility restrictions faced by the individual. This leaves a largeproportion of car trips, which in principle could switch to alternative modes, with littlechance of doing so, even if new services were provided or land use reorganised.
Given the current lack of ‘smarter travel’ initiatives therefore, the introduction of morecoercive measures to reduce people’s car use would be extremely unpopular;particularly if significant improvements in both the availability and cost of publictransport and the local provision of goods and services were not provided. The mostvulnerable in this respect are likely to be older people and lone parents living in ruralareas, and low-income workers who are reliant on a car commute to access theiremployment. These issues are explored more fully in the latter half of the next chapter.
RAC Foundation for Motoring The Car in British Society 123


RAC Foundation for Motoring The Car in British Society 125125 The Car in British Society RAC Foundation for Motoring
6The cost of adjustmentto individuals andsociety in moving to alow carbon future

6 The cost of adjustment to individuals and society in moving to a low carbon future
6.1 Introduction
This chapter first briefly considers the Government’s position on private vehicle use, asoutlined in its latest strategy guidance (DfT, 2008), and discusses what this might meanin terms of people’s future travel in the UK (section 6.2). It then, in section 6.3,presents the views of policy makers and practitioners, as elicited through exploratoryinterviews with a range of professionals, in order to establish what is actuallyhappening on the ground, in response to the recent national transport policy agenda.
Section 6.4 reviews the theoretical evidence from the wider social sciences literature toexplore how much is already known about what the economic and socialconsequences of more coercive car use reduction measures might be, triggered eitherby substantially increased fuel costs, or politically-led pressures to reduce vehicle CO2emissions and restrain car travel.
126 The Car in British Society RAC Foundation for Motoring
Key messages
� Current policy debates on the need to reduce car use in order to meet the recentlyannounced CO2 emission targets (Climate Change Act 2008) do not fully considerthe impact that this might have on people’s lifestyles and livelihoods, especiallythose who have limited travel alternatives.
� Empirical evidence relating to the economic and social consequences ofsignificantly reducing people’s car use is currently very limited.
� Limited experimental studies suggest that in the short term people absorb suchcosts, but in the medium term some groups may experience economic andsocial hardships.
� We also do not know what the knock-on effects of a reduced ability to travelmight be on the wider economy and society and this is largely not consideredby the literature.
� Some useful research has been undertaken in other disciplines about the broadercosts of adjustment to economic shocks, which may have lessons that couldusefully be applied to the transport field.
� Our focus groups demonstrated that many people have already adjusted their caruse and the way they drive as a result of recent economic pressures andenvironmental concerns.
� Most people cannot envisage a future without their cars and most would go toconsiderable lengths to maintain their ownership and a reasonable degree of use.Many also said they would use public transport more if it was more readilyavailable, convenient and cheaper, but this is rarely the approach people takein reality.

6 The cost of adjustment to individuals and society in moving to a low carbon future
Section 6.5 then considers this in light of our discussions with members of thepublic, who were asked to consider three future policy scenarios as part of thefocus group exercises:
1. Where the cost of motoring is significantly more (at least double) as a result ofcontinuing increases in petrol prices due to global barrel price increases;
2. Where additional cost is placed on the use of cars through either road user chargingor place-based congestion or parking charges;
3. Where their car use is restricted due to petrol rationing or the introduction of apersonal carbon allowance.
We were particularly interested to find out how the participants thought their lifestylesand livelihoods might be affected and what they saw as the key benefits anddisbenefits for themselves, their families and dependents and wider society of atransition to a less car reliant lifestyle.
The chapter concludes (Section 6.6) by considering the implications for future policyarising from these explorations.
6.2 Delivering a Sustainable Transport System
The latest strategy document to emerge from the DfT, Delivering a SustainableTransport System (DaSTS) (DfT, 2008) outlines five key goals for transport, focusingprimarily on economic growth and reduced greenhouse gas emissions, but alsoconsidering better safety, security and health, greater equality of opportunity andimproved quality of life. It acknowledges the Government’s commitment to an overallreduction in greenhouse gas emissions of 80% by 2050 compared to 1990 levels, andrecognises this presents a significant challenge for the transport sector. Transport isidentified as responsible for approximately half of the UK’s CO2 emissions, or about40% of greenhouse gas emissions. For domestic transport, approximately 96% ofthese emissions come from road transport, with passenger cars accounting for over50% of this.
Although the DfT’s policies and proposals to reduce its carbon budget are still indevelopment, it is clear that increased vehicle efficiency is high on the agenda, but sois encouraging behaviour change, through land use planning measures, publictransport investment, and demand management in the form of congestion charging andsmarter travel choices. Traffic is expected to continue to grow over the next twentyyears but the DfT’s own recent modelling (as well as our analysis for this study)suggests that there is considerable doubt about the rate of that growth.
It is interesting to note that in planning its national framework for transport over thenext 10 years, the Government appears to suggest that transport investment is largely
RAC Foundation for Motoring The Car in British Society 127

6 The cost of adjustment to individuals and society in moving to a low carbon future
either already committed or out of its hands. It states that the Government now ownsvery little transport infrastructure and that most transport spending is by households orregional and local authorities and the private sector. Its stated spending priority to 2014is on making better use of the existing network, combined with a targeted programmeof improved capacity, reliability and safety. Funding beyond 2014 will not be announceduntil next year, but it looks unlikely that there will be any surprises.
DaSTS appears to suggest that it is largely in the hands of individuals and the privatesector to make the key decisions in a future world of growing uncertainty surroundingthe shape of the transport system. However, this statement appears to overlook thatthe majority of the English Trunk Road Network remains in the hands of the HighwaysAgency, whilst Network Rail is a public body and Local Transport Authorities alsoreceive the majority of their capital funding from Government, even if it doesn’t directlycontrol these assets.
6.3 Local policy makers’ perspectives
Against this policy backdrop, it seemed pertinent to assess what directions localauthorities themselves were taking in relation to levels of car travel in their areas. Wespoke to policy officers from two Government Offices and four local authorities (oneCounty, one Passenger Transport Executive (PTE) and two Metropolitan cities), andalso a national bus operator and a property developer to gauge their perspectives onthis. The following sections present their current thinking in this respect.
6.3.1 Recognising the complexity of people’s transport decisions
Local authority officers and the bus operator both commented on the complexity ofpeople’s underlying motivations for their current car use patterns, and the need toconcentrate car restraint measures where there are already viable alternatives to thecar, such as around town centres and along high frequency public transport corridors.They suggested that there has been a fundamental shift in transport policy in recentyears, from trying to move people as much as possible out of cars and onto publictransport, to trying to make the most of the assets that are already available andadopting more of a balanced approach towards all modes.
One officer told us:
’We have to be much cleverer at understanding what journeys can be made byother means and indeed that some journeys are better made by car …Localtransport policy is not necessarily about getting people out of cars. Other optionsare not always viable.’Director, local transport authority
128 The Car in British Society RAC Foundation for Motoring

6 The cost of adjustment to individuals and society in moving to a low carbon future
The general view in our interviews was that there is still some way to go before the ‘lowhanging fruit’ is plucked, as identified by the following quotes:
’We have seen local benefits- reduced car dependence in certain areas. We nowneed to become more ambitious for the future … If people can get there by car,we’re still trying to create the public transport option. Breaking down variousbarriers – not just ‘is there a bus’, but safety, attitudes, etc.”.Transport planner, local transport authority
Overall, current policy appears to focus on car use management, but with a much moresegmented and sophisticated approach towards tackling different aspects of this:
‘In the optimistic days of the White Paper, we almost felt we could have a blanketapproach and we’ve learned that we can’t. We can’t tackle the problem withoutbreaking it down - carbon emissions, etc. At the moment they’re probably thestronger argument. Remove that and we still have to deal with the sheer volume[of traffic], there will still be a need to tackle the total demand for movement.There are always going to be reasons to try to manage the movement by car –free flowing, ambience, visual, safety, quality of life areas where people can walkaround without being intimidated.’Director, local transport authority
6.3.2 Managing congestion
Discussions with a representative from one of the larger bus operating companiesidentified that congestion often undermines improvements in bus operations:
’[We] have to manage congestion to allow public transport to take a bigstep forward’.Representative from a national bus operating company
A local authority representative suggested that local pricing is an important means oftackling congestion, but that it is likely to require strong leadership by centralGovernment, which is currently absent:
‘Ultimately, some form of pricing might be needed to manage congestion, but itwould not be immediately accepted in smaller cities and towns. Pricing is seen asa tax: not part of an overall package of charges, but an infringement. Governmentis abdicating – there are some things a local authority can’t do without a fullysupported national framework.’Director, local transport authority
RAC Foundation for Motoring The Car in British Society 129
6 The cost of adjustment to individuals and society in moving to a low carbon future
6.3.3 Concerns about social exclusion and accessibility
There was also a general understanding that car dependence is often situational andthat it can cause or compound social exclusion. Local authority officers expressedparticular concerns, that currently, public transport networks do not supply access tothe full range of work opportunities that the car network does, so the focus is onremedying this, through travel planning schemes, as well as targeted serviceimprovements. It was also noted that in some cases, the changed nature of urbanemployment means that large, peripheral manufacturing jobs have diminished, whichtends to increase car dependence, as it was more possible to provide public transportto these locations than to the current more dispersed sites.
It was felt that Accessibility Planning has made a difference through:
'Working closely with the Environment Agency, Housing and Highways Agency…The Accessibility Planning agenda has helped a lot. Transport is not always thesolution now.’Transport lead, Government Office
It has also helped with partnership working in some instances:
‘It has made a difference, bringing together different services to work on exclusion.’Transport lead officer, Government Office
Nonetheless, the feeling was that the efficiencies gained from consolidating health and(post-primary) education on larger sites is likely to outweigh transport considerations:
‘The health sector will reorganise to concentrate care and you can see thebusiness case for that. To some extent, transport is just expected. Everybodyexpects transport to sort itself out … All the drivers in education and health areagainst putting services in local areas. They do consult us, but it’s more ‘if weclose these four to make one, where is the best place to put it?’Director, local transport authority
Although in some areas housing is being planned to fit with accessibility objectives,there was generally little indication that land use planning is currently recognising theneed to facilitate a sharp reduction in people’s car use. For the long run, the signs aremore encouraging, as Regional Spatial Strategies are focusing new land usedevelopment on high-density corridors, which can more easily be served by publictransport. However, these Strategies are often not being linked with commensurateplans for new Government investment in public transport infrastructure in these areas,which suggests their impact on car use reduction will be limited.
130 The Car in British Society RAC Foundation for Motoring

6 The cost of adjustment to individuals and society in moving to a low carbon future
6.3.4 Integrating transport with wider local policy objectives
One hope for the future was seen to be better integration of car use reduction policiesinto other areas of local policy delivery that are often given higher priority by politicians.Car use reduction can often be fitted into that context, as one officer commented:
‘Members are often more interested in other issues, e.g. social services. Gettingrecognition among politicians of the fundamental role of transport in makingsociety hang together. Social services can’t be effective if people can’t accessthe services.’Transport planner, local authority
The practitioners described the decision-making and delivery structures for localtransport as highly complex, made more so by the need for more integrated transportand land use planning and the involvement of other key stakeholders in the economicand social spheres. Within transport policy itself, decision making is also fragmented;Passenger Transport Authorities, Metropolitan Districts, Counties, rural Districts andUnitary authorities all have different and often conflicting views of the best way forward,as well as differing powers and capacities to deliver.
6.3.5 A changing policy agenda?
It was clear from the interviews that that there has been a change of emphasis in localtransport policy since the RAC Foundation’s 1995 Car Dependence report. In practice,local authorities have adopted a range of different demand and supply-side policymeasures, with their Local Transport Plans aimed at encouraging people out of theircars and these have been implemented to a greater or lesser degree over the last tento fifteen years.
Our interviews suggest that local authorities are moving away from blanket policies totarget modal shift towards a more balanced policy approach across all modes. This ispartly in reflection of transport’s place as part of Regional Spatial Strategies andRegional Economic Strategies: the objectives are wider and the partnerships morecomplex, but all interviewees saw benefits from this structure, as it integrates land usewith transport (among other things). The significant shift in the policy agenda on theLocal Transport Authorities and Government Office horizons is the Sub NationalReview (HMT et al, 2007), which is expected to change the structures behind regionaland local policy. Again, this was largely seen as positive by our interviewees, since itwill further integrate transport decisions and delivery with land use, economic andsocial policy.
As identified above, a further significant shift in the policy agenda is the ClimateChange Act 2008, which commits the Government to reduce CO2 emissions by 80% by2050, based on 1990 levels. At this stage, it is unclear how local authorities anticipate
RAC Foundation for Motoring The Car in British Society 131

6 The cost of adjustment to individuals and society in moving to a low carbon future
they will be able to deliver the necessary steps to achieve this carbon reduction in thecontext of their current strategies and programmes. At present they seem to be lookingto central Government for a steer on how, where and when it is appropriate to enactsuch a strategy locally. However, the Department for Transport also appears to havereached something of an impasse at present. Despite a clear indication that it is awarethat the transport sector needs to make a significant contribution to reducinggreenhouse gas emissions, there is as yet very little evidence of how this will beachieved (DfT, 2008). From the limited available documentation, it would appear thatfour broad policy directions are envisaged:
1. Improved vehicle and traffic management technology2. Travel planning and other softer measures3. Road-based user charging, road tolling and congestion charging in innerurban areas
4. Personalised carbon allowances and carbon trading schemes
It is unclear what level of contribution the Department feels each of these broadstrategies will deliver, but it is evident that three of the four are aimed at encouragingreductions in overall car use through behaviour change. With behaviour change firmlyon the agenda, and road pricing still in the policy toolbox, it is essential that we fullyunderstand the impacts of changing policies on car-reliant people and places.
In the next sections, we qualitatively examine the likely impacts of the cost ofadjustment, for individuals and society at large, in adopting a more coercive approachto car use reduction, with a view to informing future policy.
6.4 Costs of adjustment to significantly reduced car use
Notwithstanding nuances in the trajectory of transport policy over the past decade,it is clear that the Government’s commitment to achieve an 80% reduction in CO2emissions by 2050 (based on 1990 levels) will lead to considerable pressure forsubstantial changes in existing patterns of car use. Such changes are likely to involvea combination of new vehicle technologies and reductions in car use. Changes intechnology and behaviour on the scale necessary to achieve the Government’s CO2targets would be unprecedented and may involve elements that are more coercive innature than existing or past policy.
Considering such changes, raises important issues regarding how such adjustmentsmight be made and, in particular, what the costs to individuals and businesses will befrom making such adjustments. At present, the understanding and measurement ofthese processes and their associated costs in a transport context is rather limited. Theaim of this section is therefore briefly to review existing knowledge and evidence fromtransport and related domains regarding such adjustment processes.
132 The Car in British Society RAC Foundation for Motoring

6 The cost of adjustment to individuals and society in moving to a low carbon future
6.4.1 Conceptual issues
Behavioural scientists typically identify several different types of costs associated withbehavioural adjustment processes. In the context of travel and activity participation,these costs would include:
1. The cost to the individual of seeking information, considering alternatives, and other“search” and cognitive costs incurred in the process of assimilating the stimulus anddeveloping and evaluating a response.
2. The cost to the individual of accepting a revised activity-travel pattern. These costswill in general include economic, psychological, social and emotional components.
3. The costs of adapting the public and private infrastructure stock to adjust to newactivity-travel patterns.
Existing evidence from studies of travel behaviour (and behaviour in other domains)suggests that individuals seek to adapt to changed conditions in a way that willallow them to preserve the status quo as far as possible and to minimise their costsof adjustment.
Classically, adaptation was seen as a sequential process, with the initial stimulusleading to a period of re-structuring and evaluation and ultimately, potentially, to anadjustment in behaviour. The contemporary view however, sees adjustment instead asan iterative process, emphasising the importance of how individuals gradually learnthrough experience about new conditions and apply their creativity to developpotentially novel responses.
Based on the existing literature, Figure 6.1 depicts a simplified archetypal view of howthe costs a person or household bears might be affected by a disruptive event, leadingto an involuntary reduction in car usage.
As the diagram illustrates, costs rise steeply immediately following the event, as theperson considers coping strategies and an initial adjustment in behaviour isundertaken. At this point in time, behaviour is in a state of flux. In this initial adjustmentstage, the person incurs more costs than previously as they seek to accommodate thepost-disruption reality. These costs may be both tangible and intangible, such as timeand energy spent in the adjustment process that one otherwise might spend at leisure,meeting social obligations, or in paid work. During this period of flux, costs haveunambiguously risen above pre-event levels. Following the period of initial adjustment,the person or household tends towards a new equilibrium, which may involve eitherhigher or lower ongoing costs than in the pre-event situation.
RAC Foundation for Motoring The Car in British Society 133

6 The cost of adjustment to individuals and society in moving to a low carbon future
6.4.2 Evidence from the transport domain
An experimental study by Doherty et al., conducted in 2002, elicited copingmechanisms and strategies, in as realistic a manner as possible, from a smallsample of people, in response to either a step-increase in fuel price or theunforeseen loss of a household vehicle. The authors noted that at the outset ofthe change, some households simply accepted and absorbed the added costs orburden and continued their lives as usual. This depended on the household’sability to reschedule its activities.
They found that in the mid-term, certain economic and social hardships, or lack ofindependence may accrue, but that if this could be withstood, more significant changesin people’s activity patterns, vehicle ownership and lifestyles may take place over thelonger term, and households may also choose to conduct more activities in the homevia teleworking or teleshopping.
Gärling et al. (2002) also speculated on a similar set of likely impacts of reduced caruse, in terms of potential coping strategies and second-order effects, as demonstratedin Table 6.1.
134 The Car in British Society RAC Foundation for Motoring
Figure 6.1: The effects of cost of adjustment on an individual’s behaviours over time
Source: Lucas and Le Vine (2008) Working Paper 1: literature Review
Initial Adjustment CostsPost Behavioural Adjustment
Higher Costs?
Lower Costs?
Pre Costs
Pre-Event
AdjustmentEVENT Post-Adjustment
Time
Cos
ts(E
cono
mic
,Em
otio
nal,
Soc
ial,
Psy
chol
ogic
al,e
tc.)

6 The cost of adjustment to individuals and society in moving to a low carbon future
Table 6.1: Potential negative effects of car use reduction
Short-term effects Intermediate effects Long-term effects
Compressing activities Changing residence, Reduced subjective andin time workplace or work hours objective well-being
Switching to slower Teleworking Worse family functioningtravel modes
Increased trip chaining Change of leisure Psychological andactivities physiological stress
Increased combination ofactivities and coordinationof tripsSource: Gärling et al. (2002: 99)
We note that while this listing of effects is plausible, there are two major complications.First, effects are likely to be specific to the chosen car restraint policy, whether quota-based, financial disincentives/incentives, personalised travel planning, or otherwise.Further, the timescales of impacts are likely to depend on the degree of advanceknowledge of the policy in general and its perceived permanence.
A limited body of literature also exists on people’s behavioural responses tocongestion, which has the advantage of being revealed-behaviour. For instance,Mokhtarian et al. (1997) report (within the context of city workers in San Diego,California) three key findings:
1. Individuals perceive the set of alternative coping strategies, as consisting ofstrategies ordered on the basis of costs. Thus, individuals are likely to adoptlow-cost strategies before they adopt higher-cost strategies.
2. Individuals who face increasing congestion view the choice of alternative copingstrategies in a manner, which is, among other things, dependent upon theirsocio-economic and demographic characteristics.
3. Policy measures designed to reduce travel may have a smaller impact thanexpected, as individuals try first to maintain current levels of travel while reducingthe personal impacts of congestion.
Looking more broadly at the literature on life shocks, as might be expected, thestructure of ongoing post-adaptation costs appears to be a function of the type oflife-disrupting event. Clark et al. (2008) presents empirical evidence that people areable to adapt more or less fully to certain life-disrupting events (e.g. divorce,widowhood, childbirth), but not to others (unemployment in particular.)
RAC Foundation for Motoring The Car in British Society 135
6 The cost of adjustment to individuals and society in moving to a low carbon future
At first glance, we may expect that the ongoing adjustment costs following a car usereduction scenario will be necessarily higher than those pre-event. Travel, being ingeneral a derived demand, is for the most part undertaken to serve the positivevaluation that people place on the destination activities. Disruption to people’s personalactivity choices – and how/whether they are accessed – would be expected to exactcosts on the individual.
However, the concept of a travel burden has been put forward, as a situation in which acar use reduction scenario might actually result in lower ongoing costs, by consideringtravel to be an encumbrance. Another conceivable cost-saving mechanism would besavings on maintenance of road infrastructure and the automobile stock. These seemunlikely to be larger in magnitude than the cost-increasing effects; however, withoutprior knowledge it is an open research question whether ongoing costs might rise or falloverall relative to before car restraint policies were enacted.
6.5 Public perceptions of the cost of adjustment
In our focus groups with the public, we asked people how they would respond to morecoercive measures to encourage car use reduction. The groups were asked to considertheir travel, activity and wider lifestyle responses to the three potential future scenarios,laid out in Section 6.1, in relation to their own car use. The following three sections ofthis chapter present their responses to each of these scenarios.
6.5.1 Reactions to increased fuel costs
It was clear that recent rises in fuel costs during the first half of 2008 had already mademany participants think more carefully about how to use their cars, doing more witheach journey and planning ahead, as demonstrated by this quote:
‘To some extent we have cut down. We’ve got to a point where we think beforewe get into the car. We do more with a single journey.’Female participant, voluntary switchers group, Nottinghamshire
Another participant told us:
‘I did actually have a bigger car, a Land Rover; it cost me a lot of money, taxgoing up for four-wheel drives. I really liked it but got a smaller car, tax and petrolare less. I almost gave it away. Nobody wanted to buy it.’Female participant, voluntary switchers group, Nottinghamshire
One participant in the ‘over 75s’ group had got rid of his second car and now alsocar-shared with his neighbour:
136 The Car in British Society RAC Foundation for Motoring

6 The cost of adjustment to individuals and society in moving to a low carbon future
‘Well we’ve gone down from two cars to one car. My wife and I used to have a careach but she only used to use her car once a week to go to the hairdressers, sowe done away with the second car and we palled up with another couple and wetake it in turns, so that has saved on petrol because we’re both going to the sameplace at the same time and coming away at the same time.’Male participant, over 75s group, Banbury
The participants recognised that, in a future where petrol was scarce or traveldistances restricted in some way, patterns of work would change and jobs might betaken on the basis of how close to home they were. For instance, a long-distance lorrydriver in one group said that he would consider sleeping in his lorry over-night for fivedays a week and only go home at weekends. Over the long term, he said he wouldconsider re-locating his employment closer to home, but this would mean taking alower paid job. He noted that there was no chance that he would consider relocatinghis family closer to his job, because their quality of life would suffer due to the loss ofclose family and social networks locally.
On the other hand, some people just couldn’t conceive being without their cars on along-term basis, no matter what the increased cost. For example in the ‘banned drivers’group (in which participants were probably more aware of the consequences of nothaving a car due to their current position), two respondents said they would takeanother job rather than risk losing the use of their car altogether:
‘I’d do everything I could to keep the car. I’d probably get another job. It wouldn’tbother me really, the freedom you get from your car compared to the time youspend working to provide for it just doesn’t compare.’Female participant, banned drivers group, Nottingham
Where people said they would consider giving up the car altogether because ofincreased costs, they suggested that this would mostly mean nothing more radical thanrethinking some trips and planning ahead more. For example one woman told us:
‘I’d probably get up earlier and go down before work or go after work or do moreon Saturday.’Female participant, voluntary switchers group, Nottinghamshire
It was mostly the people in the ‘voluntary switchers’ group who responded in this way,which suggests that they were not particularly car reliant in the first place and couldeasily adapt to a no-car situation.
RAC Foundation for Motoring The Car in British Society 137

6 The cost of adjustment to individuals and society in moving to a low carbon future
6.5.2 Responses to direct charges on car use
Participants were asked their opinion on the introduction of national road user chargingor area charging schemes. Two participants in the ‘voluntary switchers’ group (onemale, one female) didn’t like the idea of restrictions or congestion charges at all,out of principle:
‘I wouldn’t pay them. I just don’t like the idea of paying these charges, congestion,toll, that would force me off the road, but it’s not likely to stop me using the car. Itwould stop me driving into those areas.’Male participant, voluntary switchers group, Nottinghamshire
‘Yes that’s right yes, I don’t like being made to pay more for the same journey nomatter how much I like the car, it’s just the principle behind it’.Female participant, voluntary switchers group, Nottinghamshire
This was by no means the general sentiment of the participants, however, and anumber of people were in support of place-based charging schemes, such as theLondon Congestion Charge, particularly in the centre of major cities:
‘I think that actually it’s probably quite a good idea in major town centres, I don’tthink it should just be rolled out everywhere as an extra tax, but London I used todo, I used to run a cab and courier company in London and the centre of Londonwas absolutely near gridlock virtually all the time every day. So I think that in thatrespect probably Manchester and Birmingham could probably afford to do thesame for the same reasons but not just everywhere’.Male participant, non-car owners group, Banbury
There was general agreement across the groups that public transport would need to beexcellent if charges were to be introduced, so that any restrictions on car use werebalanced by a substantial increase in the supply of public transport. London was putforward as an excellent example of where public transport is of high quality inside thecongestion zone and thus people are not inconvenienced by not being able to drivetheir cars into central London.
6.5.3 Travel rationing
In the travel rationing scenario, most people agreed that their social needs wouldcompete with domestic and family needs and that that there would be a real struggledeciding what aspects of their current car travel to give up:
‘There would be a fine line between what I wanted to do and what I should do.’Female participant, non-car owners group, Banbury
138 The Car in British Society RAC Foundation for Motoring

6 The cost of adjustment to individuals and society in moving to a low carbon future
When pushed they said they would sacrifice clothes, hairdos and charity donations tokeep the car and maintain their lifestyles.
A number of people recognised that they could potentially switch some of theirshopping activities to online, car share or walk. However, it was a scenario that wasgenerally conceptualised by people as being well into the future, by which time it wasoften felt that other solutions would materialise, as one participant observed:
‘I think by that time the technology might increase and the cars will be drivingunder solar power.’Male participant, banned drivers group, Nottingham
6.5.4 Wider impacts on family, friends, and society
Many people said that greater restrictions on driving would mean having to choosewhich kids did what on what night or alternating the activities for fairness. One womantold us:
‘It would mean my children wouldn’t get as many different places as what they donow, they wouldn’t be able to do as many clubs and social things. Shoppingwould be difficult because I’d have to try and get to work, get out to the shop, getback, pick the children up, pick them up and take them, it would be very difficulttime-wise for me.’Female participant, voluntary switchers group, Nottinghamshire
One participant in this group said that she would not be able to visit her elderly motherso often and there was a general sentiment that informal care networks for the elderlywould be quite seriously eroded in this respect. For one or two of the ‘new drivers’ notbeing able to drive would throw them back into a situation of dependence on theirparents:
‘I’d probably become more dependent on my dad again because he has acompany car so he gets the petrol paid for, so I’d probably spend more time withmy dad.’Female participant, new drivers, Banbury
On the other hand, it was suggested by some that the effects of less car use on thecommunity as a whole, could be quite positive in terms of reducing pollution, givingpeople more personal time for reflection, such as reading a book or ‘seeing’ places thatare local but ignored and encouraging greater on street activity and community spirit.One woman noted that:
RAC Foundation for Motoring The Car in British Society 139

6 The cost of adjustment to individuals and society in moving to a low carbon future
‘I think it would be amazing, people would actually speak to each other and youwould see people’Female participant, voluntary switchers group, Nottinghamshire
On the downside, it was suggested that there might be more reported sickness offwork, if petrol was rationed or scarce:
‘It’s like a few years ago when we had that petrol strike, it had a knock-on effectwhere I worked, people weren't coming in because they said well I’m not going onpublic transport, I’m not spending hours to get to work (a) I can’t afford it and (b) Ihaven’t got the time, so the sickness rate really went up through the roof.’Female participant, voluntary switchers group, Nottinghamshire
But on the other hand, it was noted that more people would probably work from home.
One participant noted that greater restrictions on the car would be likely to impact onrural settlements the most:
‘I think that the younger people that have got employment would have to look forhousing nearer there, so it would change the whole structure of rural life again.Because there’d be an awful lot of the young people that are still employedactually leaving the villages to go to towns or cities and, once again, you comeback to the situation where the small rural villages are more elderly people thanthere is [young people] so that the actual balance of the village goes out as well.’Male participant, over 75s group, Banbury
6.6 Conclusions
This chapter has reviewed some of the recent developments in UK transport policy, inparticular what the UK Government’s recent commitment to an 80% reduction ingreenhouse gases by 2050 (based on 1990 levels) might imply for people’s privatevehicle use in the UK. It has identified the responses of local policy makers in relationto these new challenges and also explored the perception and potential adaptations ofindividuals and households to a range of potential car use reduction measures, asthese were explored through a series of focus group exercises for this study.
The key concept linking these various elements of the chapter is the concept of thecost of adjustment. As policy interventions become more coercive, so it is likely thatthese costs will rise. The existing behavioural literature provides some insights into thenature of adjustment processes and the nature of the costs entailed. However, there isvery little empirical evidence that quantifies the magnitude of these costs or how theyrelate to specific policy measures. Thus, we conclude that developing a sounderempirical understanding of these issues presents a significant new research challenge.
140 The Car in British Society RAC Foundation for Motoring

6 The cost of adjustment to individuals and society in moving to a low carbon future
The focus groups provided some useful insights into the degree of car dependencethat might currently exist within the UK in 2008, which influences the scope for low costadjustments. These insights broadly supported the findings of our literature review, thatcar dependence is a complex and varied phenomenon, which is experienced differentlyby different people in different circumstances. Such exercises can clearly offer only asnapshot of the situation and are in no way intended as a true representation of thewider picture. Nonetheless, it was clear from the discussions that a number of peoplein each of the groups were willing to give up their cars given the right inducements,such as better or cheaper public transport, whilst others were more embedded inpatterns of car use.
However, our interviews with local policy makers suggest that many authorities alreadyimplement many of the policy instruments they are legally sanctioned to adopt.Although these have been successful in producing minor levels of modal shift and/orreduced car use, they fall far short of the levels in reduction that might be needed tomeet the Government’s new emissions targets. They also feel that it is unlikely thatlocal congestion charging would be an acceptable option for them politically. There wasstrong support among the professional interviewees for a project, which wouldseriously consider the range and nature of the costs of adjustment that might resultfrom more coercive measures for car use reduction.
RAC Foundation for Motoring The Car in British Society 141


RAC Foundation for Motoring The Car in British Society 143143 The Car in British Society RAC Foundation for Motoring
7Conclusions andrecommendations

7 Conclusions and recommendations
The exploratory analysis presented in this report has revisited the issue of cardependence within the contemporary policy context and has identified a wide-rangingdebate on its nature and extent. This partly reflects substantive differences inviewpoints, but it is often more the result of confusing and conflicting use ofterminology, describing numerous and very different aspects of people’s patterns of carownership and use under the banner of ‘car dependence’. From this we conclude that itis not a particularly useful or accurate descriptor to encapsulate the current role of carswithin UK society.
The report identifies that car use in the UK has continued to spread across thepopulation since the RAC Foundation’s 1995 Car Dependence study. This isparticularly the case for groups that have traditionally not had access to a car, such aslower income households, older people and women. Car owners are also continuing todrive later in life, especially men, as people are living longer than ever before and arekeen to retain their active lifestyles. Even non-car owning households make an averageof two car trips a week and a quarter of all their shopping trips are by car. Therelationship between household income and car ownership is weakening, as lowerincome households are acquiring cars. This suggests that for most of UK society, caruse is now the norm.
It is also the case that the type of area where people live and their level of access topublic transport is becoming a stronger predictor of people’s car use than the traditionalpredictor, household income. This suggests that the role of place and the differentopportunities that it offers in providing viable alternatives to the car will be an importantconsideration in any future policy measures for car use restraint. The differential impactof policies for different people in different places is a highly under-researched area andalso has been largely overlooked by policy makers.
Despite the growing penetration of car ownership and use across the population, inrecent years car use per person has levelled off and some aspects of personal cartravel have declined slightly. Depending on the measure used, growth in average caruse per person ceased at some point between 1995 and 2002. The halt in the increasein average car use per person is consistent with a continuing growth in car ownership,because cars are being used less intensively over time.
Looking at a more aggregate level, national car road traffic continues to grow slowly,but in the recent, pre-recession years, only in line with increases in the nationalpopulation of driving age. If this situation continues, then future aggregate growth ratesfor car traffic will be less than has historically been observed and may require areassessment of our long term traffic forecasts- car traffic may simply mirror theincrease in the number of adults in the population. A recent study of driving patterns inthe USA has found a similar pattern.
144 The Car in British Society RAC Foundation for Motoring

7 Conclusions and recommendations
Even if car use is stabilising, there are likely to be a variety of economic andenvironmental pressures to curtail car use in the future. Despite some successes withvoluntary policies to reduce people’s car use through place-based parking charges,travel awareness and other personalised travel campaigns, central and local policy haslargely been unable to affect drivers’ choices to use their cars for most journeys. Theliterature has demonstrated that the needs and circumstances of the driving populationvary enormously, in terms of their socio-demographic characteristics, social andpsychological drivers and motivations, their economic and physical circumstances andtheir roles and responsibilities.
This means that some people are more resistant to change than others and some morevulnerable. The Lex/RAC Motoring Reports consistently shows that between 78 to 90 percent of drivers say they would find it very difficult to adjust their lifestyle to being without acar. Loss of freedom and personal control is a big factor in this, but also the perceived lackof availability of viable public transport alternatives for some or all of their journeys.
Our focus groups show that many people are currently prepared to hold on to their existingcar use behaviours, even when this requires compromising other areas of householdexpenditure or putting up with challenging driving conditions, such as in traffic congestion.This is largely due to both their personal circumstances and the wider constraints andinconveniences they perceive they will experience if they switch their journeys onto publictransport. Emotional or psychological attachment to the car is an issue for some people,but for most, the practical utility and lower cost of the car is the key.
Our professional interviews suggest that local authorities are moving away from blanketpolicies to target modal shift, towards a more balanced policy approach across allmodes. However, it is unclear how they anticipate they will be able to deliver thenecessary change in car use reduction to achieve a low carbon future in the context oftheir current strategies and programmes. At present the focus remains on ‘picking thelow-hanging fruit’, whilst waiting for central Government to determine how, where andwhen such a strategy should be delivered. However, the Department for Transport alsoappears to have reached something of an impasse at present; despite a clearindication that it is aware that the transport sector needs to make a contribution toreducing greenhouse gas emissions.
From the limited available documentation, it would appear that four broad policydirections are envisaged:
1. Improved vehicle and traffic management technology2. Travel planning and other softer measures3. Road-based user charging, road tolling and congestion charging in inner urbanareas
4. Personalised carbon allowances and carbon trading schemes
RAC Foundation for Motoring The Car in British Society 145

7 Conclusions and recommendations
It is, as yet, unclear what level of contribution the Department feels each of thesebroad strategies will deliver, but it is evident that three of the four are aimed atencouraging reductions in overall car use through behavioural change. It is also clearthat the achieved reductions will need to be significantly greater than the 11%reductions that have already been witnessed through best practice travel planninginitiatives in urban areas. This suggests that future policies will need to place a fargreater emphasis on road pricing and/or rationing car use in some way.
Considerable research has been carried out since the mid- 1990s and the transportprofession has gained experience in observing the ability of policies to influence caruse through a variety of initiatives, from the London Congestion Charging scheme tothe Nottingham tram lines and the application of ‘smart travel choices’. However, mostadjustments made by travellers have been marginal in nature and there is a generallack of understanding of the likely consequences, both for the economy and society, ofmajor reductions in car use, beyond those which can be achieved by voluntary meanswithin a stable environment.
This is clearly a subject for significant further research, in order to better inform policydebates in several government departments and to help to reduce the negative impactsof future economic pressures and policy measures on car-using families. While therewill be scope to explore some of these issues through the re-use of existing data sets,we recommend that detailed empirical research is needed in order to fully examine thenature and extent of the ‘costs of adjustment’, particularly where economic and politicalpressures result in households having to cut back their car use, beyond which theywould voluntarily. This should seek to identify the kinds of measures that could betaken, both by the public and private sectors, to reduce any undue burden and/or socialexclusion arising from economic or political pressures to reduce car use.
146 The Car in British Society RAC Foundation for Motoring

RAC Foundation for Motoring The Car in British Society 147147 The Car in British Society RAC Foundation for Motoring
References

References
Anable, J., 2005. ‘Complacent Car Drivers’ or ‘Aspiring Environmentalists’: Identifyingtravel behaviour segments using attitude theory. Transport Policy, 12, pp. 65–78.
Balaker, T, 2007. Why Mobility Matters to Personal Life. [Internet] Los Angeles: ReasonFoundation (The Galvin Project to End Congestion).Available at: http://www.reason.org/pb62.pdf[Accessed 7 July 2008].
Bamberg, S., & Schmidt, P., 2003. Incentives Morality or Habit? Predicting Students’ CarUse for University Routes with the Models of Ajzen, Schwartz, and Triandis.Environment & Behaviour, 35 (2), pp.264-285.
Buchan, K, November 2008. Low carbon transport policy for the UK: Phase 2 FinalTechnical Report. [Internet] s.l: Campaign for Better Transport and MTRU.Available at: http://www.transportclimate.org[Accessed 1 February 2009].
Cairns, S. et al., 2004. Smarter Choices – Changing the Way We Travel. London:Department for Transport.
Clark, A., Diener, E., Georgellis, Y. & Lucas, R., 2008. Lags and Leads in LifeSatisfaction: A Test of the Baseline Hypothesis. The Economic Journal, 118 (529).
CSS Transport Futures Group, 2008. Travel is Good. [Internet] s.l: CSS TransportFutures GroupAvailable at: http://www.ccsnet.org.uk
Department for Transport, 2006. Transport Trends 2006. [Internet] s.l: DfT.Available at: http://www.dft.gov.uk/pgr/statistics/datatablespublications/trends/[Accessed 13 June 2007].
Department for Transport, 2007. Evidence Base Review on Mobility: Choices & Barriersfor Different Social Groups. [Internet] London: DfT.Available at: http://www.dft.gov.uk/162259/163944/evidencebasereviewmobility[Accessed 7 July 2008].
Department for Transport, 2008. Delivering a Sustainable Transport System: MainReport. [Internet] London: DfT.Available at: http://www.dft.gov.uk/about/strategy/transportstrategy/dasts/dastsreport.pdf[Accessed 22 January 2009].
Department for Transport, 2008a. Building Sustainable Transport into New Developments:A Menu of Options for growth Points and Eco-towns. [Internet] London: DfT.Available at: http//www.dft.gov.uk/pgr/sustainable/sustainable transnew.pdf[Accessed 23 February 2009].
148 The Car in British Society RAC Foundation for Motoring

References
Doherty S., Lee-Gosselin M., Burns K. & Andrey J., 2002. Household ActivityRescheduling in Response to Automobile Reduction Scenarios. TransportationResearch Record,?,(1807).
Faber Maunsell, 2008. Perceptions of congestion on motorways. [Internet] London:Department for Transport.Available at: http://www.dft.gov.uk/pgr/scienceresearch/social/motorwaycongestion
Freund, P., 2003. The Ecology of the Automobile. Montreal and New York: BlackRose Books.
Fyhri, A. & Hjorthol, R, 2008. Children’s independent mobility to school, friends andleisure activities., Journal of Transport Geography (forthcoming) [Internet]Available at:http://www.elsevier.com/wps/find/journaldescription.cwshome/30448/description#description[Accessed 17 January 2009].
Gardner, B. & Abraham, C., 2008. Psychological correlates of car use: A meta-analysis.Transportation Research Part F (forthcoming).
Gärling, A., Gärling, T., & Loukopoulos, P., 2002. Forecasting Psychological Impacts ofCar Use Reduction: A Challenge to an Environmental Psychology of Transportation.Applied Psychology: An International Review, 51, (1).
Garnett, T., & Jackson, T, 2007. Frost Bitten: an exploration of refrigeration dependence inthe UK food chain and its implications for climate change policy. 11th European RoundTable on Sustainable Consumption and Production. Basel, Switzerland, June 2007.Available at:http://www.fcrn.org.uk/frcnPubs/publications/PDFs/Frostbitten%20paper.pdf[Accessed 21 February 2009].
HMT, BERR & DCLG, 2007. Review of sub-national economic development andregeneration. [Internet].Available at: http://www.hm-treasury.gov.uk/sub-national_economic_development_regeneration_review.htm
Jackson, T., 2005. Motivating Sustainable Consumption: A Review of Evidence onConsumer Behaviour and Behavioural Change. s.l:UK Sustainable DevelopmentResearch Network.
Jones, P, 2008. Working Paper 4: Conceptual ConceptsAvailable at: www.racfoundation.org.uk
Lucas, K., Grosvenor, T, & Simpson, R., 2001. Transport, the environment and socialexclusion. Joseph Rowntree Foundation/York Publishing Ltd.
RAC Foundation for Motoring The Car in British Society 149

References
Lucas, K., & Le Vine, S., 2008. Working Paper 1: Literature Review.Available at: www.racfoundation.org.uk
Merron, G, 2007. Smarter travel choices, individualised travel marketing andsustainable travel towns [Letter] (unpublished correspondence, DfT, 23rd May 2007).
Metz, D., 2009. Sustainable travel behaviour. Universities' Transport Study GroupConference. UCL, January 2009.
Mokhtarian, P., Raney, E. & Salomon, I., 1997. Behavioral Responses toCongestion: Identifying Patterns and Socio-Economic Differences in Adoption.Transport Policy, 4 (3).
Mokhtarian, P. L., Salomon, I. & Redmond, L., 2001. Understanding the demand fortravel: it's not purely derived. Innovation: The European Journal of Social ScienceResearch, 14.
Puentes, R. & Tomer, A., 2008. The Road...Less Traveled: An analysis of vehicle milestraveled trends in the U.S. Metropolitan Infrastructure Initiative Series.
RAC Foundation., 1995. Car Dependence. London: RAC Foundation for Motoring
Siren, A. & Hakamies-Blomqvist, L., 2002. Private car as the grand equaliser?Demographic factors and mobility in Finnish men and women aged 65+. TransportationResearch Part F, 7, pp.107-118.
Social Exclusion Unit, 2003. Making the Connections: Final report on transport andsocial exclusion. [Internet].Available at:http://www.cabinetoffice.gov.uk/social_exclusion_task_force/~/media/assets/www.cabinetoffice.gov.uk/social_exclusion_task_force/publications_1997_to_2006/making_transport_summary_2003%20pdf.ashx[Accessed 7 May 2008].
Socialdata. & Sustrans, (undated) Travel Behaviour Research Baseline Survey 2004.[Internet].Available at: www.sustrans.org.uk/stdt
Sonkin, B., Edwards, P., Roberts, I. & Green, J., 2006. Walking, cycling and transportsafety: an analysis of child road deaths. Journal of the Royal Society of Medicine, 99,pp.402-405.
Steer Davies Gleave. 2005. Overcoming Car Dependency. s.l:Transport for London.
Taylor, J., Barnard, M., Neil, H. & Creegan, C., 2009. The Travel Choices and Needs ofLow Income Households: the Role of the Car. s.l:National Centre for Social Research.
150 The Car in British Society RAC Foundation for Motoring

References
Trent Barton Buses, 2009. Big issues: counting the cost of congestion. [Internet].Available at: http://www.trentbuses.co.uk/company/congestion.html[Accessed 4 February 2009].
Urry, J., 2000. Inhabiting the Car. [Internet] Lancaster: Department of Sociology,Lancaster University.Available at: http://www.lancs.ac.uk/fss/sociology/papers/urry-inhabiting-the-car.pdf[Accessed 7 July 2009].
Vidal, J., 2009. Europe to prosecute Britain for breaking air pollution laws. TheGuardian, 29 Jan.
Wellings, B. & Lipson, B, 2008. Towards better transport: Funding new infrastructurewith future road pricing revenue. [Internet] London: Policy Exchange.Available at: http://www.policyexchange.org.uk/images/libimages/334.pdf[Accessed: 12 February 2009].
World Health Organisation, 2005. Air quality guidelines: Global update. [Internet]Copenhagen:WHOAvailable at: http://www.who.int/phe/health_topics/outdoorair_aqg/en/[Accessed 4 February 2009].
RAC Foundation for Motoring The Car in British Society 151


RAC Foundation for Motoring The Car in British Society 153153 The Car in British Society RAC Foundation for Motoring
Appendices

Appendices
1. Procedures for Estimating Public Transport Accessibility Measure (Chapter 2)
The NTS includes a set of variables relating to public transport accessibility:
1) Walk time to nearest bus stop2) Frequency of bus service at nearest bus stop
3) Walk time to nearest train station4) Bus time to nearest train station5) Frequency of train service at nearest train station
6) Bus time to nearest doctor’s office7) Bus time to nearest post office8) Bus time to nearest chemist9) Bus time to nearest food store10) Bus time to nearest shopping centre11) Bus time to nearest hospital
It was not possible to use variables 6 through 11, as they were not collected in 5 (andin some cases 6) years of the time series (which covers 1989 – 2006).
We note that the accessibility indicators are limited to only the single closest bus stopand train station to a respondent’s residence. Whilst this is a restriction, it is recognisedin the literature that there is no single measure which encompasses all aspects ofaccessibility; even the well-known PTAL [Public Transport Accessibility Levels] systemis limited, in that it does not take into account the destinations served by transit.
The format of the NTS dataset prevents us from using the PTAL system, therefore thefollowing alternative classification schemes were developed for bus accessibility andtrain accessibility, based on the categorisation of the NTS data:
154 The Car in British Society RAC Foundation for Motoring

Appendices
RAC Foundation for Motoring The Car in British Society 155
Bus Accessibility Measure
More More More More Lessfrequent frequent frequent frequent frequentthan once than than than thanevery 15 once per once per once once perminutes half hour hour per day day
Less than 6 minute walk High Moderate Moderate Low Low
7 – 13 minute walk High Moderate Moderate Low Low
14 – 26 minute walk Moderate Moderate Moderate Low Low
27 – 43 minute walk Low Low Low Low Low
More than 44 minute walk Low Low Low Low Low
Rail Accessibility Measure
More frequent More frequent Less frequentthan once per than once than once
hour (throughout per hour per hourthe day) (rush hours) (all day)
Less than 6 minutes (walkor bus, whichever is faster) High High Low
7 – 13 minutes High Moderate Low
14 – 26 minutes Moderate Moderate Low
27 – 43 minutes Moderate Low Low
More than 44 minutes Low Low Low
In order to combine the bus and rail accessibility measures into an overall measure ofpublic transport accessibility, another simple mapping procedure was employed foreach possible combination:

Appendices
Public Transport Accessibility Measure
High Rail Moderate Rail Low RailAccessibility Accessibility Accessibility
High Bus Accessibility High High Moderate
Moderate Bus Accessibility High Moderate Low
Low Bus Accessibility Moderate Low Low
The subjective categorisation was developed with the dual aims of defining intuitively-appealing categories and a reasonable balance in the percentage of households ineach of the categories.
The percentages of households in each category of this public transport accessibilitymeasure are:
156 The Car in British Society RAC Foundation for Motoring
YR198919901991199219931994199519961997199819992000200120022003200420052006
LOW202118192015191822222420181919201919
MOD273027292828313128303130293333323233
HIGH535055525357505150474550534748484948

Appendices
2 Research methods for the focus groups and professional interviews
Focus groups
We conducted a limited number of exploratory focus group discussions as part of thestudy, in order to begin to get a better understanding of the public’s perceptions of theircar use behaviours and to examine whether or not they considered themselves to bedependent on their cars, either practically or psychologically. In all, we held five focusgroups, two in Nottingham and three in Banbury, with randomly selected members ofthe public who were recruited according to a pre-determined set of recruitment criteria,as follows:
1. Voluntary switchers: these were people of a range of ages who had made avoluntary switch from their cars to public transport for some journeys, as a result ofreduced fares or free bus tickets that were recently introduced by Nottingham CityTransport.
2. Banned drivers: these were people of a range of ages that had received an enforceddriving ban of over six months in the last year.
3. Over 75s drivers: these were elderly drivers living in and around Banbury who mightbe considering giving up driving in the near future because of their age.
4. New drivers: these were young people of between 18 and 25 years old living in andaround Banbury, who had passed their tests within the last year.
5. Non-car owners: these were people living in and around Banbury in non-car owninghouseholds and without regular access to a car.
The groups took place during the first two weeks of September 2008 and eachdiscussion was approximately two hours in duration. This report is largely based on thetranscripts from these discussions.
The groups were designed to probe both the actual travel patterns, daily activities,attitudes to transport, perceptions and experiences of car use of the people whoparticipated in them, as well as their travel, activity and lifestyle responses to threepotential future scenarios in relation to their car use:
1. Where the cost of motoring is significantly more (at lease double) as a result ofcontinuing increases in petrol prices due to global barrel price increases.
2. Where additional cost is placed on the use of cars through either road user chargingor place-based congestion or parking charges.
3. Where their car use is restricted due to petrol rationing or the introduction of apersonal carbon allowance.
We were particularly interested to find out how the participants thought their lifestyleswould be affected and what they saw as the key benefits and disbenefits forthemselves, their families and dependents and wider society, of a transition to a less
RAC Foundation for Motoring The Car in British Society 157

Appendices
car reliant lifestyle. We also wanted to better understand the cost of this adjustmenteconomically and socially. The groups and locations were specifically identified,because it was felt that they would be able to shed light on these questions and mightalso be in a position to offer specific insights on the activity and lifestyle effects of morecoercive measures to reduce car use, as a result of their own personal experiences.
Professional interviews
We spoke to policy officers from two Government Offices and four local authorities (oneCounty, one PTE and two Metropolitan cities). As this was a small scoping study, theinterviews at this stage were more intended to engage local authorities in the subject ofthe research than to empirically examine their position. Our primary objectives for theinterviews were:
1. To identify their current policy position in relation to car use and car restraintmeasures;
2. To identify whether they have undertaken their own studies to explore the issue ofreduced car availability (either through restraint measures or economic constraintsarising from escalating fuel costs) and the likely impacts on households/activities.If so, will they share this with us?
3. To identify what they see as the key policy challenges in this respect and how (if)they are planning to meet them;
4. To identify whether they would be interested in exploring these issues further, in lightof their proposed implementation strategies.
The interviews were conducted during Summer 2008, the majority of which wereface to face, but some were held over the phone. Questions were posed in an open-ended format and notes of people’s responses taken rather than full transcripts.Wherever possible, we aimed to speak to the Chief Officer or a key representativeof each organisation.
158 The Car in British Society RAC Foundation for Motoring