The CALIPSO fish and seafood study concerning … of Scientific Support for the Risk Assessment...
162
CALIPSO Fish and seafood consumption study and biomarker of exposure to trace elements, pollutants and omega 3. Coordinator I Jean-Charles Leblanc CALIPSO Coordinator Jean-Charles Leblanc The CALIPSO fish and seafood study concerning dietary consumption and biomarker of exposure to trace elements, pollutants and omega 3 was performed at the initiative of the General Directorate for Foods of France's Ministry of Agriculture and Fisheries, the French Institute for Agronomy Research and the French Food Safety Agency. Unlike traditional so-called "indirect" exposure studies based on ingestions, this study enables finer characterisation of the risks and benefits associated with fish and seafood consumption by measuring the actual biological internal levels of individuals as a function of their dietary habits and local provisioning modes. The CALIPSO study constitutes an important scientific and methodological examination of the risks- benefits question in general and that of fish and seafood consumption in particular, a subject widely debated at national and international levels. The study shows that French coastal populations, generally high seafood consumers, are well informed and have sound knowledge of these foods. They appreciate information on this subject which is a source of concern, yet they tend regard the public controversy on this issue with some scepticism. The study shows that the contaminant levels measured in provisioned fish and seafood are globally satisfactory relative to currently applicable regulations, with the exception of a few products. For trace elements this "background" contamination level is relatively homogeneous all along the French coast, whereas for persistent organic pollutants a North-South contamination gradient is observed. From a benefits point of view, the study shows that consuming fish alone at least twice a week (including some oily fish) provides the recommended intake of omega 3 long-chain polyunsaturated fatty acids. As regards risks, the study reveals that although some high consumers exceed the reference toxicological values, the excesses are moderate and moreover difficult to interpret owing to the uncertainties inherent in all indirect exposure studies and the existence of safety factors. Nevertheless these results demonstrate the need to pursue the efforts being made to reduce exposure (by reducing pollution), especially to dioxins and all PCBs. Finally, concerning the global question of weighing health risks against nutritional benefits, the study results confirm the validity of the recommendations made by various national scientific bodies: that the general population should consume fish at least twice a week, including some oily fish, and that pregnant or breast-feeding women should consume predator fish not more than once a week. Looking beyond these general recommendations, this study highlights the advantages of diversifying the consumed fish and seafood species in terms of proportions and provisioning origins in order to ensure a rational balance between benefits and risks compatible with nutritional and toxicological recommendations.
Transcript of The CALIPSO fish and seafood study concerning … of Scientific Support for the Risk Assessment...

CALIPSOFish and seafood consumption studyand biomarker of exposure totrace elements, pollutants and omega 3.
Co
ord
inat
or
IJea
n-C
har
les
Leb
lan
c C
ALI
PSO
Coordinator
Jean-Charles Leblanc
The CALIPSO fish and seafood study concerning dietary consumption and biomarker of exposure totrace elements, pollutants and omega 3 was performed at the initiative of the General Directorate forFoods of France's Ministry of Agriculture and Fisheries, the French Institute for Agronomy Researchand the French Food Safety Agency. Unlike traditional so-called "indirect" exposure studies based oningestions, this study enables finer characterisation of the risks and benefits associated with fish andseafood consumption by measuring the actual biological internal levels of individuals as a function oftheir dietary habits and local provisioning modes.
The CALIPSO study constitutes an important scientific and methodological examination of the risks-benefits question in general and that of fish and seafood consumption in particular, a subject widelydebated at national and international levels.
The study shows that French coastal populations, generally high seafood consumers, are well informedand have sound knowledge of these foods. They appreciate information on this subject which is asource of concern, yet they tend regard the public controversy on this issue with some scepticism. Thestudy shows that the contaminant levels measured in provisioned fish and seafood are globallysatisfactory relative to currently applicable regulations, with the exception of a few products. For traceelements this "background" contamination level is relatively homogeneous all along the French coast,whereas for persistent organic pollutants a North-South contamination gradient is observed.
From a benefits point of view, the study shows that consuming fish alone at least twice a week (includingsome oily fish) provides the recommended intake of omega 3 long-chain polyunsaturated fatty acids.As regards risks, the study reveals that although some high consumers exceed the reference toxicologicalvalues, the excesses are moderate and moreover difficult to interpret owing to the uncertaintiesinherent in all indirect exposure studies and the existence of safety factors. Nevertheless these resultsdemonstrate the need to pursue the efforts being made to reduce exposure (by reducing pollution),especially to dioxins and all PCBs.
Finally, concerning the global question of weighing health risks against nutritional benefits, the studyresults confirm the validity of the recommendations made by various national scientific bodies: thatthe general population should consume fish at least twice a week, including some oily fish, and thatpregnant or breast-feeding women should consume predator fish not more than once a week.
Looking beyond these general recommendations, this study highlights the advantages of diversifyingthe consumed fish and seafood species in terms of proportions and provisioning origins in order toensure a rational balance between benefits and risks compatible with nutritionaland toxicological recommendations.

LIST OF AUTHORS AND OTHER CONTRIBUTORS 1
AcknowledgementsThe authors would like to thank the General Directorate for Foods of the French Ministry of Agricultureand Fisheries for its financial support, Mr. Patrice Marion and Mr. Luc Marchaison for their active collaborationin the execution of the study, Mrs. Nadine Fréry of InVS for her assistance in the preparation of the studyprotocol, Mrs. Nathalie Arnich, Mrs. Sophie Galotti, Mr. Fernando Aguila, Mrs. Landy Razanamahefa, Ms.Céline Dumas and Mrs. Esther Kalonji from Afssa for their observations and their attentive proofreading,and the experts of Committee on residues and chemical and physical contaminants, especially Alain Baertand Michel Boisset. The authors also express their particular gratitude to all the participants in the CALIPSOsurvey without whose support this study would not have been possible.
List of authorsJean-Charles Leblanc (Coordinator)AFSSA / DERNS27-31 avenue du Général Leclerc94701 Maisons-Alfort CedexINRA / INAP-G16 rue Claude Bernard - 75005 Paris
Véronique SirotAFSSA / DERNS27-31 avenue du Général Leclerc94701 Maisons-Alfort CedexINRA / INAP-G16 rue Claude Bernard - 75005 Paris
Jean-Luc VolatierOffice of Scientific Support for the Risk Assessment (PASER)AFSSA / DERNS27-31 avenue du Général Leclerc94701 Maisons-Alfort Cedex
Nawel Bemrah-AouachriaQuantitative risk assessment teamOffice of Scientific Support for the Risk Assessment (PASER)AFSSA / DERNS27-31 avenue du Général Leclerc94701 Maisons-Alfort Cedex
Other contributorsAlexandra Tard Quantitative risk assessment teamOffice of Scientific Support for the Risk Assessment (PASER)AFSSA / DERNS27-31 avenue du Général Leclerc94701 Maisons-Alfort Cedex
Yves MaurasPharmacology and Toxicology LaboratoryUniversity Medical Centre of Angers4 rue Larrey49933 Angers Cedex 9
Thierry GuérinEnvironmental inorganic contaminants and minerals unitAFSSA / LERQAP23 avenue du Général De Gaulle94706 Maisons-Alfort Cedex
Bruno Le BizecLABERCANational School of veterinary medicineAtlanpôle La Chantrerie44307 Nantes Cedex 3
Philippe LegrandLaboratory of biochemistryAgrocampus de Rennes65 rue de Saint-Brieuc35042 Rennes Cedex
Isabelle TapieFood regulatory and biotechnologies officeMinistry of Agriculture and fisheriesMAP / DGAL / SDRRCC251 rue de Vaugirard75015 Paris
Philippe VergerFood Risk Analysis Methodologies unit(Mét@risk)INRA / INAP-G16 rue Claude Bernard - 75005 Paris
Marine Oseredczuk Information Centre for Food Quality (CIQUAL)Office of Scientific Support for the Risk Assessment (PASER)AFSSA / DERNS27-31 avenue du Général Leclerc94701 Maisons-Alfort Cedex
Anne Le BouilPharmacology and Toxicology LaboratoryUniversity Medical Centre of Angers4 rue Larrey49933 Angers Cedex 9
Hervé GarraudUT2A Helioparc Pau Pyrénées 2 avenue du Président Pierre Angot 64053 Pau Cedex 9
Philippe MarchandLABERCANational School of veterinary medicineAtlanpôle La Chantrerie44307 Nantes Cedex 3
Daniel CathelineLaboratory of biochemistryAgrocampus de Rennes65 rue de Saint-Brieuc35042 Rennes Cedex
Charlotte GrastilleurFood regulatory and biotechnologies officeMinistry of Agriculture and fisheriesMAP / DGAL / SDRRCC251 rue de Vaugirard 75015 Paris
Nadine FlavignyFood Risk Analysis Methodologies unit(Mét@risk)INRA / INAP-G16 rue Claude Bernard - 75005 Paris
POISSON 4.3 GB.qxd 17.9.2006 20:17 Page 1

2 GLOSSARY
Glossary
A F S S A : French Food Safety Agency (Agence Française de Sécurité Sanitaire des Aliments)
ALA: Alpha-linolenic acidAsB: A r s e n o b e t a i n eAsC: A r s e n o c h o l i n eCIQUAL: Informatics Centre for Food Quality
(Centre Informatique sur la Qualité des Aliments)
CREDOC: Research Center for the Study and Observation of Living Conditions (Centre de recherche pour l'étude et l'observation des conditions de vie)
CSHPF: High Council for Public Health (Conseil supérieur d’hygiène publique de France)
CSTEE: Committee on To x i c i t y, Ecotoxicity and the Environment
CVD: Cardiovascular diseasesD B T: Dibutyltin DGAL: General Food Directorate (Direction
Générale de l’Alimentation)DGCCRF: General Directorate for
Competition, Consumption and Fraud Prevention (Direction Générale de la Concurrence, de la Consommation et de la Répression des Fraudes)
DHA: Docosahexaenoic acid
DL-PCB: Dioxin-like polychlorobiphenylDMA: Dimethylarsinic acid D O T: D i o c t y l t i nD P T: D i p h e n y l t i nE PA: Eicosapentaenoic acid GAA: gamma-aminolevulinic acid
G E M S /Food Euro: Global Environment Monitoring
System/ Food Contamination Monitoring and Assessment P r o g r a m
IARC: International Agency for Research on Cancer
IFREMER: French Research Institute for Exploitation of the Sea (Institut Français de Recherche pour l’Exploitation de la Mer)
INCA: Individual National Food Consumption Survey
INRA: French Institute for Agronomy R e s e a r c h
IPCS: International Program on Chemical S a f e t y
J E C FA: Joint FAO/WHO Expert Committee on Food Additives and contaminants
JMPR: FAO/WHO Joint Meeting Pesticide R e s i d u e s
LA: Linoleic acidLOD: Limit of detectionLOQ: Limit of quantificationM B T: M o n o b u t y l t i n
MMA: Monomethylarsonic acidM O T: M o n o o c t y l t i nM P T: M o n o p h e n y l t i nMRL: Minimum Risk LevelM U FA: Monounsaturated fatty acidOCA: Food Consumption Observatory
(Observatoire des Consommations A l i m e n t a i r e s )
O P C S T: Parliamentary Office for Evaluation of Scientific and Technical Options ( O ffice Parlementaire des Choix Scientifiques et Te c h n i q u e s )
PAH: Polycyclic aromatic hydrocarbonPBDE: P o l y b r o m o d i p h e n y l e t h e rPCB: P o l y c h l o r o b i p h e n y lPCDD: P o l y c h l o r o d i b e n z o - p - d i o x i nPCDF: P o l y c h l o r o d i b e n z o f u r a n
POP: Persistent organic pollutantPTWI: Provisional Tolerable Weekly IntakeP U FA: Polyunsaturated fatty acidRDA: Recommended Daily AllowanceREGAL: General Foods Directory (Répertoire
Général des Aliments)
SCOOP: Scientific CO-OPeration on questions relating to food
S FA: Saturated fatty acidT B T: Tr i b u t y l t i nTDI: Tolerable Daily IntakeTDS: Total Diet StudyTEF: Toxic equivalency factor
TEI: Total energy intakeTEQ: Toxic EquivalentT O T: Tr i o c t y l t i nT P T: Tr i p h e n y l t i nT RV: Toxicological reference valueWHO: World Health Organisation
POISSON 4.3 GB.qxd 17.9.2006 20:17 Page 2

Preface
The diversity of environmental pollutants, largely related to unceasing industrial and technologicaldevelopment, presents a permanent problem when verifying food control quality from a health pointof view and evaluating the risks for consumers of foods subject to contamination. This is a real challengefor scientists, health experts and the public services responsible for food safety. The problem is particularlyimportant in that chemical pollutants are ubiquitous and extremely varied in their chemical forms andtoxicological characteristics. Moreover, due to their properties and variable persistence, they enter thefood chains that lead to man through vegetable and animal foods. Consequently environmental pollutantsare a constant public health concern, which is why the General Food Directorate (DGAL: DirectionGénérale de l’Alimentation), depends on the scientific and methodological support of risk assessmentexperts to face this fast and ever changing challenge.
The present work was delegated by the DGAL to the French Institute for Agronomy Research (INRA:Institut National de la Recherche Agronomique) with the aim of assessing the exposure of high consumersof seafood. The French Food Safety Agency (AFSSA: Agence Française de Sécurité Sanitaire des Aliments)made a substantial methodological contribution to the study and analysed its results. This study hasimproved our knowledge of the dietary habits of high consumers of fish and seafood in France and oftheir provisioning practices. It has yielded inventories of the levels of nutritional and toxic substances inthese products consumed in different regions, and it has provided exposure data for these populationsthanks to a study of the biological impregnation to contaminants. The outcome of the study is thereforean evaluation of the risks relative to the consumption of seafood products, which are then balancedwith the nutritional benefits.
The study results shed new light on the relationships between diet and health and will help to betterprotect and inform the consumer. In addition, they enable France to make a useful contribution to thescientific and regulatory studies whether national, European or international levels.
AFSSA Director General DGAL Director General INRA President and Director General
Pascale Briand Jean-Marc Bournigal Marion Guillou
PREFACE 3
POISSON 4.3 GB.qxd 17.9.2006 20:17 Page 3

4 TABLE OF CONTENTS
I - Methodology and general presentation 6Introduction 7
1.1 Present situation 9
1.1.1 Fatty acids 9• Fish consumption and cardiovascular diseases• Fatty acids • Fatty acids and cardiovascular diseases• Fatty acids and cancer• Fatty acids in food• Needs and intakes of the French population• Fatty acids and pregnant women• Fatty acids and elderly people
1.1.2 Trace elements 13• Mercury• Cadmium• Lead• Arsenic• Organotin compounds
1.1.3 Persistent organic pollutants 19• Dioxins and “dioxin-like” polychlorobiphenyls• Indicator polychlorobiphenyls• Polybromodiphenylethers
1.2 Study methodology 21
1.2.1 Selection of study zones and populations 21• Inclusion criteria• Exclusion criteria• Exclusion criteria for the biological part
1.2.2 Consumption survey 23
1.2.3 Biological part 26• Analysis of the biological samples
1.2.4 “Total Diet Study” part 29• Preparation of the list of food samples• Sampling• Analysis of the food samples
1.3 Presentation and interpretation of the results 33
1.3.1 Estimation of consumptions and concentrations 33
1.3.2 Estimation of missing or censured data 34
1.3.3 Estimation of fatty acid and contaminant intakes 34• Food exposure (Indirect approach)• Biomarkers of exposure (Direct approach)• Characterization of risk / benefit• Interpretation of the results
II - Fish and seafood consumption 382.1 Seafood consumption by high consumers 39
2.1.1 Fresh and frozen fish 39• National level (4 zones)• Regional level
2.1.2 Molluscs and crustaceans 41• National level (4 zones)• Regional level
2.1.3 Other seafood 45• National level (4 zones)• Regional level
2.2. Comparison of consumption data from the CALIPSO study and the
Individual National Food Consumption Survey (INCA 99) 47
POISSON 4.3 GB.qxd 17.9.2006 20:17 Page 4
TABLE OF CONTENTS 5
2.3 Fish and seafood provisioning 48
2.3.1 Fresh and frozen fish 49
2.3.2 Molluscs and crustaceans 51
III - Seafood composition and contamination 543.1 Fatty acid composition 55
3.1.1 Fresh and frozen fish 55
3.1.2 Molluscs and crustaceans 56
3.1.3 Other seafood 56
3.1.4 Regional variations 57
3.2 Contamination by trace elements 61
3.2.1 Fresh and frozen fish 61
3.2.2 Molluscs and crustaceans 62
3.2.3 Other seafood 63
3.2.4 Regional variations 63
3.3 Contamination by persistent organic pollutants 71
3.3.1 Fresh and frozen fish 71
3.3.2 Molluscs and crustaceans 72
3.3.3 Other seafood 72
3.3.4 Regional variations 75
IV - Nutritional intakes and exposure to contaminants 784.1 Fatty acid intakes 78
4.1.1 Food exposure 78
4.1.2 Biomarker of exposure 84
4.2 Exposure to trace elements 89
4.2.1 Food exposure 89
4.2.2 Biomarker of exposure 94
4.3 Exposure to persistent organic pollutants 98
4.3.1 Food exposure 98
V - Perception of risks 1015.1 General dietary risks 102
5.2 Risks associated with marine pollution 105
5.3 behaviour of seafood consumers 106
5.4 Consumer information 109
VI - Discussion 1116.1 Fatty acids 112
6.2 Trace elements 113
6.3 Persistent organic polluants 119
6.4 Characterization of risk / benefit 120
VII - Conclusion 126
VIII - Appendix 128
POISSON 4.3 GB.qxd 17.9.2006 20:17 Page 5

6 FIRST PART - Methodology and general presentation
FIRSTPART
Methodology andgeneral presentation
POISSON 4.3 GB.qxd 17.9.2006 20:17 Page 6

FIRST PART - Methodology and general presentation 7
Introduction
The scientific approach to the evaluation of the nutritional benefits of nutritive elements (minerals, fattyacids, etc.) in food and the health risks related to toxic substances (pesticides, heavy metals, natural toxinsand other environmental contaminants) is to estimate the quantity of ingested substances then comparethis with nutritional baselines and/or toxicological reference values. These nutritional and toxicologicalbaselines defined by expert scientific committees form part of global public health programmes intendedto confirm optimal cover of physiological needs and the absence of adverse effect on consumer health.
The evaluation of the dietary intake of a given nutriment or contaminant, also known as the “dietaryexposure” is based on various approaches including the traditional one that consists in proff i n gconsumption data with composition or contamination data1. In most cases this so-called “indirect” or“food exposure” approach provides a response to health questions posed by the national authoritiesresponsible for evaluating and managing food risks.
In parallel with this first approach, a “direct” measure of the intakes by exposure biomarkers,complementary to the first, can be made if necessary in order to better characterise the benefits and/orthe possible risks of a particular substance as regards consumer health. This method has the advantageof evaluating in situ, in other words in the biological tissue of individuals, the internal level of a nutrimentand/or contaminant of interest; it also takes into account exposure channels other than food. Howeverthe results are not easy to interpret.
For many years seafood such as fish, molluscs and crustaceans has often been the focus of attention innutritional and toxicological work. Nutritionists consider these products to be an important source ofhigh-quality proteins, minerals and essential fatty acids such as omega 3, although only half the populationfollow the recommendation of the National Nutrition and Health Programme (PNNS) to consume fishat least twice a week2. Toxicologists tend to regard seafood as a major vector for toxic substances suchas metal trace elements and persistent organic pollutants. The scientific reality is more complex and areconciliation of these two viewpoints requires that we take into consideration both nutritional andtoxic substances contained in food products and also consumer behaviour with regard to these products.
Concerning intakes of the omega 3 family of long-chain polyunsaturated fatty acids, today there is verylittle available data on the fatty acid content of fish and seafood or on biomarkers of exposure to omega3 fatty acid in the French population, in particular in people consuming large quantities of seafood(other than through food supplements). Many studies have already demonstrated the involvement ofthe fatty acids eicosapentaenoic acid (EPA) and docosahexaenoic acid (DHA), found mainly in fish andseafood, in the mechanisms protecting against certain pathologies, notably cardiovascular disease.
1 FAO/WHO. Guidelines for the study of dietary intakes of chemical contaminants. Geneva : WHO, Offset publication n°87. 1985.
2 Ministère de l’Emploi et de la Solidarité, Ministère délégué à la Santé. Programme National Nutrition-Santé. 2001-2005.
POISSON 4.3 GB.qxd 17.9.2006 20:17 Page 7

8 FIRST PART - Methodology and general presentation
As regards exposure to trace elements, several recent studies have shown that for the average consumerin the general population the toxicological limits are not exceeded. Nevertheless, the absence of risk forthe average consumer does not exclude a risk for heavy consumers, as underlined in many studies (FrenchTotal Diet Study (TDS) 20043, INCA Study 19994, reports of the French Upper Council for Public Health(CSHPF) in 19965 and the Parliamentary Office for the Assessment of Scientific and Technical Choices(OPECST) in 20016). Moreover, the absence of French data on the levels of “indirect” or “direct” exposureto certain substances (omega 3 and pollutants in particular) of populations consuming large quantitiesof seafood does not enable a quantified assessment of the benefits or risks associated with these dietaryhabits, a situation that is obviously prejudicial to the global health risk evaluation and managementp r o c e s s .
C o n s e q u e n t l y, it is necessary to push the analysis further by performing, first, a representative study ofseveral French coastal populations that are regular consumers of seafood, and of their local provisioningand self-provisioning practices (beach fishing), and secondly a representative study of the biologicalslevels of pollutants and omega 3 in these populations. The choice of coastal regions for the study isjustified by their particularly high seafood consumption.
The objective of this study is therefore to make a survey of the nutritional intakes and exposure to traceelements and persistent organic pollutants of high fish and seafood consumers by examining their foodconsumption habits and analysing the real risks of these habits as well as their nutritional benefits,notably those associated with polyunsaturated fatty acids.
This study is described in three distinct and complementary parts (Figure 1):
• a consumption study focused on heavy fish and seafood consumers in four French coastal regions;
• a study of blood and urinary biomarkers associated with intakes of fatty acids and exposure tocontaminants in a sub-sample of consumers having participated in the food consumption survey;
• a study of levels of fatty acids and contamination by trace elements and persistent organic pollutantsin the seafood bought and consumed by the populations of the four coastal regions, applying astandardised international methodology of the “total diet study” (TDS) type7 .
3 INRA-DGAL. Leblanc J.C. Coord i n a t o r. The first French Total Diet Study. Mycotoxins, minerals and trace elements. May 2004, 68p.
4 CREDOC-AFSSA-DGAL. Volatier J.-L. Coord o n n a t e u r. Enquête individuelle nationale sur les consommations alimentaires (INCA). Tec & DocL a v o i s i e r, Paris, 1999.
5 CSHPF, groupe de travail contaminants. Plomb, cadmium et merc u re dans l’alimentation : évaluation et gestion du risque. Tec & Doc Lavoisier,Paris, 1996.
6 OPCST. Effets des métaux lourds sur l’environnement et la santé. 2001.
7 Total diet studies (TDS). Consultation US FDA/OMS, Kansas city, juillet/août 1999, consultation ANFZA/WHO/FAO, Brisbane, janvier 2002 etconsultation INRA/WHO, Paris, Mai 2004.
POISSON 4.3 GB.qxd 17.9.2006 20:17 Page 8

FIRST PART - Methodology and general presentation 9
Figure 1: General outlines of the Calipso study
Figure 1: General outlines of the Calipso study
1.1 Present situation
1.1.1 Fatty acids
Fish consumption and cardiovascular diseases
Many studies have demonstrated that fish consumption correlates inversely with coronarian mortality.More specifically, such mortality is observed to decrease by 15% among populations consuming fish atleast once a week8. A 20 g increase in daily fish consumption reduces the coronary heart disease mortalityrisk by 7%. Moreover, these trends are accentuated in the case of oily fish.
One of the hypotheses proposed to explain this protective effect of fish consumption is their richness infatty acids, in particular in polyunsaturated fatty acids of the omega 3 class.
Biomarker of exposure / Long term exposure
Biological part Total Diet Study
Consumption survey
Direct way
Assessment of exposure tonutrients and contaminants
Indirect way
Assessment of exposure tonutrients and contaminants
Biological level composition consumption
8 He K., Song Y., Daviglus M.L., Liu K., Van Horn L., Dyer A.R. and Greenland P. Accumulated evidence on fish consumption and coronary heartdisease mortality, a meta-analysis of cohort studies. Circulation 109 (22) : 2705-2711, 2004.
POISSON 4.3 GB.qxd 17.9.2006 20:17 Page 9

10 FIRST PART - Methodology and general presentation
Fatty acids
Fatty acids are organic molecules composed of a carbonyl chain terminating on a carboxyl group. Theyare characterised by the length of their carbonyl chain, the number of double bonds and their positionon the chain. We can therefore distinguish saturated fatty acids (SFA) with no double bonds,monounsaturated (MUFA) with a single double bond, and polyunsaturated (PUFA) with several doublebonds. The PUFAs can be divided into four classes according to the position of the first unsaturationrelative to the carbon atom at the methyl end: n-7 (omega 7), n-9 (omega 9), n-6 (omega 6) and n-3(omega 3).
While saturated, monounsaturated and some polyunsaturated fatty acids (n-7 and n-9 classes) can besynthesised by the organism (Figure 2), the omega 3 and omega 6 precursors (alpha-linolenic and linoleicacid, respectively) must be provided by food; these are referred to as “essential fatty acids”.
The physiological role of fatty acids is first and foremost energetic. But the polyunsaturated fatty acidsof the essential n-6 and n-3 classes are above all important constituents of many structures (membranephospholipids bringing fluidity and their properties to membranes) and some are precursors of oxygenmediators notably involved in the processes of inflammation and blood platelet aggregation(prostaglandins, thromboxanes, leukotrienes, etc.) 9 1 0.
Fatty acids and cardiovascular diseases
Many epidemiological studies have confirmed the adverse effects of an excess of SFAs in the developmentof cardiovascular diseases (CVD) and the associated mortality. Excessive SFA consumption correlatespositively with mortality due to CVD and with factors of high risk of CVD. On the other hand, theconsumption of MUFAs and above all PUFAs correlates negatively with CVD. The protective role of then-3 PUFAs has been demonstrated in primary prevention and above all in secondary prevention of CVD.Long-chain omega 3 might help to reduce mortality, though not morbidity1 0. Long-chain omega 3supplements might help to reduce cardiovascular risks by lowering the risk of sudden death of peoplewith a history of cardiovascular problems. However they do not reduce the incidence of non-mortalcardiac infarct. More particularly, the protective role of alpha-linolenic acid (ALA), the precursor of then-3 long-chain PUFAs, has been demonstrated in several clinical intervention studies, in particular thoseconcerning prevention of sudden death in man9. Linoleic acid (LA), precursor of the n-6 long-chain PUFA s ,tends to lower the cholesterolemy but it does not appear to reduce cardiovascular mortality. Generallyspeaking, the n-6 PUFAs have a lipid-lowering effect; they reduce the LDL-cholesterol, but they have noe ffect on the circulating triglycerides, whereas the n-3 PUFAs have a hypotriglyceridemiant effect (atleast in certain population groups), although this concerns only the very long-chain compounds,eicosapentaenoic acid (EPA) and docosahexaenoic acid (DHA).
Fatty acids and cancer
Today only experimental studies on animal models provide some information on the role of fatty acidsin cancerous processes. The n-6 PUFAs encourage tumorous growth while the n-3 PUFAs have a protectivee ff e ct 11 12. However the mechanisms by which fatty acids act on the cellular cycle (modulation of theexpression of proteins regulating the cellular cycle and the apoptosis) are not well understood.
9 Martin A. Coord o n n a t e u r. Apports nutritionnels conseillés pour la population française. 3e édition. Editions Tec & Doc, Lavoisier, Paris, 2001.
10 AFSSA. The Omega 3 fatty acids and the cardiovascular system: nutritional benefits and claims. July 2003.
11 CNERNA, CNRS. Riboli E., Decloître F. et Collet-Ribbing C., Coordonnateurs. Alimentation et cancer – Evaluation des données scientifiques.Tec & Doc, Lavoisier, Paris, 1996.
12 AFSSA. Acides gras alimentaires et cancers : état des connaissances et perspectives. 2003.
POISSON 4.3 GB.qxd 17.9.2006 20:17 Page 10

FIRST PART - Methodology and general presentation 11
13 Pawlosky R.J., Hibbeln J.R., Novotny J.A. and Salem N.Jr. Physiological compartmental analysis of alpha-linolenic acid metabolism in adulthumans. J. Lipid. Res., 42 : 1257-1265, 2001.
14 Goyens P.L.L., Spilker M.E., Zock P.L., Katan M.B. and Mensink R.P. Compartmental modeling to quantify alpha-linolenic acid conversionafter longer term intake of multiple tracer boluses. J. Lipid. Res., 46 : 1474-1483, 2005.
Fatty acids in food
The principal dietary sources of the precursors ALA (alpha-linolenic acid) and LA (linoleic acid) arevegetable oils and animal products. For example, rapeseed, nut and soyabean oils are rich in ALA andsunflower and maize oils are rich in LA. Animal products, in particular fish, seafood and breastmilk,provide long-chain n-3 PUFA compounds in substantial quantity. The n-6 PUFAs are found in quantityin terrestrial animal products, in particular meat and eggs and also in breastmilk.
Leaving aside dietary supplements, seafood products remain the major source of long-chain n-3 PUFA ssince in humans the conversion of the precursor ALA into these long-chain derivatives is low: it has beenshown that less than 1% of the ALA is converted into DHA13 14 .
Figure 2 : Conversion capacity of fatty acids in animals and plantsn - 3 n - 6 n - 9 n - 7
Omega 3 Omega 6 Omega 9 Omega 71 8 : 0 ∈ 1 6 : 0
⇓ # 9 ⇐ ⇓ # 91 8 : 3 1 8 : 2
Alpha-linolenic acid #1 5 Linoleic acid #1 2 1 8 : 1 1 6 : 1( A L A ) ⇐ ( L A ) ⇐⇓ # 6 ⇓ # 6 ⇓ # 6 ⇓ # 61 8 : 4 1 8 : 3 1 8 : 2 1 6 : 2⇓ ∈ ⇓ ∈ ⇓ ∈ ⇓ ∈2 0 : 4 2 0 : 3 2 0 : 2 1 8 : 2⇓ #5 ⇓ # 5 ⇓ # 5 ⇓ # 52 0 : 5 2 0 : 4 2 0 : 3 1 8 : 3
E i c o s a p e n t a e n o i c Arachidonic acid acid ( E PA ) ( A A ) ⇓ ∈⇓ ∈ ⇓ ∈2 2 : 5 ∈ ∈
Docosapentaenoic ⇒ 2 4 : 5 2 2 : 4 ⇒ 2 4 : 4 2 0 : 3acid
( D PA ) ⇓ # 6 ⇓ # 6 ⇓ # 62 2 : 6
Docosahexaenoic acid
( D H A ) β- o x 2 2 : 5 β- o x2 4 : 5 ⇐ 2 4 : 6 ⇐ 2 4 : 5 2 0 : 4
Plant kingdom Plant and animal kingdom Animal kingdom∈ : Elongase — #5, #6 : #-desaturase — β- o x : β- o x y d a s e
POISSON 4.3 GB.qxd 17.9.2006 20:17 Page 11

12 FIRST PART - Methodology and general presentation
Needs and intakes of the French population
Table 1 presents recommended daily allowances (RDA) determined for adults on the basis of plasmaticparameters for SFAs, MUFAs and PUFA s .
Table 1: National nutritional recommended daily intake of fatty acids in adults 9
I d e a l l y, in the diet, the LA (18:2 n-6) / ALA (18:3 n-3) ratio should tend towards 5. This ratio was determinedtaking into account the existence of competition between the n-3 and n-6 PUFA classes in various enzymes(the desaturated #6 and #5) involved in the conversion of the precursors ALA and LA into essentiallong-chain PUFA derivatives (Figure 2).
To obtain the beneficial effects on the cardiovascular system and neurodevelopment some institutionsrecommend daily consumption of 0.2 g to 0.5 g of n-3 LC-PUFA1 5. The American Heart Associationrecommends daily consumption of 1 g of EPA and DHA1 6.
Fatty acids and pregnant women
There have been few studies on the fatty acid needs of pregnant and breast-feeding women. Ta k i n ginto account the needs of the foetus, the development needs of the placenta and state of pregnancy,the recommended daily allowances for pregnant women are estimated to be 10 g of LA and 2 g of ALA.For breast-feeding women, the daily needs are 11 g of LA and 2.2 g of ALA (Table 1).
DHA and arachidonic acid (AA) are essential in the development of the central nervous system of thefoetus, in particular during the last quarter of gestation when the synthesis of brain cells is fastest. Thesetwo fatty acids are incorporated in the cellular membranes contributing to their structure and functions.However it appears that the conversion rate of the ALA into DHA is very low, which implies that theDHA content of cellular membranes depends more on dietary intake of DHA than on ALA. The RDA ofDHA has been fixed at 0.25 g for pregnant and breast-feeding women.
Fatty acids and elderly people
In view of the lower energy needs after 65 years of age, the RDAs for elderly people are lower than foryounger adults: 7.5 g of LA and 1.5 g of ALA. Concerning the long-chain n-3 PUFAs, there have been
k c a l . d- 1 S FA M U FA LA A L A L C - P U FA D H A To t a l
Adult man g . d- 1 1 9 . 5 4 9 1 0 2 0 . 5 0 . 1 2 8 12 2 0 0 % TEI 8 2 0 4 . 0 0 . 8 0 . 2 0 0 . 0 5 3 3Adult woman g . d- 1 1 6 4 0 8 1 . 6 0 . 4 0 0 . 1 0 6 6 . 01 8 0 0 % TEI 8 2 0 4 . 0 0 . 8 0 . 2 0 0 . 0 5 3 3Pregnant woman g . d- 1 1 8 4 5 . 5 1 0 2 . 0 1 0 . 2 5 7 6 . 52 0 5 0 % TEI 8 2 0 4 . 4 0 . 9 0 . 4 0 . 1 3 3 . 7Breat-feeding woman g . d- 1 2 0 5 0 1 1 2 . 2 1 0 . 2 5 8 4 . 22 2 5 0 % TEI 8 2 0 4 . 4 0 . 9 0 . 4 0 . 1 3 3 . 7Older subject g . d- 1 1 5 3 8 7 . 5 1 . 5 0 . 4 0 0 . 1 0 6 2 . 51 7 0 0 % TEI 8 2 0 4 . 4 0 . 9 0 . 4 0 . 1 3 3 . 7
TEI: Total energy intake (lipids, carbohydrates, proteins)L C - P U FA: Long chain polyunsaturated fatty acids
15 EFSA. Opinion of the scientific panel on dietetic products, nutrition and allergies related to nutrition claims concerning omega-3 fatty acids,monounsaturated fat, polyunsaturated fat and unsaturated fat. July 2005.
16 Kris-Etherton P.M., Harris W.S., Appel L.J. Fish consumption, fish oil, (n-3) fatty acids, and cardiovascular disease. Circulation. 106 : 2747-2754. 2002.
POISSON 4.3 GB.qxd 17.9.2006 20:17 Page 12

13FIRST PART - Methodology and general presentation 13
indications of a reduction of the ability to convert EPA into DHA and/or an alteration of the oxidationof these fatty acids in elderly people 9, an alteration that has also been demonstrated on animalmodels17 18.
Fatty acid intakes in the French population, in particular ALA and LA, were assessed by means of a panelof 5,008 volunteers aged between 35 and 60 in the SU.VI.MAX study (supplementation of vitamins andantioxidant minerals). The consumption data of the study were crossed with ALA and LA compositiondata supplied by the British Ministry of Agriculture, Fisheries and Food (MAFF), the American Departmentof Agriculture (USDA), and in France, the Informatics Centre for Food Quality (CIQUAL), the MeatInformation Centre (CIV) and the Institute for Fats and Oils (ITERG).
Table 2: Intakes of linoleic and alpha-linolenic acids in France (data from SU.VI.MAX)10
This work has shown that ALA intakes are lower than the RDAs (0.8% of total energy intake), regardlessof age and sex (Table 2). The 18:2 n-6 / 18:3 n-3 ratio is too high, ranging from 5 to 34 with an averageof about 11, compared to the RDA of 5.
On the other hand, to date there are no available data on intakes of LC-PUFA omega 3 (EPA and DHA)in the French population.
1.1.2 Trace elements
Mercury
Mercury (Hg) is a chemical compound used in many industrial activities (batteries, electric equipment,chemical industry, paints, dental amalgams). These sources are both environmental and anthropogenic,notably due to the combustion of fossil fuels, industrial releases and waste incineration.
The organic forms of mercury, in particular methylmercury (MeHg), are more toxic than the inorganicones. The World Health Organisation (WHO) estimates that 99% of the MeHg absorbed by the populationcomes from food 1 9. The major source of MeHg exposure for humans is fish20 21 22 . Metallic mercury istransformed into organic mercury by marine bacterial microflora which makes it bioavailable and explainsits marked ability to cumulate in shellfish and predator fish near the top of the trophic chain. Followingingestion, methylmercury is rapidly absorbed in the digestive tract and 90% is found in the blood. Itthen passes the hemato-encephalic barrier and concentrates essentially in the central nervous system.
M i n P 5 M e a n P 9 5 M a x18:2 n-6 (LA) M 1 . 5 3 2 . 8 1 4 . 2 6 6 . 2 1 1 0 . 5 4(% TEI) W 1 . 6 2 2 . 9 1 4 . 3 8 6 . 3 1 1 1 . 6 3
18:3 n-3 (ALA) M 0 . 2 1 0 . 3 0 0 , 3 9 0 . 5 2 1 . 5 2(% TEI) W 0 . 1 9 0 . 3 2 0 . 4 1 0 . 5 5 1 . 1 1
Ratio 18:2 n-6 / 18:3 n-3 M 5 . 5 7 . 5 1 1 . 1 1 6 . 1 3 3 . 8W 4 . 5 7 . 3 1 0 . 8 1 5 . 7 3 4 . 6
TEI: Total energy intake, M: Men, W: Wo m e n
17 Beier K., Volk L. and Fahimi H.D. The impact of aging on enzyme proteins of rat liver peroxisomes : quantitative analysis by immunoblottingand immunolectron micro s c o p y. Vi rchows Archiv B Cell Pathol 63 : 139-146. 1993.
18 Perichon R. and Bourre J.M. Peroxisomal _-oxidation activity and catalase activity development and aging in mouse liver. Biochimie 77 : 288-293. 1995.
19 WHO, ICPS. Environmental Health Criteria 101, Methylmerc u r y, Geneva : International Programme on Chemical Safety. 1990.
20 Direction Générale de la Santé (DGS). Etude sur la teneur en métaux dans l'alimentation. La diagonale des métaux Paris, 1992.
21 Decloître F. La part des diff é rents aliments dans l'exposition au plomb, au cadmium et au merc u re, en France. Cah. Nutr. Diét. 33 (3) : 167-175, 1998.
22 JECFA Evaluation of certain food additives and contaminants. 61th report of the Joint FAO/WHO Expert Committee on Food Additives andcontaminants. WHO Geneva. 2004.
POISSON 4.3 GB.qxd 17.9.2006 20:17 Page 13
14 FIRST PART - Methodology and general presentation
In humans and animals the brain is the main organ targeted by MeHg. This neurotoxicity appears in theadult brain but even more so in the developing brain. Moreover, MeHg diffuses easily through theplacenta and is also found in human milk.
In both humans and animals the neurotoxic effects observed after exposure to high MeHg levels(concentrations greater than 100 mg/kg in human hair) are essentially sensorial, visual, auditory andmotor deficiencies. On the other hand, in humans, the effects of exposure to low doses of MeHg aremore difficult to identify.
In adults, epidemiological studies in Amazonia have revealed the presence of alterations of visual,somatosensorial and motor functions, and of memory, attention, learning ability and manual dexterityin people whose hair mercury level is 6 mg/kg or more22 23 24 25 26. The blood and the hair are good markersof MeHg exposure, in particular in conditions of uniform dietary regime, and these concentrations arelinked to those of MeHg in the brain, which enables good estimation of the effects of mercury on healthand the central nervous system2 7. Nevertheless the authors underline that the measured levels do notenable confirmation of a dose-response effect, since the concentrations measured in the biologicalmatrices at the time of the study do not necessarily correspond to the earlier exposures that caused theobserved adverse eff e c t s2 2.
In children the main prospective epidemiological studies carried out in the Seychelles, New Zealand andthe Faeroe Islands point to a correlation between dietary exposure to mercury during pregnancy andthe appearance of neurological symptoms in children2 8. However different populations appear to haved i fferent sensitivity to mercury, which can also be affected by dietary habits and exposure to otherc o n t a m i n a n t s .
Apart from its effects on the central nervous system, MeHg also appears to be able to affect the immunitarysystem of adults and the developing immunitary system29 30 31. Further experimental studies are necessaryto confirm and clarify the mechanisms of this immunotoxicity.
In 1990 the WHO established a provisional tolerable weekly intake (PTWI) of 3.3 µg of MeHg/kg bw(kilograms of body weight) based on evaluations made by the JECFA (Joint FAO/WHO Expert Committeeon Food Additives and Contaminants) from 1972 to 19891 9. However, in order to assure better protectionfor foetuses and infants, the WHO issued warnings for pregnant and breast-feeding women. In France,the CSHPF in 1998 and the AFSSA in 200232 recognised the existence of sensitive groups (pregnant andbreast-feeding women, very young children, fishermen operating in highly contaminated zones) andrecommended the provision of specific information to encourage these particular groups to diversifythe species of fish they consume. Following the publication of new results, the JECFA lowered the PTWI
23 Lebel J, Mergler D, Branches F, Lucotte M, Amorim M, Dolbec J, Miranda D, Arantes G, Rheault I, Pichet P. Evidence of early nervous systemdysfunction in Amazonian populations exposed to low-levels of methylmerc u r y. Neurotoxicology 17 : 157-168, 1996.
24 Lebel J, Mergler D, Branches F, Lucotte M, Armorin M, Larribe F, Dolbec J. Neurotoxic effects of low-level methylmercury contamination inthe Amazonian Basin. Environ. Res. 79 : 20-32, 1998.
25 Dolbec J, Mergler D, Sousa Passos CJ, Sousa de Morais S, Lebel J. Methylmercury exposure affects motor performance of a riverine popula-tion of the Tapajos river, Brazilian Amazon. Int. Arch. Occup. 73 (3) : 195-203, 2000.
26 US EPA. Water quality criterion for the protection of human health : Methylmerc u r y, Final. EPA-823-R-01-001. Washington. 2001.
27 JECFA Safety evaluation of certain food additives and contaminants. 53th report of the Joint FAO/WHO Expert Committee on FoodAdditives and contaminants. WHO Food Additives Series 44. WHO Geneva. 2000.
28 Murata K, Weilhe P, Araki S, Budtz-Jorgensen E, Grandjean P. Evoked potentials in Faroese children prenatally exposed to methylmerc u r y.N e u rotoxicol. Teratol. 21 : 471-472, 1999.
29 Ilback NG. Effects of methyl mercury exposure on spleen and blood natural killer (NK) cell activity in the mouse. Toxicology 25; 67 (1) : 117-124, 1991.
30 Ilback NG, Sundberg J, Oskarsson A. Methylmercury exposure via placenta and milk impairs natural killer (NK) cell function in newborn rats.Toxicol Lett. 58 (2) : 149-158, 1991.
31 Wild LG, Ortega HG, Lopez M, Salvaggio JE. Immune system alteration in the rat after indirect exposure to methyl mercury chloride ormethyl mercury sulfide. Environ. Res. 74 (1): 34-42, 1997.
32 AFSSA. Avis de l’Afssa relatif à l’évaluation des risques sanitaires liés à l’exposition au merc u re des femmes enceintes et allaitantes et desjeunes enfants, 21 Octobre 2002.
POISSON 4.3 GB.qxd 17.9.2006 20:17 Page 14

15FIRST PART - Methodology and general presentation 15
to 1.6 µg/kg bw in 20032 2. This intake corresponds to a steady state concentration in the mother's bloodof 56 µg of MeHg per litre assessed from a NOAEL for hair of 14 mg/kg (taking into account a hair/bloodratio of 250) that does not have any appreciable adverse effects on the foetus. The PTWI takes intoaccount uncertainty factors: 2 for the variability between individuals of the relationship between theMeHg concentration measured in hair and that measured in the blood, and 3.2 for the inter- i n d i v i d u a lvariability (pharmacokinetic component) of the relationship between the dietary intake of MeHg andthe concentration measured in the blood. The AFSSA Opinion dated March 20043 3 confirmed the validityof this PTWI for the most sensitive population groups: pregnant and breast-feeding women and youngchildren. The Food Standards Agency's advisory committees on contaminants in the United Kingdomhas stated that in view of these new toxicological data there appears to be no reason to revise the PTWIestablished previously by the JECFA at 3.3 µg MeHg/kg bw for the general public, with the exception ofsensitive populations3 5.
In France, exposure studies to date tend to show that values close to or greater than the PTWI of 1.6 µg/kgbw/week can be reached by certain categories of high fish and seafood consumer, and notably very younginfants and women of child-bearing age33 36 . Better estimation of the exposure of the more sensitive groupstaking into account both the species of fish consumed and their origin is necessary to correctly evaluate therisk run by these groups and, if need be, to enable the provision of better information – or even betterrecommendations than those made today – on dietary consumption.
Cadmium
Cadmium (Cd) is a contaminant found in the environment and in particular in the soil, due to erosionand human and agricultural activities. It thereby enters the food chain. In non-smoking individuals themain source of cadmium exposure is food. The most highly contaminated foods are molluscs, offal, leafvegetables and cereals20 21. Digestive absorption of cadmium is low (about 5-10%). On the other hand,cadmium is a cumulative toxin whose biological half-life is very long (estimated to be 20-30 years inhumans). The International Agency for Research on Cancer (IARC)3 7 classifies cadmium as “carcinogenicfor man” (category 1).
Cadmium has numerous toxic effects, but the main impact on the organism of prolonged exposure tocadmium in both man and animals is on the renal function. The nephrotoxic effects are characterisedby degeneration of the proximal tubules and proteinuria38 39 40 41. The risk associated with this degenerationstarts to increase when the urinary excretion of cadmium exceeds 2.5 µg/g creatinine. The JECFA Committeeconsiders this to be the value for which there is an absence of prevalence of renal tubular malfunction4 2.In man, these alterations of the renal function can be accompanied by bone damage with osteomalacia
33 AFSSA. Avis de l’Afssa relatif à la réévaluation des risques sanitaires du méthylmerc u re liés à la consommation des produits de la pêche aure g a rd de la nouvelle dose hebdomadaire tolérable pro v i s o i re (DHTP). 16 mars 2004.
35 FSA Advice on fish consumption : benefit and risks, Committee on toxicity and Scientific advisory committee on nutrition London TSO, 2004.
36 Crépet A., Tressou J., Verger P. and Leblanc J.C. Management options to reduce exposure to methylmercury through the consumption offish and fishery products by the French population. Regul. Toxicol. Pharmacol. 42 : 179-189. 2005.
37 IARC. Monographs on evaluation of carcinogenic risks to humans. WHO, Lyon vol85 : 119. 1993.
38 JECFA. Safety evaluation of certain food additives and contaminants. 33th report of the Joint FAO/WHO Expert Committee on FoodAdditives and contaminants. WHO Technical Report Series 776. WHO Geneva. 1989.
39 Nogawa K, Honda R, Kido T, Tsuritani I, Yamada Y, Ishizaki M, Yamaya H. A dose-response analysis of cadmium in the general enviro n m e n twith special re f e rence to total cadmium intake limit. Environ. Res. 48 (1) : 7-16, 1989.
40 Staessen JA, Buchet JP, Ginucchio G, Lauwerys RR, Lijnen P, Roels H, Fagard R. Public health implications of environmental exposure to cad-mium and lead : an overview of epidemiological studies in Belgium. Working Groups. J. Cardiovasc. Risk 3 (1) : 26-41, 1996.
41 Jarup L, Hellstrom L, Alfven T, Carlsson MD, Grubb A, Persson B, Petersson C, Spang G, Schutz A, Elinder CG. Low level exposure to cad-mium and early kidney damage: the OSCAR study. Occup. Environ. Med. 57 (10) : 668-672, 2000.
42 JECFA. Safety evaluation of certain food additives and contaminants. 55th report of the Joint FAO/WHO Expert Committee on FoodAdditives and contaminants. WHO. 2001.
POISSON 4.3 GB.qxd 17.9.2006 20:17 Page 15

16 FIRST PART - Methodology and general presentation
and demineralisation43 44. Additionally, relationships exist in man and animals between cadmium exposureand retarded foetal growth4 5; reduced fertility in males has also been reported46 47. On the other hand,there is no confirmed relationship between dietary exposure to cadmium and arterial hypertension orc a n c e r.
In France, the average daily intake of cadmium was estimated to be 19.6 µg for adults in 19982 1, 17 µgin 20004 8 and 3.6 µg in 20034 9. Following the first French total diet study (TDS)3, the latest estimationsin 2005 indicate an average daily intake of 2.7 µg in people over 15 years old5 0, which represents about4% of the PTWI of 7 µg/kg bw/week established by the JECFA using a theoretical prediction modelestimating the relationships between the dietary intake of cadmium, urinary excretion and associatedprevalence of renal tubular malfunction4 2.
The most contaminated foods are offal and seafood, notably molluscs. Seafood represents 8% to 25%of dietary intake of cadmium5 1. Vegetables, potatoes and similar products, due to their importance inhuman diets, are also major vectors of dietary exposure (23.7% and 21.2% respectively) in the generalp o p u l a t i o n5 0.
Lead
Lead (Pb) is an environmental pollutant found in soil and the atmosphere, in particular in theneighbourhood of industrial sites and heavy automobile traff i c .
The dietary intake of lead comes mainly from drinks5 0, fresh fruit, vegetables and cereals. The contributionfrom drinks, which was non-negligible just a few years ago, is tending to decline rapidly as productionmethods are improved.
One of the major effects of lead on the organism is its hematological toxicity of which anaemia is themost common symptom. The presence of lead in the blood is the principal biomarker of lead exposure.Lead acts on the biosynthesis of the heme, inhibiting two key enzymes, gamma-aminolevulinic aciddehydratase (ALA-D) and ferrochelatase. In adults, urinary ALA-D excretion and free porphyrins of theerythrocytes, whose level is linked to the ferrochelatase, are exploited as biological markers for leade x p o s u re5 2. In 1991 it was shown that lead exposure reduces the erythrocyte's defences against oxidationand shortens its life5 3.
43 ATSDR. Toxicological profile for cadmium. Draft for public comment. US. Department of Health and Human Services. Public Health Service.Agency for Toxic Substances and Disease Registry, 1997.
44 Noël L., Guérin T. and Kolf-Clauw M. Subchronic dietary exposure of rats to cadmium alters the metabolism of metals essential to bonehealth. Food Chem. Toxicol. 42 (8) : 1203-1210. 2004.
45 Frery N, Nessmann C, Girard F, Lafond J, Moreau T, Blot, Lellouch J, Huel G. Environmental exposure to cadmium and human birthweight.To x i c o l o g y, 79 (2) : 109-118, 1993.
46 Xu B, Chia SE, Tsakok M, Ong CN. Trace elements in blood and seminal plasma and the relationship to sperm quality. Reprod. Toxicol. 7(6) ::613-618, 1993.
47 Telisman S, Cvitkovic P, Jurasovic J, Pizent A, Gavella M, Robic B. Semen quality and re p roductive endocrine function in relation to biomar-kers of lead, cadmium, zinc, and copper in men. Environ. Health Perspect. 108 (1) : 45-53, 2000.
48 Leblanc J.-C., Malmauret L., Guérin T., Bordet F., Boursier B. and Verger P. Estimation of the dietary intake of pesticide residues, lead, cad-mium, arsenic and radionuclides in France. Food Addit. Contam. 17 (11) : 925-932. 2000
49 Noël L., Leblanc J.-C. and Guérin T. Determination of several elements in duplicate meals from catering establishment using closed vesselm i c rowave digestion with inductively coupled plasma mass spectrometry detection: estimation of daily dietary intake. Food Addit. Contam. 20(1) : 44-56. 2003.
50 Leblanc J.-C., Guérin T., Noël L., Calamassi-Tran G. Volatier J.-L. and Verger P. Dietary exposure estimates of 18 elements from the 1st Fre n c hTotal Diet Study. Food Addit. Contam. 22 (7) : 624-641. 2005.
51 Tressou J., Crépet A., Bertail P., Feinberg M.H. and Leblanc J.-C. Probabilistic exposure assessment to food chemicals based on extreme valuet h e o r y. Application to heavy metals from fish and sea products. Food Chem. Toxicol. 42 : 1349-1358. 2004.
52 Landrigan PJ. Current issues in the epidemiology and toxicology of occupational exposure to lead. Eniron. Hlth. Perspect. 89 : 61-66, 1990.
53 Sugawara E, Nakamura K, Miyake T, Fukumura A, Seki Y. Lipid peroxidation and concentration of glutathione in erythrocytes from workersexposed to lead. Br. J. Ind. Med. 48: 239-242, 1991.
POISSON 4.3 GB.qxd 17.9.2006 20:17 Page 16

FIRST PART - Methodology and general presentation 17
Many studies have long demonstrated a correlation between hypertension and professional exposureto lead54 55.
H o w e v e r, the most worrying impact of lead remains the neurotoxic effects (saturnism) it can cause. Leadperturbs the liberation of neuromediators by nerve cells and can pass the hemato-encephalic barrier.Epidemiological studies have shown that exposure of the foetus to small doses of lead can cause congenitala b n o r m a l i t i es56 . Exposure to doses of lead that do not result in the appearance of saturnism symptomsduring infancy can nevertheless cause durable neuro-behavioural handicaps (reading difficulties, lowerintellectual performance, absenteeism, etc.)57 .
The annual dietary intake of lead by the French population was estimated between 1978 and 1980 tobe 60 mg, equivalent to 30% to 50% of the PTWI of 50 µg/kg bw/week fixed by the WHO in 1972. In1987, the JECFA revised this dose to 25 µg/kg bw/week for children, then extended it to adults. Theparticular sensitivity of pre- and post-natal infants to the neurotoxic effect of lead implies that the dietaryintake should be reduced for pregnant women, but no modification of the PTWI has been proposed.Dietary intake of lead has fallen substantially in industrialised countries with the disappearance of lead-based solders, the introduction of lead-free gasoline and improvements in food production andtransformation practices, notably in vinification and wine making processes and food can soldering. Theaverage daily dietary intake of the adult population was estimated to be 68 µg in 19982 1, 52 µg in 2000 4 8
and 34 µg in 20034 9, and it has been more recently estimated to be 18 µg5 0, equivalent to 7% of theP T W I .
Seafood consumption (fresh fish, crustaceans and molluscs) accounts for 3% to 11% of lead intake viafood. As for mercury and cadmium, we can suppose that values close to or even exceeding the PTWI arereached by the highest consumers. An estimation of the exposure of these people is therefore necessary.
Arsenic
Arsenic (As) is a soil contaminant naturally present in the environment but whose main anthropogenicorigins are the use of phytosanitary products, atmospheric releases from incineration installations andindustrial activity. The organic forms of arsenic – arsenobetaine (AsB), arsenocholine (AsC),monomethylarsonic acid (MMA), dimethylarsinic acid (DMA), etc. – are the predominant forms in foodmatrices. Whilst public health organisations still consider inorganic arsenic (As(III) and As(V)) to be themost dangerous forms and the methylated forms to be less harmful, in recent years scientists have revisedthis position as analytical speciation techniques continue to improve and in the light of the latesttoxicological studies on the different forms of contaminants58 59 60 . These studies reveal that DMA isprobably carcinogenic or promotes carcinogenesis and that the MMA(III) and the DMA(III) are genotoxic5 8.In man, pentavalent arsenic As(V) is reduced to trivalent arsenic As(III), itself methylated into methylarsonicand dimethylarsinic acids, most of which are then excreted.
54 Cooper WC, Gaffey WR. Mortality of lead workers. J. Occup. Med. 17 : 100-107, 1975.
55 De Kort WLAM, Verschoor MA, Wibowo AAE, Van Hemmen JJ. Occupational exposure to lead and blood pre s s u re: a study in 105 workers.Brit. J. Ind. Med. 11 : 145-156, 1987.
56 Baghurst PA, Robertson EF, Mc Michael AJ, Vimpani GV, Wigg NR, Roberts RR. The Port Prire cohort study: lead effects on pregnancy outco-me and early childhood development. Neuro t o x i c o l o g y. 8: 395-401, 1987.
57 Needleman HL, Schell A, Bellinger D, Leviton A, Allred RN. The long-term effect of exposure to low doses of lead in childhood. N. Engl. J.Med. 322: 83-88, 1990.
58 Velez D. and Montoro R. Inorganic arsenic in foods : Current overview and future challenges. Recent Res. Devel. Agricultural & Food Chem.5 : 55-71. 2001.
59 Vahter M. Mechanisms of arsenic biotransformation. To x i c o l o g y. 181-182 : 211-217. 2002.
60 Hirano S., Kobayashi Y., Cui X., Kanno S., Hayakawa T. and Shraim A. The accumulation and toxicity of méthylated arsenicals in endothelialcells : important roles of thiol compounds. Toxicol. Appl. Pharmacol. 198 (3) : 458-467. 2004.
POISSON 4.3 GB.qxd 17.9.2006 20:17 Page 17

18 FIRST PART - Methodology and general presentation
The IARC classifies arsenic as “carcinogenic for man” (category 1). Severe exposure to arsenic results invomiting, abdominal pain and diarrhoea; prolonged exposure to low doses of arsenic in drinking watercan cause cancer of the skin, lung, bladder or kidney, and cutaneous disorders such as hyperkeratosisand pigmentation modifications61 62 .
In 1989 the WHO3 8 fixed a PTWI of 15 µg/kg bw/week for inorganic arsenic.
The exposure to total arsenic can be of atmospheric origin and it is also increased by cigarette smoking,but dietary exposure remains the prime source. Much of the arsenic comes from fish and seafood. Thescientific literature reports that 0.4% to 5.3% of the arsenic present in fish and seafood are in the formof inorganic arsenic63 . The average daily intake of total arsenic in Europe was estimated in 2003 to be125 µg in adults, and the contribution of seafood to this exposure exceeded 50%6 4. However littlecontamination data on all seafood is available today. More particularly in France, the average daily intakefor the adult population was estimated in 2000 to be 109 µg4 8 and in 2003 to be 147µg4 9 of which 135µg (95%) comes from fish. However this report underlines the difficulty in evaluating precisely theexposure to arsenic due to the diversity of its origins (sea fish, river fish, fish farms, etc.). European dataprovide average contamination levels for fish and seafood (including molluscs, crustaceans andechinoderms) ranging from less than 0.1 µg/g to 18 µg/g6 4. A more recent estimation indicates an averagedaily intake of 62 µg for adults (6.2 µg/kg bw/week for a person weighing 70 kg), of which 62% comesfrom seafood5 0.
Organotin compounds
Organostannic compounds (OTC) present in the environment are mainly of anthropogenic origin. Theyare used as stabilizers and catalysts, vermifuges in the composition of plastics, biocides in paints, and inwashing products and pesticides. Sludges from sewage treatments plants and industrial and agriculturalactivities are the main sources of environmental contamination.
Water pollution leads to contamination of living marine organisms almost permanently exposed toorganic tin. These active substances are very certainly responsible for the toxic effects observable inmarines species at very low doses, such as growth and reproduction disorders in oysters and sex changesin certain gasteropods.
In humans, food – and seafood in particular65 – is the principal origin of organic tin absorption. Tr i s u b s t i t u t e dorganic tin – tributyltin (TBT) and triphenyltin (TPT) – appear to be the most toxic. TBT causes endocrineperturbations and TPT affects the reproductive system and development6 5. Generally speaking, theorganostannic compounds such as dibutyltin (DBT), tributyltin (TBT) and triphenyltin (TPT) are immunotoxic,causing a drop in the lymphocytes in the thymus and peripheral lymphoid organs66 67 .
61 Wu M.M., Kuo T.L., Hwang Y.H. and Chan C.J. Dose-response relation between arsenic concentration in well water and mortality from can-cers and vascular diseases. Am. J. Epidemiol. 130 (6) : 1123-1132, 1989.
62 Chen C.J., Chen C.W., Wu M.M. and Kuo T.L. Cancer potential in liver, lung, bladder and kidney due to ingested inorganic arsenic in drin-king water. Br. J. Cancer. 66 (5) : 888-892, 1992.
63 Schoof, R. A., Yost, L. J., Eickhoff, J., Crecelius, E. A., Cragin, D. W., Meacher, D. M., and Menzel, D. B., 1999, A market basket survey ofinorganic arsenic food. Food and Chemical To x i c o l o g y, 37, 839-846.
64 SCOOP reports on tasks 3.2.11. Assessment of dietary exposure to arsenic, cadmium, lead and mercury of the population of EU MembersStates. 2003.
65 SCOOP reports on tasks 3.2.13. Assessment of dietary exposure to organotin compounds of the population of EU Members States. 2003.
66 Gennari A., Potters M., Seinen W. and Pieters R.. Organotin-induced apoptosis as observed in vitro is not relevant for induction of thymus atro p h yat antiproliferative doses. Toxicol. Appl. Pharmacol. 147 : 259-266. 1997.
67 Gennari A., Bol M., Seinen W., Penninks A. and Pieters R. Organotin-induced apoptosis occurs in small CD4(+)CD8(+) thymocytes and is accompa-nied by an increase in RNA synthesis. To x i c o l o g y. 175 : 191-200. 2002.
POISSON 4.3 GB.qxd 17.9.2006 20:17 Page 18
FIRST PART - Methodology and general presentation 19
In 2004 the European Food Safety Authority (EFSA)6 8 established a group tolerable daily intake (TDI) of0.25 µg/kg bw/day for tributyltin (TBT), dibutyltin (DBT), triphenyltin (TPT) and dioctyltin (DOT) basedon TBTO molecular mass; this group TDI is 0.1 µg/kg bw when expressed as Sn content, in line with theCSTEE proposals (Committee on To x i c i t y, Ecotoxicity and the Environment) in 2003 69 and the WHOrecommendations in 1999.
The rarity of the contamination data, in particular in France where they are almost inexistent, makes itd i fficult to evaluate population exposure. The data published in the SCOOP task 3.2.136 5 or in theEuropean OT-SAFE report 70 are difficult to exploit for purposes of risk evaluation due to their qualitativeand quantitative disparity. However these two studies do show that shellfish accumulate more organictin than fish and crustaceans.
1.1.3 Persistent organic pollutants
Persistent organic pollutants are environmental contaminants mainly of anthropogenic origin (industrialand agricultural utilisations over the last 30 years) which, mainly due to their lipophilic nature, accumulatein food chains. Their have multiple effects on human health including genotoxicity, embryotoxicity andendocrine perturbations.
Dioxins and “dioxin-like” polychlorobiphenyls
Polychlorodibenzo-p-dioxins (PCDD) and polychlorodibenzofurans (PCDF) are compounds of similarmolecular structure and physicochemical properties. There are 210 dioxin congeners, 75 PCDDs and135 PCDFs. However only the toxicity of the 2.3.7.8-tetrachloro-dibenzo-p-dioxin (2.3.7.8-TCDD), the“Seveso dioxin”, has been widely verified. This therefore serves as a reference in the calculation oftoxicities as so-called Toxic Equivalents (TEQ) by applying Toxic Equivalent Factors (TEF) to the 16 otherdioxin congeners and furans similar to 2.3.7.8-TCDD.
The polychlorobiphenyls (PCB) include 209 congeners that differ only in the number and position of thechlorine atoms on the biphenyl molecule. Twelve PCBs have toxicological properties similar to those ofdioxins and are therefore referred to as “dioxin-like PCBs” (DL-PCB). TEF weightings are also applied tothe DL-PCBs and they form part of the toxicity calculation along with the PCDDs and PCDFs.
In 2001, the JECFA fixed a provisional tolerable monthly intake for PCDDs, PCDFs and DL-PCBs at70 pg TEQW H O/kg bw 7 1.
68 EFSA. Opinion of the Scientific Panel on Contaminants in the food chain on a request from the Commission to assess the health risks to consu-mers associated with exposure to organotins in foodstuffs. Question N°EFSA-Q-2003-110. September 2004.
69 Opinion of the Scientific Committee on To x i c i t y, Ecotoxicity and the Environment (CSTEE) on Revised assessment of the risks to health and thee n v i ronment associated with the use of organostannic compounds (excluding use in antifouling paints). 43rd plenary meeting. 28 May 2004.
70 OT SAFE. Sources, consumer exposure and risks of organotin contamination in seafood. Final report of the European Commission Researc hP roject OT-SAFE N° QLK1-2001-01437, 149p. Décembre 2004.
71 JECFA. Summary of the 57th meeting of the Joint FAO/WHO Expert committee on food additives. Rome, 5-14 June 2001.
POISSON 4.3 GB.qxd 17.9.2006 20:17 Page 19

20 FIRST PART - Methodology and general presentation
“Indicator” polychlorobiphenyls
The seven congeners called “indicator PCBs” (i-PCB) 28, 52, 101, 118, 138, 153 and 180 have propertiesd i fferent from DL-PCBs. They have antithyroidian and neurotoxic effects. It is estimated that the exposureto i-PCB account for half the exposure to total PCB congeners due to their tendency to cumulate in foodmatrices and their toxicological impact on man7 2. Recent European studies indicate for adults an averagedaily intake of 0.01 to 0.045 µg i-PCB/kg bw7 3.
Concerning all the PCBs, in 2002 the WHO proposed a TDI of 0.02 µg/kg bw, in Aroclor Equivalent74 . Thei-PCB analysis results must be multiplied by two to be expressed in Aroclor Equivalent. The calculatedexposure is then compared with the TDI.
Polybromodiphenylethers
Polybromodiphenylethers (PBDEs) are flame retardants used in plastics and textiles. Since the 1970s theyhave accumulated in food chains, in aquatic biotopes in particular. These compounds are hepatotoxic,embryotoxic and also have antithyroidian effects, which is particularly worrying in view of the PBDEconcentrations found in human milk75 .
To date no PTWI has been fixed for PBDEs at national, European or international level.
Fish and seafood are major contributors to dietary exposure to persistent organic pollutants: 25% to30% for the 17 congeners of dioxin and furan type78 79 , 75% for PCBs (from the i-PCBs)7 8, and 30% forthe 7 PBDE congeners (28, 47, 99, 100, 153, 154, 183)80 . In France, data from the INCA survey point toan estimated daily dietary intake of PCDDs and PCDFs in adults of 1.45 pg TEQWHO/kg bw in 20007 8,and 0.5 pg/kg bw in 20057 9. The daily intake of DL-PCBs was estimated to be 1.2 pg/kg bw in 20067 9.
72 AFSSA. Avis sur l’existence éventuelle d’une corrélation significative entre les teneurs dans diff é rents congénères de PCB. Saisinen°2002-SA-0149. 2003.
73 EFSA. Opinion of the CONTAM panel related to the presence of non dioxin-like polychlorinated biphenyls (PCB) in feed and food. 2005.w w w. e f s a . e u ropa.eu <http://www. e f s a . e u ro p a . e u >
74 WHO/IPCS. Polychlorinated biphenyls : Human health aspects. Geneva. 2003.
75 Norén K and Meironyté D. Contaminants in Swedish human milk. Decreasing levels of organochlorine and increasing levels ofo r g a n o b romine compounds. Organohalogen Comp 38 : 1-4. 1998.
78 SCOOP reports on tasks 3.2.5. Assessment of dietary intakes of dioxins and related PCBs by the population of EU Members States. 2000.
79 AFSSA, Rapport Dioxines, furanes et PCB de type dioxines : Evaluation de l’exposition de la population française. Avril 2006.
80 The third International Workshop on Brominated flame re t a rdants, To ronto, June 2004.
POISSON 4.3 GB.qxd 17.9.2006 20:17 Page 20

FIRST PART - Methodology and general presentation 21
1.2 Study methodology
1.2.1 Selection of study zones and populations
The four coastal zones selected for the seafood consumption survey are Mediterranée/Va r, Normandie/Baiede Seine, Bretagne sud, and Gironde/Charente Maritime sud.
The populations in these regions are the highest consumers of fish and seafood, as confirmed by a FoodConsumption Observatory study in 1996 (OCA-CREDOC8 1). For example, as regards fish the highestconsumptions are in Nord-Pas-de-Calais, Picardie, the Parisian Region, Haute-Normandie, Basse-Normandie,Pays de la Loire, Poitou-Charentes, Aquitaine, Languedoc-Roussillon, Provence-Alpes-Côte d'Azur andCorsica where annual consumption per household is 18.5 to 32.7 kg. It appears that fish consumptiondeclines as we move away from the coast, which may be partly explained by widespread self-procurementof seafood by coastal populations. This hypothesis is supported by a CREDOC8 2 survey of 400 representativehouseholds in the north of the Cotentin peninsular which reveals that 20% of the seafood consumed(fish, crustaceans and shellfish) is self-provisioned. Moreover we also note that the coastal regions havethe highest number of retail seafood outlets83 84 (Figure 3).
Figure 3: Retail trade for fish in 2002
For each of the four zones one nearby fishing port enabling direct provisioning was selected wherebeach fishing is possible. Individuals were recruited within a radius of 20 to 25 km around this point.Between 20 and 27 towns were visited in each zone and the number of individuals questioned per townwas calculated on the basis of the number of inhabitants published in the 1999 INSEE survey. The fourlarge regions finally selected are Le Havre in Normandie/Baie de Seine, Lorient in Bretagne sud, LaRochelle in Gironde/Charente Maritime sud, and Toulon in Mediterranee/Va r. The existence in each ofthese zones of an environmental source of a contaminant of interest was also a selection criterion,notably PCBs in the Baie de Seine and cadmium in the Gironde estuary.
81 OCA-CREDOC. Les disparités régionales de la consommation alimentaire des ménages français. Rapport n° CP004. Février 1996.
82 Dufour A. et Volatier J.-L. Enquête sur la consommation alimentaire dans le Nord Cotentin pour la Cogema. Juin 1998.
83 OFIMER (Office national interprofessionnel des produits de la mer et de l’aquaculture). La Lettre de l’OFIMER. Novembre 2001.
84 Cochez N. DGCCRF – Bureau A2. Les entreprises du petit commerce en France entre 1993 et 2003.
Source : DGCCRF, 2002.
POISSON 4.3 GB.qxd 17.9.2006 20:17 Page 21

22 FIRST PART - Methodology and general presentation
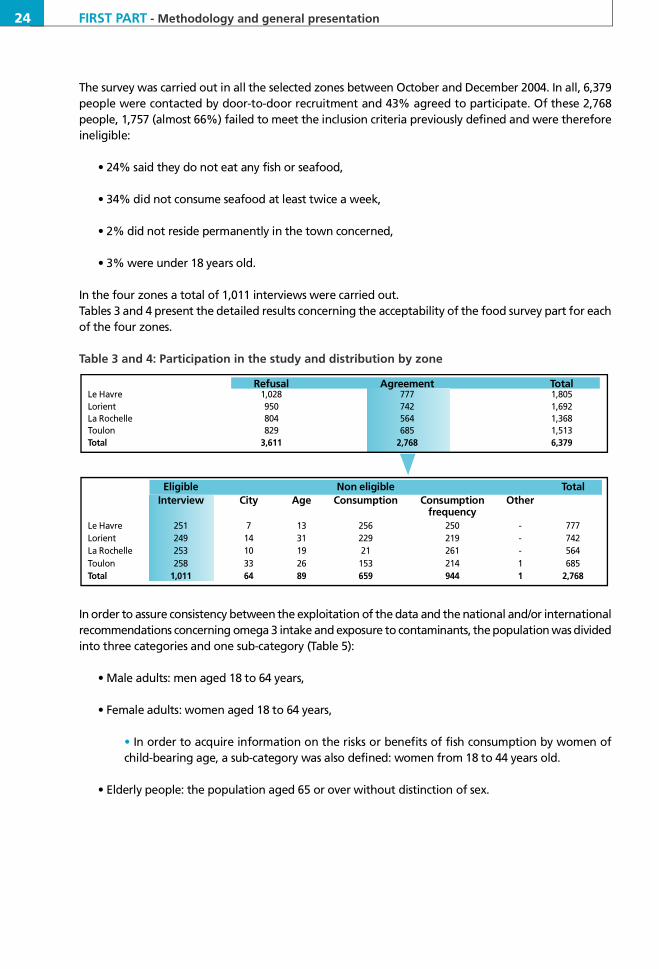
A representative consumer population sample was ensured by random recruitment (apart from thequotas applied) by door-to-door canvassing every five doors, using the so-called “random route” method.
About one thousand individuals were recruited, or 250 per zone. The people satisfying the inclusioncriteria listed below were questioned.
Inclusion criteria
• Adult (18 years or older),
• Consumes seafood at least twice a week, a criterion defined in the 1999 INCA study and therecommendations of the PNNS. The median consumption frequency calculated from the individualseafood consumption data in the population of the INCA study was twice a week (CREDOC-AFSSA-DGAL, 20008 5) ,
• Permanent resident in the zone for several years.
Exclusion criteria
• Refusal to participate: during the pilot survey about 42% of the people contacted refused toparticipate in the survey 8 6.
Over and above these inclusion criteria, the female population aged 18 to 44 years corresponding towomen of child-bearing age was over-represented in order to obtain a sample representative of thispopulation and a larger volume of consumption and biological data in view of the health risks associatedwith methylmercury. Based on an evaluation of the health risks of methylmercury consumed in seafood,in 2004 the AFSSA recommended that pregnant and breast-feeding women should consume no morethan 150g of predator fish per week, in addition to their usual consumption of non-predator fish3 2.
The dietary study covered all foods consumed by adults (18 years or older): seafood and other foods.This study is based on a questionnaire concerning consumption frequency validated during the pilotsurvey by means of 7-day consumption diaries. The portion sizes usually consumed were estimated bymeans of a book of sample photographs8 7. The survey involved a single interview during which thefollowing points were covered:
• Presentation of the study to obtain the consent of the adult person to participate;
• Questionnaire concerning the frequency of food consumption in general and seafood in particular.Information was also collected on purchasing methods (fresh, frozen, canned, etc.) and on the usualorigin of the seafood consumed (commercial and self-provisioning), the socio-demographic profileof the respondent and about ten closed questions on the perception of the food risks associatedwith seafood;
• Presentation of the biological part to obtain the informed consent of the respondent to participateif eligible (see below the exclusion criteria for the biological part).
85 CREDOC-AFSSA-DGAL, 2000. Enquête Nationale sur les Consommations Alimentaires. Editions Tec & Doc.
86 Afssa. Etude de faisabilité d’une enquête sur les “modes d’approvisionnement locaux en produits de la mer chez des forts consommateurs”:évaluation de l’exposition aux métaux lourds et quantification du risque sanitaire associé. Note technique OCA/NB/JLV/2003-574. 2003.
87 Portions alimentaires : manuel photos pour l’estimation des quantities. SUVIMAX. 1994.
POISSON 4.3 GB.qxd 17.9.2006 20:17 Page 22

FIRST PART - Methodology and general presentation 23
Exclusion criteria for the biological part
• Refusal to participate;
• People suffering from pathologies that could have repercussions on the biological level of omega3, lead, mercury, arsenic or cadmium (renal disease, arterial hypertension, urinary incontinence).
1.2.2 Consumption survey
In order to have data on habitual consumptions, we gave priority to the food frequency questionnaire(FFQ). However, and in view of the fact that FFQs are less precise than questionnaires concerning shortperiods, such as consumption diaries or 24 h recall, we first performed a FFQ validation study8 6.
This pilot survey was intended to prepare for the full-scale survey and was performed in two coastalzones (La Rochelle on Atlantic and Toulon on Mediterranean). The field survey involved 61 people aged15 or over. The consumptions were recorded using a consumption diary and a food frequencyquestionnaire. Owing to the heavy work implied by a consumption diary and its poor representativenessof dietary habits over the year, this solution was excluded for the full-scale survey. It was thereforenecessary to validate the lighter and less restrictive food frequency questionnaire for the main surveys.The results of this survey reveal poor correlation (correlation coefficient ranging from -0.1 to 0.15)between the consumption of some seafood products and the two collection methods. Several reasonscould explain this disagreement. First, the seasonality of the consumption of certain seafood products.Indeed, since the diary does not reflect the dietary habits over the year, a large number of fish in the liston the FFQ had not been consumed when filling in the diary. Moreover some confusion was observedfor several categories of products:
• Seafood products consumed fresh but also canned and/or smoked: these were therefore wellseparated and well identified in the FFQ used in the full-scale survey to avoid risk of confusion.
• Products for which several denominations are sometimes used (cod, grenadier/hoki, etc) or whichhave local names: for these we tried to be as exhaustive as possible by indicating all the known namesor by grouping the names designating the same product.
These two points led us to review the classification of products subject to confusion in the statisticalanalysis of the pilot survey data.
On the other hand, satisfactory correlations were observed for well identified seafood products (salmon,skate, perch and trout for which the correlation coefficient ranged from 0.35 to 0.5) and for the otherfood categories.
The FFQ was therefore validated and improvements were made prior to the full-scale survey.
POISSON 4.3 GB.qxd 17.9.2006 20:17 Page 23
24 FIRST PART - Methodology and general presentation
The survey was carried out in all the selected zones between October and December 2004. In all, 6,379people were contacted by door-to-door recruitment and 43% agreed to participate. Of these 2,768people, 1,757 (almost 66%) failed to meet the inclusion criteria previously defined and were thereforeineligible:
• 24% said they do not eat any fish or seafood,
• 34% did not consume seafood at least twice a week,
• 2% did not reside permanently in the town concerned,
• 3% were under 18 years old.
In the four zones a total of 1,011 interviews were carried out. Tables 3 and 4 present the detailed results concerning the acceptability of the food survey part for eachof the four zones.
Table 3 and 4: Participation in the study and distribution by zone
In order to assure consistency between the exploitation of the data and the national and/or internationalrecommendations concerning omega 3 intake and exposure to contaminants, the population was dividedinto three categories and one sub-category (Table 5):
• Male adults: men aged 18 to 64 years,
• Female adults: women aged 18 to 64 years,
• In order to acquire information on the risks or benefits of fish consumption by women ofchild-bearing age, a sub-category was also defined: women from 18 to 44 years old.
• Elderly people: the population aged 65 or over without distinction of sex.
R e f u s a l A g re e m e n t To t a lLe Havre 1 , 0 2 8 7 7 7 1 , 8 0 5L o r i e n t 9 5 0 7 4 2 1 , 6 9 2La Rochelle 8 0 4 5 6 4 1 , 3 6 8To u l o n 8 2 9 6 8 5 1 , 5 1 3To t a l 3 , 6 1 1 2 , 7 6 8 6 , 3 7 9
E l i g i b l e Non eligible To t a lI n t e r v i e w C i t y A g e C o n s u m p t i o n Consumption O t h e r
f re q u e n c yLe Havre 2 5 1 7 1 3 2 5 6 2 5 0 - 7 7 7L o r i e n t 2 4 9 1 4 3 1 2 2 9 2 1 9 - 7 4 2La Rochelle 2 5 3 1 0 1 9 2 1 2 6 1 - 5 6 4To u l o n 2 5 8 3 3 2 6 1 5 3 2 1 4 1 6 8 5To t a l 1 , 0 1 1 6 4 8 9 6 5 9 9 4 4 1 2 , 7 6 8
POISSON 4.3 GB.qxd 17.9.2006 20:17 Page 24
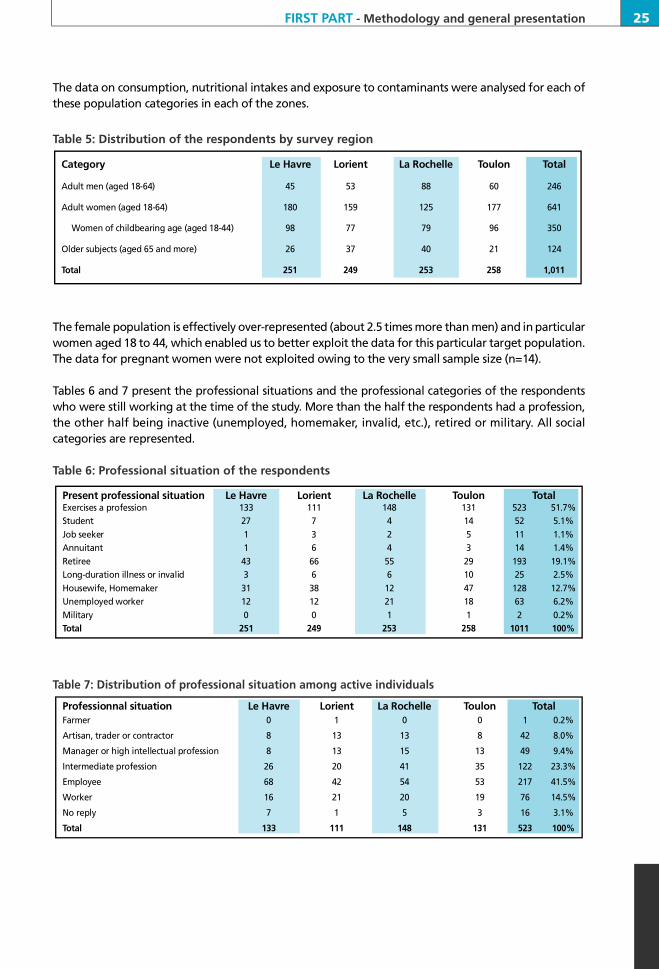
FIRST PART - Methodology and general presentation 25
The data on consumption, nutritional intakes and exposure to contaminants were analysed for each ofthese population categories in each of the zones.
Table 5: Distribution of the respondents by survey region
The female population is effectively over-represented (about 2.5 times more than men) and in particularwomen aged 18 to 44, which enabled us to better exploit the data for this particular target population.The data for pregnant women were not exploited owing to the very small sample size (n=14).
Tables 6 and 7 present the professional situations and the professional categories of the respondentswho were still working at the time of the study. More than the half the respondents had a profession,the other half being inactive (unemployed, homemaker, invalid, etc.), retired or military. All socialcategories are represented.
Table 6: Professional situation of the respondents
Table 7: Distribution of professional situation among active individuals
P rofessionnal situation Le Havre L o r i e n t La Rochelle To u l o n To t a lF a r m e r 0 1 0 0 1 0 . 2 %
Artisan, trader or contractor 8 1 3 1 3 8 4 2 8 . 0 %
Manager or high intellectual profession 8 1 3 1 5 1 3 4 9 9 . 4 %
Intermediate profession 2 6 2 0 4 1 3 5 1 2 2 2 3 . 3 %
E m p l o y e e 6 8 4 2 5 4 5 3 2 1 7 4 1 . 5 %
Wo r k e r 1 6 2 1 2 0 1 9 7 6 1 4 . 5 %
No reply 7 1 5 3 1 6 3 . 1 %
To t a l 1 3 3 1 1 1 1 4 8 1 3 1 5 2 3 1 0 0 %
P resent professional situation Le Havre L o r i e n t La Rochelle To u l o n To t a lExercises a profession 1 3 3 1 1 1 1 4 8 1 3 1 5 2 3 5 1 . 7 %S t u d e n t 2 7 7 4 1 4 5 2 5 . 1 %Job seeker 1 3 2 5 1 1 1 . 1 %A n n u i t a n t 1 6 4 3 1 4 1 . 4 %R e t i r e e 4 3 6 6 5 5 2 9 1 9 3 1 9 . 1 %Long-duration illness or invalid 3 6 6 1 0 2 5 2 . 5 %Housewife, Homemaker 3 1 3 8 1 2 4 7 1 2 8 1 2 . 7 %Unemployed worker 1 2 1 2 2 1 1 8 6 3 6 . 2 %M i l i t a r y 0 0 1 1 2 0 . 2 %To t a l 2 5 1 2 4 9 2 5 3 2 5 8 1 0 1 1 1 0 0 %
C a t e g o r y Le Havre L o r i e n t La Rochelle To u l o n To t a l
Adult men (aged 18-64) 4 5 5 3 8 8 6 0 2 4 6
Adult women (aged 18-64) 1 8 0 1 5 9 1 2 5 1 7 7 6 4 1
Women of childbearing age (aged 18-44) 9 8 7 7 7 9 9 6 3 5 0
Older subjects (aged 65 and more) 2 6 3 7 4 0 2 1 1 2 4
To t a l 2 5 1 2 4 9 2 5 3 2 5 8 1 , 0 1 1
POISSON 4.3 GB.qxd 17.9.2006 20:17 Page 25

26 FIRST PART - Methodology and general presentation
1.2.3 Biological part
This is a study of biomarkers of exposure to fatty acids and environmental contaminants, exploitingbiological samples taken from consumers participating in the food consumption survey. Despite thegeneral interest shown in the subject of this study, 52.8% of the people questioned did not participatein the biological part: 39.1% did not wish to, for the reasons shown below, 13.2% were not eligible forhealth reasons (see the exclusion criteria for the biological part) and 0.5% (5 people) did not reply (Ta b l e8). The 55% acceptance rate among the eligible people is high for this type of public health study. Figure4 shows the distribution of the reasons for refusal (several replies were possible; the results correspondto the aggregated replies).
Table 8: Participation in the biological part
Figure 4: Reasons for refusal to participate in the biological part
* refusal to take a sample for religious or philosophical convictions, or considering it as an attack on privacy or fear to be infect durings a m p l i n g** cancer or haemophilia
Of the eligible respondents 477 people agreed to participate in this biological part; 83 desisted and394 were sampled (Table 9).
A g re e m e n t R e f u s a l Non eligible No re p l y To t a l
Le Havre 1 0 3 1 0 9 3 8 1 2 5 1
L o r i e n t 1 2 6 8 0 4 1 2 2 4 9
La Rochelle 1 1 9 1 0 6 2 8 - 2 5 3
To u l o n 1 2 9 1 0 0 2 7 2 2 5 8
Total 4 7 7 3 9 5 1 3 4 5 1 , 0 1 1
POISSON 4.3 GB.qxd 17.9.2006 20:17 Page 26

FIRST PART - Methodology and general presentation 27
Table 9: Summary of sampling
From October to December 2004, the samples were taken by selected medical laboratories in each ofthe four zones. They also performed the lipids profile for each individual. The samples were stored at-20°C in suitable containers until their analysis. This storage temperature was maintained throughoutthe transportation of the samples to the analytical laboratories.
The biological samples were analysed for a profile of fatty acids in the erythrocyte membrane, and alsofor lead, mercury, arsenic and cadmium and the toxic forms of arsenic and mercury (inorganic arsenicand methylmercury).
The exposure of the subjects to fatty acids was evaluated by performing a fatty acids profile of thephospholipids in erythrocyte membranes, since with a 120 days half-life these phospholipids provide agood marker of the long-term dietary regime88 , unlike adipose tissue or plasma which could only reflectthe last meal. Plasma being constituted essentially by triglycerides, it does not provide a good markerfor long-chain n-3 PUFAs intake. Similarly a profile based on adipose tissue takes into account only thelatest variations of the fatty acid levels in the diet. The level of the erythrocyte membrane phospholipidsintegrates all these fluctuations over the preceding three months.
Concerning trace elements, total blood and urine constitute the most appropriate biomarkers forevaluating the levels of individuals chronic exposure89 90 91 92 93.
Analysis of the biological samples
Lipids profiles were performed using 4 ml blood samples:
• Lipids profile (total cholesterol, HDL cholesterol, LDL cholesterol and triglycerides) based on serumusing the classic analysis methods of medical laboratories.
• Fatty acids profile on the pellet fraction of the erythrocyte membrane phospholipids, notably long-chain PUFAs: EPA (eicosapentaenoic acid) and DHA (docosahexaenoic acid).
A g re e m e n t D e s i s t a n c e S a m p l i n g among A g eF e m a l e s M a l e s
Le Havre 1 0 3 1 5 8 4 6 6 1 8 44 ± 15 y
L o r i e n t 1 2 6 1 3 1 1 5 9 1 2 4 46 ± 14 y
La Rochelle 1 1 9 2 5 1 0 0 5 7 4 3 47 ± 14 y
To u l o n 1 2 9 3 0 9 5 7 5 2 0 44 ± 13 y
To t a l 4 7 7 8 3 3 9 4 2 8 9 1 0 5
88 Weill P., Schmitt B., Chesneau G., Daniel N., Safraou F. and Legrand P. Effects of introducing linseed in livestock diet on blood fatty acid com-position of consumers of animal products. Ann. Nutr. Metab. 46 : 182-191. 2002.
89 WHO/IPCS. Biomarkers and risk assessment : Concepts and Principles. Environmental Health Criteria 155. Geneva. 1993.
90 WHO/IPCS. Environmental Health Criteria 224. Arsenic and arsenic compounds. Geneva. 2001.
91 WHO/IPCS. Biomarkers and risk assessment : Validity and validation. Environmental Health Criteria 222. Geneva. 2001.
92 Kido T., Sunaga K., Nishijo M., Nakagawa H., Kobayashi E. and Nogawa K. The relation of individual cadmium concentration in urine withtotal cadmium intake in Kakehashi River basin, Japan. Toxicol. Letters. 152 : 57-61. 2004.
93 Sanzo J.M., Dorro n s o ro M., Amiano P., Amurrio A., Aguinagalde F.X., Azpiri M.A. and the EPIC group of Spain. Estimation and validation ofm e rcury intake associated with fish consumption in an EPIC cohort of Spain. Public Health Nutr. 4(5) : 981-988. 2001.
POISSON 4.3 GB.qxd 17.9.2006 20:17 Page 27

28 FIRST PART - Methodology and general presentation
Fatty acidsThe fatty acid profile of erythrocytes was performed on the blood collected in heparin tubes andimmediately centrifuged (3,500 g, 10 min., 4°C) after elimination of the plasma. The erythrocytes werefrozen at -80°C.
The erythrocyte lipids were first extracted9 4. After evaporation of the solvents, the total lipids weresaponified then esterified. The methylic esters were extracted then separated and quantified by gasphase chromatography coupled to a flame ionisation detector. The identification of the methylic estersof fatty acids is based on the retention times obtained for standard methylic esters.
Trace elementsThe trace elements analyses were based on total blood and urine.
The total lead, mercury, cadmium and arsenic were determined by Inductively Coupled Plasma-MassSpectrometry (ICP-MS), a sensitive, multi-element detection system. To ensure optimal reliability of theblood analysis results, the lead, cadmium and mercury were measured by two different laboratories onall the samples taken. The lead, cadmium and total arsenic were measured in the urine samples. Thelaboratories' detection limits for these trace elements are presented in Table 10.
The speciation of arsenic was performed on a hundred samples presenting the highest total arsenicconcentration (>75 µg/g creatinine). The inorganic arsenic, the most toxic forms, was measured afterelimination of the AsB and AsC by extraction in liquid-liquid phase. The remaining arsenic, inorganic As,As(III) and As(V) and their intermediate mono- and dimethylated derivatives, MMA and DMA of degreeV was determined by graphite furnace atomic absorption spectroscopy using Zeeman effect backgroundc o r r e c t i o n .
Table 10: Standards and analytical limits for trace elements 95 :
Trace element Biological Limit of Limit of S t a n d a rd *m a t r i c e d e t e c t i o n q u a n t i f i c a t i o n
Lead (Pb) Total blood 0.2-0.3 µg/L 0.7-10 µg/L <90 µg/L total blood (man)<70 µg/L (woman)
U r i n e 0.15 µg/L 0.5 µg/L <25 µg/g créatinineCadmium (Cd) total blood 0.03-0.3 µg/L 0.1-1 µg/L <2 µg/L (smoker)
<1 µg/L (no smoker)U r i n e 0.1 µg/L 0.5 µg/L <2 µg/g créatinine
M e rcury (Hg) Total blood 0.3 µg/L 1.0 µg/L <10 µg/LMethylmercury (MeHg) Total blood 0.3 µg/L 1.0 µg/LTotal Arsenic (As) U r i n e 1.3 µg/L 5 µg/LA r s e n i c f o r m s * * U r i n e 10 µg/L <10 µg/g créatinine
* correspond to the P95 for the general French population which is not professionally exposed** As(III), As(V), MMA (V) and DMA (V), considered as more toxic
94 Rioux V., Lemarchal P. and Legrand P. Myristic acid unlike palmitic acid, is rapidly metabolized in cultured rat hepatocytes. J. Nutr. Biochem.,1 1 : 198-207, 2001.
95 INRS. Biotox. www. i n r s . f r. Mise à jour en mai 2005
POISSON 4.3 GB.qxd 17.9.2006 20:17 Page 28
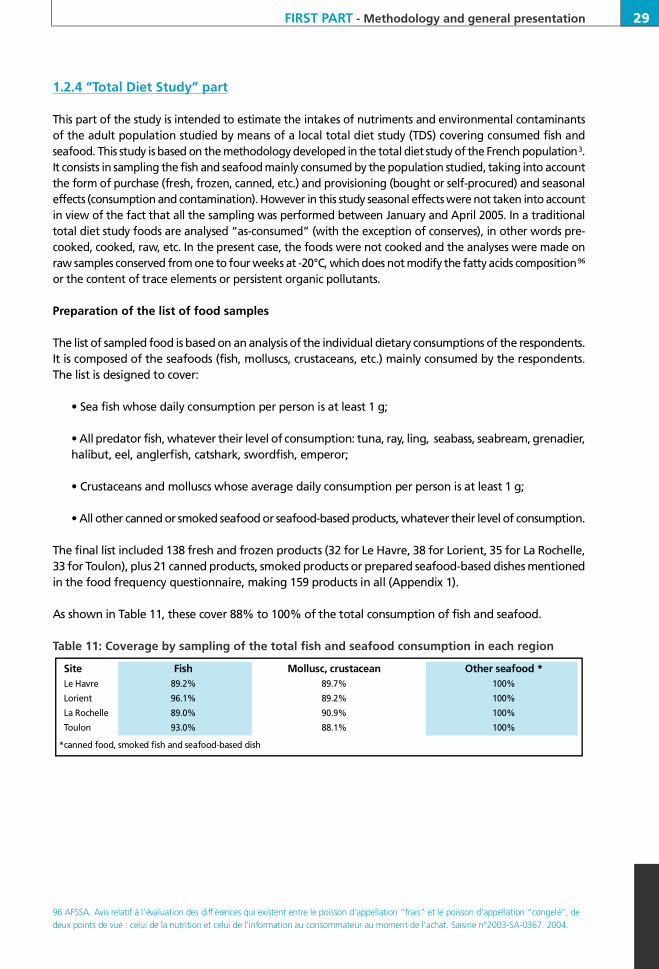
FIRST PART - Methodology and general presentation 29
1.2.4 “Total Diet Study” part
This part of the study is intended to estimate the intakes of nutriments and environmental contaminantsof the adult population studied by means of a local total diet study (TDS) covering consumed fish andseafood. This study is based on the methodology developed in the total diet study of the French population3.It consists in sampling the fish and seafood mainly consumed by the population studied, taking into accountthe form of purchase (fresh, frozen, canned, etc.) and provisioning (bought or self-procured) and seasonale ffects (consumption and contamination). However in this study seasonal effects were not taken into accountin view of the fact that all the sampling was performed between January and April 2005. In a traditionaltotal diet study foods are analysed “as-consumed” (with the exception of conserves), in other words pre-cooked, cooked, raw, etc. In the present case, the foods were not cooked and the analyses were made onraw samples conserved from one to four weeks at -20°C, which does not modify the fatty acids composition9 6
or the content of trace elements or persistent organic pollutants.
Preparation of the list of food samples
The list of sampled food is based on an analysis of the individual dietary consumptions of the respondents.It is composed of the seafoods (fish, molluscs, crustaceans, etc.) mainly consumed by the respondents.The list is designed to cover:
• Sea fish whose daily consumption per person is at least 1 g;
• All predator fish, whatever their level of consumption: tuna, ray, ling, seabass, seabream, grenadier,halibut, eel, anglerfish, catshark, swordfish, emperor;
• Crustaceans and molluscs whose average daily consumption per person is at least 1 g;
• All other canned or smoked seafood or seafood-based products, whatever their level of consumption.
The final list included 138 fresh and frozen products (32 for Le Havre, 38 for Lorient, 35 for La Rochelle,33 for Toulon), plus 21 canned products, smoked products or prepared seafood-based dishes mentionedin the food frequency questionnaire, making 159 products in all (Appendix 1).
As shown in Table 11, these cover 88% to 100% of the total consumption of fish and seafood.
Table 11: Coverage by sampling of the total fish and seafood consumption in each region
S i t e F i s h Mollusc, crustacean Other seafood *Le Havre 8 9 . 2 % 8 9 . 7 % 1 0 0 %
L o r i e n t 9 6 . 1 % 8 9 . 2 % 1 0 0 %
La Rochelle 8 9 . 0 % 9 0 . 9 % 1 0 0 %
To u l o n 9 3 . 0 % 8 8 . 1 % 1 0 0 %
*canned food, smoked fish and seafood-based dish
96 AFSSA. Avis relatif à l’évaluation des diff é rences qui existent entre le poisson d’appellation “frais” et le poisson d’appellation “congelé”, dedeux points de vue : celui de la nutrition et celui de l’information au consommateur au moment de l’achat. Saisine n°2003-SA-0367. 2004.
POISSON 4.3 GB.qxd 17.9.2006 20:17 Page 29
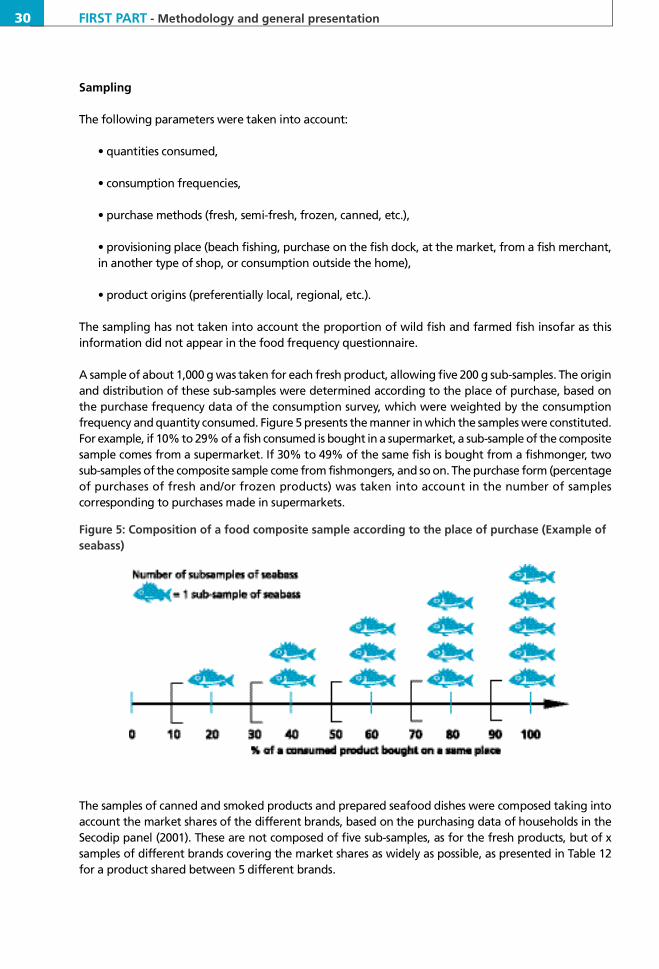
30 FIRST PART - Methodology and general presentation
Sampling
The following parameters were taken into account:
• quantities consumed,
• consumption frequencies,
• purchase methods (fresh, semi-fresh, frozen, canned, etc.),
• provisioning place (beach fishing, purchase on the fish dock, at the market, from a fish merchant,in another type of shop, or consumption outside the home),
• product origins (preferentially local, regional, etc.).
The sampling has not taken into account the proportion of wild fish and farmed fish insofar as thisinformation did not appear in the food frequency questionnaire.
A sample of about 1,000 g was taken for each fresh product, allowing five 200 g sub-samples. The originand distribution of these sub-samples were determined according to the place of purchase, based onthe purchase frequency data of the consumption survey, which were weighted by the consumptionfrequency and quantity consumed. Figure 5 presents the manner in which the samples were constituted.For example, if 10% to 29% of a fish consumed is bought in a supermarket, a sub-sample of the compositesample comes from a supermarket. If 30% to 49% of the same fish is bought from a fishmonger, twosub-samples of the composite sample come from fishmongers, and so on. The purchase form (percentageof purchases of fresh and/or frozen products) was taken into account in the number of samplescorresponding to purchases made in supermarkets.
Figure 5: Composition of a food composite sample according to the place of purchase (Example ofseabass)
The samples of canned and smoked products and prepared seafood dishes were composed taking intoaccount the market shares of the different brands, based on the purchasing data of households in theSecodip panel (2001). These are not composed of five sub-samples, as for the fresh products, but of xsamples of different brands covering the market shares as widely as possible, as presented in Table 12for a product shared between 5 different brands.
POISSON 4.3 GB.qxd 17.9.2006 20:17 Page 30

FIRST PART - Methodology and general presentation 31
Table 12: Illustration of the representative sampling for a product
Taking into account the effective presence of products on the market, the market coverage was 37%to 80.4% for canned products, 42.9% to 91.5% for smoked products and 50.3% to 72.3% for otherproducts (prepared seafood-based dishes).
For each product in the list, the 5 sub-samples were mixed, ground and remixed to obtain a singlehomogeneous composite sample of the product. The sub-samples were composed only of the comestibleparts of the products. More precisely, fish were filleted and skinned (notably the smoked fish). The cannedfoods were drained, particularly when they contained oil; for shellfish only the soft content was ground(plus the coral in the case of scallops); crustaceans were peeled in order to sample only the flesh (notablylegs and claws of crabs and lobsters); mollusc and crustacean samples were composed of raw and/orcooked sub-samples.
The use of intermediate recipients was not allowed during the preparation of the samples. The mixingequipment used was made of stainless steel (K55 Dito Cutter/Mixer). In compliance with good laboratorypractices, the hardware used to prepare the composite samples was thoroughly washed (RBS.25 detergent)between each preparation in order to avoid cross-contamination between samples.
After preparation, the samples were stored at -20°C in suitable containers until the time of analysis. Thisstorage temperature was maintained throughout the transportation of the samples to the analyticall a b o r a t o r i e s .
Analysis of the food samples
The analyses involved both nutritional and toxic elements in the products sampled. Concerning the toxicelements, the measurements concerned total lead, cadmium, arsenic and mercury, the various forms ofspeciation of arsenic (As(III), As(V), MMA, DMA, AsB), of mercury (methylmercury) and of organostanniccompounds (monobutyltin (MBT), dibutyltin (DBT), tributyltin (TBT), monophenyltin (MPT), diphenyltin(DPT), triphenyltin (TPT), monooctyltin (MOT), dioctyltin (DOT) and trioctyltin (TOT)), and persistentorganic pollutants (POPs): 17 dioxins and furans, 12 dioxin-like PCBs, 7 indicator PCBs and 7 PBDEs, mostof them found (28, 47, 99, 100, 153, 154, 183).
The same samples were also analysed for saturated, monounsaturated and polyunsaturated fatty acids(48 fatty acids in all).
B r a n d Found on the market Market share % in sampleA Ye s 4 0 % 5 0 . 0 %B Ye s 3 0 % 3 7 . 5 %C N o 1 0 % -D Ye s 1 0 % 1 2 . 5 %E N o 1 0 % -To t a l 1 0 0 % 1 0 0 %
POISSON 4.3 GB.qxd 17.9.2006 20:17 Page 31

32 FIRST PART - Methodology and general presentation
97 Marchand P., Matayron G., Gadé C., Le Bizec B. et André F. PCDD/F, dioxin-like and markers PCBs in trouts from French aquaculture .Organohalogen Compounds, vol 66.
Table 13 shows the detection limits (LOD) and quantification limits (LOQ) of the various analyses.
Fatty acids The principle consists in extracting, purifying and esterifying the free fat in the samples according to theAFNOR NF V04-403 standard. After drying the sample, the fat is extracted, filtered through a column,then weighed and esterified. The esters are analysed using a gas phase chromatograph equipped witha flame ionisation detector. The identification of the esters in fatty acids is based on the retention timesobtained for standard esters. The concentrations, calculated relative to a standard, are based on theareas of the corresponding peaks.
Trace elementsThe trace elements in the food matrices were measured by ICP-MS. Sixteen replicas were analysed. Thespeciation of mercury (methylmercury) was performed by coupling gas phase chromatography and ICP-MS, and that of arsenic (AsB, MMA, DMA, As(III) and As(V)) by coupling liquid phase chromatographyand ICP-MS. The compounds MMA and DMA detected in the tissue of fish and seafood are of redoxpotential V. The organostannic compounds were analysed by gas phase chromatography coupled witha microwave-induced plasma and an atomic emission detector.
Persistent organic pollutantsThe samples are first lyophilised then ground. For the analysis of the dioxin congeners, furans, DL-PCBs,i-PCBs and PBDEs, markers preimplanted with 1 3C are added before extraction. The fat is then extractedby accelerated solvent extraction (ASE) using a toluene/acetone mixture under high pressure andtemperature (P=100 bar, T=120°C)97 . The solvents are evaporated in order to determine the quantity offat extracted. The extract is finally purified in three successive open chromatographic columns.
After these fat extraction and purification steps, a quantification standard is added in order to evaluatethe recovery yields.
The four fractions obtained corresponding to each of the pollutant classes are analysed by gas phasechromatography coupled to a high-resolution mass spectrometer (GC-HRMS).
POISSON 4.3 GB.qxd 17.9.2006 20:17 Page 32

FIRST PART - Methodology and general presentation 33
Table 13: Analytical limits for fatty acids, trace elements and persistent organic pollutants infood samples
1.3 Presentation and interpretation of the results
The results are described in five parts. The first treats the results of the fish and seafood consumptions u r v e y, the second the composition in nutriments and contamination in contaminants of these sameproducts, the third the nutritional intakes and exposure to contaminants. Two methodological approachesof evaluation of nutriment intakes and exposure to contaminants are presented, first a so-called “direct”or “biomarkers of exposure” approach, then an “indirect” or “food exposure” approach. The fourthpart presents the perception of risks by participating consumers, and the fifth part presents some generalremarks for discussion.
In the sections entitled “Seafood composition and contamination” and “Nutritional intakes and exposureto contaminants” the following substances are treated successively: fatty acids, trace elements andpersistent organic pollutants.
1.3.1 Estimation of consumptions and concentrations
Concerning fish and seafood consumption, the results are presented in the form of three national tables,the first one for fish, the second for molluscs and crustaceans, and the last one for other seafood (canned,smoked, prepared dishes). Each table describes the average quantities consumed, the 95th percentile ofconsumption and the consumption rate (the % of consumers consuming a given product), for eachproduct and each group of individuals (male adults, female adults, women of child-bearing age andpeople over 65 years old).
Limit of detection Limit of quantification Fatty acids (mg/g lipid) - 1Trace elements (µg/g fresh weight)Lead (Pb) 0 . 0 0 0 4 0 . 0 0 1Cadmium (Cd) 0 . 0 0 0 4 0 . 0 0 1M e rcury (Hg) 0 . 0 0 0 8 0 . 0 0 3
M e H g 0 . 0 0 0 7 0 . 0 0 2Arsenic (As) 0 . 0 0 2 0 . 0 0 5
A s B 0 . 0 0 5 0 . 0 0 2A s ( I I I ) 0 . 0 0 2 0 . 0 0 8D M A 0 . 0 0 2 0 . 0 0 8M M A 0 . 0 0 7 0 . 0 2A s ( V ) 0 . 0 1 0 . 0 3
O r g a n o t i nM B T 0 . 0 0 0 2 0 . 0 0 0 5D B T 0 . 0 0 0 1 0 . 0 0 0 4T B T 0 . 0 0 0 0 8 0 . 0 0 0 3M P T 0 . 0 0 0 2 0 . 0 0 0 8D P T 0 . 0 0 0 2 0 . 0 0 0 5T P T 0 . 0 0 0 2 0 . 0 0 0 5M O T 0 . 0 0 0 2 0 . 0 0 0 5D O T 0 . 0 0 0 2 0 . 0 0 0 8T O T 0 . 0 0 0 2 0 . 0 0 0 8
Persistent organic pollutants (pgTEQW H O/g fresh weight - ng/g fw)P C D D - -P C D F - -P C B - D L - -i P C B 0 . 0 0 1 0 . 0 0 1P B D E 0 . 0 0 1 0 . 0 0 1
POISSON 4.3 GB.qxd 17.9.2006 20:17 Page 33

34 FIRST PART - Methodology and general presentation
Concerning the composition of the products, and as in the “consumption” part of the study the resultsare presented in the form of three national tables: one for each category of foods. Each table describesthe average quantities of each element analysed in the food samples listed in alphabetic order. The totallipids (total and unsaponifiable fatty acids) expressed in g/100 g corresponds to an average of two analyseson the same samples, but made two different laboratories using two methods (NF V04-403 standardand accelerated extraction by solvents). The unsaponifiable parts not having been analysed, the levelswere deduced from the literature when possible (USDA database for the common species). For fish notcovered by the literature, the unsaponifiable levels were estimated as recommended by the FAO andapplied by the CIQUAL98 . For molluscs, crustaceans and other products the average unsaponifiable levelswere estimated from values found in the literature.
The consumption data are expressed in g/week, the fatty acid levels in mg/100 g of food, the traceelements in µg/g of food, and the persistent organic pollutants in pg TEQW H O/g of food for dioxins, furansand DL-PCBs and in ng/g of food for i-PCBs and PBDEs.
1.3.2 Estimation of missing or censured data
Missing composition data for the products not sampled in the study zones were completed on a case-by-case basis. In some cases, a data item missing in one zone was replaced by the average of the dataavailable for the other zones. In others cases a product was not sampled at all (not found on the marketsat the time of sampling or very little consumed) so no measurement could be made (7 fish and 12 molluscsor crustaceans). The fatty acid level was then estimated either by exploiting information available in thenational and/or international literature or by applying the calculated average for products of the samef a m i l y, class or order.
The trace elements that were undetectable (<LOD) or unquantified (<LOQ) were taken to be equal tohalf these limits, in line with international recommendations9 9. For the persistent organic pollutants,since it is generally accepted that at high resolution (GC-HRMS) the LOD is equal to the LOQ, half theLOD was taken for undetectable concentrations. For the censured fatty acid measurements, the levelswere not taken into consideration.
1.3.3 Estimation of fatty acids and contaminants intakes
Food exposure (Indirect approach)
The average intakes of fatty acids and contaminants were calculated by crossing the individual consumptiondata from the food consumption survey with the individual composition and/or contamination dataobtained by analysis of the representative food samples in the consumption/provisioning sets selectedin each study zone. The estimation of these intakes takes into account a coverage exceeding 90% of theindividual consumptions of fish and seafood declared by the populations studied in each of the fourzones (Table 11).
The fatty acid intakes via fish and seafood are expressed in mg/day; the trace element intakes are expressedin µg/kg bw/week; the persistent organic pollutants intakes are expressed in pg TEQW H O/kg bw/weekfor dioxins, furans and DL-PCBs or in ng/kg bw/day for i-PCBs and PBDEs.
98 Greenfield H. and Southgate D.A.T. Food composition data. Production, managements and use. Second edition. FAO. Rome 2003. Toe x p ress fatty acid levels in g/100 g of fatty acids from fatty acid levels in g/100 g of lipid, we use a corrective factor: 0.70 for lean fish (<1% oftotal lipid), 0.80 for semioily fish (1 to 5% of total lipid), 0.90 for oily fish (>5% of total lipid).
99 International Programme on Chemical Safety/Gems/Food Euro Workshop on reliable evaluation of low level contamination of food,Kulmbach, Federal Republic of Germany. May 1995.
POISSON 4.3 GB.qxd 17.9.2006 20:17 Page 34

FIRST PART - Methodology and general presentation 35
These results are presented in the form of a table for each region showing the average quantities andhigh quantiles (P95) of fatty acids and contaminants contained in food for the four groups of individuals(mean ± standard deviation, or SD). The exposure value for the high quantiles does not correspond tothe sum of the high quantiles of exposure of each group of foods taken into account since the highconsumers associated with each group are not the same. We should remember that the exposure iscalculated for each individual on the basis of his/her declared real body weight. Eighteen individuals outof the 1,011 respondents did not state their body weight, so this was taken to be the average weightof individuals of the same sex and age group.
M o r e o v e r, when necessary the text indicates the main vector(s) contributing to the total exposure and/ortoxicological reference value (TRV), expressed here as a poucentage, following the methodology offixing food standards as recommended by the Codex Alimentarius Committee on Food Additives andC o n t a m i n a n ts1 0 0.
biomarker of exposure (direct approach)
One table for each region describes for each group of individuals the average and high-quantile (P95)results of the levels of biological exposure of the 394 subjects of the study, for fatty acids measured inthe erythrocytes, and for trace elements in urine and blood.
Fatty acid and trace element levels that were undetectable (<LOD) or unquantified (<LOQ) were takento be equal to the half these limits. The composition of the fatty acid profile of the erythrocytes isexpressed as a percentage of the total lipids. The trace element concentration is expressed in µg/L forblood or in µg/L or µg/g creatinine for urine.
Characterisation of risks/benefits
This final stage of the risk evaluation aims to describe the breakdowns of intakes or biomarker and tocompare the average level, the P95 and even the P97.5 of the exposed population with referencenutritional or toxicological values established by national, European or international expert scientificcommittees (AFSSA, EFSA, JECFA). The results obtained are expressed as equivalents or as contributionto the reference values.
Unlike the food exposure approach which in this study concerned only the contribution of fish andseafood products but not other foods, the biomarker approach enables us to characterise the real levelsof omega 3 and contaminant biological exposure of populations. In theory it therefore offers a suitablerisk/benefit approach for fish and seafood consumption. However a prerequisite is the availability of acommon physiological target for which beneficial and adverse effects have been described and linkedto an effect or state of health of a population studied. The comparison of these two information sourcesis indispensable for an objective analysis in this type of approach. In reality, from a methodological pointof view the scientific approach is complex and necessitates further in-depth work later.
At this stage, only a descriptive analysis of the benefits of daily consumption of omega 3 as regardscardiovascular diseases and an analysis of the risks of daily intake of methylmercury was performed,based on existing recommendations and published epidemiological data, but without correlating theimpact on the health of our population. To do this, we start from the assumption that beneficial nutritional
100 Joint FAO/WHO Food standards programme, Codex Alimentarius Commission (CCFAC), CCFAC policy for exposure assessment of conta-minants and toxins in foods or food groups adopted, procedural manual, 15é m e edition, Rome 2005
POISSON 4.3 GB.qxd 17.9.2006 20:17 Page 35

36 FIRST PART - Methodology and general presentation
e ffects may appear in individuals whose omega 3 intakes conform to the recommendations and that,i n v e r s e l y, toxicological effects may appear in individuals whose exposures exceed the reference toxicologicalvalues. A quantification of these risk/benefit effects in relation to fish and seafood consumption is therebyobtained empirically simply by estimating the number of individuals that match the nutritionalrecommendations and those that exceed the reference toxicological values.
M o r e o v e r, to better explain or explore any differences in dietary habits, in the composition of theprovisionings, in the estimated intakes of nutriments and contaminants and in biological levels, a statisticalanalysis was performed between the regions. Additionally, correlations were calculated between thed i fferent variables, fatty acid intakes, exposure to contaminants evaluated by the indirect approach andthe direct approach and also using socio-demographic variables using SAS.7 in order to validate theselected exposure markers from a methodological point of view.
Interpretation of the results
It is necessary here to make some important remarks regarding the interpretation of the results:
• The use of the average concentration of composition or contamination in the indirect approachrepresents a realistic and appropriate estimation of the long-term omega 3 intakes and exposure tocontaminants from fish and seafood products in that these data are based on representative sets ofconsumptions and provisionings of the populations studied in the four zones, and also in that thesedata are compared with reference lifelong nutritional and toxicological levels established by Europeanor international scientific committees1 0 1.
• Toxicologists generally agree that as regards chronic toxic effects, occasional exposure exceedingthe reference toxicological values for short periods of the life of an individual does not necessarilyinduce a significant human health risk due to the fact that the toxicological reference values (TRV )contain a safety margin1 0 2.
• Nutritionists generally agree that omega 3 fatty acids have a beneficial effect on prevention ofCVDs and development of the cerebral nervous system. Nevertheless at present the respectiveinvolvement of eicosapentaenoic acid (EPA) and docosahexaenoic acid (DHA) LC-PUFAs is debatable.In France the ratio of the precursors of omega 6 and omega 3, linoleic acid (LA) / alpha-linolenic acid(ALA), is recommended to tend to 5 in adults. The recommended daily intakes vary depending onscientific authority. In France the recommended daily intakes are 2 g ALA and 500 mg n-3 and n-6L C - P U FAs including 120 mg DHA15 a. At international level, the International Society for the Study ofFatty Acids and Lipids (ISSFAL) recommends a minimal daily intake of 500 mg n-3 LC-PUFAs (EPA andDHA) concerning the prevention of CVDs1 0 3.
• Epidemiologists generally agree that validated exposure biomarkers constitute good indicators ofthe total long-term dietary (or other) exposure of individuals and are consequently valid indicatorsfor interpreting the level of toxicological risk or nutritional benefit to which consumers are exposed.
101 FAO/WHO. Food consumption and exposure assessment of chemicals Geneva: WHO, Offset publication n° 97. 1997.
102 ILSI Europe, Significance of Excursions of intake above the Acceptable Daily Intake (ADI), Report of a workshop held in April 1998.a ANC, 2001. Recommended daily intake in adult male for a total energy intake of 2200 kcal/day, i.e. 0.8% of the total energy intake (TEI) forALA, 0.2% of the TEI for omega 3 and 6, and 0.05% of the TEI for DHA. A discussion has been opened in France on an update of this values.
103 International Society for the study of Fatty Acids and Lipids. Report of the Sub-Committee on commendations for intake of PUFA in heal-thy adults. Issfal Newsletter. June 2004.
POISSON 4.3 GB.qxd 17.9.2006 20:17 Page 36

FIRST PART - Methodology and general presentation 37
M o r e o v e r, it is important to bear in mind that this study is representative of the methodology appliedand that there is some “background noise” in exposures of dietary origin of high fish and seafoodconsumers in the four coastal areas. Consequently, a priori it does not take into account special situationsof overexposure, for example due to possible local environmental sources of contaminated food (e.g.consumers who do not respect interdiction of beach fishing) or to atypical consumer behaviour (e.g.intake of food supplements).
F i n a l l y, in view of our adoption of a composite food sampling approach (Total Diet Study method), oneshould bear in mind that the comparative statistics calculated on the composition or contamination offood and for which trends are observed, not significant differences, necessitate complementaryinvestigations in view of the relative smallness of our sampling compared to statistical sampling ofmonitoring plan type.
POISSON 4.3 GB.qxd 17.9.2006 20:17 Page 37

38 SECOND PART - Fish and seafood consumption
SECONDPART
Fish and seafoodconsumption
POISSON 4.3 GB.qxd 17.9.2006 20:18 Page 38

SECOND PART - Fish and seafood consumption 39
Seafood consumption by high consumers
On examination of the results relating to weekly seafood consumption, and despite our verifications ofthe completed questionnaires, some data appeared absurd. It therefore appeared reasonable to eliminateindividuals consuming more than 5 kg of seafood per week (corresponding to a consumption of 714 gper day or 357 g per meal) and individuals consuming less than 200 g of seafood per week (29 g perday), since these are not representative of high seafood consumption. In all 15 individuals were excludedfor this reason.
C o n s e q u e n t l y, the results concerning the seafood consumption are presented for 996 individuals.
For the questions relating to provisioning habits or perception of food risks, the calculations include theentire sample of 1,011 individuals.
2.1.1 Fresh and frozen fish
National level (4 zones)
We were able to verify that the selected consumers were indeed high seafood consumers. The averageconsumption of fresh and frozen fish (excluding conserved or smoked products) was found to be633 g/week, or 90 g/day in men aged 18 to 64 years with a 95th percentile of 1,491 g (Table 14). Forwomen in the same age group the average is 637 g/week, or 91 g/day, with a 95th percentile of1,522 g/week. Finally, the average consumption of subjects over 65 years old is 788 g/week, or 112 g/day,with a 95th percentile of 1,783 g/week.
In all the zones and all the population groups (male adults, female adults and elderly people) cod is thefish most consumed, not only in terms of quantity but also in percentage of consumers: the averagequantity consumed is about 93 g/week, and the consumer rate is between 81% and 88%. Women ofchild-bearing age conform to the same trend as female adults, but with an even higher consumer rate.
Salmon, saithe and sole are also among the most consumed fish. Women consume more salmon andsaithe (67 and 59 g/week) than men (56 and 54 g/week) and elderly people (57 and 50 g/week). On theother hand, for the latter group sole is the second most consumed fish (63 g/week) while it is only fourthin the other groups (50 g/week for men and 35 g/week for women).
Apart from these four fish, the distribution of the consumed species differs between groups. For example,elderly people consume much more herring than the other groups (32 g/week versus 8 g and 9 g/weekfor male and female adults, respectively). Elderly people also consume more ray (42 g/week versus 25and 26 g/week for under-65 men and women, respectively), with a consumers rate of around 56%.
Regional level
The regional differences are presented in Figure 6. Generally, male adults in Le Havre consume significantlyless fish than those in Lorient (p<0.01) and La Rochelle (p<0.05). The average fish consumption in Lorientis also higher than that in Toulon for this same age group (p<0.05). In the other groups, no diff e r e n c ein fish consumption was observed between the different zones.
POISSON 4.3 GB.qxd 17.9.2006 20:18 Page 39

40 SECOND PART - Fish and seafood consumption
POISSON 4.3 GB.qxd 17.9.2006 20:18 Page 40

SECOND PART - Fish and seafood consumption 41
Figure 6: Mean consumptions of fish per zone, age group and sex (g/week)
2.1.2 Molluscs and crustaceans
National level (4 zones)
The average consumption of molluscs and crustaceans is 270 g per week for men aged 18 to 64, witha 95th percentile of 703 g; 260 g for women in the same age group, with a 95th percentile of 665 g;279 g for people over 65, with a 95th percentile of 649 g (Table 15).
In male adults, the highest average consumption is of oysters, shrimps and great scallops, withrespectively 41 g, 36 g and 34 g per week. Shrimps have the highest consumers rate of the three (92%versus 70% for great scallops and 67% for oysters). Mussels are also very widely consumed: 88% ofall men aged 18 to 44 years say they consume on average 23 g per week.
Among women in the same age group, shrimps, great scallops, oysters and mussels are the mostconsumed seafood, with respectively 42 g, 40 g, 28 g and 22 g per week. Shrimps and mussels havethe highest consumers rates (92% and 86% respectively).
POISSON 4.3 GB.qxd 17.9.2006 20:18 Page 41

42 SECOND PART - Fish and seafood consumption
Women consumers aged 18 to 44 years (i.e. women of child-bearing age) display the same trends bothin terms of average consumption (235 g per week, with a 95th percentile of 607 g) and similar ofmolluscs and crustaceans consumption profiles.
Among elderly people, oysters and great scallops (51 g and 43 g per week) stand out from othercrustaceans and molluscs. Shrimps and mussels, consumed less than oysters (37 g and 24 g respectively)are consumed by more individuals (85% and 88% respectively).
POISSON 4.3 GB.qxd 17.9.2006 20:18 Page 42

SECOND PART - Fish and seafood consumption 43
POISSON 4.3 GB.qxd 17.9.2006 20:18 Page 43

44 SECOND PART - Fish and seafood consumption
Regional level
Concerning the geographic differences, the people in La Rochelle consume more molluscs and crustaceans(Figure 7). The average consumption of adult women in this town is significantly different from that inLe Havre (p<0.05) and Toulon (p<0.01). People in Lorient consume more crustaceans and molluscs thanthose in Toulon (p<0.05). For men in the same age group, those in La Rochelle consume significantlymore molluscs and crustaceans than those in Le Havre (p<0.05). Among the elderly, people in To u l o nconsume significantly less molluscs and crustaceans than those in La Rochelle and Lorient (p<0.05),
Figure 7: Mean consumptions of molluscs and crustaceans per zone, age group and sex(g/week)
POISSON 4.3 GB.qxd 17.9.2006 20:18 Page 44

SECOND PART - Fish and seafood consumption 45
2.1.3 Other seafood
National level (4 zones)
This category of products includes canned and smoked fish and the other seafood-based products. Theconsumptions of these foods must be interpreted with care since the recipes of products such as fishsoup and paella are very variable between individuals and commercial brands; their fish or crustaceancontent can diff e r. Table 16 includes the consumption of a few complete dishes without taking intoaccount the recipe or the proportion of seafood they contain. Consequently these data do not reliablyindicate the actual consumption of seafood and overestimate it
The weekly consumption of canned seafood is 125 g for men aged 18 to 64, 102 g for women of thesame age and 72 g for elderly people. Tuna is the most widely consumed canned product in all thegroups, except for elderly people whose average consumption of anchovy is almost the same as that oftuna (20 g/week for anchovy, 22 g/week for tuna). While the average consumptions of sardine andmackerel are lower, these are consumed by large numbers of people.
The weekly consumptions of smoked products by men, women and the elderly are 22 g, 19 g and 13 gr e s p e c t i v e l y. Salmon is the most-consumed smoked product with an average quantity of about 10 g/weekfor adult male and female and 7 g/week for the elderly.
Paella and fish soup are widely consumed in all the population groups, though with a marked preferencefor soup among elderly people.
POISSON 4.3 GB.qxd 17.9.2006 20:18 Page 45

46 SECOND PART - Fish and seafood consumption
POISSON 4.3 GB.qxd 17.9.2006 20:18 Page 46

SECOND PART - Fish and seafood consumption 47
Regional level
Significant differences between the average consumptions are observed between the study zones forall the groups studied. In particular the consumptions in Toulon are higher than in the other regions(Figure 8).
Figure 8: Mean consumptions of canned food, smoked fish and other seafood per zone, agegroup and sex (g/week)
2.2. Comparison of consumption data from the CALIPSO study and the Individual National Food Consumption Survey (INCA 99)
We compared the consumption data of fish, molluscs and crustaceans, smoked, canned or other products,taken from the INCA 99 survey and collected by means of a 7-day consumption diary with the resultsobtained in the present survey.
As often observed in this type of comparison, the values obtained by means of a food frequencyquestionnaire are greater than those obtained using a consumption diary, although we should rememberthat the CALIPSO survey concerned only high consumers, in other words those consuming seafoodproducts twice a week or more, which tends to amplify the observed differences. We therefore decidedto compare the results with the consumption data for seafood consumers alone.
The consumptions in the CALIPSO survey are about 2.5 times higher for consumption of fish, molluscsand crustaceans, and about 1.5 times higher for the other products. For the total consumption of theseproducts, a factor of about 3.5 is observed between the two studies, which demonstrates that the CALIPSOstudy's objective of targeting high fish and seafood consumers was effectively reached (Appendix 3a).
POISSON 4.3 GB.qxd 17.9.2006 20:18 Page 47
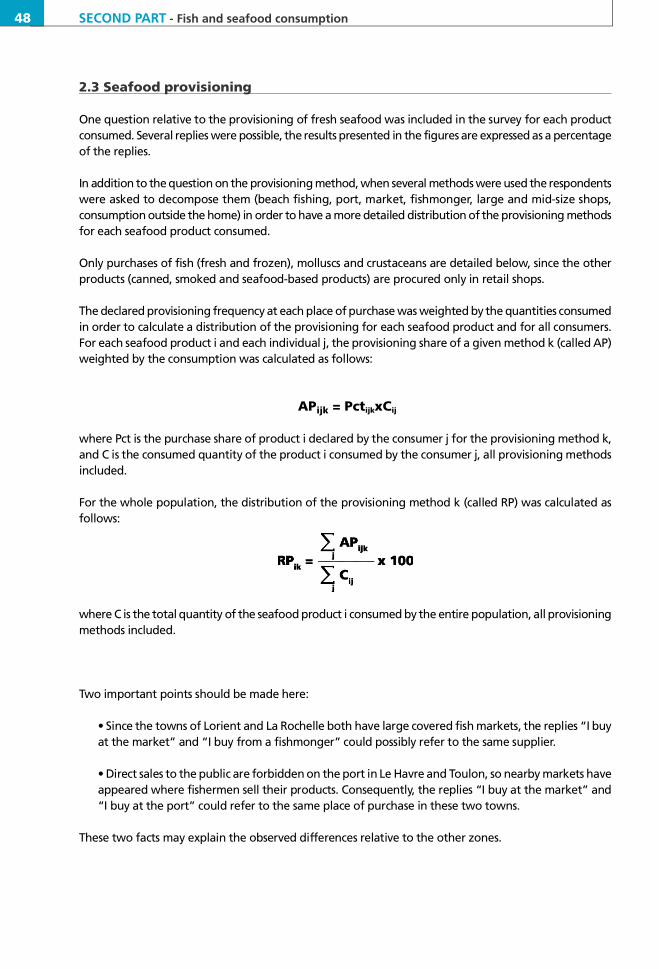
48 SECOND PART - Fish and seafood consumption
2.3 Seafood provisioning
One question relative to the provisioning of fresh seafood was included in the survey for each productconsumed. Several replies were possible, the results presented in the figures are expressed as a percentageof the replies.
In addition to the question on the provisioning method, when several methods were used the respondentswere asked to decompose them (beach fishing, port, market, fishmonger, large and mid-size shops,consumption outside the home) in order to have a more detailed distribution of the provisioning methodsfor each seafood product consumed.
Only purchases of fish (fresh and frozen), molluscs and crustaceans are detailed below, since the otherproducts (canned, smoked and seafood-based products) are procured only in retail shops.
The declared provisioning frequency at each place of purchase was weighted by the quantities consumedin order to calculate a distribution of the provisioning for each seafood product and for all consumers.For each seafood product i and each individual j, the provisioning share of a given method k (called AP)weighted by the consumption was calculated as follows:
APijk = PctijkxCij
where Pct is the purchase share of product i declared by the consumer j for the provisioning method k,and C is the consumed quantity of the product i consumed by the consumer j, all provisioning methodsi n c l u d e d .
For the whole population, the distribution of the provisioning method k (called RP) was calculated asf o l l o w s :
where C is the total quantity of the seafood product i consumed by the entire population, all provisioningmethods included.
Two important points should be made here:
• Since the towns of Lorient and La Rochelle both have large covered fish markets, the replies “I buyat the market” and “I buy from a fishmonger” could possibly refer to the same supplier.
• Direct sales to the public are forbidden on the port in Le Havre and Toulon, so nearby markets haveappeared where fishermen sell their products. Consequently, the replies “I buy at the market” and“I buy at the port” could refer to the same place of purchase in these two towns.
These two facts may explain the observed differences relative to the other zones.
POISSON 4.3 GB.qxd 17.9.2006 20:18 Page 48

SECOND PART - Fish and seafood consumption 49
2.3.1 Fresh and frozen fish
Figure 9 shows that, all species included, fresh and frozen fish is generally purchased in large stores(supermarket or hypermarket), in all the study zones, in particular in Le Havre and Hyères-Toulon wherethis provisioning method accounts for more than half of all purchases (61% and 54%, respectively).
In Lorient and La Rochelle, purchases from fishmongers and the market account for almost half of allpurchases, and large stores for one third.
Purchases on the port are mentioned by 10% of respondents in Le Havre and Lorient, 4% in La Rochelleand 3% in Hyères-Toulon. Very few people consume fish they have caught themselves; these are mostnumerous in the region of Lorient and La Rochelle (8% and 6% respectively).
Figure 9: Provisioning shares of fresh and frozen fish at different places of purchase in the 4zones (% of purchases)
POISSON 4.3 GB.qxd 17.9.2006 20:18 Page 49

50 SECOND PART - Fish and seafood consumption
POISSON 4.3 GB.qxd 17.9.2006 20:18 Page 50

SECOND PART - Fish and seafood consumption 51
2.3.2 Molluscs and crustaceans
Molluscs and crustaceans are bought more often in large stores (supermarket, hypermarket) in Le Havreand Hyères-Toulon (Figure 10): half or more of all provisioning is by this method. In these regions abouta quarter of all purchases are made at fishmongers. In the Mediterranean region, 14% of the respondentsconsume molluscs and crustaceans only outside their home.
In Lorient and La Rochelle almost 75% of total provisioning is via the market, fishmongers and largestores, although the distribution varies between the regions.
Provisioning by beach fishing is much more prominent in Lorient and La Rochelle (15% to 10% comparedto 3% to 5% in the other regions). However this remains a minority method.
POISSON 4.3 GB.qxd 17.9.2006 20:18 Page 51

52 SECOND PART - Fish and seafood consumption
Figure 10: Distribution of mollusc and crustacean provisioning in the 4 zones (% of purchases)
POISSON 4.3 GB.qxd 17.9.2006 20:18 Page 52

SECOND PART - Fish and seafood consumption 53
POISSON 4.3 GB.qxd 17.9.2006 20:18 Page 53

54 THIRD PART - Seafood composition and contamination
THIRDPART
Seafood compositionand contamination
POISSON 4.3 GB.qxd 17.9.2006 20:18 Page 54

THIRD PART - Seafood composition and contamination 55
3.1 Fatty acid composition
As described in the first part, 159 fish and seafood products sampled in the four study zones were analysedfor their fatty acids composition: 95 fish, 43 molluscs and crustaceans and 21 other products (canned,smoked and seafood-based products). Tables 17 to 19 present the results of the analysis of total lipids(in g/100 g) and fatty acids in these foods (in mg/100 g), averaged for the four regions, representing 30species of fish, 17 species of molluscs and crustaceans and 14 other products.
3.1.1 Fresh and frozen fish
Total Lipids : The fish containing most lipids are eel, salmon, swordfish and halibut, in all the regions,with respective average levels of 20.4, 13.5, 12.4 and 11.7 g of lipids for 100 g of fish (Table 17). Howeverthe lipids profile of eel must be interpreted with care since the composite sample came from a singlebatch imported from the Netherlands. Mackerel and sardine are also rich in lipids (7.1 and 5.7 g/100 g)but unlike the fish mentioned previously the levels are not homogeneous between the different zones.The composite sample of sardine in Toulon is particularly low in fat (0.8 g/100 g), as is the compositesample of mackerel in La Rochelle (2.3 g/100 g) (results not presented). These differences may be explainedby the difference of size observed during the sampling, a seasonal effect, different provisioning originsor a reproduction period dependent on the region. A regional effect may also explain the diff e r e n c eobserved for the sardine sample in Toulon given that this comprised 80% of Mediterranean sardines(diet, etc.).
Angler fish, pout and cod display the lowest fat levels: 0.2 to 0.3 g of lipids/100 g.
These results are consistent with the data of the national CIQUAL database 1 0 4.
L C - P U FAs : The fish richest in n-3 LC-PUFAs (EPA, DPA, DHA) are mainly the oiliest fish and also freshanchovy (3,241 mg/100 g including 1,365 mg DHA/100 g). Logically, the fish the least rich in n-3 LC-PUFAare the least oily: gurnard, angler fish and pout (46, 66 and 77 mg/100 g respectively), although somelow-oil fish are also found to be rich in n-3 LC-PUFAs, for example cod, whiting and pollack for whichrespectively 55%, 52% and 51% of fatty acids are n-3 LC-PUFAs, which are relatively high levels (resultsnot presented).
Data in the literature are absent or incomplete for two thirds of all fish104 105 106. For the majority ofproducts, our data (lipid level and lipids profile) are consistent with the literature. The differences whenthey exist may be explained by the large variability of the oil level in the fish flesh, this being dependenton the period of the year, age, size, sex, reproduction period, fishing zone or breeding method, thespecific species, food and even particularly large individual variability. Our results for fresh tuna forexample indicate a total lipids level of 0.73 g/100 g versus 6.2 g/100g in the CIQUAL database,15.5 g/100 g in the German database and 4.90 g/100g in the American database. This may be explainedby the provisioning period of the samples analysed (end of January to April) and by the provisioningmethods: tuna sold in France at this time of year are “fattened” tuna weighing 10 to 35 kg, not necessarilythe same as those analysed to constitute the French1 0 4, German1 0 5 and American1 0 6 d a t a b a s e s .
104 Data from the French database REGAL of the Informatics Centre for Food Quality of the French Food Safety Agency. Retrieved September 2005.
105 Souci S.W., Fachmann W. and Kraut H. Food composition and nutrition tables. 6th edition revised and completed. Medpharm ScientificPublishers, CRC Press, Boca Raton. 2000.
106 USDA-Agricultural re s e a rch service. USDA National nutrient database for standard re f e rence. http://www. a r s . u s d a . g o v
POISSON 4.3 GB.qxd 17.9.2006 20:18 Page 55

56 THIRD PART - Seafood composition and contamination
3.1.2 Molluscs and crustaceans
Total lipids : In general molluscs (Table 18) contain much less fat than fish (0.4 to 6.7g of lipids/100 g).Crustaceans have a higher lipids level than molluscs with 6.7 g/100 g for the common crab, 4.4 g/100 gfor the spider crab and 3.8 g/100 g for the swimcrab.
L C - P U FAs : Crustaceans are also richer than molluscs in n-3 LC-PUFAs and more particularly in DHA:714 mg/100 g for the common crab, for example. The molluscs with the least lipids are the cephalopods,in particular octopus (0.4 g/100 g) and cuttlefish (0.9 g/100 g).
There is little available composition data on this type of product in the French and international literature(9 products compared), but our results are consistent with the data in the CIQUAL1 0 4 and German1 0 5
d a t a b a s e s .
3.1.3 Other seafood
Total lipids : Concerning canned and smoked products and prepared seafood-based dishes, the lipid andfatty acid levels obtained are very variable (Table 19) despite our standardised preparation protocol ofthe comestible part, notably as regards draining. Mackerel (conserved in oil or smoked) has, as we mightexpect, the highest fat level (13.2 and 17.0 g of lipids/100 g).
L C - P U FAs : Once again the products the least rich in total lipids are not necessarily those the least richin omega 3: of the total fatty acids, we find 20% of DHA in fish soup, canned pilchard and smokedsalmon compared to 1.3% in tarama (which is very rich in total lipids - the results are not presented).
The results for these products must be interpreted with care. The total lipids level corresponds to the ave-rage of two analyses made on the same sample and the difference between the two levels could be asmuch as 21.4 g/100 g for tarama or 14.7 g/100 g for canned tuna. These differences, much smaller forfish, molluscs and crustaceans, can perhaps be explained by the difficulty of homogenising these pro-d u c t s .
Tuna, sardine and mackerel contain two to eight times more fat when they are canned (including conser-vation in oil) compared to fresh or frozen forms. For sardine and tuna, this difference may be partiallyexplained by the presence of oil in cans, despite draining during preparation of the samples or by dif-ferent fishing periods for canned and fresh product. We always used preparation methods as close aspossible to real consumption habits. Oleic (C18:1 n-9) and linolenic (C18:2 n-6) fatty acids, the most com-mon in many oils, appear in higher concentrations in canned products than in fresh ones. Moreover, inthe case of tuna the samples of fresh tuna were constituted only of red tuna whereas the samples of can-ned tuna (including the sub-samples of conserved in oil) are constituted of different species (yellowfin,albacore and skipjack). For mackerel, the differences in total lipids appear to be due to a concentrationof arachidonic acid (C20:4 n-6) ten times higher in the composite sample of canned mackerel (includingthe sub-samples conserved in oil) than in fresh fish, and a concentration of parinaric acid (C18:4 n-3) fourtimes higher in canned and smoked mackerel than in fresh mackerel. We are unable to explain thesed i ff e r e n c e s .
POISSON 4.3 GB.qxd 17.9.2006 20:18 Page 56

THIRD PART - Seafood composition and contamination 57
Smoked mackerel contains more fat (total lipids) than fresh mackerel. In this case the difference may bedue to cooking prior to smoking which could concentrate the lipids. Smoked mackerel is much richer inn-3 PUFAs, whether as a precursor (ALA) or as long-chain derivatives. Smoked mackerel is also richer insaturated fatty acids (C18:0 and C20:0). These differences are perhaps due to the different fishing zonesaccording to the final use of the product, direct consumption or transformation.
On the other hand, the compositions of fresh and smoked salmon are relatively close, a homogeneitythat is perhaps explained by the fact that cultivated salmon accounts for 90% of salmon consumptionin France, most of it coming from Norway 1 0 7. In addition, the salmon is smoked cold (25°C) without cooking,so there is no water loss and the fatty acids are not concentrated by the smoking.
3.1.4 Regional variations
There is no significant difference in the average compositions of fish in the different study zones in termsof the total lipidic composition or the level of LC-PUFAs omega 3. Similarly, there is no significant diff e r e n c ebetween the compositions of molluscs and crustaceans sampled in these zones.
107 OFIMER. Note thématique sur les marchés – Le marché du saumon. Février 2004. http://www. o f i m e r. f r
POISSON 4.3 GB.qxd 17.9.2006 20:18 Page 57
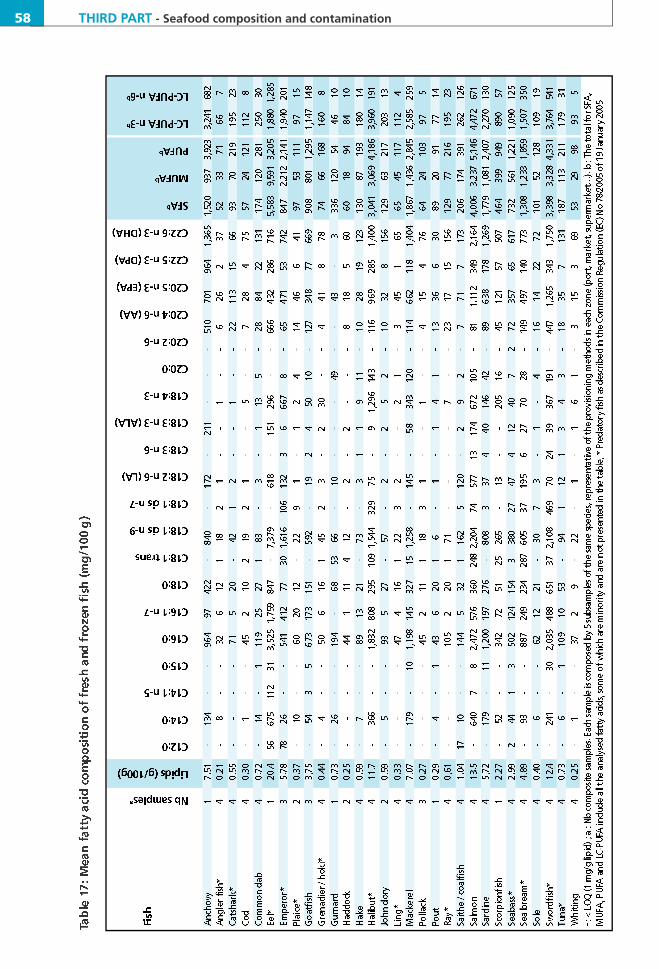
58 THIRD PART - Seafood composition and contamination
POISSON 4.3 GB.qxd 17.9.2006 20:18 Page 58

THIRD PART - Seafood composition and contamination 59
POISSON 4.3 GB.qxd 17.9.2006 20:18 Page 59

60 THIRD PART - Seafood composition and contamination
POISSON 4.3 GB.qxd 17.9.2006 20:18 Page 60

THIRD PART - Seafood composition and contamination 61
3.2 Contamination by trace elements
Table 20 indicates the proportion of censured data, in other words less than the detection limit (LOD).
For all the products sampled – fish, molluscs, crustaceans and other products – arsenic is present mainlyin the form arsenobetaine (organic arsenic) considered as non-toxic. The forms of speciation of inorganictoxic arsenics, As(III) and As(V), are in a minority, but the As(III) is detected in 91.2% of the sampleswhereas the As(V) never is. The total inorganic arsenic is therefore constituted mainly by the speciesAs(III) considered to be the most toxic.
The samples contain mainly butyltins along with some phenyltins. Apart from monooctyltin (MOT),detectable in 10% of the samples, the presence of octyltins is sporadic.
In all the foods, mercury is mainly found in its toxic methyl form, methylmercury.
F i n a l l y, more than 54% of the samples contain lead and cadmium in detectable quantities.
Table 20: Proportion of censured data (< LOD) in analysing the trace elements in foodsamples.
Tables 21 to 24 present the results of the trace elements (in µg/g fresh weight) in the sampled foods,averaged for the four regions.
3.2.1 Fresh and frozen fish
Arsenic : The species of fish containing the highest concentrations of total arsenic are bottom fish (plaice,pout, sole, goatfish, ray, common dab and catshark). Their levels are between 12 and 34 µg/g freshweight. Fish containing the highest levels of toxic inorganic arsenic (As(III) and As(V)) are pout, ray andgoatfish with respectively 0.077, 0.073 and 0.072 µg/g. The least contaminated by inorganic arsenic areeel with 0.009 µg/g, ling, grenadier and emperor with 0.012 µg/g. Inorganic arsenic in fresh and frozenfish represents 0.1% to 3.5% of total arsenic, which is consistent with the literature6 3. Our results areparticularly consistent with the British FSA study in October 20051 0 8.
Trace element % censured data (<LOD)
As total 0 . 0 0A s B 0 . 0 0M M A 8 5 . 5D M A 1 6 . 3A s ( I I I ) 8 . 8 0A s ( V ) 1 0 0
Hg total 0 . 0 0M e H g 0 . 0 0
Cd total 4 5 . 3Pb total 3 0 . 2O r g a n o t i n c o m p o u n d s
M B T 1 5 . 1D B T 1 0 . 7T B T 1 2 . 6M P T 4 9 . 1D P T 4 6 . 5T P T 5 2 . 2M O T 9 0 . 0D O T 9 9 . 4T O T 1 0 0
108 FSA. Arsenic in fish and shellfish. 2005. http://www. f o o d . g o v. u k /
POISSON 4.3 GB.qxd 17.9.2006 20:18 Page 61

62 THIRD PART - Seafood composition and contamination
M e rcury : As regards total mercury, the data shown in Table 21 are particularly consistent with the resultsof MAP monitoring plan1 0 9, for all species. Predator fish are found to contain the highest levels ofmethylmercury (MeHg): swordfish (0.94 µg/g), emperor (0.57 µg/g), tuna (0.33 µg/g) and eel (0.32 µg/g).These species also have the highest levels of total mercury, although they do not exceed the maximumauthorised limit of 1 mg/kg1 1 0, which is reassuring when we consider that our results are obtained fromcomposite samples. None of the non-predator species exceeds the maximum level of 0.5 mg/kg1 1 0. Thefish the least contaminated by MeHg are anchovy (0.020 µg/g), salmon (0.038 µg/g) and saithe(0.041 µg/g). MeHg represents 67% to 100% of the total mercury in fish, within the limits of measuringuncertainty of the two analysis techniques employed.
Cadmium : Some species have cadmium levels exceeding 0.30 µg/g, 0.10 µg/g or 0.05 µg/g, the maximumauthorised species to species110 : saithe (0.07 µg/g), swordfish (0.07 µg/g), and catshark with the highestobserved cadmium level (0.42 µg/g). These high average values are due to the exceptional contaminationof the composite sample from Le Havre (1.65 µg/g), the concentrations of the composite samples of thethree other zones do not exceed the maximal authorised level.
Lead : Halibut is the fish the most contaminated by lead (0.1 µg/g). However no species exceeds themaximum authorised limits (0.2 to 0.4 µg/g)1 1 0. Our data are generally consistent with the MAP monitoringp l a n s1 0 9, both for lead and cadmium, considering that many levels in these plans are less than the analyticallimits of our study.
Organic tin : Concerning the organostannic compounds (OTC), many of our data are censured: 11% to15% for the butyltin, 47% to 52% for the phenyltin and more than 90% for the octyltin. The fishpresenting the highest levels are halibut (0.023 µg/g) and swordfish (0.019 µg/g), all forms of organic tinincluded. These results are consistent with the data of the SCOOP task 3.2.13.6 5.
3.2.2 Molluscs and crustaceans
Arsenic : Octopus is the species with the highest level of total arsenic (42.3 µg/g), as shown in Table 22.However it should be underlined once again that we had only one composite sample (5 sub-samples)coming from the Toulon region. Otherwise crustaceans are found to be the most contaminated by arse-nic, with 37.2 µg/g for the spider crab and 16.8 µg/g for crabs including the common crab; these also havevery high levels of toxic inorganic arsenic (0.188 and 0.257 µg/g respectively). We also note a highinorganic arsenic level in Mediterranean sea urchins (0.222 µg/g). Unlike fish, the total arsenic andinorganic arsenic levels in our mollusc and crustacean samples exceed those found in the FSA study in2005, which is perhaps explained by different provisioning (local fishing, etc.).
M e rcury : Octopus and crab are also the species the most contaminated by mercury, in particular byMeHg (0.219 and 0.175 µg/g respectively). However none exceed the limit fixed at 0.5 µg Hg/g for fishproducts (excluding predator fish)1 1 0. The sea urchin is the least contaminated species, with less than0.003 µg MeHg/g.
Cadmium : The maximum authorised limits1 1 0 are exceeded by several species, in particular crab (4.1versus 0.5 µg/g), shrimp (1.1 versus 0.5 µg/g) and calico scallops (1.1 versus 1.0 µg/g). The other bivalvemolluscs display lower cadmium levels not exceeding 0.04 µg/g. These average contaminations are greaterthan the mean levels measured in the French monitoring plans: 0.46 µg/g for crab or 0.05 µg/g for shrimp.
109 Ministère de l’Agriculture et de la Pêche. DGAL. Résultats des plans de surveillance sur les produits de la mer de 1999 à 2004.
110 Commission Regulation (EC) No 78/2005 of 19 January 2005 amending Regulation (EC) No 466/2001 setting maximum levels for certaincontaminants in foodstuffs as re g a rds heavy metals.
POISSON 4.3 GB.qxd 17.9.2006 20:18 Page 62

THIRD PART - Seafood composition and contamination 63
These differences are due to high contamination of our composite crab sample in Lorient (12 µg/g versusless than 1 µg/g in the other sampling zones) and of our composite shrimp sample in Le Havre (4 µg/gversus less than 0.05 µg/g on the other zones).
Lead : None of the species sampled exceeds the maximum authorised limits1 1 0. For the common samples,in the case of both lead and cadmium our levels are generally lower than those found in the FSA study1 0 8.
Organic tin : The organic tin levels are relatively low with a lower maximum value than for fish (0.01µg/g for squid and swimcrab). As for fish, these results are consistent with the data found in the SCOOPtask 3.2.13.6 5
3.2.3 Other seafood
Among other seafood, the canned products are the most contaminated by trace elements (Table 23).We find total arsenic levels of 3.54 µg/g in canned sardine and 2.23 µg/g in canned crab; more particularly,for inorganic arsenic the average level is 0.07 µg/g for canned crab and pilchard. The same is true form e r c u r y, the maximum level being found in canned tuna (0.2 µg/g), but without exceeding the authorisedl i m i ts1 1 0.
On the other hand, canned or bottled anchovy and canned sardines reveal cadmium concentrationshigher than the authorised limits (0.35 and 0.22 µg/g versus 0.1 µg/g). However these results must beinterpreted with care in view of the homogenisation problems encountered during the sampling ofcanned products.
The other products, smoked fish or prepared seafood-based dishes, contain very low levels of tracee l e m e n t s .
F i n a l l y, the organic tin levels are equivalent to those measured in the composite samples of molluscs andcrustaceans (0.01 µg/g).
3.2.4 Regional variations
Despite the deliberate choice of zones contrasted by the existence of old local environmental pollution,no significant differences are found between the trace element contaminations measured in the diff e r e n tstudy zones, for all the trace elements except inorganic arsenic (Table 24). For the species common totwo zones, fish sampled in Lorient contain significantly more inorganic arsenic than fish in Toulon (p<0.05,significant differences not presented). They also appear to be more contaminated than fish sampled inLe Havre and La Rochelle, although the difference is not significant.
As regards molluscs and crustaceans, it appears that the samples from Le Havre are more contaminatedby organic tin than those in the other zones. However, this result must be interpreted with care in viewof the small number of samples (10 to 12 species or 40 to 48 sub-samples depending on the zone), thelarge number of censured data and the fact that the sampled species are different from one zone toanother (molluscs, crustaceans, etc.).
This absence of regional differences can be largely explained by the low representation of explicitly localorigins in the provisioning of seafood products mentioned earlier and by the general respect of localfishing interdictions when these exist.
POISSON 4.3 GB.qxd 17.9.2006 20:18 Page 63

64 THIRD PART - Seafood composition and contamination
POISSON 4.3 GB.qxd 17.9.2006 20:18 Page 64

THIRD PART - Seafood composition and contamination 65
POISSON 4.3 GB.qxd 17.9.2006 20:18 Page 65

66 THIRD PART - Seafood composition and contamination
POISSON 4.3 GB.qxd 17.9.2006 20:18 Page 66

THIRD PART - Seafood composition and contamination 67
POISSON 4.3 GB.qxd 17.9.2006 20:19 Page 67
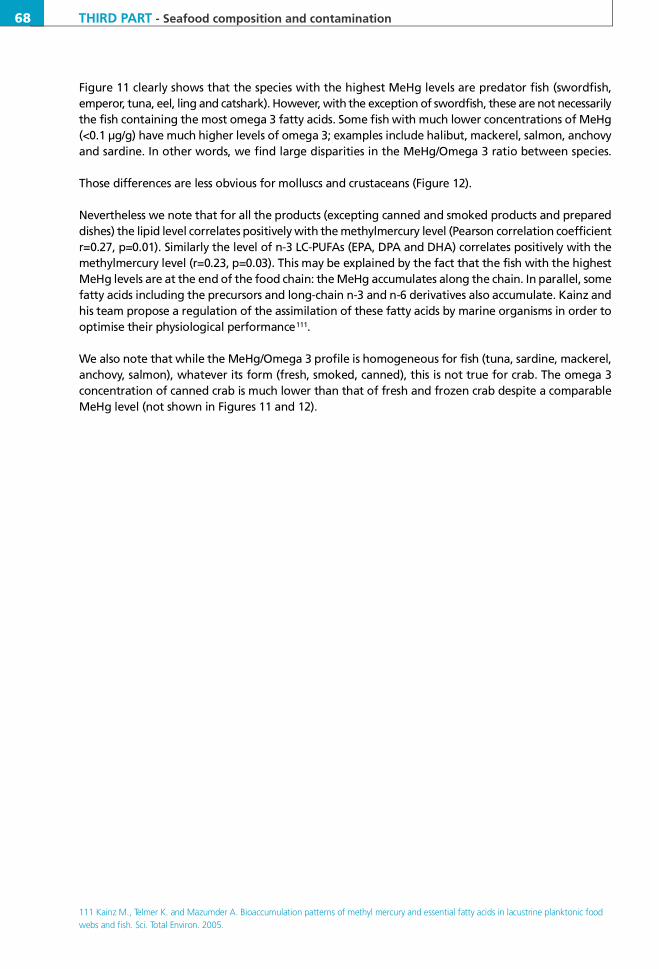
68 THIRD PART - Seafood composition and contamination
Figure 11 clearly shows that the species with the highest MeHg levels are predator fish (swordfish,e m p e r o r, tuna, eel, ling and catshark). However, with the exception of swordfish, these are not necessarilythe fish containing the most omega 3 fatty acids. Some fish with much lower concentrations of MeHg(<0.1 µg/g) have much higher levels of omega 3; examples include halibut, mackerel, salmon, anchovyand sardine. In other words, we find large disparities in the MeHg/Omega 3 ratio between species.
Those differences are less obvious for molluscs and crustaceans (Figure 12).
Nevertheless we note that for all the products (excepting canned and smoked products and prepareddishes) the lipid level correlates positively with the methylmercury level (Pearson correlation coeff i c i e n tr=0.27, p=0.01). Similarly the level of n-3 LC-PUFAs (EPA, DPA and DHA) correlates positively with themethylmercury level (r=0.23, p=0.03). This may be explained by the fact that the fish with the highestMeHg levels are at the end of the food chain: the MeHg accumulates along the chain. In parallel, somefatty acids including the precursors and long-chain n-3 and n-6 derivatives also accumulate. Kainz andhis team propose a regulation of the assimilation of these fatty acids by marine organisms in order tooptimise their physiological performance1 1 1.
We also note that while the MeHg/Omega 3 profile is homogeneous for fish (tuna, sardine, mackerel,a n c h o v y, salmon), whatever its form (fresh, smoked, canned), this is not true for crab. The omega 3concentration of canned crab is much lower than that of fresh and frozen crab despite a comparableMeHg level (not shown in Figures 11 and 12).
111 Kainz M., Telmer K. and Mazumder A. Bioaccumulation patterns of methyl mercury and essential fatty acids in lacustrine planktonic foodwebs and fish. Sci. Total Environ. 2005.
POISSON 4.3 GB.qxd 17.9.2006 20:19 Page 68

THIRD PART - Seafood composition and contamination 69
POISSON 4.3 GB.qxd 17.9.2006 20:19 Page 69

70 THIRD PART - Seafood composition and contamination
POISSON 4.3 GB.qxd 17.9.2006 20:19 Page 70

THIRD PART - Seafood composition and contamination 71
3.3 Contamination by persistent organic pollutants
Tables 25 to 28 present the results of the analyses of persistent organic pollutants in sampled food,averaged for the four regions.
3.3.1 Fresh and frozen fish
PCDD/F et PCB-DL : Table 25 shows that the fish the most contaminated by dioxins (PCDD/Fs) and dioxin-like polychlorobiphenyls (DL-PCBs) are eel (88.3 pg TEQW H O/g fresh weight) and sardine (10.6 pg TEQW H O/ gfresh weight). These are followed by the predators emperor fish and seabass with levels of 7.0 to3.9 pg TEQW H O/g fresh weight. The least contaminated fish are catshark, anglerfish, saithe and cod withless than 0.15 pg TEQW H O/g fresh weight.
These results are consistent with the DGAL1 0 9 monitoring plans and with the English data1 1 2.
The results for eel are subject to reservation in view of the composition and origin of the sample, asexplained earlier concerning the fatty acid composition. We note that this sample of eel exceeds theregulatory limit fixed for PCDD/Fs and DL-PCBs (12 pg TEQW H O/g fresh weight), as does the compositesample of sardine (limit fixed at 8 pg TEQW H O/g fresh weight). The other samples all have levels less thanthe limits (4 pg TEQW H O/g fresh weight for PCDD/Fs and 8 pg TEQW H O/g fresh weight for the total of thePCDD/Fs and DL-PCBs)1 1 3.
i-PCB : Eel and sardine are also the fish most heavy contaminated by “indicator polychlorobiphenyls”(i-PCB), with respectively 2,26 and 117 ng/g fresh weight. The i-PCBs being representative of the PCBscontamination, we find emperor, seabass and seabream in which the i-PCBs levels exceed 30 ng/g freshweight. The least contaminated fish are saithe and cod with values of 1.1 and 1.2 ng/g fresh weightr e s p e c t i v e l y. With the exception of the eel, these results are consistent with the DGAL109 m o n i t o r i n gplans. We recall that at present there is no regulation concerning the i-PCBs levels in fish and seafoodp r o d u c t s .
PBDE : The fish the most contaminated by polybromodiphenylethers (PBDE 28, 47, 99, 100, 153, 154,183) is again eel with an average of 26.6 ng/g fresh weight. This level is exceptional in that the otherfish have contamination levels of less than 3 ng/g. The PBDEs level increases with the fat content: mackerel,a n c h o v y, seabass, sardine and salmon all have moderately heavy high contaminations between 2 and3 ng/g fresh weight. The least contaminated fish is catshark with 0.3 ng/g fresh weight and less than 1%of lipids. The PBDEs contamination does not depend on whether the species is a predator or not. Theseresults are consistent with the JECFA data in 2005 on fish and seafood products1 1 4. As in the case ofi-PCBs, to date there is no regulation concerning PBDEs levels in fish and seafood.
112 FSA. Dioxins and dioxin-like PCBs in farmed and wild fish and shellfish. February 2006.
113 Commission Regulation (EC) No 199/2006 of 3 February 2006 amending Regulation (EC) No 466/2001 setting maximum levels for certaincontaminants in foodstuffs as re g a rds dioxins and dioxin-like PCBs.
114 JECFA. Safety evaluation of certain food additives and contaminants. 64th report of the Joint FAO/WHO Expert Committee on FoodAdditives and contaminants. WHO Geneva. 2005.
POISSON 4.3 GB.qxd 17.9.2006 20:19 Page 71
72 THIRD PART - Seafood composition and contamination
3.3.2 Molluscs and crustaceans
When the contamination is expressed relative to grams of fat, molluscs and crustaceans generally havelower levels of persistent organic pollutants than fish (results not presented), but when the contaminationis expressed relative to grams of fresh weight this difference (apart from eel) is less marked (Table 26).
PCDD/F and DL-PCB : The species most contaminated by PCDD/Fs and DL-PCBs are swimcrab with 18.6pg TEQW H O/g fresh weight and crab with 6.5 pg TEQW H O/g fresh weight. This can be partly explained bythe very heavy contamination of the crab and swimcrab samples from Le Havre. Moreover, the compositeswimcrab sample exceeds the regulatory limits for PCDD/Fs (4 pg TEQW H O/g fresh weight) and for PCDD/Fsand DL-PCBs (8 pg TEQW H O/g fresh weight)1 1 3. These species are followed by the spider crab with 5.6 pgT E QW H O/g fresh weight. The least contaminated species are shrimp and periwinkle with 0.1 pg TEQW H O/ gfresh weight.
i-PCB : Swimcrab, crab and spider crab also display the highest levels of i-PCB, with respectively 187, 58and 20 ng/g gross fresh weight. Shrimp and cockle are the least contaminated with 0.4 and 0.7 ng/gfresh weight respectively.
PBDE : Spider crab displays the highest level of PBDEs (28, 47, 99, 100, 153, 154, 183) with 3.0 ng/g freshweight. Octopus and calico scallop are the species the least contaminated with PBDEs, with an averagelevel below 0.2 ng/g fresh weight.
3.3.3 Other seafood
PCDD/F and DL-PCB : The products with the highest concentrations of PCDD/Fs and DL-PCBs are cannedsardine with 3.9 pg TEQW H O/g fresh weight (Table 27). These data are quite consistent with the Englishdata in 20061 1 2. No product exceeds the regulatory values.
i-PCB : Canned sardine also has the highest level of i-PCBs (35.5 ng/g fresh weight) along with smokedmackerel and smoked salmon (13.9 and 12.8 ng/g fresh weight respectively).
PBDE : Canned pilchard, smoked mackerel and smoked salmon have the highest levels of PBDEs (28, 47,99, 100, 153, 154, 183) with 3.2, 2.8 and 2.7 ng/g fresh weight respectively. These same products arerelatively rich in total lipids (>10%).
The products the least contaminated by POPs, all pollutants included, are paella and smoked haddock.
POISSON 4.3 GB.qxd 17.9.2006 20:19 Page 72

THIRD PART - Seafood composition and contamination 73
POISSON 4.3 GB.qxd 17.9.2006 20:19 Page 73

74 THIRD PART - Seafood composition and contamination
Table 26: Mean contamination by persistent organic pollutants of molluscs and crustaceans
Table 27: Mean contamination by persistents organic pollutants of other seafood
Canned foodA n c h o v y 2 8 . 1 9 0 . 0 3 0 . 1 4 0 . 1 7 1 . 2 1 1 . 0 2C r a b 1 1 3 . 9 0 . 0 5 0 . 0 5 0 . 1 0 0 . 2 2 0 . 7 4M a c k e r e l 1 1 0 . 4 0 . 2 1 0 . 6 5 0 . 8 6 6 . 0 6 1 . 4 6P i l c h a r d 1 1 3 . 0 0 . 8 5 0 . 9 3 1 . 7 8 9 . 3 2 3 . 2 4S a r d i n e 1 7 . 8 4 0 . 7 7 3 . 1 2 3 . 8 7 3 5 . 5 1 . 3 6Tu n a * 5 0 . 8 8 0 . 0 2 0 . 0 7 0 . 0 9 1 . 4 7 0 . 5 9
Smoked fishH a d d o c k 1 0 . 3 5 0 . 0 3 2 0 . 0 3 8 0 . 0 7 0 0 . 3 1 5 0 . 2 7 5H e r r i n g 1 1 0 . 3 0 . 3 4 6 0 . 4 3 4 0 . 7 7 9 4 . 9 6 3 0 . 9 5 8M a c k e r e l 1 1 7 . 1 0 . 3 3 1 1 . 0 1 4 1 . 3 4 5 1 3 . 8 9 2 . 8 2 8S a l m o n 1 1 0 . 3 0 . 3 0 3 1 . 0 5 7 1 . 3 6 0 1 2 . 8 4 2 . 7 3 3
Seafood-based dishFish soup 2 0 . 9 8 0 . 0 3 6 0 . 0 9 5 0 . 1 3 1 0 . 9 2 0 0 . 2 4 0P a e l l a 1 2 8 . 0 0 . 0 2 7 0 . 0 1 9 0 . 0 4 6 0 . 1 7 3 0 . 1 9 9Surimi 1 4 . 0 8 0 . 0 1 3 0 . 0 2 3 0 . 0 3 6 1 . 2 6 0 0 . 6 2 8Tarama, terrine ou mousse 1 4 . 4 3 0 . 0 2 6 0 . 0 6 2 0 . 0 8 9 1 . 1 5 9 1 . 0 6 0
F W: fresh weight. a: Nb composite samples. Each sample is composed by 5 subsamples of the same species, representative of theprovisioning methods in each zone (port, market, supermarket…).* Predatory fish as described in the Commission Regulation (EC) No 78/2005 of 19 January 2005
Other seafood
Calico scallop 1 1 . 3 7 0 . 2 0 0 . 1 5 0 . 3 4 3 . 1 5 0 . 2 0C o c k l e 2 0 . 5 7 0 . 0 7 0 . 1 1 0 . 1 8 0 . 7 3 0 . 2 0Common periwinkle 3 2 . 4 6 0 . 0 6 0 . 0 9 0 . 1 5 1 . 0 4 0 . 6 0C r a b 3 7 . 7 6 2 . 6 2 3 . 9 0 6 . 5 2 5 8 . 1 0 . 7 7Cuttle fish 2 1 . 6 3 0 . 0 7 0 . 1 0 0 . 1 6 2 . 1 5 0 . 2 3Great scallop 4 1 . 3 1 0 . 2 0 0 . 1 9 0 . 3 9 4 . 9 8 0 . 3 0L o b s t e r 1 2 . 0 3 0 . 7 2 0 . 8 1 1 . 5 2 4 . 3 8 0 . 4 2M u s s e l 4 1 . 4 8 0 . 2 3 0 . 3 3 0 . 5 6 3 . 9 5 0 . 4 5O c t o p u s 1 0 . 6 6 0 . 0 6 0 . 2 0 0 . 2 5 1 . 9 7 0 . 2 0O y s t e r 4 0 . 9 3 0 . 2 7 0 . 3 2 0 . 6 0 2 . 7 0 0 . 2 5S c a m p i 3 0 . 8 6 0 . 2 7 0 . 2 0 0 . 4 7 1 . 8 2 0 . 2 8Sea urchin 1 1 . 0 9 0 . 0 4 0 . 2 4 0 . 2 8 1 . 3 4 0 . 2 5S h r i m p 4 1 . 2 2 0 . 0 5 0 . 0 6 0 . 1 1 0 . 4 4 0 . 3 2Spider crab 1 4 . 9 4 2 . 3 6 3 . 2 2 5 . 5 8 1 9 . 5 3 . 0 1S q u i d 4 1 . 8 7 0 . 3 3 0 . 5 9 0 . 9 1 6 . 5 9 0 . 6 9S w i m c r a b 2 4 . 6 6 4 . 7 9 1 3 . 8 1 8 . 6 1 8 7 1 . 0 3W h e l k 3 1 . 4 5 0 . 4 9 0 . 2 0 0 . 6 8 1 . 7 4 0 . 3 8
F W: fresh weight. a: Nb composite samples. Each sample is composed by 5 subsamples of the same species, representative of theprovisioning methods in each zone (port, market, supermarket…).
Mollusc, crustacean
POISSON 4.3 GB.qxd 17.9.2006 20:19 Page 74

THIRD PART - Seafood composition and contamination 75
3.3.4 Regional variations
Generally speaking, the contamination by persistent organic pollutants of our fish and seafood samplesdisplays a north-south gradient. The Le Havre samples are the most contaminated, for all the pollutantsconsidered, and the Toulon samples are the least contaminated (Table 28), although these diff e r e n c e sare not statistically significant (on all the products and on the 19 common fish sampled in the four zones).
In Le Havre, the average PCDD/Fs and DL-PCBs contamination is 1.9 pg TEQW H O/g fresh weight for fishand 5.1 pg TEQW H O/g fresh weight for molluscs and crustaceans. The average i-PCB contamination reaches20.5 ng/g fresh weight for fish and 55.0 ng/g for molluscs and crustaceans. The average PBDEs (28, 47,99, 100, 153, 154, 183) contamination is 1.3 ng/g of fresh weight for fish and 0.6 ng/g of fresh weightfor molluscs and crustaceans, the highest average being found in the Lorient samples (just slightly higherat 0.7 ng/g fresh weight). However, we note that these averages are not calculated for the same speciesin the four regions, but for species that in each region cover about 90% of the fish and seafoodconsumption of heavy consumers see 1.3.
The samples in Toulon are generally the least contaminated with POPs with average PCDD/Fs andDL-PCBs levels of 1.1 pg TEQW H O/g in fish and 0.39 pg TEQW H O/g in molluscs and crustaceans. The averagei-PCBs contamination is 12.2 ng/g for fish and 2.1 ng/g for molluscs and crustaceans. Finally, the averagePBDEs contaminations of the Toulon samples are again the lowest: 0.8 ng/g fresh weight for fish and0.3 ng/g fresh weight for molluscs and crustaceans.
When the contamination is expressed per gram of fat rather than fresh weight, the contaminationgradient still exists for PBDEs contamination of fish and PCDD/Fs and DL-PCBs contamination of molluscsand crustaceans (results not presented). We also note that the PBDEs contamination of molluscs andcrustaceans, when expressed per gram of fat, is relatively homogeneous across the study zones. Thesame is true for i-PCBs contamination of fish, molluscs and crustaceans (with the exception of samplesfrom Le Havre). The high PCDD/Fs, DL-PCBs and i-PCBs levels found in molluscs and crustaceans from LeHavre are due to the heavy contamination of the crab and swimcrab samples.
POISSON 4.3 GB.qxd 17.9.2006 20:19 Page 75

76 THIRD PART - Seafood composition and contamination
Table 28: Mean contamination by persistent organic pollutants of fish (excluding eel), molluscsand crustaceans per site
F i s h 2 2M e a n 3 . 7 4 0 . 3 6 3 1 . 5 6 5 1 . 9 2 9 2 0 . 4 9 1 . 3 1 1
S D 4 . 7 8 0 . 6 2 5 3 . 5 8 0 4 . 1 7 6 4 8 . 9 4 1 . 4 5 5
Mollusc, Crustacean 1 0M e a n 2 . 7 0 1 . 4 4 0 3 . 7 0 7 5 . 1 4 7 5 5 . 0 1 0 . 6 1 6
S D 2 . 1 3 2 . 4 5 7 7 . 8 5 2 0 . 2 8 1 1 4 . 9 0 . 5 0 7
F i s h 2 7M e a n 3 . 2 4 0 . 3 4 1 1 . 2 7 7 1 . 6 1 8 1 4 . 6 0 0 . 8 5 2
S D 4 . 8 5 0 . 6 4 9 2 . 3 6 5 2 . 9 7 9 2 6 . 7 6 0 . 7 5 0
Mollusc, Crustacean 1 1M e a n 2 . 5 6 0 . 7 3 1 0 . 8 8 2 1 . 6 1 4 5 . 9 6 5 0 . 6 9 5
S D 2 . 6 2 1 . 0 1 2 1 . 2 2 6 2 . 2 2 2 7 . 7 9 5 0 . 8 3 2
F i s h 2 3M e a n 3 . 1 9 0 . 3 3 6 1 . 1 9 6 1 . 5 3 2 1 3 . 7 8 0 . 8 8 1
S D 4 . 2 1 0 . 4 7 3 1 . 8 3 5 2 . 2 8 3 2 0 . 5 8 0 . 6 7 6
Mollusc, Crustacean 1 2M e a n 1 . 7 8 0 . 3 1 4 0 . 2 2 5 0 . 5 3 9 3 . 0 0 8 0 . 3 4 3
S D 1 . 5 4 0 . 3 9 9 0 . 2 2 1 0 . 5 7 1 3 . 2 5 9 0 . 1 4 4
F i s h 2 3M e a n 3 . 9 1 0 . 2 4 6 0 . 8 8 4 1 . 1 3 0 1 2 . 2 2 0 . 8 0 9
S D 4 . 7 3 0 . 2 9 1 0 . 9 9 2 1 . 2 4 3 1 4 . 5 7 0 . 6 2 6
Mollusc, Crustacean 1 0M e a n 1 . 2 2 0 . 1 6 1 0 . 2 2 6 0 . 3 8 7 2 . 0 6 1 0 . 3 1 9
S D 0 . 6 9 0 . 2 0 9 0 . 2 2 8 0 . 4 3 2 1 . 6 4 8 0 . 1 0 2
F W: fresh weight. a: Nb composite samples. Each sample is composed by 5 subsamples of the same species, representative of theprovisioning methods in each zone (port, market, supermarket…).
POISSON 4.3 GB.qxd 17.9.2006 20:19 Page 76

FOURTH PART - Nutritional intakes and exposure to contaminants 77
FOURTHPART
Nutritional intakes andexposure to contaminants
POISSON 4.3 GB.qxd 17.9.2006 20:19 Page 77

78 FOURTH PART - Nutritional intakes and exposure to contaminants
4.1 Fatty acid intakes
4.1.1 Food exposure
Fatty acid intakes through fish and seafood consumption for the four study zones are presented in Ta b l e s29 to 33.
Note that these results correspond to fatty acid intakes only through fish and seafood, not intakesthrough the total diet. However, as mentioned in the introductory section of this report, leaving asideconsumption of dietary supplements, marine products are the main source of long-chain polyunsaturatedomega 3 fatty acids given that the conversion of the precursor ALA is very low (less than 1%, see“Methodology and General Presentation”).
For the four study zones, the intakes of long-chain polyunsaturated omega 3 are lower but of the sameorder of magnitude as the estimated intakes of the Inuit and Japanese populations, both high seafoodc o n s u m e r s115 116. Average EPA intakes are 419 to 517 mg/day for adult males and 403 to 509 mg/day foradult females; DHA intakes are 739 to 960 mg/day for men and 713 to 885 mg/day for women. Thevariability between individuals is also consistent with the results found in the literature.
Compared to intakes of the general French population through seafood1 1 7, the PUFA intakes of thesubjects of this study are 4.1 times higher in adult males and 4.2 times higher in women. More than halfof these PUFAs are LC-PUFAs of the omega 3 family, EPA, DPA and DHA.
The RDAs of long-chain PUFAs, in particular DHA, are well covered (786 ± 612 mg DHA/day on averagefor an RDA of 100 to 120 mg/day), regardless of the age and sex and notably in adult females and womenof child-bearing age.
As regards women of child-bearing age (18 to 44 years), in the four study zones fish and seafoodconsumption alone provides average intakes largely exceeding the RDA of LC-PUFAs and DHA for adultfemales and pregnant women.
Generally speaking, in all the zones, and whatever the age group and sex considered, the averageE PA+DHA intakes exceed the 1 g/day recommended by the American Heart Association, yet they generallyremain below the maximum limit of EPA+DHA intake of 2 g/day according to the AFSSA in 20031 0; 14%of our subjects exceed this recommendation – through fish and seafood consumption alone. However,given the rarity of available data, this limit is not considered to be an intake beyond which health riskcan appear, but rather an intake beyond which there is no proven nutritional benefit.
The statistical analyses reveal that the subjects in Le Havre, regardless of age and sex, have an estimatedE PA intake through their fish and seafood consumption higher than subjects in Lorient and La Rochelle,and a DHA intake higher than subjects in La Rochelle and Toulon (Table 33).
M o r e o v e r, within a given zone there are no clear disparities in terms of n-3 LC-PUFA intakes betweenthe different age groups and sexes (results not presented), apart from Lorient where men aged 18 to64 have EPA, DHA, PUFA and omega 3 intakes significantly higher than women in the same age group( p < 0 . 0 5 ) .
115 Yamada T., Strong J.P., Ishii T., Ueno T., Koyama M., Wagayama H., Shimizu A., Sakai T., Malcom G.T. and Guzman M.A. Athero s c l e ro s i sand omega-3 fatty acids in the populations of a fishing village and a farming village in Japan. Athero s c l e rosis 153 : 469-481. 2000.
116 Dewailly E., Blanchet C., Lemieux S., Sauvé L., Gringas S., Ayotte P. and Holub B.J. n-3 fatty acids and cardiovascular disease risk factorsamong the Inuit of Nunavik. Am. J. Clin. Nutr. 74 : 464-473. 2001.
117 Razanamahefa L., Lafay L., Oseredczuk M., Thiebaut A., Laloux L., Gerber M., Astorg P. et Berta J.-L. Consommation lipidique de la popula-tion française et qualité des données de composition des principaux groupes d’aliments vecteurs. Bull. Cancer 92 (7-8) : 647-657. 2005.
POISSON 4.3 GB.qxd 17.9.2006 20:19 Page 78

Elderly subjects (≥ 65 years) in Le Havre have relatively higher intakes than those in other zones, withaverage EPA and DHA levels of 693 and 1,164 mg/day respectively compared to a maximum of 416 mgE PA and 770 mg DHA per day in the other zones. However these regional differences are not statisticallysignificant. This particularity of elderly people in Le Havre can no doubt be explained by their very highconsumption of herring (excluding smoked herring) of 129.3 g/week. According to the literature thisfish is one of the most oily (8.5 to 12.3 g of lipids for 100 g1 0 4; 17.8 g of lipids for 100 g including 2.8 gof n-3 LC-PUFA1 0 5) .
According to the zone and the group of individuals considered, consumption of fish and seafood productsprovides 3.3% to 5.8% of the RDA of the omega 3 precursor (ALA), 6.4% to 10% of the RDA of saturatedfatty acids and 2.6% to 4.2% of the RDA of monounsaturated fatty acids.
The Appendix 5 shows that the main contributors to omega 3 exposure are salmon (27%), mackerel(12%), sardine (10%), anchovy and herring (about 5%). The consumption of salmon contribute onaverage to 33% of the recommended daily intake of EPA and DHA, mackerel to 28% and sardine to24% (Appendix 6).
Indeed mackerel, sardine and salmon are major contributors in all four study zones, providing respectively7% to 16%, 6% to 17% and 24% to 31% of the intake. Herring, an other oily fish, account for at least5% of the intake only in Le Havre and La Rochelle, while anchovy contributes to omega 3 intake inLorient and To u l o n .
FOURTH PART - Nutritional intakes and exposure to contaminants 79
POISSON 4.3 GB.qxd 17.9.2006 20:19 Page 79

80 FOURTH PART - Nutritional intakes and exposure to contaminants
POISSON 4.3 GB.qxd 17.9.2006 20:19 Page 80
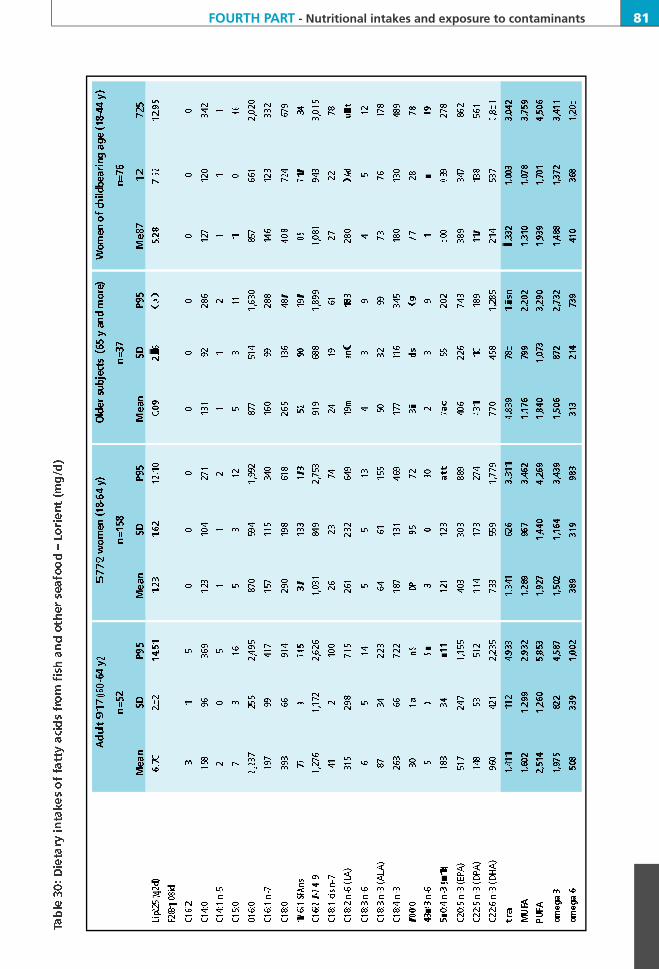
FOURTH PART - Nutritional intakes and exposure to contaminants 81
POISSON 4.3 GB.qxd 17.9.2006 20:19 Page 81

82 FOURTH PART - Nutritional intakes and exposure to contaminants
POISSON 4.3 GB.qxd 17.9.2006 20:19 Page 82

FOURTH PART - Nutritional intakes and exposure to contaminants 83
POISSON 4.3 GB.qxd 17.9.2006 20:19 Page 83

84 FOURTH PART - Nutritional intakes and exposure to contaminants
Table 33: Dietary intakes of fatty acids from fish and other seafood per site (mg/d, Mean ± SD)
4.1.2 Biomarker of exposure
The results of the erythrocyte fatty acid profile of the 391 subjects in the study are presented in Ta b l e s34 to 38.
Unlike the food exposure results obtained by crossing food composition and individual consumptiondata, the results of the direct approach yield the fatty acid biological level resulting from the total diet.
The results obtained suggest that adult males have the most triglycerides in the blood, but with highvariability (0.9 g/L ± 0.6 to 1.6 g/L ± 2.3 depending on the zone) compared to women and to males inother age groups, the norm being 0.5 to 2 g/L1 1 8. On the other hand, elderly subjects (≥ 65 years) havethe highest total cholesterol (2.15 to 2.48 g/L), HDL-cholesterol (0.62 to 0.69 g/L) and LDL-cholesterol(1.35 to 1.66 g/L). 39% of the subjects exceeds the norm of the total cholesterol level, fixed at 2.0 to2.6 g/L depending on age. Generally, only women of child-bearing age (18 to 44 years) have averagetotal cholesterol levels corresponding to the norm for their age.
The lipidic fraction of the erythrocyte membrane is constituted by 50% of SFA on average in adult malesand 47% in women and elderly people. MUFAs represent about 18% of total lipids, and PUFAs 27% foromega 6 and 7% for omega 3. The EPA, DPA and DHA account for almost all the omega 3 in theerythrocyte membrane, the precursor ALA representing only 0.2% of total lipids on average. The omega6 precursor (LA) constitutes only about 11% of the membrane lipidic fraction.
Le Havre L o r i e n t La Rochelle To u l o n All subjectsn = 2 4 9 n = 2 4 7 n = 2 4 8 n = 2 5 2 n = 9 9 6
E PA 516 ± 454 a 428 ± 304 b 428 ± 316 b 437 ± 324 a. b 452 ± 356
D PA 141 ± 142 a 120 ± 153 a 111 ± 124 a 138 ± 101 a 127 ± 132
D H A 896 ± 800 a 786 ± 568 a . b 743 ± 522 b 720 ± 502 b 786 ± 612
Omega 3* 1,814 ± 1.596 a 1,602 ± 1,177 a 1,521 ± 1,096 a 1,594 ± 1,136 a 1,633 ± 1,270
P U FA 2,248 ± 1.937 a 2,037 ± 1,452 a 1,909 ± 1,293 a 2,145 ± 1,522 a 2,085 ± 1,572
* The intake of Omega 3 correspond to the intakes of ALA, C18:4 n-3, EPA, DPA and DHAValues in the same raw with different superscript letters are significantly different, p<0.05 (Tu k e y ’s test)
118 Godeau P., Herson S. and Piette J.C. Traité de médecine, 4e édition. Médecine-Sciences Flammarion. 2004.
POISSON 4.3 GB.qxd 17.9.2006 20:19 Page 84

Table 34: Fatty acid composition of red blood cells – Le Havre (% total FA)
Adult men Adult women Older subjects Women of childbearing age
(18-64 y) (18-64 y) (65 y and more ) (18-44 y)
n = 1 8 n = 6 0 n = 7 n = 2 9
M e a n S D P 9 5 M e a n S D P 9 5 M e a n S D P 9 5 M e a n S D P 9 5
Triglycerides (g/L) 0 . 9 0 0 . 6 3 1 . 8 6 0 . 8 6 0 . 4 3 1 . 8 5 0 . 8 1 0 . 2 0 0 . 9 9 0 . 7 8 0 . 3 2 1 . 3 9
Total cholesterol (g/L) 1 . 9 9 0 . 3 7 2 . 5 5 2 . 0 0 0 . 3 9 2 . 6 2 2 . 1 5 0 . 4 4 2 . 6 1 1 . 8 2 0 . 3 3 2 . 4 4
HDL (g/L) 0 . 5 7 0 . 1 0 0 . 7 3 0 . 6 6 0 . 2 0 0 . 9 1 0 . 6 4 0 . 1 3 0 . 8 1 0 . 6 1 0 . 2 4 0 . 8 3
C h o l e s t e r o l / H D L 3 . 6 1 0 . 9 5 5 . 0 1 3 . 2 5 0 . 8 6 4 . 7 1 3 . 4 6 0 . 8 6 4 . 7 9 3 . 2 9 0 . 9 1 4 . 7 6
LDL (g/L) 1 . 2 4 0 . 3 2 1 . 6 7 1 . 1 8 0 . 3 3 1 . 7 1 1 . 3 5 0 . 3 9 1 . 7 5 1 . 0 9 0 . 3 0 1 . 6 6
Fatty acids (% total lipids)
C 1 2 : 0 0 . 2 8 0 . 1 3 0 . 4 9 0 . 3 2 0 . 1 9 0 . 5 9 0 . 3 0 0 . 1 8 0 . 5 9 0 . 2 8 0 . 1 3 0 . 5 0
C 1 4 : 0 0 . 8 4 0 . 2 4 1 . 2 7 0 . 7 7 0 . 2 5 1 . 2 7 0 . 9 0 0 . 3 5 1 . 3 7 0 . 7 8 0 . 2 4 1 . 2 5
C14:1 n-5 0 . 1 2 0 . 0 5 0 . 2 1 0 . 1 2 0 . 0 5 0 . 1 9 0 . 1 7 0 . 1 2 0 . 3 6 0 . 1 2 0 . 0 5 0 . 2 2
C 1 5 : 0 0 . 2 5 0 . 1 1 0 . 4 4 0 . 2 6 0 . 0 6 0 . 3 7 0 . 3 2 0 . 1 0 0 . 4 6 0 . 2 7 0 . 0 6 0 . 3 8
C 1 6 : 0 2 0 . 5 8 1 . 3 6 2 2 . 6 7 2 0 . 2 9 1 . 0 4 2 1 . 9 9 2 0 . 8 6 0 . 9 7 2 1 . 9 1 2 0 . 5 5 1 . 1 4 2 2 . 2 7
C16:1 n-9 0 . 3 6 0 . 1 4 0 . 6 1 0 . 3 3 0 . 1 8 0 . 7 7 0 . 3 8 0 . 2 5 0 . 7 7 0 . 3 6 0 . 1 8 0 . 7 7
C16:1 n-7 1 . 2 5 0 . 5 3 2 . 0 4 1 . 1 5 0 . 4 6 1 . 8 7 1 . 4 8 0 . 5 4 2 . 1 4 1 . 1 9 0 . 4 4 1 . 8 5
C 1 8 : 0 2 3 . 6 9 6 . 8 5 3 6 . 2 9 2 4 . 0 2 4 . 7 2 3 0 . 2 0 2 3 . 0 9 4 . 9 6 2 9 . 4 1 2 3 . 5 9 4 . 7 5 3 1 . 0 5
C18:1 n-9t 0 . 4 0 0 . 2 0 0 . 7 2 0 . 3 0 0 . 1 8 0 . 6 2 0 . 3 7 0 . 1 6 0 . 5 6 0 . 3 0 0 . 1 7 0 . 6 2
C18:1 n-9 1 5 . 0 9 3 . 1 3 1 9 . 1 9 1 4 . 5 6 2 . 1 8 1 8 . 4 9 1 5 . 8 3 2 . 0 9 1 8 . 1 7 1 4 . 7 4 2 . 2 7 1 8 . 3 4
C18:1 n-7 1 . 1 7 0 . 2 1 1 . 4 3 1 . 2 0 0 . 1 6 1 . 5 5 1 . 2 9 0 . 1 7 1 . 5 0 1 . 2 2 0 . 1 5 1 . 5 2
C18:2 n-6 (LA) 1 4 . 2 2 5 . 5 0 2 1 . 2 2 1 2 . 9 0 4 . 5 3 2 0 . 6 2 1 2 . 9 9 3 . 8 4 1 7 . 6 5 1 3 . 4 2 4 . 8 4 2 0 . 5 4
C18:3 n-6 0 . 2 5 0 . 1 2 0 . 3 9 0 . 1 9 0 . 1 0 0 . 3 4 0 . 2 6 0 . 0 9 0 . 3 4 0 . 2 0 0 . 1 0 0 . 3 5
C18:3 n-3 (ALA) 0 . 2 5 0 . 1 1 0 . 4 1 0 . 2 5 0 . 1 1 0 . 4 5 0 . 2 6 0 . 1 0 0 . 4 1 0 . 2 3 0 . 0 8 0 . 3 5
C 2 0 : 0 0 . 1 9 0 . 0 7 0 . 3 3 0 . 1 8 0 . 0 8 0 . 3 1 0 . 2 3 0 . 0 7 0 . 3 1 0 . 1 9 0 . 0 8 0 . 3 2
C20:2 n-6 0 . 3 1 0 . 0 6 0 . 4 1 0 . 3 4 0 . 0 5 0 . 4 0 0 . 3 4 0 . 0 5 0 . 4 0 0 . 3 4 0 . 0 6 0 . 4 2
C20:3 n-6 1 . 2 8 0 . 2 5 1 . 6 0 1 . 4 2 0 . 3 2 2 . 0 2 1 . 3 9 0 . 2 1 1 . 6 0 1 . 5 1 0 . 3 3 2 . 0 8
C20:4 n-6 (AA) 1 1 . 0 0 1 . 6 1 1 3 . 9 1 1 2 . 1 3 1 . 9 8 1 4 . 6 9 1 0 . 5 8 2 . 4 7 1 3 . 9 2 1 2 . 0 4 2 . 1 7 1 5 . 9 1
C20:5 n-3 (EPA ) 0 . 8 7 0 . 5 3 1 . 4 9 0 . 7 9 0 . 4 1 1 . 7 1 1 . 1 2 0 . 5 3 1 . 9 5 0 . 5 8 0 . 2 1 1 . 0 5
C22:4 n-6 1 . 8 7 0 . 6 3 2 . 7 8 2 . 0 2 0 . 6 9 3 . 0 6 1 . 5 8 0 . 5 6 2 . 2 5 2 . 1 2 0 . 6 9 3 . 3 5
C22:5 n-6 0 . 3 9 0 . 0 9 0 . 5 0 0 . 4 3 0 . 1 6 0 . 7 5 0 . 3 7 0 . 1 0 0 . 5 1 0 . 4 9 0 . 1 6 0 . 7 5
C22:5 n-3 (DPA ) 1 . 7 0 0 . 4 0 2 . 3 7 1 . 7 4 0 . 3 8 2 . 3 3 1 . 6 1 0 . 5 5 2 . 2 6 1 . 5 7 0 . 3 1 2 . 0 6
C22:6 n-3 (DHA) 3 . 6 4 1 . 0 5 5 . 2 5 4 . 2 9 1 . 1 7 6 . 6 6 4 . 2 7 1 . 2 4 5 . 6 0 3 . 9 0 1 . 0 2 5 . 3 0
S FA 4 5 . 8 3 7 . 5 6 5 9 . 5 4 4 5 . 8 5 4 . 4 8 5 3 . 0 7 4 5 . 7 1 5 . 5 3 5 2 . 6 1 4 5 . 6 7 4 . 4 9 5 3 . 1 4
M U FA 1 7 . 9 9 3 . 7 4 2 3 . 3 6 1 7 . 3 6 2 . 7 3 2 2 . 3 8 1 9 . 1 4 2 . 6 7 2 1 . 7 8 1 7 . 6 3 2 . 7 7 2 2 . 3 4
omega 6 2 9 . 3 2 4 . 7 9 3 5 . 5 0 2 9 . 4 3 3 . 5 1 3 4 . 5 2 2 7 . 5 1 3 . 2 1 3 1 . 9 4 3 0 . 1 3 3 . 4 0 3 4 . 4 6
omega 3 6 . 4 6 1 . 5 3 8 . 8 3 7 . 0 6 1 . 6 7 1 0 . 0 7 7 . 2 7 1 . 9 7 9 . 3 0 6 . 2 7 1 . 2 3 7 . 8 2
omega 6/omega 3 4 . 8 2 1 . 5 9 7 . 9 0 4 . 4 4 1 . 3 0 6 . 7 4 4 . 0 0 1 . 0 3 5 . 3 2 5 . 0 4 1 . 3 6 7 . 0 5
L A / A L A 7 0 . 2 0 5 9 . 1 4 2 1 4 . 4 0 5 8 . 1 9 2 3 . 7 1 9 9 . 7 7 5 2 . 8 9 1 2 . 3 8 7 0 . 5 2 6 3 . 3 3 2 8 . 0 5 1 1 9 . 2 1
FOURTH PART - Nutritional intakes and exposure to contaminants 85
POISSON 4.3 GB.qxd 17.9.2006 20:19 Page 85

86 FOURTH PART - Nutritional intakes and exposure to contaminants
Table 35: Fatty acid composition of red blood cells – Lorient (% total FA)
Adult men Adult women Older subjects Women of childbearing age
(18-64 y) (18-64 y) (65 y and more ) (18-44 y)
n = 2 1 n = 8 4 n = 1 0 n = 3 9
M e a n S D P 9 5 M e a n S D P 9 5 M e a n S D P 9 5 M e a n S D P 9 5
Triglycerides (g/L) 1 . 2 8 0 . 6 7 2 . 6 2 0 . 9 0 0 . 4 9 1 . 7 7 1 . 0 1 0 . 4 7 1 . 7 5 0 . 8 5 0 . 4 2 1 . 7 0
Total cholesterol (g/L) 2 . 1 0 0 . 4 6 2 . 8 1 2 . 2 1 0 . 4 1 2 . 7 5 2 . 4 8 0 . 4 4 3 . 1 7 2 . 1 1 0 . 4 2 2 . 7 6
HDL (g/L) 0 . 5 0 0 . 1 0 0 . 6 4 0 . 6 1 0 . 1 3 0 . 8 4 0 . 6 6 0 . 2 0 0 . 8 9 0 . 5 9 0 . 1 3 0 . 7 9
C h o l e s t e r o l / H D L 4 . 3 7 1 . 1 9 6 . 2 0 3 . 7 3 0 . 9 2 5 . 3 2 4 . 0 7 1 . 2 1 5 . 9 1 3 . 6 9 0 . 9 8 5 . 1 3
LDL (g/L) 1 . 3 9 0 . 4 1 1 . 9 5 1 . 4 4 0 . 3 5 2 . 0 0 1 . 6 6 0 . 3 9 2 . 2 1 1 . 3 7 0 . 3 6 1 . 8 8
Fatty acids (% total lipids)
C 1 2 : 0 0 . 8 7 0 . 4 9 1 . 2 4 0 . 5 9 0 . 3 4 1 . 1 1 0 . 8 2 0 . 4 6 1 . 5 8 0 . 6 0 0 . 3 8 1 . 1 3
C 1 4 : 0 1 . 1 6 0 . 5 0 1 . 8 0 0 . 9 7 0 . 4 0 1 . 6 7 1 . 0 4 0 . 4 3 1 . 4 6 0 . 9 6 0 . 4 4 1 . 7 2
C14:1 n-5 0 . 3 9 0 . 1 6 0 . 6 5 0 . 3 4 0 . 1 8 0 . 6 4 0 . 3 2 0 . 1 5 0 . 5 4 0 . 3 3 0 . 1 8 0 . 6 2
C 1 5 : 0 0 . 8 0 0 . 3 3 1 . 3 8 0 . 6 7 0 . 3 0 1 . 1 8 0 . 6 6 0 . 2 6 0 . 9 8 0 . 6 5 0 . 3 2 1 . 2 6
C 1 6 : 0 2 1 . 7 9 2 . 6 5 2 5 . 7 2 2 0 . 4 0 2 . 2 6 2 4 . 7 6 2 0 . 3 9 1 . 7 0 2 3 . 2 3 2 0 . 5 8 2 . 3 3 2 4 . 0 7
C16:1 n-9 0 . 3 9 0 . 1 6 0 . 6 7 0 . 3 8 0 . 1 9 0 . 8 2 0 . 4 5 0 . 2 6 0 . 8 1 0 . 4 1 0 . 2 0 0 . 8 2
C16:1 n-7 1 . 3 3 0 . 4 6 2 . 0 4 1 . 3 4 0 . 6 0 2 . 3 7 1 . 3 7 0 . 5 1 2 . 1 2 1 . 3 1 0 . 5 7 2 . 2 3
C 1 8 : 0 2 5 . 4 4 5 . 3 3 3 2 . 0 3 2 2 . 8 1 5 . 8 1 3 2 . 5 5 2 1 . 7 6 4 . 7 2 2 7 . 4 9 2 3 . 2 6 5 . 8 8 3 2 . 7 6
C18:1 n-9t 0 . 4 0 0 . 4 1 0 . 9 7 0 . 4 2 0 . 4 2 0 . 7 0 0 . 3 2 0 . 1 9 0 . 6 0 0 . 3 7 0 . 1 9 0 . 6 8
C18:1 n-9 1 4 . 6 2 1 . 5 7 1 6 . 6 0 1 5 . 6 1 3 . 0 3 2 2 . 7 1 1 6 . 2 2 2 . 7 7 2 0 . 7 5 1 5 . 6 9 2 . 7 1 2 0 . 0 6
C18:1 n-7 1 . 4 8 0 . 2 4 1 . 8 4 1 . 4 6 0 . 2 3 1 . 8 4 1 . 4 8 0 . 2 5 1 . 8 7 1 . 4 3 0 . 2 2 1 . 7 9
C18:2 n-6 (LA) 1 0 . 8 2 2 . 2 0 1 3 . 6 3 1 3 . 3 6 4 . 1 7 2 1 . 1 1 1 2 . 8 3 4 . 1 7 2 0 . 0 0 1 3 . 2 7 3 . 8 4 2 0 . 1 4
C18:3 n-6 0 . 2 1 0 . 1 0 0 . 3 9 0 . 2 1 0 . 0 9 0 . 3 6 0 . 2 0 0 . 0 9 0 . 3 5 0 . 2 1 0 . 0 9 0 . 3 7
C18:3 n-3 (ALA) 0 . 2 7 0 . 1 5 0 . 5 3 0 . 2 5 0 . 1 4 0 . 5 3 0 . 2 5 0 . 1 2 0 . 4 0 0 . 2 3 0 . 1 4 0 . 5 0
C 2 0 : 0 0 . 2 0 0 . 1 0 0 . 3 8 0 . 2 6 0 . 1 2 0 . 4 5 0 . 2 5 0 . 1 2 0 . 4 0 0 . 2 6 0 . 1 4 0 . 4 5
C20:2 n-6 0 . 6 1 0 . 2 9 1 . 0 1 0 . 4 8 0 . 2 3 0 . 9 5 0 . 4 1 0 . 2 3 0 . 7 2 0 . 5 0 0 . 2 2 0 . 9 4
C20:3 n-6 1 . 2 6 0 . 4 9 2 . 0 0 1 . 2 8 0 . 4 5 2 . 1 8 1 . 3 4 0 . 3 4 1 . 8 2 1 . 3 4 0 . 4 9 2 . 1 8
C20:4 n-6 (AA) 1 0 . 2 0 3 . 3 7 1 4 . 5 6 1 0 . 7 3 2 . 7 8 1 4 . 5 2 1 1 . 0 0 3 . 0 2 1 4 . 5 8 1 0 . 6 8 3 . 0 1 1 4 . 2 7
C20:5 n-3 (EPA ) 0 . 6 4 0 . 3 3 1 . 1 2 0 . 7 5 0 . 3 4 1 . 2 7 0 . 8 2 0 . 4 1 1 . 4 1 0 . 5 9 0 . 2 9 1 . 0 9
C22:4 n-6 1 . 8 7 0 . 7 6 3 . 1 6 1 . 7 6 0 . 6 5 2 . 8 7 1 . 6 7 0 . 6 3 2 . 4 5 1 . 8 6 0 . 7 0 3 . 0 2
C22:5 n-6 0 . 6 6 0 . 2 8 1 . 0 7 0 . 5 4 0 . 2 4 0 . 9 0 0 . 4 3 0 . 2 6 0 . 8 3 0 . 5 6 0 . 2 2 0 . 9 1
C22:5 n-3 (DPA ) 1 . 5 8 0 . 7 6 2 . 6 0 1 . 6 0 0 . 5 6 2 . 4 5 2 . 0 3 0 . 9 7 3 . 3 6 1 . 4 9 0 . 6 0 2 . 4 5
C22:6 n-3 (DHA) 3 . 0 1 1 . 7 9 6 . 5 9 3 . 7 8 1 . 4 3 6 . 0 8 3 . 9 3 1 . 4 0 5 . 7 4 3 . 4 1 1 . 3 0 5 . 2 6
S FA 5 0 . 2 6 7 . 6 9 6 2 . 6 6 4 5 . 7 0 7 . 0 1 5 5 . 9 3 4 4 . 9 2 5 . 8 7 5 3 . 5 9 4 6 . 3 1 7 . 4 3 5 7 . 1 1
M U FA 1 8 . 2 1 1 . 6 5 2 0 . 8 9 1 9 . 1 3 3 . 5 1 2 7 . 4 7 1 9 . 8 5 3 . 5 1 2 5 . 5 6 1 9 . 1 6 3 . 0 8 2 2 . 8 9
omega 6 2 5 . 6 3 5 . 2 7 3 1 . 5 2 2 8 . 3 6 4 . 8 1 3 6 . 2 4 2 7 . 8 8 3 . 9 2 3 2 . 9 2 2 8 . 4 3 5 . 2 0 3 6 . 3 0
omega 3 5 . 4 9 2 . 5 5 1 0 . 1 0 6 . 3 8 2 . 0 1 9 . 3 1 7 . 0 3 1 . 9 7 9 . 2 2 5 . 7 3 1 . 8 7 8 . 3 4
omega 6/omega 3 5 . 4 7 2 . 0 1 8 . 7 0 4 . 9 1 1 . 7 8 8 . 7 8 4 . 4 0 1 . 7 9 7 . 2 4 5 . 4 9 1 . 9 0 8 . 9 3
L A / A L A 5 2 . 9 9 2 9 . 2 3 1 0 3 . 2 5 6 8 . 6 4 4 8 . 3 0 1 3 0 . 8 5 6 3 . 7 2 3 4 . 2 9 1 2 1 . 6 5 7 6 . 5 4 6 1 . 0 3 1 3 2 . 8 7
POISSON 4.3 GB.qxd 17.9.2006 20:19 Page 86

Table 36: Fatty acid composition of red blood cells – La Rochelle (% total FA)
Adult men Adult women Older subjects Women of childbearing age
(18-64 y) (18-64 y) (65 y and more) (18-44 y)
n = 3 7 n = 4 6 n = 1 4 n = 2 8
M e a n S D P 9 5 M e a n S D P 9 5 M e a n S D P 9 5 M e a n S D P 9 5
Triglycerides (g/L) 1 . 6 2 2 . 3 0 3 . 2 1 0 . 9 0 0 . 3 7 1 . 6 0 1 . 1 8 0 . 5 5 2 . 1 8 0 . 8 6 0 . 3 6 1 . 2 6
Total cholesterol (g/L) 2 . 1 4 0 . 3 2 2 . 7 9 2 . 0 9 0 . 3 8 2 . 7 1 2 . 2 9 0 . 3 5 2 . 8 0 1 . 9 9 0 . 3 5 2 . 5 7
HDL (g/L) 0 . 5 4 0 . 1 3 0 . 7 3 0 . 6 8 0 . 1 6 0 . 9 6 0 . 6 9 0 . 1 9 1 . 0 3 0 . 6 7 0 . 1 7 1 . 0 2
C h o l e s t e r o l / H D L 4 . 2 0 1 . 2 8 6 . 7 1 3 . 2 8 1 . 0 2 4 . 7 5 3 . 4 8 0 . 8 1 4 . 4 3 3 . 1 5 0 . 8 8 4 . 5 6
LDL (g/L) 1 . 3 4 0 . 2 9 1 . 9 5 1 . 2 5 0 . 3 9 1 . 8 1 1 . 3 6 0 . 2 7 1 . 6 7 1 . 1 7 0 . 3 9 1 . 7 1
Fatty acids (% total lipids)
C 1 2 : 0 0 . 5 7 0 . 3 9 1 . 2 0 0 . 5 5 0 . 3 6 1 . 1 7 0 . 5 7 0 . 3 7 1 . 0 1 0 . 5 7 0 . 3 6 1 . 2 0
C 1 4 : 0 0 . 8 4 0 . 2 5 1 . 2 3 0 . 8 4 0 . 3 0 1 . 3 0 0 . 8 5 0 . 4 0 1 . 4 9 0 . 8 5 0 . 3 0 1 . 2 9
C14:1 n-5 0 . 1 5 0 . 1 1 0 . 4 1 0 . 1 8 0 . 1 2 0 . 4 2 0 . 1 9 0 . 1 9 0 . 5 8 0 . 2 0 0 . 1 4 0 . 4 3
C 1 5 : 0 0 . 2 6 0 . 1 7 0 . 7 8 0 . 2 2 0 . 0 9 0 . 3 0 0 . 2 3 0 . 1 0 0 . 4 1 0 . 2 3 0 . 1 0 0 . 3 0
C 1 6 : 0 2 0 . 2 0 1 . 4 0 2 2 . 5 2 2 0 . 5 9 2 . 1 3 2 4 . 3 7 2 0 . 3 9 1 . 6 5 2 2 . 7 6 2 0 . 6 0 2 . 0 5 2 4 . 2 5
C16:1 n-9 0 . 2 3 0 . 1 3 0 . 3 5 0 . 2 4 0 . 1 0 0 . 3 8 0 . 2 5 0 . 1 5 0 . 5 2 0 . 2 3 0 . 1 1 0 . 3 9
C16:1 n-7 0 . 6 4 0 . 2 7 1 . 1 7 0 . 7 1 0 . 2 5 1 . 1 4 0 . 8 9 0 . 4 9 1 . 9 1 0 . 6 7 0 . 2 6 0 . 9 8
C 1 8 : 0 2 8 . 1 6 8 . 0 7 4 2 . 5 3 2 8 . 2 9 7 . 8 6 3 9 . 3 5 2 5 . 5 4 7 . 1 7 3 4 . 1 8 2 8 . 5 5 8 . 2 6 3 9 . 3 1
C18:1 n-9t 0 . 3 6 0 . 1 4 0 . 6 7 0 . 3 4 0 . 1 0 0 . 4 8 0 . 3 4 0 . 1 2 0 . 4 7 0 . 3 5 0 . 1 1 0 . 4 8
C18:1 n-9 1 2 . 9 3 2 . 3 3 1 6 . 3 6 1 2 . 8 9 2 . 7 0 1 6 . 3 6 1 5 . 1 3 4 . 4 3 2 4 . 3 5 1 2 . 5 4 2 . 7 7 1 6 . 3 3
C18:1 n-7 1 . 0 7 0 . 1 9 1 . 4 0 1 . 1 2 0 . 1 9 1 . 4 1 1 . 2 4 0 . 2 4 1 . 7 1 1 . 1 1 0 . 2 0 1 . 3 9
C18:2 n-6 (LA) 8 . 6 5 2 . 2 7 1 2 . 2 1 8 . 6 2 1 . 9 7 1 1 . 1 5 9 . 8 2 2 . 9 6 1 4 . 9 3 8 . 6 4 1 . 9 6 1 1 . 1 4
C18:3 n-6 0 . 1 6 0 . 0 7 0 . 2 6 0 . 1 8 0 . 1 0 0 . 3 6 0 . 1 4 0 . 0 9 0 . 2 8 0 . 1 8 0 . 1 1 0 . 3 6
C18:3 n-3 (ALA) 0 . 1 4 0 . 0 5 0 . 2 1 0 . 1 8 0 . 0 7 0 . 2 6 0 . 1 9 0 . 1 3 0 . 4 2 0 . 1 7 0 . 0 6 0 . 2 6
C 2 0 : 0 0 . 1 9 0 . 0 9 0 . 3 6 0 . 1 9 0 . 0 8 0 . 3 3 0 . 2 2 0 . 0 9 0 . 3 8 0 . 1 8 0 . 0 8 0 . 3 0
C20:2 n-6 0 . 3 8 0 . 1 6 0 . 6 5 0 . 3 6 0 . 1 8 0 . 6 3 0 . 3 3 0 . 1 4 0 . 4 7 0 . 3 5 0 . 1 9 0 . 6 3
C20:3 n-6 1 . 6 1 0 . 4 8 2 . 3 2 1 . 3 7 0 . 4 0 1 . 9 2 1 . 3 3 0 . 4 3 2 . 0 7 1 . 3 9 0 . 4 3 1 . 9 0
C20:4 n-6 (AA) 1 2 . 9 8 2 . 8 6 1 7 . 5 6 1 2 . 7 7 3 . 3 9 1 7 . 3 9 1 2 . 1 5 3 . 7 7 1 6 . 2 7 1 2 . 8 4 3 . 4 4 1 7 . 3 9
C20:5 n-3 (EPA ) 0 . 8 0 0 . 3 6 1 . 4 3 0 . 8 3 0 . 3 1 1 . 3 7 0 . 8 0 0 . 3 7 1 . 3 5 0 . 7 7 0 . 2 3 1 . 1 4
C22:4 n-6 2 . 1 7 0 . 6 2 3 . 4 6 2 . 0 8 0 . 7 5 3 . 4 6 1 . 8 6 0 . 7 0 2 . 5 3 2 . 2 5 0 . 7 6 3 . 5 7
C22:5 n-6 0 . 4 9 0 . 1 6 0 . 7 8 0 . 4 4 0 . 1 5 0 . 6 9 0 . 3 6 0 . 1 3 0 . 4 8 0 . 4 9 0 . 1 4 0 . 7 3
C22:5 n-3 (DPA ) 2 . 1 4 0 . 6 0 2 . 9 8 1 . 8 9 0 . 5 9 2 . 9 2 1 . 9 7 0 . 6 5 2 . 8 2 1 . 8 3 0 . 5 0 2 . 6 7
C22:6 n-3 (DHA) 4 . 8 8 1 . 4 4 7 . 3 5 5 . 1 2 1 . 5 3 7 . 4 6 5 . 2 3 1 . 9 1 7 . 4 3 5 . 0 2 1 . 4 9 7 . 1 7
S FA 5 0 . 2 2 9 . 1 7 6 6 . 6 0 5 0 . 6 9 8 . 8 7 6 3 . 5 9 4 7 . 8 0 7 . 4 5 5 6 . 1 1 5 0 . 9 7 9 . 3 2 6 4 . 1 7
M U FA 1 5 . 0 2 2 . 6 2 1 8 . 7 1 1 5 . 1 4 2 . 9 7 1 8 . 9 9 1 7 . 6 9 5 . 3 1 2 8 . 9 2 1 4 . 7 5 3 . 0 0 1 8 . 9 5
omega 6 2 6 . 4 3 5 . 4 5 3 3 . 6 8 2 5 . 8 1 5 . 7 7 3 3 . 7 4 2 5 . 9 8 4 . 8 5 3 2 . 3 4 2 6 . 1 4 6 . 0 5 3 4 . 2 6
omega 3 7 . 9 6 2 . 2 6 1 1 . 6 7 8 . 0 2 2 . 2 3 1 1 . 5 4 8 . 1 8 2 . 6 0 1 1 . 0 0 7 . 7 9 2 . 1 2 1 0 . 9 9
omega 6/omega 3 3 . 4 7 0 . 7 8 4 . 6 2 3 . 3 5 0 . 7 4 4 . 0 2 3 . 4 6 1 . 1 4 5 . 8 9 3 . 4 5 0 . 6 3 4 . 0 0
L A / A L A 6 8 . 5 0 3 4 . 5 7 1 3 1 . 2 0 5 3 . 1 7 2 2 . 5 5 9 5 . 9 3 6 4 . 2 1 3 0 . 3 9 1 1 9 . 1 0 5 9 . 0 8 2 6 . 4 3 1 0 3 . 4 2
FOURTH PART - Nutritional intakes and exposure to contaminants 87
POISSON 4.3 GB.qxd 17.9.2006 20:19 Page 87

88 FOURTH PART - Nutritional intakes and exposure to contaminants
Table 37: Fatty acid composition of red blood cells – Toulon (% total FA)
Adult men Adult women Older subjects Women of childbearing age
(18-64 y) (18-64 y) (65 y and more) (18-44 y)
n = 1 7 n = 6 9 n = 9 n = 4 1
M e a n S D P 9 5 M e a n S D P 9 5 M e a n S D P 9 5 M e a n S D P 9 5
Triglycerides (g/L) 1 . 2 6 0 . 5 9 2 . 0 6 0 . 8 8 0 . 6 0 1 . 8 8 1 . 0 0 0 . 3 5 1 . 5 6 0 . 9 0 0 . 6 6 2 . 0 4
Total cholesterol (g/L) 2 . 1 2 0 . 3 5 2 . 7 3 2 . 0 3 0 . 3 8 2 . 6 2 2 . 3 7 0 . 5 4 3 . 2 2 1 . 9 0 0 . 3 5 2 . 4 4
HDL (g/L) 0 . 4 2 0 . 1 0 0 . 5 6 0 . 5 4 0 . 1 6 0 . 8 5 0 . 6 2 0 . 1 7 0 . 8 4 0 . 4 8 0 . 1 3 0 . 7 7
C h o l e s t e r o l / H D L 5 . 4 0 1 . 7 9 9 . 1 4 4 . 0 1 1 . 1 3 6 . 1 5 3 . 9 1 0 . 7 2 4 . 8 8 4 . 1 5 1 . 2 1 6 . 2 0
LDL (g/L) 1 . 4 5 0 . 3 2 1 . 9 7 1 . 3 2 0 . 3 2 1 . 8 4 1 . 5 5 0 . 3 7 2 . 0 9 1 . 2 4 0 . 3 0 1 . 7 5
Fatty acids (% total lipids)
C 1 2 : 0 0 . 7 7 0 . 4 0 1 . 3 7 0 . 6 9 0 . 3 4 1 . 2 6 0 . 7 0 0 . 2 8 1 . 0 6 0 . 6 8 0 . 3 7 1 . 2 8
C 1 4 : 0 1 . 3 8 0 . 5 4 1 . 9 6 1 . 2 1 0 . 4 9 1 . 9 2 1 . 4 2 0 . 4 3 1 . 8 8 1 . 1 9 0 . 5 4 1 . 9 4
C14:1 n-5 0 . 3 4 0 . 1 5 0 . 5 8 0 . 3 4 0 . 1 7 0 . 5 9 0 . 3 4 0 . 0 8 0 . 4 3 0 . 3 3 0 . 1 6 0 . 5 8
C 1 5 : 0 1 . 0 0 0 . 3 4 1 . 5 2 0 . 8 0 0 . 3 5 1 . 4 7 0 . 7 7 0 . 3 9 1 . 3 7 0 . 7 7 0 . 3 7 1 . 5 2
C 1 6 : 0 2 2 . 9 4 3 . 5 5 2 7 . 8 7 2 1 . 3 2 3 . 4 9 2 7 . 0 6 2 2 . 1 1 2 . 6 0 2 6 . 1 8 2 1 . 2 4 3 . 4 5 2 6 . 7 3
C16:1 n-9 0 . 6 8 0 . 2 1 0 . 8 8 0 . 5 6 0 . 2 3 0 . 8 7 0 . 4 3 0 . 2 2 0 . 7 7 0 . 5 1 0 . 2 4 0 . 8 7
C16:1 n-7 1 . 1 9 0 . 6 0 1 . 9 6 1 . 2 6 0 . 6 4 2 . 2 2 1 . 2 4 0 . 7 3 2 . 4 9 1 . 2 9 0 . 6 9 2 . 2 5
C 1 8 : 0 2 6 . 3 7 4 . 3 8 3 2 . 2 3 2 3 . 7 6 5 . 4 4 3 3 . 9 8 2 5 . 8 4 8 . 0 0 3 9 . 0 3 2 3 . 2 6 5 . 5 3 3 3 . 1 0
C18:1 n-9t 0 . 2 7 0 . 1 3 0 . 4 9 0 . 2 4 0 . 1 3 0 . 4 3 0 . 2 2 0 . 1 4 0 . 4 4 0 . 2 3 0 . 1 2 0 . 4 2
C18:1 n-9 1 4 . 4 1 2 . 4 5 1 7 . 9 2 1 5 . 0 5 2 . 7 6 1 9 . 5 6 1 5 . 0 9 3 . 3 6 1 9 . 8 7 1 5 . 2 5 2 . 8 5 1 8 . 8 6
C18:1 n-7 1 . 4 4 0 . 2 4 1 . 8 1 1 . 4 2 0 . 3 1 1 . 9 3 1 . 4 3 0 . 2 7 1 . 8 1 1 . 4 2 0 . 3 0 1 . 9 1
C18:2 n-6 (LA) 1 0 . 3 0 2 . 0 6 1 3 . 8 0 1 1 . 7 4 3 . 3 3 1 7 . 7 0 1 1 . 6 9 2 . 8 3 1 5 . 8 2 1 2 . 0 7 2 . 9 8 1 7 . 8 3
C18:3 n-6 0 . 1 7 0 . 0 9 0 . 3 2 0 . 1 4 0 . 0 9 0 . 3 1 0 . 1 7 0 . 0 9 0 . 3 0 0 . 1 4 0 . 0 9 0 . 3 0
C18:3 n-3 (ALA) 0 . 2 0 0 . 1 3 0 . 4 7 0 . 2 6 0 . 1 3 0 . 4 7 0 . 3 0 0 . 0 9 0 . 4 0 0 . 2 4 0 . 1 0 0 . 4 3
C 2 0 : 0 0 . 2 8 0 . 1 1 0 . 4 3 0 . 2 7 0 . 1 1 0 . 4 3 0 . 2 8 0 . 1 0 0 . 4 3 0 . 2 5 0 . 1 1 0 . 4 2
C20:2 n-6 0 . 4 2 0 . 1 4 0 . 6 6 0 . 3 8 0 . 2 0 0 . 7 4 0 . 3 9 0 . 1 5 0 . 5 8 0 . 3 8 0 . 1 9 0 . 7 4
C20:3 n-6 1 . 1 5 0 . 4 4 1 . 8 9 1 . 2 1 0 . 3 4 1 . 7 5 1 . 1 5 0 . 4 2 1 . 7 5 1 . 2 5 0 . 3 4 1 . 7 8
C20:4 n-6 (AA) 9 . 8 0 3 . 9 9 1 5 . 7 9 1 1 . 1 3 4 . 1 4 1 6 . 0 4 9 . 6 6 4 . 1 7 1 5 . 2 5 1 1 . 3 6 4 . 1 0 1 5 . 7 9
C20:5 n-3 (EPA ) 0 . 5 2 0 . 2 6 0 . 8 3 0 . 6 2 0 . 3 1 1 . 0 5 0 . 5 4 0 . 2 9 0 . 9 7 0 . 5 2 0 . 2 2 0 . 8 5
C22:4 n-6 1 . 8 3 0 . 8 9 3 . 0 5 2 . 1 7 1 . 0 6 3 . 7 0 1 . 8 6 1 . 2 8 3 . 7 2 2 . 3 9 1 . 1 6 4 . 1 2
C22:5 n-6 0 . 3 7 0 . 2 0 0 . 6 8 0 . 4 1 0 . 2 6 0 . 8 9 0 . 2 7 0 . 1 7 0 . 5 4 0 . 4 4 0 . 2 9 0 . 9 5
C22:5 n-3 (DPA ) 1 . 3 8 0 . 7 4 2 . 6 6 1 . 5 5 0 . 6 6 2 . 6 4 1 . 3 8 0 . 4 7 1 . 9 1 1 . 5 5 0 . 6 5 2 . 5 8
C22:6 n-3 (DHA) 2 . 7 9 2 . 0 0 5 . 8 6 3 . 4 9 1 . 8 0 6 . 7 9 2 . 7 2 1 . 1 3 4 . 1 9 3 . 2 5 1 . 8 5 6 . 8 7
S FA 5 2 . 7 3 8 . 1 6 6 3 . 3 0 4 8 . 0 3 8 . 6 2 6 4 . 4 9 5 1 . 1 3 8 . 8 6 6 5 . 9 8 4 7 . 3 9 8 . 3 6 6 3 . 2 3
M U FA 1 8 . 0 6 2 . 4 0 2 1 . 9 8 1 8 . 6 2 2 . 8 9 2 3 . 2 7 1 8 . 5 3 4 . 0 7 2 4 . 6 5 1 8 . 8 1 3 . 1 2 2 3 . 1 2
omega 6 2 4 . 0 4 6 . 0 2 3 0 . 6 4 2 7 . 1 9 6 . 5 3 3 6 . 2 3 2 5 . 2 0 6 . 0 3 3 1 . 5 9 2 8 . 0 3 6 . 4 3 3 6 . 7 5
omega 3 4 . 9 0 2 . 8 2 9 . 4 5 5 . 9 2 2 . 4 8 1 0 . 5 1 4 . 9 3 1 . 6 7 7 . 1 0 5 . 5 5 2 . 4 9 1 0 . 3 9
omega 6/omega 3 6 . 0 7 2 . 5 9 1 0 . 1 6 5 . 1 7 1 . 7 9 8 . 3 5 5 . 3 7 1 . 2 7 7 . 1 2 5 . 7 5 1 . 9 1 8 . 4 7
L A / A L A 6 7 . 6 5 3 5 . 2 2 1 1 7 . 6 7 5 6 . 4 8 3 0 . 2 3 9 9 . 2 0 4 2 . 5 0 1 6 . 9 3 7 0 . 3 9 6 1 . 2 9 2 9 . 9 8 9 9 . 4 2
POISSON 4.3 GB.qxd 17.9.2006 20:19 Page 88

Table 38: Composition in EPA, DPA, DHA and omega 3 of the red blood cells of the subjects of alla reas re g a rdless of the age and sex (% total lipids, Mean ± SD)
Table 38 shows that heavy consumers in Toulon have significantly less EPA in their erythrocyte membranethan subjects in the other zones (p<0.05). The people in La Rochelle have erythrocyte DPA, DHA andomega 3 levels significantly higher than those in the other zones, although the differences are relativelys m a l l .
4.2 Exposure to trace elements
4.2.1 Food exposure
As for fatty acids, it is important to note that the results presented in this section correspond to theexposure to the trace elements only through consumption of fish and seafood, not through the totaldiet. Nevertheless, as stated in the first part, food (and fish and seafood in particular) remain the maincontributor of exposure to arsenic, organic tin and mercury, particularly methylmercury, its most toxicform. The intake results are presented in Tables 39 to 43. The contributions of food to the exposure tothe different contaminants and to the TRV are presented in the Appendix 5 and 6.
Some of the contamination data being censured (levels below the limit of detection), these have beentaken to be equal to 1/2 LOD, particularly As(V) and octyltins for which almost all the data were censured.
Arsenic : The average exposure to total arsenic (AsT) of 84.0 ± 64.2 µg/kg bw/week is very much higherthan the average intake of French people estimated in 2004 to be 6.2 µg/kg bw/week (see Introduction).The proportion of inorganic arsenic in the total arsenic of 0.8% is consistent with the figures of 0.4% to5% usually found in the literature6 3. The average exposure to inorganic arsenic is between 0.40 and0.72 µg/kg bw/week for men aged 18 to 64 years and between 0.52 and 0.85 µg/kg bw/week in womenof the same age group and the P95 reaches 1.82 µg/kg bw/week in these same women who are more
Le Havre L o r i e n t La Rochelle To u l o n All subjects
n = 8 4 n = 1 1 5 n = 9 7 n = 9 5 n = 3 9 1
E PA 0.83 ± 0.45 a 0.74 ± 0.35 a 0.81 ± 0.34 a 0.59 ± 0.30 b 0.74 ± 0.37
D PA 1.72 ± 0.40 a 1.63 ± 0.65 a 2.00 ± 0.61 b 1.51 ± 0.66 a 1.71 ± 0.62
D H A 4.16 ± 1.17 a 3.65 ± 1.52 a, c 5.04 ± 1.55 b 3.29 ± 1.80 c 4.02 ± 1.66
Omega 3* 6.96 ± 1.67 a 6.28 ± 2.14 a, c 8.02 ± 2.27 b 5.65 ± 2.50 c 6.70 ± 2.34
* The composition in Omega 3 corresponds to ALA, EPA, DPA and DHAValues in the same raw with different superscript letters are significantly different, p<0.05 (Tu k e y ’s test)
FOURTH PART - Nutritional intakes and exposure to contaminants 89
POISSON 4.3 GB.qxd 17.9.2006 20:19 Page 89

90 FOURTH PART - Nutritional intakes and exposure to contaminants
119 The InVS prefers using the USEPA's TRV (0.3 µg/kg bw/d or 2.1 µg/kg bw/wk) to the JECFA's PTWI. Using this value would mean an expo-s u re of 87% of this TRV for adult males in Lorient and that without the other food intakes.
exposed than the other groups, although these values remain well below the PTWI of 15 µg/kg bw/week3 8
(<15% of the PTWI)1 1 9 established by the JECFA, an intake that none of our subjects exceeds. However,inorganic arsenic may be absorbed from sources other than seafood, in particular from drinking water.The Appendix 5 show that the products contributing most to the exposure of our population to toxicinorganic arsenic are great scallop (8.6%), oyster (7.0%), cod (6.3%) and ray (5.1%). Some diff e r e n c e sare noticed between the different regions. While ray and cod appear to be major contributors to As andA sinorg exposure in all four zones, the great scallop is a majority contributor to Asi n o r g exposure only inLe Havre (15%) and in Toulon (14%), and the sea urchin is a majority contributor only in Toulon (12%).Nevertheless the fish and seafood consumption only provide 4.2% of the TRV (Appendix 6).
M e rcury : The data reveal that mercury is almost exclusively absorbed in the form of methylmercurywith an average exposure ranging from 0.88 to 1.50 µg MeHg/kg bw/week for adult males and from1.17 to 1.69 µg MeHg/kg bw/week for adult females. The exposure is of the same order of magnitudefor elderly subjects (1.26 to 1.79 µg MeHg/kg bw/week) and women of child-bearing age (1.07 to 1.60µg MeHg/kg bw/week). We should underline that these average exposures are close to or even abovethe JECFA's PTWI of 1.6 µg MeHg/kg bw/week. More than a third of the subjects (35%) have an intakeexceeding the PTWI. Among these 29% are in Lorient, 28% in La Rochelle, 28% in Toulon and 14% inLe Havre. A third (32%) are women of child-bearing age, considered to be the most sensitive populationin view of the effects of high exposure on the foetus. The 95th percentile exposure of women of child-bearing age is 3.09 µg MeHg/kg bw/week in La Rochelle and 4.26 µg MeHg/kg bw/week in Toulon, or1.9 and 2.7 times the PTWI respectively, and 2 to 3 times the P95 level of such women in the INCA survey3 2.
The products contributing most to MeHg exposure, in all the subjects combined, are tuna (19%), cod(7%), ling and sole (6% each), with little difference from one zone to another. Fish generally accountsfor 86% of the MeHg exposure, molluscs and crustaceans for 13% and other seafood for less than 2%(Appendix 5). This consumption contribute to 92% of the TRV with the same major contributors(Appendix 6).
Lead : The average exposures of high seafood consumers, even the highest percentiles, are well belowthe PTWI (25 µg/kg bw/week). The average exposure ranges from 0.27 to 0.49 µg/kg bw/week accordingto the group of individuals and the zone considered, or 1% to 2% of the PTWI. The highest P95 level isfound in women of child-bearing age in La Rochelle (1.14 µg/kg bw/week). The main contributor to leadexposure is sardine (17%), but we also note large contributions from hake in Lorient (28%), great scallopin Le Havre (22%), mussels in La Rochelle (16%) and sea urchin in Toulon (14%). We should rememberthat there exist contributors to lead exposure other than fish and seafood.
Cadmium : The highest average exposure, in Le Havre subjects (3.50 to 5.00 µg/kg bw/week), is less thanthe JECFA's PTWI of 7 µg/kg bw/week. However, in the French population fish and seafood representonly 8% to 25% of the cadmium intake via food. The exposure of our heavy consumers should beinterpreted with caution since it takes into account only their fish and seafood consumptions; theiraverage total diet exposure could be higher. The PTWI is exceeded by 8.5% of our subjects through theirfish and seafood consumption alone. The main contributors to this exposure are shrimp (16%), crab(15%), anchovy (10%), periwinkle (7%), great scallop (9%) and sardine (5%). However these contributionsare not the same in all zones: the main contributors in Le Havre are shrimp (60%), great scallop (14%)and catshark (10%); in Lorient they are crab (53%) and saithe (15%); in La Rochelle they are molluscs:periwinkle (21%), calico scallop (19%) and oyster (11%); in Toulon they are anchovy (23%) and greatscallop (20%). For the most exposed individuals in each zone (P90) we find the same main contributors(results not presented). These consumptions represent 35% of the TRV. Shrimps and crab are the majorcontributors (Appendix 6).
POISSON 4.3 GB.qxd 17.9.2006 20:19 Page 90

Organic tin : The average exposure to all the organostannic compounds does not exceed 0.14 µg Sn/kgbw/week, or 0.34 µg Sn/kg bw/week at P95, regardless of the zone, age group and sex, which representrespectively 19% and 47% of the PTWI fixed at 0.72 µg Sn/kg bw/week6 8 for TBT, DBT, TPT and DOTa l o n e .
Generally speaking, regardless of the zone considered and whatever the trace element, women andelderly subjects (≥ 65 years) are more exposed than men aged 18 to 64 years. More particularly, adultmales are significantly less exposed to inorganic arsenic than women of the same age group (p<0.05),all zones included.
Table 39: Food exposure of the high fish and seafood consumers to trace elements – Le Havre(µg/kg bw/week)
Adult men Adult women Older subjects Women of childbearing age(18-64 y) (18-64 y) (65 y and more) (18-44 y)
n = 4 4 n = 1 7 9 n = 2 6 n = 9 8M e a n S D P 9 5 M e a n S D P 9 5 M e a n S D P 9 5 M e a n S D P 9 5
A sT 5 9 . 4 9 4 3 . 3 1 1 4 4 . 6 5 8 9 . 7 9 7 0 . 5 6 2 4 2 . 8 3 8 7 . 9 7 5 6 . 0 3 2 0 0 . 1 8 7 8 . 9 3 6 3 . 1 3 2 1 2 . 6 4
A s B 5 7 . 0 2 4 2 . 0 9 1 3 5 . 9 6 8 5 . 2 0 6 6 . 0 8 2 3 0 . 0 9 8 3 . 5 8 5 3 . 0 1 1 8 5 . 9 4 7 5 . 4 5 5 9 . 3 7 1 9 2 . 0 0
M M A 0 . 2 2 0 . 1 9 0 . 5 5 0 . 2 9 0 . 3 6 0 . 7 7 0 . 2 9 0 . 2 9 0 . 9 4 0 . 3 1 0 . 4 5 1 . 0 4
D M A 0 . 3 4 0 . 2 6 0 . 8 1 0 . 4 4 0 . 3 6 1 . 1 4 0 . 4 4 0 . 3 1 0 . 9 4 0 . 4 4 0 . 3 9 1 . 2 9
A s ( I I I ) 0 . 4 4 0 . 3 7 1 . 1 3 0 . 5 8 0 . 5 0 1 . 5 0 0 . 6 5 0 . 4 0 1 . 3 9 0 . 5 2 0 . 3 9 1 . 4 6
A s ( V ) 0 . 0 6 0 . 0 3 0 . 1 3 0 . 0 8 0 . 0 5 0 . 1 9 0 . 0 7 0 . 0 4 0 . 1 6 0 . 0 8 0 . 0 5 0 . 2 0
A so r g 5 7 . 5 9 4 2 . 3 9 1 3 7 . 4 9 8 5 . 9 3 6 6 . 4 8 2 3 1 . 6 5 8 4 . 3 2 5 3 . 3 3 1 8 7 . 1 6 7 6 . 2 1 5 9 . 8 4 1 9 4 . 2 2
A si n o r g 0 . 4 9 0 . 3 9 1 . 2 4 0 . 6 7 0 . 5 4 1 . 6 9 0 . 7 2 0 . 4 4 1 . 5 6 0 . 6 0 0 . 4 4 1 . 6 2
H gT 0 . 8 7 0 . 5 5 1 . 9 4 1 . 1 7 1 . 1 5 2 . 6 9 1 . 2 5 1 . 2 2 3 . 4 5 1 . 0 4 0 . 9 6 2 . 2 8
M e H g 0 . 8 8 0 . 5 7 1 . 9 3 1 . 1 7 1 . 1 7 2 . 6 9 1 . 2 6 1 . 3 1 3 . 4 5 1 . 0 7 1 . 0 2 2 . 2 7
C d 3 . 5 0 2 . 3 2 7 . 2 3 5 . 0 0 5 . 0 4 1 2 . 7 0 4 . 1 5 4 . 3 3 9 . 6 9 4 . 6 4 4 . 1 7 1 1 . 8 2
P b 0 . 2 7 0 . 2 1 0 . 6 5 0 . 3 5 0 . 3 1 0 . 7 9 0 . 3 7 0 . 2 6 0 . 6 6 0 . 3 1 0 . 2 6 0 . 7 8
O T CT 0 . 1 1 0 . 0 7 0 . 2 1 0 . 1 4 0 . 1 0 0 . 3 4 0 . 1 3 0 . 0 9 0 . 3 4 0 . 1 3 0 . 0 9 0 . 3 4
B u t y l 0 . 0 9 0 . 0 6 0 . 1 8 0 . 1 1 0 . 0 8 0 . 2 9 0 . 1 0 0 . 0 8 0 . 2 8 0 . 1 0 0 . 0 8 0 . 2 7
P h é n y l 0 . 0 2 0 . 0 1 0 . 0 3 0 . 0 2 0 . 0 2 0 . 0 6 0 . 0 2 0 . 0 2 0 . 0 5 0 . 0 2 0 . 0 2 0 . 0 4
O c t y l 0 . 0 0 0 . 0 0 0 . 0 1 0 . 0 1 0 . 0 0 0 . 0 1 0 . 0 0 0 . 0 0 0 . 0 1 0 . 0 1 0 . 0 0 0 . 0 1
A sT: total arsenic, Aso r g: organic arsenic, Asi n o r g: inorganic arsenic, HgT: total mercury, OTCT: All organostannic compounds,in µg Sn/kg bw/wk, Butyl: butyltin, Phenyl: phenyltin, Octyl: octyltin.
FOURTH PART - Nutritional intakes and exposure to contaminants 91
POISSON 4.3 GB.qxd 17.9.2006 20:19 Page 91

92 FOURTH PART - Nutritional intakes and exposure to contaminants
Table 40: Food exposure of the high fish and seafood consumers to trace elements – Lorient(µg/kg bw/week)
Table 41: Food exposure of the high fish and seafood consumers to trace elements –La Rochelle (µg/kg bw/week)
Adult men Adult women Older subjects Women of childbearing age(18-64 y) (18-64 y) (65 y and more) (18-44 y)
n = 8 7 n = 1 2 2 n = 3 9 n = 7 8M e a n S D P 9 5 M e a n S D P 9 5 M e a n S D P 9 5 M e a n S D P 9 5
A sT 6 4 . 7 8 5 3 . 5 0 1 5 3 . 8 8 7 7 . 3 8 5 0 . 8 2 1 7 5 . 5 8 8 6 . 6 4 5 5 . 7 7 1 8 9 . 2 0 6 9 . 2 7 4 3 . 5 7 1 5 6 . 6 1
A s B 5 9 . 0 6 4 8 . 3 6 1 3 9 . 1 8 7 0 . 9 6 4 5 . 4 2 1 5 5 . 3 8 7 7 . 4 2 4 8 . 6 4 1 6 9 . 1 3 6 3 . 4 9 3 9 . 3 4 1 4 2 . 3 6
M M A 0 . 1 3 0 . 1 1 0 . 3 6 0 . 1 5 0 . 1 2 0 . 3 7 0 . 1 6 0 . 1 1 0 . 3 4 0 . 1 5 0 . 1 2 0 . 3 7
D M A 0 . 5 8 0 . 4 8 1 . 2 2 0 . 7 5 0 . 5 4 1 . 7 4 0 . 8 3 0 . 5 1 1 . 5 8 0 . 7 3 0 . 5 9 2 . 0 2
A s ( I I I ) 0 . 3 2 0 . 2 2 0 . 6 9 0 . 4 2 0 . 2 8 0 . 9 3 0 . 3 9 0 . 2 8 0 . 9 3 0 . 4 1 0 . 3 0 0 . 9 1
A s ( V ) 0 . 0 8 0 . 0 5 0 . 1 5 0 . 0 9 0 . 0 5 0 . 2 1 0 . 0 9 0 . 0 4 0 . 1 7 0 . 0 9 0 . 0 5 0 . 2 0
A so r g 5 9 . 7 7 4 8 . 7 3 1 4 0 . 4 8 7 1 . 8 6 4 5 . 7 5 1 5 7 . 5 8 7 8 . 4 1 4 8 . 9 1 1 7 0 . 0 4 6 4 . 3 8 3 9 . 6 8 1 4 3 . 6 8
A si n o r g 0 . 4 0 0 . 2 6 0 . 7 9 0 . 5 2 0 . 3 3 1 . 0 9 0 . 4 8 0 . 3 2 1 . 0 7 0 . 5 0 0 . 3 4 1 . 0 9
H gT 1 . 3 9 1 . 2 9 3 . 0 1 1 . 5 9 1 . 1 5 3 . 5 2 1 . 7 5 1 . 0 6 3 . 5 8 1 . 3 9 0 . 9 2 3 . 0 3
M e H g 1 . 4 2 1 . 2 7 3 . 0 8 1 . 6 5 1 . 1 9 3 . 6 2 1 . 7 9 1 . 0 9 3 . 8 1 1 . 4 3 0 . 9 6 3 . 0 9
C d 1 . 2 2 2 . 1 6 3 . 2 6 1 . 7 2 2 . 4 6 6 . 0 6 1 . 5 5 1 . 7 8 5 . 1 9 1 . 9 2 2 . 9 2 7 . 8 5
P b 0 . 3 8 0 . 3 0 0 . 7 6 0 . 4 8 0 . 3 1 1 . 1 3 0 . 4 9 0 . 3 2 1 . 0 6 0 . 4 7 0 . 3 4 1 . 1 4
O T CT 0 . 0 7 0 . 0 5 0 . 1 4 0 . 0 9 0 . 0 5 0 . 2 0 0 . 0 8 0 . 0 4 0 . 1 6 0 . 0 8 0 . 0 5 0 . 1 8
B u t y l 0 . 0 5 0 . 0 4 0 . 1 1 0 . 0 7 0 . 0 4 0 . 1 4 0 . 0 6 0 . 0 3 0 . 1 1 0 . 0 6 0 . 0 4 0 . 1 4
P h é n y l 0 . 0 1 0 . 0 1 0 . 0 3 0 . 0 2 0 . 0 1 0 . 0 4 0 . 0 2 0 . 0 1 0 . 0 3 0 . 0 1 0 . 0 1 0 . 0 3
O c t y l 0 . 0 1 0 . 0 0 0 . 0 1 0 . 0 1 0 . 0 0 0 . 0 2 0 . 0 1 0 . 0 0 0 . 0 1 0 . 0 1 0 . 0 0 0 . 0 1
A sT: total arsenic, Aso r g: organic arsenic, Asi n o r g: inorganic arsenic, HgT: total mercury, OTCT: All organostannic compounds,in µg Sn/kg bw/wk, Butyl: butyltin, Phenyl: phenyltin, Octyl: octyltin.
Adult men Adult women Older subjects Women of childbearing age(18-64 y) (18-64 y) (65 y and more) (18-44 y)
n = 5 2 n = 1 5 8 n = 3 7 n = 7 6
M e a n S D P 9 5 M e a n S D P 9 5 M e a n S D P 9 5 M e a n S D P 9 5
A sT 9 1 . 5 8 5 3 . 5 4 1 9 9 . 7 9 1 0 4 . 4 7 7 4 . 6 4 2 3 2 . 8 0 1 1 6 . 8 4 6 7 . 2 8 2 4 4 . 4 7 9 7 . 5 3 8 1 . 4 3 2 3 0 . 2 6
A s B 8 2 . 9 6 3 7 . 4 9 1 8 1 . 0 1 9 5 . 6 4 6 9 . 7 3 2 1 9 . 0 4 1 0 8 . 9 3 6 4 . 0 4 2 2 8 . 0 1 8 9 . 6 6 7 6 . 5 1 2 2 0 . 4 4
M M A 0 . 3 1 1 . 1 4 0 . 6 8 0 . 3 2 0 . 3 8 0 . 7 4 0 . 3 2 0 . 3 1 0 . 8 4 0 . 2 7 0 . 4 2 0 . 5 3
D M A 0 . 8 1 0 . 3 7 2 . 0 7 0 . 7 6 0 . 7 2 2 . 0 1 0 . 6 1 0 . 4 2 1 . 4 0 0 . 6 8 0 . 7 6 1 . 9 2
A s ( I I I ) 0 . 6 4 0 . 2 7 1 . 3 8 0 . 7 5 0 . 5 7 1 . 6 3 0 . 7 2 0 . 4 0 1 . 4 9 0 . 6 8 0 . 6 2 1 . 5 4
A s ( V ) 0 . 0 9 0 . 0 1 0 . 1 7 0 . 0 9 0 . 0 5 0 . 1 8 0 . 0 9 0 . 0 4 0 . 1 7 0 . 0 9 0 . 0 6 0 . 1 8
A so r g 8 4 . 0 8 3 9 . 0 0 1 8 3 . 5 0 9 6 . 7 2 7 0 . 5 5 2 2 0 . 5 7 1 0 9 . 8 5 6 4 . 5 3 2 2 9 . 7 2 9 0 . 6 1 7 7 . 4 7 2 2 2 . 6 8
A si n o r g 0 . 7 2 0 . 2 9 1 . 5 4 0 . 8 5 0 . 6 2 1 . 8 2 0 . 8 1 0 . 4 3 1 . 6 7 0 . 7 7 0 . 6 7 1 . 7 1
H gT 1 . 4 0 0 . 2 1 3 . 1 1 1 . 6 3 1 . 1 3 3 . 7 5 1 . 7 4 0 . 8 9 3 . 3 2 1 . 5 0 1 . 1 5 2 . 7 9
M e H g 1 . 4 4 0 . 3 4 3 . 1 0 1 . 6 7 1 . 1 5 3 . 6 7 1 . 7 5 0 . 8 9 3 . 3 0 1 . 5 4 1 . 1 6 2 . 8 0
C d 3 . 1 0 1 . 3 6 8 . 7 9 2 . 9 2 3 . 1 4 1 0 . 0 4 2 . 2 4 2 . 4 9 6 . 4 4 2 . 6 2 2 . 7 0 6 . 6 3
P b 0 . 4 3 0 . 2 9 0 . 9 6 0 . 4 4 0 . 3 1 0 . 9 4 0 . 4 3 0 . 2 3 0 . 8 1 0 . 4 0 0 . 3 0 0 . 9 3
O T CT 0 . 0 7 0 . 0 3 0 . 1 2 0 . 0 7 0 . 0 4 0 . 1 6 0 . 0 7 0 . 0 3 0 . 1 2 0 . 0 7 0 . 0 5 0 . 1 5
B u t y l 0 . 0 5 0 . 0 2 0 . 0 9 0 . 0 5 0 . 0 3 0 . 1 1 0 . 0 4 0 . 0 2 0 . 0 7 0 . 0 5 0 . 0 3 0 . 1 0
P h é n y l 0 . 0 1 0 . 0 1 0 . 0 3 0 . 0 2 0 . 0 1 0 . 0 4 0 . 0 2 0 . 0 1 0 . 0 3 0 . 0 2 0 . 0 1 0 . 0 4
O c t y l 0 . 0 1 0 . 0 0 0 . 0 1 0 . 0 1 0 . 0 0 0 . 0 1 0 . 0 1 0 . 0 0 0 . 0 1 0 . 0 1 0 . 0 0 0 . 0 1
A sT: total arsenic, Aso r g: organic arsenic, Asi n o r g: inorganic arsenic, HgT: total mercury, OTCT: All organostannic compounds,in µg Sn/kg bw/wk, Butyl: butyltin, Phenyl: phenyltin, Octyl: octyltin.
POISSON 4.3 GB.qxd 17.9.2006 20:19 Page 92

Table 42: Food exposure of the high fish and seafood consumers to trace elements – Toulon(µg/kg bw/week)
Table 43: Food exposure of the high fish and seafood consumers to trace elements of all areasregardless of the age and sex (µg/kg bw/week, Mean ± SD)
Le Havre L o r i e n t La Rochelle To u l o n All subjects
n = 2 4 9 n = 2 4 7 n = 2 4 8 n = 2 5 2 n = 9 9 6
A sT 84.2 ± 65.9 a 104 ± 69.7 b 74.4 ± 52.9 a 73.9 ± 62.8 a 84.0 ± 64.2
A si n o r g 0.64 ± 0.51 a 0.81 ± 0.56 b 0.47 ± 0.31 c 0.64 ± 0.81 a 0.64 ± 0.59
P b 0.34 ± 0.29 a 0.44 ± 0.29 b 0.45 ± 0.31 b 0.40 ± 0.51 a. b 0.41 ± 0.37
C d 4.64 ± 4.63 a 2.86 ± 3.01 b 1.52 ± 2.27 c 0.77 ± 0.74d 2.44 ± 3.34
H gT 1.12 ± 1.08 a 1.60 ± 1.04 b 1.55 ± 1.19 b 1.66 ± 1.38b 1.48 ± 1.20
M e H g 1.13 ± 1.11 a 1.63 ± 1.05 b 1.59 ± 1.21 b 1.63 ± 1.35b 1.49 ± 1.20
O T CT 0.13 ± 0.09 a 0.07 ± 0.04 b 0.08 ± 0.05 b 0.11 ± 0.07 c 0.10 ± 0.07
A sT: total arsenic, Asi n o r g: inorganic arsenic, HgT: total mercury, OTCT: All organostannic compounds, in µg Sn/kg bw/wkValues in the same raw with different superscript letters are significantly different, p<0.05 (Tu k e y ’s test)
Adult men Adult women Older subjects Women of childbearing age(18-64 y) (18-64 y) (65 y and more) (18-44 y)
n = 6 0 n = 1 7 1 n = 2 1 n = 9 2M e a n S D P 9 5 M e a n S D P 9 5 M e a n S D P 9 5 M e a n S D P 9 5
A sT 6 4 . 5 3 5 7 . 3 3 1 4 3 . 3 4 7 6 . 3 2 6 5 . 0 2 2 2 2 . 0 4 8 0 . 4 2 5 8 . 9 4 1 4 6 . 5 5 7 2 . 0 0 6 3 . 0 0 2 3 2 . 7 7
A s B 5 4 . 6 3 4 7 . 5 4 1 2 0 . 9 7 6 6 . 6 3 5 7 . 2 8 1 9 3 . 3 1 6 9 . 7 8 5 2 . 4 2 1 3 1 . 7 8 6 3 . 0 6 5 5 . 8 6 2 0 9 . 7 0
M M A 0 . 1 0 0 . 0 9 0 . 2 5 0 . 1 2 0 . 1 0 0 . 2 6 0 . 1 0 0 . 0 6 0 . 2 0 0 . 1 2 0 . 1 1 0 . 3 0
D M A 0 . 4 9 0 . 4 0 1 . 2 4 0 . 5 2 0 . 3 7 1 . 1 8 0 . 6 0 0 . 3 8 1 . 0 4 0 . 5 2 0 . 3 9 1 . 2 1
A s ( I I I ) 0 . 5 0 0 . 4 9 1 . 5 8 0 . 5 8 0 . 8 7 1 . 6 1 0 . 4 9 0 . 4 5 1 . 5 3 0 . 4 6 0 . 4 1 1 . 4 5
A s ( V ) 0 . 0 8 0 . 0 5 0 . 1 5 0 . 0 9 0 . 0 6 0 . 2 0 0 . 0 8 0 . 0 3 0 . 1 1 0 . 0 9 0 . 0 5 0 . 1 8
A so r g 5 5 . 2 3 4 7 . 9 6 1 2 2 . 0 8 6 7 . 2 7 5 7 . 6 1 1 9 4 . 3 6 7 0 . 4 8 5 2 . 6 9 1 3 2 . 7 4 6 3 . 7 0 5 6 . 1 6 2 1 1 . 5 6
A sinorg 0 . 5 8 0 . 5 4 1 . 8 1 0 . 6 7 0 . 9 1 1 . 7 8 0 . 5 6 0 . 4 7 1 . 6 3 0 . 5 5 0 . 4 5 1 . 6 7
H gT 1 . 5 4 1 . 3 1 4 . 7 3 1 . 7 1 1 . 4 4 4 . 1 1 1 . 5 4 1 . 1 3 3 . 0 5 1 . 6 1 1 . 2 7 3 . 8 7
M e H g 1 . 5 0 1 . 2 9 4 . 0 9 1 . 6 9 1 . 4 2 4 . 4 3 1 . 5 0 0 . 8 0 2 . 8 7 1 . 6 0 1 . 2 9 4 . 2 6
C d 0 . 8 3 0 . 7 5 2 . 1 6 0 . 7 6 0 . 7 6 1 . 9 2 0 . 6 7 0 . 6 6 2 . 2 8 0 . 7 1 0 . 7 9 1 . 7 3
P b 0 . 3 8 0 . 3 0 0 . 9 6 0 . 4 2 0 . 5 9 1 . 1 9 0 . 3 9 0 . 2 7 0 . 7 7 0 . 3 6 0 . 4 0 1 . 0 3
O T CT 0 . 1 0 0 . 0 5 0 . 1 8 0 . 1 1 0 . 0 8 0 . 2 7 0 . 0 9 0 . 0 4 0 . 1 4 0 . 1 1 0 . 0 8 0 . 2 7
B u t y l 0 . 0 8 0 . 0 4 0 . 1 6 0 . 0 9 0 . 0 6 0 . 2 1 0 . 0 7 0 . 0 3 0 . 1 1 0 . 0 9 0 . 0 7 0 . 2 2
P h é n y l 0 . 0 1 0 . 0 1 0 . 0 3 0 . 0 2 0 . 0 1 0 . 0 4 0 . 0 1 0 . 0 1 0 . 0 2 0 . 0 2 0 . 0 1 0 . 0 3
O c t y l 0 . 0 1 0 . 0 1 0 . 0 2 0 . 0 1 0 . 0 1 0 . 0 2 0 . 0 1 0 . 0 0 0 . 0 1 0 . 0 1 0 . 0 1 0 . 0 2
A sT: total arsenic, Aso r g: organic arsenic, Asi n o r g: inorganic arsenic, HgT: total mercury, OTCT: All organostannic compounds,
in µg Sn/kg bw/wk, Butyl: butyltin, Phenyl: phenyltin, Octyl: octyltin.
FOURTH PART - Nutritional intakes and exposure to contaminants 93
POISSON 4.3 GB.qxd 17.9.2006 20:19 Page 93

94 FOURTH PART - Nutritional intakes and exposure to contaminants
Table 43 indicates that the total arsenic exposure in Lorient is significantly higher than in the other zones(p<0.05). For inorganic arsenic, the most toxic form (Asi n o r g), the subjects in Lorient are also significantlymore exposed and the subjects in La Rochelle are significantly less exposed than those in the other zones.
Regarding cadmium, we observe a significant north-south exposure gradient (p<0.05) with a maximumin Le Havre and a minimum in Toulon. On the other hand, for mercury (HgT) and more particularlymethylmercury the exposure of subjects is significantly less in Le Havre than in the other zones.
F i n a l l y, for organostannic compounds (OTCT) we observe that subjects in Le Havre and Toulon aresignificantly more exposed than people in the other zones (p<0.05).
4.2.2 Biomarkers of exposure
Table 44 presents the trace element concentrations found in the blood of our tested subjects.
Lead : Twenty-two subjects (6% of the subjects for which a blood sample was taken) display a bloodlevel exceeding the so-called “standard” (90 µg/L for men, 70 µg/L for women)1 2 0, but none exceed theconcentration of 200 µg/L above which medical monitoring is required. The average lead levels in theblood range from 27.1 to 52.3 µg/L in individuals aged 18 to 64 years; they are slightly higher in elderlysubjects at 40.7 to 77.2 µg/L.
M e rcury : For total mercury, 13 subjects (3%) exceed the “standard” of 10 µg/L of blood1 2 0. In all thezones women of child-bearing age (under 45 years old) are the group with the lowest Hg and MeHglevels in the blood (1.91 to 4.13 µg/L and 2.29 to 3.39 µg/L respectively, depending on the zone). Elderlysubjects constitute the group with the highest levels, except in Toulon (3.12 to 5.91 µg Hg/L and 3.85 to5.34 µg MeHg/L). The P95 level is 9.07 µg MeHg/L in Toulon and 9.69 µg MeHg/L in Le Havre.
Cadmium : The urinary cadmium level is the biomarker usually used (see Introduction). Neverthelessdepending on the zone, the average cadmium levels in the blood range from 0.42 to 0.94 µg/L for menor from 0.54 to 0.64 µg/L for women aged 18 to 64 years. A concentration exceeding the “standard”(1 µg/L for non-smokers and 2 µg/L for smokers)1 2 0 was found in 18 individuals (4.6%). No individualsexceeded the concentration associated with toxicity (20 µg/L).
120 The “standard value”, or re f e rence value, corresponds to the P95 level for the general French population which is not professionally expo-sed. This value is absolutely not an upper limit which must not be exceeded (see Table 10, p28).
POISSON 4.3 GB.qxd 17.9.2006 20:19 Page 94

Table 44: Blood concentrations in trace elements (µg/L)
C d P b H gT M e H g
Adult men (18-64 y) n=18M e a n 0 . 4 2 3 6 . 4 2 . 6 2 . 9 5
S D 0 . 3 4 1 9 . 6 2 . 5 4 2 . 4 0
Adult women (18-64 y) n=59M e a n 0 . 5 4 2 8 . 9 2 . 7 5 3 . 4 4
S D 0 . 4 4 1 4 . 9 2 . 0 5 2 . 5 3
Older subjects (65 y and more) n=6M e a n 0 . 4 9 4 0 . 7 3 . 1 2 3 . 8 5
S D 0 . 1 9 1 4 . 9 2 . 3 1 2 . 8 7
Women of childbearing age (18-44 y) n=28M e a n 0 . 6 2 2 0 . 6 1 . 9 1 2 . 2 9
S D 0 . 5 4 7 . 0 2 1 . 4 1 1 . 2 7
M e a n 0 . 5 1 3 1 . 4 2 . 7 6 3 . 3 7
All subjects n=83 S D 0 . 4 1 1 6 . 3 2 . 1 6 2 . 5 1
P 9 5 1 . 4 3 5 7 . 6 7 . 4 9 9 . 6 9
Adult men (18-64 y) n=21M e a n 0 . 9 4 4 0 . 6 3 . 2 7 3 . 3 2
S D 1 . 0 0 2 0 . 1 1 . 6 4 1 . 8 2
Adult women (18-64 y) n=84M e a n 0 . 5 7 2 7 . 1 3 . 6 1 3 . 5 7
S D 0 . 4 4 1 3 . 1 2 . 3 5 2 . 2 7
Older subjects (65 y and more) n=10M e a n 0 . 5 5 5 4 . 1 4 . 8 3 5 . 3 4
S D 0 . 2 6 3 9 . 5 3 . 1 5 3 . 5 1
Women of childbearing age (18-44 y) n=39M e a n 0 . 6 5 2 1 . 1 2 . 5 4 2 . 5 5
S D 0 . 5 3 1 1 . 7 1 . 6 5 1 . 4 9
M e a n 0 . 6 3 3 1 . 9 3 . 6 5 3 . 6 8
All subjects n=115 S D 0 . 5 9 1 9 . 8 2 . 3 3 2 . 3 6
P 9 5 1 . 7 2 6 9 . 6 8 . 4 0 8 . 3 4
Adult men (18-64 y) n=38M e a n 0 . 7 6 5 2 . 3 4 . 0 7 3 . 5 5
S D 0 . 9 0 2 2 . 7 2 . 5 5 2 . 1 8
Adult women (18-64 y) n=46M e a n 0 . 6 4 3 9 . 3 4 . 6 1 3 . 7 4
S D 0 . 4 8 2 2 . 3 3 . 3 8 3 . 0 2
Older subjects (65 y and more) n=14M e a n 0 . 6 7 7 7 . 2 5 . 9 1 4 . 8 2
S D 0 . 3 3 4 0 . 6 4 . 2 3 3 . 3 5
Women of childbearing age (18-44 y) n=28M e a n 0 . 6 7 3 2 . 0 4 . 1 3 3 . 3 9
S D 0 . 6 0 1 8 . 6 3 . 1 1 2 . 9 4
M e a n 0 . 6 9 4 9 . 7 4 . 5 9 3 . 8 2
All subjects n=98 S D 0 . 6 6 2 8 . 5 3 . 2 4 2 . 7 8
P 9 5 1 . 9 4 1 0 3 . 3 1 1 . 9 8 . 7 9
Adult men (18-64 y) n=17M e a n 0 . 7 3 4 8 . 0 2 . 9 6 3 . 5 7
S D 0 . 5 0 2 8 . 4 2 . 2 9 2 . 8 0
Adult women (18-64 y) n=69M e a n 0 . 5 8 3 3 . 3 3 . 1 4 4 . 0 2
S D 0 . 4 4 2 1 . 4 5 . 3 4 7 . 0 7
Older subjects (65 y and more) n=9M e a n 1 . 0 5 5 7 . 3 3 . 3 7 4 . 7 2
S D 1 . 4 9 2 1 . 4 2 . 0 3 2 . 9 2
Women of childbearing age (18-44 y) n=41M e a n 0 . 6 6 2 6 . 7 2 . 3 5 2 . 8 4
S D 0 . 5 2 1 8 . 8 2 . 2 6 2 . 2 3
M e a n 0 . 6 5 3 8 . 2 3 . 1 3 4 . 0 1
All subjects n=95 S D 0 . 6 3 2 4 . 0 4 . 6 8 6 . 1 9
P 9 5 1 . 5 3 8 4 . 0 7 . 0 1 9 . 0 7
M e a n 0 . 6 2 3 7 . 8 3 . 5 7 3 . 7 3
All subjects n=391 S D 0 . 5 8 2 3 . 8 3 . 3 0 3 . 7 6
P 9 5 1 . 7 0 8 4 . 3 8 . 9 0 8 . 8 4
H gT : total mercury
FOURTH PART - Nutritional intakes and exposure to contaminants 95
POISSON 4.3 GB.qxd 17.9.2006 20:19 Page 95

96 FOURTH PART - Nutritional intakes and exposure to contaminants
Tables 45 and 46 present the trace element concentrations found in the urine of our tested subjects.
12 subjects (3%) have a total arsenic level less than the limit of quantification (5 µg/L); 242 subjects (63%)have urinary cadmium levels less than the LOQ (0.5 µg/L); 335 subjects (87%) have lead levels less thanthe LOQ (5 µg/L). However, in order not to underestimate the biological level, the averages presentedin Table 45 include all the subjects, with levels below the LOQ taken to be equal to 1/2 LOQ for each ofthe trace elements.
Cadmium : The measurements indicate that the cadmium levels in urine are in the “standard” range,less than 2 µg/g creatinine, even for the high percentiles (P95). Only 12 people (3%) exceed this norm,yet these are not the people having the highest cadmium concentrations in the blood.
Lead : The lead levels are also low for all age groups and both sexes, on average 5.7 ± 4.4 µg/g creatinine.Levels of 25 µg/g creatinine (the “standard”1 2 0) or more were observed in four individuals (1%), whowere also among the people having the highest lead concentrations in the blood.
Arsenic : Table 46 presents the results of the arsenic speciation performed on the 101 subjects displayingthe highest level of total arsenic in the urine (>75 µg/g creatinine). 87 subjects (86%) have levels ofinorganic arsenic (As(III), As(V) and its derivatives MMA(V)and DMA(V)) exceeding the “standard” of10 µg/g creatinine1 2 0. These forms of arsenic account for 16.1% of total arsenic in urine.
Table 45: Urinary concentrations in trace elements
A sT C d P b(µg/g cre a t i n i n e ) (µg/g cre a t i n i n e ) (µg/g cre a t i n i n e )
Adult men (18-64 y) n=18 Mean ± SD 39.0 ± 50.4 0.5 ± 0.4 4.2 ± 3.6Adult women (18-64 y) n=60 Mean ± SD 58.4 ± 87.4 0.6 ± 0.3 4.8 ± 2.5Older subjects (65 y and more) n=6 Mean ± SD 50.8 ± 48.3 1.0 ± 0.7 5.7 ± 1.5Women of childbearing age (18-44 y) n=29 Mean ± SD 41.7 ± 58.1 0.5 ± 0.2 4.2 ± 2.3
All subjects n=84Mean ± SD 53.7 ± 78.4 0.6 ± 0.4 4.8 ± 2.7P 9 5 1 7 5 1 . 2 9 . 8
Adult men (18-64 y) n=21 Mean ± SD 55.9 ± 101 0.4 ± 0.2 3.7 ± 1.9Adult women (18-64 y) n=84 Mean ± SD 84.7 ± 152 0.7 ± 0.4 6.5 ± 4.3Older subjects (65 y and more) n=10 Mean ± SD 57.4 ± 39.0 1.0 ± 0.5 7.3 ± 2.6Women of childbearing age (18-44 y) n=39 Mean ± SD 36.7 ± 36.4 0.5 ± 0.5 6.0 ± 5.4
All subjects n=115Mean ± SD 77.1 ± 137 0.7 ± 0.4 6.0 ± 4.0P 9 5 2 6 9 1 . 4 1 2 . 5
Adult men (18-64 y) n=38 Mean ± SD 69.9 ± 92.0 0.5 ± 0.3 3.7 ± 1.7Adult women (18-64 y) n=46 Mean ± SD 160 ± 449 0.7 ± 0.6 6.5 ± 6.2Older subjects (65 y and more) n=13 Mean ± SD 94.9 ± 119 0.6 ± 0.3 7.2 ± 3.7Women of childbearing age (18-44 y) n=28 Mean ± SD 70.9 ± 79.2 0.6 ± 0.6 5.6 ± 6.1
All subjects n=97Mean ± SD 116 ± 319 0.6 ± 0.5 5.5 ± 4.8P 9 5 3 3 3 1 . 5 1 5 . 0
Adult men (18-64 y) n=16 Mean ± SD 52.2 ± 68.7 0.6 ± 0.4 4.0 ± 2.4Adult women (18-64 y) n=66 Mean ± SD 100 ± 292 0.7 ± 0.5 6.0 ± 4.8Older subjects (65 y and more) n=9 Mean ± SD 79.9 ± 75.4 1.3 ± 0.4 12.0 ± 8.9Women of childbearing age (18-44 y) n=39 Mean ± SD 114 ± 70.6 0.5 ± 0.3 4.7 ± 2.8
All subjects n=91Mean ± SD 89.7 ± 251 0.7 ± 0.5 6.2 ± 5.4P 9 5 2 5 8 1 . 7 1 6 . 4
All subjects n=387Mean ± SD 84.8 ± 218 0.7 ± 0.5 5.7 ± 4.4P 9 5 2 8 8 1 . 5 1 2 . 7
A sT : total arsenic
POISSON 4.3 GB.qxd 17.9.2006 20:19 Page 96

Table 46: Arsenic speciation in the urine of the 101 subjects with the highest urinary totalarsenic level (Mean ± SD)
Whatever the trace element, age group and sex considered, the subjects in Le Havre have the lowestblood levels, although there are no statistically significant differences between zones (table 47). Thesetrends are consistent with the exposures calculated by the indirect approach, with the exception ofcadmium. We calculated an average exposure in Le Havre of 4.64 µg Cd/kg bw/week, which is 2 to 6times more than in the other zones, whereas the biological results suggest an equivalent exposure inthe four study zones (differences not statistically significant). The north-south gradient that appearedsignificantly with the indirect approach for cadmium is therefore not reflected in the biological levelresults. For lead, mercury and methylmercury we find similar trends between the level of dietary intakeand the biological exposure, with a minimum in Le Havre and a maximum in La Rochelle. For lead inparticular it would appear that the subjects in La Rochelle are often the most exposed (indirect approachand direct approach). This is confirmed by the statistical analysis (p<0.05).
In the cases of arsenic, cadmium and lead, there are no significant differences in concentrations in urinesamples between the study zones, despite the fact that dietary exposure to inorganic arsenic is significantlyhigher in Lorient and significantly lower in La Rochelle.
Table 47: Blood and urinary concentrations in trace elements of the subjects of all areasregardless of the age and sex (Mean ± SD)
Le Havre L o r i e n t La Rochelle To u l o n All subjects
Blood concentrations n = 8 3 n = 1 1 5 n = 9 8 n = 9 5 n = 3 9 1
Cd (µg/L Blood) 0.51 ± 0.41 a 0.63 ± 0.59 a 0.69 ± 0.66 a 0.65 ± 0.63 a 0.62 ± 0.58
Pb (µg/L Blood) 31.7 ± 16.3 a 31.9 ± 19.8 a 49.8 ± 28.5 b 38.2 ± 24.0 a 37.8 ± 23.8
H gT (µg/L Blood) 2.76 ± 2.16 a 3.65 ± 2.33 a. b 4.59 ± 3.24 b 3.13 ± 4.68 a 3.57 ± 3.30
MeHg (µg/L Blood) 3.37 ± 2.51 a 3.68 ± 2.36 a 3.82 ± 2.78 a 4.01 ± 6.19 a 3.73 ± 3.76
Urinary concentrations n = 8 4 n = 1 1 5 n = 9 7 n = 9 1 n = 3 8 7
A sT/Creat (µg/g Creat) 53.7 ± 78.4 a 77.1 ± 137.4 a 116.1 ± 318.5 a 89.7 ± 251.0 a 84.8 ± 217.5
Cd/Creat (µg/g Creat) 0.6 ± 0.4 a 0.7 ± 0.4 a 0.6 ± 0.5 a 0.7 ± 0.5 a 0.7 ± 0.5
Pb (µg/g Creat) 4.8 ± 2.7 a 6.0 ± 4.0 a 5.5 ± 4.8 a 6.2 ± 5.4 a 5.7 ± 4.4
Speciation in urines n = 1 5 n = 3 3 n = 3 2 n = 2 1 n = 1 0 1
A si n o r g (µg/L urine) 24.6 ± 21.5 a 19.9 ± 11.2 a 31.8 ± 26.7 a 38.2 ± 41.6 a 28.2 ± 26.8
A si n o r g / Creat (µg/g Creat) 25.7 ± 24.8 a 22.8 ± 12.3 a 26.0 ± 24.1 a 33.7 ± 28.9 a 26.5 ± 22.3
A sT : total arsenic. Asi n o r g: inorganic arsenic (As(III), As(V) and their metabolits MMA(V) and DMA(V)), HgT: total mercury, Creat:creatinine. Values in the same raw with different superscript letters are significantly different, p<0.05 (Tu k e y ’s test)
Le Havre L o r i e n t La Rochelle To u l o n All subjectsn = 1 5 n = 3 3 n = 3 2 n = 2 1 n = 1 0 1
A sT (µg/L urine) 193 ± 127 180 ± 167 315 ± 377 344 ± 496 259 ± 331
C reatinine (g/L urine) 1.20 ± 0.60 1.00 ± 0.40 1.40 ±0.70 1.20 ± 0.60 1.20 ± 0.60
A sT / Creat (µg/g Cre a t ) 180 ± 118 201 ± 210 283 ± 520 304 ± 469 245 ± 383
A sinorg (µg/L urine) 24.6 ± 21.5 19.9 ± 11.2 31.8 ± 26.7 38.2 ± 41.6 28.2 ± 26.8
A si n o r g / Creat (µg/g) 25.7 ± 24.8 22.8 ± 12.3 26.0 ± 24.1 33.7 ± 28.9 26.5 ± 22.3
% Asi n o r g 16.5 ± 12.4 16.3 ± 10.4 14.4 ± 10.8 18.3 ± 11.9 16.1 ± 11.1
A sT : total arsenic. Asi n o r g: inorganic arsenic (As(III), As(V) and their metabolits MMA(V) and DMA(V)), Creat: creatinine
FOURTH PART - Nutritional intakes and exposure to contaminants 97
POISSON 4.3 GB.qxd 17.9.2006 20:19 Page 97

98 FOURTH PART - Nutritional intakes and exposure to contaminants
4.3 Exposure to persistent organic pollutants
4.3.1 Food exposure
These results correspond to the exposure to persistent organic pollutants through fish and seafoodconsumption only, not through total diet; they also exclude environmental exposure via the respiratorytract. However food is the principal vector accounting for more than 90% of total exposure of thepopulation to PCDD/Fs and DL-PCBs1 2 1, and fish and seafood are found to be the most contaminatedproducts (see Introduction).
Tables 48 and 49 present the exposure to dioxins and furans, DL-PCBs, i-PCBs and PBDEs of the diff e r e n tpopulation groups in each study zone. The Appendix 5 and 6 presents for all the consumers in all thezones the main contributions (as percentages) to the total exposure for each class of pollutants and toT RV when they do exist.
PCDD/F and DL-PCB : Only the subjects in Toulon and women of child-bearing age in Lorient have anaverage exposure to dioxins, furans and DL-PCBs less than the WHO's PTMI of 70 pg TEQW H O/kg bw/month.However 62% of the subjects have an exposure through their fish and seafood consumptions less than thePTMI. Clearly the average is strongly influenced by certain high values; the statistical distribution is notsymmetric. This average exposure ranges from 9.70 to 20.0 pg TEQW H O/kg bw/week in adult males andfrom 11.9 to 27.1 pg TEQW H O/kg bw/week in women. Elderly subjects have the highest exposure, in particularthose in Le Havre (average 32.0 pg TEQW H O/kg bw/week, or 109 pg TEQW H O/kg bw/week at P95).
However we should underline that the real exposure to dioxins is almost certainly overestimated sincethe cooking of fish and seafood reduces the PCDDs level, as pointed out by Hori and his team1 2 2. TheDL-PCBs account for 76% of the total exposure and the PCDD/F account for 24% which is consistent withthe conclusions of the report of the Afssa (2006)1 2 1.
The main contributors to PCDD/Fs and DL-PCBs exposure are sardine (19%), salmon (14%), seabass (7%),mackerel (7%), and seabream (5%). The swimcrab accounts for almost 5% of the exposure on averagein the 4 zones; but it is an important contributor to PCDD/Fs and DL-PCBs exposure only in Le Havre(16%). Similarly, eel is a major contributor to DL-PCB exposure only in La Rochelle (18%).
i-PCB : Only 278 people (28%) have a i-PCBs exposure through their fish and seafood consumption lessthan the TDI of 0.02 µg/kg bw/day. The highest average exposure is that of elderly people in Le Havrewith more than 0.67 µg/kg bw/week; the P95 level of these same subjects is 2.36 µg/kg bw/week. Themain contributors to this exposure are sardine (20%), salmon (13%), seabass (8%) and mackerel (7%).The eel is a major contributor in La Rochelle (26%) and the swimcrab in Le Havre (16%), but not in theother zones.
In subjects exceeding the TRV of PCDD/Fs and DL-PCBs or i-PCBs, we find the same major contributorsto the exposure, the most important being the sardine (23% for PCDD/Fs, DL-PCBs and i-PCBs) and theeel (16% for PCDD/Fs and DL-PCBs, 12% for i-PCBs).
PBDE : The average exposure to PBDEs (28, 47, 99, 100, 153, 154, 183) ranges from 1.61 to 2.39 ng/kgbw/day for men aged 18 to 64 years and from 1.98 to 2.58 ng/kg bw/day for women in the same agegroup. The most exposed adult females in Le Havre (P95) have an exposure of 5.95 ng/kg bw/day. Themain contributors to this exposure are salmon (19%), mackerel (9%), cod (6%), sardine (7%) and tuna(5%). Once again, in La Rochelle we find eel is a major contributor (12%) to PBDEs exposure.
121 Afssa. Avis de l’Agence française de sécurité sanitaire des aliments relatifs à l’évaluation de l’exposition de la population française auxdioxines, furanes et PCB de type dioxine. 9 janvier 2006.
122 Hori T. Nakagawa R., Tobiishi K., Iida T., Tsutsumi T., Sasaki K. and Toyoda M. Effects of cooking on concerns of polychlorinated dibenzo-p-dioxins and related compounds in fish and meat. J.Agric. Food Chem. 53 (22) : 8820-8828. 2005.
POISSON 4.3 GB.qxd 17.9.2006 20:19 Page 98

Table 48: Food exposure of high fish and seafood consumers to persistent organic pollutants
P C D D / F P C B - D L Total diox i P C B P B D E(pg TEQO M S/ ( p g / T E QO M S ( p g / T E QO M S/ (µg/kg bw/week) (ng/kg bw/day)kg bw/week) /kg bw/week) kg bw/week)
4 . 1 5 1 3 . 6 4 1 7 . 7 9 0 . 3 8 1 . 7 43 . 9 1 1 3 . 4 1 1 7 . 1 8 0 . 3 8 1 . 0 68 . 8 8 4 3 . 4 7 5 1 . 7 9 1 . 2 1 3 . 9 35 . 7 8 2 1 . 3 1 2 7 . 0 9 0 . 5 1 2 . 3 46 . 4 7 5 2 . 4 8 5 6 . 9 8 0 . 5 9 1 . 8 41 6 . 5 8 5 6 . 4 3 7 1 . 5 7 1 . 6 0 5 . 9 57 . 6 7 2 4 . 3 1 3 1 . 9 8 0 . 6 7 2 . 2 37 . 9 7 2 5 . 1 9 3 3 . 1 5 0 . 7 2 1 . 5 22 6 . 5 1 8 2 . 0 5 1 0 8 . 5 5 2 . 3 6 5 . 2 54 . 9 2 1 5 . 9 3 2 0 . 8 5 0 . 4 7 2 . 3 25 . 1 6 1 7 . 6 3 2 2 . 5 3 0 . 5 6 2 . 0 41 5 . 9 4 5 6 . 6 8 7 0 . 6 9 1 . 5 9 7 . 0 44 . 7 8 1 5 . 2 7 2 0 . 0 5 0 . 4 0 2 . 1 70 . 6 9 4 . 4 9 5 . 1 8 0 . 1 1 0 . 1 11 2 . 2 0 4 0 . 6 1 5 3 . 5 9 1 . 1 5 5 . 0 64 . 8 9 1 4 . 6 0 1 9 . 4 9 0 . 3 4 2 . 1 64 . 0 4 1 3 . 9 5 1 7 . 7 1 0 . 3 5 1 . 6 01 1 . 8 9 4 2 . 8 0 5 6 . 7 4 0 . 9 7 4 . 3 14 . 6 8 1 4 . 0 4 1 8 . 7 3 0 . 3 3 1 . 9 83 . 0 0 9 . 7 2 1 2 . 6 6 0 . 2 6 1 . 0 41 1 . 2 6 3 5 . 9 7 4 8 . 0 5 0 . 8 6 3 . 5 93 . 9 5 1 1 . 6 3 1 5 . 5 8 0 . 2 7 2 . 1 03 . 2 1 1 3 . 2 1 1 6 . 1 7 0 . 3 5 1 . 7 59 . 1 0 2 4 . 9 0 3 3 . 7 9 0 . 6 4 4 . 0 43 . 9 4 1 5 . 9 8 1 9 . 9 2 0 . 5 4 2 . 3 93 . 6 3 2 4 . 7 0 2 7 . 5 4 1 . 1 2 3 . 0 78 . 6 2 3 3 . 4 3 4 2 . 5 2 1 . 0 9 5 . 0 65 . 2 0 1 6 . 2 3 2 1 . 4 3 0 . 4 6 2 . 5 83 . 7 2 1 4 . 5 8 1 7 . 6 0 0 . 5 2 1 . 8 81 2 . 4 1 4 8 . 7 0 5 6 . 7 6 1 . 4 2 6 . 0 84 . 4 7 1 6 . 0 0 2 0 . 4 7 0 . 4 7 2 . 2 13 . 1 3 1 1 . 4 9 1 4 . 0 7 0 . 4 1 1 . 4 09 . 7 7 3 8 . 7 3 4 3 . 9 5 1 . 5 3 4 . 5 94 . 9 0 1 3 . 8 0 1 8 . 7 0 0 . 3 9 2 . 5 33 . 9 6 1 3 . 9 4 1 7 . 1 9 0 . 4 9 2 . 0 41 2 . 8 1 3 8 . 8 3 5 1 . 8 3 1 . 3 6 6 . 1 72 . 0 4 7 . 6 5 9 . 6 9 0 . 2 2 1 . 6 11 . 3 5 5 . 8 6 7 . 1 2 0 . 2 1 1 . 0 94 . 3 8 1 7 . 1 0 2 1 . 2 2 0 . 5 6 3 . 5 12 . 4 7 9 . 3 9 1 1 . 8 6 0 . 2 7 1 . 9 81 . 8 9 9 . 6 1 1 1 . 2 6 0 . 3 8 1 . 6 06 . 6 7 2 5 . 4 8 3 1 . 8 9 0 . 8 5 4 . 7 72 . 4 4 9 . 2 3 1 1 . 6 7 0 . 2 5 1 . 5 81 . 1 6 5 . 8 2 6 . 8 8 0 . 1 8 0 . 7 34 . 0 4 1 5 . 1 5 1 9 . 2 0 0 . 3 5 2 . 5 52 . 2 5 8 . 5 3 1 0 . 7 8 0 . 2 5 1 . 9 71 . 8 0 1 0 . 5 4 1 2 . 0 2 0 . 4 5 1 . 7 65 . 4 9 1 9 . 7 9 2 4 . 4 4 0 . 7 2 3 . 7 4
Adult men M e a n
(18-64 y) n=45S DP 9 5
Adult womenM e a n
(18-64 y) n=180S DP 9 5
Older subjectsM e a n
(65 y and more) n=26S DP 9 5
Women of childbearingM e a n
age (18-44 y) n=98S DP 9 5
Adult men M e a n
(18-64 y) n=53S DP 9 5
Adult womenM e a n
(18-64 y) n=159S DP 9 5
Older subjectsM e a n
(65 y and more) n = 3 7S DP 9 5
Women of childbearing M e a n
age (18-44 y) n=77S DP 9 5
Adult men M e a n
(18-64 y) n=88S DP 9 5
Adult womenM e a n
(18-64 y) n=125S DP 9 5
Older subjects M e a n
(65 y and more) n = 4 0S DP 9 5
Women of childbearingM e a n
age (18-44 y) n=79S DP 9 5
Adult men M e a n
(18-64 y) n=60S DP 9 5
Adult womenM e a n
(18-64 y) n=177S DP 9 5
Older subjects M e a n
(65 y and more) n = 2 1S DP 9 5
Women of childbearingM e a n
age (18-44 y) n=96S DP 9 5
FOURTH PART - Nutritional intakes and exposure to contaminants 99
POISSON 4.3 GB.qxd 17.9.2006 20:19 Page 99

100 FOURTH PART - Nutritional intakes and exposure to contaminants
Table 49: Food exposure to persistent organic pollutants of high fish and seafood consumers ofall areas re g a rdless of the age and sex (Mean ± SD)
For all the classes of pollutant we observe a similar trend: the subjects in Toulon are less exposed thanthose in the other zones.
This trend is significant for dioxins, furans and DL-PCBs: the subjects in Toulon are significantly less exposedthan the subjects in the other zones, without distinction of age or sex (p<0.05). For the i-PCBs, subjectsin both Toulon and Lorient have a significantly lower exposure than those in the two other zones.M o r e o v e r, for the dioxins, furans and i-PCBs, the subjects in Le Havre are more exposed than those inLorient and La Rochelle, although this difference is not statistically significant.
F i n a l l y, the average exposure to PBDEs (28, 47, 99, 100, 153, 154, 183) is significantly less in Toulon thanin La Rochelle (p<0.05), but it is equivalent to that in the two other zones.
Generally for food exposure we find a north-south gradient like the one observed for seafoodcontamination by POPs.
Le Havre L o r i e n t La Rochelle To u l o n All subjects
n = 2 4 9 n = 2 4 7 n = 2 4 8 n = 2 5 2 n = 9 9 6
PCDD/F (pg TEQO M S/kg bw/week) 5.58 ± 6.01 a 4.84 ± 3.79 a 4.65 ± 3.63 a 2.37 ± 1.73 b 4.34 ± 4.25
PCB-DL (pg TEQO M S/kg bw/week) 17.7 ± 19.3 a 14.7 ± 13.0 a 16.1 ± 18.4 a 8.96 ± 8.59 b 14.3 ± 15.7
Total PCDD/F et PCB-DL 23.3 ± 25.2 a 19.5 ± 16.6 a 20.8 ± 21.1 a 11.3 ± 10.1 b 18.7± 19.6
(pg TEQO M S/kg bw/week)
iPCB (µg/kg bw/week) 0.53 ± 0.58 a 0.35 ± 0.35 b 0.49 ± 0.77 a 0.26 ± 0.33 b 0.40 ± 0.55
PBDE (ng/kg bw/day) 2.23 ± 1.70 a. b 2.14 ± 1.50 a. b 2.45 ± 2.31 a 1.86 ± 1.44 b 2.17 ± 1.78
Values in the same raw with different superscript letters are significantly different, p<0.05 (Tu k e y ’s test)
POISSON 4.3 GB.qxd 17.9.2006 20:19 Page 100

FIFTHPART
Perception of risks
FIFTH PART - Perception of risks 101
POISSON 4.3 GB.qxd 17.9.2006 20:19 Page 101

102 FIFTH PART - Perception of risks
In addition to the food frequency questionnaire, questions on the perception of food risks in generaland on the risks associated with seafood in particular were asked to the respondents in order to betterappreciate their knowledge, their attitudes and their selection criteria, in particular those of coastaldwellers and high seafood consumers. The subjects were questioned during a period when no seriousfood crisis was in the news.
5.1 General dietary risks
A first general question on the perception of dietary risks formulated identically during the INCA 99national study reveals the awareness of the existence of risks linked to food, although this is somewhatm o d e r a t e .
“In your opinion, do today's food products present a health risk?”
Figure 13 : High seafood consumers’ perception of the health risk of food products (% ofreplies)
Almost half the participants believe there is a small risk, 35% think there is a major risk, and about11% think there is no risk at all.
POISSON 4.3 GB.qxd 17.9.2006 20:19 Page 102
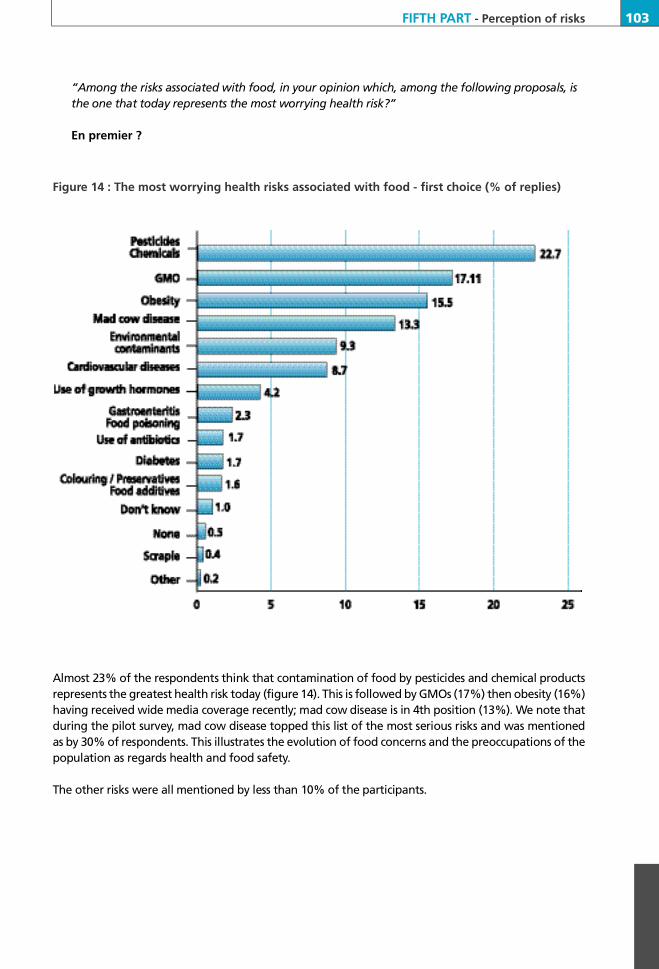
“Among the risks associated with food, in your opinion which, among the following proposals, isthe one that today represents the most worrying health risk?”
En premier ?
Figure 14 : The most worrying health risks associated with food - first choice (% of replies)
Almost 23% of the respondents think that contamination of food by pesticides and chemical productsrepresents the greatest health risk today (figure 14). This is followed by GMOs (17%) then obesity (16%)having received wide media coverage recently; mad cow disease is in 4th position (13%). We note thatduring the pilot survey, mad cow disease topped this list of the most serious risks and was mentionedas by 30% of respondents. This illustrates the evolution of food concerns and the preoccupations of thepopulation as regards health and food safety.
The other risks were all mentioned by less than 10% of the participants.
FIFTH PART - Perception of risks 103
POISSON 4.3 GB.qxd 17.9.2006 20:19 Page 103

104 FIFTH PART - Perception of risks
Second choice?
Figure 15 : The most worrying health risks associated with food - second choice (% of replies)
Chemical products appear to be a matter of concern for a majority of respondents (18%) since these arefound once again at the top of the list of the most serious health risks (figure 15). Environmentalcontaminants, the use of growth hormones in farms, cardiovascular diseases and GMOs are also mentionedby more than 10% of the participants.
The “Other risks” mentioned include cancer, avian influenza, food allergies and infantile obesity. Thefact that avian influenza was little mentioned is explained by the fact that the survey was made priorto recent intense media coverage of this problem.
These results are consistent with those of the IRSN barometer of risk perception performed during thesame year. In this study, the most frequently mentioned hazards or risks potentially linked to food areobesity and pesticides and, to a lesser degree, GMOs1 2 3.
123 IRSN Baro m è t re IRSN sur la perception des risques et de la sécurité, résultats du sondage (2004).
POISSON 4.3 GB.qxd 17.9.2006 20:19 Page 104

5.2 Risks associated with marine pollution
“In your opinion, does marine pollution present a major health risk through seafoodc o n s u m p t i o n ? ”
Of the people questioned, 81.1% believe marine pollution can present health risks through foodconsumption. This general awareness of the potential health risks relating to maritime pollution andpossible contamination of marine products is no doubt due to the fact that the respondents reside incoastal areas. Only 13.6% of the respondents think that marine pollution presents no major health risk.This high level of risk awareness in relation to fish and seafood consumption, without prejudice to theirseriousness, contrasts with the results of other studies that often reveal a phenomenon of habituationto risks, or even denial of these risks by the people exposed. This has been observed in risk perceptionstudies around listed installations, notably nuclear power plants1 2 4, and in studies on the perception ofrisks associated with “mad cow disease” which revealed the absence of changes in consumption habitsamong the highest meat consumers during the crisis, whereas occasional consumers reduced theirc o n s u m p t i on1 2 5.
This general perception of the risk is accompanied by very good knowledge of the environmentalcontaminants contained in fish and seafood.
“In your opinion, which pollutants can be present in seafood?”(several replies possible).The results correspond to the aggregated replies.
Figure 16 : Pollutants present in the sea, according to the respondents (% of replies)
124 Milochevitch A Effet de la distance sur la perception des mesures de protection en cas d’accident nucléaire Actes de la 21è m e réunion del ’ O b s e r v a t o i re des opinions sur les risques et la sécurité IRSN 2002
125 Adda J. “Les consommateurs français et la vache folle” INRA Sciences Sociales n°4 Décembre 1999
FIFTH PART - Perception of risks 105
POISSON 4.3 GB.qxd 17.9.2006 20:19 Page 105

106 FIFTH PART - Perception of risks
Hydrocarbons are the best-known pollutants, in particular among people living near the coast who arevery sensitive to marine pollution issues, no doubt due to their experience of oil spillages, notably thatof the oil tanker “Erika” recently. Heavy metals (mercury and lead) are mentioned in second place. Thefrequent mention of lead is rather surprising in view of the moderate contribution of marine productsto tolerable intake to lead (< 2% PTWI, see Appendix 6). This can be explained by the bad reputationof lead as an environmental contaminant. Dioxins, which had been the subject of much media coveragea few months earlier, are also often mentioned as marine pollutants.
The “Other” pollutants mentioned include toxic algae, radioactivity, pesticides, general waste (plastics,metals) and bacteria.
5.3 Behaviour of seafood consumers
“Do you pay particular attention to the origin of the seafood you buy, in the sense that you knowsome coastal zones can be more polluted than others?”
More than the half the respondents (53%, or 539) say they attach importance to the origin of the seafoodthey buy. Among them, 4% said the origin was the first criterion when selecting seafood and 22% saidit was the second criterion. This sensitivity to the origin of the fishing is confirmed by OFIMER studiesthat reveal the importance of consumer information, notably for well-informed consumers who constitutea large part of our study population. However, we shall see later that the geographic origin is of littleimportance compared to the main criteria: appearance, freshness, price and season.
“Which seafood origins do you avoid?” (several replies possible). The results correspond to theaggregated replies.
F i g u re 17 : Seafood origins avoided by high consumers (% of re p l i e s )
POISSON 4.3 GB.qxd 17.9.2006 20:19 Page 106

The Mediterranean Sea is the most avoided when purchasing seafood (18% of respondents), followedby the northern oceans: Northwest and Northeast Atlantic and the Baltic mentioned in about 12% ofr e p l i e s .
“Among the following criteria, to which do you attach the greatest importance when buyings e a f o o d ? ”
First choice?
Figure 18 : Consumers' first selection criterion when purchasing seafood (% of replies)
FIFTH PART - Perception of risks 107
POISSON 4.3 GB.qxd 17.9.2006 20:19 Page 107

108 FIFTH PART - Perception of risks
Second choice?
Figure 19 : Consumers' second selection criterion when purchasing seafood (% of replies)
Freshness and appearance are undeniably the prime purchasing criteria for 80% of respondents. Priceis the second criterion for 32% of respondents and to a lesser degree the season (18%), the taste (16%)and the origin (13%). These are therefore consumers who trust their own judgement when making theirc h o i c e s .
Very few people appear to be concerned by the nutritional value of the products bought. We have seenthat the fatty acid composition of fish is nevertheless highly variable and could interest the consumer.It appears that for the moment this type of very important information for nutritionists, dieticians andpublic health professionals in general is not well integrated in consumers' criteria when selecting products,despite the increasing reputation of omega 3 fatty acids.
The “Other” criteria mentioned include product availability, impulsive desire, presence/absence of bones,use-by date and odour. Ease of preparation is not often mentioned, although has been shown elsewherethat this is an important selection criterion for consumers in general. Perhaps the fact that our studypopulation are high fish and seafood consumers means they are not put off by the preparation of wholefish, a supposition well supported by OFIMER studies1 2 6.
126 OFIMER Etude sur les poissonniers en France La lettre de l’OFIMER Novembre 2001
POISSON 4.3 GB.qxd 17.9.2006 20:19 Page 108

5.4 Consumer information
“ To ensure effective information of consumers, since 1st January 2002 community regulationsrequire that seafood labelling includes the commercial denomination of the species, theproduction method and the zone of capture. Are you aware of this?”
Almost the two thirds of the people questioned (62.8%) are aware of the new regulation now applicableto seafood labelling. This result is not surprising in view of the high frequency of purchases of fish andseafood by the respondents in the study.
“Do you think this measure will affect your buying habits?”
Of the people questioned, 47% or 473 think that the new regulation (of which 71% were aware) willinfluence their buying habits, while 46% or 460 (of which 60% were aware of the regulation) do notthink so.
“Do you think that the controls carried out at seafood points of sale are sufficient or insuff i c i e n t ? ”
The controls made on seafood appear to reassure only one third of the respondents. More than half ofthem (50.7%) believe these controls to be insufficient, and 16% have no opinion on the subject. Thisresult no doubt reflects the visible preoccupation of this population of high fish and seafood consumersas regards possible environmental contamination of the fish, crustaceans or molluscs they consume.
“Do you think that consumption of cultivated fish is safer than consumption of wild fish?”
Figure 20 : High consumers’ opinions as regards the risks of consuming cultivated fish(% of replies)
FIFTH PART - Perception of risks 109
POISSON 4.3 GB.qxd 17.9.2006 20:19 Page 109

110 FIFTH PART - Perception of risks
A majority of respondents believe consumption of wild fish is safer (41%), or at least no less safe thanconsuming cultivated fish (38%) (figure 20).
Various media alerts, notably that stirred up by the publication in January 2004 of an article in “Science”about the contamination of farmed salmon in Europe, explains this undercurrent of suspicion as regardsfish farming. In this media context, however, we note that 4 out of 10 of our subjects consider thatfarmed fish and wild fish are equivalent.
“If so, why?” (several replies possible) The results correspond to the aggregated replies.
F i g u re 21 : Reasons given for believing that consumption of farmed fish is safer thenconsumption of wild fish (% of re p l i e s )
Almost half the respondents believe that consumption of farmed fish is safer thanks to better controland regular surveillance of the fish (figure 21). A quarter of them are reassured by the fact that themarine milieu in which these fish live is not only controlled and regularly analysed but also by the factthat this environment is less exposed to external pollution (boats, toxic waste, etc.). More than 20% ofthem believe eating farmed fish is better for health: more natural, more healthy, better monitoring, etc.
About 5% of respondents support the idea that consumption of farmed fish is safer, but without knowingprecisely why. Finally, 4% give philosophical reasons, prejudices or information read or heard in them e d i a .
In conclusion, this part of the study on perceptions and attitudes of high fish and seafood consumers asregards the possible risks of their consumption shows that this population has extensive knowledge offish and seafood. They are consumers seeking information, preoccupied, but they remain somewhatdetached from public controversy on this subject.
POISSON 4.3 GB.qxd 17.9.2006 20:19 Page 110

SIXTHPART
Discussion
SIXTH PART - Discussion 111
POISSON 4.3 GB.qxd 17.9.2006 20:19 Page 111

112 SIXTH PART - Discussion
6.1 Fatty acids
The lipids of the erythrocyte membranes of the subjects contain 0.74% of EPA, 1.71% of DPA and 4.02%of DHA, or 6.47% of n-3 LC-PUFAs. Few data are available on this subject in the scientific literature, andwhen they do exist they are not comparable with ours since they generally come from interventionstudies involving omega 3 supplementation of subjects, or they do not concern the general population,or they do not use the same biomarker of exposure.
In controls of an intervention study, Weill et al. in 2002 found DHA accounted for 4.8 ± 0.89% of totallipids in the red blood cell membrane, and EPA for 0.5 ± 0.12%8 8. In 2004, Payet et al. measured4.8 ± 1.2 % of DHA and 1.1 ± 0.81% of EPA in elderly people before supplementation1 2 7. In 2003, Dewaillyand his team reported n-3 LC-PUFAs levels of 1.8%, 3.9% and 8.0% in circulating phospholipids in plasmain three Canadian population groups consuming respectively 13g, 60g and 131g of fish per day1 2 8.
The trends observed in the results of the measurements in the erythrocytes for the different zones (Ta b l e s34 to 38) are not completely in agreement with the intakes calculated by crossing consumption andcomposition data (Tables 29 to 33).
The relationship between n-3 LC-PUFAs intake and the erythrocyte composition is not proportional,which implies that many other factors are acting. Knowing that n-3 fatty acids are subject to beta-oxidation, the quantity of total lipids in the diet influences the oxidation of the n-3 LC-PUFAs. We notea Pearson correlation coefficient of 0.26 (p<0.0001) between the n-3 LC-PUFAs levels in the erythrocytesand the proportion of n-3 LC-PUFAs in the dietary lipids.
M o r e o v e r, since age influences peroxidation of lipids, in particular the n-3 LC-PUFAs, the correlationbetween age and the erythrocyte n-3 LC-PUFAs levels is 0.23 (p<0.0001). For smokers the number ofcigarettes smoked per day correlates negatively with the blood DHA (r=-0.22, p=0.02).
It is particularly difficult to find a simple mathematical model linking the erythrocyte composition to n-3 LC-PUFAs consumption, which may be explained in several ways:
• The first hypothesis is that the fatty acids composition of the blood tissue (erythrocyte) is not agood marker for all n-3 fatty acids. It is accepted that the DHA of the erythrocytes reflects very poorlythe ingested quantity, unlike other n-3 PUFAs1 2 9. In man and general population, we must neverthelesssettle for this accessible tissue.
• The second hypothesis is the variability between individuals related to beta-oxidation of fatty acidsand its multiple regulation factors. In the case of fatty acids, although they are essential, theiravailability is highly dependant on their energy usage by beta-oxidation, which is not the case formany other essential nutrients, including vitamins and minerals. This beta-oxidation, which does notspare the n-3 PUFAs, can represent up to 90% of the n-3 metabolism; it is influenced by the physiologicaland physiopathological status of the energy expenditure and the fatty acids composition (quantityof saturated acids) and other energy-providing nutrients in the diet.
• The third hypothesis is that the presence of the precursor alpha-linolenic acid (ALA) in the diet canalso bring non-negligible additional quantities of n-3 LC-PUFAs (EPA and DHA)8 8. This could explainwhy the French population, even heavy fish consumers, has an n-3 LC-PUFAs status lower than other
127 Payet M., Esmail M.H., Polichetti E., Le Brun G., Adjemout L., Donnoarel G., Portugal H. and Pieroni G. Docosahexaenoic acid-enriched eggconsumption induces accretion of arachidonic acid in erythrocytes of erderly patients. Br. J. Nutr. 91 : 789-796. 2004.
128 Dewailly E., Blanchet C., Gingras S., Lemieux S., and Holub B.J. Fish consumption and blood lipids in three ethnic groups of Québec(Canada). Lipids. 38 (4) : 359-365. 2003.
129 Patch C., Murphy K., Mansour., TapsellL., Meyer B., Mori T., Noakes M., Clifton P., Puddey I. and Howe P. Erythrocyte biomarker-based vali-dation of a diet history method used in a dietary intervention trial. NSA Poster Presentations. Asia Pac. J. Clin. Nutr. 13 : 60. 2004.
POISSON 4.3 GB.qxd 17.9.2006 20:19 Page 112

populations, in view of the small quantities of ALA consumed4 and the richness of the diet in n-6fatty acids that inhibit the ALA conversion. By way of comparison, we could assume that a populationconsuming the precursor ALA (Canada, Japan) and little LA would increase its very long-chain n-3status by ALA conversion, in this case non-negligible. The study of Weill et al. suggests this idea sincethe n-3 LC-PUFA status is high with a diet rich in ALA (flax-eating animals products) but in which fishis absent8 8. In our population, those most consumed oils are sunflower and olive which provide1.0 ± 1.0 g ALA/week (high estimation) and 23.2 ± 22.6 g LA/week compared to 11.2 ± 8.9 g ALA/weekand 23.5 ± 18.6 g LA/week if the subjects consumed only rapeseed oil.
• A fourth explanation is that the variability over a long period of the biological exposure in thegeneral population is less than that found in the intervention studies over short periods. The literatureon intervention studies relates that the variations in the erythrocyte membrane composition can belarge. Harris reports a 4.3% increase of EPA + DHA resulting from supplementation of one gram ofE PA + DHA over 6 months. For a higher n-3 LC-PUFAs intake (0.14 g/day) Weill noted a 0.69% increasein the n-3 LC-PUFAs in the erythrocyte membrane. Our subjects are high fish and seafood consumers,but the large panel of products and the differences in the nutritional composition of the productscould lead to considerable variation in intakes depending on the products consumed (see the chapteron “Seafood composition and contamination”). Furthermore the biological samples were takenbetween October and December 2004, which means they reflect summer consumptions, whereasthe samples were taken between January and April 2005, a period during which most of the fishtend to display higher total lipid and fatty acid levels than those measured in summer. In additionto this seasonal variation of lipids levels in fish there may also be some seasonality in the consumptionof oily fish. These factors could well imply that the erythrocyte membrane is not an ideal marker oflong-term n-3 LC-PUFAs consumption, but in fact only a short-term marker as suggested by certains t u d i es1 3 0. Intervention studies presenting significant results are often made over a few days or evena few weeks, but rarely over a duration corresponding to the hematopoietic cycle.
• A last hypothesis is that the relationship between the DHA consumed and the proportion of DHAin the erythrocyte membrane is not linear. It could be logarithmic, polynomial…
6.2 Trace elements
Arsenic : Concerning the levels found in food samples, we noted that the total of the contents of thed i fferent arsenic forms was not always equal to the AsT level. When the sum is less than the AsT l e v e l ,the difference may be explained by the non-detection of certain arsenic species which induces a slightunderestimation of the total of the arsenic species relative to the total level. In the opposite case, this ismainly due to the fact that the AsT and the forms of speciation were quantified using two distinctanalytical techniques, although the observed differences generally remain within the estimated limitsof measuring uncertainty of the methods.
The total arsenic concentrations measured in urine are relatively high. This is not surprising in view ofthe diet rich in seafood of the subjects tested. In effect, organic arsenic is of dietary origin (AsB inparticular), which accounts for a large part of total arsenic in the urine, reflects the intake at the lastmeal. It is therefore important to take the arsenic speciation into account here.
Regarding indirect exposure, note that the inorganic arsenic corresponds to the forms As(III) and As(V).In toxicology and occupational medicine (direct exposure or biomarkers) inorganic arsenic is understoodto mean the As(III) and As(V) forms and their mono- and dimethyl metabolic derivatives, MMA and DMAof redox potential V. Nevertheless, these methylated forms are in a minority.
130 Poppitt S.D., Kilmartin P., Butler P. and Keogh G.F. Assessment of erythrocyte phospholipids fatty acid composition as a biomarker for dieta-ry MUFA, PUFA or saturated fatty acid intake in a controlled cross-over intervention trial. Lipids Health Dis. 4 : 30. 2005.
SIXTH PART - Discussion 113
POISSON 4.3 GB.qxd 17.9.2006 20:19 Page 113

114 SIXTH PART - Discussion
There is no significant correlation between arsenic (total and inorganic) consumed and arsenic found inthe urine, but the quantity of predator fish consumed correlates significantly with the inorganic arsenicmeasured in the urine, weighted by the creatinine (r=0.25, p=0.01).
These results are highly consistent in view of the very low inorganic arsenic intakes from fish and seafoodcompared to other sources (water, etc.).
M e rcury : The analyses of mercury in seafood products, either to determine the total level or them e t h y l m e r c u r y, were self-checked on each series of tests by internal quality controls (IQC) performedusing suitable certified reference material (CRM). In 83% of cases, the average measured concentrationof total Hg tallies with that of the MeHg concentrations, allowing for the respective enlarged uncertaintiesof the two analytical methods used. The dispersion of these values is identical in both cases and is Gaussian.Nevertheless in 17% of cases there subsists significant differences between the total and methylmercuryconcentrations. To explain these differences and notably the fact that the MeHg levels can appear higherthan the total mercury, we must take into consideration the possible existence of a analytical bias in theisotopic dilution method, although this approach is recognised as one of the best. In current researchwork it is now envisaged that native mercury may behave differently from mercury added during theisotopic dilution method. The analytical biases usually corrected by this method are therefore no longercorrected perfectly.
Generally speaking, the calculated exposures are higher than the estimations found in the internationalliterature which often indicate that very few consumers exceed the PTWI. However the calculations areoften made for populations that are not high fish consumers, and the studies often concern only a smallnumber of products (less than 30, versus 84 in our study). In 1995 Buzina et al. reported, for Adriaticpopulations consuming fish and seafood 2 to 6 times per week, exposures ranging from 132 to 294 µgHg/week on average1 3 1, or 1.9 to 4.2 µg Hg/kg bw/week for individuals of 70 kg aged 15 to 59 years,which is of the same order of magnitude as the results of our study. This comparison therefore illustrateswell that our study concerns mainly high seafood consumers. However, the consumption study methodbased on a food frequency questionnaire, it is probable that the consumptions and therefore the exposuresare overestimated.
We note that the calculated mercury exposure (HgT) of the subjects and more particularly themethylmercury exposure appears significantly lower in Le Havre than in the other zones (Table 43). Thiscould be explained by lower consumption of the main contributors to this exposure which are predatorfish, notably fresh tuna (mean consumption and consumer rate, see Appendix 2).
As regards the MeHg biomarker of exposure data, these confirm the consequences of high consumptionof seafood products and predator fish in particular. In view of the quality procedure applied in the HgT
analysis of the blood samples, the values of total Hg level obtained are considered to be reliable. Tw oseries of independent measurements were performed by two specialized analytical laboratories. Themeasurements were made using a reference analytical technique recognised to be reliable and sensitive,and the results tally satisfactorily for at least 80% of the results around the tolerated confidence interval(CI) (between 70% and 130% of the determined HgT level). The rest of the data outside this interval areessentially low biomarker values, but not high values, which increases the confidence in the interpretationof the data.
131 Buzina R., Stegnar P., Buzina-Suboticanec K., Horvat M., Petric I. and Farley T.M.M. Dietary mercury intake and human exposure in anAdriatic population. Sci. Total Environ. 170 : 199-208. 1995.
POISSON 4.3 GB.qxd 17.9.2006 20:20 Page 114

On the other hand, the mercury speciation results in the blood samples are more difficult to interpretin that the technique was developed during this study.
The average ratio between the MeHg and HgT concentrations is 115%, i.e. a 15% difference. About30% of the samples analysed have quantified MeHg levels that lie outside the tolerated confidenceinterval CI, CI being determined from the estimated uncertainties of the two methods used in order toestablish a pertinent internal quality control (IQC). Of these 30%, 10% of the observed differences areless than the lower limit of 0.7 of the CI, probably due to the small concentrations close to the estimatedquantification limit, and 20% are higher than the upper limit of this CI. This overestimation of the resultsappear to be linked to the global composition of the blood matrix resulting in different behaviourbetween added mercury, present in the dissolved phase, and native mercury which is chelated by proteinsthat can precipitate in an acid milieu (isotopic dilution method). Actually, the quantification by isotopicdilution used during this study offers the possibility of developing a primary reference method enablinggreater precision and reliability132 133 134, however subject to verifying that the enriched isotope added isnot extracted differently from the analyte present in the matrix1 3 5. This is probably what we observe in20% of cases on the blood matrix. Further detailed investigations are necessary in order to confirm thisand to attempt to correct it.
The MeHg measured in the blood correlates significantly with the quantity of MeHg absorbed from fishand seafood (r = 0.36, p<0.0001). This conclusion is borne out by the fact that the quantity of predatorfish consumed correlates positively with the MeHg measured in the blood (r = 0.26, p<0.0001). Furthermorewe also note a significant correlation between the MeHg level in the blood and the ages of the subjects(r = 0.25, p<0.0001). We should bear in mind that our population is relatively homogeneous (only highconsumers) and that it is difficult to obtain a very good correlation contrary to a heterogeneous populationrepresenting a wide range of consumption and exposure levels.
Moreover the blood analysis results are consistent with the results of the study of Bjornberg et al. ( 2 0 0 5 )concerning Swedish women of child-bearing age and who are high fish consumers 1 3 6. Such women inour study have an average MeHg level in the blood of 2.3 to 3.4 µg/l depending on the zone, with amedian for all the zones combined of 2.4 µg/L. The Swedish study indicates a median value of1.7 µg/L for these high seafood consumers. For comparison, the NHANES study indicates for thegeneral American population (not high fish consumers) a geometric average of 1.02 µg/L for womenaged 16 to 49 years137.
The blood analyses results for MeHg in the subjects of our study are reassuring. We recall that a PTWIof 1.6 µg/kg bw/week was established by the JECFA2 2. This corresponds to a concentration of 14 mg ofHg/kg in the mother's hair, or 56 µg of MeHg/L in the mother's blood (mean ration hair/blood of 250),having no adverse effects on the foetus. The PTWI includes an uncertainty factor of 2 corresponding tothe inter-individual variability of the relation between MeHg concentration measured in hair and thatmeasured in blood. In fact, even among the very high consumers of fish and seafood, consuming up to4.5 kg of product per week and with exposures calculated from these high consumptions of as much as
132 Rivier C., Stumpf C., Labarraque G., Hervouët G., Désenfant M., Priel M., Rouyer J.-M. et Seiller M.-P. Matériaux de référence et essaisd’aptitude : deux outils au service de la qualité des analyses. Spectra Analyse. 256 : 33-35. 2005.
133 Monperrus M., Tessier E., Ve s c h a m b re S., Amouroux D. and Donard O.F.X. Simultaneous speciation of mercury and butyltin compounds innatural waters and snow by propylation and species-specific isotope dilution mass spectrometry analysis. Anal. Bioanal. Chem. 381 (4) : 854-862. 2005.
134 Centineo G., Rodriguez-Gonzalez P., Gonzalez E.B., Garcia Alonso J.I. and Sanz-Medel A. Simultaneous determination of mono-, di- andtributyltin in enviromnental samples using isotope dilution gas chromatography mass spectro m e t r y. J. Mass. Spectrom. 39 (5) : 485-494. 2004.
135 Monperrus M., Krupp E., Amouroux D., Donard O.F.X. and Rodriguez Martin-Doimeadios R.C. Potential and limits of speciated isotope-dilution analysis for methodology and assessing environmental re a c t i v i t y. Trend. Analyt. Chem. 23 (3) : 261-272. 2004.
136 Bjornberg K.A., Vahter M., Grawe K.P. and Berglund M. Methyl mercury exposure in Swedish women with high fish consumption. Sci To t a lE n v i ron. 341 (1-3) : 45-52. 2005.
137 Schober S.E., Sinks T.H., Jones R.L., Bolger P.M., McDowell M., Osterloh J., Garrett E.S., Canady R.A., Dillon C.F., Sun Y., Joseph C.B. andM a h a ffey K.R. Blood mercury levels in US children and women of childbearing age, 1999-2000. JAMA. 289 (13) : 1667-1674. 2003.
SIXTH PART - Discussion 115
POISSON 4.3 GB.qxd 17.9.2006 20:20 Page 115

116 SIXTH PART - Discussion
9.6 µg/kg bw/week, we find MeHg blood levels well below the value of 56 µg/L, the maximum being 18µg/L. In fact only one person displayed a concentration exceeding this value, and this can be partlyexplained by this person's use of a medication affecting the renal and hepathic functions.
Given that the biological results do not indicate that the total Hg and MeHg values associated withtoxicity are exceeded, whereas the exposure calculation indicates that a third of the subjects exceed therecommended PTWI for MeHg, to characterise the risk associated with exposure to MeHg we exploitthe biomarker results of our study. The measurements in the biological matrices (blood or hair) enableus to calculate, using a pharmacokinetic model, a “steady state dietary intake” which relates the dailyintake of MeHg to the concentration in blood or hair, as described by international scientific bodies suchas JECFA, EPA, FDA, NRC and WHO19 138. The use of biomarker data to estimate exposures requires thatthe methylmercury concentrations in the blood of our population be effectively in a steady state, whichwe believe to be the case in view of our recruitment criteria and the homogeneous dietary habits stableover time. Taking only the individuals for which blood analyses were made (n=385), by crossing theconsumption and contamination data we calculate an average exposure of 1.61 ± 1.28 µg MeHg/kgbw/week for the general population excluding women of child-bearing age, and for such women anaverage exposure of 1.34 ± 0.92 µg/kg bw/week. The use of blood concentrations and the single-compartment pharmacokinetic model indicate for the general population, excluding women ofchild-bearing age, an average exposure of 0.65 ± 0.64 µg/kg bw/week, and for women of child-bearingage, the subjects most “at risk”, an average exposure of 0.39 ± 0.29 µg/kg bw/week. These averageexposures can be compared with the PTWI which takes into account a safety factor of 3.2 correspondingto the inter-individual variability of the pharmacokinetic model. Applying the pharmacokinetic modelat individual level this variability is clearly not integrated, but we can consider that, in view of the sizeof our population, this variability can be ignored for the average of the population. The average intakesof MeHg of 0.39 ± 0.29 µg/kg bw/week estimated for women of child-bearing age, and of 0.65 ± 0.64µg/kg bw/week estimated for the general population are only half the estimated intakes via indirecte x p o s u r e .
138 NAS/NRC. Toxicological effect of MeHg. National Academy Press. Washington DC. 2000.
POISSON 4.3 GB.qxd 17.9.2006 20:20 Page 116
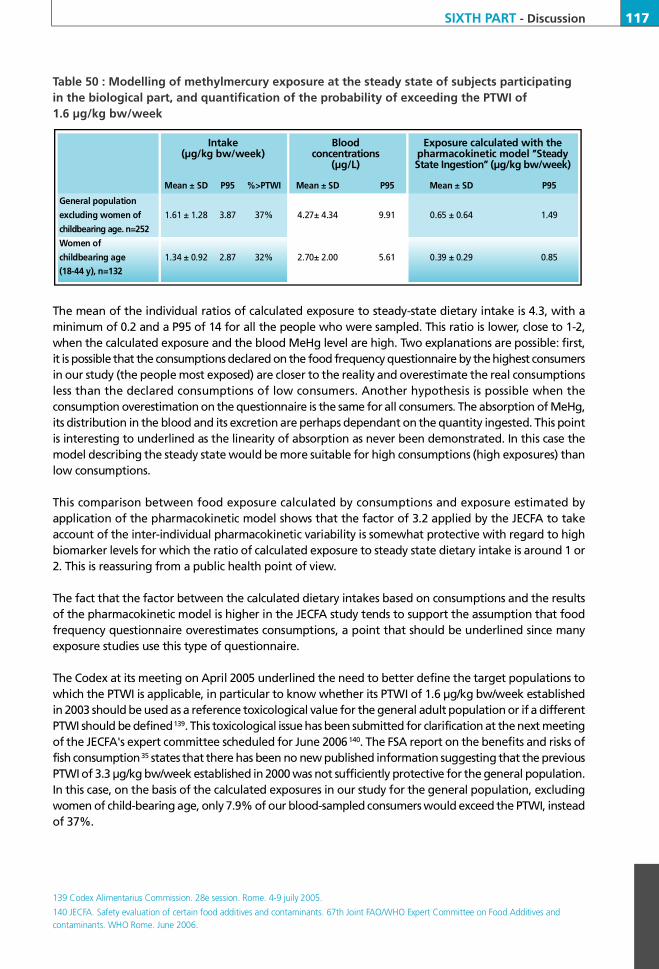
Table 50 : Modelling of methylmercury exposure at the steady state of subjects participatingin the biological part, and quantification of the probability of exceeding the PTWI of1.6 µg/kg bw/week
The mean of the individual ratios of calculated exposure to steady-state dietary intake is 4.3, with aminimum of 0.2 and a P95 of 14 for all the people who were sampled. This ratio is lower, close to 1-2,when the calculated exposure and the blood MeHg level are high. Two explanations are possible: first,it is possible that the consumptions declared on the food frequency questionnaire by the highest consumersin our study (the people most exposed) are closer to the reality and overestimate the real consumptionsless than the declared consumptions of low consumers. Another hypothesis is possible when theconsumption overestimation on the questionnaire is the same for all consumers. The absorption of MeHg,its distribution in the blood and its excretion are perhaps dependant on the quantity ingested. This pointis interesting to underlined as the linearity of absorption as never been demonstrated. In this case themodel describing the steady state would be more suitable for high consumptions (high exposures) thanlow consumptions.
This comparison between food exposure calculated by consumptions and exposure estimated byapplication of the pharmacokinetic model shows that the factor of 3.2 applied by the JECFA to takeaccount of the inter-individual pharmacokinetic variability is somewhat protective with regard to highbiomarker levels for which the ratio of calculated exposure to steady state dietary intake is around 1 or2. This is reassuring from a public health point of view.
The fact that the factor between the calculated dietary intakes based on consumptions and the resultsof the pharmacokinetic model is higher in the JECFA study tends to support the assumption that foodfrequency questionnaire overestimates consumptions, a point that should be underlined since manyexposure studies use this type of questionnaire.
The Codex at its meeting on April 2005 underlined the need to better define the target populations towhich the PTWI is applicable, in particular to know whether its PTWI of 1.6 µg/kg bw/week establishedin 2003 should be used as a reference toxicological value for the general adult population or if a diff e r e n tPTWI should be defined1 3 9. This toxicological issue has been submitted for clarification at the next meetingof the JECFA's expert committee scheduled for June 20061 4 0. The FSA report on the benefits and risks offish consumption3 5 states that there has been no new published information suggesting that the previousPTWI of 3.3 µg/kg bw/week established in 2000 was not sufficiently protective for the general population.In this case, on the basis of the calculated exposures in our study for the general population, excludingwomen of child-bearing age, only 7.9% of our blood-sampled consumers would exceed the PTWI, insteadof 37%.
I n t a k e Blood E x p o s u re calculated with the (µg/kg bw/week) c o n c e n t r a t i o n s pharmacokinetic model ’’Steady
( µ g / L ) State Ingestion’’ (µg/kg bw/week)
Mean ± SD P 9 5 % > P T W I Mean ± SD P 9 5 Mean ± SD P 9 5
General population excluding women of 1.61 ± 1.28 3 . 8 7 3 7 % 4.27± 4.34 9 . 9 1 0.65 ± 0.64 1 . 4 9childbearing age. n=252Women of childbearing age 1.34 ± 0.92 2 . 8 7 3 2 % 2.70± 2.00 5 . 6 1 0.39 ± 0.29 0 . 8 5(18-44 y), n=132
139 Codex Alimentarius Commission. 28e session. Rome. 4-9 juily 2005.
140 JECFA. Safety evaluation of certain food additives and contaminants. 67th Joint FAO/WHO Expert Committee on Food Additives andcontaminants. WHO Rome. June 2006.
SIXTH PART - Discussion 117
POISSON 4.3 GB.qxd 17.9.2006 20:20 Page 117

118 SIXTH PART - Discussion
Lead : As regards lead, we noted that 22 subjects (6%) have blood levels higher than the standard (70to 90 µg/L) and that 4 others have urine levels higher than the standard (25 µg/g creatinine). For mostof these people, this high concentration can be at least partly explained by professional or leisure activitiesexposing them to lead (welding, paints, manipulation of metals, hunting, etc.) and/or by the fact thattheir homes were built before 1948 (after which lead paint was forbidden), although no direct statisticallink can be established.
There is a significant correlation between the quantity of lead consumed in seafood and the lead measuredin the blood (r=0.18, p=0.0005). However this correlation is less marked than for mercury. This is explainedby the fact that other sources of lead intake (water, other foods) have not been taken into account here.Age also correlates positively with the presence of lead in the blood (r=0.46, p<0.0001)
Cadmium : The urine analyses reveal that 12 people (3%) have a cadmium concentration exceeding 2µg/g of creatinine, among which 7 are smokers or former smokers with an average age of 52.
As for MeHg we observe that the cadmium results in the biological matrices do not lead to the sameinterpretations as those for the calculated food exposures. According to our calculations, 8.5% of thesubjects exceed the PTWI, whereas the results of the biological analyses indicate that the cadmium levelsremain below the standards.
Some factors have major impact on the cadmium levels measured in the biological matrices. For examplethe number of cigarettes smoked per day correlates strongly with cadmium level in the blood (r=0.62,p<0.0001). For non-smokers, age also correlates with these cadmium levels (r=0.38, p<0.0001), which isnormal for an element that accumulates in the body over time.
Age correlates with cadmium level expressed in µg Cd/g creatinine, with a correlation of 0.34 (p<0.0001),which means that the individuals with the highest levels (>2 µg/g creatinine) are over 50 years old.
We note a correlation between the urinary cadmium level and the dietary exposure to cadmium fromseafood (r=0.32, p<0.0001). On the other hand, the blood cadmium level does not correlate with theexposure to cadmium (p=0.65). This phenomenon may be explained by the fact that seafood are notthe only foods contributing to cadmium exposure. The total diet study shows that the main food sourcesof cadmium are vegetables and potatoes, a long way ahead of crustaceans and molluscs, bread, poultryand off al3. Substitutions between consumptions of terrestrial meat products and fish and seafoodconsumption may explain the absence of a relationship between seafood consumption and bloodcadmium level.
Another parameter to be taken into account when comparing the differences between the biologicalresults and the calculated dietary exposures is the difficulty in quantifying the real contaminationvariability of the seafood products consumed. The contribution of beach fishing to the provisioning, inparticular in Lorient and La Rochelle for molluscs and crustaceans, can induce non-negligible variabilityin the contamination of the consumed foods. Indeed the IFREMER monitoring plans indicatecontaminations levels that can correspond to large differences in concentrations from one point ofcontrol to another, which is not the case in Toulon for example. It is therefore possible that the subjects
POISSON 4.3 GB.qxd 17.9.2006 20:20 Page 118

in Toulon are more likely to consume products with trace elements levels close to the average, whereasin La Rochelle and Lorient the food contamination can be much more variable, depending on theprovisioning. This may be due to the fact that the ports of Lorient and La Rochelle (and more generallyBrittany and the Atlantic coast) commercialise products of more varied origins (fishing zones, foreignboats, etc.) than Mediterranean ports such as Toulon. Consequently applying an average contaminationto products in Toulon is without doubt more in line with the reality than doing so in other zones.
6.3 Persistent organic polluants
In view of the blood volumes already taken for the analysis of trace elements and the large quantitiesof blood necessary we preferred not to perform blood analyses. However the calculations of exposurealready enable us to raise some points for discussion relative to the existing literature.
PCDD/Fs, DL-PCBs and iPCBs: We find that 39% of the individuals exceed the PTMI of 70 pg TEQW H O/ k gbw/month fixed for PCDD/Fs and DL-PCBs, and that 72% of them exceed the TDI of 0.02 µg/kg bw/dayfixed for i-PCBs. We must remember that other foods also contribute to the intake of PCDD/Fs, DL-PCBs and i-PCBs and that consequently the total exposures are higher. The PCDD/F, DL-PCB and i-PCBcontaminations of seafood products are comparable to those measured by the monitoring plans ofAdministrations. And the PCDD/F and DL-PCB contaminations are within the interval reported by theEuropean Authority in 2005: between 0.3 and 5.8 pg TEQ/g fresh weight1 4 1, except in the case of thevery heavily contaminated eel sample from the Netherlands and some crustaceans rarely consumed,such as swimcrab. The study confirms that even when consuming fish and seafood that comply withthe European maximum contamination limits, a high consumer can exceed the JECFA's PTMI, a factthat has already been revealed by other studies1 4 2. This demonstrates the need to make an effort toreach target values lower than the regulatory limits as rapidly as possible, which is what the newEuropean regulation proposes.
The biggest contributors are oily fish (appendix 5 and 6). The lower exposure of the subjects in To u l o nis concomitant with the lower POP contaminations measured in the Toulon samples. Moreover, althoughthe consumption of fish with the highest contaminations is generally equivalent in the four studyzones, it is found that in Toulon the consumption of the most contaminated crustaceans (swimcrab,crab, spider crab) is less.
However in no zone in particular do we find a dietary exposure significantly higher than in the otherz o n e s .
PBDEs : The average exposure to PBDEs (28, 47, 99, 100, 153, 154, 183) is 2.17 ± 1.78 ng/kg bw/day, allzones and all subjects included, which is consistent with exposures recently estimated in other countries.
Total Diet Studies (TDS) published in several countries (Canada, USA, Finland, Netherlands, Spain, Sweden,United Kingdom and Japan) report average exposures of 13 to 228 ng PBDE/day1 1 4. The levels found inour population of high fish consumers range from 139 to 161 ng PBDE/day with an average of 150 ng/day.Our results are therefore very consistent with those other studies using similar methodologies. Our studypopulation consumes on average four times more fish and seafood than the only consumers of theFrench adult population in the INCA survey (Appendix 3a). We have applied an average deterministicexposure model exploiting the INCA consumption data and our contamination data for fish and seafood
141 EFSA. Opinion of the Scientific Panel on contaminants in the Food chain on a request from the European Parliament related to the safetyassessment of wild and farmed fish. The EFSA Journal. 236 : 1-118. 2005.
142 Baars A.J., Bakker M.I., Baumann R.A., Boon P.E., Freijer J.I., Hoogenboom L.A., Hoogerbrugge R., van Klaveren J.D., Liem A.K., Traag W. A .and de Vries J. Dioxins, dioxin-like PCBs and non-dioxin-like PCBs in foodstuffs: occurrence end dietary in The Netherlands. Toxicol Lett. 151 (1) :51-61. 2004.
SIXTH PART - Discussion 119
POISSON 4.3 GB.qxd 17.9.2006 20:20 Page 119
120 SIXTH PART - Discussion
and those of other product groups contributing to PBDE exposure taken from European studies. Thiscalculation yields an estimated PBDE exposure of about 63 to 142 ng PBDE/day for the French populationcompared to 172 to 250 ng/day for our study population1 4 3.
In its evaluation in 2005, the JECFA concluded that the observed exposure of the general population isestimated to be about 4 ng/kg bw/day, which corresponds to 240 ng/day for a person weighing 60 kg,or slightly more than our calculated exposure. This result is very consistent since the JECFA estimationwas not based on fish consumption alone. The JECFA considered that in view of the consequent marginof exposure for a non-genotoxic compound, the current intakes do not appear to be a cause for concernas regards public health1 1 4.
Today it remains very difficult to measure the PBDEs in biological matrices. Gas phase chromatographycoupled with mass spectrometry (GC-NCI-MS or GC-EI-HRMS) is for the moment the most suitable methodfor detecting PBDEs in matrices of dietary or human origin. But precise evaluation of PBDEs levels inthese matrices is hampered by two serious problems: possible contamination of the samples and thetechnical difficulty of measuring the heaviest compounds.
Nevertheless, there have been some studies of PBDEs levels in maternal milk. The data indicate valuesranging from less than 0.1 ng/g lipids in the earliest studies (in the 1970s) to 1.7 to 3.8 ng/g lipids morerecently (1997 to 2003)1 4 3. Other studies have measured the PBDEs in blood and adipose tissue. Theaverage levels range from 0.4 to 5.6 ng/g in blood or plasma, and from 0.5 to 11.6 ng/g of lipids in adiposet i s s ue1 4 3. Sjodin and his team have moreover showed that a correlation exists between a fish-rich dietand elevation of the measured plasma levels for certain PBDEs1 4 4. We note that whatever the matrixconsidered the tissual concentrations in American studies are always much higher than in other studies.
G l o b a l l y, the data presently available on the concentration in biological tissue are insufficiently documentedto enable to establish a relation with the dietary exposure we have observed.
6.4 Characterisation of benefits and risks
Table 51 summarises the EPA and DHA intakes and the exposures to various contaminants of thepopulation studied, and the probability of exceeding the recommended intakes for n-3 LC-PUFAs orthe TRV.
143 AFSSA. Avis relatif à une évaluation du risqué lié à la présence de re t a rdateurs de flamme bromes dans les aliments (PBDE). Août 2006.
144 Sjodin A, Hagmar L, Klasson-Wehler E, Bjork J, Bergman A. Influence of the consumption of fatty Baltic Sea fish on plasma levels of halo-genated environmental contaminants in Latvian and Swedish men. Environ. Health Perspect. 108 (11) : 1035-1041. 2000.
POISSON 4.3 GB.qxd 17.9.2006 20:20 Page 120
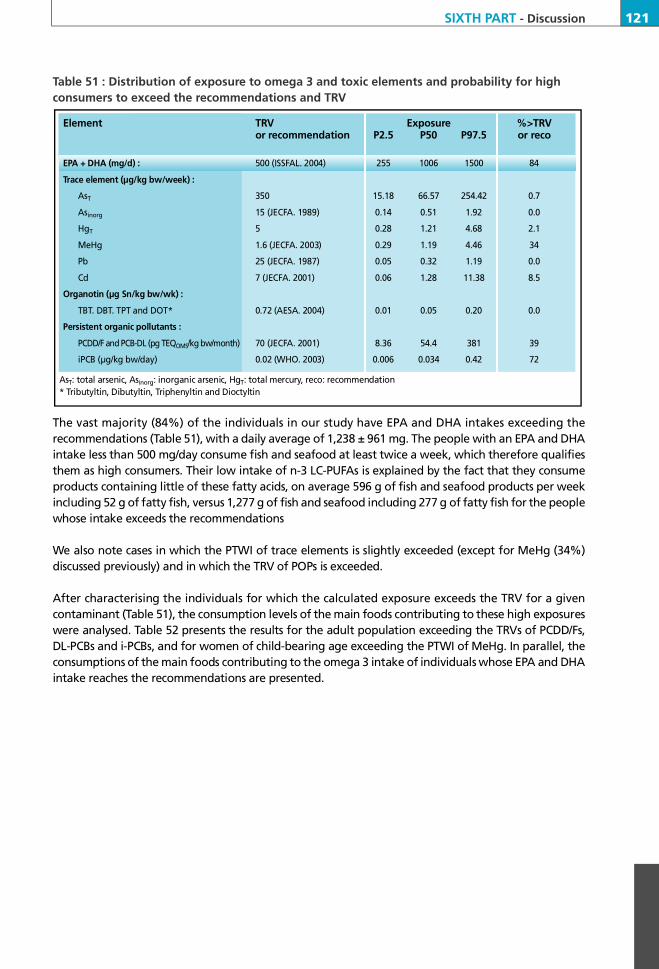
Table 51 : Distribution of exposure to omega 3 and toxic elements and probability for highconsumers to exceed the recommendations and TRV
The vast majority (84%) of the individuals in our study have EPA and DHA intakes exceeding therecommendations (Table 51), with a daily average of 1,238 ± 961 mg. The people with an EPA and DHAintake less than 500 mg/day consume fish and seafood at least twice a week, which therefore qualifiesthem as high consumers. Their low intake of n-3 LC-PUFAs is explained by the fact that they consumeproducts containing little of these fatty acids, on average 596 g of fish and seafood products per weekincluding 52 g of fatty fish, versus 1,277 g of fish and seafood including 277 g of fatty fish for the peoplewhose intake exceeds the recommendations
We also note cases in which the PTWI of trace elements is slightly exceeded (except for MeHg (34%)discussed previously) and in which the TRV of POPs is exceeded.
After characterising the individuals for which the calculated exposure exceeds the TRV for a givencontaminant (Table 51), the consumption levels of the main foods contributing to these high exposureswere analysed. Table 52 presents the results for the adult population exceeding the TRVs of PCDD/Fs,DL-PCBs and i-PCBs, and for women of child-bearing age exceeding the PTWI of MeHg. In parallel, theconsumptions of the main foods contributing to the omega 3 intake of individuals whose EPA and DHAintake reaches the recommendations are presented.
E l e m e n t T RV E x p o s u re % > T RVor re c o m m e n d a t i o n P 2 . 5 P 5 0 P 9 7 . 5 or re c o
E PA + DHA (mg/d) : 500 (ISSFAL. 2004) 2 5 5 1 0 0 6 1 5 0 0 8 4
Trace element (µg/kg bw/week) :
A sT 350 1 5 . 1 8 6 6 . 5 7 2 5 4 . 4 2 0 . 7
A si n o r g 15 (JECFA. 1989) 0 . 1 4 0 . 5 1 1 . 9 2 0 . 0
H gT 5 0 . 2 8 1 . 2 1 4 . 6 8 2 . 1
M e H g 1.6 (JECFA. 2003) 0 . 2 9 1 . 1 9 4 . 4 6 3 4
P b 25 (JECFA. 1987) 0 . 0 5 0 . 3 2 1 . 1 9 0 . 0
C d 7 (JECFA. 2001) 0 . 0 6 1 . 2 8 1 1 . 3 8 8 . 5
Organotin (µg Sn/kg bw/wk) :
T B T. DBT. TPT and DOT* 0.72 (AESA. 2004) 0 . 0 1 0 . 0 5 0 . 2 0 0 . 0
Persistent organic pollutants :
PCDD/F and PCB-DL (pg TEQO M S/kg bw/month) 70 (JECFA. 2001) 8 . 3 6 5 4 . 4 3 8 1 3 9
iPCB (µg/kg bw/day) 0.02 (WHO. 2003) 0 . 0 0 6 0 . 0 3 4 0 . 4 2 7 2
A sT: total arsenic, Asi n o r g: inorganic arsenic, HgT: total mercury, reco: recommendation* Tributyltin, Dibutyltin, Triphenyltin and Dioctyltin
SIXTH PART - Discussion 121
POISSON 4.3 GB.qxd 17.9.2006 20:20 Page 121

122 SIXTH PART - Discussion
Table 52 : Consumptions (g/week) of the major contributors (>5% exposure) to the exposureto persistent organic pollutants, MeHg and Omega 3 by subjects who have an exposure abovethe TRV or recommendations
Table 52 and the tables in Appendix 5 listing the contributions to the exposures do not reveal anyparticular contaminated fish species contributing significantly to the exposure to contaminants coveredby this study. Although it is difficult to weigh the nutritional benefits of omega 3 in fish and seafoodagainst the risks associated with their contamination, some points can nevertheless be underlined.
It is useful to recall the correlation between the MeHg content of fish and seafood products (exceptingcanned and smoked products and prepared dishes) and the n-3 LC-PUFAs content (EPA, DPA, DHA):r=0.23 (p=0.03). Nevertheless, the major contributors to MeHg exposure in women of child-bearing age(tuna, cod, ling, sole, whiting and hake) are not the main contributors to n-3 LC-PUFAs intake (salmon,mackerel, sardine, anchovy and herring). More particularly, the contribution to n-3 LC-PUFAs intake ofthe main vectors of MeHg is negligible, representing less than 5%.
Figures 11 and 12 (Chapter 3: Seafood composition and contamination) show clearly the nutritionalbenefits of salmon, mackerel, sardine, anchovy and halibut, accompanied by low MeHg content.
Nevertheless, we should remember that these species, in particular salmon, sardine and mackerel whichare oily fish and therefore rich in omega 3, also contain high levels of POPs and are, regardless of thecongeners considered, the main vectors of these pollutants. These same species also contribute to lead,cadmium and organotin exposure, although this is not necessarily due to heavy contamination, butoften to their high level of consumption which is visible in the regional data.
From one zone to another we tend to find the same major contributors to contaminant and omega 3fatty acid intakes. However some geographic differences are seen (Appendix 5).
Major Subjects who have an Subjects who have an Women of childbearing age Subjects who have anC o n t r i b u t o r s e x p o s u re to PCDD/F e x p o s u re to who have an exposure intake of EPA and DHA >
and PCB-DL > TRV * * iPCB > TRV * * MeHg > TRV * * R e c o m m e n d a t i o n * *% contrib M e a n ± S D P 9 5 % contrib M e a n ± S D P 9 5 % contrib M e a n ± S D P 9 5 % contrib M e a n ± S D P 9 5
E e l * 1 6 9 ± 30 3 7 1 2 4 ± 19 19 - - - - - -S e a b a s s * 7 40 ± 80 1 7 5 9 25 ± 56 1 0 2 - - - - - -Sea bream* 5 38 ± 84 1 9 7 5 25 ± 61 114 - - - - - -S w i m c r a b 9 19 ± 48 1 0 0 6 8 ± 32 5 0 - - - - - -M a c k e r e l 7 18 ± 105 2 5 6 7 42 ± 75 1 7 3 - - - 1 2 47 ± 79 1 8 1S a r d i n e 2 3 60 ± 57 1 6 4 2 3 35 ± 45 1 3 8 - - - 9 39 ± 47 1 4 7S a l m o n 9 102 ± 126 2 8 8 1 1 73 ± 95 2 2 5 - - - 2 3 82 ± 98 2 3 0C o d - - - - - - 5 93 ± 103 2 1 2 - - - Swordfish* - - - - - - 7 13 ± 38 5 0 - - -L i n g - - - - - - 5 19 ± 37 9 8 - - - W h i t i n g - - - - - - 5 36 ± 62 1 3 7 - - -H a k e - - - - - - 5 38 ± 73 1 9 0 - - - S o l e - - - - - - 6 65 ± 98 2 5 0 - - - Tu n a * - - - - - - 2 6 139 ± 123 3 3 5 - - - A n c h o v y - - - - - - - - - 5 40 ± 89 1 8 0* Predatory fish as described in the Commission Regulation (EC) No 78/2005 of 19 January 2005** PTMI for PCDD/F and PCB-DL = 70 pg TEQO M S/kg bw/month (JECFA, 2001). TDI for iPCB = 0.02 µg/kg bw/day (WHO, 2003). PTWIfor MeHg = 1.6 µg/kg bw/week (JECFA, 2003). Recommended intake for EPA + DHA = 500 mg/d (ISSFAL, 2004)
POISSON 4.3 GB.qxd 17.9.2006 20:20 Page 122

These disparities are largest as regards the trace elements (other than MeHg) and it clearly appears thatthe average contributions in all the zones are not representative of each region. The differences are dueto particularly high contaminations in a given zone and/or regional food consumptions diff e r e n c e s .
• C o n t a m i n a t i o n : crab accounts for 53% of the Cd exposure in Lorient, but less than 5% in the otherzones, which is due to heavy contamination of the composite sample in Lorient (12 µg/g versus lessthan 1 µg/g in the other sampling zones). Similarly, shrimp accounts for 60% of Cd exposure in LeHavre, but less than 2% in the other zones, due to heavy contamination of the composite sample inLe Havre (4 µg/g versus less than 0.05 µg/g in the other zones). The same observation can be madeconcerning whelks in La Rochelle (21% of the exposure and a Cd level of 2 µg/g versus less than 1µg/g elsewhere). Ray, a fish relatively contaminated by AsT and Asi n o r g, appears in some zones as amajority contributor; similarly for the great scallop in Toulon (14%). The swimcrab, which appearsto be a majority contributor to PCDD/F, DL-PCB and i-PCB exposure in general in the four zones, is infact a major contributor only in Le Havre, due to the heavy contamination of the composite samplein Le Havre.
• C o n s u m p t i o n : the great scallop appears to contribute heavily to Pb exposure in Le Havre (22%)due to high consumption, as do mussels in La Rochelle (16%) and sea urchin in Toulon (14%). Thegreat scallop is also a majority contributor to Asi n o r g exposure in Le Havre (15%), again due to highconsumption, along with cod, less contaminated than ray but widely consumed. The sea urchin inToulon is also a majority contributor to Asinorg exposure (12%) since it is highly consumed comparedto the other zones. The eel appears to be the only heavy contributor to PBDE, DL-PCB and i-PCBexposure, but only in La Rochelle due to high consumption and a high consumer rate in all thepopulation groups there, compared to the other zones. Finally, as regards the organotins, in viewof the low levels of each compound in the samples, the contributions are explained by the diff e r e n tconsumptions from one region to another.
• Contamination and consumption : other large regional contributions to Cd exposure – faithe inLorient and Toulon, whelks in La Rochelle, anchovy in Lorient and Toulon, great scallop in Le Havreand Toulon – are due not only to slightly higher contamination in these zones, but also to higherconsumption of these products. Similarly, faithe, a fish widely consumed, appears to be a maincontributor (28%) to Pb exposure in Lorient in particular since the composite sample is morecontaminated in this zone (0.2 µg/g versus less than 0.002 µg/g elsewhere).
On the basis of our analysis is appears that consumption recommendations should take account of allthe data presented here and, if they are based on synthetic results, they should also take into accountthe fact that consumption levels vary for given species and above that the contamination levels forcertain species and certain contaminants can vary greatly from one region to another, even from onesampling point to another within the same region. It is therefore important to incorporate in the analysisthe provisioning methods, local ones in particular, of certain products, and encourage consumers todiversify their provisioning origins for local species (and species bought locally but not of local origin)subject to the highest contaminations.
SIXTH PART - Discussion 123
POISSON 4.3 GB.qxd 17.9.2006 20:20 Page 123

124 SIXTH PART - Discussion
Lastly the analysis of the consumption and exposure data shows that for many subjects exceeding theT RV by the indirect approach, particularly for MeHg, this exceeding is not due to the consumption ofhighly contaminated products but to their high consumption, in quantities and variety. Low contaminatedproducts consumed in high quantities can lead to exceeding of TRV. For example we can consider an“average fish” including all the 81 different products consumed by subjects exceeding the PTWI forMeHg, weighting the contaminations of those products by the mean consumption of those subjects.The contamination of this “average fish” is 0.096 µg MeHg/g fresh weight. A consumption of this fishhigher than 1,167 g per week would lead to an exceeding of the TRV for a subject of 70 kg bw. In otherwords a high consumer who would consume a important variety of products with about 8 portions offish and seafood per week or more might present a risk of exceeding the PTWI for MeHg by the indirectapproach calculation.
In view of the possible overestimation of consumptions by the data collection method - the food frequencyquestionnaire - used in this survey, we calculated a correction factor applicable to the consumption dataof this survey, using the data collected from the feasibility study8 6.
Having calculated contaminants and Omega 3 contributions of each seafood product, the products forwhich at least one intake was greater than or equal to 5% of the total intake were selected. Theseproducts and their contribution to the total intake are shown in the Appendix 5.
During the feasibility study, two methods of collecting dietary consumption data had been employed:the food frequency questionnaire and a 7-day diary record. Among the seafood products consumed inthe feasibility survey and common to the two methods, we selected the products also common with thelist of contributors of the full-scale survey identified previously.
Three categories of products were constituted:
• 1: Fish consumed only fresh or frozen
• 2: Molluscs and crustaceans consumed only fresh or frozen
• 3: Fish and crustaceans consumed fresh, frozen, smoked or canned
For each individual in the database of the pilot survey, the ratios between the quantity of product notedin the 7-day diary record and the quantity declared on the food frequency questionnaire were calculated.Table 53 presents the results of these calculations.
POISSON 4.3 GB.qxd 17.9.2006 20:20 Page 124

SIXTH PART - Discussion 125
Table 53 : Consumption correction coefficient between the FFQ and the 7 day diary record in thefeasibility study for the three categories defined
The results show clearly here that the food frequency questionnaire tends to overestimate consumptions,compared to the 7-day diary record, by a factor 1.5 to 2 depending on the category.
Applying these correction coefficients, the consumptions of all the products concerned for the 996individuals of the CALIPSO survey were calculated and compared with the consumption data of fish andseafood collected among consumers only in the INCA 99 survey (Appendix 3b).
The difference factor between the consumption values from the two surveys is less than in the firstcomparison (Part 2.2.) for fish and molluscs and crustaceans where it falls from about 2.5 to 2. On theother hand, it is reduced much less, from 1.5 to about 1.3, for other seafood products (canned, smokedand others). For the total consumption, the difference factor between the two surveys falls from about2.5 to 3.
After correction of the consumptions, it appears that the probability of exceeding the TRVs for allcontaminants is less. In particular, before correction the i-PCBs exposure of 72% of the subjects exceededthe TDI; after correction this figure falls to 58%. Similarly, before correction 39% of the subjects exceededthe PTMI for PCDD/Fs and DL-PCBs, but only 26% after correction. Concerning cadmium exposure, thepercentage of people exceeding the PTWI drops from 8.5% to 2.2%, and for arsenic from 0.7% to 0.03%.
F i n a l l y, while 34% of the subjects in our study have an MeHg exposure exceeding the PTWI of 1.6 µg/kgbw/week, after correction this figure falls to 20%. If we consider the two PTWIs (1.6 µg/kg bw/week forwomen of child-bearing age, 3.3 µg/kg bw/week for other adult people), the cases exceeding the PTWIfall from 16% to 7%. Moreover, if we apply to these new exposures the average correction factor of 4.3(exposure / steady state) we obtain a new average steady state of 0.27 ± 0.24 µg/kg bw/week (versus0.35 ± 0.88 µg/kg bw/week before correction) and 0.67 µg/kg bw/week at P95 (0.82 before correction).
The correlations between dietary exposure and blood levels are not improved after correction of theconsumptions, either for fatty acids or contaminants.
CI 95%
C a t e g o r i e M e a n Inf. limit Sup. limit1 0 . 4 7 0 . 2 0 0 . 7 3
2 0 . 5 8 0 . 3 1 0 . 8 5
3 0 . 6 5 0 . 4 3 0 . 8 6
CI : Confidence interval
POISSON 4.3 GB.qxd 17.9.2006 20:20 Page 125

126 SEVENTH PART - Conclusion
SEVENTHPART
Conclusion
POISSON 4.3 GB.qxd 17.9.2006 20:20 Page 126

SEVENTH PART - Conclusion 127
Unlike traditional so-called “indirect” exposure studies based on ingestions, the CALIPSO study enablesfiner characterisation of the risks and benefits associated with fish and seafood consumption by measuringactual biological levels. The study reveals that French coastal populations, generally high seafoodconsumers, are well informed and have sound knowledge of these foods. They appreciate informationon this subject which is a source of concern, yet they tend to be ambivalent as regards the public controversyon this issue.
The study shows that the contaminant levels measured in provisioned fish and seafood are globallysatisfactory relative to currently applicable regulations, with the exception of a few products. For traceelements this “background” contamination level is relatively homogeneous all along the French coast,whereas for persistent organic pollutants a North-South contamination gradient is observed.
From a “benefits” point of view, the study shows that consuming fish alone at least twice a week (includingsome oily fish) ensures the recommended intake of omega 3 long-chain polyunsaturated fatty acids.C o n s e q u e n t l y, in view of the measured data and current scientific knowledge of the benefits of consumingomega 3, notably prevention of cardio-vascular diseases, it is legitimate to conclude that such eff e c t sare observed in our study population, even if the study reveals that physiological, nutritional andbehavioural factors also affect the homeostasic regulation of omega 3.
As regards risks, only the highest consumers of our study population present a non-negligible probabilityof exceeding the reference toxicological values, notably for methylmercury, cadmium, dioxins and PCBs(“dioxin-like” or not). For these persistent organic pollutants (POP), other foods not taken into accountin this study are also vectors. However, the study of biomarkers and the rectification of the consumptionsrevealed by the food consumption survey shows that these calculated excess levels are difficult to interpretowing to the uncertainties inherent in all indirect exposure studies and the existence of safety factors.Even when the reference toxicological values are exceeded, the levels remain relatively close to thesevalues, in particular for methylmercury and cadmium. Nevertheless these results demonstrate the needto pursue the efforts being made to reduce exposure (by reducing pollution), especially to dioxins andall PCBs.
With the exception of a few fish, the foods contributing most to omega 3 intake and to exposure topersistent organic pollutants are often the same specifies, in particular salmon, mackerel and sardine,owing mainly to their high fat content and their high consumers rate. For trace elements, the contributingfoods are different: for example tuna and swordfish for methylmercury, and shrimp, crab, anchovy, greatscallop and periwinkle for cadmium, mainly due to a higher level of contamination and/or consumptionin certain regions.
F i n a l l y, concerning the global question of weighing health risks against nutritional benefits, the studyresults confirm the validity of the recommendations formulated by various national scientific bodies:that the general population should consume fish at least twice a week, including some oily fish, andthat pregnant or breast-feeding women should consume predator fish not more than once a week.
Looking beyond these general recommendations, this study highlights the advantages of diversifyingthe consumed fish and seafood species in terms of proportions and provisioning origins in order to ensurea rational balance between benefits and risks compatible with nutritional and toxicologicalr e c o m m e n d a t i o n s .
POISSON 4.3 GB.qxd 17.9.2006 20:20 Page 127

128 APPENDIX
EIGHTHPART
APPENDIX
POISSON 4.3 GB.qxd 17.9.2006 20:20 Page 128

APPENDIX 1 : Fish and seafood sampled in the 4 study zones 129
Appendix 1 : Fish and seafood sampled in the 4 study zones
Samples common to the four zones
Fresh anchovy Smoked haddock Canned anchovy Smoked herringPreserved anchovy Smoked mackerelCanned mackerel Smoked salmonCanned pilchard Canned sardines Ta r a m aCanned Yellow fin tuna* S u r i m iCanned Albacore tuna* Dehydrated fish soupCanned Skipjack tuna* Liquid fish soupCanned flaked Yellow fin tuna* P a e l l aCanned flaked tuna (without further details)*Canned crab* Predatory fish as described in the Commission Regulation (EC) No 78/2005 of 19 January 2005
F i s h Mollusc, crustaceanAngler fish* P o l l a c k C r a bC a t s h a r k * R a y * Great scallopC o d Saithe / Coalfish M u s s e lDab S a l m o n Oyster Eel* S a r d i n e P e r i w i n k l eGrenadier / hoki* S e a b a s s * S c a m p iH a k e Sea bream* Shrimp H a l i b u t * S o l e Squid L i n g S w o r d f i s h * S w i m c r a bM a c k e r e l Tu n a * W h e l kP l a i c e Whiting Angler fish* M a c k e r e l Cockle C a t s h a r k * P l a i c e C r a bC o d Pollack Great scallopDab R a y * M u s s e lE m p e r o r * Saithe / Coalfish O y s t e rG o a t f i s h S a l m o n Periwinkle Grenadier / hoki* S a r d i n e S c a m p iGurnard S e a b a s s * S h r i m pHaddock Sea bream* Spider crabHake S o l e S q u i dH a l i b u t * S w o r d f i s h * S w i m c r a bJohn dory Pout Tu n a *L i n g Whiting Angler fish * P o l l a c k Calico scallop C a t s h a r k * Ray* Cockle C o d Saithe / Coalfish C r a bD a b S a l m o n Cuttle fish E m p e r o r * S a r d i n e Great scallop Goatfish Seabass* M u s s e lGrenadier / hoki* Sea bream * O y s t e rHaddock S o l e P e r i w i n k l eH a k e S w o r d f i s h * S c a m p iH a l i b u t * Tu n a * S h r i m pL i n g W h i t i n g S q u i dM a c k e r e l W h e l kAngler fish* R a y * Cuttle fish C a t s h a r k * Saithe / Coalfish Great scallopC o d Scorpion fish Lobster Dab S e a b a s s * Mussel E m p e r o r * Sea bream * O c t o p u sG o a t f i s h S a l m o n Oyster Grenadier / hoki* S a r d i n e Sea urchinHake S o l e S h r i m pH a l i b u t * S w o r d f i s h * S q u i dJohn dory Tu n a * W h e l kL i n g W h i t i n gM a c k e r e l
* Predatory fish as described in the Commission Regulation (EC) No 78/2005 of 19 January 2005
Le Havre
L o r i e n t
La Rochelle
To u l o n
POISSON 4.3 GB.qxd 17.9.2006 20:20 Page 129
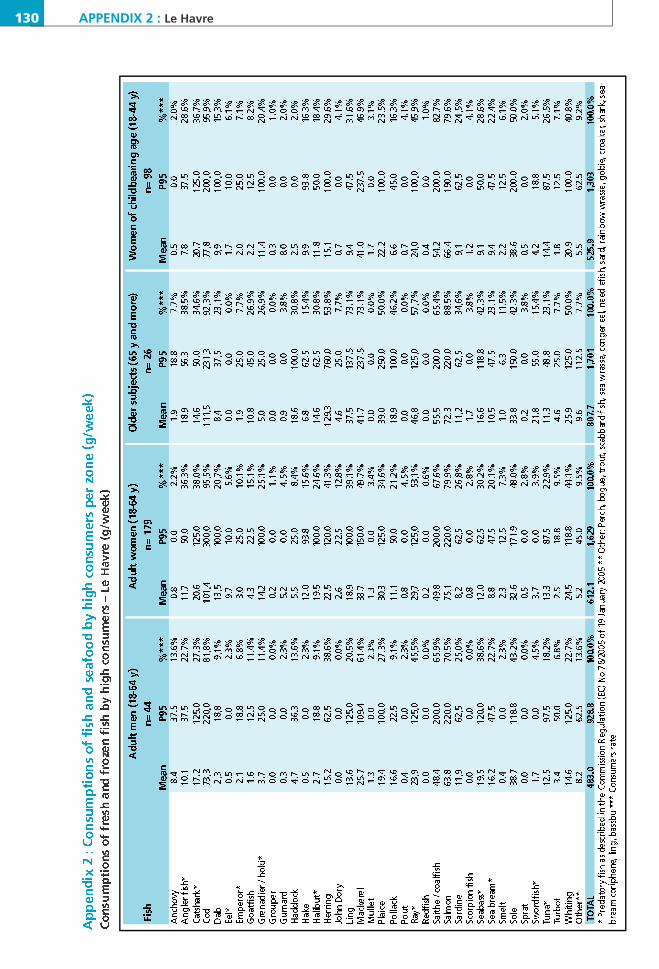
130 APPENDIX 2 : Le Havre
POISSON 4.3 GB.qxd 17.9.2006 20:20 Page 130

APPENDIX 2 : Le Havre 131
POISSON 4.3 GB.qxd 17.9.2006 20:20 Page 131

132 APPENDIX 2 : Le Havre
POISSON 4.3 GB.qxd 17.9.2006 20:20 Page 132

APPENDIX 2 : Lorient 133
POISSON 4.3 GB.qxd 17.9.2006 20:20 Page 133

134 APPENDIX 2 : Lorient
POISSON 4.3 GB.qxd 17.9.2006 20:20 Page 134

APPENDIX 2 : Lorient 135
POISSON 4.3 GB.qxd 17.9.2006 20:20 Page 135

136 APPENDIX 2 : La Rochelle
POISSON 4.3 GB.qxd 17.9.2006 20:20 Page 136

APPENDIX 2 : La Rochelle 137
POISSON 4.3 GB.qxd 17.9.2006 20:21 Page 137

138 APPENDIX 2 : La Rochelle
POISSON 4.3 GB.qxd 17.9.2006 20:21 Page 138

APPENDIX 2 : Toulon 139
POISSON 4.3 GB.qxd 17.9.2006 20:21 Page 139
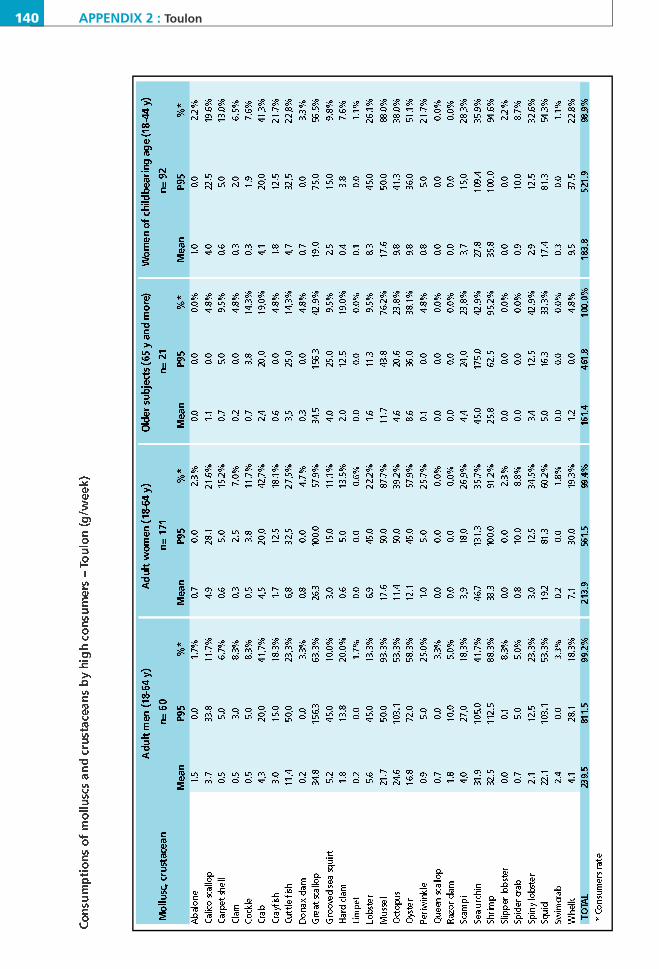
140 APPENDIX 2 : Toulon
POISSON 4.3 GB.qxd 17.9.2006 20:21 Page 140

APPENDIX 2 : Toulon 141
POISSON 4.3 GB.qxd 17.9.2006 20:21 Page 141

142 APPENDIX 3A AND 3B : Comparison between Calipso and INCA before and after corre c t i o n
Appendix 3a :Comparison between consumption data from Calipso and INCA before correction
Appendix 3b :Comparison between consumption data from Calipso and INCA after correction
Calipso (n=243) INCA (n=509)Seafood gro u p Adult men (18-64 y) Consumers only (83,5%)
M e a n P 9 5 M e a n P 9 5
F i s h 4 4 1 . 8 1 , 0 7 6 2 6 7 . 2 7 0 5 . 0
Mollusc, crustacean 2 0 5 . 7 5 1 1 . 9 1 1 5 . 1 2 8 5 . 0
Seafood-based dishes 2 6 8 . 4 6 9 5 . 0 2 2 3 . 2 7 3 0 . 0
To t a l 9 1 5 . 8 1 , 9 6 7 3 6 5 . 9 1 , 0 7 5
Calipso (n=630) INCA (n=610)Adult women (18-64 y) Consumers only (84.3%)
F i s h 4 5 1 . 8 1 , 1 5 5 2 2 9 . 0 5 8 0 . 0
Mollusc, crustacean 1 9 4 . 7 5 4 4 . 7 1 0 9 . 8 2 5 8 . 0
Seafood-based dishes 2 3 6 . 1 6 4 1 . 0 1 6 8 . 1 6 4 0 . 0
To t a l 8 8 2 . 6 1 , 9 4 3 3 0 4 . 5 8 0 0 . 0
Calipso (n=123) INCA (n=243)Older subjects (65 y and more ) Consumers only (86.1%)
F i s h 5 7 5 . 6 1 , 4 1 3 2 9 0 . 2 6 9 5 . 0
Mollusc, crustacean 2 0 8 . 5 5 3 5 . 6 1 1 5 . 3 3 3 0 . 0
Seafood-based dishes 1 6 1 . 9 3 9 6 . 9 1 2 7 . 0 4 1 0 . 0
To t a l 9 4 6 . 0 2 , 1 4 8 3 3 2 . 5 8 5 0 . 5
Calipso (n=344) INCA (n=404)Women of childbearing age (18-44 y) Consumers only (82.7%)
F i s h 3 9 1 . 9 8 7 0 . 5 2 2 4 . 3 5 8 0 . 0
Mollusc, crustacean 1 7 4 . 1 4 8 7 . 9 1 0 9 . 3 2 5 0 . 0
Seafood-based dishes 2 6 2 . 4 6 9 1 . 9 1 7 4 . 4 6 5 0 . 0
To t a l 8 2 8 . 4 1 , 8 0 6 3 0 0 . 3 7 8 5 . 0
Calipso (n=243) INCA (n=509)Seafood gro u p Adult men (18-64 y) Consumers only (83,5%)
M e a n P 9 5 M e a n P 9 5
F i s h 6 3 3 . 0 1 , 4 9 1 2 6 7 . 2 7 0 5 . 0
Mollusc, crustacean 2 7 0 . 3 7 0 3 . 4 1 1 5 . 1 2 8 5 . 0
Seafood-based dishes 3 1 2 . 3 7 9 8 . 8 2 2 3 . 2 7 3 0 . 0
To t a l 1 , 2 1 6 2 , 4 8 6 3 6 5 . 9 1 , 0 7 5
Calipso (n=630) INCA (n=610)Adult women (18-64 y) Consumers only (84.3%)
F i s h 6 3 6 . 5 1 , 5 2 2 2 2 9 . 0 5 8 0 . 0
Mollusc, crustacean 2 5 9 . 9 6 6 5 . 3 1 0 9 . 8 2 5 8 . 0
Seafood-based dishes 2 7 2 . 2 7 4 2 . 5 1 6 8 . 1 6 4 0 . 0
To t a l 1 , 1 6 9 2 , 5 8 8 3 0 4 . 5 8 0 0 . 0
Calipso (n=123) INCA (n=243)Older subjects (65 y and more ) Consumers only (86.1%)
F i s h 7 8 7 . 8 1 , 7 8 3 2 9 0 . 2 6 9 5 . 0
Mollusc, crustacean 2 7 9 . 3 6 4 8 . 8 1 1 5 . 3 3 3 0 . 0
Seafood-based dishes 1 8 7 . 7 4 7 2 . 5 1 2 7 . 0 4 1 0 . 0
To t a l 1 , 2 5 5 2 , 7 6 4 3 3 2 . 5 8 5 0 . 5
Calipso (n=344) INCA (n=404)Women of childbearing age (18-44 y) Consumers only (82.7%)
F i s h 5 6 9 . 4 1 2 8 6 . 9 2 2 4 . 3 5 8 0 . 0
Mollusc, crustacean 2 3 5 . 1 6 0 7 . 4 1 0 9 . 3 2 5 0 . 0
Seafood-based dishes 3 0 0 . 8 7 9 5 . 0 1 7 4 . 4 6 5 0 . 0
To t a l 1 , 1 0 5 2 , 4 0 1 3 0 0 . 3 7 8 5 . 0
POISSON 4.3 GB.qxd 17.9.2006 20:21 Page 142

APPENDIX 4 : Le Havre 143
Appendix 4: Distribution of provisioning per site (% of consumed product)
Fish
Le Havre Fished or B o u g h t B o u g h t Bought Bought Consumed only c o l l e c t e d at the at the f rom a f rom a outside the
p o r t m a r k e t f i s h m o n g e r s u p e r m a r k e t h o m e
Anchovy (excluding canned) - - 4 . 0 5 7 . 3 3 8 . 7 -
Angler fish* 0 . 4 7 . 6 2 . 1 2 0 . 0 6 8 . 1 1 . 9
C a t s h a r k * 0 . 5 1 9 . 0 2 . 0 1 2 . 1 6 5 . 6 0 . 8
C o d 0 . 1 4 . 3 2 . 6 1 4 . 1 7 6 . 7 2 . 2
D a b 4 . 1 1 2 . 8 1 6 . 4 1 8 . 1 4 4 . 9 3 . 7
E e l * 3 . 9 1 6 . 0 5 . 7 6 5 . 5 7 . 9 1 . 0
E m p e r o r * - 0 . 5 1 2 . 7 2 6 . 5 6 0 . 3 -
G o a t f i s h 2 . 0 1 5 . 8 2 . 6 2 1 . 2 4 2 . 1 1 6 . 3
Grenadier / Hoki* - 0 . 9 0 . 9 1 3 . 5 8 4 . 5 -
G r o u p e r 5 7 . 1 - - - 4 2 . 9 -
G u r n a r d - 4 . 6 - 2 5 . 7 6 9 . 7 -
H a d d o c k - 0 . 2 6 . 0 1 5 . 4 7 8 . 5 -
H a k e 1 . 0 0 . 3 1 4 . 4 6 . 6 7 7 . 7 -
H a l i b u t * - 0 . 6 0 . 3 4 . 5 9 3 . 2 1 . 4
Herring (excluding smoked) 1 . 7 1 0 . 7 5 . 8 3 0 . 7 5 0 . 7 0 . 4
John dory 3 . 3 9 . 6 - 3 4 . 3 5 2 . 9 -
L i n g 0 . 5 3 . 2 2 . 8 1 6 . 7 7 5 . 1 1 . 8
M a c k e r e l 1 0 . 5 3 7 . 4 1 . 7 1 1 . 0 3 7 . 3 2 . 2
M u l l e t 6 9 . 2 - - - 2 2 . 6 8 . 1
P l a i c e 2 . 4 3 8 . 1 5 . 1 1 2 . 9 4 1 . 4 -
P o l l a c k 2 . 2 4 . 4 8 . 4 1 3 . 9 5 5 . 9 1 5 . 2
Pout 1 5 . 5 4 3 . 8 - 7 . 8 3 2 . 9 -
R a y * 4 . 1 6 . 4 3 . 3 1 6 . 4 6 5 . 0 4 . 9
R e d f i s h - - - - 1 0 0 . 0 -
Saithe / Coalfish 3 . 9 2 . 1 1 0 . 9 8 2 . 4 0 . 8
Salmon (excluding smoked) 0 . 0 0 . 9 1 . 7 1 7 . 1 7 5 . 8 4 . 5
Sardine (excluding canned) 0 . 3 5 . 0 4 . 3 2 3 . 2 6 5 . 1 2 . 2
Scorpion fish - - - 3 6 . 0 6 4 . 0 -
S e a b a s s * 2 7 . 2 1 8 . 2 1 . 3 1 3 . 1 2 7 . 9 1 2 . 2
Sea bream* 2 . 3 2 4 . 2 5 . 0 1 6 . 8 4 8 . 9 2 . 7
S m e l t 2 . 1 2 4 . 2 - 3 6 . 6 3 7 . 1 -
S o l e 5 . 9 3 0 . 6 0 . 6 1 7 . 7 3 4 . 0 1 1 . 2
S p r a t 3 7 . 5 - 1 2 . 5 1 2 . 5 3 7 . 5 -
S w o r d f i s h * - 1 . 4 - 5 . 1 9 3 . 4 -
Tuna (excluding canned)* - 1 . 3 1 . 5 7 . 3 8 7 . 2 2 . 7
Tu r b o t 4 . 8 2 1 . 6 - 3 9 . 2 2 9 . 2 5 . 2
W h i t i n g 1 . 4 9 . 8 3 . 1 2 1 . 0 6 4 . 0 0 . 7
O t h e r * * 1 9 . 6 - - - 8 0 . 4 -
* Predatory fish as described in the Commission Regulation (EC) No 78/2005 of 19 January 2005** Other: Perch, trout, scabbard-fish, sea wrasse, conger eel, croaker, shark, bassbu
POISSON 4.3 GB.qxd 17.9.2006 20:21 Page 143

Fish
L o r i e n t Fished or B o u g h t B o u g h t Bought Bought Consumed only c o l l e c t e d at the at the f rom a f rom a outside the
p o r t m a r k e t f i s h m o n g e r s u p e r m a r k e t h o m e
Anchovy (excluding canned) 1 . 5 2 . 1 1 2 . 5 6 8 . 3 1 4 . 6 1 . 0
Angler fish* 5 . 6 9 . 9 1 3 . 3 3 4 . 7 3 3 . 9 2 . 6
C a t s h a r k * 1 . 3 - 3 . 6 5 7 . 8 3 7 . 3 -
C o d 2 . 7 1 3 . 4 7 . 1 3 0 . 6 4 4 . 8 1 . 4
D a b 2 . 6 1 4 . 0 7 . 3 4 9 . 0 2 4 . 0 3 . 1
E e l * 5 2 . 8 1 . 6 7 . 6 1 7 . 3 2 0 . 7 -
Emperor* 1 . 8 4 . 0 1 0 . 1 2 6 . 4 5 5 . 2 2 . 4
G o a t f i s h 8 . 5 2 1 . 6 1 4 . 5 4 2 . 0 1 2 . 6 0 . 7
Grenadier / Hoki* 3 . 6 2 . 4 2 . 9 3 8 . 2 4 5 . 4 7 . 5
G r o u p e r - - - 1 0 0 . 0 - -
G u r n a r d 3 . 9 2 0 . 1 4 . 3 4 1 . 6 3 0 . 0 -
H a d d o c k 3 . 9 0 . 8 2 . 5 3 5 . 1 5 7 . 7 -
H a k e 3 . 4 2 6 . 4 1 1 . 7 2 9 . 8 2 5 . 9 2 . 7
H a l i b u t * 3 . 2 1 . 8 2 2 . 4 2 9 . 6 3 7 . 6 5 . 3
Herring (excluding smoked) 3 0 . 4 1 5 . 4 1 2 . 8 2 6 . 2 1 3 . 9 1 . 3
John Dory 5 . 9 - 2 7 . 9 3 1 . 4 8 . 3 2 6 . 5
L i n g 1 . 4 3 . 8 5 . 0 4 5 . 3 4 3 . 5 0 . 9
M a c k e r e l 1 9 . 0 3 0 . 6 8 . 6 2 6 . 6 1 5 . 3 -
M u l l e t 5 5 . 9 4 4 . 1 - - - -
P l a i c e 7 . 6 3 . 7 1 0 . 6 3 4 . 2 4 3 . 9 -
P o l l a c k 1 3 . 2 1 2 . 7 5 . 4 4 0 . 6 2 7 . 4 0 . 5
P o u t 1 5 . 8 3 8 . 1 2 6 . 9 1 2 . 0 5 . 5 1 . 7
R a y * 2 . 5 2 . 3 8 . 8 4 4 . 8 3 8 . 5 3 . 0
R e d f i s h - - 3 3 . 5 6 6 . 5 - -
Saithe / Coalfish 1 . 8 8 . 4 6 . 8 3 4 . 5 4 6 . 1 2 . 3
Salmon (excluding smoked) 0 . 8 1 . 1 6 . 7 3 5 . 5 5 3 . 2 2 . 8
Sardine (excluding canned) 3 . 4 9 . 9 1 5 . 3 4 0 . 8 2 8 . 6 1 . 8
Scorpion fish 2 6 . 5 - - 2 8 . 5 1 9 . 9 2 5 . 2
S e a b a s s * 3 1 . 7 2 1 . 7 7 . 8 2 1 . 6 1 4 . 2 3 . 0
Sea bream* 5 . 2 1 0 . 7 2 0 . 8 3 7 . 4 2 0 . 3 5 . 5
S m e l t 1 6 . 3 1 3 . 2 - 5 3 . 6 1 6 . 9 -
S o l e 1 6 . 3 2 0 . 4 3 . 9 4 6 . 4 1 0 . 2 2 . 6
S p r a t - - 5 0 . 0 - 5 0 . 0 -
S w o r d f i s h * 2 . 6 8 . 8 2 7 . 1 3 1 . 4 2 3 . 9 6 . 3
Tuna (excluding canned)* 4 . 1 2 9 . 0 7 . 5 2 8 . 2 2 9 . 2 2 . 0
Tu r b o t 1 2 . 8 0 . 7 1 7 . 9 2 2 . 8 1 3 . 2 3 2 . 7
W h i t i n g 4 . 2 2 4 . 4 1 0 . 5 3 2 . 4 2 8 . 1 0 . 5
O t h e r * * 1 0 . 8 - - 7 . 5 8 1 . 7 -
* Predatory fish as described in the Commission Regulation (EC) No 78/2005 of 19 January 2005** Other: Perch, trout, scabbard-fish, sea wrasse, conger eel, croaker, shark, bassbu
144 APPENDIX 4 : Lorient
POISSON 4.3 GB.qxd 17.9.2006 20:21 Page 144

APPENDIX 4 : La Rochelle 145
Fish
La Rochelle Fished or B o u g h t B o u g h t Bought Bought Consumed only c o l l e c t e d at the at the f rom a f rom a outside the
p o r t m a r k e t f i s h m o n g e r s u p e r m a r k e t h o m e
Anchovy (excluding canned) 1 . 2 0 . 5 7 9 . 7 3 . 7 1 4 . 5 0 . 4
Angler fish* 1 . 1 2 . 1 3 3 . 9 2 0 . 7 3 3 . 5 8 . 7
C a t s h a r k * 5 . 9 1 8 . 2 2 1 . 9 1 5 . 0 2 9 . 2 9 . 7
C o d 0 . 4 4 . 8 2 9 . 3 1 7 . 3 4 7 . 3 0 . 8
D a b 5 . 2 2 3 . 2 1 9 . 2 1 7 . 7 3 1 . 6 3 . 2
E e l 2 4 . 1 1 . 9 3 0 . 6 1 1 . 0 2 7 . 8 4 . 6
Emperor* - 8 . 5 3 6 . 1 2 0 . 9 2 9 . 1 5 . 5
G o a t f i s h 3 . 3 6 . 1 4 9 . 4 1 6 . 7 2 2 . 7 1 . 8
Grenadier / Hoki* 0 . 4 1 6 . 7 2 1 1 9 . 9 3 4 . 4 7 . 6
G r o u p e r - - 3 2 . 9 4 3 . 5 1 8 . 4 5 . 2
G u r n a r d - 8 . 9 2 6 . 8 1 5 . 4 4 6 . 6 2 . 3
H a d d o c k - 2 4 . 8 1 9 . 7 1 4 . 0 3 7 . 3 4 . 1
H a k e 2 . 5 1 0 . 2 2 9 . 5 2 4 . 1 3 3 . 4 0 . 3
H a l i b u t * 0 . 0 2 . 1 3 4 . 2 2 5 . 1 3 7 . 6 1 . 0
Herring (excluding smoked) 1 . 0 1 3 . 5 2 5 . 0 1 7 . 1 4 3 . 4 -
John Dory 1 . 0 3 1 . 4 4 2 . 0 9 . 8 7 . 2 8 . 6
L i n g 0 . 3 1 3 . 0 1 5 . 4 1 8 . 6 3 9 . 0 1 3 . 8
M a c k e r e l 1 6 . 4 1 4 . 0 2 4 . 0 1 1 . 2 3 4 . 0 0 . 4
M u l l e t 3 8 . 7 3 0 . 4 1 8 . 5 4 . 1 8 . 3 -
P l a i c e 4 . 2 4 2 2 3 . 2 9 . 2 2 0 . 6 0 . 8
P o l l a c k 5 . 5 1 9 . 0 2 7 . 3 1 6 . 7 3 1 . 0 0 . 5
P o u t 3 3 . 1 1 5 . 1 2 1 . 4 1 0 . 1 1 6 . 6 3 . 7
R a y * 3 . 0 6 . 9 3 5 . 6 2 4 . 1 2 7 . 2 3 . 3
R e d f i s h - 5 0 . 3 - - 3 4 . 8 1 4 . 8
Saithe / Coalfish 0 . 1 8 . 0 2 0 . 6 1 2 . 9 5 6 . 8 1 . 6
Salmon (excluding smoked) 0 . 2 2 . 4 2 4 . 8 1 8 . 8 4 5 . 8 7 . 9
Sardine (excluding canned) 1 . 2 6 . 2 3 3 . 5 2 1 . 4 3 6 . 4 1 . 3
Scorpion fish - 1 4 . 3 3 9 . 5 2 7 . 4 1 2 . 4 6 . 4
S e a b a s s * 3 4 . 8 2 . 1 3 6 . 0 1 3 . 9 8 . 6 4 . 6
Sea bream* 1 8 . 2 1 2 . 7 3 1 . 1 9 . 6 2 6 . 1 2 . 0
S m e l t 1 7 . 6 1 . 2 1 9 . 2 2 2 . 6 3 2 . 8 6 . 7
S o l e 1 2 . 4 5 . 3 3 5 . 8 1 4 . 5 2 8 . 2 3 . 9
S p r a t - 1 2 . 7 1 1 . 4 1 9 . 0 4 7 . 5 9 . 5
S w o r d f i s h * - 5 . 6 6 0 . 2 1 9 . 4 1 1 . 3 4 . 1
Tuna (excluding canned)* 3 . 9 3 . 5 3 3 . 8 2 1 . 2 3 4 . 8 2 . 8
Tu r b o t 2 . 2 8 . 7 1 9 . 8 8 . 8 3 5 . 4 2 5 . 0
W h i t i n g 4 . 2 9 . 2 2 7 . 6 1 8 . 8 3 5 . 3 5 . 0
O t h e r * * 2 7 . 5 5 . 2 3 7 . 2 9 . 2 1 7 . 3 3 . 6
* Predatory fish as described in the Commission Regulation (EC) No 78/2005 of 19 January 2005** Other: Perch, trout, scabbard-fish, sea wrasse, conger eel, croaker, shark, bassbu
POISSON 4.3 GB.qxd 17.9.2006 20:21 Page 145

Fish
To u l o n Fished or B o u g h t B o u g h t Bought Bought Consumed only c o l l e c t e d at the at the f rom a f rom a outside the
p o r t m a r k e t f i s h m o n g e r s u p e r m a r k e t h o m e
Anchovy (excluding canned) - 1 . 2 4 . 9 4 0 . 5 3 9 . 6 1 3 . 7
Angler fish* - 0 . 9 2 . 2 3 0 . 5 5 8 . 6 7 . 8
C a t s h a r k * - 2 . 2 - 3 8 . 7 5 5 . 0 3 . 7
C o d - 0 . 6 2 . 3 1 6 . 9 7 7 . 7 2 . 6
D a b 1 . 0 0 . 9 4 . 9 3 8 . 4 5 0 . 6 4 . 2
E e l * 6 . 3 8 . 1 0 . 6 1 7 . 5 6 1 . 3 6 . 3
Emperor* - 7 . 1 - 4 0 . 2 5 0 . 1 2 . 6
G o a t f i s h 1 . 2 6 . 7 1 . 3 3 6 . 6 4 7 . 1 7 . 1
Grenadier / Hoki* - 4 . 8 - 1 6 . 3 7 6 . 8 2 . 1
G r o u p e r - 3 . 2 4 . 3 3 1 . 1 2 9 . 1 3 2 . 3
G u r n a r d 2 . 7 8 . 9 3 . 7 1 3 . 2 5 8 . 2 1 3 . 3
H a d d o c k - 1 . 2 - 1 3 . 2 8 3 . 1 2 . 4
H a k e - - - 1 0 . 3 8 6 . 8 2 . 9
H a l i b u t * - 1 . 7 0 . 5 2 6 . 2 6 8 . 8 2 . 8
Herring (excluding smoked) - - - 3 1 . 4 6 8 . 6 -
John Dory - 7 . 2 3 . 1 2 6 . 0 2 9 . 9 3 3 . 7
L i n g - 1 . 3 6 . 6 2 3 . 0 6 7 . 0 2 . 1
M a c k e r e l 3 . 5 2 . 3 0 . 9 3 4 . 2 5 7 . 2 1 . 9
M u l l e t 2 1 . 2 3 4 . 6 1 . 3 1 0 . 9 2 8 . 3 3 . 8
P l a i c e 4 . 6 2 . 9 - 1 8 . 1 7 1 3 . 4
P o l l a c k - 0 . 8 1 . 6 3 5 . 0 6 2 . 5 -
P o u t - - - 3 4 . 1 6 5 . 9 -
R a y * - 0 . 3 0 . 2 2 1 . 5 6 8 . 7 9 . 4
R e d f i s h 1 4 . 8 3 . 4 - - 7 2 . 1 9 . 7
Saithe / Coalfish - 0 . 8 1 . 9 1 3 . 4 8 3 . 9 -
Salmon (excluding smoked) - 0 . 2 0 . 4 1 5 . 5 8 0 . 6 3 . 2
Sardine (excluding canned) 0 . 2 6 . 3 5 . 2 3 4 . 1 5 1 . 9 2 . 2
Scorpion fish 4 . 4 3 . 4 8 . 9 3 0 . 3 3 6 . 2 1 6 . 7
S e a b a s s * 2 . 0 2 . 5 5 . 7 3 0 . 8 4 5 . 7 1 3 . 2
Sea bream* 6 . 9 6 . 3 5 . 6 3 2 . 2 4 0 . 6 8 . 4
S m e l t - - 0 . 5 2 2 . 2 6 0 . 9 1 6 . 4
S o l e - 2 . 9 3 . 4 3 4 . 3 5 4 . 7 4 . 7
S p r a t - - - 6 3 . 2 1 3 . 8 2 3 . 0
S w o r d f i s h * - 2 . 1 7 . 6 1 5 . 0 5 7 . 8 1 7 . 5
Tuna (excluding canned)* 0 . 4 3 . 6 5 . 0 3 0 . 7 5 7 . 4 2 . 9
Tu r b o t - 7 . 3 5 . 0 3 2 . 8 3 7 . 8 1 7 . 2
W h i t i n g - 3 . 8 4 . 5 2 7 . 5 6 3 . 2 1 . 0
O t h e r * * 2 2 . 0 8 . 6 - 2 7 . 6 4 1 . 8 -
* Predatory fish as described in the Commission Regulation (EC) No 78/2005 of 19 January 2005** Other : Bogue, roquier, trout, conger eel, sard, shark, coriphaire, rainbow wrasse, gobie
146 APPENDIX 4 : Toulon
POISSON 4.3 GB.qxd 17.9.2006 20:21 Page 146

APPENDIX 4 : Le Havre 147
Mollusc, crustacean
Le Havre Fished or B o u g h t B o u g h t Bought Bought Consumed only c o l l e c t e d at the at the f rom a f rom a outside the
p o r t m a r k e t f i s h m o n g e r s u p e r m a r k e t h o m e
A b a l o n e 2 7 . 3 - 1 0 . 9 - 2 5 . 5 3 6 . 4
Calico scallop 2 . 0 9 . 7 1 . 9 6 . 6 7 7 . 8 2 . 0
Carpet shell 1 9 . 9 3 . 3 - 3 7 . 7 3 6 . 4 2 . 6
C l a m 6 2 . 5 - - - 3 7 . 5 -
C o c k l e 1 6 . 5 1 . 4 1 4 . 7 2 2 . 0 4 3 . 2 2 . 1
C r a b 2 . 6 1 7 . 1 3 . 1 1 8 . 3 5 7 . 3 1 . 6
C r a y f i s h 1 2 . 6 - 0 . 5 2 6 . 0 5 9 . 3 1 . 6
Cuttle fish - 2 8 . 5 2 . 1 2 3 . 5 4 3 . 4 2 . 4
Donax clam 7 1 . 4 - - - 2 8 . 6 -
Great scallop 2 . 8 1 3 . 8 2 . 8 1 9 . 1 5 6 . 2 5 . 3
Grooved sea squirt - - - - - -
Hard clam 0 . 3 0 . 3 3 . 8 3 3 . 5 5 9 . 9 2 . 2
L i m p e t 1 0 0 . 0 - - - - -
L o b s t e r 3 . 6 3 . 1 1 . 0 1 0 . 2 6 9 . 8 1 2 . 3
M u s s e l 0 . 4 0 . 3 8 . 4 2 5 . 4 6 1 . 4 4 . 0
O c t o p u s - 2 . 2 1 0 . 7 1 7 . 7 6 5 . 1 4 . 4
O y s t e r 2 . 0 4 . 6 2 4 . 4 2 7 . 6 3 9 . 9 1 . 5
P e r i w i n k l e 4 . 8 1 . 8 6 . 7 2 3 . 8 6 1 . 4 1 . 4
Queen scallop - - - - - 1 0 0 . 0
Razor clam - - - - - -
S c a m p i 1 . 9 1 . 2 4 . 0 2 4 . 7 6 2 . 7 5 . 4
Sea urchin - - - - 1 0 0 . 0 -
S h r i m p 1 . 7 2 . 3 5 . 0 1 8 . 7 7 1 . 1 1 . 2
Slipper lobster - - - - - -
Spider crab 2 1 . 5 1 7 . 8 3 . 8 2 4 . 5 3 1 . 5 0 . 9
Spiny lobster - 5 . 2 0 . 4 1 1 . 2 7 6 . 1 7 . 1
S q u i d - 7 . 1 1 . 1 1 1 . 8 7 7 . 3 2 . 7
S w i m c r a b 1 2 . 2 2 5 . 9 5 . 6 2 2 . 0 3 4 . 0 0 . 3
W h e l k 0 . 2 3 . 5 9 . 4 2 2 . 3 6 4 . 2 0 . 4
POISSON 4.3 GB.qxd 17.9.2006 20:21 Page 147

Mollusc, crustacean
L o r i e n t Fished or B o u g h t B o u g h t Bought Bought Consumed only c o l l e c t e d at the at the f rom a f rom a outside the
p o r t m a r k e t f i s h m o n g e r s u p e r m a r k e t h o m e
A b a l o n e - 1 0 0 . 0 - - - -
Calico scallop 9 . 7 7 . 8 1 2 . 3 1 9 . 7 4 8 . 6 1 . 9
Carpet shell 4 9 . 1 1 1 . 4 1 2 . 2 2 1 . 9 3 . 3 2 . 0
C l a m 4 1 . 9 - 2 1 . 3 2 7 . 1 4 . 8 4 . 8
C o c k l e 6 5 . 0 0 . 9 1 2 . 1 1 2 . 8 9 . 2 -
C r a b 7 . 8 1 5 . 7 1 3 . 9 4 1 . 5 2 0 . 2 0 . 8
C r a y f i s h 6 . 1 - 1 3 . 3 1 3 . 9 4 8 . 6 1 8 . 1
Cuttle fish 7 . 3 4 . 9 1 . 2 2 9 . 5 5 7 . 2 -
Donax clam 6 8 . 8 - - 3 1 . 3 - -
Great scallop 0 . 5 4 . 2 6 . 8 2 3 . 1 6 2 . 3 2 . 8
Grooved sea squirt 1 0 0 . 0 - - - - -
Hard clam 3 3 . 6 1 3 . 6 1 1 . 7 2 3 . 1 1 5 . 5 2 . 6
L i m p e t 1 0 0 . 0 - - - - -
L o b s t e r 1 7 . 5 4 . 8 6 . 0 4 2 . 8 2 0 . 5 8 . 4
M u s s e l 5 . 0 2 . 2 1 7 . 1 3 6 . 9 3 3 . 9 4 . 9
O c t o p u s - - 1 4 . 7 4 9 . 2 3 6 . 1 -
O y s t e r 7 . 5 9 . 5 3 4 . 3 3 9 . 5 8 . 4 1 . 0
P e r i w i n k l e 2 4 . 6 2 . 9 2 2 . 6 3 5 . 3 1 4 . 3 0 . 4
Queen scallop - - - - - 1 0 0 . 0
Razor clam 8 8 . 2 - - 1 1 . 8 - -
S c a m p i 3 . 2 1 4 . 2 1 5 . 2 4 6 . 5 2 0 . 2 0 . 7
Sea urchin 2 3 . 6 2 1 . 8 5 . 5 2 1 . 8 - 2 7 . 3
S h r i m p 1 2 . 3 2 . 4 1 0 . 6 3 4 . 9 3 8 . 9 1 . 5
Slipper lobster - - - - - -
Spider crab 1 4 . 3 1 5 . 3 1 3 . 1 3 7 . 5 1 8 . 3 1 . 5
Spiny lobster 7 . 4 3 . 7 7 . 4 5 6 . 3 1 7 . 8 7 . 4
S q u i d 1 0 . 2 7 . 6 5 . 7 3 0 . 4 4 3 . 4 2 . 8
S w i m c r a b 4 6 . 9 6 . 6 1 3 . 7 2 1 . 0 1 1 . 8 -
W h e l k 1 . 7 3 . 6 9 . 6 4 8 . 9 3 2 . 7 3 . 4
148 APPENDIX 4 : Lorient
POISSON 4.3 GB.qxd 17.9.2006 20:21 Page 148

APPENDIX 4 : La Rochelle 149
Mollusc, crustacean
La Rochelle Fished or B o u g h t B o u g h t Bought Bought Consumed only c o l l e c t e d at the at the f rom a f rom a outside the
p o r t m a r k e t f i s h m o n g e r s u p e r m a r k e t h o m e
A b a l o n e - - 7 . 7 - 8 4 . 6 7 . 7
Calico scallop 2 1 . 9 8 . 8 2 0 . 2 1 9 . 9 2 7 . 9 1 . 3
Carpet shell 3 2 . 3 2 0 . 8 2 1 . 1 9 . 7 1 1 . 8 4 . 2
C l a m - 3 3 . 8 1 2 . 8 1 5 . 5 3 0 . 4 7 . 4
C o c k l e 1 8 . 3 1 7 . 2 2 8 . 9 2 1 . 2 1 2 . 2 2 . 2
C r a b 4 . 3 9 . 7 2 2 . 1 2 5 . 8 3 3 . 7 4 . 5
C r a y f i s h 3 3 . 2 7 . 5 2 5 . 8 1 5 . 4 5 . 5 1 2 . 6
Cuttle fish 7 . 2 1 1 . 3 2 0 . 5 2 8 . 1 3 2 . 3 0 . 6
Donax clam - - - - - -
Great scallop 3 . 0 1 3 . 7 2 1 . 2 2 2 . 7 3 5 . 9 3 . 6
Grooved sea squirt - - - - - -
Hard clam 6 . 5 2 6 . 0 2 8 . 8 1 7 . 7 1 9 . 9 1 . 1
L i m p e t 1 0 . 2 1 5 . 5 3 7 . 2 - 3 7 . 2 -
L o b s t e r 3 . 0 1 0 . 0 2 1 . 4 2 9 . 4 2 1 . 2 1 5 . 0
M u s s e l 3 . 6 7 . 0 3 3 . 9 2 8 . 2 2 2 . 8 4 . 6
O c t o p u s 6 . 4 - 5 3 . 6 1 5 . 5 2 0 . 6 3 . 9
O y s t e r 1 0 . 2 1 3 . 2 3 9 . 5 1 7 . 8 1 8 . 3 1 . 0
P e r i w i n k l e 2 4 . 0 0 . 8 3 6 . 0 1 5 . 3 1 9 . 1 4 . 8
Queen scallop - 4 2 . 4 2 4 . 6 1 0 . 6 2 2 . 5 -
Razor clam 7 2 . 6 4 . 3 - 5 . 1 5 . 1 1 2 . 8
S c a m p i 1 . 7 4 . 5 2 8 . 6 3 6 . 8 2 3 . 5 4 . 9
Sea urchin 3 9 . 1 - 2 6 . 1 6 . 5 2 1 . 7 6 . 5
S h r i m p 5 . 8 3 . 7 2 7 . 4 2 8 . 1 3 3 . 6 1 . 3
Slipper lobster - - 1 0 0 . 0 - - -
Spider crab 1 7 . 0 1 6 . 4 2 9 . 3 1 3 . 5 2 3 . 8 -
Spiny lobster 2 . 4 2 7 . 4 1 4 . 3 1 1 . 9 2 8 . 6 1 5 . 5
S q u i d 3 . 4 1 1 . 9 2 4 . 8 1 8 . 5 3 7 . 7 4 . 1
S w i m c r a b 2 6 . 3 0 . 3 2 8 . 2 3 5 . 8 8 . 5 0 . 9
W h e l k 1 . 6 1 1 . 1 3 4 . 6 1 5 . 6 2 5 . 9 1 1 . 1
POISSON 4.3 GB.qxd 17.9.2006 20:21 Page 149

150 APPENDIX 4 : Toulon
Mollusc, crustacean
To u l o n Fished or B o u g h t B o u g h t Bought Bought Consumed only c o l l e c t e d at the at the f rom a f rom a outside the
p o r t m a r k e t f i s h m o n g e r s u p e r m a r k e t h o m e
A b a l o n e 2 5 . 0 - - 4 . 2 1 2 . 5 5 8 . 3
Calico scallop - 2 . 0 0 . 7 2 4 . 3 5 9 . 6 1 3 . 5
Carpet shell 4 . 2 3 . 3 2 . 8 2 6 . 5 3 5 . 4 2 7 . 8
C l a m 1 . 3 5 . 0 2 . 5 3 1 . 7 1 9 . 6 4 0 . 0
C o c k l e 7 . 5 - - 3 5 . 2 4 5 . 2 1 2 . 1
C r a b 6 . 2 0 . 9 0 . 9 3 5 . 9 3 7 . 1 1 8 . 9
C r a y f i s h 5 . 3 - 0 . 8 1 2 . 0 4 8 . 1 3 3 . 8
Cuttle fish 5 . 5 2 . 5 1 . 3 1 8 . 3 6 7 . 7 4 . 7
Donax clam 1 0 . 0 - - 3 7 . 6 3 6 . 4 1 6 . 0
Great scallop 0 . 3 0 . 8 - 1 2 . 5 7 9 . 2 7 . 2
Grooved sea squirt 3 . 6 1 4 . 9 9 . 2 3 4 . 4 1 9 . 0 1 9 . 0
Hard clam 2 . 1 5 . 1 1 . 7 3 3 . 9 2 1 . 4 3 5 . 8
L i m p e t - - - 3 3 . 3 - 6 6 . 7
L o b s t e r 1 . 9 2 . 1 2 . 7 1 7 . 8 4 8 . 8 2 6 . 7
M u s s e l 0 . 2 1 . 3 3 . 3 2 6 . 5 5 1 . 4 1 7 . 2
O c t o p u s 1 6 . 0 3 . 2 1 . 8 1 7 . 1 5 2 . 0 9 . 9
O y s t e r 1 . 1 2 . 1 7 . 1 2 9 . 8 4 3 . 2 1 6 . 7
P e r i w i n k l e 9 . 0 1 . 0 - 2 6 . 9 3 9 . 4 2 4 . 2
Queen scallop - - - - - 1 0 0 . 0
Razor clam - - - - 5 4 . 5 4 5 . 5
Sea urchin 5 9 . 6 1 6 . 9 1 . 5 9 . 8 9 . 2 3 . 0
S c a m p i - 1 . 0 0 . 7 2 5 . 6 5 9 . 3 1 3 . 4
S h r i m p 0 . 2 1 . 0 1 . 4 1 7 . 7 7 5 . 5 4 . 2
Slipper lobster 7 . 9 1 5 . 8 - 3 1 . 6 2 8 . 9 1 5 . 8
Spider crab 1 7 . 6 5 . 9 1 . 5 3 6 . 8 3 5 . 3 2 . 9
Spiny lobster - 2 . 6 0 . 9 1 6 . 1 5 7 . 4 2 3 . 9
S q u i d 4 . 8 2 . 7 0 . 9 1 2 . 9 7 4 . 4 4 . 4
S w i m c r a b 0 . 3 1 . 0 1 . 0 1 4 . 8 5 5 . 2 2 7 . 6
W h e l k - 2 5 . 4 3 . 4 2 4 . 2 3 3 . 6 1 3 . 5
POISSON 4.3 GB.qxd 17.9.2006 20:21 Page 150

APPENDIX 5 : All subjects, all areas 151
Appendix 5:Contributors to the total exposure to omega 3 and contaminants (%) - All subjects, all areas
OMEGA 3 TRACE ELEMENTS PERSISTENT ORGANIC POLLUTA N T SS p e c i e s n - 3 * * M e H g C d P b O T C A sT A s i n o r g P B D E P C D D / F P C B - D L Tot diox i P C BA n c h o v y 4 . 8 5 0 . 5 9 9 . 9 3 5 . 2 0 3 . 6 6 0 . 5 7 1 . 7 4 3 . 5 9 0 . 6 2 0 . 9 7 0 . 8 8 0 . 8 1Angler fish* 0 . 1 1 2 . 2 3 0 . 0 1 0 . 2 6 0 . 9 6 1 . 9 6 0 . 6 7 0 . 8 5 0 . 2 7 0 . 2 2 0 . 2 3 0 . 4 0Calico scallop 0 . 4 3 0 . 0 7 4 . 7 6 1 . 6 1 0 . 5 3 0 . 4 1 0 . 2 3 0 . 1 9 0 . 5 4 0 . 1 8 0 . 2 8 0 . 2 9C a t s h a r k * 0 . 2 7 1 . 7 0 2 . 6 8 1 . 0 0 1 . 1 3 4 . 5 5 1 . 4 0 0 . 3 3 0 . 1 8 0 . 1 8 0 . 1 8 0 . 3 8C o c k l e 0 . 0 4 0 . 0 6 0 . 1 2 0 . 2 5 0 . 4 7 0 . 0 8 0 . 6 5 0 . 0 7 0 . 0 7 0 . 0 5 0 . 0 5 0 . 0 3C o d 1 . 3 8 6 . 8 9 0 . 1 0 1 . 5 9 5 . 8 9 1 0 . 9 3 6 . 0 4 6 . 2 6 1 . 7 9 2 . 1 7 2 . 0 2 1 . 7 8C r a b 1 . 9 0 2 . 4 7 1 4 . 6 1 0 . 9 1 1 . 1 7 2 . 4 9 4 . 8 9 1 . 0 5 5 . 7 8 2 . 8 8 3 . 6 0 2 . 8 1Cuttle fish 0 . 2 4 0 . 3 8 0 . 4 6 1 . 2 0 0 . 4 1 0 . 8 9 0 . 5 7 0 . 1 5 0 . 1 7 0 . 0 7 0 . 0 9 0 . 1 5D a b 0 . 3 8 1 . 2 9 0 . 0 1 0 . 1 3 0 . 4 0 3 . 7 5 1 . 1 9 0 . 8 2 1 . 1 3 0 . 6 4 0 . 7 5 0 . 4 0E e l * 0 . 6 6 1 . 0 1 0 . 1 2 0 . 4 2 0 . 3 3 0 . 0 6 0 . 1 0 4 . 3 9 1 . 5 6 7 . 0 0 6 . 4 4 8 . 2 8E m p e r o r * 0 . 6 9 1 . 2 4 0 . 0 2 0 . 1 8 0 . 2 7 0 . 0 6 0 . 0 9 0 . 3 7 1 . 3 6 1 . 5 0 1 . 4 4 1 . 2 9Fish soup 1 . 9 0 0 . 5 7 2 . 0 5 2 . 1 2 1 . 3 9 0 . 9 9 4 . 1 3 1 . 7 9 1 . 1 9 1 . 0 5 1 . 0 7 0 . 8 2G o a t f i s h 1 . 0 8 1 . 0 7 0 . 0 1 0 . 1 2 0 . 2 1 2 . 4 8 1 . 4 1 0 . 7 0 2 . 1 3 2 . 2 3 2 . 1 8 1 . 6 9Great scallop 1 . 1 0 1 . 4 1 9 . 0 4 1 0 . 6 7 6 . 1 0 2 . 4 0 8 . 5 5 1 . 3 1 3 . 2 5 1 . 2 9 1 . 8 0 2 . 3 6G r e n a d i e r / H o k i * 0 . 2 3 1 . 5 7 0 . 0 7 0 . 2 5 0 . 9 6 1 . 0 8 0 . 5 1 0 . 7 4 0 . 4 3 0 . 2 0 0 . 2 6 0 . 4 9G u r n a r d 0 . 0 2 0 . 1 8 0 . 0 0 0 4 0 . 0 0 1 0 . 0 4 0 . 1 1 0 . 0 5 0 . 0 8 0 . 1 9 0 . 1 5 0 . 1 6 0 . 1 5H a d d o c k 0 . 0 7 0 . 3 9 0 . 0 6 0 . 1 1 0 . 2 8 0 . 4 7 0 . 2 8 0 . 2 8 0 . 1 2 0 . 1 0 0 . 1 0 0 . 1 1H a k e 0 . 3 8 4 . 5 6 0 . 0 1 1 . 1 9 2 . 3 1 2 . 5 7 1 . 6 0 1 . 4 7 0 . 5 3 1 . 2 3 1 . 0 3 1 . 3 3H a l i b u t * 3 . 3 7 0 . 9 6 0 . 9 5 2 . 8 1 2 . 8 9 1 . 3 1 0 . 6 1 1 . 7 7 3 . 3 5 2 . 0 0 2 . 3 3 1 . 7 6H e r r i n g 4 . 6 6 0 . 2 5 0 . 0 0 2 0 . 1 3 0 . 3 2 0 . 1 4 0 . 1 8 0 . 5 8 0 . 8 2 0 . 3 5 0 . 4 6 0 . 3 2John dory 0 . 0 9 0 . 2 7 0 . 1 0 0 . 1 3 0 . 4 4 0 . 0 6 0 . 1 5 0 . 1 6 0 . 0 9 0 . 1 6 0 . 1 5 0 . 1 9L i n g 0 . 2 4 5 . 7 3 0 . 1 7 0 . 0 3 1 . 1 9 1 . 8 9 0 . 7 3 1 . 1 4 0 . 3 9 0 . 3 8 0 . 3 7 0 . 4 8L o b s t e r 0 . 1 6 0 . 1 5 1 . 1 3 0 . 0 3 0 . 0 3 0 . 2 3 0 . 1 8 0 . 0 8 0 . 6 5 0 . 2 5 0 . 3 4 0 . 1 1M a c k e r e l 1 1 . 5 2 2 . 2 9 1 . 1 7 0 . 5 9 6 . 2 2 1 . 4 2 2 . 8 0 8 . 5 5 6 . 2 7 6 . 8 4 6 . 6 2 6 . 8 4M u s s e l 0 . 9 8 1 . 1 5 1 . 8 6 1 0 . 4 7 1 . 3 4 2 . 8 9 4 . 6 1 1 . 3 4 2 . 3 2 1 . 1 7 1 . 4 5 1 . 0 8O c t o p u s 0 . 0 5 0 . 7 4 0 . 2 6 0 . 8 7 0 . 2 8 2 . 7 1 1 . 6 9 0 . 0 9 0 . 1 5 0 . 1 5 0 . 1 5 0 . 1 2O y s t e r 0 . 6 8 0 . 3 3 3 . 2 2 5 . 0 8 2 . 5 4 1 . 2 8 7 . 0 4 0 . 9 1 3 . 2 9 1 . 5 1 1 . 9 1 1 . 0 6P a e l l a 2 . 5 5 0 . 0 4 1 . 7 2 3 . 8 5 1 . 3 8 0 . 1 7 1 . 0 9 1 . 4 8 0 . 9 6 0 . 2 3 0 . 4 2 0 . 1 7P e r i w i n k l e 0 . 2 3 0 . 0 4 0 . 7 3 1 . 3 1 0 . 2 6 0 . 5 0 1 . 5 6 0 . 2 8 0 . 0 9 0 . 0 5 0 . 0 6 0 . 0 5P i l c h a r d 0 . 4 4 0 . 0 4 0 . 0 3 0 . 0 3 0 . 1 0 0 . 0 6 0 . 2 9 0 . 5 1 0 . 5 2 0 . 2 0 0 . 2 8 0 . 1 6P l a i c e 0 . 1 1 0 . 7 9 0 . 0 0 0 . 1 7 0 . 5 8 1 . 6 3 0 . 1 8 0 . 6 1 0 . 7 0 0 . 5 5 0 . 5 8 0 . 5 0P o l l a c k 0 . 1 5 0 . 9 8 0 . 0 2 0 . 0 2 0 . 7 1 0 . 7 9 1 . 5 5 0 . 5 9 0 . 0 9 0 . 5 1 0 . 4 0 0 . 6 0P o u t 0 . 0 2 0 . 2 1 0 . 0 0 1 0 . 0 2 0 . 1 0 0 . 2 8 0 . 2 0 0 . 0 6 0 . 0 2 0 . 0 3 0 . 0 3 0 . 0 3R a y * 0 . 5 2 2 . 8 9 2 . 3 6 2 . 9 5 1 . 0 8 9 . 9 4 5 . 1 5 1 . 2 7 1 . 0 4 0 . 4 9 0 . 6 2 0 . 4 4Sea bream* 3 . 4 5 2 . 2 3 0 . 0 2 0 . 0 7 1 . 8 2 1 . 7 7 2 . 5 5 2 . 8 8 4 . 1 0 5 . 4 0 5 . 0 4 4 . 8 8Saithe / Coalfish 1 . 7 6 3 . 0 3 4 . 0 4 7 . 1 7 6 . 1 2 1 . 9 5 3 . 4 8 4 . 7 3 0 . 7 7 1 . 1 8 1 . 0 6 1 . 0 2S a l m o n 2 6 . 5 9 3 . 7 2 0 . 0 4 0 . 8 2 6 . 4 5 3 . 1 0 4 . 7 8 1 8 . 7 6 1 4 . 3 3 1 4 . 1 8 1 3 . 9 9 1 2 . 8 6S a r d i n e 9 . 5 3 2 . 7 5 5 . 2 4 1 7 . 2 3 4 . 2 4 3 . 8 6 4 . 1 7 6 . 5 2 1 5 . 8 4 2 0 . 1 0 1 8 . 9 1 2 0 . 3 9Scorpion fish 0 . 3 0 0 . 4 8 0 . 0 0 1 0 . 0 0 2 0 . 0 6 0 . 1 0 0 . 1 0 0 . 1 8 0 . 6 0 0 . 6 3 0 . 6 2 0 . 4 7S e a b a s s * 2 . 7 2 3 . 2 6 0 . 0 2 1 . 3 7 4 . 3 9 0 . 9 6 1 . 5 7 4 . 8 2 5 . 2 5 8 . 0 9 7 . 3 5 8 . 0 1Sea urchin 0 . 1 5 0 . 0 3 1 . 2 4 3 . 4 2 0 . 6 8 0 . 6 1 3 . 0 1 0 . 2 9 0 . 2 5 0 . 4 3 0 . 3 9 0 . 2 1S c a m p i 0 . 3 3 1 . 9 3 1 . 2 3 2 . 1 9 1 . 0 4 2 . 5 5 4 . 4 0 0 . 6 0 1 . 4 6 0 . 4 9 0 . 7 4 0 . 3 9S h r i m p 0 . 6 9 1 . 5 1 1 5 . 5 3 1 . 8 3 1 . 6 7 1 . 2 2 1 . 5 6 1 . 5 7 0 . 9 3 0 . 3 9 0 . 5 2 0 . 2 5S o l e 0 . 5 9 5 . 7 1 0 . 1 8 1 . 1 0 1 . 8 5 9 . 6 9 1 . 7 1 1 . 9 2 1 . 1 1 1 . 0 5 1 . 0 4 2 . 4 6Spider crab 0 . 5 9 0 . 1 0 1 . 0 3 0 . 6 5 0 . 1 0 1 . 4 9 0 . 9 7 0 . 9 5 2 . 0 8 1 . 1 1 1 . 3 6 0 . 6 4S q u i d 0 . 5 0 1 . 1 6 1 . 4 7 0 . 6 2 2 . 5 7 1 . 8 4 0 . 4 8 1 . 1 9 1 . 7 9 1 . 1 8 1 . 3 2 1 . 0 3S u r i m i 2 . 2 9 0 . 8 8 0 . 7 4 0 . 7 7 4 . 3 9 0 . 3 9 1 . 2 2 2 . 5 7 0 . 3 1 0 . 1 9 0 . 2 2 0 . 7 6S w i m c r a b 0 . 7 8 0 . 5 3 0 . 3 8 2 . 6 1 1 . 0 1 0 . 8 9 0 . 7 9 0 . 5 4 4 . 8 4 4 . 6 1 4 . 6 5 4 . 4 7S w o r d f i s h * 1 . 8 3 3 . 7 8 0 . 8 0 0 . 0 1 1 . 4 3 0 . 1 1 0 . 4 2 0 . 5 3 0 . 2 1 0 . 3 6 0 . 3 2 0 . 3 0Ta r a m a 1 . 4 0 0 . 0 1 0 . 0 0 4 0 . 0 1 0 . 0 9 0 . 0 3 0 . 1 2 0 . 7 7 0 . 1 0 0 . 0 8 0 . 0 9 0 . 1 2Tu n a * 4 . 3 5 1 9 . 2 1 3 . 2 6 0 . 8 5 1 3 . 3 4 2 . 3 8 2 . 1 0 5 . 0 7 1 . 0 1 1 . 8 7 1 . 6 2 2 . 2 0W h e l k 0 . 3 7 0 . 6 4 6 . 9 5 3 . 3 5 1 . 2 4 3 . 8 1 2 . 2 4 0 . 5 7 2 . 1 5 0 . 3 9 0 . 9 1 0 . 2 8W h i t i n g 0 . 2 8 4 . 5 0 0 . 0 5 0 . 2 2 1 . 5 3 2 . 0 9 2 . 2 1 1 . 6 6 0 . 7 9 1 . 2 7 1 . 1 5 1 . 7 7
* Predatory fish as described in the Commission Regulation (EC) No 78/2005 of 19 January 2005For certain species the different packaging are taken into account: Herring: fresh and canned, Mackerel: fresh, canned and smoked,Sardine: fresh and canned, Salmon: fresh and smoked, Tuna :fresh and canned, Anchovy: fresh and canned, Crab: fresh and canned,Haddock: fresh and smoked** omega 3 (ALA, C18:4 n-3, EPA, DPA and DHA)
POISSON 4.3 GB.qxd 17.9.2006 20:21 Page 151

152 APPENDIX 5 : Le Havre
* Predatory fish as described in the Commission Regulation (EC) No 78/2005 of 19 January 2005For certain species the different packaging are taken into account: Herring: fresh and canned, Mackerel: fresh, canned and smoked,Sardine: fresh and canned, Salmon: fresh and smoked, Tuna :fresh and canned, Anchovy: fresh and canned, Crab: fresh and canned,Haddock: fresh and smoked** omega 3 (ALA, C18:4 n-3, EPA, DPA and DHA)
Contributors to the total exposure to omega 3 and contaminants (%) – All subjects – Le Havre
OMEGA 3 TRACE ELEMENTS PERSISTENT ORGANIC POLLUTA N T S
S p e c i e s n - 3 * * M e H g C d P b O T C A sT A s i n o r g P B D E P C D D / F P C B - D L Tot diox i P C B
A n c h o v y 1 . 9 4 0 . 2 9 1 . 6 8 2 . 4 3 1 . 1 0 0 . 2 1 0 . 6 4 1 . 4 1 0 . 2 1 0 . 3 7 0 . 3 3 0 . 3 1
Angler fish* 0 . 1 2 1 . 6 6 0 . 0 0 0 . 2 5 0 . 3 2 1 . 0 5 0 . 9 1 0 . 6 2 0 . 1 5 0 . 1 1 0 . 1 2 0 . 0 8
C a t s h a r k * 0 . 8 3 1 . 3 8 1 0 . 2 8 3 . 7 1 2 . 9 8 6 . 7 6 2 . 7 0 0 . 8 0 0 . 5 8 0 . 5 1 0 . 5 2 0 . 8 6
C o d 1 . 7 2 8 . 0 4 0 . 0 3 1 . 7 0 4 . 9 0 2 0 . 4 5 1 3 . 2 6 9 . 3 6 1 . 0 8 2 . 1 3 1 . 8 3 1 . 7 0
C r a b 2 . 1 5 6 . 9 8 0 . 4 7 1 . 3 5 2 . 7 4 2 . 6 9 5 . 9 6 1 . 5 6 9 . 9 2 7 . 4 5 8 . 0 1 9 . 0 0
D a b 0 . 4 1 1 . 1 3 0 . 0 0 0 . 1 3 0 . 4 0 3 . 7 9 0 . 9 9 0 . 9 3 1 . 5 9 1 . 1 0 1 . 2 3 0 . 5 9
E e l * 0 . 3 8 0 . 7 8 0 . 3 4 0 . 4 6 0 . 1 7 0 . 0 4 0 . 0 6 2 . 0 9 0 . 8 5 2 . 9 7 2 . 7 6 3 . 4 4
Fish soup 0 . 7 1 0 . 3 4 0 . 2 1 0 . 8 6 0 . 4 1 0 . 4 2 1 . 5 0 0 . 7 1 0 . 3 4 0 . 3 1 0 . 3 2 0 . 2 2
Great scallop 2 . 1 2 0 . 5 9 1 3 . 8 4 2 2 . 2 1 1 3 . 3 0 2 . 5 3 1 5 . 3 3 1 . 1 8 5 . 6 5 2 . 7 1 3 . 5 2 4 . 7 1
G r e n a d i e r / H o k i * 0 . 1 3 1 . 2 2 0 . 0 0 0 . 8 9 0 . 3 0 0 . 6 3 0 . 2 7 0 . 9 3 0 . 3 6 0 . 1 5 0 . 2 1 0 . 2 9
H a k e 0 . 2 4 0 . 9 3 0 . 0 0 0 . 0 2 0 . 3 9 0 . 2 2 0 . 4 9 0 . 4 1 0 . 1 0 0 . 2 4 0 . 2 0 0 . 2 6
H a l i b u t * 3 . 7 1 1 . 9 9 0 . 0 0 0 . 0 2 3 . 6 4 1 . 8 2 0 . 4 6 2 . 7 3 3 . 2 7 3 . 0 9 3 . 1 2 2 . 5 8
H e r r i n g 7 . 2 3 0 . 2 8 0 . 0 0 0 . 1 4 0 . 1 9 0 . 1 3 0 . 1 5 0 . 4 1 0 . 5 7 0 . 2 5 0 . 3 3 0 . 2 1
L i n g 0 . 3 5 7 . 6 2 0 . 0 0 0 . 0 2 0 . 4 6 1 . 6 6 0 . 5 5 1 . 0 9 0 . 2 0 0 . 2 1 0 . 2 0 0 . 2 3
M a c k e r e l 1 6 . 1 0 3 . 5 8 0 . 5 4 0 . 6 0 8 . 0 0 1 . 4 4 2 . 1 6 1 6 . 3 5 1 3 . 3 8 1 3 . 4 2 1 3 . 3 2 1 3 . 3 1
M u s s e l 0 . 9 7 0 . 3 1 0 . 0 2 1 4 . 2 9 1 . 2 9 0 . 6 9 1 0 . 1 8 0 . 8 0 2 . 6 2 1 . 5 2 1 . 8 0 1 . 4 1
O y s t e r 0 . 4 5 0 . 3 7 0 . 0 1 0 . 0 2 3 . 3 1 0 . 9 8 9 . 1 3 0 . 3 2 2 . 6 4 1 . 1 8 1 . 5 5 0 . 5 8
P a e l l a 2 . 4 3 0 . 0 5 0 . 4 9 4 . 0 4 1 . 0 1 0 . 1 6 0 . 9 9 1 . 3 8 0 . 8 6 0 . 2 2 0 . 3 9 0 . 1 4
P e r i w i n k l e 0 . 3 0 0 . 0 6 0 . 3 7 1 . 6 5 0 . 0 4 0 . 3 0 1 . 1 8 0 . 3 5 0 . 0 7 0 . 0 4 0 . 0 5 0 . 0 4
P i l c h a r d 0 . 5 3 0 . 0 7 0 . 0 1 0 . 0 5 0 . 0 9 0 . 0 7 0 . 3 1 0 . 6 9 0 . 5 1 0 . 2 1 0 . 2 9 0 . 1 6
P l a i c e 0 . 3 0 2 . 9 7 0 . 0 0 0 . 6 2 1 . 9 3 5 . 8 6 0 . 4 3 2 . 2 0 2 . 6 1 2 . 0 5 2 . 1 8 1 . 8 3
P o l l a c k 0 . 2 0 1 . 9 1 0 . 0 0 0 . 0 1 0 . 5 8 0 . 9 4 0 . 6 7 0 . 7 3 0 . 1 1 0 . 4 9 0 . 4 0 0 . 5 8
R a y * 0 . 5 1 2 . 9 1 0 . 0 3 0 . 3 1 1 . 2 0 9 . 6 9 5 . 2 4 1 . 3 0 0 . 8 0 0 . 4 7 0 . 5 5 0 . 4 4
Saithe / Coalfish 1 . 1 0 3 . 9 5 0 . 0 1 0 . 7 2 4 . 0 7 1 . 6 5 4 . 4 2 4 . 0 7 0 . 5 9 0 . 9 5 0 . 8 4 0 . 8 6
S a l m o n 3 1 . 4 6 5 . 5 7 0 . 0 2 0 . 4 8 7 . 3 3 3 . 2 1 3 . 0 3 1 8 . 2 9 9 . 6 0 1 2 . 1 3 1 1 . 3 6 1 1 . 0 1
S a r d i n e 6 . 2 2 1 . 2 5 1 . 9 2 1 6 . 9 3 3 . 1 9 2 . 3 0 2 . 1 2 4 . 3 0 9 . 2 5 1 4 . 0 2 1 2 . 8 9 1 3 . 2 8
S c a m p i 0 . 1 5 0 . 5 0 0 . 6 7 1 . 1 0 1 . 0 7 1 . 4 9 0 . 9 0 0 . 1 8 1 . 0 3 0 . 2 2 0 . 4 5 0 . 1 4
S e a b a s s * 1 . 6 0 4 . 9 7 0 . 0 0 1 . 8 1 2 . 0 3 0 . 6 4 0 . 4 7 5 . 3 1 4 . 9 0 6 . 5 7 6 . 1 4 5 . 3 7
Sea bream* 1 . 7 6 0 . 9 5 0 . 0 0 0 . 0 6 0 . 8 1 0 . 4 9 0 . 2 6 1 . 2 4 0 . 7 2 1 . 1 2 1 . 0 1 0 . 9 2
S h r i m p 0 . 9 1 1 . 2 6 5 9 . 8 9 4 . 9 1 0 . 7 3 1 . 4 7 1 . 9 7 2 . 1 1 0 . 5 1 0 . 3 0 0 . 3 5 0 . 3 1
S o l e 0 . 4 8 3 . 9 0 0 . 0 0 0 . 0 4 0 . 3 5 8 . 6 9 2 . 3 7 1 . 5 5 0 . 7 6 1 . 3 0 1 . 1 4 2 . 6 4
S q u i d 0 . 6 9 2 . 5 9 0 . 0 7 0 . 4 2 6 . 5 6 2 . 9 2 0 . 6 6 2 . 8 0 4 . 9 9 3 . 0 7 3 . 5 5 2 . 4 4
S u r i m i 3 . 4 4 1 . 5 1 0 . 4 1 1 . 2 3 5 . 0 4 0 . 5 8 1 . 7 0 3 . 7 3 0 . 4 7 0 . 3 1 0 . 3 5 1 . 0 7
S w i m c r a b 1 . 5 4 1 . 5 9 0 . 8 8 8 . 3 6 3 . 8 4 2 . 4 1 2 . 8 8 1 . 0 4 1 5 . 4 8 1 6 . 2 6 1 5 . 9 7 1 6 . 3 9
S w o r d f i s h * 0 . 7 2 1 . 7 2 0 . 0 7 0 . 0 0 0 . 5 2 0 . 0 4 0 . 0 7 0 . 2 3 0 . 0 9 0 . 0 9 0 . 0 9 0 . 1 0
Ta r a m a 0 . 7 6 0 . 0 1 0 . 0 0 0 . 0 0 0 . 0 3 0 . 0 1 0 . 0 5 0 . 3 7 0 . 0 3 0 . 0 3 0 . 0 3 0 . 0 4
Tu n a * 4 . 4 7 1 9 . 8 2 1 . 2 9 1 . 1 2 1 0 . 2 9 2 . 1 4 2 . 0 1 4 . 2 4 0 . 9 4 1 . 3 5 1 . 2 4 1 . 6 3
W h e l k 0 . 7 6 1 . 6 9 6 . 4 1 6 . 9 3 3 . 8 7 7 . 5 0 1 . 6 1 1 . 3 5 1 . 9 5 0 . 8 6 1 . 1 6 0 . 6 4
W h i t i n g 0 . 1 0 3 . 2 4 0 . 0 1 0 . 0 3 1 . 5 1 1 . 8 9 1 . 8 1 0 . 8 0 0 . 2 2 0 . 2 2 0 . 2 1 0 . 1 9
POISSON 4.3 GB.qxd 17.9.2006 20:21 Page 152

APPENDIX 5 : Lorient 153
* Predatory fish as described in the Commission Regulation (EC) No 78/2005 of 19 January 2005For certain species the different packaging are taken into account: Herring: fresh and canned, Mackerel: fresh, canned and smoked,Sardine: fresh and canned, Salmon: fresh and smoked, Tuna :fresh and canned, Anchovy: fresh and canned, Crab: fresh and canned,Haddock: fresh and smoked** omega 3 (ALA, C18:4 n-3, EPA, DPA and DHA)
Contributors to the total exposure to omega 3 and contaminants (%) – All subjects – Lorient
OMEGA 3 TRACE ELEMENTS PERSISTENT ORGANIC POLLUTA N T S
S p e c i e s n - 3 * * M e H g C d P b O T C A sT A s i n o r g P B D E P C D D / F P C B - D L Tot diox i P C B
A n c h o v y 5 . 4 3 0 . 5 8 7 . 3 0 4 . 7 6 4 . 8 0 0 . 4 7 1 . 5 0 3 . 8 3 0 . 5 8 1 . 0 7 0 . 9 3 1 . 0 6
Angler fish* 0 . 1 1 2 . 9 7 0 . 0 1 0 . 2 5 1 . 7 2 2 . 4 3 0 . 6 4 1 . 1 3 0 . 1 7 0 . 1 5 0 . 1 5 0 . 1 5
C a t s h a r k * 0 . 0 3 0 . 3 7 0 . 0 0 0 . 0 5 0 . 2 0 0 . 9 3 0 . 1 0 0 . 0 8 0 . 0 1 0 . 0 1 0 . 0 1 0 . 0 3
C o c k l e 0 . 1 0 0 . 2 1 0 . 3 6 0 . 2 9 1 . 6 1 0 . 2 2 2 . 0 7 0 . 2 2 0 . 2 5 0 . 1 7 0 . 1 9 0 . 0 9
C o d 0 . 8 7 6 . 9 4 0 . 1 5 0 . 3 7 4 . 4 3 6 . 3 5 1 . 9 9 4 . 5 2 0 . 9 1 1 . 5 8 1 . 3 9 1 . 4 8
C r a b 2 . 2 4 1 . 0 2 5 3 . 1 1 1 . 3 2 0 . 7 9 3 . 5 0 9 . 3 0 0 . 9 7 8 . 6 4 3 . 0 5 4 . 5 5 1 . 6 7
D a b 0 . 1 2 2 . 8 8 0 . 0 0 0 . 0 1 0 . 7 0 3 . 8 9 1 . 2 3 0 . 5 4 0 . 1 7 0 . 1 3 0 . 1 4 0 . 1 8
E e l * 0 . 2 2 0 . 4 9 0 . 0 1 0 . 1 7 0 . 1 6 0 . 0 2 0 . 0 2 2 . 1 6 0 . 6 0 3 . 7 8 3 . 4 2 4 . 7 0
E m p e r o r * 0 . 7 4 2 . 4 8 0 . 0 4 0 . 0 0 0 . 4 4 0 . 0 9 0 . 1 2 0 . 6 6 2 . 2 5 3 . 1 5 2 . 9 0 2 . 6 3
Fish soup 2 . 0 0 0 . 5 2 1 . 0 4 1 . 9 1 1 . 8 0 0 . 8 1 3 . 1 2 1 . 8 1 1 . 0 1 0 . 9 4 0 . 9 5 0 . 8 0
G o a t f i s h 1 . 3 5 1 . 0 6 0 . 0 0 0 . 2 4 0 . 2 2 2 . 0 1 2 . 1 7 0 . 7 9 1 . 5 3 1 . 8 8 1 . 7 8 1 . 7 2
Great scallop 0 . 8 0 4 . 1 0 0 . 0 1 1 . 3 1 4 . 7 9 0 . 9 3 2 . 5 6 1 . 5 4 1 . 0 6 0 . 3 7 0 . 5 5 0 . 4 4
G r e n a d i e r / H o k i * 0 . 1 9 0 . 8 1 0 . 0 1 0 . 0 8 1 . 3 5 1 . 6 3 0 . 5 7 1 . 0 9 0 . 5 0 0 . 3 1 0 . 3 5 0 . 9 1
G u r n a r d 0 . 0 3 0 . 7 1 0 . 0 0 0 . 0 0 0 . 1 5 0 . 4 4 0 . 2 0 0 . 3 1 0 . 7 8 0 . 5 9 0 . 6 3 0 . 6 1
H a d d o c k 0 . 0 6 0 . 5 6 0 . 0 0 0 . 2 0 0 . 5 4 1 . 2 7 0 . 4 2 0 . 3 6 0 . 1 4 0 . 1 0 0 . 1 1 0 . 1 4
H a k e 0 . 4 2 1 1 . 2 6 0 . 0 1 0 . 9 7 6 . 1 0 6 . 7 1 3 . 9 5 2 . 8 7 0 . 6 7 1 . 5 9 1 . 3 5 2 . 0 1
H a l i b u t * 1 . 3 1 0 . 3 8 0 . 0 0 0 . 0 0 0 . 9 1 0 . 4 4 0 . 2 3 0 . 7 4 1 . 8 4 0 . 9 2 1 . 1 6 0 . 6 8
H e r r i n g 3 . 6 0 0 . 2 3 0 . 0 0 0 . 1 4 0 . 4 3 0 . 1 2 0 . 1 5 0 . 6 4 0 . 7 5 0 . 3 4 0 . 4 4 0 . 3 5
John dory 0 . 1 6 0 . 2 4 0 . 3 9 0 . 5 3 0 . 4 2 0 . 0 8 0 . 0 7 0 . 3 4 0 . 2 0 0 . 2 8 0 . 2 5 0 . 4 1
L i n g 0 . 2 1 9 . 1 7 0 . 6 7 0 . 0 3 2 . 3 3 2 . 0 1 0 . 9 6 1 . 3 3 0 . 2 1 0 . 3 4 0 . 3 0 0 . 5 3
M a c k e r e l 1 2 . 9 2 2 . 4 2 0 . 8 6 0 . 4 9 7 . 2 2 1 . 8 2 5 . 0 0 8 . 6 0 5 . 1 5 6 . 6 7 6 . 2 3 6 . 4 2
M u s s e l 0 . 9 8 1 . 2 7 2 . 0 2 1 1 . 3 1 1 . 1 0 7 . 3 0 4 . 4 6 0 . 8 2 2 . 6 4 1 . 3 3 1 . 6 6 0 . 7 9
O y s t e r 0 . 6 1 0 . 3 1 0 . 0 1 9 . 1 6 2 . 1 9 1 . 1 3 0 . 5 6 1 . 2 0 2 . 7 9 0 . 9 8 1 . 4 4 0 . 7 9
P a e l l a 2 . 9 9 0 . 0 4 1 . 3 6 3 . 6 5 2 . 0 0 0 . 1 4 0 . 9 0 1 . 6 4 0 . 8 6 0 . 2 2 0 . 3 8 0 . 1 8
P e r i w i n k l e 0 . 4 7 0 . 0 8 1 . 7 5 2 . 3 5 0 . 5 8 1 . 0 2 2 . 1 4 0 . 5 9 0 . 2 0 0 . 1 2 0 . 1 4 0 . 1 3
P i l c h a r d 0 . 4 5 0 . 0 3 0 . 0 2 0 . 0 3 0 . 1 3 0 . 0 6 0 . 2 6 0 . 5 2 0 . 5 7 0 . 2 1 0 . 3 0 0 . 1 8
P l a i c e 0 . 0 5 0 . 2 0 0 . 0 0 0 . 0 5 0 . 3 8 0 . 6 6 0 . 3 0 0 . 2 2 0 . 2 0 0 . 1 4 0 . 1 5 0 . 1 6
P o l l a c k 0 . 2 5 1 . 1 9 0 . 0 6 0 . 0 7 1 . 4 2 1 . 4 8 5 . 2 1 1 . 2 7 0 . 1 9 1 . 3 8 1 . 0 7 1 . 6 7
P o u t 0 . 0 5 0 . 8 3 0 . 0 0 0 . 0 7 0 . 4 0 1 . 1 5 0 . 8 0 0 . 2 6 0 . 0 9 0 . 1 1 0 . 1 0 0 . 1 0
R a y * 0 . 5 4 3 . 1 9 0 . 0 1 0 . 0 3 0 . 7 4 1 1 . 8 4 9 . 1 5 1 . 7 0 0 . 9 0 0 . 3 9 0 . 5 2 0 . 4 1
Saithe / Coalfish 0 . 9 8 4 . 5 0 1 5 . 3 2 2 8 . 0 0 5 . 9 0 2 . 0 3 3 . 8 2 3 . 5 5 0 . 8 2 1 . 5 6 1 . 3 6 1 . 6 4
S a l m o n 2 5 . 1 8 3 . 5 1 0 . 0 3 0 . 3 1 2 . 2 8 2 . 6 6 7 . 2 3 1 7 . 0 4 1 1 . 0 6 1 1 . 5 6 1 1 . 2 9 1 1 . 4 2
S a r d i n e 1 7 . 4 5 0 . 7 3 4 . 3 6 1 7 . 5 1 4 . 2 4 3 . 4 5 1 . 8 3 8 . 9 9 2 5 . 5 2 2 9 . 2 5 2 8 . 0 5 3 0 . 2 0
S e a b a s s * 2 . 1 0 2 . 9 2 0 . 0 3 0 . 8 1 1 . 4 8 0 . 7 4 2 . 3 9 5 . 8 6 4 . 1 8 6 . 9 1 6 . 1 6 7 . 0 9
S c a m p i 0 . 6 7 3 . 4 9 2 . 6 4 5 . 7 2 1 . 3 2 6 . 7 6 6 . 7 7 1 . 3 3 2 . 8 4 1 . 0 0 1 . 4 7 0 . 7 9
Sea bream* 2 . 2 8 1 . 0 7 0 . 0 0 0 . 1 2 1 . 9 6 0 . 8 2 4 . 9 2 2 . 0 2 1 . 9 8 6 . 3 5 5 . 3 5 7 . 5 8
S h r i m p 0 . 7 4 1 . 9 8 0 . 5 8 0 . 0 4 3 . 8 2 0 . 8 4 1 . 5 4 1 . 4 6 2 . 0 4 0 . 7 9 1 . 1 3 0 . 3 5
S o l e 0 . 4 3 4 . 4 1 0 . 0 1 0 . 7 2 3 . 4 1 7 . 5 2 0 . 8 9 1 . 8 4 0 . 7 4 0 . 6 6 0 . 6 7 1 . 3 7
Spider crab 1 . 6 7 0 . 4 2 4 . 1 5 2 . 6 1 0 . 4 1 6 . 0 2 3 . 9 0 3 . 8 4 8 . 3 8 4 . 4 9 5 . 4 8 2 . 5 8
S q u i d 0 . 1 7 0 . 4 8 0 . 0 1 1 . 1 4 1 . 4 5 1 . 8 6 0 . 3 9 0 . 5 5 0 . 7 7 0 . 5 6 0 . 6 0 0 . 6 5
S u r i m i 1 . 4 2 0 . 4 5 0 . 2 3 0 . 3 3 3 . 9 8 0 . 1 7 0 . 5 3 1 . 5 9 0 . 1 4 0 . 0 9 0 . 1 1 0 . 4 7
S w i m c r a b 0 . 9 4 0 . 5 2 0 . 6 4 2 . 0 9 0 . 1 8 1 . 1 6 0 . 2 9 1 . 1 2 3 . 9 0 2 . 1 9 2 . 6 5 1 . 5 1
S w o r d f i s h * 1 . 5 2 3 . 6 8 0 . 5 9 0 . 0 0 2 . 3 5 0 . 1 6 1 . 2 3 0 . 6 0 0 . 1 7 0 . 3 7 0 . 3 2 0 . 2 4
Ta r a m a 1 . 4 0 0 . 0 1 0 . 0 0 0 . 0 1 0 . 1 2 0 . 0 3 0 . 1 0 0 . 7 7 0 . 0 9 0 . 0 7 0 . 0 7 0 . 1 1
Tu n a * 3 . 5 7 1 2 . 3 0 2 . 2 0 0 . 7 1 1 5 . 6 0 2 . 2 1 1 . 5 8 5 . 0 3 0 . 5 6 0 . 7 5 0 . 6 9 1 . 1 6
W h i t i n g 0 . 1 9 2 . 9 8 0 . 0 1 0 . 0 3 1 . 4 6 2 . 6 2 2 . 4 2 1 . 6 8 0 . 9 2 1 . 1 1 1 . 0 5 1 . 4 1
POISSON 4.3 GB.qxd 17.9.2006 20:21 Page 153
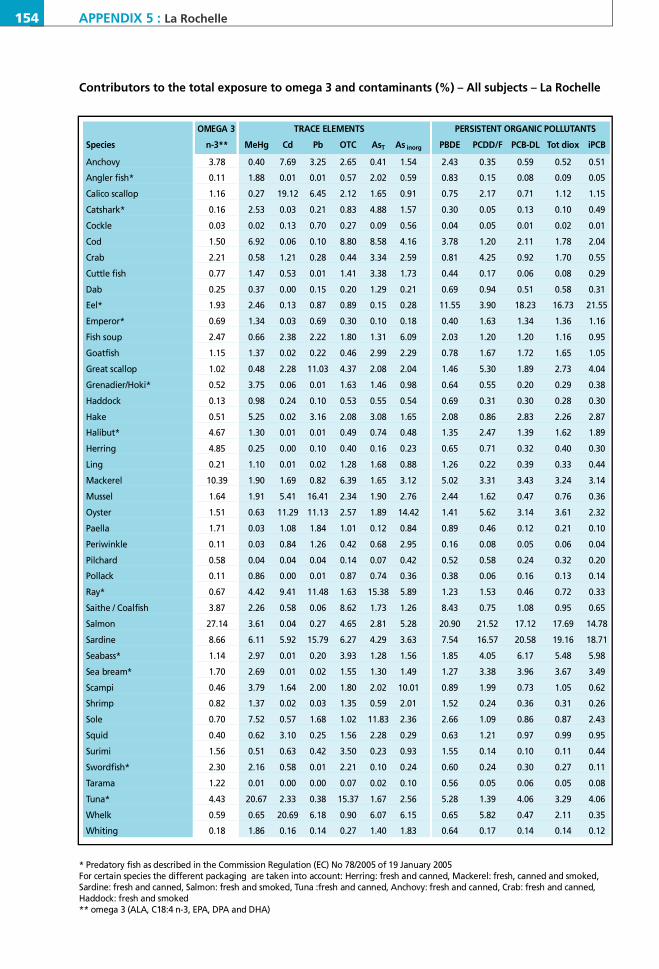
Contributors to the total exposure to omega 3 and contaminants (%) – All subjects – La Rochelle
154 APPENDIX 5 : La Rochelle
* Predatory fish as described in the Commission Regulation (EC) No 78/2005 of 19 January 2005For certain species the different packaging are taken into account: Herring: fresh and canned, Mackerel: fresh, canned and smoked,Sardine: fresh and canned, Salmon: fresh and smoked, Tuna :fresh and canned, Anchovy: fresh and canned, Crab: fresh and canned,Haddock: fresh and smoked** omega 3 (ALA, C18:4 n-3, EPA, DPA and DHA)
OMEGA 3 TRACE ELEMENTS PERSISTENT ORGANIC POLLUTA N T S
S p e c i e s n - 3 * * M e H g C d P b O T C A sT A s i n o r g P B D E P C D D / F P C B - D L Tot diox i P C B
A n c h o v y 3 . 7 8 0 . 4 0 7 . 6 9 3 . 2 5 2 . 6 5 0 . 4 1 1 . 5 4 2 . 4 3 0 . 3 5 0 . 5 9 0 . 5 2 0 . 5 1
Angler fish* 0 . 1 1 1 . 8 8 0 . 0 1 0 . 0 1 0 . 5 7 2 . 0 2 0 . 5 9 0 . 8 3 0 . 1 5 0 . 0 8 0 . 0 9 0 . 0 5
Calico scallop 1 . 1 6 0 . 2 7 1 9 . 1 2 6 . 4 5 2 . 1 2 1 . 6 5 0 . 9 1 0 . 7 5 2 . 1 7 0 . 7 1 1 . 1 2 1 . 1 5
C a t s h a r k * 0 . 1 6 2 . 5 3 0 . 0 3 0 . 2 1 0 . 8 3 4 . 8 8 1 . 5 7 0 . 3 0 0 . 0 5 0 . 1 3 0 . 1 0 0 . 4 9
C o c k l e 0 . 0 3 0 . 0 2 0 . 1 3 0 . 7 0 0 . 2 7 0 . 0 9 0 . 5 6 0 . 0 4 0 . 0 5 0 . 0 1 0 . 0 2 0 . 0 1
C o d 1 . 5 0 6 . 9 2 0 . 0 6 0 . 1 0 8 . 8 0 8 . 5 8 4 . 1 6 3 . 7 8 1 . 2 0 2 . 1 1 1 . 7 8 2 . 0 4
C r a b 2 . 2 1 0 . 5 8 1 . 2 1 0 . 2 8 0 . 4 4 3 . 3 4 2 . 5 9 0 . 8 1 4 . 2 5 0 . 9 2 1 . 7 0 0 . 5 5
Cuttle fish 0 . 7 7 1 . 4 7 0 . 5 3 0 . 0 1 1 . 4 1 3 . 3 8 1 . 7 3 0 . 4 4 0 . 1 7 0 . 0 6 0 . 0 8 0 . 2 9
D a b 0 . 2 5 0 . 3 7 0 . 0 0 0 . 1 5 0 . 2 0 1 . 2 9 0 . 2 1 0 . 6 9 0 . 9 4 0 . 5 1 0 . 5 8 0 . 3 1
E e l * 1 . 9 3 2 . 4 6 0 . 1 3 0 . 8 7 0 . 8 9 0 . 1 5 0 . 2 8 1 1 . 5 5 3 . 9 0 1 8 . 2 3 1 6 . 7 3 2 1 . 5 5
E m p e r o r * 0 . 6 9 1 . 3 4 0 . 0 3 0 . 6 9 0 . 3 0 0 . 1 0 0 . 1 8 0 . 4 0 1 . 6 3 1 . 3 4 1 . 3 6 1 . 1 6
Fish soup 2 . 4 7 0 . 6 6 2 . 3 8 2 . 2 2 1 . 8 0 1 . 3 1 6 . 0 9 2 . 0 3 1 . 2 0 1 . 2 0 1 . 1 6 0 . 9 5
G o a t f i s h 1 . 1 5 1 . 3 7 0 . 0 2 0 . 2 2 0 . 4 6 2 . 9 9 2 . 2 9 0 . 7 8 1 . 6 7 1 . 7 2 1 . 6 5 1 . 0 5
Great scallop 1 . 0 2 0 . 4 8 2 . 2 8 1 1 . 0 3 4 . 3 7 2 . 0 8 2 . 0 4 1 . 4 6 5 . 3 0 1 . 8 9 2 . 7 3 4 . 0 4
G r e n a d i e r / H o k i * 0 . 5 2 3 . 7 5 0 . 0 6 0 . 0 1 1 . 6 3 1 . 4 6 0 . 9 8 0 . 6 4 0 . 5 5 0 . 2 0 0 . 2 9 0 . 3 8
H a d d o c k 0 . 1 3 0 . 9 8 0 . 2 4 0 . 1 0 0 . 5 3 0 . 5 5 0 . 5 4 0 . 6 9 0 . 3 1 0 . 3 0 0 . 2 8 0 . 3 0
H a k e 0 . 5 1 5 . 2 5 0 . 0 2 3 . 1 6 2 . 0 8 3 . 0 8 1 . 6 5 2 . 0 8 0 . 8 6 2 . 8 3 2 . 2 6 2 . 8 7
H a l i b u t * 4 . 6 7 1 . 3 0 0 . 0 1 0 . 0 1 0 . 4 9 0 . 7 4 0 . 4 8 1 . 3 5 2 . 4 7 1 . 3 9 1 . 6 2 1 . 8 9
H e r r i n g 4 . 8 5 0 . 2 5 0 . 0 0 0 . 1 0 0 . 4 0 0 . 1 6 0 . 2 3 0 . 6 5 0 . 7 1 0 . 3 2 0 . 4 0 0 . 3 0
L i n g 0 . 2 1 1 . 1 0 0 . 0 1 0 . 0 2 1 . 2 8 1 . 6 8 0 . 8 8 1 . 2 6 0 . 2 2 0 . 3 9 0 . 3 3 0 . 4 4
M a c k e r e l 1 0 . 3 9 1 . 9 0 1 . 6 9 0 . 8 2 6 . 3 9 1 . 6 5 3 . 1 2 5 . 0 2 3 . 3 1 3 . 4 3 3 . 2 4 3 . 1 4
M u s s e l 1 . 6 4 1 . 9 1 5 . 4 1 1 6 . 4 1 2 . 3 4 1 . 9 0 2 . 7 6 2 . 4 4 1 . 6 2 0 . 4 7 0 . 7 6 0 . 3 6
O y s t e r 1 . 5 1 0 . 6 3 1 1 . 2 9 1 1 . 1 3 2 . 5 7 1 . 8 9 1 4 . 4 2 1 . 4 1 5 . 6 2 3 . 1 4 3 . 6 1 2 . 3 2
P a e l l a 1 . 7 1 0 . 0 3 1 . 0 8 1 . 8 4 1 . 0 1 0 . 1 2 0 . 8 4 0 . 8 9 0 . 4 6 0 . 1 2 0 . 2 1 0 . 1 0
P e r i w i n k l e 0 . 1 1 0 . 0 3 0 . 8 4 1 . 2 6 0 . 4 2 0 . 6 8 2 . 9 5 0 . 1 6 0 . 0 8 0 . 0 5 0 . 0 6 0 . 0 4
P i l c h a r d 0 . 5 8 0 . 0 4 0 . 0 4 0 . 0 4 0 . 1 4 0 . 0 7 0 . 4 2 0 . 5 2 0 . 5 8 0 . 2 4 0 . 3 2 0 . 2 0
P o l l a c k 0 . 1 1 0 . 8 6 0 . 0 0 0 . 0 1 0 . 8 7 0 . 7 4 0 . 3 6 0 . 3 8 0 . 0 6 0 . 1 6 0 . 1 3 0 . 1 4
R a y * 0 . 6 7 4 . 4 2 9 . 4 1 1 1 . 4 8 1 . 6 3 1 5 . 3 8 5 . 8 9 1 . 2 3 1 . 5 3 0 . 4 6 0 . 7 2 0 . 3 3
Saithe / Coalfish 3 . 8 7 2 . 2 6 0 . 5 8 0 . 0 6 8 . 6 2 1 . 7 3 1 . 2 6 8 . 4 3 0 . 7 5 1 . 0 8 0 . 9 5 0 . 6 5
S a l m o n 2 7 . 1 4 3 . 6 1 0 . 0 4 0 . 2 7 4 . 6 5 2 . 8 1 5 . 2 8 2 0 . 9 0 2 1 . 5 2 1 7 . 1 2 1 7 . 6 9 1 4 . 7 8
S a r d i n e 8 . 6 6 6 . 1 1 5 . 9 2 1 5 . 7 9 6 . 2 7 4 . 2 9 3 . 6 3 7 . 5 4 1 6 . 5 7 2 0 . 5 8 1 9 . 1 6 1 8 . 7 1
S e a b a s s * 1 . 1 4 2 . 9 7 0 . 0 1 0 . 2 0 3 . 9 3 1 . 2 8 1 . 5 6 1 . 8 5 4 . 0 5 6 . 1 7 5 . 4 8 5 . 9 8
Sea bream* 1 . 7 0 2 . 6 9 0 . 0 1 0 . 0 2 1 . 5 5 1 . 3 0 1 . 4 9 1 . 2 7 3 . 3 8 3 . 9 6 3 . 6 7 3 . 4 9
S c a m p i 0 . 4 6 3 . 7 9 1 . 6 4 2 . 0 0 1 . 8 0 2 . 0 2 1 0 . 0 1 0 . 8 9 1 . 9 9 0 . 7 3 1 . 0 5 0 . 6 2
S h r i m p 0 . 8 2 1 . 3 7 0 . 0 2 0 . 0 3 1 . 3 5 0 . 5 9 2 . 0 1 1 . 5 2 0 . 2 4 0 . 3 6 0 . 3 1 0 . 2 6
S o l e 0 . 7 0 7 . 5 2 0 . 5 7 1 . 6 8 1 . 0 2 1 1 . 8 3 2 . 3 6 2 . 6 6 1 . 0 9 0 . 8 6 0 . 8 7 2 . 4 3
S q u i d 0 . 4 0 0 . 6 2 3 . 1 0 0 . 2 5 1 . 5 6 2 . 2 8 0 . 2 9 0 . 6 3 1 . 2 1 0 . 9 7 0 . 9 9 0 . 9 5
S u r i m i 1 . 5 6 0 . 5 1 0 . 6 3 0 . 4 2 3 . 5 0 0 . 2 3 0 . 9 3 1 . 5 5 0 . 1 4 0 . 1 0 0 . 1 1 0 . 4 4
S w o r d f i s h * 2 . 3 0 2 . 1 6 0 . 5 8 0 . 0 1 2 . 2 1 0 . 1 0 0 . 2 4 0 . 6 0 0 . 2 4 0 . 3 0 0 . 2 7 0 . 1 1
Ta r a m a 1 . 2 2 0 . 0 1 0 . 0 0 0 . 0 0 0 . 0 7 0 . 0 2 0 . 1 0 0 . 5 6 0 . 0 5 0 . 0 6 0 . 0 5 0 . 0 8
Tu n a * 4 . 4 3 2 0 . 6 7 2 . 3 3 0 . 3 8 1 5 . 3 7 1 . 6 7 2 . 5 6 5 . 2 8 1 . 3 9 4 . 0 6 3 . 2 9 4 . 0 6
W h e l k 0 . 5 9 0 . 6 5 2 0 . 6 9 6 . 1 8 0 . 9 0 6 . 0 7 6 . 1 5 0 . 6 5 5 . 8 2 0 . 4 7 2 . 1 1 0 . 3 5
W h i t i n g 0 . 1 8 1 . 8 6 0 . 1 6 0 . 1 4 0 . 2 7 1 . 4 0 1 . 8 3 0 . 6 4 0 . 1 7 0 . 1 4 0 . 1 4 0 . 1 2
POISSON 4.3 GB.qxd 17.9.2006 20:21 Page 154

APPENDIX 5 : Toulon 155
Contributors to the total exposure to omega 3 and contaminants (%) – All subjects – Toulon
* Predatory fish as described in the Commission Regulation (EC) No 78/2005 of 19 January 2005For certain species the different packaging are taken into account: Herring: fresh and canned, Mackerel: fresh, canned and smoked,Sardine: fresh and canned, Salmon: fresh and smoked, Tuna :fresh and canned, Anchovy: fresh and canned, Crab: fresh and canned,Haddock: fresh and smoked** omega 3 (ALA, C18:4 n-3, EPA, DPA and DHA)
OMEGA 3 TRACE ELEMENTS PERSISTENT ORGANIC POLLUTA N T S
S p e c i e s n - 3 * * M e H g C d P b O T C A sT A s i n o r g P B D E P C D D / F P C B - D L Tot diox i P C B
A n c h o v y 8 . 4 1 1 . 0 8 2 2 . 8 6 1 0 . 2 9 6 . 0 6 1 . 1 7 3 . 2 7 6 . 6 5 1 . 3 3 1 . 8 3 1 . 7 0 1 . 3 7
Angler fish* 0 . 0 9 2 . 4 3 0 . 0 1 0 . 5 1 1 . 2 3 2 . 3 4 0 . 5 3 0 . 8 3 0 . 5 9 0 . 5 4 0 . 5 5 1 . 3 0
C a t s h a r k * 0 . 0 7 2 . 5 2 0 . 4 1 0 . 0 1 0 . 5 1 5 . 5 9 1 . 2 4 0 . 1 2 0 . 0 8 0 . 0 7 0 . 0 7 0 . 1 3
C o d 1 . 5 0 5 . 6 6 0 . 1 7 4 . 1 5 5 . 4 3 8 . 3 3 4 . 7 3 7 . 3 6 3 . 9 3 2 . 8 4 3 . 0 6 1 . 9 1
C r a b 1 . 0 9 1 . 3 0 4 . 0 4 0 . 7 1 0 . 7 1 0 . 4 9 1 . 7 6 0 . 8 8 0 . 4 1 0 . 1 2 0 . 1 9 0 . 0 4
Cuttle fish 0 . 0 9 0 . 0 7 1 . 3 0 4 . 7 4 0 . 2 5 0 . 1 8 0 . 5 5 0 . 1 7 0 . 4 9 0 . 2 3 0 . 2 9 0 . 3 0
D a b 0 . 7 5 0 . 7 9 0 . 0 2 0 . 2 3 0 . 3 2 6 . 0 0 2 . 3 1 1 . 1 3 1 . 8 0 0 . 8 2 1 . 0 5 0 . 5 3
E e l * 0 . 1 9 0 . 3 2 0 . 0 2 0 . 1 9 0 . 0 8 0 . 0 2 0 . 0 3 1 . 8 0 0 . 8 9 3 . 1 0 2 . 9 2 3 . 5 2
E m p e r o r * 0 . 8 0 1 . 1 6 0 . 0 3 0 . 0 4 0 . 3 5 0 . 0 7 0 . 0 6 0 . 4 1 1 . 5 7 1 . 5 1 1 . 5 1 1 . 3 6
Fish soup 2 . 5 1 0 . 7 5 4 . 5 4 3 . 4 5 1 . 5 6 1 . 4 2 5 . 7 8 2 . 5 9 2 . 1 7 1 . 7 5 1 . 8 3 1 . 3 1
G o a t f i s h 1 . 4 4 1 . 8 4 0 . 0 1 0 . 0 2 0 . 1 6 4 . 9 0 1 . 1 9 1 . 2 4 5 . 2 8 5 . 2 7 5 . 2 4 3 . 9 7
Great scallop 0 . 5 1 0 . 4 7 1 9 . 8 1 8 . 1 0 1 . 9 7 4 . 0 2 1 4 . 1 3 1 . 0 8 0 . 9 9 0 . 2 3 0 . 4 0 0 . 2 5
G r e n a d i e r / H o k i * 0 . 1 1 0 . 5 2 0 . 1 9 0 . 0 1 0 . 5 5 0 . 5 9 0 . 2 3 0 . 3 2 0 . 3 0 0 . 1 6 0 . 1 9 0 . 3 6
H a d d o c k 0 . 0 4 0 . 0 1 0 . 0 0 0 . 0 6 0 . 0 2 0 . 0 2 0 . 0 6 0 . 0 4 0 . 0 3 0 . 0 1 0 . 0 1 0 . 0 1
H a k e 0 . 3 8 0 . 9 1 0 . 0 2 0 . 6 2 0 . 7 2 0 . 3 4 0 . 3 4 0 . 5 6 0 . 5 0 0 . 2 8 0 . 3 3 0 . 2 1
H a l i b u t * 3 . 9 7 0 . 1 7 3 . 7 6 1 1 . 0 7 6 . 4 7 2 . 2 2 1 . 2 5 2 . 2 3 5 . 7 8 2 . 6 0 3 . 4 1 1 . 8 6
H e r r i n g 3 . 2 1 0 . 2 5 0 . 0 0 0 . 1 5 0 . 2 6 0 . 1 6 0 . 1 9 0 . 6 3 1 . 2 5 0 . 4 8 0 . 6 5 0 . 4 2
John dory 0 . 0 9 0 . 8 4 0 . 0 0 0 . 0 1 1 . 3 4 0 . 1 4 0 . 5 2 0 . 3 1 0 . 1 6 0 . 3 8 0 . 3 3 0 . 3 7
L o b s t e r 0 . 1 7 0 . 5 8 4 . 4 6 0 . 1 1 0 . 1 1 0 . 9 0 0 . 7 0 0 . 3 2 2 . 5 8 0 . 9 7 1 . 3 6 0 . 4 2
L i n g 0 . 1 8 5 . 0 4 0 . 0 1 0 . 0 7 0 . 7 1 2 . 2 1 0 . 5 6 0 . 9 0 0 . 9 2 0 . 5 8 0 . 6 5 0 . 7 2
M a c k e r e l 7 . 2 3 1 . 2 7 1 . 5 8 0 . 4 4 3 . 3 2 0 . 8 0 0 . 9 7 4 . 2 5 3 . 2 6 3 . 8 7 3 . 7 0 4 . 5 0
M u s s e l 0 . 3 9 1 . 1 0 0 . 0 2 0 . 0 3 0 . 6 3 1 . 7 3 1 . 0 6 1 . 2 9 2 . 4 1 1 . 3 6 1 . 5 8 1 . 7 4
O c t o p u s 0 . 1 5 2 . 9 1 1 . 0 3 3 . 4 3 1 . 1 0 1 0 . 6 9 6 . 6 9 0 . 3 6 0 . 5 8 0 . 5 8 0 . 5 8 0 . 4 6
O y s t e r 0 . 2 0 0 . 0 3 1 . 6 0 0 . 1 4 2 . 0 9 1 . 1 3 4 . 0 7 0 . 7 2 2 . 1 5 0 . 7 7 1 . 0 7 0 . 5 6
P a e l l a 3 . 1 8 0 . 0 5 3 . 9 2 5 . 8 5 1 . 5 1 0 . 2 7 1 . 6 2 2 . 0 1 1 . 6 6 0 . 3 7 0 . 6 8 0 . 2 7
P i l c h a r d 0 . 2 3 0 . 0 2 0 . 0 3 0 . 0 2 0 . 0 6 0 . 0 4 0 . 1 7 0 . 3 2 0 . 4 3 0 . 1 5 0 . 2 1 0 . 1 1
R a y * 0 . 3 7 1 . 0 9 0 . 0 1 0 . 0 2 0 . 7 3 2 . 9 7 0 . 4 4 0 . 8 6 0 . 9 5 0 . 6 3 0 . 6 9 0 . 5 8
Saithe / Coalfish 1 . 2 5 1 . 4 4 0 . 3 6 0 . 1 3 5 . 9 1 2 . 3 8 4 . 4 0 2 . 9 1 0 . 9 0 1 . 1 4 1 . 0 7 0 . 9 3
S a l m o n 2 3 . 8 7 2 . 2 2 0 . 0 7 2 . 2 0 1 1 . 4 5 3 . 7 0 3 . 6 0 1 8 . 8 1 1 5 . 1 3 1 5 . 8 8 1 5 . 6 1 1 4 . 2 3
S a r d i n e 6 . 1 4 2 . 9 0 8 . 7 0 1 8 . 6 9 3 . 3 0 5 . 3 8 9 . 0 2 5 . 2 9 1 2 . 1 4 1 6 . 6 7 1 5 . 6 4 1 9 . 4 8
Scorpion fish 0 . 8 2 1 . 9 0 0 . 0 1 0 . 0 1 0 . 2 5 0 . 4 0 0 . 4 1 0 . 7 0 2 . 3 8 2 . 4 9 2 . 4 5 1 . 8 6
S e a b a s s * 6 . 1 0 2 . 1 9 0 . 0 3 2 . 6 2 1 0 . 0 5 1 . 1 7 1 . 8 5 6 . 2 5 7 . 8 4 1 2 . 6 5 1 1 . 5 6 1 3 . 5 0
Sea bream* 8 . 1 7 4 . 1 9 0 . 0 6 0 . 0 8 2 . 9 2 4 . 4 4 3 . 5 3 6 . 9 5 1 0 . 2 3 1 0 . 0 9 1 0 . 0 5 7 . 5 1
Sea urchin 0 . 5 8 0 . 1 2 4 . 9 0 1 3 . 5 3 2 . 7 0 2 . 4 2 1 1 . 9 0 1 . 1 4 0 . 9 9 1 . 7 2 1 . 5 5 0 . 8 3
S h r i m p 0 . 3 4 1 . 4 3 1 . 6 2 2 . 3 4 0 . 8 0 1 . 9 7 0 . 7 4 1 . 2 1 0 . 9 1 0 . 1 3 0 . 3 0 0 . 0 8
S o l e 0 . 7 6 6 . 9 9 0 . 1 2 1 . 9 5 2 . 6 4 1 0 . 7 0 1 . 2 3 1 . 6 3 1 . 8 3 1 . 3 7 1 . 4 7 3 . 3 9
S q u i d 0 . 7 7 0 . 9 3 2 . 6 7 0 . 6 9 0 . 7 3 0 . 3 1 0 . 5 8 0 . 8 0 0 . 2 1 0 . 1 4 0 . 1 6 0 . 1 0
S u r i m i 2 . 8 3 1 . 0 3 1 . 6 6 1 . 0 9 5 . 0 4 0 . 5 7 1 . 7 2 3 . 3 7 0 . 5 0 0 . 2 7 0 . 3 2 1 . 0 8
S w o r d f i s h * 2 . 8 6 7 . 5 0 1 . 9 5 0 . 0 1 0 . 6 5 0 . 1 6 0 . 1 3 0 . 6 8 0 . 3 5 0 . 6 9 0 . 6 1 0 . 7 6
Ta r a m a 2 . 2 9 0 . 0 2 0 . 0 1 0 . 0 1 0 . 1 4 0 . 0 6 0 . 2 1 1 . 3 7 0 . 2 4 0 . 1 7 0 . 1 9 0 . 2 6
Tu n a * 5 . 1 1 2 3 . 9 3 7 . 1 6 1 . 2 1 1 2 . 1 4 3 . 4 8 2 . 2 4 5 . 7 3 1 . 1 6 1 . 3 3 1 . 2 8 1 . 9 6
W h e l k 0 . 1 0 0 . 2 3 0 . 7 9 0 . 3 2 0 . 1 9 1 . 6 6 1 . 2 2 0 . 2 9 0 . 8 4 0 . 2 3 0 . 3 6 0 . 1 4
W h i t i n g 0 . 6 4 9 . 8 3 0 . 0 4 0 . 6 9 2 . 8 6 2 . 4 4 2 . 7 5 3 . 5 2 1 . 8 6 3 . 5 7 3 . 1 7 5 . 3 2
POISSON 4.3 GB.qxd 17.9.2006 20:21 Page 155
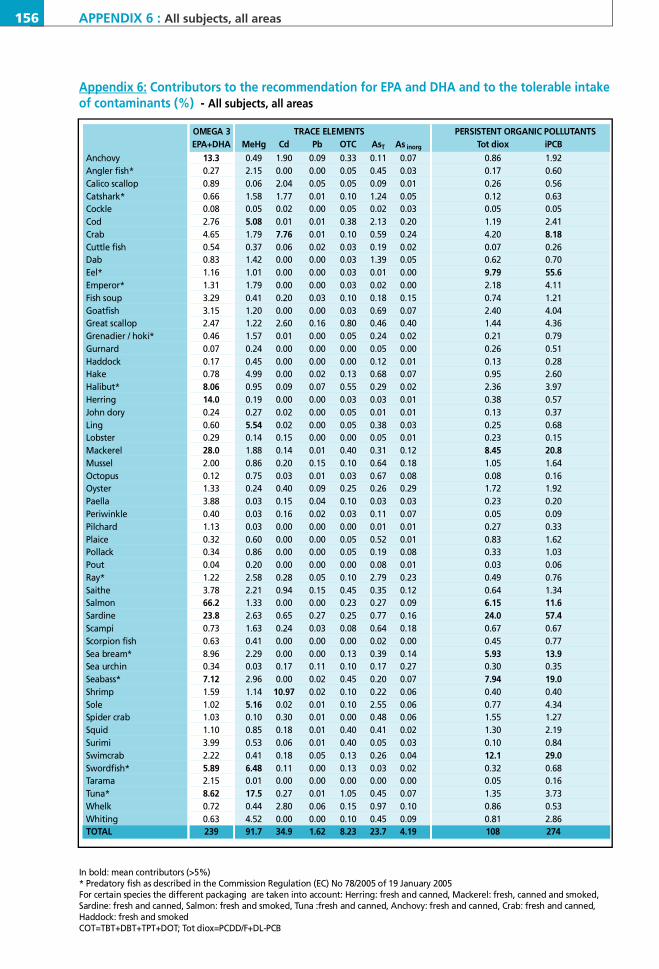
156 APPENDIX 6 : All subjects, all areas
Appendix 6: Contributors to the recommendation for EPA and DHA and to the tolerable intakeof contaminants (%) - All subjects, all areas
OMEGA 3 TRACE ELEMENTS PERSISTENT ORGANIC POLLUTA N T SE PA + D H A M e H g C d P b O T C A sT A s i n o r g Tot diox i P C B
A n c h o v y 1 3 . 3 0 . 4 9 1 . 9 0 0 . 0 9 0 . 3 3 0 . 1 1 0 . 0 7 0 . 8 6 1 . 9 2Angler fish* 0 . 2 7 2 . 1 5 0 . 0 0 0 . 0 0 0 . 0 5 0 . 4 5 0 . 0 3 0 . 1 7 0 . 6 0Calico scallop 0 . 8 9 0 . 0 6 2 . 0 4 0 . 0 5 0 . 0 5 0 . 0 9 0 . 0 1 0 . 2 6 0 . 5 6C a t s h a r k * 0 . 6 6 1 . 5 8 1 . 7 7 0 . 0 1 0 . 1 0 1 . 2 4 0 . 0 5 0 . 1 2 0 . 6 3C o c k l e 0 . 0 8 0 . 0 5 0 . 0 2 0 . 0 0 0 . 0 5 0 . 0 2 0 . 0 3 0 . 0 5 0 . 0 5C o d 2 . 7 6 5 . 0 8 0 . 0 1 0 . 0 1 0 . 3 8 2 . 1 3 0 . 2 0 1 . 1 9 2 . 4 1C r a b 4 . 6 5 1 . 7 9 7 . 7 6 0 . 0 1 0 . 1 0 0 . 5 9 0 . 2 4 4 . 2 0 8 . 1 8Cuttle fish 0 . 5 4 0 . 3 7 0 . 0 6 0 . 0 2 0 . 0 3 0 . 1 9 0 . 0 2 0 . 0 7 0 . 2 6D a b 0 . 8 3 1 . 4 2 0 . 0 0 0 . 0 0 0 . 0 3 1 . 3 9 0 . 0 5 0 . 6 2 0 . 7 0E e l * 1 . 1 6 1 . 0 1 0 . 0 0 0 . 0 0 0 . 0 3 0 . 0 1 0 . 0 0 9 . 7 9 5 5 . 6E m p e r o r * 1 . 3 1 1 . 7 9 0 . 0 0 0 . 0 0 0 . 0 3 0 . 0 2 0 . 0 0 2 . 1 8 4 . 1 1Fish soup 3 . 2 9 0 . 4 1 0 . 2 0 0 . 0 3 0 . 1 0 0 . 1 8 0 . 1 5 0 . 7 4 1 . 2 1G o a t f i s h 3 . 1 5 1 . 2 0 0 . 0 0 0 . 0 0 0 . 0 3 0 . 6 9 0 . 0 7 2 . 4 0 4 . 0 4Great scallop 2 . 4 7 1 . 2 2 2 . 6 0 0 . 1 6 0 . 8 0 0 . 4 6 0 . 4 0 1 . 4 4 4 . 3 6Grenadier / hoki* 0 . 4 6 1 . 5 7 0 . 0 1 0 . 0 0 0 . 0 5 0 . 2 4 0 . 0 2 0 . 2 1 0 . 7 9G u r n a r d 0 . 0 7 0 . 2 4 0 . 0 0 0 . 0 0 0 . 0 0 0 . 0 5 0 . 0 0 0 . 2 6 0 . 5 1H a d d o c k 0 . 1 7 0 . 4 5 0 . 0 0 0 . 0 0 0 . 0 0 0 . 1 2 0 . 0 1 0 . 1 3 0 . 2 8H a k e 0 . 7 8 4 . 9 9 0 . 0 0 0 . 0 2 0 . 1 3 0 . 6 8 0 . 0 7 0 . 9 5 2 . 6 0H a l i b u t * 8 . 0 6 0 . 9 5 0 . 0 9 0 . 0 7 0 . 5 5 0 . 2 9 0 . 0 2 2 . 3 6 3 . 9 7H e r r i n g 1 4 . 0 0 . 1 9 0 . 0 0 0 . 0 0 0 . 0 3 0 . 0 3 0 . 0 1 0 . 3 8 0 . 5 7John dory 0 . 2 4 0 . 2 7 0 . 0 2 0 . 0 0 0 . 0 5 0 . 0 1 0 . 0 1 0 . 1 3 0 . 3 7L i n g 0 . 6 0 5 . 5 4 0 . 0 2 0 . 0 0 0 . 0 5 0 . 3 8 0 . 0 3 0 . 2 5 0 . 6 8L o b s t e r 0 . 2 9 0 . 1 4 0 . 1 5 0 . 0 0 0 . 0 0 0 . 0 5 0 . 0 1 0 . 2 3 0 . 1 5M a c k e r e l 2 8 . 0 1 . 8 8 0 . 1 4 0 . 0 1 0 . 4 0 0 . 3 1 0 . 1 2 8 . 4 5 2 0 . 8M u s s e l 2 . 0 0 0 . 8 6 0 . 2 0 0 . 1 5 0 . 1 0 0 . 6 4 0 . 1 8 1 . 0 5 1 . 6 4O c t o p u s 0 . 1 2 0 . 7 5 0 . 0 3 0 . 0 1 0 . 0 3 0 . 6 7 0 . 0 8 0 . 0 8 0 . 1 6O y s t e r 1 . 3 3 0 . 2 4 0 . 4 0 0 . 0 9 0 . 2 5 0 . 2 6 0 . 2 9 1 . 7 2 1 . 9 2P a e l l a 3 . 8 8 0 . 0 3 0 . 1 5 0 . 0 4 0 . 1 0 0 . 0 3 0 . 0 3 0 . 2 3 0 . 2 0P e r i w i n k l e 0 . 4 0 0 . 0 3 0 . 1 6 0 . 0 2 0 . 0 3 0 . 1 1 0 . 0 7 0 . 0 5 0 . 0 9P i l c h a r d 1 . 1 3 0 . 0 3 0 . 0 0 0 . 0 0 0 . 0 0 0 . 0 1 0 . 0 1 0 . 2 7 0 . 3 3P l a i c e 0 . 3 2 0 . 6 0 0 . 0 0 0 . 0 0 0 . 0 5 0 . 5 2 0 . 0 1 0 . 8 3 1 . 6 2P o l l a c k 0 . 3 4 0 . 8 6 0 . 0 0 0 . 0 0 0 . 0 5 0 . 1 9 0 . 0 8 0 . 3 3 1 . 0 3P o u t 0 . 0 4 0 . 2 0 0 . 0 0 0 . 0 0 0 . 0 0 0 . 0 8 0 . 0 1 0 . 0 3 0 . 0 6R a y * 1 . 2 2 2 . 5 8 0 . 2 8 0 . 0 5 0 . 1 0 2 . 7 9 0 . 2 3 0 . 4 9 0 . 7 6S a i t h e 3 . 7 8 2 . 2 1 0 . 9 4 0 . 1 5 0 . 4 5 0 . 3 5 0 . 1 2 0 . 6 4 1 . 3 4S a l m o n 6 6 . 2 1 . 3 3 0 . 0 0 0 . 0 0 0 . 2 3 0 . 2 7 0 . 0 9 6 . 1 5 1 1 . 6S a r d i n e 2 3 . 8 2 . 6 3 0 . 6 5 0 . 2 7 0 . 2 5 0 . 7 7 0 . 1 6 2 4 . 0 5 7 . 4S c a m p i 0 . 7 3 1 . 6 3 0 . 2 4 0 . 0 3 0 . 0 8 0 . 6 4 0 . 1 8 0 . 6 7 0 . 6 7Scorpion fish 0 . 6 3 0 . 4 1 0 . 0 0 0 . 0 0 0 . 0 0 0 . 0 2 0 . 0 0 0 . 4 5 0 . 7 7Sea bream* 8 . 9 6 2 . 2 9 0 . 0 0 0 . 0 0 0 . 1 3 0 . 3 9 0 . 1 4 5 . 9 3 1 3 . 9Sea urchin 0 . 3 4 0 . 0 3 0 . 1 7 0 . 1 1 0 . 1 0 0 . 1 7 0 . 2 7 0 . 3 0 0 . 3 5S e a b a s s * 7 . 1 2 2 . 9 6 0 . 0 0 0 . 0 2 0 . 4 5 0 . 2 0 0 . 0 7 7 . 9 4 1 9 . 0S h r i m p 1 . 5 9 1 . 1 4 1 0 . 9 7 0 . 0 2 0 . 1 0 0 . 2 2 0 . 0 6 0 . 4 0 0 . 4 0S o l e 1 . 0 2 5 . 1 6 0 . 0 2 0 . 0 1 0 . 1 0 2 . 5 5 0 . 0 6 0 . 7 7 4 . 3 4Spider crab 1 . 0 3 0 . 1 0 0 . 3 0 0 . 0 1 0 . 0 0 0 . 4 8 0 . 0 6 1 . 5 5 1 . 2 7S q u i d 1 . 1 0 0 . 8 5 0 . 1 8 0 . 0 1 0 . 4 0 0 . 4 1 0 . 0 2 1 . 3 0 2 . 1 9S u r i m i 3 . 9 9 0 . 5 3 0 . 0 6 0 . 0 1 0 . 4 0 0 . 0 5 0 . 0 3 0 . 1 0 0 . 8 4S w i m c r a b 2 . 2 2 0 . 4 1 0 . 1 8 0 . 0 5 0 . 1 3 0 . 2 6 0 . 0 4 1 2 . 1 2 9 . 0S w o r d f i s h * 5 . 8 9 6 . 4 8 0 . 1 1 0 . 0 0 0 . 1 3 0 . 0 3 0 . 0 2 0 . 3 2 0 . 6 8Ta r a m a 2 . 1 5 0 . 0 1 0 . 0 0 0 . 0 0 0 . 0 0 0 . 0 0 0 . 0 0 0 . 0 5 0 . 1 6Tu n a * 8 . 6 2 1 7 . 5 0 . 2 7 0 . 0 1 1 . 0 5 0 . 4 5 0 . 0 7 1 . 3 5 3 . 7 3W h e l k 0 . 7 2 0 . 4 4 2 . 8 0 0 . 0 6 0 . 1 5 0 . 9 7 0 . 1 0 0 . 8 6 0 . 5 3W h i t i n g 0 . 6 3 4 . 5 2 0 . 0 0 0 . 0 0 0 . 1 0 0 . 4 5 0 . 0 9 0 . 8 1 2 . 8 6T O TA L 2 3 9 9 1 . 7 3 4 . 9 1 . 6 2 8 . 2 3 2 3 . 7 4 . 1 9 1 0 8 2 7 4
In bold: mean contributors (>5%)* Predatory fish as described in the Commission Regulation (EC) No 78/2005 of 19 January 2005For certain species the different packaging are taken into account: Herring: fresh and canned, Mackerel: fresh, canned and smoked,Sardine: fresh and canned, Salmon: fresh and smoked, Tuna :fresh and canned, Anchovy: fresh and canned, Crab: fresh and canned,Haddock: fresh and smokedC O T = T B T + D B T + T P T + D O T; Tot diox=PCDD/F+DL-PCB
POISSON 4.3 GB.qxd 17.9.2006 20:21 Page 156

APPENDIX 6 : Le Havre 157
Contributors to the recommendation for EPA and DHA and to the tolerable intake ofcontaminants (%) – All subjects, Le Havre
OMEGA 3 TRACE ELEMENTS PERSISTENT ORGANIC POLLUTA N T SE PA + D H A M e H g C d P b O T C A sT A s i n o r g Tot diox i P C B
A n c h o v y 5 . 3 8 0 . 1 9 0 . 7 6 0 . 0 4 0 . 1 3 0 . 0 4 0 . 0 3 0 . 3 0 0 . 6 6
Angler fish* 0 . 4 1 1 . 1 0 0 . 0 0 0 . 0 0 0 . 0 3 0 . 2 4 0 . 0 4 0 . 1 1 0 . 1 8
C a t s h a r k * 2 . 0 1 0 . 7 5 7 . 0 5 0 . 0 4 0 . 2 8 1 . 5 6 0 . 1 0 0 . 3 6 1 . 4 6
C o d 3 . 5 3 4 . 4 2 0 . 0 0 0 . 0 1 0 . 5 5 4 . 2 6 0 . 5 0 1 . 0 2 2 . 3 0
C r a b 6 . 2 5 4 . 4 6 0 . 2 7 0 . 0 2 0 . 3 0 0 . 5 9 0 . 2 6 1 0 . 2 2 8 . 4
D a b 1 . 0 4 0 . 9 1 0 . 0 0 0 . 0 0 0 . 0 3 1 . 5 9 0 . 0 4 1 . 1 5 1 . 1 6
E e l * 0 . 4 6 0 . 4 1 0 . 0 0 0 . 0 0 0 . 0 0 0 . 0 0 0 . 0 0 3 . 9 4 2 2 . 4
Fish soup 1 . 4 2 0 . 1 7 0 . 0 8 0 . 0 1 0 . 0 5 0 . 0 8 0 . 0 6 0 . 3 1 0 . 5 1
Great scallop 4 . 7 5 0 . 3 2 7 . 3 9 0 . 3 3 2 . 2 8 0 . 4 9 0 . 7 5 2 . 5 9 8 . 6 3
Grenadier / hoki* 0 . 3 1 0 . 8 7 0 . 0 0 0 . 0 1 0 . 0 5 0 . 1 5 0 . 0 1 0 . 1 9 0 . 6 1
H a d d o c k 0 . 1 8 0 . 0 2 0 . 0 0 0 . 0 0 0 . 0 0 0 . 0 1 0 . 0 0 0 . 0 1 0 . 0 1
H a k e 0 . 4 9 0 . 7 6 0 . 0 0 0 . 0 0 0 . 0 5 0 . 0 5 0 . 0 2 0 . 1 1 0 . 3 4
H a l i b u t * 1 0 . 7 1 . 7 9 0 . 0 0 0 . 0 0 0 . 9 8 0 . 5 0 0 . 0 2 3 . 7 3 6 . 5 2
H e r r i n g 2 9 . 6 0 . 1 6 0 . 0 0 0 . 0 0 0 . 0 3 0 . 0 2 0 . 0 1 0 . 3 3 0 . 4 9
L i n g 1 . 1 4 6 . 5 0 0 . 0 0 0 . 0 0 0 . 0 8 0 . 4 2 0 . 0 2 0 . 1 9 0 . 4 9
M a c k e r e l 4 9 . 2 2 . 2 6 0 . 1 7 0 . 0 1 0 . 7 3 0 . 3 0 0 . 0 8 2 0 . 1 4 9 . 4
M u s s e l 2 . 2 3 0 . 1 7 0 . 0 1 0 . 1 7 0 . 1 0 0 . 1 3 0 . 4 2 1 . 4 7 2 . 7 4
O y s t e r 1 . 2 3 0 . 2 2 0 . 0 0 0 . 0 0 0 . 5 3 0 . 2 1 0 . 5 1 1 . 7 1 1 . 5 0
P a e l l a 3 . 7 7 0 . 0 2 0 . 1 4 0 . 0 4 0 . 0 8 0 . 0 3 0 . 0 3 0 . 2 2 0 . 1 9
P e r i w i n k l e 0 . 4 4 0 . 0 3 0 . 1 7 0 . 0 2 0 . 0 0 0 . 0 6 0 . 0 5 0 . 0 4 0 . 0 9
P i l c h a r d 1 . 2 7 0 . 0 4 0 . 0 0 0 . 0 0 0 . 0 0 0 . 0 1 0 . 0 1 0 . 3 0 0 . 3 6
P l a i c e 0 . 8 5 2 . 1 5 0 . 0 0 0 . 0 1 0 . 1 8 1 . 7 8 0 . 0 2 3 . 1 3 6 . 0 8
P o l l a c k 0 . 4 9 1 . 3 4 0 . 0 0 0 . 0 0 0 . 0 8 0 . 2 0 0 . 0 3 0 . 3 2 1 . 1 3
R a y * 1 . 3 4 1 . 8 8 0 . 0 1 0 . 0 0 0 . 1 5 2 . 6 2 0 . 2 4 0 . 4 7 0 . 9 0
S a i t h e 2 . 2 8 2 . 2 6 0 . 0 0 0 . 0 1 0 . 3 5 0 . 3 0 0 . 1 6 0 . 4 1 1 . 0 7
S a l m o n 8 0 . 4 1 . 5 5 0 . 0 0 0 . 0 0 0 . 4 0 0 . 2 8 0 . 0 6 4 . 7 2 1 0 . 8
S a r d i n e 1 7 . 1 0 . 7 2 0 . 5 6 0 . 2 2 0 . 2 8 0 . 4 4 0 . 0 7 1 9 . 6 5 1 . 9
S c a m p i 0 . 3 5 0 . 2 8 0 . 3 2 0 . 0 1 0 . 1 3 0 . 3 2 0 . 0 4 0 . 3 8 0 . 2 8
Sea bream* 5 . 5 4 0 . 7 8 0 . 0 0 0 . 0 0 0 . 0 8 0 . 1 1 0 . 0 1 1 . 1 9 2 . 5 6
S e a b a s s * 4 . 4 4 3 . 6 3 0 . 0 0 0 . 0 2 0 . 1 8 0 . 1 1 0 . 0 2 8 . 3 0 1 6 . 7
S h r i m p 2 . 3 6 0 . 7 1 4 3 . 7 3 0 . 0 5 0 . 0 5 0 . 3 0 0 . 0 8 0 . 2 7 0 . 5 7
S o l e 0 . 9 7 2 . 6 8 0 . 0 0 0 . 0 0 0 . 0 3 2 . 4 5 0 . 1 0 1 . 0 0 5 . 9 2
S q u i d 1 . 8 0 1 . 6 9 0 . 0 3 0 . 0 0 1 . 2 5 0 . 6 2 0 . 0 2 3 . 6 5 5 . 6 7
S u r i m i 5 . 6 4 0 . 7 4 0 . 0 8 0 . 0 1 0 . 5 5 0 . 0 7 0 . 0 5 0 . 1 4 1 . 1 8
S w i m c r a b 4 . 7 9 1 . 0 7 0 . 4 9 0 . 1 6 0 . 5 0 0 . 5 7 0 . 1 4 4 3 . 6 1 1 2
S w o r d f i s h * 4 . 0 1 4 . 0 0 0 . 0 6 0 . 0 0 0 . 1 3 0 . 0 1 0 . 0 1 0 . 1 7 0 . 4 4
Ta r a m a 1 . 3 2 0 . 0 0 0 . 0 0 0 . 0 0 0 . 0 0 0 . 0 0 0 . 0 0 0 . 0 3 0 . 0 9
Tu n a * 9 . 0 2 1 3 . 1 0 . 2 1 0 . 0 1 1 . 0 5 0 . 3 7 0 . 0 7 0 . 6 6 2 . 0 0
W h e l k 1 . 5 5 1 . 0 0 4 . 7 9 0 . 1 1 0 . 5 5 2 . 0 6 0 . 0 7 1 . 0 4 1 . 2 3
W h i t i n g 0 . 3 2 2 . 3 4 0 . 0 0 0 . 0 0 0 . 1 0 0 . 4 0 0 . 0 7 0 . 2 0 0 . 4 1
T O TA L 2 7 0 6 7 . 5 6 6 . 3 1 . 3 3 1 2 . 3 2 3 . 8 4 . 2 1 1 3 8 3 4 9
In bold: mean contributors (>5%)* Predatory fish as described in the Commission Regulation (EC) No 78/2005 of 19 January 2005For certain species the different packaging are taken into account: Herring: fresh and canned, Mackerel: fresh, canned and smoked,Sardine: fresh and canned, Salmon: fresh and smoked, Tuna :fresh and canned, Anchovy: fresh and canned, Crab: fresh and canned,Haddock: fresh and smokedC O T = T B T + D B T + T P T + D O T; Tot diox=PCDD/F+DL-PCB
POISSON 4.3 GB.qxd 17.9.2006 20:21 Page 157

158 APPENDIX 6 : Lorient
Contributors to the recommendation for EPA and DHA and to the tolerable intake ofcontaminants (%) – All subjects, Lorient
OMEGA 3 TRACE ELEMENTS PERSISTENT ORGANIC POLLUTA N T SE PA + D H A M e H g C d P b O T C A sT A s i n o r g Tot diox i P C B
A n c h o v y 1 6 . 3 0 . 5 9 1 . 9 4 0 . 0 9 0 . 3 5 0 . 1 3 0 . 0 8 1 . 2 2 2 . 9 0
Angler fish* 0 . 2 3 2 . 9 8 0 . 0 0 0 . 0 0 0 . 0 5 0 . 6 6 0 . 0 3 0 . 1 4 0 . 2 7
C a t s h a r k * 0 . 0 7 0 . 4 0 0 . 0 0 0 . 0 0 0 . 0 0 0 . 2 4 0 . 0 0 0 . 0 1 0 . 0 3
C o c k l e 0 . 2 0 0 . 1 9 0 . 0 7 0 . 0 0 0 . 1 3 0 . 0 6 0 . 1 1 0 . 1 9 0 . 1 7
C o d 1 . 8 6 6 . 2 1 0 . 0 2 0 . 0 0 0 . 1 0 1 . 5 2 0 . 0 8 1 . 0 6 2 . 1 7
C r a b 4 . 8 0 0 . 9 7 3 0 . 5 1 0 . 0 2 0 . 0 5 1 . 0 7 0 . 5 4 4 . 8 7 3 . 1 7
D a b 0 . 2 7 3 . 8 0 0 . 0 0 0 . 0 0 0 . 0 3 1 . 7 1 0 . 0 8 0 . 1 7 0 . 4 4
E e l * 0 . 5 3 0 . 4 3 0 . 0 0 0 . 0 0 0 . 0 0 0 . 0 0 0 . 0 0 4 . 1 6 2 3 . 6 3E m p e r o r * 1 . 5 1 3 . 0 3 0 . 0 1 0 . 0 0 0 . 0 3 0 . 0 2 0 . 0 1 3 . 7 6 6 . 1 5
Fish soup 3 . 4 3 0 . 4 4 0 . 2 1 0 . 0 3 0 . 1 0 0 . 1 9 0 . 1 6 0 . 7 9 1 . 2 9
G o a t f i s h 4 . 3 6 1 . 2 8 0 . 0 0 0 . 0 0 0 . 0 0 0 . 7 5 0 . 1 5 2 . 6 0 5 . 1 2
Great scallop 1 . 7 7 3 . 8 1 0 . 0 0 0 . 0 2 0 . 3 8 0 . 2 2 0 . 1 2 0 . 4 5 0 . 6 9
Grenadier / hoki* 0 . 4 3 0 . 7 0 0 . 0 0 0 . 0 0 0 . 0 5 0 . 3 8 0 . 0 2 0 . 2 8 1 . 4 5
G u r n a r d 0 . 1 0 0 . 9 7 0 . 0 0 0 . 0 0 0 . 0 0 0 . 1 9 0 . 0 2 1 . 0 6 2 . 0 4
H a d d o c k 0 . 1 4 0 . 4 7 0 . 0 0 0 . 0 0 0 . 0 3 0 . 3 3 0 . 0 2 0 . 0 7 0 . 1 7
H a k e 0 . 9 9 1 3 . 7 0 . 0 0 0 . 0 1 0 . 2 8 2 . 0 6 0 . 2 2 1 . 2 7 3 . 8 0
H a l i b u t * 2 . 2 6 0 . 3 4 0 . 0 0 0 . 0 0 0 . 0 5 0 . 1 0 0 . 0 1 1 . 1 5 1 . 1 8
H e r r i n g 9 . 5 1 0 . 2 1 0 . 0 0 0 . 0 0 0 . 0 3 0 . 0 3 0 . 0 1 0 . 4 4 0 . 6 5
John dory 0 . 4 1 0 . 2 7 0 . 1 0 0 . 0 1 0 . 0 3 0 . 0 3 0 . 0 0 0 . 3 1 0 . 9 1
L i n g 0 . 4 7 9 . 8 9 0 . 1 0 0 . 0 0 0 . 0 8 0 . 4 8 0 . 0 4 0 . 2 2 0 . 7 3M a c k e r e l 2 5 . 3 2 . 3 0 0 . 1 4 0 . 0 1 0 . 2 8 0 . 5 2 0 . 2 9 7 . 1 3 1 4 . 8
M u s s e l 2 . 1 0 1 . 0 8 0 . 2 7 0 . 1 7 0 . 0 5 1 . 9 0 0 . 2 1 1 . 4 2 1 . 2 6
O y s t e r 1 . 3 2 0 . 2 9 0 . 0 0 0 . 1 6 0 . 1 5 0 . 3 2 0 . 0 3 1 . 5 6 1 . 6 0
P a e l l a 4 . 3 5 0 . 0 3 0 . 1 7 0 . 0 4 0 . 1 0 0 . 0 3 0 . 0 4 0 . 2 6 0 . 2 3
P e r i w i n k l e 1 . 0 6 0 . 0 7 0 . 3 3 0 . 0 3 0 . 0 3 0 . 2 6 0 . 1 1 0 . 1 2 0 . 2 2
P i l c h a r d 1 . 3 8 0 . 0 4 0 . 0 1 0 . 0 0 0 . 0 0 0 . 0 2 0 . 0 1 0 . 3 2 0 . 3 9
P l a i c e 0 . 1 6 0 . 2 3 0 . 0 0 0 . 0 0 0 . 0 3 0 . 3 0 0 . 0 2 0 . 2 0 0 . 4 1
P o l l a c k 0 . 4 9 1 . 1 2 0 . 0 1 0 . 0 0 0 . 0 5 0 . 3 9 0 . 2 9 0 . 8 9 2 . 7 2
P o u t 0 . 1 0 0 . 8 1 0 . 0 0 0 . 0 0 0 . 0 0 0 . 3 2 0 . 0 4 0 . 1 1 0 . 2 3
R a y * 1 . 1 8 2 . 8 1 0 . 0 0 0 . 0 0 0 . 0 3 3 . 6 9 0 . 5 1 0 . 3 9 0 . 5 7
S a i t h e 2 . 3 5 3 . 8 2 3 . 7 6 0 . 5 8 0 . 1 5 0 . 4 6 0 . 1 8 1 . 0 1 2 . 4 1
S a l m o n 6 6 . 0 1 . 3 7 0 . 0 0 0 . 0 0 0 . 0 5 0 . 2 7 0 . 1 6 4 . 7 3 9 . 2 4
S a r d i n e 4 6 . 0 0 . 6 6 0 . 7 8 0 . 3 2 0 . 1 5 0 . 9 6 0 . 0 9 3 8 . 1 8 3 . 1S c a m p i 1 . 5 3 3 . 2 2 0 . 4 7 0 . 0 9 0 . 0 5 1 . 9 3 0 . 3 7 1 . 5 2 1 . 5 4
Sea bream* 6 . 2 6 1 . 3 5 0 . 0 0 0 . 0 0 0 . 1 3 0 . 3 0 0 . 3 9 9 . 1 9 2 8 . 8
S e a b a s s * 5 . 7 2 3 . 3 9 0 . 0 1 0 . 0 1 0 . 0 5 0 . 2 3 0 . 1 4 8 . 4 0 1 9 . 4
S h r i m p 1 . 6 4 1 . 7 5 0 . 0 8 0 . 0 0 0 . 2 5 0 . 2 2 0 . 0 7 0 . 9 5 0 . 5 5
S o l e 0 . 9 0 4 . 5 3 0 . 0 0 0 . 0 1 0 . 1 0 2 . 7 5 0 . 0 5 0 . 7 3 2 . 8 9
Spider crab 2 . 8 4 0 . 4 1 1 . 2 0 0 . 0 4 0 . 0 3 1 . 9 4 0 . 2 3 6 . 2 5 5 . 1 1
S q u i d 0 . 4 1 0 . 4 2 0 . 0 0 0 . 0 1 0 . 0 8 0 . 5 2 0 . 0 2 0 . 5 0 1 . 0 3
S u r i m i 2 . 4 3 0 . 3 2 0 . 0 3 0 . 0 0 0 . 2 5 0 . 0 3 0 . 0 2 0 . 0 6 0 . 5 2
S w i m c r a b 2 . 1 7 0 . 5 9 0 . 2 2 0 . 0 4 0 . 0 0 0 . 4 9 0 . 0 2 4 . 7 3 4 . 5 7
S w o r d f i s h * 2 . 8 0 5 . 0 0 0 . 0 8 0 . 0 0 0 . 1 8 0 . 0 4 0 . 0 6 0 . 3 4 0 . 5 1
Ta r a m a 2 . 2 3 0 . 0 1 0 . 0 0 0 . 0 0 0 . 0 0 0 . 0 0 0 . 0 0 0 . 0 5 0 . 1 5
Tu n a * 7 . 3 5 1 1 . 4 0 . 2 9 0 . 0 1 0 . 9 0 0 . 5 4 0 . 0 7 0 . 5 2 1 . 6 0W h i t i n g 0 . 3 7 2 . 8 9 0 . 0 0 0 . 0 0 0 . 0 8 0 . 7 1 0 . 1 3 0 . 9 7 2 . 6 0
T O TA L 2 3 8 1 0 1 4 0 . 8 1 . 7 4 4 . 8 8 2 9 . 3 5 . 2 7 1 1 5 2 4 3
In bold: mean contributors (>5%)* Predatory fish as described in the Commission Regulation (EC) No 78/2005 of 19 January 2005For certain species the different packaging are taken into account: Herring: fresh and canned, Mackerel: fresh, canned and smoked,Sardine: fresh and canned, Salmon: fresh and smoked, Tuna :fresh and canned, Anchovy: fresh and canned, Crab: fresh and canned,Haddock: fresh and smokedC O T = T B T + D B T + T P T + D O T; Tot diox=PCDD/F+DL-PCB
POISSON 4.3 GB.qxd 17.9.2006 20:21 Page 158

APPENDIX 6 : La Rochelle 159
Contributors to the recommendation for EPA and DHA and to the tolerable intake ofcontaminants (%) – All subjects, La Rochelle
OMEGA 3 TRACE ELEMENTS PERSISTENT ORGANIC POLLUTA N T SE PA + D H A M e H g C d P b O T C A sT A s i n o r g Tot diox i P C B
A n c h o v y 1 0 . 9 0 . 4 0 1 . 2 0 0 . 0 6 0 . 2 3 0 . 0 9 0 . 0 5 0 . 9 0 2 . 1 8
Angler fish* 0 . 2 7 1 . 9 9 0 . 0 0 0 . 0 0 0 . 0 3 0 . 4 5 0 . 0 2 0 . 1 0 0 . 1 2
Calico scallop 2 . 2 7 0 . 2 3 8 . 2 0 0 . 1 9 0 . 2 3 0 . 3 5 0 . 0 3 1 . 0 6 2 . 2 7
C a t s h a r k * 0 . 3 6 2 . 4 8 0 . 0 0 0 . 0 0 0 . 0 5 1 . 3 2 0 . 0 5 0 . 0 8 0 . 8 3
C o c k l e 0 . 0 5 0 . 0 1 0 . 0 2 0 . 0 1 0 . 0 3 0 . 0 2 0 . 0 2 0 . 0 2 0 . 0 2
C o d 2 . 8 9 5 . 7 3 0 . 0 0 0 . 0 0 0 . 4 3 1 . 5 5 0 . 1 1 1 . 3 7 3 . 1 9
C r a b 4 . 8 6 0 . 5 2 0 . 1 4 0 . 0 0 0 . 0 3 0 . 6 1 0 . 0 8 1 . 6 6 1 . 1 1
Cuttle fish 1 . 5 9 1 . 4 1 0 . 0 6 0 . 0 0 0 . 0 8 0 . 7 4 0 . 0 6 0 . 0 8 0 . 5 6
D a b 0 . 5 8 0 . 3 5 0 . 0 0 0 . 0 0 0 . 0 3 0 . 3 0 0 . 0 1 0 . 6 7 0 . 7 4
E e l * 3 . 1 5 2 . 7 0 0 . 0 1 0 . 0 1 0 . 0 8 0 . 0 3 0 . 0 1 2 6 . 3 1 4 9
E m p e r o r * 1 . 3 9 2 . 4 2 0 . 0 0 0 . 0 2 0 . 0 3 0 . 0 3 0 . 0 1 3 . 3 8 7 . 3 1
Fish soup 4 . 0 7 0 . 4 9 0 . 2 4 0 . 0 3 0 . 1 3 0 . 2 1 0 . 1 8 0 . 8 9 1 . 4 5
G o a t f i s h 3 . 2 1 1 . 8 0 0 . 0 0 0 . 0 0 0 . 0 5 0 . 8 3 0 . 0 8 2 . 8 1 4 . 0 0
Great scallop 2 . 1 6 0 . 3 8 0 . 2 5 0 . 2 0 0 . 3 5 0 . 3 6 0 . 0 6 2 . 5 1 7 . 8 2
Grenadier / hoki* 0 . 9 5 4 . 3 8 0 . 0 1 0 . 0 0 0 . 1 0 0 . 3 4 0 . 0 3 0 . 2 7 0 . 7 3
H a d d o c k 0 . 2 7 1 . 3 1 0 . 0 1 0 . 0 0 0 . 0 3 0 . 1 4 0 . 0 2 0 . 4 4 0 . 9 5
H a k e 0 . 9 7 4 . 7 7 0 . 0 0 0 . 0 5 0 . 1 3 0 . 5 7 0 . 0 5 2 . 2 7 6 . 0 8
H a l i b u t * 1 2 . 0 1 . 5 6 0 . 0 0 0 . 0 0 0 . 0 3 0 . 1 8 0 . 0 2 2 . 2 3 5 . 5 5
H e r r i n g 1 0 . 3 0 . 1 9 0 . 0 0 0 . 0 0 0 . 0 3 0 . 0 3 0 . 0 1 0 . 3 8 0 . 5 7
L i n g 0 . 4 6 0 . 8 7 0 . 0 0 0 . 0 0 0 . 0 5 0 . 3 2 0 . 0 3 0 . 2 7 0 . 7 3
M a c k e r e l 1 8 . 3 1 . 4 9 0 . 1 5 0 . 0 1 0 . 3 3 0 . 2 6 0 . 0 9 3 . 5 9 8 . 0 8
M u s s e l 2 . 8 9 1 . 3 8 0 . 5 1 0 . 2 7 0 . 1 8 0 . 2 9 0 . 0 7 0 . 5 2 0 . 4 8
O y s t e r 2 . 3 5 0 . 4 4 1 . 5 1 0 . 1 9 0 . 1 5 0 . 3 1 0 . 4 7 3 . 0 8 3 . 9 3
P a e l l a 2 . 7 8 0 . 0 2 0 . 1 0 0 . 0 3 0 . 0 8 0 . 0 2 0 . 0 2 0 . 1 6 0 . 1 4
P e r i w i n k l e 0 . 0 4 0 . 0 2 0 . 1 3 0 . 0 2 0 . 0 3 0 . 1 3 0 . 1 1 0 . 0 5 0 . 0 6
P i l c h a r d 1 . 2 3 0 . 0 3 0 . 0 0 0 . 0 0 0 . 0 0 0 . 0 1 0 . 0 1 0 . 2 9 0 . 3 5
P o l l a c k 0 . 2 4 0 . 9 8 0 . 0 0 0 . 0 0 0 . 0 5 0 . 1 9 0 . 0 1 0 . 1 3 0 . 2 8
R a y * 1 . 3 1 4 . 2 5 1 . 1 0 0 . 2 1 0 . 0 8 3 . 9 9 0 . 1 8 0 . 5 8 0 . 5 7
S a i t h e 8 . 1 1 1 . 7 9 0 . 0 4 0 . 0 0 0 . 7 5 0 . 2 9 0 . 0 3 0 . 6 7 0 . 9 5
S a l m o n 6 8 . 8 1 . 5 1 0 . 0 0 0 . 0 0 0 . 1 8 0 . 2 6 0 . 0 8 1 0 . 1 1 5 . 9
S a r d i n e 1 9 . 1 6 . 6 5 0 . 6 0 0 . 2 7 0 . 3 3 0 . 7 9 0 . 1 0 2 8 . 2 5 9 . 1
S c a m p i 0 . 8 9 3 . 0 8 0 . 1 6 0 . 0 3 0 . 0 8 0 . 3 3 0 . 3 3 0 . 7 8 0 . 8 5
Sea bream* 4 . 5 7 3 . 2 4 0 . 0 0 0 . 0 0 0 . 1 0 0 . 3 2 0 . 0 5 6 . 0 2 1 2 . 3
S e a b a s s * 2 . 4 2 3 . 1 8 0 . 0 0 0 . 0 0 0 . 1 8 0 . 2 8 0 . 0 5 6 . 9 8 1 7 . 2
S h r i m p 1 . 7 0 1 . 0 7 0 . 0 0 0 . 0 0 0 . 1 0 0 . 1 0 0 . 0 6 0 . 2 4 0 . 3 8
S o l e 1 . 2 8 7 . 1 4 0 . 0 6 0 . 0 3 0 . 0 5 2 . 5 7 0 . 0 6 0 . 7 5 4 . 8 9
S q u i d 0 . 8 4 0 . 5 3 0 . 4 6 0 . 0 0 0 . 1 5 0 . 4 3 0 . 0 1 0 . 9 7 1 . 9 7
S u r i m i 2 . 8 6 0 . 3 7 0 . 0 4 0 . 0 0 0 . 2 8 0 . 0 4 0 . 0 2 0 . 0 7 0 . 5 9
S w o r d f i s h * 6 . 0 3 2 . 8 7 0 . 0 6 0 . 0 0 0 . 2 0 0 . 0 2 0 . 0 1 0 . 2 4 0 . 1 8
Ta r a m a 1 . 4 1 0 . 0 1 0 . 0 0 0 . 0 0 0 . 0 0 0 . 0 0 0 . 0 0 0 . 0 3 0 . 0 9
Tu n a * 8 . 4 3 2 1 . 6 0 . 1 9 0 . 0 0 1 . 1 8 0 . 2 7 0 . 0 7 3 . 6 7 9 . 4 6
W h e l k 0 . 9 7 0 . 5 1 6 . 3 8 0 . 1 3 0 . 0 5 1 . 3 8 0 . 2 5 2 . 1 2 0 . 6 1
W h i t i n g 0 . 4 3 1 . 7 2 0 . 0 1 0 . 0 0 0 . 0 0 0 . 2 4 0 . 0 5 0 . 1 3 0 . 2 2
T O TA L 2 1 9 9 7 . 9 2 1 . 7 1 . 7 8 6 . 5 5 2 1 . 0 3 . 0 5 1 1 7 3 3 4
In bold: mean contributors (>5%)* Predatory fish as described in the Commission Regulation (EC) No 78/2005 of 19 January 2005For certain species the different packaging are taken into account: Herring: fresh and canned, Mackerel: fresh, canned and smoked,Sardine: fresh and canned, Salmon: fresh and smoked, Tuna :fresh and canned, Anchovy: fresh and canned, Crab: fresh and canned,Haddock: fresh and smokedC O T = T B T + D B T + T P T + D O T; Tot diox=PCDD/F+DL-PCB
POISSON 4.3 GB.qxd 17.9.2006 20:21 Page 159

160 APPENDIX 6 : Toulon
Contributors to the recommendation for EPA and DHA and to the tolerable intake ofcontaminants (%) – All subjects, Toulon
OMEGA 3 TRACE ELEMENTS PERSISTENT ORGANIC POLLUTA N T SE PA + D H A M e H g C d P b O T C A sT A s i n o r g Tot diox i P C B
A n c h o v y 2 0 . 6 0 . 7 9 3 . 6 9 0 . 1 7 0 . 6 0 0 . 1 8 0 . 1 2 1 . 0 2 1 . 9 6
Angler fish* 0 . 1 7 2 . 5 3 0 . 0 0 0 . 0 1 0 . 1 3 0 . 4 7 0 . 0 2 0 . 3 1 1 . 8 0
C a t s h a r k * 0 . 1 9 2 . 6 8 0 . 0 3 0 . 0 0 0 . 0 5 1 . 8 2 0 . 0 5 0 . 0 5 0 . 2 1
C o d 2 . 7 7 3 . 9 9 0 . 0 0 0 . 0 3 0 . 3 8 1 . 1 9 0 . 1 2 1 . 3 1 1 . 9 7
C r a b 2 . 7 1 1 . 2 3 0 . 3 5 0 . 0 1 0 . 0 5 0 . 0 9 0 . 0 7 0 . 0 9 0 . 0 5
Cuttle fish 0 . 2 7 0 . 0 7 0 . 1 6 0 . 0 9 0 . 0 3 0 . 0 4 0 . 0 3 0 . 2 0 0 . 4 7
D a b 1 . 4 4 0 . 6 6 0 . 0 0 0 . 0 0 0 . 0 0 1 . 9 5 0 . 0 8 0 . 4 9 0 . 4 6
E e l * 0 . 5 2 0 . 5 0 0 . 0 0 0 . 0 0 0 . 0 0 0 . 0 1 0 . 0 0 4 . 8 4 2 7 . 5
E m p e r o r * 1 . 3 8 1 . 7 5 0 . 0 0 0 . 0 0 0 . 0 5 0 . 0 2 0 . 0 0 1 . 6 0 3 . 0 2
Fish soup 4 . 2 4 0 . 5 3 0 . 2 6 0 . 0 3 0 . 1 3 0 . 2 3 0 . 2 0 0 . 9 6 1 . 5 7
G o a t f i s h 3 . 7 4 1 . 7 2 0 . 0 0 0 . 0 0 0 . 0 0 1 . 1 6 0 . 0 4 4 . 1 5 7 . 0 1
Great scallop 1 . 2 0 0 . 3 9 2 . 7 2 0 . 1 0 0 . 2 3 0 . 7 4 0 . 6 5 0 . 2 2 0 . 3 2
Grenadier / hoki* 0 . 1 7 0 . 3 7 0 . 0 1 0 . 0 0 0 . 0 3 0 . 0 8 0 . 0 1 0 . 0 8 0 . 3 8
H a d d o c k 0 . 1 1 0 . 0 1 0 . 0 0 0 . 0 0 0 . 0 0 0 . 0 1 0 . 0 0 0 . 0 1 0 . 0 1
H a k e 0 . 6 9 0 . 8 5 0 . 0 0 0 . 0 1 0 . 0 5 0 . 0 8 0 . 0 1 0 . 1 6 0 . 2 2
H a l i b u t * 7 . 2 6 0 . 1 0 0 . 3 4 0 . 2 9 1 . 1 3 0 . 3 8 0 . 0 3 2 . 3 1 2 . 6 2
H e r r i n g 6 . 7 5 0 . 1 9 0 . 0 0 0 . 0 0 0 . 0 3 0 . 0 3 0 . 0 1 0 . 3 9 0 . 5 7
John dory 0 . 2 2 0 . 8 2 0 . 0 0 0 . 0 0 0 . 1 5 0 . 0 3 0 . 0 2 0 . 2 2 0 . 5 7
L i n g 0 . 3 3 4 . 9 3 0 . 0 0 0 . 0 0 0 . 0 5 0 . 3 2 0 . 0 1 0 . 3 1 0 . 7 7
L o b s t e r 0 . 3 6 0 . 5 6 0 . 6 0 0 . 0 0 0 . 0 0 0 . 2 0 0 . 0 3 0 . 9 0 0 . 6 1
M a c k e r e l 1 9 . 3 1 . 4 9 0 . 1 2 0 . 0 1 0 . 3 0 0 . 1 7 0 . 0 4 3 . 0 7 1 0 . 8
M u s s e l 0 . 7 9 0 . 8 1 0 . 0 0 0 . 0 0 0 . 0 5 0 . 2 7 0 . 0 3 0 . 8 0 2 . 0 5
O c t o p u s 0 . 3 7 2 . 9 8 0 . 1 0 0 . 0 5 0 . 1 0 2 . 6 3 0 . 3 4 0 . 3 3 0 . 6 1
O y s t e r 0 . 4 4 0 . 0 2 0 . 0 8 0 . 0 0 0 . 2 0 0 . 1 8 0 . 1 4 0 . 5 6 0 . 6 8
P a e l l a 4 . 6 1 0 . 0 3 0 . 1 8 0 . 0 5 0 . 1 0 0 . 0 3 0 . 0 4 0 . 2 8 0 . 2 4
P i l c h a r d 0 . 6 4 0 . 0 2 0 . 0 0 0 . 0 0 0 . 0 0 0 . 0 1 0 . 0 1 0 . 1 7 0 . 2 1
R a y * 1 . 0 3 1 . 3 8 0 . 0 0 0 . 0 0 0 . 1 0 0 . 8 7 0 . 0 2 0 . 5 3 1 . 0 0
S a i t h e 2 . 4 1 0 . 9 8 0 . 0 1 0 . 0 0 0 . 5 8 0 . 3 4 0 . 1 2 0 . 4 8 0 . 9 6
S a l m o n 5 0 . 0 0 . 8 8 0 . 0 0 0 . 0 1 0 . 2 0 0 . 2 8 0 . 0 5 5 . 1 2 1 0 . 6
S a r d i n e 1 3 . 3 2 . 5 0 0 . 6 5 0 . 2 6 0 . 2 0 0 . 8 8 0 . 3 7 1 0 . 5 3 5 . 9
Scorpion fish 1 . 5 9 1 . 6 3 0 . 0 0 0 . 0 0 0 . 0 3 0 . 0 7 0 . 0 1 1 . 7 9 3 . 0 4
Sea bream* 1 9 . 3 3 . 7 6 0 . 0 0 0 . 0 0 0 . 2 0 0 . 8 3 0 . 1 1 7 . 3 5 1 2 . 2
Sea urchin 1 . 2 8 0 . 1 3 0 . 6 6 0 . 4 2 0 . 4 3 0 . 6 6 1 . 0 6 1 . 2 0 1 . 3 6
S e a b a s s * 1 5 . 8 1 . 6 5 0 . 0 0 0 . 0 2 1 . 3 8 0 . 2 0 0 . 0 5 8 . 0 7 2 2 . 5
S h r i m p 0 . 6 8 1 . 0 5 0 . 0 7 0 . 0 2 0 . 0 5 0 . 2 9 0 . 0 2 0 . 1 5 0 . 0 9
S o l e 0 . 9 3 6 . 2 8 0 . 0 0 0 . 0 1 0 . 1 8 2 . 4 3 0 . 0 3 0 . 5 9 3 . 6 5
S q u i d 1 . 3 3 0 . 7 5 0 . 2 2 0 . 0 1 0 . 0 8 0 . 0 5 0 . 0 2 0 . 0 8 0 . 1 3
S u r i m i 4 . 9 9 0 . 6 7 0 . 0 7 0 . 0 1 0 . 5 0 0 . 0 7 0 . 0 4 0 . 1 3 1 . 0 7
S w o r d f i s h * 1 0 . 6 1 3 . 9 0 . 2 3 0 . 0 0 0 . 0 5 0 . 0 4 0 . 0 1 0 . 5 4 1 . 5 9
Ta r a m a 3 . 6 2 0 . 0 1 0 . 0 0 0 . 0 0 0 . 0 0 0 . 0 1 0 . 0 1 0 . 0 9 0 . 2 8
Tu n a * 9 . 6 5 2 3 . 8 0 . 3 6 0 . 0 1 1 . 0 5 0 . 6 1 0 . 0 6 0 . 5 5 1 . 8 9
W h e l k 0 . 2 1 0 . 2 5 0 . 0 8 0 . 0 0 0 . 0 3 0 . 4 4 0 . 0 6 0 . 2 9 0 . 2 7
W h i t i n g 1 . 4 0 1 1 . 0 0 . 0 0 0 . 0 1 0 . 2 3 0 . 4 3 0 . 0 9 1 . 9 2 8 . 1 5
T O TA L 2 2 0 1 0 1 1 1 . 0 1 . 6 1 9 . 1 3 2 0 . 8 4 . 2 2 6 4 . 2 1 7 1
In bold: mean contributors (>5%)* Predatory fish as described in the Commission Regulation (EC) No 78/2005 of 19 January 2005For certain species the different packaging are taken into account: Herring: fresh and canned, Mackerel: fresh, canned and smoked,Sardine: fresh and canned, Salmon: fresh and smoked, Tuna :fresh and canned, Anchovy: fresh and canned, Crab: fresh and canned,Haddock: fresh and smokedC O T = T B T + D B T + T P T + D O T; Tot diox=PCDD/F+DL-PCB
POISSON 4.3 GB.qxd 17.9.2006 20:21 Page 160

CALIPSOFish and seafood consumption studyand biomarker of exposure totrace elements, pollutants and omega 3.
Issue date :August 2006
Design-production :Pascal Devriendt - 02 communication
Rue Charles Humbert 9 - 1205 Genève
Printing :Mâcon Imprimerie
Photo Crédit :Véronique Sirot - AFSSA


![PROGRESSREPORT 2010 - World organisation for … · ANMV Agence Nationale du Médicament Vétérinaire [ANSES] ANSES Agence Nationale de Sécurité Sanitaire (formerly AFSSA) [France]](https://static.fdocuments.us/doc/165x107/5b9cea3209d3f2321b8d916e/progressreport-2010-world-organisation-for-anmv-agence-nationale-du-medicament.jpg)