The Burden of Herpes Zoster and Postherpetic Neuralgia in ...
146
The Burden of Herpes Zoster and Postherpetic Neuralgia in Manitoba A 15 YEAR POPULATION BASED COHORT STUDY USING ADMINISTRATIVE HEALTHCARE DATA BY KEVIN FRIESEN A thesis submitted to the Faculty of Graduate Studies of the University of Manitoba in partial fulfillment of the requirements of the degree of Master of Science College of Pharmacy Rady Faculty of Health Sciences University of Manitoba Winnipeg, Manitoba, Canada Copyright © 2016 by Kevin Friesen
Transcript of The Burden of Herpes Zoster and Postherpetic Neuralgia in ...

The Burden of Herpes Zoster and Postherpetic Neuralgia in Manitoba
A 15 YEAR POPULATION BASED COHORT STUDY USING
ADMINISTRATIVE HEALTHCARE DATA
BY KEVIN FRIESEN
A thesis submitted to the Faculty of Graduate Studies of
the University of Manitoba
in partial fulfillment of the requirements of the degree of
Master of Science
College of Pharmacy
Rady Faculty of Health Sciences
University of Manitoba
Winnipeg, Manitoba, Canada
Copyright © 2016 by Kevin Friesen

ii
Permission has been granted to the Library of The University of Manitoba to lend or sell
copies of this thesis, to the National Library of Canada to microfilm this thesis and to
lend or sell copies of the film, and to University Microfilm Inc. to publish an abstract of
this thesis.
The author reserves other publication rights, and neither this thesis nor extensive
extracts from it may be printed or otherwise reproduced without the author’s written
permission.

iii
ABSTRACT
Herpes zoster (HZ) is a common disease, having a lifetime prevalence of 20%-30%,
with 10% of cases converting to postherpetic neuralgia (PHN). Treating these
conditions results in a significant burden to the healthcare system. We hypothesized
that the growth and aging of our population is causing this burden to rise.
Administrative healthcare data from April 1997 to April 2014 were used to conduct a
burden of disease study of HZ and PHN in Manitoba, Canada. Expenditures were
grouped into three domains: pharmacotherapy, medical care, and hospitalization.
Episode and total provincial costs were determined within each domain by year. HZ
epidemiology, conversion to PHN, and drug utilization were examined. Trend analysis
was performed for all results.
Changes were found within each domain. Key medications became generic and the
resulting reduction in price offset increased drug utilization leaving drug-episode costs
unchanged. Mean per-episode medical costs increased moderately. However,
increases in HZ cases drove total annual expenditures within these domains up. A
dramatic reduction in HZ-related hospitalizations counteracted these trends, resulting in
no change in overall burden of disease. The total healthcare cost of treating HZ and
PHN in Manitoba in 2011/12 was $1,997,183, only slightly less than the $2,095,633
burden determined for 1997/98, the first study year.
It is unclear if hospitalization rates can continue to offset these other trends, as there
may be a floor to how low these rates can drop. In this case, the long-term trends in
iv
drug and medical costs, amplified by changes in population demographics and the
recent jump in incidence rates, may lead the burden of HZ to rise in the future.

v
ACKNOWLEDGEMENTS
I would like to acknowledge the patience, guidance, encouragement, and deep support
provided to me by my advisor, Dr Shawn Bugden.
I want to express my deepest appreciation for the members of my advisory committee,
Dr. Jamie Falk, Dr. Silvia Alessi-Severini, and Dr. Dan Chateau. Their experience,
guidance, insight, and feedback was invaluable.
I want to acknowledge my family for all they have done for me, thanks Mom, Ken,
Byron, and Sylvester. Additionally, I want to acknowledge the role played by my fellow
students. I would especially like to thank Kevin Hamilton and Juliano Amador da Silva
for their friendship, encouragement, and humour.
A special thanks goes to those at the Manitoba Centre for Health Policy, in particular,
Heather Prior and Charles Burchill, for the answering my many SAS and analysis
related questions.
Finally, I would like to acknowledge the financial support of Merck Canada who provided
the funding for my research

vi
DEDICATION
This thesis is dedicated to my Dad.

vii
THESIS PREFACE
This thesis has been written in a grouped manuscript style, sometimes referred to as a
sandwich thesis. This style of thesis is comprised of several research papers intended
for publication in peer reviewed journals.
This thesis is comprised of three papers looking at the burden of herpes zoster and
postherpetic neuralgia in Manitoba. They are preceded by two chapters of background
information, and a third chapter which provides a more detailed explanation on the
foundational methods used to construct the cohort and define episodes and costs.
Following this are the three aforementioned papers presenting the primary results. The
final chapter summarizes the findings of the thesis and discusses their implications.

viii
TABLE OF CONTENTS
Abstract ........................................................................................................................... iii
Acknowledgements ......................................................................................................... v
Dedication .......................................................................................................................vi
Thesis Preface ............................................................................................................... vii
Table of Contents .......................................................................................................... viii
List of Tables ................................................................................................................. xiii
List of Figures ................................................................................................................ xiv
List of Abbreviations .......................................................................................................xv
Chapter 1. Herpes Zoster and Postherpetic Neuralgia ............................................ 1
1.1. Thesis Introduction ............................................................................................. 1
1.2. Herpes Zoster Pathogenesis .............................................................................. 2
1.3. Symptoms of Herpes Zoster............................................................................... 4
1.4. Treatment ........................................................................................................... 6
1.4.1. Antiviral Treatment of Herpes Zoster ........................................................... 6
1.4.2. Treatment of Zoster Associated Pain and Postherpetic Neuralgia. ............. 7
1.5. Varicella Zoster Virus Vaccines .......................................................................... 9
1.5.1. Varicella Zoster Vaccine (Varivax®) ............................................................ 9
1.5.2. Herpes Zoster Vaccine .............................................................................. 10
1.5.3. Long Term Effects of Varicella and Herpes Zoster Vaccines on HZ Rates 13

ix
Chapter 2. Burden of Disease Analysis ................................................................. 15
2.1. Introduction to Burden of Disease Analysis ...................................................... 15
2.5. Review of the Zoster Burden of Disease Literature .......................................... 20
2.5.1. Epidemiology of Herpes Zoster and Postherpetic Neuralgia ..................... 20
2.5.2. Economic Burden ...................................................................................... 23
Chapter 3. Project Outline – Methods and Objectives ........................................... 26
3.1. Study Objectives .............................................................................................. 26
3.2. Methodology Overview ..................................................................................... 27
3.3. Study Methodology .......................................................................................... 27
3.3.1. Data Sources ............................................................................................. 28
3.3.2. Approvals ................................................................................................... 30
3.4. Analytical Methods ........................................................................................... 30
3.4.1. Episode Definition ...................................................................................... 31
3.4.2. Exclusion Criteria ....................................................................................... 32
3.4.3. Analysis Time Frame ................................................................................. 33
3.4.4. Determining Incident Drug Class Use ........................................................ 34
3.4.5. Diagnosis of Post-Herpetic Neuralgia ........................................................ 35
3.4.6. Cost Determination .................................................................................... 37
3.4.7. Additional Methods .................................................................................... 37

x
Chapter 4. The Changing Landscape of the Antiviral Treatment of Herpes Zoster: A
17-Year Population-Based Cohort Study ...................................................................... 38
Chapter Introduction ...................................................................................................... 38
4.1. Manuscript Cover Page .................................................................................... 39
4.2. Abstract ............................................................................................................ 40
4.3. Introduction ...................................................................................................... 42
4.4. Methods ........................................................................................................... 43
4.5. Results ............................................................................................................. 46
4.6. Discussion ........................................................................................................ 48
4.7. Conclusion ....................................................................................................... 51
4.8. Acknowledgments ............................................................................................ 52
4.9. Figures and Tables .......................................................................................... 53
4.10. References ................................................................................................... 57
Chapter 5. Price of Pain: Population Based Cohort Burden of Disease Analysis of
Medication Cost in Herpes Zoster and Postherpetic Neuralgia ..................................... 60
5.1. Chapter Introduction ......................................................................................... 60
5.2. Manuscript Cover Page .................................................................................... 61
5.3. Abstract ............................................................................................................ 62
5.4. Background ...................................................................................................... 64
5.5. Methods ........................................................................................................... 66

xi
5.6. Results ............................................................................................................. 69
5.7. Discussion ........................................................................................................ 71
5.8. Acknowledgments ............................................................................................ 75
5.9. Tables and Figures .......................................................................................... 76
5.10. References ................................................................................................... 81
Chapter 6. Cost of Shingles: Population Based Burden of Disease Analysis of
Herpes Zoster and Postherpetic Neuralgia ................................................................... 85
6.1. Chapter Introduction ......................................................................................... 85
6.2. Manuscript Cover Page .................................................................................... 86
6.3. Abstract ............................................................................................................ 87
6.4. Background ...................................................................................................... 90
6.5. Methods ........................................................................................................... 91
6.6. Results ............................................................................................................. 95
6.6.1. Trends over time ........................................................................................ 95
6.6.2. Herpes Zoster Burden and Mean Costs 2011/12 ...................................... 97
6.7. Discussion ........................................................................................................ 99
6.8. Conclusion ..................................................................................................... 101
6.9. Acknowledgments .......................................................................................... 101
6.10. Tables and Figures ..................................................................................... 103
6.11. References ................................................................................................. 107

xii
Chapter 7. Thesis Conclusions ............................................................................ 112
Thesis References ...................................................................................................... 115
Appendix A: Age Distribution Tornado Plot ................................................................. 123
Appendix B: Research Approvals and Acknowledgements ......................................... 124
Acknowledgements .................................................................................................. 125
Manitoba Centre for Health Policy Approval Letter .................................................. 126
University of Manitoba Health Ethics Review Board Approval ................................. 127
University of Manitoba Health Ethics Review Board Annual Renewal ..................... 129
Manitoba Health Information Privacy Committee Approval ...................................... 131

xiii
LIST OF TABLES
Table 1.4-1: Antiviral treatment of herpes zoster. ............................................................ 6
Table 5.9-1 Total and cost per episode of treating herpes zoster related pain by year . 76
Table 5.9-2 Treatment of herpes zoster related pain by drug class. ............................. 77
Table 6.10-1 Overall health system burden of herpes zoster and postherpetic neuralgia
in Manitoba, Canada ................................................................................................... 103

xiv
LIST OF FIGURES
Figure 3.4-1 Episode definition ...................................................................................... 31
Figure 3.4-2 Study Time Frames ................................................................................... 33
Figure 3.4-3 Incident vs prevalent drug class use ......................................................... 35
Figure 3.4-4: Defining Continuous Drug-Class Use ...................................................... 36
Figure 4.8-1 Episodes and incidence of herpes zoster.................................................. 53
Figure 4.9-2 Antiviral treatment of herpes zoster over time ........................................... 54
Figure 4.9-3 Mean drug treatment cost per antiviral treated herpes zoster episodes .... 55
Figure 4.9-4 Summed costs of antiviral treatment of herpes zoster. ............................. 56
Figure 5.9-1 Mean cost of herpes zoster pain treatment by age. .................................. 78
Figure 5.9-2 Treatment of Post-Herpetic Neuralgia Episodes by Drug Class ................ 79
Figure 5.9-3 Distribution of days of drug treatment per episode .................................... 80
Figure 6.10-1 Piecewise regression on age adjusted incidence of herpes zoster ....... 104
Figure 6.10-2 Cost per episode of herpes zoster by treatment modality. .................... 105
Figure 6.10-3 Totals Costs of Treating Herpes Zoster by Modality. ............................ 106

xv
LIST OF ABBREVIATIONS
ATC – Anatomical therapeutic chemical classification system
BOD – Burden of disease
CI – Confidence interval
DALY – Disability adjusted life years
DPIN – Drug program information network
HALY – Health adjusted life years
HIPC – Health information privacy committee
HZ – Herpes zoster
ICD-9-CM – International classification of diseases, 9th revision, clinical modification
ICD-10-CA - – International classification of diseases, 9th revision, Canadian
enhancement
ICER – Incremental cost-effectiveness ratio
LTPT – Long-term persistence substudy
MCHP – Manitoba centre for health policy
NSAID – Nonsteroidal anti-inflammatory drug
PHN – Postherpetic neuralgia
PY – Person years
QALY – Quality adjusted life years
SPS – Shingles prevention study
STPS – Short-term persistence substudy
RCT – Randomized controlled trial
VZ – Varicella zoster
VZV – Varicella zoster virus
ZAP – Zoster associated pain
Chapter 1: Herpes Zoster and Postherpetic Neuralgia Page 1
Chapter 1. Herpes Zoster and Postherpetic Neuralgia
1.1. Thesis Introduction
HZ is an acute condition characterized by raised red rash, typically localized to band or
stripe like patterns, and significant amounts of pain. The lifetime prevalence at 60 years
of age is between 20% and 30% percent.1–4 Between 10 and 30 percent of zoster cases
will develop a chronic pain syndrome that persists despite resolution of viral infection
and dermatological symptoms.5,6 This syndrome is called post-herpetic neuralgia (PHN),
and can be a very difficult condition to treat, and can last from several months to over 2
years.7–10
While we have a good understanding of how HZ and PHN affects the lives of individuals
with the illness, when it comes to the burden at the healthcare system level we lack
reliable estimates of the current cost in the Canadian context. The high lifetime
prevalence of HZ, a high rate of medical consultation, the costs of pharmacological
treatment, occasional need for hospitalization, and the long duration of PHN coalesce to
produce a significant disease burden. Although a significant number of studies have
looked at the cost of HZ, the majority of these studies have been outside of a Canadian
context. The most recent Canadian studies use decade old data and are incomplete in
spectrum of costs considered.
In 2009, a vaccine for herpes zoster was introduced to the Canadian market. Due to its
relatively high costs and moderate efficacy it remains uncertain whether it should be
recommended for all adults at risk, if so who should receive it, and finally, who should
pay for it.

Chapter 1: Herpes Zoster and Postherpetic Neuralgia Page 2
It is the objective of this thesis project to enumerate the number of HZ cases in the
province, measure the mean and total costs, determine prescribing practices related to
its treatment, and examine trends in these parameters over an extended period of time.
This baseline data on the burden of HZ is an important and necessary background to
inform future public health decisions related to this disease, including the assessment of
the role and impact of the HZ vaccine introduced in 2009.
1.2. Herpes Zoster Pathogenesis
Herpes zoster is caused by reactivation of the varicella zoster virus (VZV). The initial
(primary) infection with VZV most commonly occurs in childhood and results in varicella
zoster (VZ), also known as chickenpox. In children, VZ is a relatively mild condition
resulting in widespread dermatological symptoms including fever, maculopapular sores,
itching, and malaise, and typically resolves within seven to fourteen days.11 While less
frequently seen, adult cases of VZ do occur and generally result in more severe
symptoms and complications.11 As the infection resolves the virus is cleared from the
skin and systemic circulation. However, viral infection of sensory neurons innervating
the affecting regions of the skin is not cleared. In these neurons the virus stops
replicating and enters a state of dormancy in dorsal root ganglia. Hidden from the
immune system in neuronal cell bodies, it persists for the lifetime of its host.12–15
VZV is one of the most highly infectious and readily transmissible common infectious
diseases. Prior to the introduction of a vaccine VZ was a near universal part of
childhood. In this pre-vaccine era over half of children 3 years of age and under would
test positive for VZV antibodies. This rate of infection rises to over 90% by age 15,

Chapter 1: Herpes Zoster and Postherpetic Neuralgia Page 3
exceeding 97% by age 40.16 Thus the pool of at-risk persons is virtually the entire
general population, excluding those vaccinated before becoming infected.
The immune system continuously works to supress the virus with the cell mediated arm
being key to continued suppression. Cell mediated immunity declines with age, and can
be suppressed by stress, diseases such as AIDs and immunological disorders, and
drugs such as chemotherapy or treatment with anti-TNF biological therapy.1,14,17
Reactivation of reservoirs of latent virus, typically occurring within a singular ganglia,
causes viral replication to restart. The virus then travels down the nerve tract causing a
fresh infection of the skin region (dermatome) innervated by that specific ganglia,
resulting in HZ.1,11,18 It is for this reason that HZ symptoms tend to be localized to
distinctive bands or stripes across the body
Postherpetic neuralgia (PHN) is a common complication of HZ, and is defined as pain
that persists for a prolonged period of time after rash healing. Different diagnostic
criteria specify various durations of pain, with a duration greater than 90 days post-
onset being one of the most common criteria used in epidemiological and burden of
disease studies. The pathogenesis of PHN is thought to be distinct and possibly related
to permanent pathophysiological changes in the sympathetic dorsal root ganglia
themselves.19,20 This is supported by post-mortem studies which have found atrophy
and other pathological changes in affected ganglia, but not in the contralateral
ganglia.8,19

Chapter 1: Herpes Zoster and Postherpetic Neuralgia Page 4
1.3. Symptoms of Herpes Zoster
The appearance of dermatological symptoms are frequently preceded by a prodromal
phase lasting several days, characterized by tingling, itching, paresthesia, pain, and
increased sensitivity to touch. At this early stage in illness, making a diagnosis can be
difficult as these symptoms are not unique to HZ, but are shared by a variety of
conditions.21
The prodromal phase ends with the appearance of a maculopapular rash, generally
within one, occasionally two, or rarely more, dermatomes. The left and right sides of the
body are separately innervated by sensory ganglia located on each side of the spinal
cord. Sensory neurons exit the spinal cord at each level meeting peripheral neurons in
the dorsal root ganglia. Bundles of these peripheral neurons then exit from the ganglia
and enervate distinct bands of skin, called dermatomes. It is this bilateral innervation to
specific dermatomes that leads to the localization of the rash. This distinct distribution is
the key symptom in the differential diagnosis of herpes zoster.9,22 The rash most
commonly affects the trunk, face, or scalp, but can occur anywhere on the surface of
the body. Itching and hypersensitivity to touch commonly affect these areas. The rash
usually crusts over in 7 to 10 days.
Pain is generally the most troubling symptom and the reason that HZ patients seek
medical care. This pain can be split into two basic types: zoster associated pain (ZAP),
and postherpetic neuralgia (PHN).
The term ZAP refers to the pain which occurs during an acute HZ episode, sometimes
beginning in the prodromal period before the appearance of visible dermatological

Chapter 1: Herpes Zoster and Postherpetic Neuralgia Page 5
symptoms, and is often the symptom that drives patients to seek medical care. Pain can
range in intensity from mild to severe; it is often described as burning, throbbing, or
lancinating; and can be continuous, intermittent, or evoked by touch.23 Skin becomes
sensitized to the point that even the feeling of clothing against skin can be unbearable.
It is important to aggressively manage ZAP, as increasing symptom severity has been
linked to increased risk of developing PHN.9,24 Complete resolution of rash and ZAP is
typically achieved within 4 to 6 weeks of onset.9,22
PHN is a neuropathic syndrome defined as HZ-related pain that continues despite
resolution of the acute HZ episode. It persists despite cessation of active viral infection,
potentially a result of sensory sensitization causing allodynia or damage to neuronal
bodies in the dorsal root ganglia.8 No standard diagnostic criteria exists for PHN,
specifically in regards to the duration of pain required with criteria ranging from 30 days
to 6 months appearing in the literature.7,825 Many of the recent epidemiological and
burden of disease studies have used pain at 90 days post-HZ onset as the diagnostic
criterion, a definition adopted for the purposes of this thesis.
Symptoms of PHN follow the same dermatomal distribution as the acute episode, a key
consideration for differential diagnosis. The duration of PHN is highly variable, lasting
from several months to years, with a typical episode lasting around one year. This pain
is often resistant to treatment with analgesic medications and may require the use of
antidepressant, anticonvulsant, or local anaesthetic drugs.7,8 A number of risk factors for
the development of PHN have been identified. These include female sex, increasing
age, severe pain at onset of zoster, prodromal symptoms, and increasing severity of
rash.7,8,19,20

Chapter 1: Herpes Zoster and Postherpetic Neuralgia Page 6
1.4. Treatment
1.4.1. Antiviral Treatment of Herpes Zoster
The early use of antiviral drugs is the most important component to the management of
a HZ episode. Current recommendations are for treatment to begin within 72 hours of
the onset of rash, as treatment effectiveness rapidly declines when delayed beyond this
point. Treatment should also be initiated in patients continuing to experience new lesion
formation.23,26,27
In Canada, three oral antiviral
drugs are currently approved by
Health Canada for the treatment
of HZ. These are famciclovir and
valacyclovir, both dosed three
times a day, and acyclovir which
is taken five times a day.23,26,27
The high frequency of acyclovir
dosing makes treatment
adherence difficult, which may
impact its effectiveness. The
introduction of valacyclovir and
famciclovir, with their easier
dosage regimen, has led to their
preferential usage and a decline
in the popularity of acyclovir.23 .
ACYCLOVIR
Normal Dose
800 mg 5 times per day Reduced Renal Function
CrCl 10-25 mL/min 800 mg every 8 hours
CrCl 0-10 mL/min 800 mg every 12 hours
Hemodialysis 250 mg after each session
FAMCICLOVIR
Normal dose
500 mg every 8 hours Reduced Renal Function
CrCl 40-59
mL/min 500 mg every 12 hours
CrCl 20-39
mL/min 500 mg once daily
CrCl <20 mL/min 250 mg once daily
Hemodialysis 250 mg after each session
VALACYCLOVIR
Normal dose
1000 mg every 8 hours Reduced Renal Function
CrCl 30-49 mL/min 1000 mg twice daily
CrCl 10-29 mL/min 1000 mg once daily CrCl <10 mL/min 500 mg once daily
Hemodialysis 250 mg after each session
Table 1.4-1: Antiviral treatment of herpes zoster.
Treatment should be initiated within 72 hours of
symptoms and continue for 7 days.
Abbreviations: CrCl, creatinine clearance.26,27,29

Chapter 1: Herpes Zoster and Postherpetic Neuralgia Page 7
As these drugs are renally excreted, dosage adjustment is required in patients with
renal impairment and are based on creatinine clearance (table 1.4-1). Immuno-
suppressed patients and those ill enough to require hospitalization may benefit from the
use of intravenous acyclovir. Parenteral formulations of valacyclovir and famciclovir are
not currently available.
Patients with acyclovir-resistant HZ should be treated with intravenous foscarnet.23
Cross-resistance has been shown to both valacyclovir, which is a pro-drug to acyclovir,
and famciclovir, which has the same mechanism of action.28
Prompt antiviral treatment can substantially decrease the duration and intensity of pain
and shorten the time to healing.7,8,26,29 While it has been suggested that antiviral
treatment decreases the likelihood of developing PHN, the evidence for this is
equivocal.25,29 Antiviral medication is ineffective in the treatment of established PHN as
no active viral infection process is present.30
1.4.2. Treatment of Zoster Associated Pain and Postherpetic Neuralgia.
It is important to aggressively manage ZAP not only to provide relief to the patient, but
also to decrease the risk of PHN as a correlation between early symptom severity and
an increased risk of PHN has been noted.9,23,24 The most important means to reduce
pain is through the early use of antiviral drugs. However, analgesic treatment is
frequently also required.
There are few good, randomized controlled trials for the treatment of ZAP. One
randomized controlled trial (RCT) of 87 subjects comparing oxycodone, gabapentin, and
placebo found that oxycodone, but not gabapentin, provide significant pain relief as

Chapter 1: Herpes Zoster and Postherpetic Neuralgia Page 8
compared to placebo treatment.20 Current recommendations are to treat ZAP
symptomatically with analgesics such as acetaminophen, ASA, non-steroidal anti-
inflammatory drugs (NSAIDs), local anaesthetics such as topical lidocaine. For severe
pain opioid analgesics may be use.9,22,23 In cases of pain not responsive to these agents
the use of anticonvulsants and antidepressants, agents typically used to treat PHN, are
commonly recommended despite a lack of good evidence.9,22
The use of corticosteroids in combination with antiviral drugs has been shown to be
effective in reducing ZAP.31 However, it should only be used concomitantly with antiviral
treatment, or after cessation of viral replication. It is frequently reported that the use of
steroids can reduce the conversion of ZAP to PHN. 21,26,31 However, the two placebo
controlled studies upon which this recommendation is based actually reported that the
combination of acyclovir and prednisone or prednisolone failed to show any benefit
beyond that conferred by treatment with acyclovir alone.32,33
PHN is a challenging condition to treat, and the effectiveness of pharmacological
therapy is limited. The Canadian Pain Society consensus statement on the treatment of
neuropathic pain recommends as first line therapy for PHN one of tricyclic
antidepressants (TCAs), gabapentin, or pregabalin.34 Opioids and topical lidocaine are
listed as second line alternatives. The European Federation of Neurological Societies
2010 treatment guidelines for neuropathic pain makes similar recommendations.
Opioids, while effective, are not recommended as first line therapy due to side effects,
the development of tolerance, and the risk of dependency.35 A variety of other drugs are
also discussed in the literature, including a number used for other forms of neuropathy,

Chapter 1: Herpes Zoster and Postherpetic Neuralgia Page 9
although their efficacy for PHN is disputed. These include duloxetine, carbamazepine,
venlafaxine valproic acid/divalproex sodium, tramadol, NSAIDs, and SSRIs.7,8,23,34–36
1.5. Varicella Zoster Virus Vaccines
1.5.1. Varicella Zoster Vaccine (Varivax®)
The VZV vaccine was first introduced to the Canadian market in 1998 and is indicated
for the prevention of VZ in individuals aged 12 months and older (Varivax™, Merck
Canada).37,38 The first universal, publically funded vaccination program in Canada was
implemented in Prince Edward Island in the year 2000, partly in response to a province-
wide varicella outbreak the year before.39 Similar programs were soon implemented
across Canada, with Manitoba adding the vaccine to the schedule of routine childhood
immunizations in 2004.40 The effect of the vaccination program on the incidence of VZ
has been substantial. Between 1994 and 2000 there were, on average, 1550
hospitalizations due to VZ each year in Canada. Following the introduction of publically
funded, vaccination programs the annual rate of hospitalization dropped to 114 per
year.41 Universal VZ vaccination programs have also been implemented in the USA,
Australia, Germany, Japan, Taiwan, and Greece.42
While the vaccine has been effective in reducing the incidence of VZ, it is not clear what
impact these programs will have on the future incidence and burden of herpes zoster in
vaccinated individuals. The varicella vaccine contains a live, attenuated version of VZV.
While this virus is less virulent than the wild type virus, it is infectious and can produce
VZV-type latent infections. These latent infections are generally localized to the dorsal
root ganglia innervating the injection site, although about 5% of vaccinated children
have detectable levels of virus in their blood stream.15 Rare cases of vaccine-virus

Chapter 1: Herpes Zoster and Postherpetic Neuralgia Page 10
related HZ have been reported, typically appearing in the same dermatome as the
injection site. 15 However, the neurovirulance of this attenuated strain appears to be a
much lower wild-type VZV. Thus, for the vaccinee, the risk of VZ and HZ are both
expected to be reduced by vaccination, although not enough time has passed for us to
be sure about what effect this will have on their lifetime risk of HZ.
1.5.2. Herpes Zoster Vaccine
In 2009 a VZV vaccine (Zostavax, Merck Canada) indicated for the prevention of HZ in
those 50 years of age and older was introduced to the Canadian market.38,43 The
vaccine is comprised of the same components used in Merck’s VZ vaccine, but at a 14-
fold higher antigen concentration.
The Shingles Prevention Study (SPS), a three year randomized, placebo-controlled trial
(RCT) of 38,546 patients, looked at the efficacy of the HZ vaccine in patients 60 years
of age and older. 44,45 Subjects were followed for a mean of 3.1 years. A 61% reduction
in the primary endpoint of burden of illness, as defined by a symptom severity-by-
duration measure, was seen. The incidence of HZ was reduced by 51%, with 5.4
cases/1000 person-years (PY) in the vaccinated arm compared to 11.1 cases/1000 PY
in the placebo treated group. This reduction in zoster incidence varied by age, with the
highest degree of reduction seen in those aged 60-69 (64% reduction), with significantly
lower efficacy in those ≥ 70 years of age (38%). There was also a 67% decrease in the
incidence of PHN.44,45
The Short-Term Persistence Substudy (STPS) was a follow up RCT using a subset of
14,720 SPS study participants.46 This extension was designed to measure the
Chapter 1: Herpes Zoster and Postherpetic Neuralgia Page 11
persistence of protection of the HZ vaccine by extending the observation period of this
sub-cohort to seven years in total. The vaccine effectiveness against the primary
endpoint of burden of illness declined from 61% in SPS to 50% in the STPS cohort. The
reduction in the secondary endpoints of HZ incidence declined from 51% to 40%, and
for PHN incidence to from 67% to 60%. Statistical significance for both the secondary
endpoints of HZ and PHN incidence was lost by the sixth year. Overall, there was a
clear trend towards decreasing efficacy with time as measured from the beginning of the
SPS trial to the end of the STPS trial.46
The final extension of SPS, the Long-Term Persistence Substudy (LTPS), further
extended the period of observation to up to 11 years, enrolling for 6867 individuals from
the vaccine arms of SPS and STPS.47 As the placebo arms of the earlier trials had been
offered immunizations following their conclusion, no control group was available for
LTPS. Instead, comparisons were made using observations from the placebo controlled
arms of SPS and STPS. An increase in HZ incidence by calendar time had been
observed in the earlier trials. For this reason, the primary analysis used a theoretical
comparison group that modelled the effect of this calendar time effect. A sensitivity
analysis that did not include this effect was also reported. Efficacy on the primary
endpoint of burden of illness decreased with time in all comparisons. In the primary
analysis, compared to the modelled comparison group, vaccine efficacy for burden of
illness was statistically significant until year eleven, the final study year. In contrast, the
sensitivity analysis using actual data from SPS/STPS (without this modelled calendar
effect), was statistically significant from placebo until year nine.47

Chapter 1: Herpes Zoster and Postherpetic Neuralgia Page 12
Thus it appears that the HZ vaccine is effective, although to a lesser degree than we
have come to expect based on our experience with childhood vaccines against
diphtheria, polio, measles, mumps, rubella, and VZ. Research into alternative vaccine
formulations is ongoing. Positive results have been reported for a non-living,
glycoprotein-based HZ vaccine using a novel adjuvant to increase efficacy.48 A number
of questions remain regarding the currently available HZ vaccine (Zostavax™). For
example, at what age should persons be vaccinated to achieve optimal benefit? Are
booster doses necessary, and if so, when? Numerous pharmacoeconomic studies have
been published looking into the cost utility of HZ vaccination programs, with sometimes
divergent results. It is clear that a vaccination program would not be cost neutral,49–51
and reported incremental cost-effectiveness ratios (ICER) range from $633 to $200,000
CDN per quality adjusted life year (QALY) and higher, depending on the
parameterization.49,51–53 A consistent finding is that the major determinant of whether
the vaccine is cost-effective is the price of the vaccine itself, which is currently listed at
$190.63 (McKesson Canada, PharmaClik online catalog, accessed May 16, 2016).
Many studies reporting ICERs at the low end of the range have used unrealistic values
for parameterization, with durations of effective protection ranging from 15 years up to
lifelong, and only using the short term outcome (around 3 years) of the SPS trial, rather
than using the results of the STPS and LTPS trials.49,51
Studies of cost-effectiveness in the context of the Canadian healthcare systems have
been published. A 2009 study reported that vaccination of 60 to 75 year olds was cost-
effective with an ICER of $41,709/QALY. However, the parameters used in their
discrete-event simulation unduly favoured this conclusion, using a half-life of vaccine

Chapter 1: Herpes Zoster and Postherpetic Neuralgia Page 13
effectiveness of 15 years, high rates of hospitalization for both HZ and PHN cases, and
high drug costs.50 A 2014 review of 11 previously published pharmacoeconomic
analyses in the setting of foreign healthcare systems concluded that vaccination would
be cost-effective at a willingness to pay threshold of $100,000/QALY. However, they
also noticed substantial variability in the reported ICERs.51
1.5.3. Long Term Effects of Varicella and Herpes Zoster Vaccines on HZ Rates
The hypothesis that exposure to persons with active VZ infections confers protection
against HZ was first suggested in the pioneering work of Dr. Hope-Simpson.54 His
research, published in 1965, presented evidence that VZ and HZ were caused by the
same virus, and that HZ was caused by reactivation of a previously acquired VZV
infection. Hope-Simpson also observed that rates of HZ were significantly lower during
years of VZ outbreaks.
If exposure to VZ decreases the risk of HZ, an obvious implication is that eliminating this
protective pool of virus would increase HZ rates in latently infected individuals, an idea
widely reported in the medical literature.42,55–57 Bennett and Watson expressed this best
when they wrote “…increasing childhood varicella vaccination may have the paradoxical
effect of increasing the rate of HZ infection because adults from the pre-vaccine era will
be exposed to less exogenous virus and thus will not receive the periodic boosting of
immunosurveillance that keeps the disease in check”.30
More recently, Brisson et al showed that adults living with children had a reduced
propensity to develop HZ, and that this protective effect was independent of the age of
the parents.55 A short report of a study using physician survey data found that

Chapter 1: Herpes Zoster and Postherpetic Neuralgia Page 14
pediatricians had significantly lower rates of HZ than psychiatrists, which correlated to
the reported differences in exposure to patients with VZ.58 A case control study also
found that adults with HZ were significantly less likely to have been exposed to VZ than
age and sex matched controls, again suggesting that exposure to VZ had a protective
effect against developing HZ.59
Numerous epidemiological studies have attempted to examine this issue using real
world data, with not entirely consistent results.42 While the majority of these
observational studies have shown increases in rates of HZ in the period following
widespread use of the VZ vaccine, a number of these trends began prior to their
introduction. In addition, methodological issues in a number of the positive studies call
their conclusions into question. A good example of the issues are found in the results of
two recent Canadian studies, one conducted in Alberta, the other in Ontario. The
Alberta study found rates of HZ increased after the province added VZ to their childhood
immunization schedul. However, only crude incidences were reported, and the trend
had beginnings in the pre-vaccine period.60 The Ontario study reported no trend toward
an increase in the incidence of HZ in the five years following the provinces introduction
of their vaccine program. However, there was an increase observed in their final year of
observation. Mathematical models have been constructed that take into account the
exogenous boosting hypothesis and the effect of childhood VZ vaccination in both the
near and long term time frame. These models suggest that the peak effect of decreased
exposure to VZ on HZ rates lages after implementation of universal vaccination by
between 5 to 20 years, dependent on the duration of the boosting effect. 42,55,57,61
Clearly additional research, and possibly the passage of time, is needed before we can
fully determine the long-term impact of childhood VZ vaccination.

Chapter 2: Burden of Disease Studies Page 15
Chapter 2. Burden of Disease Analysis
2.1. Introduction to Burden of Disease Analysis
The term “burden of disease” (BOD) encompasses a “wide range of different
approaches that aim at assessing the impact of disease events on various dimensions
of human life including health”.62 In general, this form of analysis seeks to quantify the
burden caused by disease, illness, disability, injury, or other health related conditions to
those afflicted, to healthcare systems, or society as a whole.62–67
There are a number of reasons for measuring the burden of disease. Knowledge of the
impact and cost of sickness and disease enables governments and healthcare
providers to set priorities for spending of healthcare dollars. It can highlight areas where
more research effort is needed, to identify unmet healthcare needs, and can provide
means to compare and contrast the impacts of various and dissimilar diseases and
conditions. These studies can be used to guide healthcare policy decisions, are used by
pharmaceutical companies to argue for drug approval and drug coverage, are used as
stepping stones in subsequent research on the disease, and have even been used in
court cases to recover tobacco-related health care costs from tobacco companies65,66.
There are two primary components that need to be specified in any BOD study beyond
simply the disease of interest. These are:
Perspective: the person, group, or system impacted by the disease of interest
Burden to be measured: for example, costs, losses, and the effects of the
diseases of interest

Chapter 2: Burden of Disease Studies Page 16
2.2. Perspectives
The perspective used to analyze burden determines how we define and measure the
burden, the types of impacts we are interested in, and the data needed to conduct the
analysis. Common perspectives taken in a BOD study include 1) that of the healthcare
systems, health management organizations (HMOs) or health insurers; 2) a societal
perspective, and 3) that of individuals with the disease or illness of interest.
2.2.1. Health System Perspectives
The healthcare system perspective looks primary at direct medical costs incurred during
the provision of care. This perspective is used when looking at economic costs to
universal public healthcare systems such as what exists in Canada and most
industrialized nations, private health management organizations (HMOs) and health
insurance providers, Medicare and Medicaid in the USA, and other types of social
welfare programs that provide healthcare support.
2.2.2. Societal Perspectives
At the largest scale, disease burden can be measured from a societal perspective.
Societal costs include the direct medical costs measured in the health system
perspective, as well as additional indirect economic and non-economic costs. These
indirect costs include such things as lost productivity, unemployment insurance, and
disability payments. More abstract impacts such as opportunity costs are also
sometimes considered. 65,66
2.2.3. Individual Perspective
When analyzing burden from the perspective of individuals we are most concerned with
the impacts directly borne by the patient. These impacts can be either economic or non-

Chapter 2: Burden of Disease Studies Page 17
economic. The economic costs considered are those out-of-pocket expenses paid
directly by individuals related to the treatment of the disease, and/or those costs related
to living with the disease.
2.3. Types of Burden
The type of burden being considered is intimately connected to the perspective taken,
as the measures quantified will be those that fall within the scope of this perspective,
whether it be health system, societal, or individual.
2.3.1. Direct Medical Costs
Direct medical costs are the primary consideration when measuring burden using a
healthcare system perspective, as well as being incorporated into societal burden
studies. These are costs that are directly related to the treatment or management of a
disease. Examples of direct medical costs include those due to prescription drug
therapy, physician visits, services provided by allied healthcare professionals,
diagnostic and imaging tests, and the cost of hospitalization.
2.3.2. Indirect Economic Costs
Indirect costs are those related to living with the ongoing effects of an illness, and
typically are non-medical expenses. These costs are generally not considered from the
healthcare system perspective, but are commonly incorporated into societal studies and
when burden is assessed from an individual perspective, although the specific items
incorporated will depend on who is bearing the burden. Examples of indirect costs
include lost or reduced revenue from missing work or loss of employment; disability and
social assistance payments; increased childcare costs in order to attend medical

Chapter 2: Burden of Disease Studies Page 18
appointments, receive treatment, while being hospitalized, or if unable to provide care
personally; the employment of in-home care-providers, aides, and housekeeping
assistance when an individual is no longer able to do this herself; home remodelling and
vehicle renovation when mobility is impaired; and other costs related to disease-specific
effects borne by individuals.
2.3.3. Non-Economic Costs
It is also possible to quantify the impact of disease on life expectancy and quality of life.
The simplest measure to explain, although not always easy to determine, is lost life
years (LLY), the decrease in years of life expectancy due to disease. Frequently, the
impact on longevity and the change in the quality of life are expressed together using a
measure called quality of life adjusted years (QALYs) which multiplies the number of
years of life by a utility factor ranging between 1 for perfect health, and 0 for death.
Numbers between these extremes represent varying degrees of loss of quality of life.
Related measures include health adjusted life years (HALYs), and disability adjusted life
years (DALYs). 62–65
2.4. Sources of Epidemiological and Healthcare Utilization Data
Many epidemiological and burden of disease studies utilize retrospective chart reviews,
survey data collected from the general population or physicians, or gather data
prospectively from sentinel physicians and clinics. Statistical techniques are then used
to make inferences about the larger population or healthcare system. In the cases of
prospective studies, physicians are typically trained to collect clinical data using a
specified set of diagnostic criteria, recording data collected during the course of
providing medical care in a standardized format. Advantages of this method include the
Chapter 2: Burden of Disease Studies Page 19
amount of clinical detail and the ability to prospectively collect the data necessary to
answer new questions that existing data may not be able to address.
Another method of epidemiological research are database studies, often using
administrative health care data generated during the normal operations of the
healthcare system. Cases are frequently identified using diagnostic codes, the utilization
of specific medical services, and drug use. Diagnoses are commonly recorded using
International Classification of Diseases (ICD) diagnostic codes. ICD codes are an
extensively utilized systematic means of classifying diseases and procedures for
administrative and billing purposes, making it a valuable research tool. Advantages of
using administrative data include much larger sample sizes, up to the size of entire
populations, the greatly reduced cost and time needed to carry out a study, and the
availability of extant data over extended periods of time. However, administrative data
are not collected for research purposes but rather to manage resources within the
healthcare system, thus the depth of clinical detail is also generally limited
A hybrid of clinical data and large database research is the use of clinical databases,
such as the general practice research database (GPRD) and its successor the clinical
practice research datalink (CPRD), both run by the United Kingdom’s Deparment of
Health.68 These databases consist of electronic medical records system, with data entry
done by physicians at the point of care. All records are anonamized, but contain record
identifiers allowing for linkages to other NHS databases, such as those containing
clinical laboratory results and disease registries. These combine the power of detailed
clinical information via electronic medical records, with the power of large databases,
and can be linked to administrative databases. This combination of detailed individual

Chapter 2: Burden of Disease Studies Page 20
level data across a broad range of medical services multiplied by the huge numbers of
patients makes these databases invaluable for research.
2.5. Review of the Zoster Burden of Disease Literature
2.5.1. Epidemiology of Herpes Zoster and Postherpetic Neuralgia
There is a substantive extant body of research examining the epidemiology of HZ and
PHN in a variety of geographical locations, various periods of time, and using an array
of methodological techniques.
The lifetime prevalence of HZ was reported at 28% in Canada, and 30% in the UK in a
single, well executed database study.2 A second report using the Weekly Returns
Service dataset, gathered by a network of sentinel physicians, found similar results with
a lifetime prevalence of 22% for males, and 32% for females.3 Another UK based study
using general practitioner survey results from a 1% sample reported lifetime HZ rates of
28%.4 There rates are relatively consistent across methodologies, and have been
repeatedly reproduced.
There is more variance in studies reporting incidence rather than lifetime prevalence
rates, although clearly these are two related concepts. Among studies that have used
data derived from general practice based studies, the observed incidence rate of HZ
varies, with rates varying from 1.4 to 5.23/1000 PY.3,6,69–71 The incidence of HZ goes up
with age, rising to 10 to 12 cases/1000 PY by age 85.4 These rates, as a whole, are
generally lower than those rates derived from database studies.

Chapter 2: Burden of Disease Studies Page 21
Among database studies, reported rates of HZ range from 3.46 cases/1000 PY up to
9.6 cases/1000 PY.5,10,72,73 Age specific incidence rates of 6.21 cases/1000 PY at 50-54
years of age, and 13.19 cases/1000 PY at age ≥ 85 have also been reported.72
We also have zoster incidence rates from RCT trials, including the SPS and STPS HZ
vaccine efficacy study. These trials reported rates of HZ in the placebo arm of 11.1 and
14.0 cases/1000 PY.44,46 It is important to note that the RCT trials enrolled only patients
≥ 60 years of age, and are best compared to age-specific HZ rates rather than
population-wide incidence.
The robust relationship between increasing age and increasing incidence of HZ, with
the rate increasing rapidly after the age of 45, is important to note when considering
changes in the burden of HZ. . Between 1997 and 2013, the number of persons
registered with Mantioba Health 60 years of age or older has increased by over 32,000,
and an overall all shift in the age structure to more aged persons (Appendix A). This
trend is expected to continue. It has been projected that by the year 2042, the size of
the senior population is expected to at least double, and the contribution to the total
population will increase from 14% in 2012, to between 19% and 23%.74
Examining the incidence of PHN or the rate of conversion from HZ to PHN is
complicated by the lack of a standardized definition of PHN. The primary criterion
needed to define and diagnose PHN for the purposes of an epidemiological study is the
duration of the post-HZ pain. As mentioned previously, the duration used ranges from
30 days to up 6 months, and measured from either onset or resolution of HZ symptoms.
Chapter 2: Burden of Disease Studies Page 22
Additionally, the severity of pain required for the determination of a case is typically not
explicitly mentioned.
Administrative data research is restricted to symptoms that require medical treatment,
as episodes not requiring a physician’s care or drug treatment are essentially invisible.
For these types of studies, only “clinically relevant” PHN, meaning PHN cases where
persons seek treatment, can be detected and reported. This approach would miss the
burden of disease associated with cases of PHN not requiring medical care. In contrast,
prospective studies can actively search for PHN cases by requesting patients return for
follow up observation at a specified time. This observation may explain the higher PHN
conversion rates reported in these studies, with estimates that up to 50% of HZ
episodes convert to PHN.6
Rates of conversion from HZ to PHN using the 90 day cut-off range from 5% to 14.5%.4–
6,10,69,73 When studies using this definition are compared, the calculated rates found
using physician collected data, administrative databases, and data from RCT are
similar, although outliers can be found. A small number of studies report PHN incidence
rates rather than conversion rates. One database study reported an estimate of 0.13 to
1.33 cases of PHN/1000 PY.72 The SPS and STPT RCTs also calculated incidence
rates, reporting values of 1.38 and 1.76 cases/1000 PY, respectively.44,46
Rates of HZ-related hospitalizations are infrequently included in purely epidemiological
reports, but are part of the majority of BOD as they are a major driver of the HZ burden.
There is a high degree of variation in reported rates of hospitalization. Reported
estimates range from 1.3% to 10% of HZ cases hospitalized, and that in the general

Chapter 2: Burden of Disease Studies Page 23
population there are between 1.2 and 4.5 HZ hospitalizations/10,000 PY.2,10,71–73 Death
is an uncommon outcome of HZ and is commonly not reported. A 2011 German study
reported a HZ mortality rate in those over age 50 of 2.1 deaths per 1,000,000 PY. The
mortality rate was strongly influenced by age, with rates in the 50 to 64 year age group
being 0.2 deaths/1,000,000 PY. 72 A UK study using data from 1994 to 1999 reported a
mortality rate of 0.4 deaths/10,000 HZ cases in the under 60 cohort, and 20-40 deaths/
10,000 HZ cases in the 60 year and older cohort.4
2.5.2. Economic Burden
Numerous BOD studies examining the economic burden of HZ and PHN have been
published. These studies have been conducted from a number of perspectives, in
numerous healthcare settings, and in various periods of history. Despite this, questions
still remain surrounding a number of issues, and this is especially true in the Canadian
context where a full assessment of HZ burden is lacking.
Estimates of the economic burden of zoster and PHN have also had a large variance in
their estimates, more so than that of epidemiological studies. Estimates of the mean
cost of HZ range from under $100 to over $6000 per episode.4,6,10,69,71,73,75 Prescription
drug expenditures account for a large portion of the burden. In some studies drugs are
the leading driver of cost.6
Per episode costs are substantially higher for persons that develop PHN, due in large
part to the extended duration of illness as compared to HZ, with treatment continuing for
three months to two years, with an average length of one year. The estimated cost to

Chapter 2: Burden of Disease Studies Page 24
treat an episode of PHN, using the 90 day definition, range from $270 up to
$1593.4,6,10,69,71,73,75
Hospitalization, although uncommon, has a huge impact on the burden calculation. For
an otherwise uncomplicated (i.e. no PHN) case of HZ, being hospitalized multiplies the
cost of an episode by 7 to 77 times. For persons with PHN, hospitalization multiplies
cost by 3 to 26 times.10,71
A robust finding from the prior work on economic burden of zoster is that prescription
medications, in particular antiviral agents including acyclovir, famciclovir, and
valacyclovir, account for the largest single direct medical cost in the outpatient treatment
of HZ.10,69,71 For episodes of PHN, analgesics and adjuvant agents used for the pain
account for the largest portion of medication cost for the treatment of post-herpetic
neuralgia. Drug treatment can account for anywhere from 30% to over 80% of
outpatient costs.10,69,73
After drug costs, outpatient medical visits are typically the next largest component of
economic burden, and can account for up to 35 to 45 percent of total outpatient costs.73
Some studies have reported that medical care costs exceed medication costs for
episodes of HZ73 or PHN.69
Consultation rates for zoster are extremely high, and the assumption that all zoster
patients seek medical care is built into the methodology of most database studies.
Consultation rates may vary by country, depending on access to the healthcare system,
expectations of patients regarding the utility of medical care, and population
demographics. This may partly account for the variance in burden between different

Chapter 2: Burden of Disease Studies Page 25
countries, and also limits the generalizability of results, as do differences in drug
coverage, and structural differences in health care systems.

Chapter 3: General Study Methodology Page 26
Chapter 3. Project Outline – Methods and Objectives
3.1. Study Objectives
The primary objective of this thesis was to determine, and report, the overall burden of
HZ and PHN in Manitoba using the perspective of the provincial healthcare system. Due
to this choice of perspective, only direct medical costs are included in this analysis.
These costs are grouped into three primary domains: pharmacological treatment using
prescription drug costs, medical service utilization, and HZ-related hospitalizations.
Secondary objectives were to examine how HZ infection, ZAP, and PHN are treated
pharmacologically, and how treatment patterns have evolved over time. Changes in the
choice of drugs used, and changes in the price of different drugs, particularly the
introduction of generic formulations of these drugs, would be expected to have impacts
on the cost of pharmacotherapy.
An additional secondary objective was to examine the epidemiology of HZ, and whether
it changed over the study period. A number of previous studies have reported an
increase in the incidence of HZ in various countries around the world, but this is far from
a universal observation. The extended duration of our observation period enabled us to
determine if an increase had occurred in Manitoba.
The final objective was to conduct an exploratory analysis of HZ vaccine uptake in
Manitoba.
Chapter 3: General Study Methodology Page 27
3.2. Methodology Overview
The purpose of providing a methodology section outside of that already incorporated
into each research paper (Chapter 4-6) is to allow space to provide additional detail on
the core methods common to all, and diagrams to clarify some of the definitions used.
These core methods include identification of distinct episodes of HZ, diagnosing PHN in
the absence of a specific ICD-9 CM code, method of differentiating incident from
prevalent use of a drug class. An explanation for why two separate reporting time
frames are used dependent upon the analysis has also been presented.
Methods distinct to each paper are described only within their respective chapter.
3.3. Study Methodology
A retrospective observational population-based study using administrative healthcare
data was conducting to determine the burden of HZ and PHN in Manitoba. In this study,
a cohort comprised of all individuals registered with Manitoba Health, Seniors and
Active Livingwas used. This cohort is virtually equivalent to the entire population of
Manitoba, Canada. The timeframe of data collection used was from April 1st 1995 to
March 31st 2014, with results reported for episodes diagnosed after April 1st 1997.
Administrative healthcare data are created during the normal, day to day operations of
the healthcare system. It is not produced for the purposes of research and lacks most of
the detail that would be present in a medical chart or electronic medical record
database. Instead, it is primarily transactional in nature, and is necessary to allow for
the healthcare system to operate. Administrative data are a commonly used data source
in burden of disease studies as it allows researchers to determine the real world cost of
Chapter 3: General Study Methodology Page 28
healthcare by using actual costs gathered from the treatment of real people, frequently
across large groups of patients.
In Manitoba, these data are collected by the different sectors of the healthcare system
and sent to the Manitoba Centre for Health Policy (MCHP) for inclusion in the
Population Health Research Data Repository. The MCHP maintains this large collection
of data, use it for the research they do on behalf of the provincial government, and
make it available to outside researchers on a cost-recovery basis. This repository also
contains some non-healthcare governmental data such as educational records, census
data, family services records, and income assistance records. All records in the
Repository’s databases are de-identified to protect patient privacy, but contain a
pseudorandomized identification number to allow for the cross-linking of an individual’s
records across separate databases.
3.3.1. Data Sources
For this study four data sources from the Repository were used. These include the Drug
Program Information Network (DPIN), medical services records, hospital discharge
abstracts, the Manitoba Immunization Monitoring System (MIMS), and the Manitoba
Health insurance registry.
The DPIN system is a real-time, electronic, point-of-sale system used by community
pharmacists to process all prescription claims. It is used to process prescription claims
to the Pharmacare program, the province’s deductible-based universal drug insurance
program, as well as to third party payers. In addition it is used to conduct drug utilization
reviews as pharmacists are able to view all prescriptions filled by that patient regardless
Chapter 3: General Study Methodology Page 29
of which pharmacy it was filled at. It provides information on all prescription
dispensations by patient, including the date, drug identification number, anatomical
therapeutic chemical (ATC) classification designation, prescriber code and specialty,
amount of drug dispensed, strength, the duration of the prescription as determined by
the pharmacist based on the prescription instructions, and a breakdown of costing data.
The medical services database contains records of fee-for-service medical claims
generated by physicians, biomedical laboratories, and x-ray providers. Each record
contains information on who received and who provided the service, service data, a
tariff code designating the service received, and the first 3-digits of the International
Classification of Disease version 9 - clinical modification (ICD-9 CM) diagnostic code of
the condition for which the service is provided, and cost information.
Hospital discharge abstracts data provides a summary of each hospitalization in the
province. These records contain admission and discharge dates, patient information, up
to 16 complete ICD-9 CM or 25 ICD-10 CA (Canadian edition) diagnostics and
procedure codes, hospital information, and a weighting factor that reflects the intensity
of resource utilization for each hospitalization.
The MIMS database is used to track immunization histories of persons registered with
Manitoba Health. Records within MIMS contain data on the types of vaccines
administered, date of administration, and provider information. Starting in 2001, MIMS
began to include immunization data on persons 18 years of age and older. This
database was used to assess the uptake of the HZ vaccine.

Chapter 3: General Study Methodology Page 30
The final database used was the Manitoba Health insurance registry, which contains
basic demographic information on all persons registered with Manitoba Health.
Registration with Manitoba Health is automatic for persons born within the province, and
is required of residents in order to access the universal public healthcare system. The
registry thus contains information on virtually all residents of the province, allowing full
enumeration of the population from which HZ arise from and is updated semi-annually.
3.3.2. Approvals
Approvals for this study were obtained from the Manitoba Centre for Health Policy
(MCHP), the University of Manitoba Health Research Ethics Board (HREB), and the
provincial Health Information Privacy Committee (HIPC). Copies of these approvals may
be found in the Appendix A to this document. Individual patient consent forms are not
required for retrospective database studies as per the regulations of these regulatory
bodies and provincial law.
3.4. Analytical Methods
The basic methodology used in this study involved the identification of all cases of HZ
and PHN in the province and the episode start date. The unit of analysis for this project
are these individual episodes.
We used medical services and hospital discharge abstract data to identify individuals
with ICD codes for HZ. A series of criteria were developed to enable us to distinguish
multiple diagnostic codes for a single individual as either being for a single episode of
HZ or for multiple episodes of HZ, using the temporal relationship between ICD codes.
After identifying episodes of HZ, medical services, hospitalizations, and prescriptions
were assigned to the episode they arose from. Prescription drug and medical service

Chapter 3: General Study Methodology Page 31
utilization and expenditures, and hospitalizations could then be determined on a per
episode basis. All episode data were reported within the Pharmacare fiscal year,
beginning on April 1st, in which diagnosis was made.
3.4.1. Episode Definition
From the combined hospital discharge abstracts and medical records databases we
identified all records with a diagnostic code for HZ; ICD-9 CM code starting with “053”,
or ICD-10 CA code starting with “B02”. The date of the first HZ diagnostic code in an
episode was defined as the episode start date.
To be considered a new episode, as opposed to the continuation of a previous episode,
two criteria must be both met:
At least two years with no diagnostic codes, or two years from the start date of a
previous episode must have elapsed, and
Where a previous episode exists, a minimum of 180 days must have passed
since that the last ICD code associated with it. .
Figure 3.4-1 Episode definition
Chapter 3: General Study Methodology Page 32
Using ICD-9 codes has been used in numerous prior HZ studies and has been shown to
be both highly selective (positive predictive value 93%) and sensitive (97.5%).76 In
addition, it is estimated that between 95% and 99% of all individuals who develop HZ
will seek medical attention.73,77 Thus, the number of HZ episodes identified within our
data using these steps is expected to be an unbiased estimator of the number of HZ
episodes in our population.
3.4.2. Exclusion Criteria
Since the units of analysis are HZ episodes it was necessary to ensure that complete
data for each individual episode was assigned to that episode. The episode criteria
described above were developed with this in mind. At least 2 years of pre-episode
observation time with no HZ diagnostic are required to ensure that a new diagnostic
code signals the start of a new episode rather than the continuation of a previous
episode. For this reason all episode with a start date on or before March 31 1997 were
excluded from the cohort. However, these individuals were allowed to enter the cohort
at a later time, if they later met the episode definition.
To avoid potential misdiagnosis or misclassification of VZ as HZ, all episodes of patients
under 20 years of age at diagnosis were also excluded. HZ rates in this age group are
very low, and it is possible that they represent a distinct group of patients that should be
analyzed separately. The addition of the VZ vaccine to the routine schedule of
childhood vaccinations would also complicate analysis of this cohort as it would likely
contain a changing mix of wild VZV-caused HZ and cases of vaccine-related HZ.

Chapter 3: General Study Methodology Page 33
3.4.3. Analysis Time Frame
For the determination of HZ incidence rates, and to analyze costs and utilization of
antiviral treatment, collection of complete episode data (including PHN period) was not
necessary. A single data point, an ICD diagnostic code with a minimum of a two year
gap from a previous code, identified the episode start date, and only 30 days post
diagnosis were needed to analyze antiviral drug utilization and its associated costs as
per study protocol. Thus, for analysis of incidence and AV use, all episodes diagnosed
after April 1, 1997 were utilized. This is the primary time frame used in chapter four, and
is used in parts of chapter six.
To determine total cost per episode we needed to allow for full equal follow up time for
all episodes. This is especially important as previous studies have shown that PHN is a
significant contributor to total cost, and this cost is accrued slowly over the duration of
an episode which can last for years. Thus episodes starting after April 1, 2012 are
excluded as less than two years of data were available for these cases. This is the
primary time frame reported upon in chapter five and six.
Figure 3.4-2 Study Time Frames

Chapter 3: General Study Methodology Page 34
3.4.4. Determining Incident Drug Class Use
Aside from vaccinations, all drugs used to treat HZ and PHN are also used for a variety
of other common illnesses. For example, the antiviral drugs used to treat an acute HZ
episode are also used for the treatment and prevention of other herpes virus infections,
in particular herpes simplex 1 and 2. Drugs used to treat ZAP and PHN are more
commonly used for other painful conditions, and this use increases with patient’s age,
mirroring the trend seen with HZ.
In order to differentiate between the continuing use of these drugs for other conditions,
and incident use associated with a new episode of HZ, a 120 day look-back period was
used. Drug treatment was categorized using Anatomical Therapeutic Chemical (ATC)
classes. Prescriptions for opioids (ATC codes starting with N02A), NSAIDS (M01),
anticonvulsants (N03A), antidepressants (N06A), nabilone (A04AD), local anesthetics
(D04A), glucocorticoids (H02AB), and ASA and acetaminophen (N02B) were
considered as potential treatment of ZAP and PHN pain. The antivirals acyclovir,
valacyclovir, and famciclovir were also examined and considered as a class.
All prescriptions within each drug class in this look-back period were considered
separately, with total class use determined by summing the days supply of all
prescriptions. Any drug class with a total of 30 days or more within the 90 days
immediately preceding the episode start date were defined as prevalent drug use, and
excluded from all further analysis for that episode.

Chapter 3: General Study Methodology Page 35
3.4.5. Diagnosis of Post-Herpetic Neuralgia
Postherpetic neuralgia does not have a specific ICD-9 CM code, but is included within
the code 053.19, herpes zoster with other nervous system complications. An ICD-10
code, G53.0, does exist. However, the vast majority of diagnostic code data available
for this study comes from medical services billings, which only list the first three digits of
ICD-9 CM codes, and ICD-10 codes are only used for the later portions of our
hospitalization data. Thus diagnostic codes are not a suitable means to identify
episodes of PHN. Therefore, we infer a diagnosis of PHN using medical claims listing a
ICD-9 CM diagnostic code of 053 (herpes zoster) and prescription treatment with drug
classes defined above as potential PHN therapies that are dated 90 days or more post
episode start date.
Figure 3.4-3 Incident vs prevalent drug class use

Chapter 3: General Study Methodology Page 36
An additional consideration is that, in the absence of ongoing ICD codes, we cannot
reliably claim that a new potential PHN prescription dispensed at a later date is for PHN,
or for an alternative condition. Therefore, prescriptions dispensed in the period after the
last medical billing code were required to meet criteria for continuous treatment, with the
first discontinuity defining the end of drug treatment and of that episode.
As drugs used to treat pain are often prescribed or used on a prn, or as needed basis,
we allowed for a grace period between prescriptions. Each prescription record contains
the dispensation date for that prescription and a days supply variable entered by the
pharmacist which approximates the duration of the prescription based on the
physician’s instructions. The end date of a prescription is the dispensation date plus the
days supplied plus a grace period of 100% of the days supply. The presence of a
discontinuity defines the end of treatment, and all prescriptions after this date were
excluded from the analysis.
Figure 3.4-4: Defining Continuous Drug-Class Use

Chapter 3: General Study Methodology Page 37
3.4.6. Cost Determination
Medical costs were taken directly from the medical services database, which lists the
fee-for-service cost paid by Manitoba Health, Healthy Living, and Seniors to service
providers. These costs are adjusted using the general Statistics Canada Consumer
Price Index (CPI) for Manitoba.
Prescription drug costs, including dispensing fees, were taken directly from the DPIN
database. These costs are adjusted using the CPI index for prescription drugs for
Manitoba.
Hospitalization costs were determined using the resource intensity weight (RIW) given
to each hospital stay by the Canadian Institutes for Health Information (CIHI), and
multiplied by mean hospitalization cost in Manitoba for 2013.
All costs are adjusted for inflation and expressed in the equivalent of 2013 Canadian
dollars.
3.4.7. Additional Methods
The methods specific to each of the three papers included in this thesis are described
the individual papers “Methods” section.

Chapter 4: Antiviral Treatment of Herpes Zoster – Paper #1 Page 38
Chapter 4. The Changing Landscape of the Antiviral
Treatment of Herpes Zoster: A 17-Year Population-
Based Cohort Study
Chapter Introduction
The next chapters are comprised of three full research papers, each of which has been,
or is intended to be, published in a scientific journal. Each of these papers is intended to
highlight specific portions of the treatment of HZ and PHN in order to develop a clear
picture of the burden of disease of this relatively common disease.
The first two papers look at the pharmacological treatment of herpes zoster and
postherpetic neuralgia in detail, while the third examines the healthcare system burden
of disease at a more macro level.
This first paper examines the use of antiviral drugs to treat acute HZ infections in
Manitoba over the period of 1997/98 to 2013/14, with a primary objective of determining
changes over time in how HZ is treated in Manitoba. The use of antiviral drugs in
general, as well as that of acyclovir, valacyclovir, and famciclovir specifically, is
reported. Also reported are the number of episodes and the age-adjusted incidence of
HZ over this time interval. Rates of antiviral treatment, as well as total annual and mean
treatment costs are also reported.

Chapter 4: Antiviral Treatment of Herpes Zoster – Paper #1 Page 39
4.1. Manuscript Cover Page
The Changing Landscape of the Antiviral Treatment of Herpes Zoster: A 17-Year
Population-Based Cohort Study
Kevin J Friesen BSc (Pharm)1, Silvia Alessi-Severini BSc (Pharm) PhD1, Jamie Falk
BSc (Pharm) PharmD 1, Dan Chateau PhD2, Shawn Bugden MSc. Pharm.D1
1College of Pharmacy, Rady Faculty of Health Sciences, University of Manitoba, 750
Bannatyne Ave, Winnipeg, MB, R3E 0T5. 2Assistant Professor, Department of
Community Health Sciences, College of Medicine, Rady Faculty of Health Sciences,
University of Manitoba, Winnipeg, Mb, R3E 3P5
This work was published in ClinicoEconomics and Outcomes Research on May 20th
2016, volume 2016(8): 207-214 https://dx.doi.org/10.2147/CEOR.S102243
Running Header: Trends in Herpes Zoster Incidence, Treatment, and Cost
Keywords: Herpes zoster, burden, economics, valacyclovir, famciclovir, acyclovir
Contributions: Kevin Friesen designed the study, analysed the data, and wrote the
manuscript. Shawn Bugden assisted in study design, provided guidance during the
analytical phase of the study, and critically reviewed the study. Silvia Alessi-Severini
was involved in the initiation of this research program and critically reviewed the
manuscript. Dan Chateau and Jamie Falk both provided guidance and extensively
reviewed and commented on this manuscript throughout the editing process.

Chapter 4: Antiviral Treatment of Herpes Zoster – Paper #1 Page 40
The Changing Landscape of the Antiviral Treatment of Herpes Zoster:
A 17-Year Population-Based Cohort Study
4.2. Abstract
Background:
Herpes zoster (HZ) is a common viral disease that produces a painful vesicular rash.
Early use of antiviral medications is recommended, as it reduces pain and speeds
healing. A population-based observational study was conducted to evaluate the
changing burden of HZ in the province of Manitoba (Canada) over a period of 17 years.
Methods:
Administrative health care data including medical and hospital records were examined,
and International Classification of Diseases, Ninth Revision, Clinical Modification and
International Classification of Diseases, Tenth Revision, Clinical Modification codes
were used to identify episodes of HZ between April 1, 1997 and March 31, 2014 in
persons aged 20 or over. Annual age-adjusted incidence and hospitalization rates were
calculated. Prescription records of HZ-diagnosed persons for acyclovir, valacyclovir,
and famciclovir were used to calculate the rates and costs of antiviral treatment.
Results:
There were 73,886 identified cases of HZ between 1997/98 and 2013/14. Of these
episodes, 42,187 (57.1%) were treated with antiviral medications at a total cost of
$4,696,611 (CAD). The age-adjusted incidence of HZ rose from 4.70/1,000 person
years in 1997/98 to 5.70/1,000 person years in 2013/14, a 21.2% increase. Antiviral

Chapter 4: Antiviral Treatment of Herpes Zoster – Paper #1 Page 41
treatment rates increased from 41.7% to 66.0% of all diagnosed episodes. Mean costs
per treated episode dropped from $139.61 in 1997/98 to $60.52 in 2013/14, primarily
due to the introduction of generic antiviral medications. The total cost of antiviral
treatment peaked in 2005/06 at $328,760 and dropped steadily thereafter to $229,366
in 2013/14. There were 1,138 HZ-related hospitalizations between 1997/98 and
2011/12, with rates decreasing from 3.1% in 1997/98 to 1.4% of all episodes in 2011/12.
Conclusions:
While both incidence of HZ and rates of antiviral treatment have risen substantially, the
economic burden from antiviral treatment has been decreasing since a peak in 2005/06
and was only 2.6% higher in 2013/14 than in 1997/98. This drop in cost is attributed to
the introduction of generic antiviral drugs.
.

Chapter 4: Antiviral Treatment of Herpes Zoster – Paper #1 Page 42
The Changing Landscape of the Antiviral Treatment of Herpes Zoster:
A 17-Year Population-Based Cohort Study
4.3. Introduction
Herpes zoster (HZ), or shingles, is a viral disease characterized by a painful, vesicular
rash. It is caused by reactivation of latent varicella zoster virus (VZV), the virus
responsible for varicella zoster (chicken pox) upon initial infection.1–3 VZV infection is
ubiquitous in the current adult population with 95-97% of adults over the age of 40
infected and at risk of developing HZ.4,5 It is estimated that 20 to 30% of these persons
will develop HZ at some time in their life.1,6 The annual incidence of HZ in the general
population is estimated to be between 1.2 and 6.3 cases per 1000 person years (PY).
The incidence increases with age to 7.2 - 11.8 cases per 1000 PY in persons older than
60 years. 1,7,8 HZ is thus a common disease with the vast majority of adults at risk.
Anti-herpetic antiviral drugs such as acyclovir, valacyclovir, and famciclovir are the
cornerstone of the acute treatment of HZ. Antiviral treatment reduces the duration and
severity of symptoms and may decrease the risk of possible complications such as
post-herpetic neuralgia.9 The current recommended treatment for HZ is to begin
antiviral therapy within 72 hours of the onset of symptoms and continue for 7 days.1,10,11
Antiviral drugs have been reported to account for 50% - 70% of the drug cost for treated
cases of HZ and can account for a significant portion of total treatment cost.7,12,13
There have been two major changes that may impact the epidemiology of HZ. The first
of these was the introduction of the varicella zoster vaccines (Varivax™, Merck Canada,
Kirkland, Quebec, Canada), which became available in Canada in January 1999 and
were incorporated into Manitoba’s publically funded childhood vaccination program in

Chapter 4: Antiviral Treatment of Herpes Zoster – Paper #1 Page 43
2004. Although HZ is still possible in vaccinated persons, the virulence of the vaccine
strain is attenuated and this may lead to eventual decreases in rates of HZ as these
persons age into adulthood.14 The second change was the introduction of the herpes
zoster vaccine (Zostavax®, Merck) in September 2009,15 which has been shown to be
safe and effective at decreasing the incidence and burden of HZ.16–18 However, the
impact of the HZ vaccine will be highly dependent on its uptake.
The population of Canada, including the population of Manitoba (est. 1.3 million in
2015), is aging.19 Due to the association of increasing age with a higher incidence of HZ
we would expect to see increasing numbers of HZ cases and an increase in the burden
of disease. However, new vaccines and varying vaccine uptake coupled with other
changes in the health care system make it difficult to predict the changing burden of
disease for HZ. As part of a research program to determine the burden of HZ, this
study examined the epidemiology of HZ and the utilization of antiviral medications in the
province of Manitoba with the objectives of determining the incidence of HZ and the cost
burden of acute antiviral treatments.
4.4. Methods
A retrospective, population-based cohort study of HZ was conducted using
administrative data. The eligible population included all adults over the age of 20 in
Manitoba (Canada) between April 1, 1997 and March 31, 2014. Data were obtained
through the Manitoba Centre for Health Policy, which maintains the provincial
Population Health Research Data Repository. The repository contains copies of
administrative health care data of Manitoba Health. The databases used included the
Drug Program Information Network (DPIN), the Medical Services database, provincial

Chapter 4: Antiviral Treatment of Herpes Zoster – Paper #1 Page 44
Hospital Discharge Abstracts, and the Manitoba Health Registry. These databases
contain de-identified health-related information on all persons registered with Manitoba
Health, virtually the entire population of Manitoba.20 Scrambled patient identifiers are
shared between these databases, enabling linkage of records and allowing for the
longitudinal analysis of individual patients across the entire health care system.
The DPIN system is used to administer the Manitoba Pharmacare Program, a universal
prescription drug care plan available to all residents of Manitoba. DPIN is used to
submit claims to Pharmacare and other third-party prescription drug programs, and
captures community prescription drug use by persons registered with Manitoba Health.
The Medical Services database captures fee-for-service medical claims from physicians
and other health providers, and includes diagnostic codes and reimbursement costs.
The Hospital Discharge Abstracts database contains information on all hospitalizations
for persons registered with Manitoba Health, including both admissions in Manitoba and
those of Manitoba residents hospitalized in other Canadian provinces. The Manitoba
Health registry contains demographic information on all persons registered with the
agency and is used to provide population counts and age.
Episodes of HZ were identified using hospital discharge abstracts and medical claim
records for the period between April 1, 1995 and March 31, 2014, which included a 2-
year pre-study data collection period to differentiate between incident and prevalent
cases. Persons with diagnostic codes for HZ (International Classification of Diseases
[ICD], Ninth Revision, Clinical Modification codes starting with 053 and ICD, Tenth
Revision, Clinical Modification codes starting with B02) that were not related to HZ
vaccinations were categorized as cases with episode start dates based on the earliest

Chapter 4: Antiviral Treatment of Herpes Zoster – Paper #1 Page 45
recorded diagnosis. Multiple episodes were allowed in cases of multiple diagnostic
codes, provided that at least 2 years had elapsed from the beginning of the previous
episode and there were no other diagnostic codes in the previous 180 days. Episodes
with a start date prior to April 1, 1997 were excluded to ensure only incident cases were
analyzed. Persons under the age of 20 years at the time of diagnosis were excluded to
avoid miscoded cases of varicella zoster or varicella zoster vaccination. Hospitalizations
were attributed to HZ in cases where an HZ diagnostic code appeared as either the
admitting diagnosis or the diagnosis most responsible for continuing hospitalization.
Prescription records for antiviral drugs (acyclovir, valacyclovir, and famciclovir)
dispensed in the period of 5 days before and up to 30 days after the appearance of the
first diagnostic code for HZ were considered to be for the treatment of HZ. Prescriptions
outside of this window were excluded to avoid misclassifying antiviral treatment of
herpes simplex 1 or 2. Drug costs were calculated directly from the prescription records
and included both cost of the drug and the dispensing fee.
The Manitoba Pharmacare fiscal year (April 1–March 31) was used in the analysis for
reporting periods. Episodes, prescription rates, costs, and hospitalizations were all
considered to have been incurred in the fiscal year in which the episode was first
diagnosed. Mean treatment costs were calculated for antiviral-treated episodes by the
drugs used within each year. The absolute number of HZ episodes and the incidence
rates were calculated within each year. The age distribution of the 1997 Manitoba
population was used to age-adjust incidence rates in subsequent years. Antiviral
treatment rates were calculated as the percent of episodes associated with one or more
anti-herpetic prescriptions. Hospitalization rates were calculated as the percent of all

Chapter 4: Antiviral Treatment of Herpes Zoster – Paper #1 Page 46
episodes that resulted in HZ hospitalizations. To ensure capture of all episode-related
hospitalizations, particularly those due to postherpetic neuralgia, we allowed for up to 2
years of follow-up time. Thus hospitalizations are reported only for episodes diagnosed
between 1997/98 and 2011/12.
All costs have been adjusted to 2013 Canadian dollars (CAD) using Statistics Canada’s
consumer price index for prescription drug costs in Manitoba.
SAS Version 9.4 (SAS Institute Inc., Cary, NC, USA) was used for all data analyses.
Approvals were granted by the University of Manitoba Health Research Ethics Board
and the Manitoba Health Information Privacy Committee. These committees do not
require individual consent for research conducted using de-identified administrative data
when reasonable safeguards to protect confidentiality and security of personal health
information are in place.
4.5. Results
Between April 1, 1997 and March 31, 2014, we identified 73,886 diagnosed episodes of
HZ in Manitoba in those aged 20 years and older, with a crude unadjusted incidence
rate of 4.99 episodes/1,000 PY. Within our observation period, 5.6% of persons
experienced more than one HZ episode.
A total of 45,442 prescriptions were dispensed to treat 42,187 episodes at a total cost of
$4,696,111 (CAD). Overall, 57.1% of diagnosed cases were treated with antiviral
medications with a mean cost per treated episode of $111.38 (95% CI: $98.59,
$124.16). From 1997/98 to 2011/12 there were 1,138 hospitalizations (1.8% of all
Chapter 4: Antiviral Treatment of Herpes Zoster – Paper #1 Page 47
episodes), where HZ was either the admitting diagnosis or the diagnosis most
responsible for continuing hospitalization, an overall incidence of 0.088/1,000 PY.
From 1997/98 to 2008/09, the number of HZ diagnoses climbed slowly from 3,844 to
4,295 episodes per year. However, the age-adjusted incidence of HZ diagnoses
remained relatively constant at a mean of 4.70/1,000 PY (95% CI: 4.65, 4.75). The
incidence rose steadily from 2009 until the end of the study period, reaching 5.70/1,000
PY in 2013/14, an increase in incidence of 21.3% from the 1997–2008 plateau (Figure
1).
The use of antiviral drugs to treat HZ increased with the increased incidence of HZ, but
to a greater degree as more of these episodes were treated with antivirals. Treatment
rates increased from 41.7% of HZ diagnoses being prescribed antiviral drugs in 1997/98
to 66.0% of cases in 2013/14. Over this same interval mean costs per antiviral-treated
episode dropped from $139.61 to $60.52.
Of the 45,442 antiviral prescriptions identified, 4,263 (9.3%) were for acyclovir, 27,752
(60.8%) for valacyclovir, and 13,601 (29.8%) for famciclovir. Substantial changes in
prescribing patterns of these drugs were observed over the study period. While
acyclovir was the most commonly used antiviral to treat HZ at the start of the study
period, its use dropped rapidly and by 2013/14, it was used in less than 5% of treated
cases. Acyclovir was replaced by famciclovir and valacyclovir, with the use of
famciclovir peaking in 2002/03 when it accounted for 49% of all HZ-related antiviral
prescriptions. Since 2003/04, valacyclovir has been the dominant antiviral treatment. By
the end of the study period, valacyclovir was used to treat 50.0% of all HZ diagnoses
and it accounted for 80.6% of the antiviral HZ prescriptions (Figure 2).

Chapter 4: Antiviral Treatment of Herpes Zoster – Paper #1 Page 48
Generic acyclovir came to the Canadian market in August 1997, the first study year,
generic famciclovir in August 2006, and generic valacyclovir in May 2008. Comparing
the mean costs in 1997/98 and 2013/14, the mean cost per treated episode decreased
by $18.50 (15.1%) from $122.19 to $103.69/episode for acyclovir, by $46.96 (32.0%)
from $146.57 to $99.61/episode for famciclovir, and by $72.11 (61.4%) from $117.50 to
$45.39 for valacyclovir (Figure 3).
The total cost of treatment changed substantially over the study period, with the total
cost for each drug dropping concurrent with the introduction of generic forms of each
drug (Figure 4). Antiviral cost peaked in 2005/06 at $328,760, which is a 47.0%
increase from 1997/98 when the total cost was $223,647. The total cost then began a
decline that continued until the end of the study period. The total cost in 2013/14 was
$229,366, only a 2.6% increase from 1997 and a 30.2% decrease from 2005.
There was a dramatic decrease in the rate and number of HZ-related hospitalizations
concurrently with the increased rates of antiviral treatment. The number of
hospitalizations dropped by 42.9% between 1997/98 and 2011/12, from 119 to 68
hospital stays per year. At the same time, there was a 36% decrease in untreated (with
antiviral drugs) episodes of HZ.
4.6. Discussion
This study found that despite an increasing incidence of diagnosed HZ cases and
higher rates of treatment, the aggregate population costs of HZ antiviral treatment
declined in recent years. The increase in HZ incidence was an expected effect of the
aging population. However, the age-adjusted incidence rate revealed an increase in HZ

Chapter 4: Antiviral Treatment of Herpes Zoster – Paper #1 Page 49
incidence independent of aging, which was unexpected. While more HZ episodes and
more treatments seemed to drive an initial increase in population costs, generic pricing
for antiviral medications has more than compensated for these increases and has
resulted in the recent reduction in overall antiviral costs.
HZ consultation rates are frequently claimed to be an accurate estimator of the actual
incidence of this disease in the population. Symptom severity is thought to drive most
persons to seek medical attention and it has been estimated that up to 99% of persons
with HZ do so.13,21 As such, the Manitoba-linked administrative records should provide a
reliable measure of HZ incidence. The study found a relatively stable age-standardized
incidence of HZ over the first two-thirds of the study period. However, starting in
2009/10, there was a sharp and continuing increase in the incidence of HZ. A similar
increase in incidence was also seen in a study conducted in Ontario (Canada) in 2009:
the authors were unable to determine a cause for such an increase.22 As 2009 was also
the last year of the dataset used in the study, the authors were unable to determine if it
was the beginning of a trend and suggested it would be important to determine if the
increase persisted. While we are no closer to determining the cause of the increase in
Manitoba, it is apparent that it continued for 5 years till the end of our study period in
March 2014.
One possible explanation is that the increase in incidence is an artifact of increased
publicity and attention to HZ in recent years coinciding with the introduction of HZ
vaccine to the Canadian marketplace in 2009. The marketing of the vaccine has raised
public awareness of the signs and symptoms of HZ, possibly influencing people to seek
care. Alternatively, it has been speculated that widespread varicella zoster vaccination

Chapter 4: Antiviral Treatment of Herpes Zoster – Paper #1 Page 50
decreases the levels of wild-type VZV in the environment, thus eliminating the natural
boosting effect of exposure in a latently infected individual.23 Theoretical modelling of
universal VZ vaccination programs suggests we can expect an initial increase in HZ
rates eventually followed by sustained long term declines.6,24,256 However, while some
epidemiological studies have found such an effect, this conclusion is not universally
supported.22,25–27 Any such increases in HZ incidence, if it occurs, would obviously be
mitigated to some extent by HZ vaccination programs. While the observed increases
are important and warrant continued monitoring, the cause remains speculative at this
point and will be difficult to be definitively ascertained.
The study showed an increased incidence of disease and a greater likelihood of
treatment with antiviral therapy, but a decrease in the economic burden of disease due
to treatment. While the increases in diagnosed cases of HZ and the proportion of cases
treated with antivirals drive the treatment levels up, the effects on cost are overwhelmed
by the drop in the price of treatment. Both acyclovir and famciclovir dropped from a
stable price point associated with the brand name product to a lower stable cost
associated with the generic product. It is important to recognize that in Manitoba’s single
payer system, generic substitution is mandatory and the vast majority of prescriptions
are automatically switched to the generic product when it is available. As valacyclovir
became the treatment of choice in Manitoba, the generic market was very competitive
and there was a sustained downward trend in treatment cost with this drug. This was
the major contributor to the overall drop in the cost of treatment.
The rate of HZ-related hospitalizations dropped throughout the study period. This
downward trend in HZ-related hospitalization was also reported in the Ontario study
Chapter 4: Antiviral Treatment of Herpes Zoster – Paper #1 Page 51
where the incidence dropped by approximately half between 1992 and 2009.22 Antiviral
treatment has steadily increased throughout our entire study from less than 42% in
1997/98 to over 66% in 2013/14. Antiviral treatment has been shown to decrease both
the severity and duration of symptoms.1,10 It is possible that the increasing antiviral
treatment of HZ has contributed to the decreasing rates of hospitalization, but other
explanations cannot be ruled out. Limitations in hospital bed availability may make it
more likely that HZ is managed on an outpatient basis.
The ability to capture the entire population of the province over a time span of 17 years
is a major strength of this research. The linked nature of the data allows individuals to
be followed across the entire health care system. However, using administrative data
also has the limitations common to all research of this type, namely that it was created
not for the purpose of research but for managing the health care system, and cases are
identified using ICD codes that are meant for billing purposes. Nevertheless, the
reliability of HZ diagnoses is known to be very high due to the distinctive nature of the
disease. In fact the use of ICD codes to diagnose zoster in administrative data is both
highly selective (positive predictive value 93%) and sensitive (97.5%).28
4.7. Conclusion
The aggregate cost of antiviral treatment of HZ is the product of a number of factors: the
numbers of episodes, treatment rates, medication choice, and treatment cost. All these
factors change with time and can alternately increase or decrease costs, making
predicting the net effect very difficult. Only by directly measuring the real-world burden
of a disease can the overall disease resource impacts be assessed. The results of this
analysis illustrate the significant impact that generic drug pricing and mandatory

Chapter 4: Antiviral Treatment of Herpes Zoster – Paper #1 Page 52
substitution can have on disease management costs at the population level. Further
research looking at other economic facets of HZ is needed to complete our
understanding of the total burden of this disease.
4.8. Acknowledgments
The authors acknowledge the Manitoba Centre for Health Policy for use of data
contained in the Population Health Research Data Repository under project
#H2014:411 (HIPC# 2014/2015-35). The results and conclusions are those of the
authors and no official endorsement by the Manitoba Centre for Health Policy, Manitoba
Health, Seniors and Active Living or other data providers is intended or should be
inferred. Data used in this study are from the Population Health Research Data
Repository housed at the Manitoba Centre for Health Policy, University of Manitoba and
were derived from data provided by Manitoba Health, Seniors and Active Living.
We thank Heather Prior from the Manitoba Centre for Health Policy for her assistance in
preliminary data extraction.
This work was supported by a grant from Merck Canada.

Chapter 4: Antiviral Treatment of Herpes Zoster – Paper #1 Page 53
4.9. Figures and Tables
Figure 4.8-1 Episodes and incidence of herpes zoster
Herpes zoster episodes numbers with crude and age standardized incidence rates.
Population age distribution standardized to the population of Manitoba in 1997

Chapter 4: Antiviral Treatment of Herpes Zoster – Paper #1 Page 54
Figure 4.9-2 Antiviral treatment of herpes zoster over time

Chapter 4: Antiviral Treatment of Herpes Zoster – Paper #1 Page 55
Figure 4.9-3 Mean drug treatment cost per antiviral treated herpes zoster episodes
Vertical lines indicate date generic versions of labelled drug introduced.

Chapter 4: Antiviral Treatment of Herpes Zoster – Paper #1 Page 56
Figure 4.9-4 Summed costs of antiviral treatment of herpes zoster.
Vertical lines indicate date generic versions of labelled drug introduced.
Chapter 4: Antiviral Treatment of Herpes Zoster – Paper #1 Page 57
4.10. References
1. Schmader KE, Dworkin RH. Natural history and treatment of herpes zoster. J
Pain. 2008;9(1 Suppl 1):S3-S9.
2. Gnann JW, Whitley RJ. Clinical practice. Herpes zoster. N Engl J Med.
2002;347(5):340-346.
3. Hope-Simpson RE. the Nature of Herpes Zoster: a Long-Term Study and a New
Hypothesis. Proc R Soc Med. 1965;58(January):9-20.
4. Brisson M, Edmunds WJ, Law B, et al. Epidemiology of varicella zoster virus
infection in Canada and the United Kingdom. Epidemiol Infect. 2001;127(02):305-314.
5. Fairley CK, Miller E. Varicella-zoster virus epidemiology--a changing scene? J
Infect Dis. 1996;174 Suppl(Suppl 3):S314-S319.
6. Brisson M, Edmunds WJ, Gay NJ, Law B, De Serres G. Modelling the impact of
immunization on the epidemiology of varicella zoster virus. Epidemiol Infect.
2000;125(3):651-669.
7. Gialloreti LE, Merito M, Pezzotti P, et al. Epidemiology and economic burden of
herpes zoster and post-herpetic neuralgia in Italy: a retrospective, population-based
study. BMC Infect Dis. 2010;10:230.
8. Lionis CD, Vardavas CI, Symvoulakis EK, et al. Measuring the burden of herpes
zoster and post herpetic neuralgia within primary care in rural Crete, Greece. BMC Fam
Pract. 2011;12(1):136.
9. Massengill JS, Kittredge JL. Practical considerations in the pharmacological
treatment of postherpetic neuralgia for the primary care provider. J Pain Res.
2014;7:125-132.
10. Dworkin RH, Johnson RW, Breuer J, et al. Recommendations for the
management of herpes zoster. Clin Infect Dis. 2007;44 Suppl 1:S1-S26.
Chapter 4: Antiviral Treatment of Herpes Zoster – Paper #1 Page 58
11. Ono F, Yasumoto S, Furumura M, et al. Comparison between famciclovir and
valacyclovir for acute pain in adult Japanese immunocompetent patients with herpes
zoster. J Dermatol. 2012;39(11):902-908.
12. Gauthier a, Breuer J, Carrington D, Martin M, Rémy V. Epidemiology and cost of
herpes zoster and post-herpetic neuralgia in the United Kingdom. Epidemiol Infect.
2009;137(1):38-47.
13. Ultsch B, Köster I, Reinhold T, et al. Epidemiology and cost of herpes zoster and
postherpetic neuralgia in Germany. Eur J Health Econ. 2013;14(6):1015-1026.
14. Horien C, Grose C. Neurovirulence of varicella and the live attenuated varicella
vaccine virus. Semin Pediatr Neurol. 2012;19(3):124-129.
15. Drug Products Database. Healh Canada Drug Products Directorate (web based
database). http://webprod5.hc-sc.gc.ca/dpd-bdpp/index-eng.jsp. Accessed November 2,
2015.
16. Oxman MN, Levin MJ. Vaccination against Herpes Zoster and Postherpetic
Neuralgia. J Infect Dis. 2008;197 Suppl(Suppl 2):S228-S236
17. Schmader KE, Johnson GR, Saddier P, et al. Effect of a zoster vaccine on
herpes zoster-related interference with functional status and health-related quality-of-life
measures in older adults. J Am Geriatr Soc. 2010;58(9):1634-1641.
18. Oxman MN, Levin MJ, Johnson GR, et al. A vaccine to prevent herpes zoster
and postherpetic neuralgia in older adults. N Engl J Med. 2005;352(22):2271-2284.
19. Statistics Canada. Annual Demographic Estimates: Canada, Provinces and
Territories. (webpage) Ottawa, ON; 2015. http://www.statcan.gc.ca/pub/91-215-x/91-
215-x2014000-eng.pdf. Accessed November 17th 2015.
20. Roos LL, Brownell M, Lix L, Roos NP, Walld R, Macwilliam L. From health
research to social research : Privacy , methods , approaches. Soc Sci Med.
2008;66:117-129.
Chapter 4: Antiviral Treatment of Herpes Zoster – Paper #1 Page 59
21. Bilcke J, Ogunjimi B, Marais C, et al. The health and economic burden of
chickenpox and herpes zoster in Belgium. Epidemiol Infect. 2012;140(11):2096-2109.
22. Tanuseputro P, Zagorski B, Chan KJ, Kwong JC. Population-based incidence of
herpes zoster after introduction of a publicly funded varicella vaccination program.
Vaccine. 2011;29(47):8580-8584.
23. Brisson M, Gay NJ, Edmunds WJ, Andrews NJ. Exposure to varicella boosts
immunity to herpes-zoster: implications for mass vaccination against chickenpox.
Vaccine. 2002;20(19-20):2500-2507.
24. Horn J, Karch A, Damm O, et al. Current and future effects of varicella and
herpes zoster vaccination in Germany – insights from a mathematical model in a
country with universal varicella vaccination. Hum Vaccin Immunother.
2016;5515(February):00-00.
25. Damm O, Ultsch B, Horn J, Mikolajczyk RT, Greiner W, Wichmann O. Systematic
review of models assessing the economic value of routine varicella and herpes zoster
vaccination in high-income countries. BMC Public Health. 2015;15(1):533.
26. Wormsbecker AE, Wang J, Rosella LC, et al. Twenty years of medically-attended
pediatric varicella and herpes zoster in Ontario, Canada: A population-based study.
PLoS One. 2015;10(7):5-11.
27. Ogunjimi B, Van Damme P, Beutels P. Herpes Zoster Risk Reduction through
Exposure to Chickenpox Patients: A Systematic Multidisciplinary Review. PLoS One.
2013;8(6).
28. Klompas M, Kulldorff M, Vilk Y, Bialek SR, Harpaz R. Herpes Zoster and
Postherpetic Neuralgia Surveillance Using Structured Electronic Data. Mayo Clin Proc.
2011;86(12):1146-1153.

Chapter 5: Zoster Pain and Postherpetic Neuralgia - Paper #2 Page 60
Chapter 5. Price of Pain: Population Based Cohort Burden
of Disease Analysis of Medication Cost in Herpes Zoster
and Postherpetic Neuralgia
5.1. Chapter Introduction
The second paper in this thesis examines the pharmacological treatment of both acute
zoster associated pain, and the more chronic condition of PHN. The pain of HZ is
frequently the symptom that prompts people to seek medical treatment, and can range
in intensity from moderate to severe. PHN is the most feared complication of HZ, and
can be difficult to treat. While only about 10% of patients convert from acute HZ to PHN,
it accounts for the vast majority of drug costs.
The results reported in the paper span the period from 1997/98 to 2011/12. The
incidence of HZ, and rates of conversion to PHN are reported, along with total annual
costs and the mean costs per episode of pharmacotherapy. Trends over time in the use
of different drug classes used are also analyzed and discussed.

Chapter 5: Zoster Pain and Postherpetic Neuralgia - Paper #2 Page 61
5.2. Manuscript Cover Page
Price of Pain: Population Based Cohort Burden of Disease Analysis of
Medication Cost in Herpes Zoster and Postherpetic Neuralgia
Kevin J Friesen BSc (Pharm)1, Jamie Falk BSc (Pharm) PharmD 1, Silvia Alessi-Severini
BSc (Pharm) PhD1, Dan Chateau PhD2, Shawn Bugden MSc. Pharm.D1
1College of Pharmacy, Rady Faculty of Health Sciences, University of Manitoba, 750
Bannatyne Ave, Winnipeg, MB, R3E 0T5. 2Assistant Professor, Department of
Community Health Sciences, College of Medicine, Rady Faculty of Health Sciences,
University of Manitoba, Winnipeg, Mb, R3E 3P5
This work was published in the Journal of Pain Research in August 3rd, 2016, volume
2016(9): 543-550 https://dx.doi.org/10.2147/JPR.S107944
Running Header: Cost of treating Herpes Zoster Pain and Postherpetic Neuralgia
Keywords: Herpes zoster, burden, economics, postherpetic neuralgia, gabapentin
Contributions: Kevin Friesen designed the study, analysed the data, and wrote the
manuscript. Shawn Bugden assisted in study design, provided guidance during the
analytical phase of the study, and critically reviewed the study. Silvia Alessi-Severini
was involved in the initiation of this research program and critically reviewed the
manuscript. Dan Chateau and Jamie Falk both provided guidance and extensively
reviewed and commented on this manuscript throughout the editing process.

Chapter 5: Zoster Pain and Postherpetic Neuralgia - Paper #2 Page 62
Price of Pain: Population Based Cohort Burden of Disease Analysis of
Medication Cost in Herpes Zoster and Postherpetic Neuralgia
5.3. Abstract
Background:
Pain is a main symptom of herpes zoster (HZ), and postherpetic neuralgia (PHN) is a
frequent complication occurring in 5% to 15% of cases, causing moderate to severe
neuropathic pain. A population-based observational study was conducted to evaluate
the treatment patterns and economic burden of prescription drug treatment of HZ and
PHN pain in the province of Manitoba (Canada) over a period of 15 years.
Methods:
Administrative health care data, including medical and hospital separation records, were
examined to identify episodes of HZ using International Classification of Diseases-9/10
codes between April 1, 1997 and March 31, 2014. Episodes of PHN were identified
using medical and prescription claims. Incident use of analgesic, antidepressant, or
anticonvulsant drugs was used to determine prescription pain costs.
Results:
The age-adjusted incidence of HZ increased from 4.7 episodes/1,000 person-years in
1997/98 to 5.7/1,000 person-years in 2013/14. PHN occurred in 9.2% of HZ cases, a
rate that did not change over the study period (P=0.57). The annual cost to treat HZ
pain rose by 174% from 1997/98, reaching CAD $332,981 in 2011/12, 82.8% (95%
confidence interval [CI] 81.2%, 84.3%) of which was related to PHN. The per episode
cost of HZ rose by 111% from $31.59 (95% CI $25.35, $37.84) to $66.81 (95% CI
$56.84, $76.78) and by 94% for PHN from $292 (95% CI $225, $358) to $566 (95% CI

Chapter 5: Zoster Pain and Postherpetic Neuralgia - Paper #2 Page 63
$478, $655). These increases were driven by increasing use of anticonvulsants,
primarily gabapentin, which accounted for 57% of the increase in cost.
Conclusions:
There has been an increase in the incidence of HZ and PHN and in the average cost
associated with the prescription treatment of their resultant neuropathic pain. The
primary driver of the increased episodic cost is the increased use of gabapentin. These
changes have resulted in a substantial increase in the economic burden associated with
HZ and PHN.

Chapter 5: Zoster Pain and Postherpetic Neuralgia - Paper #2 Page 64
Price of Pain: Population-Based Cohort Burden of Disease Analysis of
Herpes Zoster and Postherpetic Neuralgia
5.4. Background
Herpes zoster (HZ) is an infectious disease caused by reactivation of latent varicella
zoster infection. This common viral disease afflicts between 20-30% of the population at
some point in their lifetime; up to 50% of individuals over 80 years of age are affected.1,2
The dermatological symptoms of HZ are typically preceded by prodromal symptoms that
range from a tingling or burning sensation to sharp stabbing pain. This is followed by a
raised, reddish rash and vesicular lesions, typically over the region of skin affected by
prodromal symptoms, 2 to 3 days later. This rash typically affects singular dermatomes
resulting in a unilateral, stripe-like appearance that is diagnostic of HZ. Lesions continue
to erupt for several days before the rash crusts over, generally within 7 to 10 days.
Symptoms then begin to subside and total resolution generally occurs within 3 to 4
weeks.3 While HZ is generally self-limiting, longer lasting complications can occur.
The most common complication of zoster is postherpetic neuralgia (PHN). PHN is
defined as pain that persists after the resolution of the dermatological symptoms of HZ.
It is caused by damage to sensory neurons sustained during the initial active infection
with pain persisting even after the virus has returned to its dormant state.4 There is no
single standard definition of PHN. Pain persisting at 30 to 120 days measured from
onset of HZ or from healing of rash are used in the literature.5–7 Pain persisting at 90
days from initial HZ diagnosis is the most commonly used definition.5–7

Chapter 5: Zoster Pain and Postherpetic Neuralgia - Paper #2 Page 65
The incidence of HZ is estimated at 3.5 to 7 cases per 1000 person-years (PY), with the
incidence in females slightly higher than males.8,9 The incidence of HZ increases
steadily with age, rising to 6-7/1000 PY by 60 years, and continuing to increase
thereafter.2,10,11 The rate of conversion to PHN has been estimated at anywhere from
5% to 60% of HZ cases.7,11,12 This wide range is partially explained by the lack of
standard diagnostic criteria. Studies that used pain persisting at 90 days to define PHN
have a more conservative conversion rate with a narrower range of between 5% and
15%.7–9,11–13
PHN is a challenging condition to treat, and the effectiveness of pharmacological
therapy is limited. The Canadian Pain Society consensus statement on the treatment of
neuropathic pain recommends as first line therapy for PHN one of tricyclic
antidepressants (TCAs), gabapentin, or pregabalin.14 Opioids and topical lidocaine are
listed as second line alternatives. The European Federation of Neurological Societies
2010 treatment guidelines for neuropathic pain largely echo these recommendations.
Opioids, while effective, are not recommended as first line therapy due to side effects,
the development of tolerance, and the risk of dependency.15 A variety of other drugs are
also discussed in the literature, including a number used for other forms of neuropathy,
although their efficacy for PHN is disputed. These include valproic acid/divalproex
sodium, duloxetine, venlafaxine, carbamazepine, tramadol, NSAIDs, and selective
serotonin reuptake inhibitors.6,14–18
While treatment of PHN remains difficult, it is possible to reduce the risk of HZ, and with
it PHN, with the HZ vaccine (Zostavax®, Merck & Co., Inc., Kenilworth, NJ, USA). This
vaccine has been shown to reduce the relative risk of HZ by 51%, and of PHN by

Chapter 5: Zoster Pain and Postherpetic Neuralgia - Paper #2 Page 66
almost 67%. While this makes it possible to decrease the chance of developing HZ and
PHN, these conditions will continue to result in a significant burden to society in the near
future.
To determine the incidence of HZ and rates of PHN, a retrospective cohort study was
conducted in Manitoba, Canada over a period of 17 years. The objectives were to
determine the burden of disease of zoster-related pain, and to understand the major
cost drivers in the changing cost of treating HZ.
5.5. Methods
A population based cohort study was conducted in Manitoba (Canada) using
administrative healthcare data from Manitoba’s universal public health care system
gathered from April 1st 1995 to March 31st 2014 in the course of providing routine
medical care. These data were accessed via the Manitoba Centre for Health Policy
(MCHP) Population Health Research Data Repository, a collection of databases
containing records of contacts of Manitoba residents with the health care system.19
Databases utilized included the Drug Program Information Network (DPIN), which
processes all community-pharmacy based prescriptions for insurance coverage and
drug utilization review; the Medical Services database which contains records of all fee-
for-service medical provider claims; hospital discharge abstracts containing separations
data for all hospitalizations; and the Manitoba Health Registry which contains basic
demographic information on all persons registered with Manitoba Health, Healthy Living
and Seniors. All records are de-identified but contain a unique scrambled personal
health number allowing for the cross-linkage of records over time and across data sets.

Chapter 5: Zoster Pain and Postherpetic Neuralgia - Paper #2 Page 67
Episodes of zoster were identified using diagnostic codes in medical claims and hospital
separations. Individuals with one or more International Classification of Diseases (ICD)
9 codes starting with 053, or ICD-10-CM codes starting with B02 were considered as
HZ cases, the date of the first being the episode start date. The use of ICD diagnostic
codes to diagnose zoster is both highly selective (positive predictive value 93%) and
sensitive (97.5%).20 Multiple episodes per individual were allowed if 2 years had
elapsed between episodes. To ensure only incident episodes were included in the
analysis a two year washout period was used, thus any episodes identified prior to
1997/98 were excluded. Episodes where individuals were under 20 years at diagnosis
were excluded to avoid misclassification of VZ cases as HZ. Cases of PHN were
identified by HZ pain drug treatment or medical claims with HZ ICD codes appearing
past 90 days from diagnosis. Ongoing treatment is defined below.
Drug treatment was categorized using Anatomical Therapeutic Chemical (ATC) classes.
Prescriptions for opioids (ATC codes starting with N02A), NSAIDS (M01),
anticonvulsants (N03A), antidepressants (N06A), nabilone (A04AD), local anesthetics
(D04A), glucocorticoids (H02AB), and ASA and acetaminophen (N02B) associated with
HZ episodes identified in the previous step were collected. Those dispensed between
90 days pre-HZ diagnoses and two years post-diagnosis were evaluated against
several criteria to assess if they were related to HZ or PHN or were only coincident.
Use of each drug class was categorized as either incident or prevalent for that episode
by evaluating prescriptions in the 90 days preceding diagnosis. A drug class was
categorized as prevalent if a person received a total of 30 days’ supply or more within
those 90 days, and all within-class prescriptions were excluded from analysis for that

Chapter 5: Zoster Pain and Postherpetic Neuralgia - Paper #2 Page 68
episode. From the remaining incident class, all prescriptions from diagnosis to the later
of a) 90 days post-diagnosis or b) date of last HZ medical claim, were classified as HZ-
PHN treatment. Prescriptions with dispensation dates outside this window had to meet
the continuous use criteria. A grace period of 100% of the prescription duration was
added to its duration to create an end date. To be considered continuous treatment
there could be no gaps between the end date of previous prescriptions and receipt of
the next. Discontinuity signaled the end of drug treatment and of that episode; all later
prescriptions were removed from further analysis of this episode.
Data were summarized by Manitoba Health fiscal years, which run from April 1st to
March 31st for each year. Results are reported as occurring within the fiscal year of
diagnosis. Incidence rates for HZ were calculated for 1997/98 through to 2013/14, and
age adjusted using the population of Manitoba in 1997 as our standard. As 2 years
follow-up was required to capture all data related to episodes of HZ with PHN, only
episodes diagnosed from 1997/98 to 2011/12 contributed to the PHN analysis.
Regression analysis was conducted on rates of conversion from HZ to PHN across this
interval.
Drug costs were calculated directly from prescription records, included cost of both drug
and dispensing fee, and were adjusted to 2013 Canadian dollars using Statistics
Canada’s consumer price index (CPI) for prescription drug costs in Manitoba. Annual
total prescription costs were tabulated for all HZ episodes, as well as within HZ
episodes that converted to PHN (HZ-PHN). Prescription costs per episode were
calculated and t-tests conducted to determine significance of differences between mean
costs in 1997/98 and 2011/12. Regression on the proportion of total cost due to HZ-

Chapter 5: Zoster Pain and Postherpetic Neuralgia - Paper #2 Page 69
PHN was used to look for trends over time. The relationship between age at diagnosis
and mean treatment cost was examined by regression analysis.
Prescription data was stratified by drug class for HZ-PHN episodes, looking at
anticonvulsants, antidepressants, NSAIDs, and opioids. The number of treated
episodes was determined for each year. Regressions on number of class-wise treated
episodes were used to examine trends over time.
SAS version 9.4 (SAS Institute, Cary NC) was used for all data analysis. Approvals
were granted by the University of Manitoba Health Research Ethics Board (HREB) and
the Manitoba Health Information Privacy Committee (HIPC).
5.6. Results
Between April 1st, 1997 and March 31st, 2014 there were 73,893 episodes of HZ
diagnosed in Manitoba resulting in a mean of 4347 (95% confidence interval (CI) 4067,
4626) episodes per year. There were 5749 episodes of HZ diagnosed in 2013/14, a
50% increase from the 3844 episodes diagnosed in 1997/98. The age standardized
incidence rate of HZ increased by 21%, from 4.70 episodes/1000 PY in 1997/98 to 5.70
episodes/1000 PY in 2013/2014.
Total prescription costs for treating pain from HZ and PHN are shown in Table 1. The
annual cost of prescription drugs used to treat all HZ-related pain rose by over 174%,
from $121,438 in 1997/98 to $332,981 in 2011/12. The drug cost of HZ-PHN episodes
rose by 191%, from $96,554 to $281,342. PHN accounted for a mean of 82.8% (95% CI
81.2%, 84.3%) of drug costs. This percentage did not change significantly over the
course of the study period (p=0.57, R2=0.026).

Chapter 5: Zoster Pain and Postherpetic Neuralgia - Paper #2 Page 70
From 1997/98 through to 2011/12, the period for which full PHN results could be
obtained, there were 6038 episodes of HZ that met study criteria for PHN,
corresponding to a conversion rate of 9.6 %. A linear regression analysis on conversion
rates revealed no significant trend over this period of time (p=0.45 R2= 0.046). However,
the increase in the total number of HZ episodes resulted in a greater number of PHN
cases over time, rising from 331 in 1997/98 to 497 in 2011/12.
The mean cost of treating HZ-related pain increases linearly with age at diagnosis, each
additional year increasing the mean episode cost by $1.04 (p<0.0001 R2= 0.65). (Figure
1) The mean cost for persons aged 20 to 29 years was $24.15 (95% CI $19.95, 28.34),
while for persons aged 60 to 69 the cost was 143% higher at $58.72 (95% CI $52.92,
$64.53).
The average cost of treating an episode of HZ, and separately those episodes with
PHN, increased over the study period (Table 1). The mean cost per episodes to treat all
HZ-related pain rose significantly by 111% (t=5.369, p<0.0001) from 1997/98 to
2011/12; and by 94% for HZ-PHN episodes (t=4.36, p<0.0001).
Changes in the drug classes used to treat of HZ-PHN were evaluated examining the
number of treated episodes by class over time using linear regression. (Figure 2) Only
anticonvulsant use changed significantly with a 212% increase in the number of
anticonvulsant treated episodes from 1997/98 to 2011/12 (p<0.0001, R2=0.92).
The duration of treatment for HZ-PHN varied widely between drug classes. (Figure 3)
The median days supplied was highest for antidepressants (178 days), and
anticonvulsants (134 days), with shorter durations for NSAIDs (50 days) and opioids (28
Chapter 5: Zoster Pain and Postherpetic Neuralgia - Paper #2 Page 71
days). The median duration of anticonvulsant treatment increased from 55 days to 141
days between 1997/98 and 2011/12. There was much less change observed in the
median treatment duration of other drug classes, with antidepressants increasing from
161 days to 190 days, opioids remaining relatively stable with an increase from 26.5
days to 27 days, and NSAIDS decreasing from 38.5 days to 30 days.
The overall annual cost of opioid, NSAID and antidepressant prescriptions underwent a
moderate increase with antidepressants increasing by 91%, opioids by 67%, and
NSAIDs by 35% (Table 2). However, these changes were small compared to the
increase in anticonvulsant use, which underwent a 755% rise in class cost, increasing
from $15,520 to $132,685. This increase accounts for 56% of the total increase in
prescription spending for the treatment of all HZ associated pain.
The most frequently prescribed anticonvulsant drug for HZ-PHN also changed over
time. In 1997 carbamazepine prescriptions accounted for 62% (260 prescriptions) of all
anticonvulsant prescriptions, while gabapentin accounted for only 21% (89
prescriptions). In contrast, in 2011 only 3.2% (80 prescriptions) of all anticonvulsant
prescriptions were for carbamazepine. Gabapentin accounted for 73% (1798) of
prescriptions, while pregabalin, which was not available in 1997, accounted for 9.2%
(226).
5.7. Discussion
The economic burden of treating HZ associated pain, and PHN in particular, increased
significantly from 1997/98 to 2011/12 (Table 1). This increase is the combined result of
increases in both the incidence of diagnosed HZ and in mean episode cost of

Chapter 5: Zoster Pain and Postherpetic Neuralgia - Paper #2 Page 72
prescription drug treatment of pain. A dramatic increase in gabapentin was found to be
a primary driver of mean episode cost.
Over the seventeen year period of 1997/98 to 2013/14 there has been a sustained
increase in the incidence of herpes zoster, with a resulting increase in the number of
PHN cases. Changes in size and increasing age21 of the provincial population explain
the majority of this increase. However, after taking both these factors into account, a
significant 21% increase in the age-adjusted incidence per thousand people remains.
As the rate of conversion from HZ to PHN did not change over the study period, the
increased number of HZ episodes resulted in an increase in the number of PHN cases.
This increase in PHN is an important factor in determining the economic burden of HZ
as these cases were responsible for over 80% of HZ-related analgesic prescription
costs.
Not only were there more HZ and PHN cases, there was also a significant increase in
the mean cost per episode related to the treatment of pain. This higher episode cost
was driven by the increased use of anticonvulsant drugs, primarily gabapentin. While
the number of users of anticonvulsants rose, the use of other classes of drugs remained
relatively unchanged (Table 2). Not only did the number of persons using anticonvulsant
drugs increase, the median duration of treatment with them increased as well.
From an evidence-based perspective this change might seem surprising. There is
considerable debate on whether this increased expenditure is justified. There is limited
evidence demonstrating superior efficacy, and a much greater cost compared to the
other first line therapy such as TCAs.22 In fact, one systematic review estimated the
NNT for a 50% reduction of pain of gabapentin to be 4.39 (95%CI 3.34-6.07), while that

Chapter 5: Zoster Pain and Postherpetic Neuralgia - Paper #2 Page 73
of TCAs was 2.64 (95% CI 2.1-3.54).23 Gabapentin was introduced to the Canadian
market in December 1994 when it was approved for the adjunctive treatment of partial
seizures.24 It was aggressively marketed to physicians for a number of non-approved
indications, including PHN, by Parke Davis. This promotion eventually lead to a US
federal lawsuit against the company for off-label marketing in 1996.25 It was not until
2004 that the FDA approved gabapentin for PHN, 25 although it has never received this
indication in Canada. Some of this promotion suggested that TCA use for PHN was
inappropriate in older patients from a safety perspective.22 However, gabapentin is not
without its own adverse effects and a systematic review suggests the number needed to
harm (NNH) for major harms is actually similar for gabapentin (NNH= 12.25, 95% CI
7.69-30.2) and TCAs (NNH= 16.9, 95% CI 8.85-178).23
Concerns have been raised about the use of opioids in non-cancer pain.26 These
include the risk of dependency, the development of tolerance, and the potential for
abuse, and are part of the rationale for listing opioids as second line PHN treatment
options.15,27 However, opioids were used frequently to treat HZ-PHN episodes (Figure
2). While the high rate of use may be concerning, the median of duration of opioid
treatment (Figure 3) reveals generally short-term use, possibly reflecting appropriate
opioid stewardship.
This study has a number of strengths and limitations. Population level data from a
universal single payer health-care system ensures virtually all contacts of residents with
this healthcare system and all prescription dispensations are captured in the study.
These data sets also allow us to directly measure health system costs rather than
inferring results from survey data or sampling, as it has been done in many previous

Chapter 5: Zoster Pain and Postherpetic Neuralgia - Paper #2 Page 74
studies.12,28–30 There are also several limitations to this study. We are unable to
measure the true incidence of HZ in the population as only persons who sought medical
treatment appear in the administrative data. However, previous studies have reported
that up to 95-99% of persons with HZ will seek medical attention.8,28 Second, HZ
diagnostic codes or prescription treatment past 90 days post diagnosis were used as a
proxy for a PHN diagnosis as we only had access to the first three digits of ICD codes in
our data. Thus rates reported are of HZ cases requiring ongoing medical management,
sometimes referred to as clinically significant PHN. This methodology is common in
administrative data studies looking at PHN.8 Lastly, the use of non-prescription
medications, including low dose ibuprofen and naproxen, acetaminophen, ASA, and
topical treatments is not captured. However, these costs are outside the scope of this
study.
The total costs of treating pain associated with HZ and PHN rose by 174% between
1997/98 and 2011/12. There are two primary components to this increasing economic
burden. The first is the increasing number of HZ cases. While some of this can be
attributed to an aging population, the age standardized incidence of HZ has increased.
The second component is the increasing average cost of treating an episode of HZ-
PHN driven by the use of higher cost anticonvulsants for longer periods of time.
Management of the economic burden of HZ-PHN analgesic treatment should include
use of evidence-based cost effective therapies, and measures such as vaccination
which can help reduce the incidence of HZ.

Chapter 5: Zoster Pain and Postherpetic Neuralgia - Paper #2 Page 75
5.8. Acknowledgments
The authors acknowledge the Manitoba Centre for Health Policy for use of data
contained in the Population Health Research Data Repository under project
#H2014:411 (HIPC# 2014/2015-35). The results and conclusions are those of the
authors and no official endorsement by the Manitoba Centre for Health Policy, Manitoba
Health, Seniors and Active Living, or other data providers is intended or should be
inferred. Data used in this study are from the Population Health Research Data
Repository housed at the Manitoba Centre for Health Policy, University of Manitoba and
were derived from data provided by Manitoba Health, Seniors and Active Living. We
would also like to thank Heather Prior from the Manitoba Centre for Health Policy for her
assistance and preliminary data extraction.

Chapter 5: Zoster Pain and Postherpetic Neuralgia - Paper #2 Page 76
5.9. Tables and Figures
Table 5.9-1 Total and cost per episode of treating herpes zoster related pain by year
Total prescription cost per episode. , and include prescriptions for postherpetic neuralgia when present. Costs are reported in
2013 Canadian dollars. Abbreviations: HZ, herpes zoster; PHN, postherpetic neuralgia; Rxs, prescriptions; CI, confidence
interval
Herpes Zoster Episodes Herpes Zoster with PHN
Year Cases Rxs Total Cost Mean Cost (95% CI) Cases Rxs Total Cost Mean PHN Cost (95% CI)
1997/98 3844 6082 $121,438 $31.59 ($25.35, $37.84) 331 3925 $96,555 $291.71 ($225.45, $357.96)
1998/99 3781 6309 $130,276 $34.46 ($28.38, $40.53) 349 4229 $107,007 $306.61 ($248.06, $365.16)
1999/00 3941 7820 $245,329 $62.25 ($50.74, $73.76) 367 5526 $215,149 $586.24 ($475.95, $696.53)
2000/01 3954 7629 $224,626 $56.81 ($46.70, $66.92) 399 5440 $192,830 $483.28 ($393.34, $573.23)
2001/02 4060 8282 $271,792 $66.94 ($52.67, $81.22) 429 6064 $236,570 $551.45 ($425.20, $677.69)
2002/03 4126 8015 $254,967 $61.80 ($52.07, $71.52) 410 5554 $215,795 $526.33 ($440.91, $611.75)
2003/04 4070 7783 $231,833 $56.96 ($47.57, $66.35) 375 5541 $191,562 $510.83 ($421.55, $600.12)
2004/05 4087 7070 $194,372 $47.56 ($40.78, $54.34) 379 4670 $153,891 $406.05 ($343.97, $468.12)
2005/06 4131 7886 $214,436 $51.91 ($44.30, $59.51) 432 5581 $172,052 $398.27 ($334.80, $461.74)
2006/07 4143 7918 $207,393 $50.06 ($42.52, $57.60) 377 5586 $165,257 $438.35 ($366.84, $509.86)
2007/08 4207 7968 $193,942 $46.10 ($39.89, $52.31) 377 5674 $152,928 $405.64 ($348.23, $463.06)
2008/09 4295 9435 $252,994 $58.90 ($50.77, $67.04) 440 7147 $209,013 $475.03 ($407.32, $542.74)
2009/10 4584 9393 $267,865 $58.43 ($49.20, $67.67) 427 7024 $222,968 $522.17 ($434.64, $609.71)
2010/11 4622 9102 $276,383 $59.80 ($49.42, $70.17) 449 6617 $230,827 $514.09 ($416.88, $611.30)
2011/12 4984 11065 $332,981 $66.81 ($56.84, $76.78) 497 8398 $281,342 $566.08 ($477.51, $654.66)

Chapter 5: Zoster Pain and Postherpetic Neuralgia - Paper #2 Page 77
Antidepressants Anticonvulsants NSAIDs Opioids Miscellaneous
Year Users Cost Users Cost Users Cost Users Cost Users Cost
1997 348 $35,607 153 $15,520 400 $23,122 866 $33,208 544 $13,980
1998 378 $29,458 168 $29,124 380 $34,326 838 $23,896 520 $13,471
1999 404 $39,612 235 $83,398 475 $64,916 893 $43,752 571 $13,651
2000 424 $46,315 250 $64,642 479 $66,661 893 $34,441 505 $12,567
2001 440 $48,663 293 $85,722 469 $47,112 885 $70,139 544 $20,157
2002 435 $52,683 298 $82,635 453 $48,795 920 $56,048 574 $14,806
2003 425 $46,661 303 $71,625 398 $32,101 819 $62,947 532 $18,498
2004 444 $49,589 326 $63,383 368 $28,335 889 $36,793 552 $16,273
2005 445 $44,140 364 $78,247 377 $29,826 902 $40,096 540 $22,127
2006 419 $49,873 389 $70,737 364 $27,909 848 $31,437 502 $27,437
2007 396 $37,136 485 $86,579 325 $24,099 829 $31,008 501 $15,119
2008 397 $51,837 533 $112,910 389 $27,118 828 $35,141 515 $25,988
2009 430 $54,128 540 $122,855 348 $24,299 866 $41,026 518 $25,558
2010 428 $49,949 581 $123,577 326 $23,549 853 $42,545 526 $36,763
2011 447 $67,903 694 $132,685 383 $31,252 926 $55,318 582 $45,824
Table 5.9-2 Treatment of herpes zoster related pain by drug class.
Total treated herpes zoster episodes (users) and drug class cost by year. Numbers are for all herpes zoster related pain,
including post-herpetic neuralgia. A single episode can be treated with more than one class of drug, possibly contributing data
to multiple categories.

Chapter 5: Zoster Pain and Postherpetic Neuralgia - Paper #2 Page 78
Figure 5.9-1 Mean cost of herpes zoster pain treatment by age.

Chapter 5: Zoster Pain and Postherpetic Neuralgia - Paper #2 Page 79
Figure 5.9-2 Treatment of Post-Herpetic Neuralgia Episodes by Drug Class
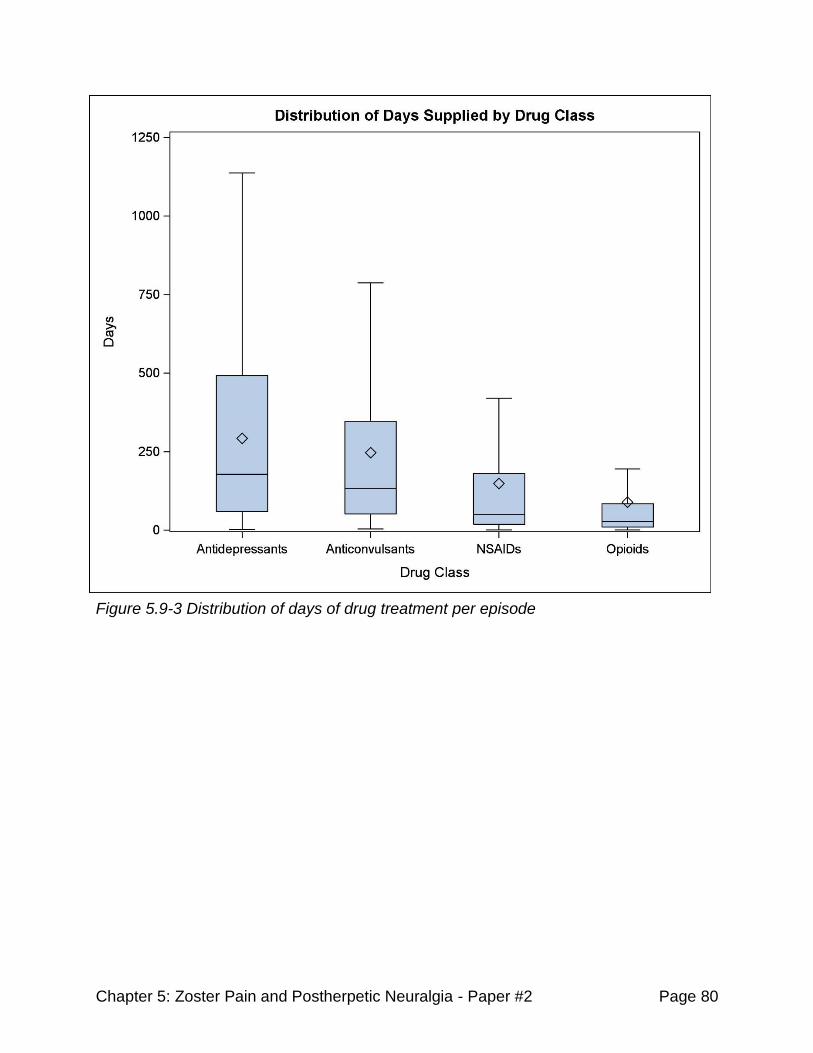
Chapter 5: Zoster Pain and Postherpetic Neuralgia - Paper #2 Page 80
Figure 5.9-3 Distribution of days of drug treatment per episode
Chapter 5: Zoster Pain and Postherpetic Neuralgia - Paper #2 Page 81
5.10. References
1. Brisson M, Edmunds WJ, Law B, et al. Epidemiology of varicella zoster virus
infection in Canada and the United Kingdom. Epidemiol Infect. 2001;127(02):305-314.
2. Johnson RW, Alvarez-Pasquin M-J, Bijl M, et al. Herpes zoster epidemiology,
management, and disease and economic burden in Europe: a multidisciplinary
perspective. Ther Adv vaccines. 2015;3(4):109-120.
3. Dworkin RH, Johnson RW, Breuer J, et al. Recommendations for the
management of herpes zoster. Clin Infect Dis. 2007;44 Suppl 1:S1-S26.
4. Bennett G, Watson C. Herpes Zoster and Postherpetic Neuralgia: Past, present
and future. Pain Res Manag. 2009;14(4):275-282.
5. Snedecor SJ, Sudharshan L, Cappelleri JC, et al. Systematic review and meta-
analysis of pharmacological therapies for pain associated with postherpetic neuralgia
and less common neuropathic conditions. Int J Clin Pract. 2014;68(7):900-918.
6. Tontodonati M, Ursini T, Polilli E, et al. Post-herpetic neuralgia. Int J Gen Med.
2012;5:861-871
7. Gauthier a, Breuer J, Carrington D, Martin M, Rémy V. Epidemiology and cost of
herpes zoster and post-herpetic neuralgia in the United Kingdom. Epidemiol Infect.
2009;137(1):38-47.
8. Ultsch B, Köster I, Reinhold T, et al. Epidemiology and cost of herpes zoster and
postherpetic neuralgia in Germany. Eur J Health Econ. 2013;14(6):1015-1026.
9. Weitzman D, Shavit O, Stein M, Cohen R, Chodick G, Shalev V. A population
based study of the epidemiology of Herpes Zoster and its complications. J Infect.
2013;67(5):463-469.

Chapter 5: Zoster Pain and Postherpetic Neuralgia - Paper #2 Page 82
10. Tanuseputro P, Zagorski B, Chan KJ, Kwong JC. Population-based incidence of
herpes zoster after introduction of a publicly funded varicella vaccination program.
Vaccine. 2011;29(47):8580-8584.
11. Edmunds WJ, Brisson M, Rose JD. The epidemiology of herpes zoster and
potential cost-effectiveness of vaccination in England and Wales. Vaccine. 2001;19(23-
24):3076-3090.
12. Cebrián-Cuenca AM, Díez-Domingo J, San-Martín-Rodríguez M, Puig-Barberá J,
Navarro-Pérez J. Epidemiology and cost of herpes zoster and postherpetic neuralgia
among patients treated in primary care centres in the Valencian community of Spain.
BMC Infect Dis. 2011;11(1):302.
13. Gialloreti LE, Merito M, Pezzotti P, et al. Epidemiology and economic burden of
herpes zoster and post-herpetic neuralgia in Italy: a retrospective, population-based
study. BMC Infect Dis. 2010;10:230.
14. Moulin D, Boulanger A, Clark a J, et al. Pharmacological management of chronic
neuropathic pain: revised consensus statement from the Canadian Pain Society. Pain
Res Manag. 2014;19(6):328-335.
15. Attal N, Cruccu G, Baron R, et al. EFNS guidelines on the pharmacological
treatment of neuropathic pain: 2010 revision. Eur J Neurol. 2010;17(9):1113-e88.
16. Boivin G, Jovey R, Elliott CT, Patrick DM. Management and prevention of herpes
zoster: A Canadian perspective. Can J Infect Dis Med Microbiol. 2010;21(1):45-52.
17. Philip A, Thakur R. Post Herpetic Neuralgia. J Palliat Med. 2011;14(6):765-773.
doi:10.1089/jpm.2011.9685.
18. Massengill JS, Kittredge JL. Practical considerations in the pharmacological
treatment of postherpetic neuralgia for the primary care provider. J Pain Res.
2014;7:125-132.

Chapter 5: Zoster Pain and Postherpetic Neuralgia - Paper #2 Page 83
19. Roos LL, Brownell M, Lix L, Roos NP, Walld R, Macwilliam L. From health
research to social research : Privacy , methods , approaches. Soc Sci Med.
2008;66:117-129.
20. Klompas M, Kulldorff M, Vilk Y, Bialek SR, Harpaz R. Herpes Zoster and
Postherpetic Neuralgia Surveillance Using Structured Electronic Data. Mayo Clin Proc.
2011;86(12):1146-1153.
21. Statistics Canada. Annual Demographic Estimates: Canada, Provinces and
Territories. (webpage) Ottawa, ON; 2015. http://www.statcan.gc.ca/pub/91-215-x/91-
215-x2014000-eng.pdf. Accessed November 2, 2015.
22. O’Connor AB, Noyes K, Holloway RG. A Cost-Effectiveness Comparison of
Desipramine, Gabapentin, and Pregabalin for Treating Postherpetic Neuralgia. J Am
Geriatr Soc. 2007;55(8):1176-1184.
23. Hempenstall K, Nurmikko TJ, Johnson RW, A’Hern RP, Rice ASC. Analgesic
therapy in postherpetic neuralgia: A quantitative systematic review. PLoS Med.
2005;2(7):0628-0644.
24. Drug Products Database. Health Canada Drug Products Directorate (web based
database). http://webprod5.hc-sc.gc.ca/dpd-bdpp/index-eng.jsp. Accessed November 2,
2015.
25. Torborg DS. The Dark Side of the Boom : The Peculiar Dilemma of Modern False
Claims Act Litigation. J Law Health. 2013;26:181-218.
26. National Opioid Use Guideline Group. Canadian Guideline for Safe and Effective
Use of Opioids for Chronic Non-Cancer Pain - Part A Executive Summary. 2010:1-38
(website)
http://nationalpaincentre.mcmaster.ca/documents/opioid_guideline_part_a_v4_5.pdf.
Accessed November 2, 2015.
Chapter 5: Zoster Pain and Postherpetic Neuralgia - Paper #2 Page 84
27. Moulin DE, Clark a. J, Gilron I, et al. Pharmacological management of chronic
neuropathic pain - Consensus statement and guidelines from the canadian pain society.
Pain Res Manag. 2007;12(1):13-21.
28. Bilcke J, Ogunjimi B, Marais C, et al. The health and economic burden of
chickenpox and herpes zoster in Belgium. Epidemiol Infect. 2012;140(11):2096-2109.
29. Di Legami V, Gianino MM, Atti MCD, et al. Epidemiology and costs of herpes
zoster: Background data to estimate the impact of vaccination. Vaccine.
2007;25(43):7598-7604.
30. Lionis CD, Vardavas CI, Symvoulakis EK, et al. Measuring the burden of herpes
zoster and post herpetic neuralgia within primary care in rural Crete, Greece. BMC Fam
Pract. 2011;12(1):136.

Chapter 6: Burden of Herpes Zoster and PHN – Paper #3 Page 85
Chapter 6. Cost of Shingles: Population Based Burden of
Disease Analysis of Herpes Zoster and Postherpetic
Neuralgia
6.1. Chapter Introduction
The third and final thesis paper looks at the overall healthcare system burden of HZ and
PHN in Manitoba. This is done by examining the results of the previous two papers with
the two other main treatment modalities: medical care and hospitalization.
Hospitalization is an infrequent result of HZ, but has an oversize impact on the total
disease burden due to its high cost, with a typical HZ-related stay costing upwards of
$12,000. The provision of medical care is also extremely important and is similar in
scale to the cost of pharmacotherapy. Trends in the total annual, and mean episode
costs for each of the three pillars of treatment are reported for both HZ in general, and
episodes of HZ with PHN specifically for the period of 1997/98 to 2011/13.
In addition, a more in depth analysis of changes in the age-adjusted incidence of HZ
over the period of 1997/98 to 2013/14 is reported. A piecewise regression analysis is
used to examine an apparent breakpoint in incidence of HZ.

Chapter 6: Burden of Herpes Zoster and PHN – Paper #3 Page 86
6.2. Manuscript Cover Page
Cost of Shingles: Population Based Burden of Disease Analysis of
Herpes Zoster and Postherpetic Neuralgia
Kevin J Friesen BSc (Pharm)1, Dan Chateau PhD2, Jamie Falk BSc (Pharm) PharmD 1,
Silvia Alessi-Severini BSc (Pharm) PhD1, Shawn Bugden MSc. Pharm.D1
1College of Pharmacy, Rady Faculty of Health Sciences, University of Manitoba, 750
Bannatyne Ave, Winnipeg, MB, R3E 0T5. 2Assistant Professor, Department of
Community Health Sciences, College of Medicine, Rady Faculty of Health Sciences,
University of Manitoba, Winnipeg, Mb, R3E 3P5
Running Header: Burden of Herpes Zoster and Postherpetic Neuralgia
Keywords: Herpes zoster, burden, economics, postherpetic neuralgia
Contributions:
Kevin Friesen designed this study, analysed the data, and wrote this manuscript. Shawn
Bugden assisted in study design, provided guidance during the analytical phase of the
study, and critically reviewed the study. Silvia Alessi-Severini was involved in the
initiation of this research program and critically reviewed the manuscript. Dan Chateau
and Jamie Falk both provided guidance and extensively reviewed and commented on
this manuscript throughout the editing process.

Chapter 6: Burden of Herpes Zoster and PHN – Paper #3 Page 87
Cost of Shingles: Population Based Burden of Disease Analysis of
Herpes Zoster and Postherpetic Neuralgia
6.3. Abstract
Background:
Herpes zoster (HZ) is a dermatological disease that results in significant pain and
distress, and is frequently complicated by postherpetic neuralgia (PHN). Together,
these illnesses produce a significant economic burden to the healthcare system.
Methods:
Administrative healthcare data collected over the period of April 1st 1997 to
March 31st 2014 were analyzed to determine the burden of HZ, looking at three primary
treatment domains: prescription drugs, medical care, and hospitalization.
Episodes of HZ were identified using international classification of disease (ICD)
codes. Piecewise regression was used to examine the age-adjusted (AA) incidence of
HZ from 1997/98-2013/14. Costs analysis was restricted to 1997/98-2011/12 to allow for
equal follow-up time for all episodes. All amounts were adjusted for inflation and
expressed in 2013 Canadian dollars.

Chapter 6: Burden of Herpes Zoster and PHN – Paper #3 Page 88
Results:
A total of 73,886 episodes of HZ were identified between 1997/98 and 2013/14.
The annual number of HZ increased by 49.5% over this period. Piecewise regression on
the AA-incidence of HZ revealed a breakpoint in 2008/09 (F(3,13)=59.6, p<0.0001). The
pre-breakpoint incidence was stable at 4.7 episodes/1000 person-years (PY). Post-
breakpoint, the incidence began to climb reaching 5.7 episodes/1000 PY in 2013/14.
The cost of pharmacotherapy rose significantly (p <0.03) from $89.77/episode
(95% CI: $82.96, $96.59) to $127.34/episode (95% CI: $117.24, $137.44). Mean
medical costs also rose significantly (p <0.0001) from $57.98/episode (95% CI; $55.26,
$60.70) to $78.84/episode (95% CI; $74.08, $83.61). Hospitalization rates declined from
3.10% in 1997/98 to 1.36% in 2011/12, with mean per-episode cost dropping from
$397/episode (95% CI; $284, $511) to $195/episode (95% CI; $129, $260).
Total annual costs of HZ and PHN were $1,997,183 in 2011/12, 4.7% lower than
the 1997/98 costs of $2,095,633.
Conclusion:
A significant increase in annual number of HZ cases was observed, driven
largely by demographic factors. However, the 21% increase in the AA-incidence reveals
changes in HZ rates beyond those expected by population shifts.
The increase in HZ cases and rising medical and prescription costs were offset by the
dramatic drop in HZ-related hospitalizations rates of hospitalization. What is not clear is
whether offsetting cost reductions (declining hospitalizations, introduction of generic
drugs) can be maintained in the future. Ultimately, it is the balance of these trends that

Chapter 6: Burden of Herpes Zoster and PHN – Paper #3 Page 89
have left the total burden of disease unchanged, but this will likely be challenged by
increasing rates of disease.

Chapter 6: Burden of Herpes Zoster and PHN – Paper #3 Page 90
Cost of Shingles: Population Based Burden of Disease Analysis of
Herpes Zoster and Postherpetic Neuralgia
6.4. Background
The varicella zoster virus (VZV) causes varicella zoster (VZ) upon initial infection,
affecting the skin and its sensory neurons. As VZ resolves, the virus enters a latent
state in neuronal ganglia, remaining there for life.1–3 Reactivation of VZV, typically within
singular ganglia, causes herpes zoster (HZ), a dermatological condition similar in
symptoms to VZ but causing moderate to severe pain.4,5 A potential complication of HZ
is postherpetic neuralgia (PHN), a longer-lasting pain syndrome caused by inflammation
or virus-induced nerve damage.4–6
Before a VZ vaccine became available in 1999 (Varivax, Merck Frosst Canada & Co),
nearly all persons were infected with VZV, typically as a child. By the age of 40, VZV
prevalence was 95%-97%.7,8 Virtually this entire pre-VZ vaccine population is at risk of
developing HZ, with an incidence estimated at between 1.2 and 6.3 cases per 1000
person years (PY), with rates increasing with age. The lifetime prevalence of HZ is
between 20-30%, rising to 50% by age 80. 2,7,9,10
The antiviral drugs acyclovir, valacyclovir, and famciclovir are the cornerstone of HZ
treatment and reduce the duration and severity of symptoms, including pain.11
Treatment should begin within 72 hours of the onset of symptoms and continue for 7
days.2,6,12 Antiviral drugs have been reported to account for 50-70% of the drug cost for
treated cases of HZ.13–16 Other drugs used to treat HZ pain include analgesics, opioids,
glucocorticoids, and topical lidocaine.

Chapter 6: Burden of Herpes Zoster and PHN – Paper #3 Page 91
Despite being relatively common, there is no a standard definition of PHN, particularly in
reference to the duration of pain which differentiates continuing HZ pain from PHN. One
of the more common criteria used is the persistence of pain for 90 days or more post-
HZ diagnosis. Studies using this definition report that 5%-15% of HZ cases convert to
PHN.13–15,17–19 PHN is a challenging condition to treat. The Canadian Pain Society
consensus statement and the European Federation of Neurological Societies (EFNS)
treatment guidelines list tricyclic antidepressants (TCAs), gabapentin, and pregabalin as
first line; and opioids or topical lidocaine as second line treatment options for PHN.20,21
In randomized controlled trials, the HZ vaccine (Zostavax®, Merck), introduced to
Canada in September 2009, has been shown to reduce the burden of HZ by 61%,
decrease the relative risk of HZ by 51%, and that of PHN by almost 67%.16,22–24
A number of recent studies have looked at the burden of HZ-PHN in a variety of health
care systems, including Belgium,25 France,26 Germany,14,27 Greece,28 Italy,13,29 Spain,18
the United Kingdom,15 and Israel.17 However, little recent Canadian data have been
published. To establish the current burden of HZ and PHN in the setting of a universal
healthcare system, and to look at long term trends in their treatment costs, a
retrospective, population based study was conducted over the 15 year period from
1997/98 to 2011/12 in Manitoba, Canada.
6.5. Methods
Using an observational, cohort-based methodology, the incidence and burden of HZ
and PHN were examined from April 1st 1997 to March 31st 2014 using administrative
healthcare data from the province of Manitoba, Canada. Data was obtained from the

Chapter 6: Burden of Herpes Zoster and PHN – Paper #3 Page 92
Manitoba Centre for Health Policy (MCHP), which maintains a data repository
containing records of virtually every contact between Manitoba residents and the
province’s universal healthcare system.30,31 All records are de-identified but contain a
unique number that allows researchers to link individual patient records across
databases.
Databases used included the Drug Program Information Network (DPIN), a community-
pharmacy based prescription processing system that enables submission of online
insurance claims by pharmacies, the Medical Services database which contains records
of fee-for-service medical claims, Hospital Discharge Abstracts containing summary
data of each hospital stay; the Manitoba Immunization Monitoring System (MIMS)
database which contains records on vaccines administered in the population, and the
Manitoba Health Registry from which population counts and basic demographics on
individuals can be obtained.
Cases of HZ were identified using International Classification of Diseases (ICD)
diagnostic codes. This method has been shown to be highly selective (positive
predictive value 93%) and sensitive (97.5%).32 Individuals with one or more ICD-9-CM
(Clinical Modification) codes starting with ‘053’, or ICD-10-CA (Canadian enhancement)
codes starting with ‘B02’ were classified as HZ cases, with episodes starting on the date
of the first code. HZ was considered to have converted to PHN when medical services
claims or prescriptions for HZ were received 90 days or more after diagnosis.
Multiple episodes of HZ were allowed provided two conditions were met: 1) a minimum
of 2 years had elapsed since the start, and 2) a minimum of 180 days had elapsed since
the last HZ ICD code from the preceding episode. To avoid misclassification of

Chapter 6: Burden of Herpes Zoster and PHN – Paper #3 Page 93
prevalent episodes, episodes with start dates prior to April 1st 1997 were discarded.
Episodes in individuals under 20 years of age were excluded from the analysis to avoid
misclassification of potentially miscoded VZ cases. Furthermore, to avoid
misclassification of physician visits regarding HZ vaccine as episodes, the MIMS
database was searched for HZ vaccination records. As MIMS does not capture all HZ
vaccinations we also used DPIN to search for vaccine prescriptions, and medical claims
to find vaccination tariff codes, using these as surrogate markers of vaccination. Any HZ
episode starting within 30 days of vaccination was excluded.
Pharmacotherapy was assessed using DPIN. Prescriptions for acyclovir, valacyclovir,
and famciclovir dispensed in the first 30 days of an episode were classified as HZ
antiviral treatment. DPIN was searched by Anatomical Therapeutic Chemical (ATC)
class. Prescriptions for nabilone (ATC class A04AD), local anesthetics (D04A), systemic
corticosteroids (H02A), NSAIDS (M01), opioids (N02A), ASA, acetaminophen (N02B),
anticonvulsants (N03A), and antidepressants (N06A) were categorized as HZ pain
prescriptions, provided that several conditions were met: 1) treatment of pain with any
drug class began within 90 days following diagnosis; 2) use of a class was incident to
diagnosis; and 3) use after the later of 90 days post-diagnosis and date of last ICD code
for HZ was continuous. Use within a drug class was considered incident if less than 30
of the 90 days pre-diagnosis had prescription coverage from that class. Continuous use
was defined as no gaps between prescription dispensations greater than 200% the
duration of the previous prescription.
All costs were adjusted for inflation to 2013 Canadian dollars using the Statistics
Canada consumer price index.

Chapter 6: Burden of Herpes Zoster and PHN – Paper #3 Page 94
HZ episodes were further stratified into two subcategories based on PHN status: HZ
episodes with no diagnosis of PHN (HZ-only), and HZ episodes that converted to PHN
(HZ-PHN). Costs were analyzed across all HZ episodes, and then within each strata
separately. The Manitoba Pharmacare fiscal year (April 1st to March 31st) was used for
analysis over time. All costs and events were considered to have been incurred in the
fiscal year of diagnosis.
Due to observation time required, two separate reporting periods are used.
Epidemiology is reported from 1997/98-2013/14 as a follow-up period is not required.
For burden analysis, two years of observable time is required to capture costs accruing
over episodes, especially for HZ-PHN. These results are reported for 1997/98- 2011/12
Statistical Analysis
The number of episodes and incidence rate of HZ, and PHN conversion rates were
calculated for each study year. The age-adjusted incidence was determined using the
1997 Manitoba population as our standard. A segmented regression analysis was
conducted to examine an apparent change in incidence of HZ. Ordinary least sum of
squares (OLS) regression analysis was used for trend analysis of costs and utilization.
Due to non-linearity and high variance, OLS regression was not suitable for
hospitalization costs. Instead, a t-test was used to compare annual hospital costs over
the first (1997/98-2003/04) and last (2004/05-2011/12) halves of the study period.
SAS® version 9.4 (SAS Institute, Cary, NC) and Microsoft Excel 2013® (Microsoft
Corporation, Redmond WA) were used for data analysis. Approvals were granted by the
University of Manitoba Health Research Ethics Board (HREB) and the Manitoba Health
Information Privacy Committee (HIPC).

Chapter 6: Burden of Herpes Zoster and PHN – Paper #3 Page 95
6.6. Results
6.6.1. Trends over time
A total of 73,886 episodes of HZ were diagnosed between 1997/98 and 2013/14, an
overall crude incidence of 4.99 cases/1000 person-years (PY). A sustained upward
trend in the annual numbers of HZ episodes was observed across the study period
(Table 1). There were 5,746 episodes of HZ identified in 2013/14, a 49.5% increase
from 1997/98.
To adjust for the effects of an increase in the size and age distribution, the age-adjusted
(AA) incidence was calculated and plotted (Figure 1). This revealed two linear trends
that appeared to converge between 2009/10 and 2010/11. Piecewise regression on the
AA-incidence revealed a breakpoint in July 2009 (F(3,13)=59.6 p<0.0001). Prior to
2009/10, the incidence of HZ remained relatively steady (p=0.96) at 4.70 cases/1000
PY (95% confidence interval (CI): 4.65, 4.75). Starting in 2009/10 the AA-incidence
began increasing on average by 0.29 cases/1000 PY/year (95% CI: 0.20, 0.37),
reaching 5.70 cases/1000 PY in 2013/14, a 21% increase from pre-2009/10 level.
Pharmacotherapy
Trends in drug utilization, medical claims cost, hospitalizations, and total cost were
examined over the period from 1997/98 to 2011/12.
Antiviral treatment rates increased from 41.7% to 62.9% (F(1,13)= 220 p<0.0001 R2=
0.94) over this period. The cost per treatedepisode dropped from $139.61 to $96.20 due
to the introduction of generic antiviral drugs. The mean cost of pain treatment per
episode increased by over 111% for HZ, rising from $31.59 (95% CI: $25.35, $37.84) to

Chapter 6: Burden of Herpes Zoster and PHN – Paper #3 Page 96
$66.81 (95% CI: $56.84, $76.79), and by 94% for HZ-PHN, from $291 (95% CI: $225,
$358) to $566 (95% CI: $478, $655) over the same interval. On average, HZ-PHN
episodes were responsible for 83% of pain-related drug costs, a proportion that
remained unchanged over time (p=0.57).
The mean cost for all drug treatment rose significantly (F(1,13)=6 p<0.03 R2=0.32), from
$89.77 (95% CI: $82.96, $96.59) to $127.34 (95%CI: $117.24, $137.44), with the
majority of this increase occurring in the first three study years (Figure 2). There was a
significant upward linear trend in the total annual drug cost (F(1,13)= 30.4 p<0.0001
R2=0.70), a result of the increase in the number of HZ cases and the rise in mean per
episode cost (Figure 3).
Medical Services Utilization.
An upward trend in utilization of medical services was observed (F(1,13)= 59.5 p<0.0001
R2=0.82), The number of medical claims per episodes of zoster rose slightly from 2.53
claims/episode (95% CI: 2.41, 2.65) to 2.80 claims/episode (95% CI: 2.67, 2.93), while
the costs per medical claim rose 23% (F(1,13=59.9, p<0.0001 R2= 0.82). Together, these
trends produced a linear increase in the per episode cost (F(1,13= 48.0 p<0.00001
R2=0.76) from $57.98/episode (95% CI: $55.26, $60.70) in 1997/98, to $78.84/episode
(95% CI: $74.08, $83.61) in 2011/12 (Figure 2). The effect of these trends is amplified
by the increase in HZ cases resulting in a significant increase in total annual medical
costs (F(1,13=182.0 p<0.0001 R2= 0.93)(Table 1).
Hospitalization
The cost per HZ related hospitalization did not change significantly over the study
period with a mean of $12,038/ hospitalization (95% CI: $11,068, $13,007). The overall
Chapter 6: Burden of Herpes Zoster and PHN – Paper #3 Page 97
mean length of stay was 13.95 days (95% CI: 12.71, 15.19) and did not change
significantly (1997/98 vs 2011/12 t=-1.62, p=0.11). There was a sharp drop in the rate of
HZ-related hospitalization across the study period (F(1,13)= 49.6 p<0.0001 R2= 0.79),
from 3.10% in 1997/98 (119 hospitalizations) to 1.36% in 2011/12 (68 hospitalizations).
This resulted in the mean per episode cost of hospitalization dropping significantly
(F=25.0 p=0.0002 R2= 0.62) from $397 (95% CI: $284, $511) to $195 (95% CI: $129,
$260), a decline of 51.0%.
Hospitalization costs accounted for 48.5% of total costs in 2011, down from 72.9% in
1997/98. The mean annual cost over the first half of the study (1997/98-2003/04) was
$1,145,074 (95% CI: $968,817, $1,321,331), significantly higher than the mean cost of
$710,400 (95% CI: $560,336, $860465) seen over last half of the study (2004/05-
2011/12) (t(13)=4.55, p=0.0005).
Total Cost
The annual total health care costs of treating HZ are shown in Table 1. Linear
regression analysis revealed no significant trend across the study period (p= 0.25) with
the total health system burden of HZ and PHN being 4.7% lower in 2011/12 than in
1997/98.
6.6.2. Herpes Zoster Burden and Mean Costs 2011/12
There were 4984 diagnosed episodes of HZ in 2011/12, an incidence of 5.3
episodes/1000 PY. Of these, 497 went on to develop PHN, a conversion rate of 10.0%.
Hospitalization accounted for 49% of total cost, medical services for 20%, and
prescription drug costs for 32%. Although PHN occurred in only a tenth of all episodes,
Chapter 6: Burden of Herpes Zoster and PHN – Paper #3 Page 98
they were responsible for 41.6% of hospital costs, 21.3% of medical cost, and 49.7% of
drug costs. Overall, HZ-PHN episodes accounted for 38.5% of total HZ-related costs.
Mean Cost per Episode
The mean cost of an episode of HZ in 2011/12 was $401 (95% CI: $318, $484). The
mean cost for HZ that converted to PHN (HZ-PHN), including the cost of treating PHN,
was $1614 (95% CI: $1009, $2220). HZ episodes not associated with PHN (HZ-only)
had a mean cost of $266 (95% CI: $204, $329), 16.5% of HZ-PHN episodes.
Pharmacotherapy:
The mean cost of treating an episode of HZ with prescription drugs in 2011/12 was
$127.34. Of this, 52.5% was from the treatment of pain with a mean cost of $66.81
(95% CI: $56.84, $76.78), the remainder arising from antiviral treatment at a mean of
$60.53 (95% CI: $60.43, 59.92). For HZ-PHN episodes the mean drug cost was $635
(95% CI: $547, $723) with pain treatment accounting for 89% of this cost at
$566/episode (95% CI: $478, $655). HZ-only episodes had a mean drug cost of $71.12
(95% CI: $69.18, $73.05), over 83% of which was due to antiviral prescriptions
treatment.
Medical Services Utilization
The average HZ episode in 2011/12 resulted in 2.80 (95% CI: 2.67, 2.93) medical
claims for a mean cost of $78.84 (95% CI: $74.08, $83.61). The average HZ-PHN
episodes resulted in 5.57 claims (95% CI: 4.86, 6.29) with a mean cost of $168.30 (95%
CI: $128.79, $207.81), while the average HZ- only episodes resulted in 2.49 claims
(95% CI: 2.38, 2.60) with a mean cost of $68.93 (95% CI: $66.08, $71.79).

Chapter 6: Burden of Herpes Zoster and PHN – Paper #3 Page 99
Hospitalization
HZ-related hospitalization was uncommon, and occurred in 1.36% of episodes in
2011/12 with a mean cost per stay of $14,258/hospitalization (95% CI: $9,461,
$19,056). HZ-PHN episodes were more frequently hospitalized at a rate of 5.0%,
whereas HZ-only episodes had a hospitalization rate of 1.0%. There was no significant
difference in the cost per hospitalization between HZ-PHN and HZ-only episodes so
these results were combined. The cost of hospitalization averaged across all HZ
episodes was $194.54 (95% CI: $115.90, $273.17).
6.7. Discussion
This study explored the burden of HZ in terms of healthcare system costs. A significant
increase in the incidence of HZ, independent of demographic shifts in the population,
was found to begin in 2009/10. The medical cost per episode increased, as did total
annual costs. Aside from the increase occurring within the first three study years, the
per-episode drug costs remained relatively constant, with the increased mean costs of
treating pain offset by decreases in antiviral cost per treatment. The combination of
increase per-episode medical costs, and constant per-episode drug costs were
multiplied by increasing numbers of episodes, causing total outpatient costs to increase.
However, this was offset by a dramatic drop in rates of hospitalization.
Although hospitalization is uncommon in HZ patients, at a cost of $12,000 per stay, it
has a disproportionate impact on the total burden. In 1997/98, hospital costs accounted
for almost three quarters of total HZ costs, this proportion had dropped to 40%-50%
over the final study years. This is a result of a dramatic change in rates of

Chapter 6: Burden of Herpes Zoster and PHN – Paper #3 Page 100
hospitalization, which dropped from 3.10% in the first study year to 1.36% in the last
year. However, it appears that this is the floor to hospitalization rates, as the downward
trend appears to have ended midway through the study.
The same is not true regarding the trends seen in number of cases, prescription drug
costs, and medical service utilization. The number of HZ cases increased by 50% from
1997/98 to 2013/14, largely driven by demographic changes. The cost per episode of
medical care has also seen sustained increases. Increasing costs of pain treatment
were offset by drops in antiviral costs leaving the per-episode drug cost steady,
however, the increasing number of episodes has resulted in increasing total drug costs.
These trends do not appear to be slowing down, and if hospitalization rates have indeed
plateaued, it may be the case that the burden of zoster will increase in the future.
The increase in the incidence of HZ, which began in 2009/10, is one of the most
interesting results of this analysis. The 21% increase in the age-adjusted incidence is
not explained by demographic changes as changes in size and age distribution are
controlled for. Exposure to wild VZV circulating in the population acts as an exogenous
boost to HZ cell-mediated immunity in latently infected adults.33–35 It has been proposed
that an unintended consequence of VZ vaccination programs could be an increase in
HZ rates. However, researchers have found mixed evidence when searching for such
an effect at the population level.33,36–41 While this study was not designed to examine
such a relationship, it is interesting to note that the VZ vaccinations were added to the
routine schedule of universally provided childhood vaccinations in 2004, just 5 years
before the increase began.

Chapter 6: Burden of Herpes Zoster and PHN – Paper #3 Page 101
An important limitation to our results on the burden of HZ is that only direct medical
expenses have been considered. There are other sources of burden for both patient
and society outside of this narrow focus, perhaps the most important being changes to
individuals quality of life, especially for those individuals affected by PHN. Societal costs
such as lost productivity, disability payments, and opportunity costs are also outside of
the scope of this study. However, this analysis has numerous strengths, including the
fact that costs are not estimated based on models nor inferred from a sample but rather
directly measured across the entire provincial population. This study examined 15 years
of healthcare data, allowing us to see changes over an extend period of time.
6.8. Conclusion
This study explored the burden of HZ in terms of healthcare system costs. A significant
increase in the incidence of HZ, independent of demographic shifts in the population,
was found to begin in 2009/10. The medical cost per episode increased, as did total
annual costs. Per-episode drug costs remained level, with increased mean costs of
treating pain offset by decreases in antiviral cost per treatment. The combination of
increase per-episode medical costs, and constant per-episode drug costs were
multiplied by increasing numbers of episodes, causing total outpatient costs to increase.
However, this was offset by a dramatic drop in rates of hospitalization.
6.9. Acknowledgments
The authors acknowledge the Manitoba Centre for Health Policy for use of data
contained in the Population Health Research Data Repository under project
#H2014:411 (HIPC# 2014/2015-35). The results and conclusions are those of the
Chapter 6: Burden of Herpes Zoster and PHN – Paper #3 Page 102
authors and no official endorsement by the Manitoba Centre for Health Policy, Manitoba
Health, Seniors and Active Living, or other data providers is intended or should be
inferred. Data used in this study are from the Population Health Research Data
Repository housed at the Manitoba Centre for Health Policy, University of Manitoba and
were derived from data provided by Manitoba Health, Seniors and Active Living.
I would also like to thank Heather Prior from the Manitoba Centre for Health Policy for
her assistance and preliminary data extraction.
This work was supported by a grant from Merck Canada.

Chapter 6: Burden of Herpes Zoster and PHN – Paper #3 Page 103
6.10. Tables and Figures
FY Year Cases Medical Services Hospitalization Drugs Annual Totals
HZ PHN Visits Cost Stays Cost Rxs Cost Overall PHN Only
1997/98
3844 331 9738 $222,864 119 $1,527,684 7842 $345,085 $2,095,633 $625,970
1998/99 3781 349 9311 $216,567 94 $947,462 8139 $346,495 $1,510,524 $521,352
1999/00 3941 367 9645 $240,928 97 $1,176,332 9927 $498,362 $1,915,623 $852,724
2000/01 3954 399 9981 $252,837 80 $978,360 9758 $475,111 $1,706,307 $622,177
2001/02 4060 429 10218 $268,900 95 $1,171,142 10548 $532,201 $1,972,243 $809,190
2002/03 4126 410 10549 $262,471 78 $1,116,598 10350 $523,136 $1,902,205 $507,749
2003/04 4070 375 10191 $275,353 83 $1,097,938 10169 $511,907 $1,885,197 $820,833
2004/05 4087 379 10291 $277,410 61 $621,227 9578 $504,787 $1,403,424 $406,629
2005/06 4131 432 10828 $286,785 49 $443,617 10507 $543,196 $1,273,598 $455,895
2006/07 4143 377 10849 $297,755 67 $924,959 10551 $530,623 $1,753,338 $473,495
2007/08 4207 377 11360 $314,783 72 $704,245 10679 $512,113 $1,531,142 $469,445
2008/09 4295 440 11615 $310,292 59 $809,855 12265 $555,622 $1,675,768 $400,491
2009/10 4584 427 12561 $355,407 58 $582,423 12456 $553,298 $1,491,129 $559,819
2010/11 4622 449 12998 $363,637 58 $627,314 12217 $578,973 $1,569,924 $633,618
2011/12 4984 497 13945 $392,947 68 $969,563 14439 $634,674 $1,997,183 $768,050
Table 6.10-1 Overall health system burden of herpes zoster and postherpetic neuralgia in Manitoba, Canada
Results were summarized by fiscal year with individuals episodes data considered to have occurred in year of diagnosis.
All costs have been adjusted to 2013 Canadian dollars using Statistics Canada consumer price index. Abbreviations: FY,
fiscal year; HZ, herpes zoster; PHN, postherpetic neuralgia

Chapter 6: Burden of Herpes Zoster and PHN – Paper #3 Page 104
Figure 6.10-1 Piecewise regression on age adjusted incidence of herpes zoster
The age adjusted incidence of herpes zoster was calculated using 1997 as the reference
year for age standardization. A highly significant breakpoint was found in July 2009
(p<0.0001). Varicella zoster vaccinations were added to the routine childhood vaccination
schedule in 2004. Abbreviations: VZV, varicella zoster vaccinations; BP, breakpoint; HZ,
herpes zoster; CI, confidence interval.

Chapter 6: Burden of Herpes Zoster and PHN – Paper #3 Page 105
Figure 6.10-2 Cost per episode of herpes zoster by treatment modality.
The mean cost of treating herpes zoster was determined within each year and regression
analysis performed (solid lines). Significant trends were found for all modalities:
prescription and medical costs p<0.0001; hospitalization p<0.0002. All costs have been
adjusted to 2013 Canadian dollars using Statistics Canada consumer price index.

Chapter 6: Burden of Herpes Zoster and PHN – Paper #3 Page 106
Figure 6.10-3 Totals Costs of Treating Herpes Zoster by Modality.
The total cost of treating herpes zoster was determined within each year and regression
analysis performed (solid lines). Significant trends were found for all modalities:
prescription costs non-significant and medical costs p<0.0001; hospitalization p<0.0002.
All costs have been adjusted to 2013 Canadian dollars using Statistics Canada consumer
price index

Chapter 6: Burden of Herpes Zoster and PHN – Paper #3 Page 107
6.11. References
1. Hope-Simpson RE. the Nature of Herpes Zoster: a Long-Term Study and a New
Hypothesis. Proc R Soc Med. 1965;58(January):9-20.
2. Schmader KE, Dworkin RH. Natural history and treatment of herpes zoster. J
Pain. 2008;9(1 Suppl 1):S3-S9.
3. Gnann JW, Whitley RJ. Clinical practice. Herpes zoster. N Engl J Med.
2002;347(5):340-346.
4. Gershon A a, Gershon MD, Breuer J, Levin MJ, Oaklander AL, Griffiths PD.
Advances in the understanding of the pathogenesis and epidemiology of herpes zoster.
J Clin Virol. 2010;48 Suppl 1:S2-S7
5. Mueller NH, Gilden DH, Cohrs RJ, Mahalingam R, Nagel M a. Varicella zoster
virus infection: clinical features, molecular pathogenesis of disease, and latency. Neurol
Clin. 2008;26(3):675-697, viii.
6. Dworkin RH, Johnson RW, Breuer J, et al. Recommendations for the
management of herpes zoster. Clin Infect Dis. 2007;44 Suppl 1:S1-S26.
7. Brisson M, Edmunds WJ, Law B, et al. Epidemiology of varicella zoster virus
infection in Canada and the United Kingdom. Epidemiol Infect. 2001;127(02):305-314.
8. Fairley CK, Miller E. Varicella-zoster virus epidemiology--a changing scene? J
Infect Dis. 1996;174 Suppl(Suppl 3):S314-S319.
9. Johnson RW, Alvarez-Pasquin M-J, Bijl M, et al. Herpes zoster epidemiology,
management, and disease and economic burden in Europe: a multidisciplinary
perspective. Ther Adv vaccines. 2015;3(4):109-120.
10. Brisson M, Edmunds WJ, Gay NJ, Law B, De Serres G. Modelling the impact of
immunization on the epidemiology of varicella zoster virus. Epidemiol Infect.
2000;125(3):651-669.

Chapter 6: Burden of Herpes Zoster and PHN – Paper #3 Page 108
11. Massengill JS, Kittredge JL. Practical considerations in the pharmacological
treatment of postherpetic neuralgia for the primary care provider. J Pain Res.
2014;7:125-132.
12. Ono F, Yasumoto S, Furumura M, et al. Comparison between famciclovir and
valacyclovir for acute pain in adult Japanese immunocompetent patients with herpes
zoster. J Dermatol. 2012;39(11):902-908.
13. Gialloreti LE, Merito M, Pezzotti P, et al. Epidemiology and economic burden of
herpes zoster and post-herpetic neuralgia in Italy: a retrospective, population-based
study. BMC Infect Dis. 2010;10:230.
14. Ultsch B, Köster I, Reinhold T, et al. Epidemiology and cost of herpes zoster and
postherpetic neuralgia in Germany. Eur J Health Econ. 2013;14(6):1015-1026.
15. Gauthier a, Breuer J, Carrington D, Martin M, Rémy V. Epidemiology and cost of
herpes zoster and post-herpetic neuralgia in the United Kingdom. Epidemiol Infect.
2009;137(1):38-47.
16. Oxman MN, Levin MJ. Vaccination against Herpes Zoster and Postherpetic
Neuralgia. J Infect Dis. 2008;197 Suppl(Suppl 2):S228-S236.
17. Weitzman D, Shavit O, Stein M, Cohen R, Chodick G, Shalev V. A population
based study of the epidemiology of Herpes Zoster and its complications. J Infect.
2013;67(5):463-469.
18. Cebrián-Cuenca AM, Díez-Domingo J, San-Martín-Rodríguez M, Puig-Barberá J,
Navarro-Pérez J. Epidemiology and cost of herpes zoster and postherpetic neuralgia
among patients treated in primary care centres in the Valencian community of Spain.
BMC Infect Dis. 2011;11(1):302
19. Edmunds WJ, Brisson M, Rose JD. The epidemiology of herpes zoster and
potential cost-effectiveness of vaccination in England and Wales. Vaccine. 2001;19(23-
24):3076-3090.

Chapter 6: Burden of Herpes Zoster and PHN – Paper #3 Page 109
20. Attal N, Cruccu G, Baron R, et al. EFNS guidelines on the pharmacological
treatment of neuropathic pain: 2010 revision. Eur J Neurol. 2010;17(9):1113-e88.
21. Moulin D, Boulanger A, Clark AJ, et al. Pharmacological management of chronic
neuropathic pain: revised consensus statement from the Canadian Pain Society. Pain
Res Manag. 2014;19(6):328-335.
22. Schmader KE, Oxman MN, Levin MJ, et al. Persistence of the efficacy of zoster
vaccine in the shingles prevention study and the short-term persistence substudy. Clin
Infect Dis. 2012;55(10):1320-1328.
23. Oxman MN, Levin MJ, Johnson GR, et al. A vaccine to prevent herpes zoster
and postherpetic neuralgia in older adults. N Engl J Med. 2005;352(22):2271-2284.
24. Drug Products Database. Heal Canada website. http://webprod5.hc-
sc.gc.ca/dpd-bdpp/index-eng.jsp. Accessed November 2, 2015.
25. Bilcke J, Ogunjimi B, Marais C, et al. The health and economic burden of
chickenpox and herpes zoster in Belgium. Epidemiol Infect. 2012;140(11):2096-2109.
26. Blein C, Gavazzi G, Paccalin M, Baptiste C, Berrut G, Vainchtock A. Burden of
herpes zoster: the direct and comorbidity costs of herpes zoster events in hospitalized
patients over 50 years in France. BMC Infect Dis. 2015;15(1):350.
27. Ultsch B, Siedler A, Rieck T, Reinhold T, Krause G, Wichmann O. Herpes zoster
in Germany: quantifying the burden of disease. BMC Infect Dis. 2011;11(1):173.
28. Lionis CD, Vardavas CI, Symvoulakis EK, et al. Measuring the burden of herpes
zoster and post herpetic neuralgia within primary care in rural Crete, Greece. BMC Fam
Pract. 2011;12(1):136.
29. Di Legami V, Gianino MM, Atti MCD, et al. Epidemiology and costs of herpes
zoster: Background data to estimate the impact of vaccination. Vaccine.
2007;25(43):7598-7604.

Chapter 6: Burden of Herpes Zoster and PHN – Paper #3 Page 110
30. Roos LL, Brownell M, Lix L, Roos NP, Walld R, Macwilliam L. From health
research to social research : Privacy , methods , approaches. Soc Sci Med.
2008;66:117-129.
31. Jutte DP, Roos LL, Brownell MD. Administrative record linkage as a tool for
public health research. Annu Rev Public Health. 2011;32:91-108.
32. Klompas M, Kulldorff M, Vilk Y, Bialek SR, Harpaz R. Herpes Zoster and
Postherpetic Neuralgia Surveillance Using Structured Electronic Data. Mayo Clin Proc.
2011;86(12):1146-1153.
33. Brisson M, Gay NJ, Edmunds WJ, Andrews NJ. Exposure to varicella boosts
immunity to herpes-zoster: implications for mass vaccination against chickenpox.
Vaccine. 2002;20(19-20):2500-2507.
34. Solomon BA, Kaporis AG, Glass AT, Simon SI, Baldwin HE. Lasting immunity to
varicella in doctors study (L.I.V.I.D. study). J Am Acad Dermatol. 1998;38(5 Pt 1):763-
765.
35. Thomas SL, Wheeler JG, Hall AJ. Contacts with varicella or with children and
protection against herpes zoster in adults: a case-control study. Lancet.
2002;360(9334):678-682.
36. Chao DY, Chien YZ, Yeh YP, Hsu PS, Lian IB. The incidence of varicella and
herpes zoster in Taiwan during a period of increasing varicella vaccine coverage, 2000-
2008. Epidemiol Infect. 2012;140(6):1131-1140.
37. Edmunds WJ, Brisson M. The effect of vaccination on the epidemiology of
varicella zoster virus. J Infect. 2002;44(4):211-219.
38. Russell ML, Dover DC, Simmonds KA, Svenson LW. Shingles in Alberta: Before
and after publicly funded varicella vaccination. Vaccine. 2014;32(47):6319-6324.

Chapter 6: Burden of Herpes Zoster and PHN – Paper #3 Page 111
39. Tanuseputro P, Zagorski B, Chan KJ, Kwong JC. Population-based incidence of
herpes zoster after introduction of a publicly funded varicella vaccination program.
Vaccine. 2011;29(47):8580-8584.
40. Leung J, Harpaz R, Molinari NA, Jumaan A, Zhou F. Herpes zoster incidence
among insured persons in the united states, 1993-2006: Evaluation of impact of
varicella vaccination. Clin Infect Dis. 2011;52(3):332-340.
41. Ogunjimi B, Van Damme P, Beutels P. Herpes Zoster Risk Reduction through
Exposure to Chickenpox Patients: A Systematic Multidisciplinary Review. PLoS One.
2013;8(6).

Chapter 7: Thesis Conclusions Page 112
Chapter 7. Thesis Conclusions
This thesis explored the burden of HZ and PHN from a healthcare system perspective.
One of our initial hypotheses was that the absolute number of HZ episodes would rise
over time as a direct result of a population aging and growth (Appendix A) 78,79. Our
results confirmed this hypothesis, finding a 49.5% increase in the annual number of HZ
episodes. Further, we found an increase in age-adjusted incidence of HZ of 21%, an
upward shift that cannot be explained by the demographic factors mentioned above.
This trend was not seen over the first 12 years of the study period, but only began after
2009. It is interesting that this upward trend began five years after the VZ vaccine was
added to the provinces schedule of routine childhood vaccinations. The observation fits
with the exogenous boosting hypothesis, which suggests that decreasing levels of wild-
VZV circulating in the population could have deleterious effects on HZ rates in those
already latently infected with VZV.42,55,57
Assuming that treatment costs would either increase with time or remain constant, we
also hypothesized that the burden of HZ and PHN should increase with time due to the
increasing number of affected individuals. However, this was not observed in our study.
We did observe an upward trends in mean medical and prescription costs that, left
unopposed, combined with the increasing rate of HZ, would have resulted in an
increase healthcare system burden of illness. However, these upward trends were
counteracted by the dramatic decrease in HZ-related hospitalization rates, which fell by
half.

Chapter 7: Thesis Conclusions Page 113
While hospitalization is an infrequent outcome of HZ, its average cost of over $12,000
per stay gives it tremendous leverage to affect the overall burden of disease. Hospital
costs account for 48% (in 2011/12) to 73% (in 1997/98) of total burden. The drop in
hospitalization rates occurred during the first half of the study period, after which rates
stabilized, and it may be the case that this is the floor below which rates can no longer
continue to fall.
The increasing cost of pharmacotherapy was itself the result of a mixture of additive and
opposing trends. The rate of antiviral treatment of HZ rose by over 50% over the study
period. Combined with the increasing number of episodes, this resulted in more than
twice as many treated episodes in 2013/14 than in 1997/98, yet the total cost of antiviral
drugs rose by only 2.6%. This is due to the introduction of generic versions of antiviral
drugs, with acyclovir going generic in 1997, famciclovir in 2006, and valacyclovir in
2008, resulting in the cost per treated episode dropping to less than half of the initial
cost by 2013/14.
The introduction of generic drugs used to treat HZ and PHN pain helped offset some of
the increases drug cost, changes in prescribing patterns for PHN, in particular the large
increase in gabapentin use, completely overwhelmed this offset. This lead to the per-
episode cost of treating pain to rise by 111%, and the total annual cost to rise by 174%.
The future burden of HZ and PHN will depend on the balance between the factors
identified and how they change. Whether the upward trend in the AA-incidence of HZ
observed continues or not is unclear. However, it seems certain that the absolute
number of HZ cases will continue to increase, driven by demographic changes.
Population models project that the population of Manitoba will continue to grow, with an
Chapter 7: Thesis Conclusions Page 114
increasing proportion represented by aged persons.74 The drugs used to treat HZ and
PHN are all now available in generic formulations, and hospitalization rates appear to
have plateaued, thus their ability to further buffer future increases in cost may be
limited. While the burden of HZ has not increased over the fifteen years between
1997/98 and 2011/12, the direction the burden of disease charts over the next fifteen
seems likely to increase.

Chapter 8: Thesis References Page 115
THESIS REFERENCES
1. Gershon A a, Gershon MD, Breuer J, Levin MJ, Oaklander AL, Griffiths PD.
Advances in the understanding of the pathogenesis and epidemiology of herpes
zoster. J Clin Virol. 2010;48 Suppl 1:S2-S7.
2. Brisson M, Edmunds WJ, Law B, et al. Epidemiology of varicella zoster virus
infection in Canada and the United Kingdom. Epidemiol Infect. 2001;127(02):305-
314.
3. Chapman RS, Cross KW, Fleming DM. The incidence of shingles and its
implications for vaccination policy. Vaccine. 2003;21(19-20):2541-2547.
4. Edmunds WJ, Brisson M, Rose JD. The epidemiology of herpes zoster and
potential cost-effectiveness of vaccination in England and Wales. Vaccine.
2001;19(23-24):3076-3090.
5. Weitzman D, Shavit O, Stein M, Cohen R, Chodick G, Shalev V. A population
based study of the epidemiology of Herpes Zoster and its complications. J Infect.
2013;67(5):463-469,
6. Cebrián-Cuenca AM, Díez-Domingo J, San-Martín-Rodríguez M, Puig-Barberá J,
Navarro-Pérez J. Epidemiology and cost of herpes zoster and postherpetic
neuralgia among patients treated in primary care centres in the Valencian
community of Spain. BMC Infect Dis. 2011;11(1):302.
7. Tontodonati M, Ursini T, Polilli E, et al. Post-herpetic neuralgia. Int J Gen Med.
2012;5:861-871.
8. Philip A, Thakur R. Post Herpetic Neuralgia. J Palliat Med. 2011;14(6):765-773.
9. Schmader KE, Dworkin RH. Natural history and treatment of herpes zoster. J
Pain. 2008;9(1 Suppl 1):S3-S9.
10. Gialloreti LE, Merito M, Pezzotti P, et al. Epidemiology and economic burden of
herpes zoster and post-herpetic neuralgia in Italy: a retrospective, population-
based study. BMC Infect Dis. 2010;10:230.

Chapter 8: Thesis References Page 116
11. Mueller NH, Gilden DH, Cohrs RJ, Mahalingam R, Nagel M a. Varicella zoster
virus infection: clinical features, molecular pathogenesis of disease, and latency.
Neurol Clin. 2008;26(3):675-697, viii.
12. Wilson JF. Herpes zoster. Ann Intern Med. 2011;154(5):ITC31-15; quiz ITC316.
13. Gilden DH, Mahalingam R, Cohrs RJ, Tyler KL. Herpesvirus infections of the
nervous system. Nat Clin Pract Neurol. 2007;3(2):82-94.
14. Grinde B. Herpesviruses: latency and reactivation - viral strategies and host
response. J Oral Microbiol. 2013;5(5):1-9.
15. Horien C, Grose C. Neurovirulence of varicella and the live attenuated varicella
vaccine virus. Semin Pediatr Neurol. 2012;19(3):124-129.
16. Fairley CK, Miller E. Varicella-zoster virus epidemiology--a changing scene? J
Infect Dis. 1996;174 Suppl(Suppl 3):S314-S319.
17. Hunt R. Virology - Herpes Virus. In: Hunt RC, ed. Microbiology and Immunology
On-Line. Vol University of South Carolina School of Medicine; 2010.
http://pathmicro.med.sc.edu/virol/herpes.htm. Accessed November 4, 2015
18. Zerboni L, Sen N, Oliver SL, Arvin AM. Molecular mechanisms of varicella zoster
virus pathogenesis. Nat Rev Microbiol. 2014;12(3):197-210.
19. Weaver BA. The burden of herpes zoster and postherpetic neuralgia in the United
States. J Am Osteopath Assoc. 2007;107(3 Suppl 1):S2-S7.
http://www.ncbi.nlm.nih.gov/pubmed/17488884. Accessed October 19, 2014.
20. Dworkin RH, Barbano RL, Tyring SK, et al. A randomized, placebo-controlled trial
of oxycodone and of gabapentin for acute pain in herpes zoster. Pain.
2009;142(3):209-217.
21. Solomon CG, Cohen JI. Herpes Zoster. N Engl J Med. 2013;369(3):255-263.
22. Gnann JW, Whitley RJ. Clinical practice. Herpes zoster. N Engl J Med.
2002;347(5):340-346.

Chapter 8: Thesis References Page 117
23. Boivin G, Jovey R, Elliott CT, Patrick DM. Management and prevention of herpes
zoster: A Canadian perspective. Can J Infect Dis Med Microbiol. 2010;21(1):45-
52.
24. Schmader KE, Sloane R, Pieper C, et al. The Impact of Acute Herpes Zoster Pain
and Discomfort on Functional Status and Quality of Life in Older Adults. Clin J
Pain. 2007;23(6):490-496.
25. Gharibo C, Kim C. Postherpetic Neuralgia: An overview of the pathophysiology,
presentation, and management. Pain Med News. 2011;(April):1-8.
26. Dworkin RH, Johnson RW, Breuer J, et al. Recommendations for the
management of herpes zoster. Clin Infect Dis. 2007;44 Suppl 1:S1-S26.
27. CPhA. E-CPS. Ottawa, ON: Canadian Pharmacists Association; 2014.
http://www.e-cps.ca.
28. Gnann JW. Antiviral therapy of varicella-zoster virus infections. In: Arvin A, G C-F,
E M, eds. Human Herpesviruses: Biology, Therapy, and Immunoprophylaxis. Vol
Cambridge: Cambridge University Press; 2007.
29. Bruxelle J, Pinchinat S. Effectiveness of antiviral treatment on acute phase of
herpes zoster and development of post herpetic neuralgia: review of international
publications. Médecine Mal Infect. 2012;42(2):53-58.
30. Bennett G, Watson C. Herpes Zoster and Postherpetic Neuralgia: Past, present
and future. Pain Res Manag. 2009;14(4):275-282.
31. Wareham DW, Breuer J. Herpes zoster. Bmj. 2007;334(June):1211-1215.
32. Wood MJ, Johnson RW, McKendrick MW, Taylor J, Mandal BK, Crooks J. A
randomized trial of acyclovir for 7 days or 21 days with and without prednisolone
for treatment of acute herpes zoster. N Engl J Med. 1994;330(13):896-900.

Chapter 8: Thesis References Page 118
33. Whitley RJ, Weiss H, Gnann JW, et al. Acyclovir with and without prednisone for
the treatment of herpes zoster. A randomized, placebo-controlled trial. The
National Institute of Allergy and Infectious Diseases Collaborative Antiviral Study
Group. Ann Intern Med. 1996;125(5):376-383.
34. Moulin D, Boulanger A, Clark AJ, et al. Pharmacological management of chronic
neuropathic pain: revised consensus statement from the Canadian Pain Society.
Pain Res Manag. 2014;19(6):328-335.
35. Attal N, Cruccu G, Baron R, et al. EFNS guidelines on the pharmacological
treatment of neuropathic pain: 2010 revision. Eur J Neurol. 2010;17(9):1113-e88.
36. Massengill JS, Kittredge JL. Practical considerations in the pharmacological
treatment of postherpetic neuralgia for the primary care provider. J Pain Res.
2014;7:125-132.
37. Merck Canada. Varivax product monograph.
http://www.merck.ca/assets/en/pdf/products/VARIVAX_III-PM_E.pdf. Accessed
Jan 17, 2016.
38. Drug Products Database. Health Canada website. http://webprod5.hc-
sc.gc.ca/dpd-bdpp/index-eng.jsp. Accessed November 2, 2015.
39. Sweet L, Gallant P, Morris M, Halperin S a. Canada’s first universal varicella
immunization program: Lessons from Prince Edward Island. Can J Infect Dis.
2003;14(1):41-44.
40. Hilderman T, Katz A, Derksen S, et al. Manitoba Immunization Study. Winnipeg:
Manitoba Centre for Health Policy; 2011. http://mchp-
appserv.cpe.umanitoba.ca/reference/MB_Immunization_Report_WEB.pdf.
Accessed March 27 2016.
41. Pubilc Health Agency of Canada. Varicella (Chickenpox). 2012. http://www.phac-
aspc.gc.ca/im/vpd-mev/varicella-eng.php. Accessed March 27, 2016.

Chapter 8: Thesis References Page 119
42. Ogunjimi B, Van Damme P, Beutels P. Herpes Zoster Risk Reduction through
Exposure to Chickenpox Patients: A Systematic Multidisciplinary Review. PLoS
One. 2013;8(6).
43. Merck Canada. Zostavax product monograph. 2014.
http://www.merck.ca/assets/en/pdf/products/ci/ZOSTAVAX_II-CI_E.pdf. Accessed
Jan 17, 2016.
44. Oxman MN, Levin MJ. Vaccination against Herpes Zoster and Postherpetic
Neuralgia. J Infect Dis. 2008;197 Suppl(Suppl 2):S228-S236.
45. Oxman MN, Levin MJ, Johnson GR, et al. A vaccine to prevent herpes zoster and
postherpetic neuralgia in older adults. N Engl J Med. 2005;352(22):2271-2284.
46. Schmader KE, Oxman MN, Levin MJ, et al. Persistence of the efficacy of zoster
vaccine in the shingles prevention study and the short-term persistence substudy.
Clin Infect Dis. 2012;55(10):1320-1328.
47. Morrison VA, Johnson GR, Schmader KE, et al. Long-term Persistence of Zoster
Vaccine Efficacy. Clin Infect Dis. 2015;60(6):900-909. doi:10.1093/cid/ciu918.
48. Lal H, Cunningham AL, Godeaux O, et al. Efficacy of an Adjuvanted Herpes
Zoster Subunit Vaccine in Older Adults. N Engl J Med. 2015:1-10.
49. Kawai K, Preaud E, Baron-Papillon F, Largeron N, Acosta CJ. Cost-effectiveness
of vaccination against herpes zoster and postherpetic neuralgia: a critical review.
Vaccine. 2014;32(15):1645-1653.
50. Najafzadeh M, Marra C a., Galanis E, Patrick DM. Cost effectiveness of herpes
zoster vaccine in Canada. Pharmacoeconomics. 2009;27(12):991-1004.
51. Peden AD, Strobel SB, Forget EL. Is herpes zoster vaccination likely to be cost-
effective in Canada? Can J Public Health. 2014;105(4):e287-e295.
52. Hornberger J, Robertus K. Cost-effectiveness of a vaccine to prevent herpes
zoster and postherpetic neuralgia in older adults. Ann Intern Med.
2006;145(5):317-325.
Chapter 8: Thesis References Page 120
53. Damm O, Ultsch B, Horn J, Mikolajczyk RT, Greiner W, Wichmann O. Systematic
review of models assessing the economic value of routine varicella and herpes
zoster vaccination in high-income countries. BMC Public Health. 2015;15(1):533.
54. Hope-Simpson RE. the Nature of Herpes Zoster: a Long-Term Study and a New
Hypothesis. Proc R Soc Med. 1965;58(January):9-20.
55. Brisson M, Gay NJ, Edmunds WJ, Andrews NJ. Exposure to varicella boosts
immunity to herpes-zoster: implications for mass vaccination against chickenpox.
Vaccine. 2002;20(19-20):2500-2507.
56. Edmunds WJ, Brisson M. The effect of vaccination on the epidemiology of
varicella zoster virus. J Infect. 2002;44(4):211-219.
57. Horn J, Karch A, Damm O, et al. Current and future effects of varicella and herpes
zoster vaccination in Germany – insights from a mathematical model in a country
with universal varicella vaccination. Hum Vaccin Immunother.
2016;5515(February):
58. Solomon BA, Kaporis AG, Glass AT, Simon SI, Baldwin HE. Lasting immunity to
varicella in doctors study (L.I.V.I.D. study). J Am Acad Dermatol. 1998;38(5 Pt
1):763-765.
59. Thomas SL, Wheeler JG, Hall AJ. Contacts with varicella or with children and
protection against herpes zoster in adults: a case-control study. Lancet.
2002;360(9334):678-682.
60. Russell ML, Dover DC, Simmonds KA, Svenson LW. Shingles in Alberta: Before
and after publicly funded varicella vaccination. Vaccine. 2014;32(47):6319-6324.
61. Brisson M, Edmunds WJ, Gay NJ, Law B, De Serres G. Modelling the impact of
immunization on the epidemiology of varicella zoster virus. Epidemiol Infect.
2000;125(3):651-669.
62. Pinheiro P, Plaß D, Kr A. The Burden of Disease Approach for Measuring
Population Health. In: Krämer A, Khan MH, Kraas F, eds. Health in Megacities
and Urban Areas. Vol Contributions to Statistics. Heidelberg: Physica-Verlag

Chapter 8: Thesis References Page 121
Heidel; 2011:21-38.
63. Gold MR, Stevenson D, Fryback DG. HALYS and QALYS and DALYS, Oh My:
similarities and differences in summary measures of population Health. Annu Rev
Public Health. 2002;23:115-134.
64. Murray CJ. Quantifying the burden of disease: the technical basis for disability-
adjusted life years. Bull World Health Organ. 1994;72(3):429-445.
65. Segel JE, Economics HP. Cost-of-Illness Studies — A Primer. 2006;(January):1-
39.
66. Stewart A, Honeycutt AA, Hardee A. An Assessment of the State of the Art for
Measuring Burden of Illness An Assessment of the State of the Art for Measuring
Burden of Illness Final Report. 2011;(0212050).
67. Kay D, Prüss A, Corvalán C. Methodology for assessment of Environmental
burden of disease. 2000;(August):23-24.
68. Herrett E, Gallagher AM, Bhaskaran K, et al. Data Resource Profile: Clinical
Practice Research Datalink (CPRD). Int J Epidemiol. 2015;44(3):827-836.
69. Gauthier a, Breuer J, Carrington D, Martin M, Rémy V. Epidemiology and cost of
herpes zoster and post-herpetic neuralgia in the United Kingdom. Epidemiol
Infect. 2009;137(1):38-47.
70. Lionis CD, Vardavas CI, Symvoulakis EK, et al. Measuring the burden of herpes
zoster and post herpetic neuralgia within primary care in rural Crete, Greece.
BMC Fam Pract. 2011;12(1):136.
71. Di Legami V, Gianino MM, Atti MCD, et al. Epidemiology and costs of herpes
zoster: Background data to estimate the impact of vaccination. Vaccine.
2007;25(43):7598-7604.
72. Ultsch B, Siedler A, Rieck T, Reinhold T, Krause G, Wichmann O. Herpes zoster
in Germany: quantifying the burden of disease. BMC Infect Dis. 2011;11(1):173.

Chapter 8: Thesis References Page 122
73. Ultsch B, Köster I, Reinhold T, et al. Epidemiology and cost of herpes zoster and
postherpetic neuralgia in Germany. Eur J Health Econ. 2013;14(6):1015-1026.
74. Yan L, Lix L, Jiang D, Einarson K, Dube S. Manitoba Population Projections 2013-
2042. Winnipeg; 2014.
75. Panatto D, Bragazzi NL, Rizzitelli E, et al. Evaluation of the economic burden of
Herpes Zoster (HZ) infection: A systematic literature review. Hum Vaccin
Immunother. 2015;11(1):239-238.
76. Klompas M, Kulldorff M, Vilk Y, Bialek SR, Harpaz R. Herpes Zoster and
Postherpetic Neuralgia Surveillance Using Structured Electronic Data. Mayo Clin
Proc. 2011;86(12):1146-1153.
77. Bilcke J, Ogunjimi B, Marais C, et al. The health and economic burden of
chickenpox and herpes zoster in Belgium. Epidemiol Infect. 2012;140(11):2096-
2109.
78. Milan A. Report on the Demographic Situation in Canada.; 2010.
http://www.statcan.gc.ca/pub/91-209-x/2011001/article/11511-eng.pdf. Accessed
March 17, 2016.
79. Statistics Canada. Annual Demographic Estimates: Canada, Provinces and
Territories. Ottawa, ON; 2015. http://www.statcan.gc.ca/pub/91-215-x/91-215-
x2014000-eng.pdf. Accessed March 17, 2016.

Appendix A: Population Aging Page 123
APPENDIX A: AGE DISTRIBUTION TORNADO PLOT
The age distribution of Manitoba was determined for the years 1997 and 2013 using the
Manitoba Health registry to obtain population counts in 5 year age intervals for persons
age 20 and above. The above tornado plot illustrates the changing demographics of
Manitoba, with a shift towards an older population clearly seen.

Appendix B: Research Approvals and Acknowledgments Page 124
APPENDIX B: RESEARCH APPROVALS AND ACKNOWLEDGEMENTS
Prior to beginning the research presented in this thesis, and to gaining access to the
Population Health Research Data Repository approvals were needed from the Manitoba
Centre for Health Policy (MCHP), the University of Manitoba Health Research Ethics
Board (HREB), and from Manitoba Health, Seniors and Active Living’s Health
Information Privacy Committee (HIPC), and a pledge of confidentially in accordance
with the Personal Health Information Act (PHIA).

Appendix B: Research Approvals and Acknowledgments Page 125
Acknowledgements
Manitoba Centre for Health Policy
The authors acknowledge the Manitoba Centre for Health Policy for use of data
contained in the Population Health Research Data Repository under project #2015-007
(HIPC#2014/2015-35). The results and conclusions are those of the authors and no
official endorsement by the Manitoba Centre for Health Policy, Manitoba Health, or
other data providers is intended or should be inferred. Data used in this study are from
the Population Health Research Data Repository housed at the Manitoba Centre for
Health Policy, University of Manitoba and were derived from data provided by Manitoba
Health, Seniors, and Active Living.
SAS
The data analysis for this thesis was generated using SAS/STAT software, Version 9.4
of the SAS system for Windows. Copyright © 2002-2012 SAS Institute Inc. SAS and all
other SAS Institute Inc. product or service names are registered trademarks or
trademarks of SAS Institute Inc., Cary, NC, USA.

Appendix B: Research Approvals and Acknowledgments Page 126
Manitoba Centre for Health Policy Approval Letter

Appendix B: Research Approvals and Acknowledgments Page 127
University of Manitoba Health Ethics Review Board Approval
Appendix B: Research Approvals and Acknowledgments Page 128
Appendix B: Research Approvals and Acknowledgments Page 129
University of Manitoba Health Ethics Review Board Annual Renewal

Appendix B: Research Approvals and Acknowledgments Page 130

Appendix B: Research Approvals and Acknowledgments Page 131
Manitoba Health Information Privacy Committee Approval


![5% Lidocaine Medicated Plaster for the Treatment of ... · Postherpetic neuralgia (PHN) is the most common complication of herpes zoster [1]. Transition from acute herpes zoster to](https://static.fdocuments.us/doc/165x107/60c008b7a73b1514f9212ab4/5-lidocaine-medicated-plaster-for-the-treatment-of-postherpetic-neuralgia-phn.jpg)