The British Museum - Worcester Polytechnic Institute British Museum Creating a Methodology for...
124
The British Museum Creating a Methodology for Evaluating a Gallery An Interactive Qualifying Project to be submitted to the faculty of Worcester Polytechnic Institute in partial fulfillment of the requirements for the Degree of Bachelor of Science Submitted by: Stephanie Carlyle Timothy Glover Anatoly Klebanov Submitted to: Project Advisors: Prof. Constance Clark Prof. Malcolm Ray Project Liaisons: Rhiannon Goddard, Interpretation Manager, the British Museum Claire Edwards, Interpretation Officer, the British Museum 21 February 2008
Transcript of The British Museum - Worcester Polytechnic Institute British Museum Creating a Methodology for...

The British Museum
Creating a Methodology for Evaluating a Gallery
An Interactive Qualifying Project to be submitted to the faculty of Worcester
Polytechnic Institute in partial fulfillment of the requirements for the Degree of
Bachelor of Science
Submitted by:
Stephanie Carlyle
Timothy Glover
Anatoly Klebanov
Submitted to:
Project Advisors:
Prof. Constance Clark
Prof. Malcolm Ray
Project Liaisons:
Rhiannon Goddard, Interpretation Manager, the British Museum
Claire Edwards, Interpretation Officer, the British Museum
21 February 2008

i
Abstract
The Interpretation Unit of the British Museum in London sponsored this project to
develop a methodology for evaluating their galleries. Future student interns will now
be able to evaluate specific galleries using the methodology guidebook created by the
WPI project team. The evaluation of galleries includes tracking visitors followed by
interviews with those visitors.

ii
Table of Contents
ABSTRACT ............................................................................................................................................ I
TABLE OF TABLES .......................................................................................................................... III
TABLE OF FIGURES ........................................................................................................................ IV
1. INTRODUCTION ............................................................................................................................. 1
2. BACKGROUND ................................................................................................................................. 2
2.1 HISTORY OF THE BRITISH MUSEUM ................................................................................................ 2
2.2 MISSION OF THE MUSEUM ............................................................................................................... 3
2.3 VISITOR STATISTICS ........................................................................................................................ 4
2.4 THE COLLECTIONS .......................................................................................................................... 6
2.5 MANAGEMENT AND GOVERNANCE ................................................................................................. 7
2.6 FUNDING ......................................................................................................................................... 8
2.7 THE INTERPRETATION UNIT ............................................................................................................ 9
3. LITERATURE REVIEW .................................................................................................................. 9
3.1 VISITOR ENGAGEMENT ................................................................................................................. 10
3.2 EDUTAINMENT .............................................................................................................................. 11
3.3 VISITOR STUDIES .......................................................................................................................... 12
3.4 THE BRITISH MUSEUM .................................................................................................................. 15
4. METHODOLOGY ........................................................................................................................... 16
4.1 OBJECTIVE 1: PRELIMINARIES ....................................................................................................... 17
4.1.1 Trials ..................................................................................................................................... 17
4.2 OBJECTIVE 2: DATA COLLECTION ................................................................................................. 18
4.2.1 Observing the Visitor ............................................................................................................ 18
4.2.2 Exit Interview ........................................................................................................................ 19
4.3 OBJECTIVE 3: DATA ANALYSIS ..................................................................................................... 19
5. RESULTS .......................................................................................................................................... 20
5.1 CREATING A METHODOLOGY ........................................................................................................ 20
5.2 CREATING A QUESTIONNAIRE ....................................................................................................... 23
5.3 CREATING MAPS ........................................................................................................................... 29
5.4 TRIAL STUDIES .............................................................................................................................. 30
5.5 DATA ANALYSIS ........................................................................................................................... 30
5.5.1 Qualitative ............................................................................................................................ 30
5.5.2 Dwell Times .......................................................................................................................... 32
5.5.4 Exhibit Popularity ................................................................................................................. 35
5.5.5 Most Photographed............................................................................................................... 36
5.5.6 Most Discussed ..................................................................................................................... 36
5.5.7 Gateway Object .................................................................................................................... 41
5.5.8 Label Reading ....................................................................................................................... 41
5.5.9 Visiting Patterns ................................................................................................................... 42
5.5.10 Walkthrough and Refusal Rates .......................................................................................... 43
5.5.11 Demographics ..................................................................................................................... 45
5.5.12 Segment Breakdown ............................................................................................................ 53
5.5.13 Comparisons with British Museum Data ............................................................................ 53
6. CONCLUSIONS .......................................................................................................................... 60
WORKS CITED ................................................................................................................................... 62
APPENDIX A: INTERVIEW QUESTIONS ..................................................................................... 64
APPENDIX B: GALLERY MAPS ..................................................................................................... 67
APPENDIX C: VISITOR TRAFFIC PATTERNS ............................................................................ 72
APPENDIX D: QUANTITATIVE DATA .......................................................................................... 77

iii
Table of Tables Table 1: Department Descriptions……..…………………………………………………………..….6
Table 2: Three Year Funding Agreement ………………………………………………………....…8
Table 3: Non Cash Resources…………………………………………………………………….…...8
Table 4: Grant-in-aid Allocation……………………………………………………………………....9
Table 5: Visitor Segments ……………………………………………………………………............15

iv
Table of Figures
Figure 1: Number of Visitors to the British Museum (created using British Museum Annual
Reports and Accounts, 2006/07) ................................................................................................... 5
Figure 2: Segment Flow Chart (Taken from “Visitor Insight Monitor – Year Two” by MHM) .. 24
Figure 3: North America Dwell Times Frequency Distribution ....................................................... 33
Figure 4: Roman Empire Dwell Times Frequency Distribution ...................................................... 34
Figure 5: Egyptian Death and Afterlife Dwell Times Frequency Distribution ............................... 35
Figure 6: Case 14: The American West .............................................................................................. 37
Figure 7: Totem .................................................................................................................................... 37
Figure 8: Case 5: The Mowachaht of Vancouver Island ................................................................... 38
Figure 9: Case 17: Hopewell Pipes from Mound City, Ohio ............................................................. 38
Figure 10: Case 18: Crocodile Armor ................................................................................................. 39
Figure 11: Busts .................................................................................................................................... 39
Figure 12: Mosaics ................................................................................................................................ 39
Figure 13: Bronze Head of Augustus .................................................................................................. 39
Figure 14: Portland Vase .................................................................................................................... 39
Figure 15: Case 3: Mummification ..................................................................................................... 40
Figure 16: Case 9: Three Parts of a Coffin ......................................................................................... 40
Figure 17: Case 7: Mummies from the Ptolemaic and Roman Periods ........................................... 41
Figure 18: North American Age Group Distribution ........................................................................ 46
Figure 19: North America First Language ......................................................................................... 46
Figure 20: North America Country of Residence .............................................................................. 47
Figure 21: Roman Empire Age Groups .............................................................................................. 48
Figure 22: Roman Empire First Language ........................................................................................ 48
Figure 23: Roman Empire Country of Residence .............................................................................. 49
Figure 24: Egyptian Death and Afterlife Age Groups ....................................................................... 50
Figure 25: Egyptian Death and Afterlife First Language ................................................................. 50
Figure 26: Egyptian Death and Afterlife Country of Residence ...................................................... 51
Figure 27: Overall Age Group ............................................................................................................. 51
Figure 28: Overall First Language ...................................................................................................... 52
Figure 29: Overall Country of Residence ........................................................................................... 52
Figure 30: Comparison of Origin of Visitors between All Three Galleries and the British
Museum ........................................................................................................................................ 53
Figure 31: Comparison of Knowledge Levels between North America and the British Museum . 54
Figure 32: Comparison of Knowledge Levels between Roman Empire and the British Museum 54
Figure 33: Comparison of Knowledge Levels between Egyptian Death and Afterlife and the
British Museum ............................................................................................................................ 55
Figure 34: Segment Comparison between North America and the British Museum ..................... 55
Figure 35: Segment Comparison between Roman Empire and the British Museum ..................... 56
Figure 36: Segment Comparison between Egyptian Death and Afterlife and the British Museum
....................................................................................................................................................... 56
Figure 37: Gender Comparison between North America and the British Museum ....................... 57
Figure 38: Gender Comparison between Roman Empire and the British Museum ...................... 57
Figure 39: Gender Comparison between Egyptian Death and Afterlife and the British Museum 58
Figure 40: Age Group Comparison between North America and the British Museum ................. 58
Figure 41: Age Group Comparison between Roman Empire and the British Museum ................ 59
Figure 42: Age Group Comparison between Egyptian Death and Afterlife and the British
Museum ........................................................................................................................................ 59

v
Standalone Document
Intern Guidebook: Methodology for Evaluating a Gallery

1
1. Introduction
Historically, museums have always been places where people come to attain greater
knowledge about the world and the cultures of the people who share it; they hold
important educational value. The early museum designers aimed to allow people to
achieve a ―higher state of existence, instead of vegetating like millions in the present
state of society‖ (Bennett, 1995). A large collection of books and artifacts make up
the content of a museum. The designers must find ways to educate the visitor about
the collection as well as engage them. ―Everything museological revolves around the
human race‖ (Dean, 1994). Thus, it is vital for museum designers to remember that
everything they do must benefit their visitors by fulfilling the visitors‘ needs. One
useful method for determining visitor needs is a tracking study, a branch of a more
broadly defined field—visitor studies.
Visitor studies are meant to determine whether the museum is accomplishing all of its
necessary tasks in order to achieve its goal of properly informing the visitor. In any
educational institution (1) students are evaluated on the knowledge they acquire, (2)
the institution is examined to see whether it is up to par, and (3) institutions conduct
studies to find out how students learn. Similarly, museums use these three stages to
shape visitor studies. A tracking study addresses the second stage in this process,
namely the ―evaluation of the activity [of learning] itself‖ (Hein G. E., 1998).
The ways in which people learn and discover the world are rapidly changing. Modern
museums are competing with newer, more technologically advanced, interactive
forms of educational entertainment, or ―edutainment.‖ While websites and television
shows, with their flashy advertisements and instant viewer satisfaction, continue to
dominate people‘s attention, museums cannot expect to attract more visitors if they do
not continually evaluate and update the museum experience. The best way to do this
is to acquaint themselves with the different types of museum goers.
The British Museum attracts nearly five million visitors each year and houses some of
the world‘s most prized artifacts such as the Rosetta Stone. Studying such a diverse
group of visitors requires the implementation of a well-designed methodology. This
study included a combination of observation and interviews. Observation is useful in
tracking visitor paths throughout a gallery while interviews allow for visitor

2
categorization. Interviews also aid in discovering which exhibits in a gallery are most
engaging, providing more data about the visitor‘s qualitative experience.
The goal of this study is to review previous tracking methods and to construct an
efficient methodology for tracking and recording visitor behavior in The British
Museum. This will establish a clearly defined protocol for conducting such studies,
which future museum interns can use in continuing to track visitors. By reviewing
past studies, testing and revising methods, and consulting with the Interpretation Unit
as well as other consultants, the methodology will be refined. Suggestions will
ultimately be made to future interns in a formal report presented to the Interpretation
Unit.
2. Background
2.1 History of the British Museum
Spanning over 13.5 acres and housing over 13 million objects, the British Museum is
one of the largest, most popular museums in the world. With artifacts from four
continents dating as far back as two million years, the British Museum is home to one
of the most comprehensive world history collections. Five million visitors come to
the museum yearly to discover a multitude of culturally diverse exhibits, such as the
Cyrus Cylinder.
The British Museum was founded on June 7th
, 1753, and consisted of a collection
donated by Sir Hans Sloane, a naturalist and a collector. This collection included
books and manuscripts, as well as various antiquities. ―The Act of Parliament that
brought about the founding of the Museum in 1753 described it as including ‗books,
drawings, manuscripts, prints, medals and coins, ancient and modern antiquities, seals,
cameos and intaglios, precious stones, agates, jaspers, vessels of agate and jasper,
crystals, mathematical instruments, drawings and pictures‘‖ (Trustees of the British
Museum). The museum also acquired the ‗Old Royal Library‘ as a generous donation
by King George II. Originally located in the Montagu House, a 17th
century mansion
in Bloomsbury, the British Museum had to be rebuilt because the house began to fall

3
apart. As the museum grew and expanded throughout the past 250 years, certain
objects needed to be relocated and renovations were required.
During the 1880s, the natural history exhibits moved to a separate museum in
Kensington. Great advances followed in the 1900s with the appointment of
professional guide lecturers, exhibition designers, and a publishing company. In 2003,
the King‘s Library was restored in honor of the museum‘s 250th
anniversary.
―Enlightenment: Discovering the World in the Eighteenth Century,‖ a permanent
exhibition, was placed in this newly renovated location. As any institution of such
caliber, the British Museum constantly strives to stay up to date with the most recent
discoveries, displaying them for the general public to examine freely. For example, a
discovery of a Viking hoard this year by a group of metal-detectorists was ―the most
important find of its type in Britain for over 150 years‖ (Trustees of the British
Museum). As of July 19, 2007, the collection has been on display at the British
Museum.
2.2 Mission of the Museum
George E. Hein (2006) describes George Brown Goode as someone who
―championed‖ the museum as an educational institution. Goode‘s belief was that the
philosophy behind a museum must be to spread ideas for the benefit of the general
public (Hein, 2006, Goode, 1889). In ―The Museums of the Future,‖ Goode describes
the museum‘s origins—what it was initially meant to accomplish. Museums in
ancient Greece were a place for the Muses, which were protectors of the arts and
sciences; the word ―muse‖ even today implies thinking or meditating on a subject.
While Goode emphasizes the importance of education in museums, he also stresses
the unfortunate confusion of a museum with a school. The root ―muse‖ was soon lost,
and ―the word [museum]…was used to describe a place of study, or a school‖ (Goode,
1889, p.428). He also points out that the term ―education‖ was in fact seen as having
negative associations with a place that promoted ―obligatory, formal, fact-laden
information transfer‖ (Hein, 2006, p.340).

4
The museum‘s collection is available for public examination free of charge since the
museum‘s mission is to promote public awareness through widespread accessibility.
The mandate of the museum is ―to illuminate the histories of cultures for the benefit
of present and future generations‖ (Ballard 2001). The aim of the museum is to hold
a collection that represents the cultures of the world to benefit and educate humanity,
and to ensure the collection is housed safely, conserved, curated, researched and
exhibited. (Trustees of the British Museum, 2006, p. 6) ―The Museum‘s objective is
to be:
A museum of the world for the world
A place for the ‗curious and studious‘
A collection held for the benefit of the world, present and future, free of
charge
A forum for the expression of many different cultural perspectives
A place to embrace the whole world and to increase understanding of the links
between and influences across different societies
A place where the UK‘s different communities can explore their
inheritances‖(Trustees of the British Museum, 2006, p.6).
―The Museum‘s Collection is drawn from all over the world and so the Museum is
uniquely placed to demonstrate the continuity and importance of cultural diversity
from the time of the earliest human artefacts two million years ago right up to the
present day‖ (Trustees of the British Museum, 2006, p.6).
2.3 Visitor Statistics
Every year, the British Museum publishes an annual report containing the latest
figures pertaining to its strategy and structure, operations, and performance. These
reports provide a general examination of many visitor statistics. With one exception,
visitor traffic decline has been consistent throughout the last nine years (shown in
Figure 1).

5
Figure 1: Number of Visitors to the British Museum (created using British Museum Annual
Reports and Accounts, 2006/07)
The drastic change in attendance has warranted attention from the museum trustees.
Although the London bombings of 2005 caused a significant drop in museum
attendance (The Trustees of The British Museum, 2006, p.5), the number of visitors
has been dropping every year with the exception of 2006. In the 1998-1999 year, the
British Museum reported that 5.6 million attended the museum, compared to 4.8
million in the 2001-2002 year, and an eight-year low of 4.5 million in 2005. Last year,
however, the museum saw a 7% increase, with a total of 4.9 million visitors, and a
six-year high of 3.3 million international guests (See Figure 1).
The number of children under the age of 15 visiting the museum hit a six-year low in
2007, at 570,000. In the previous year, that number was around 873,000, compared to
951,000 children in 2001. Every year the British Museum sets a target for the number
of visitors, both adults and children, they expect that year. The museum‘s target for
children under the age of 15 in the year 2006 was 900,000; they fell over 300,000
children short (see Figure 1). One of their goals, as stated in their annual report for

6
2006 is ―to further enhance access to culture and sport for children‖ (The Trustees of
The British Museum, 2006, p.5).
2.4 The Collections
There are over 3000 exhibits in 90 galleries representing cultures from all over the
world. Those who have a chance to pay the museum a visit participate in an
unparalleled experience. Visitors have the opportunity to view the galleries located in
ten diverse collection and research departments shown below in Table 1.
Table 1: Department Descriptions
Department Description Location
Africa, Oceania,
and Americas
350,000 contemporary, archaeological, and
historical objects
Ground Floor,
Main Floor
Ancient Egypt
and Sudan
Objects from the Nile Valley ranging from
10,000BC to 12th
century AD
Ground floor,
Upper Floor
Asia
Japan, Korea, China, Central Asia,
Afghanistan, South Asia, and South-East Asia
from 4000BC to present day
Ground Floor,
Upper Floor
Coins and
Medals
Coins weights, tokens, money boxes dating as
far back as the seventh century BC All Floors
Greek and
Roman
Antiques
100,000 objects dating from 3200BC to
fourth century AD All Floors
Middle East
Archaeological material from: Mesopotamia,
Iran, Levant, Jordan, Lebanon, Anatolia,
Arabia, Central Asia and the Caucasus
Main Floor
Portable
Antiques and
Treasure
Archaeological objects found by members of
the public in England and Wales
N/A (not
indicated)
Prehistory and
Europe
Wide variety of objects from Africa, Asia,
and Europe dating as far back as two million
years ago
Upper Floor
Prints and
Drawings
Natural collection of western prints dating
from the beginning of the 15th
century Upper Floor
By telling diverse stories of world history, the museum allows people to find
meanings pertinent to their own culture, and to possibly see that cultures throughout
the world are not so different after all. In order to reach a wider audience, the
museum has an outreach program to reach those who are unable to visit the museum.

7
Through the Partnership UK program, a series of exhibitions and objects tour around
regional museums. The museum lent 2,222 objects to 172 UK venues in the 2006-
2007 year. This program attracted 2.5 million people that otherwise would have been
unable to see these exhibits (Trustees of the British Museum, 2006, p. 17).
The museum offers programs for schools and teachers including ideas for visits,
educational activities, and resources within the galleries. They also have training for
teachers, web resources, and school projects. The museum has a brochure specifically
for schools and teachers that has upcoming events for each grade level and courses for
teachers. In addition to school programs the museum offers adult learning programs.
There are free introductory tours, hands-on objects, gallery talks with curators, films,
and courses. There are also special tours for English for speakers of other languages
(ESOL) students. While the collections themselves are extraordinary, none of it
would be possible without the help of the dedicated staff.
2.5 Management and Governance
Over 1000 staff members work full-time at the museum; they continually build and
add to the collections to keep them ―modern and alive‖ according to the Act of
Parliament (Trustees of the British Museum). The collection sometimes expands
through outside donations of artifacts. The museum is constantly conducting research
on this growing collection to obtain a better understanding of it. Conservation is a
major part of everyday business at the museum and is employed in order to preserve
the collection for future generations. Other vital employees include 320 security
guards that monitor the museum 24 hours a day. These people, along with the
museum‘s sponsors, allow the museum to function.
The governing board of the museum consists of 25 trustees, which is in accordance
with the British Museum Act of 1963 and the Museums and Galleries Act of 1992.
Thirteen trustees are appointed by the prime minister. The governing board is
responsible for managing the museum. The Governance Policies and Principles are a
set of regulations which govern the board of trustees (Trustees of the British Museum).
8
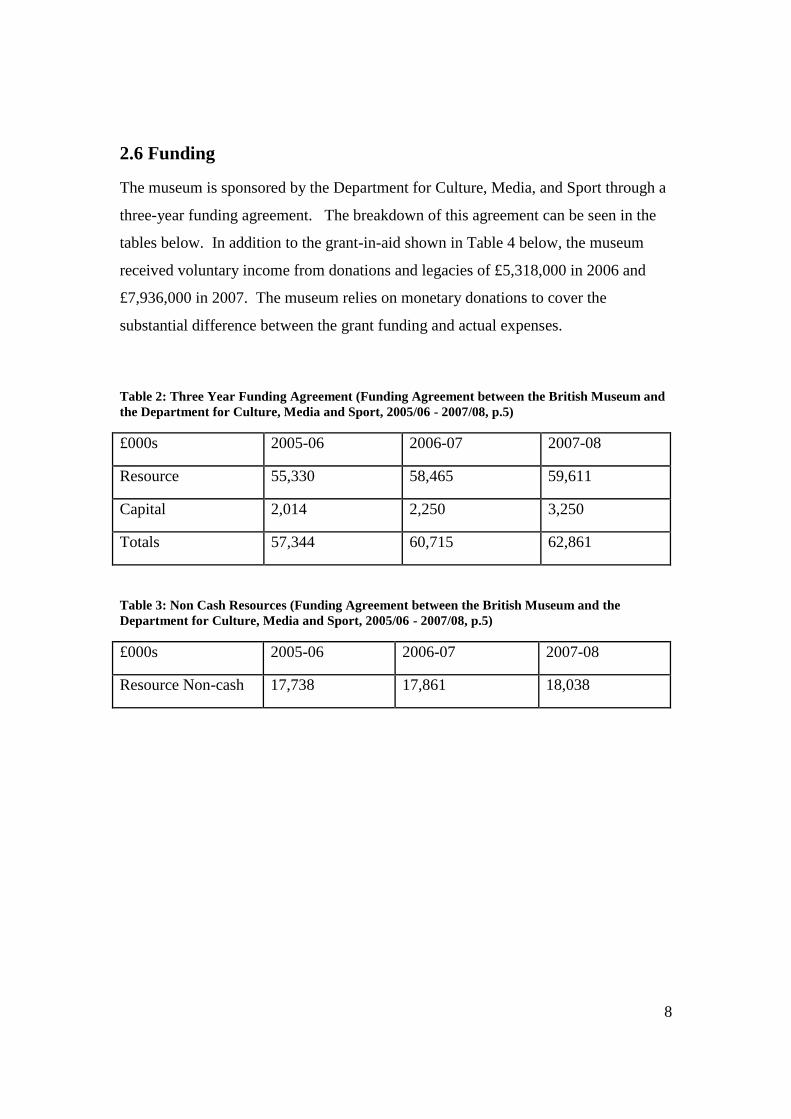
2.6 Funding
The museum is sponsored by the Department for Culture, Media, and Sport through a
three-year funding agreement. The breakdown of this agreement can be seen in the
tables below. In addition to the grant-in-aid shown in Table 4 below, the museum
received voluntary income from donations and legacies of £5,318,000 in 2006 and
£7,936,000 in 2007. The museum relies on monetary donations to cover the
substantial difference between the grant funding and actual expenses.
Table 2: Three Year Funding Agreement (Funding Agreement between the British Museum and
the Department for Culture, Media and Sport, 2005/06 - 2007/08, p.5)
£000s 2005-06 2006-07 2007-08
Resource 55,330 58,465 59,611
Capital 2,014 2,250 3,250
Totals 57,344 60,715 62,861
Table 3: Non Cash Resources (Funding Agreement between the British Museum and the
Department for Culture, Media and Sport, 2005/06 - 2007/08, p.5)
£000s 2005-06 2006-07 2007-08
Resource Non-cash 17,738 17,861 18,038
9
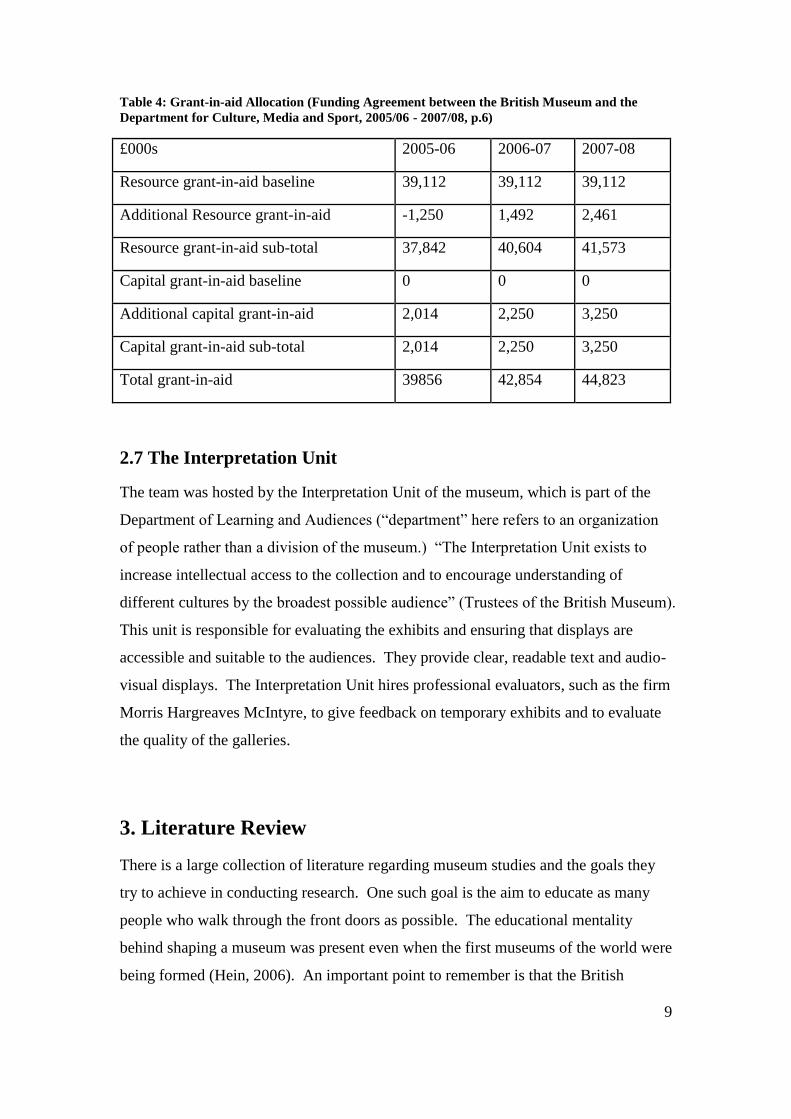
Table 4: Grant-in-aid Allocation (Funding Agreement between the British Museum and the
Department for Culture, Media and Sport, 2005/06 - 2007/08, p.6)
£000s 2005-06 2006-07 2007-08
Resource grant-in-aid baseline 39,112 39,112 39,112
Additional Resource grant-in-aid -1,250 1,492 2,461
Resource grant-in-aid sub-total 37,842 40,604 41,573
Capital grant-in-aid baseline 0 0 0
Additional capital grant-in-aid 2,014 2,250 3,250
Capital grant-in-aid sub-total 2,014 2,250 3,250
Total grant-in-aid 39856 42,854 44,823
2.7 The Interpretation Unit
The team was hosted by the Interpretation Unit of the museum, which is part of the
Department of Learning and Audiences (―department‖ here refers to an organization
of people rather than a division of the museum.) ―The Interpretation Unit exists to
increase intellectual access to the collection and to encourage understanding of
different cultures by the broadest possible audience‖ (Trustees of the British Museum).
This unit is responsible for evaluating the exhibits and ensuring that displays are
accessible and suitable to the audiences. They provide clear, readable text and audio-
visual displays. The Interpretation Unit hires professional evaluators, such as the firm
Morris Hargreaves McIntyre, to give feedback on temporary exhibits and to evaluate
the quality of the galleries.
3. Literature Review
There is a large collection of literature regarding museum studies and the goals they
try to achieve in conducting research. One such goal is the aim to educate as many
people who walk through the front doors as possible. The educational mentality
behind shaping a museum was present even when the first museums of the world were
being formed (Hein, 2006). An important point to remember is that the British

10
Museum strives to educate the general public, not a specific, narrowly defined
audience. Hence, attracting as many visitors as possible is just as important as
educating them.
In the past, museums needed to compete with international exhibits and libraries
(Bennett, 1995) and show the public that the museum provides more than just a
hodgepodge of objects; the museum also educates and allows for interaction. In
today‘s information age, especially, newer and more technologically advanced forms
of edutainment (Buckingham and Scanlon, 2000, Okan 2003, Hogle, 1996), such as
educational software are on the rise. Today, museums must provide more engaging
environments to pull people away from the computer screen and into their
establishments. In order to efficiently attract visitors, museums conduct visitor
studies and redesign exhibits.
3.1 Visitor Engagement
Using those factors which have to do with human psychology, such as the way in
which people learn and interact, museums can design exhibits to attract a more
diverse audience. Ernest Edmonds et al (2006) studied creative engagement and how
it can be used to design interactive art systems. Working at the Powerhouse Museum
in Sydney, Australia, Edmonds et al were able to design and implement several
interactive pieces of art, such as an image on a large screen that would change
depending on the viewer‘s movements. The theory of visitor engagement involves
the use of three exhibit characteristics: attractors, sustainers, and relaters. An attractor
is something that catches a visitor‘s eye, filters out the surrounding distractions, and
draws attention to the exhibit for further exploration. A sustainer is a characteristic
that keeps the viewer‘s attention as they first engage the object, providing ample time
for them to stay and learn. A relater is ―an [aspect] that [helps] a continuing
relationship to grow so that the audience returns to the work on future occasions‖
(Edmonds, Muller, & Connell, 2006). Ideally, by using these three techniques, the
exhibit should communicate its meaning to the viewer and leave them desiring more
knowledge.

11
Eilean Hooper-Greenhill (1999) contrasted the way humans communicate with one
another and the ways in which various forms of mass communications converse with
people. Hooper-Greenhill shows that education depends on the quality of
communication. She points out that without a communicator, a message, a medium,
and a receiver there can be no communication, and thus no learning can take place; in
our example, these are the exhibit, the meaning of that exhibit, any labels or images,
and the visitor, respectively. Unlike a person in a face-to-face conversation, a
museum exhibit cannot explain or clarify (without the help of a curator) anything that
is unclear or misunderstood. Hooper-Greenhill shows that television is a medium also
lacking the power to directly respond to the viewer (Hooper-Greenhill, 1999). She
fails to show, however, that what a person values is the control that allows them to
have power over what knowledge they acquire. In other words, a person may ask a
specific question seeking a specific answer, allowing the filtering of the barrage of
information that a specific medium of communication provides.
3.2 Edutainment
Museums are competing for audiences with a fairly recent form of learning called
educational entertainment, or edutainment. It is the application of education in a
supposedly fun, game-oriented atmosphere, using animations and simulations
(Buckingham & Scanlon, 2000). There has been an increasing interest in the
edutainment ―industry‖ since the early 1990s (Okan, 2003).
Edutainment attracts learners with computer software designs to transform education
into a ―fun-filled‖ gaming experience. ―The purpose of edutainment is to attract and
hold the attention of the learners by engaging their emotions through a computer
monitor full of vividly colored animations‖ (Okan, 2003). This new way of engaging
learners in such a way is rapidly growing in today‘s highly technological society
(Hogle, 1996). There are games ranging from alphabet software for young children,
to complex simulation software for adults.
Museums are competing with edutainment for audiences because edutainment can be
entirely experienced within one‘s household. Some museums have been keeping pace

12
with the technological era by adding interactive computers to complement exhibits
(Ciolfi & Bannon, 2002), however, the British Museum believes that their own
collection is enough to attract visitors and keep them engaged. As Hogle said, the
edutainment industry has been growing in recent years, making the job of marketing
the museum increasingly difficult.
In order to compete with edutainment, as well as other distractions such as television
and the internet, museums need to ―know their audience and market accordingly‖
(Dean, 1994). The museum must understand its audience so as to discover their needs,
and design the exhibits to fit those needs. One very useful way to become acquainted
with their audience is to study the visitors; museums have been conducting visitor
studies since the early 20th
century (Carliner, 2001). Museums perform tracking
studies, conduct interviews and distribute surveys with the intent to learn more about
what visitors want from their experience.
3.3 Visitor Studies
Visitor studies are an essential tool to guide museums in continually attracting and
engaging visitors. Museums have millions of artifacts in storage, and only a limited
amount on display in galleries. There is simply not enough room on the gallery floors
to show everything. In order to ensure that the most relevant objects are on display,
the museums conduct studies. The importance of museum studies is to identify and
evaluate the changes made to the museum environment and how these changes affect
the audience. By examining how visitors react to a diverse set of surroundings and
designs, one can analyze the effectiveness of the museum in communicating with the
museumgoer.
Visitor tracking studies are used as evaluations of how visitors interact with exhibits
in museums. Compared to research on the artifacts, which is conducted to increase
knowledge, visitor tracking studies are specific to the situation (Hein G. E., 1998, p.
56). Some tracking studies also evaluate how people learn, and provide information
to improve the museum.

13
Museums are a form of informal learning. Museums are often visited by school
groups because of their educational value. Due to the variety of exhibits offered in
museums, people can learn about many subjects: early history, art, science and
technology, careers, and cultural differences. People learn on their own by making
correlations between what they see and what they already know. ―We see according
to what we know, and we make sense of meaning according to what we perceive‖
(Hooper-Greenhill, 1999, p. 47). The process of understanding the meaning of an
object is an alternation between observation and deduction, ―looking from the whole
to the detail and back again‖ (Hooper-Greenhill, 1999, p. 47). What is learned from
an exhibit varies from visitor to visitor, depending on how they interpret the
information.
Carradice (2001) conducted a study at the British Museum, in which he observed and
questioned visitors in one particular gallery – the HSBC (Hong Kong and Shanghai
Banking Corporation) Money Gallery. The study was conducted to evaluate the use
and popularity of galleries and report this information to other museums as well as to
the HSBC, the donor of the exhibit. The study revealed valuable insight into the
length of the visitor‘s stay in the gallery, and how much time was spent at each
exhibit. It also categorized which gender was more likely to stop and observe the
exhibits, as well as the length of each pause. Visitors typically spent 3 ½ to 5 ½
minutes in the HSBC Money Gallery (Carradice, 2001). This is useful information
that can be used to design future tracking studies because it will help determine an
estimate for the number of visitors that can be tracked. Carradice also mentioned that
visitors that paused for less than 10 seconds at any particular exhibit were difficult to
keep track of. Therefore, only stays longer than 10 seconds were recorded; however,
the total time spent in the gallery was still tracked. In this gallery, males viewed the
exhibits longer than females (five minutes for males compared to two minutes for
females) (Carradice, 2001). The discrepancy between male and female interest may
change from gallery to gallery; this shows that it is important to observe both genders
equally to acquire accurate data. Finally, Carradice noted that more than half of his
observed visitors were alone while the rest had one or more companion. Visitors who
were alone tended to spend more time at each exhibit than those in a group.
14
In a study done by Defresne-Tasse and Lefebvre, it was determined that visiting
frequency may be the most important factor influencing visitors‘ stay at an exhibit. A
visitor who goes to a museum on occasion feels that the surroundings are familiar
enough, and does not need to expend too much energy on orienting himself; this type
of visitor pays the most attention to exhibits. If a person goes to a museum often, he
or she becomes too familiar with a museum, and the opposite is likely to occur; there
is less interest in the exhibits with which there is a level of familiarity. Finally, if one
never goes to a museum, most of their focus is used on orienting themselves instead
of looking at the exhibits (Dufresne-Tasse & Lefebvre, 1994). This is important to
note when considering the methods which should be used when examining visitor
behavior. According to Dufresne-Tasse et al, study methods should be focused more
on visiting trends rather than demographics.
Bitgood, Patterson, and Benefield conducted a tracking study at 13 zoos across the
United States. They observed a minimum of 30 visitors per zoo with equal numbers
of males and females, and equal numbers of adults and children over eight years old.
Only one person per group was observed, and if they returned to the exhibit, that
second time was ignored. Since larger areas would take longer to view, only the time
that the visitor was stopped and looking at an exhibit was recorded and the total time
in that area was added. If a visitor did not stop, their time was recorded as zero. The
results showed correlations between exhibit characteristics and visitor behavior
(Bitgood, Patterson, & Benefield, 1988). The Bitgood et al study showed that
different exhibit characteristics influence the amount of time visitors spend at an
exhibit. This coincides with Melton‘s assertion that ―every exhibit object competes
visually with every other exhibit in a museum (Melton, 1935), (Bitgood, Patterson, &
Benefield, 1988). The study showed that exhibits with large objects (in this case,
animals) tended to attract more visitors, and exhibits where the animals were moving,
held the visitors‘ attention for a longer time (approximately twice as long). Also, the
proximity of the visitor to the objects in view greatly affected the duration of viewing.
In addition, animals with which visitors were able to interact had the longest viewing
times (Bitgood, Patterson, & Benefield, 1988).

15
3.4 The British Museum
The British Museum has conducted studies on their visitors in the past. One pertinent
study categorizes the Museum visitors into seven different audience segments based
on the visitors‘ reasons for attending the museum. The study, conducted over the past
few years, breaks down the audience into sightseers, self-developers, families,
sensualists, repeat social visitors, experts, and Aficionados.
Table 5: Visitor Segments (Project Description) table from (Morris Hargreaves McIntyre, 2007)
Segment
name
Description % of our
visitors
No of
visits
Broad needs
Sightseers First-time visitors
making a general
visit. Mainly tourists
who want to ‗do‘ the
Museum
30% 26%
(1,230,000)
Ease of access,
comfort,
orientation, good
facilities
Self
developers
Non-specialists
wanting to
informally improve
their general
knowledge about
subjects covered in
the Museum
24% 24%
(1,140,000)
Journey of
discovery, layered
information,
finding out new
things
Families Mixed age groups,
wanting fun and
educational trip for
children. Defined as
any group with
adults (aged 16+)
and children (aged
15 or under) in it
12% 12%
(570,000)
Ease of access and
movement, child-
friendly facilities
and activities,
different levels of
service to meet
diverse age ranges.
Sensualists Non-specialists and
specialists wanting a
deeply moving
experience through
engagement with the
collections
13% 14%
(660,000)
Ambience, deep
sensory
engagement, space
for contemplation
Repeat
social
visitors
(Third-
Spacers)
Repeat visitors,
meeting up with
others at the
Museum. Use the
Museum as a social
space and want to
feel a sense of
12% 14%
(660,000)
Ease of access,
comfort,
orientation, good
facilities, warm
welcome,
accessible
exhibitions

16
ownership in their
surroundings
Experts Specialists wanting
to deepen their
knowledge further by
engaging deeply with
the collection
9% 10%
(480,000)
High quality access
to collections,
critical
engagement, access
to expert staff
Aficionados Specialists who want
to commune with
objects in the
collection, and use
their existing
knowledge as a base
to go deeper
2% N/A Ambience, deep
sensory
engagement, space
for contemplation
4. Methodology
The British Museum understands the importance of continually improving its overall
environment to better serve the visitors. The sponsor, the Interpretation Unit,
managed by Rhiannon Goddard, is responsible for making sure the museum
communicates effectively with its visitors.
The Interpretation Unit hires interns, who usually work for several weeks in helping
the unit to achieve their goals. These interns have not been able to conduct visitor
studies and surveys. The lack of time prevents these interns from developing an
efficient method for studying visitors. This IQP team is responsible for devising a
standard method, which will be used by future interns, as well as a set of guidelines
for using the method.
Studying museum visitors is crucially important when a museum strives to constantly
promote the satisfaction of every museumgoer. If a museum knows what its visitors
seek to accomplish during their visit, their various needs can be met through properly
structuring and presenting museum material. Whether a visitor wants to acquire new
knowledge or is visiting for purely recreational purposes, each motivation must be
considered. Achieving a successful result in a study like this, which is ultimately
helping the museum to inform and engage the public, requires a clearly outlined plan
of action.

17
4.1 Objective 1: Preliminaries
The preliminary objective when the team arrives is to become acquainted with the
sponsor, with the museum, and previous tracking studies that the museum has on
record. The team should spend the first several days talking to the sponsor about
previous studies and the museum galleries to be studied. The team will also conduct
trial studies during the first week. On the following week, the group will revise
interview questions, conduct surveys, and track visitors.
Throughout the duration of the project, the team must review past tracking studies that
the museum has conducted. In particular, the team will read British Museum studies
conducted by professional consultants, Morris Hargreaves McIntyre (MHM), which
describe audience segments. It is obligatory to review the questions they have asked
in the past when determining visitor segments, because they themselves developed the
visitor segments used. In addition, the Interpretation Unit has a handbook for interns
that includes procedures for conducting interviews, as well as necessary
demographics questions that must be included in every survey. The team will discuss
methods with the interpretation unit in order to ensure that the team produces exactly
what the interpretation unit wants.
4.1.1 Trials
The team will pre-test survey questions and observation methods via administering a
questionnaire and tracking visitor movement. The questions will be evaluated based
on visitor responses and changed accordingly. For example, if a visitor is confused by
the wording or is not sure how to answer a question, it will need to be revised. Using
the word ―room‖ instead of ―gallery‖ may be one such revision, since some visitors
tend to think of the entire museum as a ―gallery.‖
The team will observe guests to determine whether one team member can handle both
tracking and interviewing, or if more than one will be needed to effectively record
visitor data

18
4.2 Objective 2: Data Collection
The team will need to spend the majority of its time at the museum observing visitors
and gathering data. Data acquisition should include visitor observation and exit
interviews. The data will most easily be compiled in spreadsheets using Excel. The
information entered into the spreadsheet will include: date, visitor number, gender,
interview answers, dwell time, and longest exhibit time. Once the data is compiled,
the team can summarize the results, create a formal report, and create a methodology
for use by future Interpretation Unit interns.
4.2.1 Observing the Visitor
The amount of time that one visitor spends in a gallery, and movement throughout the
gallery can all be observed without the subject‘s knowledge. This type of observation,
called unobtrusive observation, gives the most accurate representation of visitor
orientation. Since the visitors are unaware of being watched, they are not inclined to
behave in any particular way in order to produce an expected outcome.
The team will observe visitor movement and record the total time spent in the gallery
as well as the time spent at each exhibit. In order to randomize the process of tracking,
at the beginning of each tracking session, a team member will choose an entrance and
count off three visitors, tracking the third. After tracking and interviewing a visitor,
the team member will start at the next entrance and repeat the process.
Every map will be labeled with the initial of the team member doing the tracking and
the number of the visitor in sequence. When tracking begins, the exact time of day,
including seconds, will be recorded on the map. The team member will draw the path
of the visitor on the map, with arrows showing direction and X‘s indicating the visitor
has stopped walking. At each stop, the tracker will record the amount of time the
visitor spent at an exhibit or panel. If the visitor takes a picture or engages in
discussion, these actions will be indicated with a P or D, respectively. When a visitor
exits the gallery, the exact time of day will be recorded once again.

19
4.2.2 Exit Interview
As the visitor exits the gallery, the team member will ask whether he or she has time
for a brief interview. If the visitor does not agree to participate in the interview,
―refusal‖ will be marked on the map. If a visitor does not stop at any exhibit, the
visitor will be marked as a ―walkthrough‖ and not interviewed. If the visitor agrees to
the interview, the team member will thank the visitor, and remind them that the
interviewer would not be offended by any negative answers. When the interview is
complete the team member will once again thank the visitor for his or her time.
4.3 Objective 3: Data Analysis
The quantitative data will be analyzed with tables and graphs. Some of the
quantitative data will include the number of visitors tracked, number of visitors
interviewed, number of visitors that view certain objects, and time spent at each
exhibit. The team will input this data into tables in Excel and create graphs and charts
to obtain a visualization of the data (see Figure 3). This will aid in forming
conclusions and portraying the data collected to the museum.
In order to analyze the qualitative data obtained from the interviews, the team will
categorize the information to convert it into quantitative data. For example, with
maps the team can determine several general paths visitors take and categorize them
into which path is most similar to the one they took.
It will be very difficult to observe groups of people since it is possible that they may
split up once in the gallery. As done in other studies, the focus will be on only one
member of each group. During the exit interview, the team will also record, if
possible, the type of group the visitor came with (family or school group). This will
make it easier to place them into categories. It will also make it possible for the team
to observe children because they would fall into either the family or school group
segment. If they are too young to interview, this may be the only way to categorize
them. When the team comes across visitors who do not speak English, or visitors
who refuse to be interviewed, they will not be able to determine which category they
belong to; however, their dwell time data can still be used. In the past, museum

20
studies have documented this refusal rate by creating a specific category for them.
We will have some amount of tracking data from this type of situation. In order to
include it in our study, we will make a specific category for the data observed; it will
not fall into one of the eight audience segments.
5. Results
The British Museum will use the data collected by the WPI team and the data that will
be collected by future interns to continually improve its galleries. The museum uses
dwell times, the amount of time visitors spend in each gallery, to evaluate the
gallery‘s performance. If there is any change in dwell time for any of the galleries
that are studied, the museum can take action (rearrange exhibits, improve the labels,
create a more efficient gateway object to catch visitor‘s eye, etc.) to make the gallery
more attractive and engaging. The museum can also use exhibit popularity (i.e. the
amount of time visitor‘s spent at each exhibit) to find out which specific areas of a
gallery need improvement. Finally, information regarding visitor tendencies in
reading labels helps the museum to specifically target the revision of certain labels
that are found ineffective when renovating a gallery.
5.1 Creating a Methodology
The objective of this project was to develop a methodology for evaluating galleries by
way of tracking and interviewing visitors. Student interns could then implement the
methodology in future evaluations. The original method for interviewing and tracking
museum visitors was written by the team before arriving on site at The British
Museum, and was based on a combination of findings from the literature review as
well as the team‘s own ideas. The team had only a basic strategy and some
preliminary ideas with no set interview questions or tracking methods. Upon arrival,
the team reviewed past studies performed at the museum as well as the MHM
documents and developed a questionnaire.

21
The Interpretation Unit previously used several methodologies for evaluating galleries.
They recorded dwell times to determine the level of engagement of the objects. They
interviewed visitors to analyze the quality of their labels. They asked visitors to fill in
personal meaning maps to find out what visitors are looking for from galleries.
Personal meaning maps are surveys that require that the interviewee write down all
mental associations upon mention of a certain topic. The unit, however, did not have
a solid method that combined tracking and interviewing. The WPI team took the
various methods from other British Museum studies and combined them to make one
efficient survey method that can be applied to any gallery. The team decided not to
use the personal meaning maps in order to save time. Future interns need to be able to
complete and analyze the study in a few weeks. This type of evaluation is very time
consuming. The study proposed by the WPI team involves tracking and interviewing,
combined for the first time as part of a standard procedure within the Interpretation
Unit.
After creating the preliminary tracking and interview template, the team conducted
several trial runs. Following the trials, the team further revised the methods and
began collecting quantitative and qualitative data. Finally, after extensive
interviewing and tracking, the team revised their methods once again, editing the
questionnaire, modifying the tracking system, and reorganizing data entry templates.
In order to develop an efficient methodology for tracking and interviewing visitors, it
was necessary to revise the interview questions and observation strategies after testing
the first version of each. Changing observation strategies involved analyzing the ease
and level of efficiency with which the team was able to track, while changing
interview questions required observing the reactions of the visitors. For instance, if
the interviewee had a difficult time answering a question or misunderstood its
meaning on more than one occasion, it was obvious that either the wording or the
question in its entirety had to be reconsidered.
The first strategy the team used to track visitors included noting the time each tracked
visitor spent reading the labels or looking at the actual objects in the gallery. In the
second iteration of the tracking strategies, the reading time was eliminated since the
visitor‘s particular behavior while at an exhibit was very difficult to observe. Instead,

22
an X was drawn at each point on the map where a visitor stopped and the time spent
standing was recorded. Since the interview contained questions regarding the
visitors‘ reading labels and panels, the team was still able to learn about reading
habits. Also, numbers were added to the panels to help the team identify which
panels were read, since panels are separate from exhibits.
While tracking using the first version of the methodology, the amount of time visitors
spent at each exhibit was identified with a code known as a level of engagement. For
instance, L1 was used when the visitor spent five seconds or less looking at an exhibit,
L2 meant that the time was between five and ten seconds, and so on. In the first
iteration, a ―G‖ was used to show that the visitor walked by and glanced at the exhibit
without stopping but was not included in the quantitative data. At this early stage of
developing the methodology, glances were thought to be insignificant, since a visitor
spent almost no time at all at the exhibit. During the second iteration of the methods,
the levels of engagement were eliminated. Instead, the exact time spent at each
exhibit was now recorded. The team concluded that exact times would be a much
more accurate and precise way of measuring exhibit viewing time. While the ―G‖
was not eliminated, it was used to symbolize that the visitor spent one second at the
exhibit. One second was recorded in the data in the same manner as all other exhibit
viewing times.
The first version of interview questions, while effective at determining visitor
reactions to the galleries and the segments into which visitors fell, needed to be
revised for the second version. The order of the questions was changed in order to
make the interview flow more smoothly. For example, in the first version the first
question asked whether the visitor was in an organized group, the second version first
asked whether the visitor came to the museum for the first time. The new order
allowed the interviewer to establish a foundation for the rest of the interview, let the
interviewee know what the interview would be like, and create a friendly atmosphere.
Asking whether the visitor has ever been for the British Museum not only makes the
interview sound more informal (as in a casual conversation) but also allows the
interviewee to know that the museum really cares about the person as a visitor. Also,
a question regarding what the visitor would like to learn during the visit was removed,
since the visitors had a hard time comprehending the question. A question asking

23
whether the visitor had any general suggestions for the gallery was added in order to
help the Interpretation Unit and the museum as a whole to improve that gallery.
The first version of the excel spreadsheet contained two sheets, the first regarding
demographics and visiting patterns and the second regarding the gallery-specific
information. Also, the order of the items was not the same as the order of the
questions on the interviews, which made the data entry process take longer. The
second iteration of the excel spreadsheet contained only one sheet and the item order
was identical to the order of the questions on the interviews.
5.2 Creating a Questionnaire
The following questions were proposed by the sponsor and used as guidelines in
determining the methods:
What are the average dwell times for particular galleries?
What are the most popular objects in each gallery?
What do the visitors think of the text in each gallery?
How do visitors orient themselves once they are in the gallery?
Do the different audience segments have different visiting patterns once in the
gallery (i.e. sightseers, self developers, art lovers, experts)?
After reviewing an intern guide prepared by previous interns, the MHM studies, and a
previous IQP (Cleary, Ernst, Moscardini, Stanford, 2007, the team created a
questionnaire adapted from these studies (see Appendix A). This interview included
questions for determining the audience segments of the visitors as well as
demographic information, used by the museum for statistical analysis. The interview
also contained questions regarding the quality of the gallery and its objects. The
following flow chart was used to determine which audience segment a visitor falls
into based on the visitor‘s answers to the interview questions.

24
The first interview question helps to determine the percentage of first-time visitors in
each gallery. This question was chosen because it was one of the questions used by
MHM to determine which segment the visitors fall into. If it was the interviewee‘s
first visit, for instance, there was a chance that the visitor was a sightseer.
Question 1: Is this your first ever visit to the British Museum?
Questions two, three, and four determine the visiting frequency of the interviewee.
These questions were also used by MHM to determine which segment visitors fall
into. Depending on their visiting frequency, as well as other factors, such as
motivation, the visitors can be classified under the repeat social segment.
Question 2: If not their first time: How long ago was your last visit?
o 12 months ago or less
o Between one and two years ago
Family Visitor?
Yes
Aficionado
No
Motivation?
Emotional Intellectual Social
Specialist? Specialist? Frequency?
Yes No Yes No Been
before
First
Time
Sensualist Expert Self
Developer
Repeat
Social
Sightseer Family
Figure 2: Segment Flow Chart (Taken from “Visitor Insight Monitor – Year Two” by
MHM)

25
o Between two and five years ago
o More than five years ago
Question 3: If not their first time: Including today, how many times have you
visited in the past 12 months?
Question 4: If not their first time: Including today, how many times have you
visited in the past 3 months?
The fifth question determines the main purpose of the interviewee‘s visit. The reason
for including this question was to determine whether the visitor was a potential
sightseer. If the visitor came to learn more about a very specific topic, however, this
could show that they already have a certain level of knowledge about one or more
topics covered in the museum.
Question 5: What was your reason for coming to the museum today?
o To see a specific gallery or exhibit?
o A general visit to the museum?
o Attend a talk, tour, or special event?
o To visit the shop?
o To visit the café?
o Meet friends
o Other_______________
The sixth question was initially used to identify people in the segment titled
―Organized Group‖ but the segment was later removed. The question was still
included because it potentially helped to determine whether a visitor was a part of a
tour group, hence most likely a sightseer or self developer.
Question 6: Are you here as part of an organized group?

26
The seventh question determines whether the visitor came to the museum with their
family. The MHM used this question to determine which segment visitors fall into.
If the visitor came to the museum with their family, they were temporarily classified
into the family segment. If the visitor, however, was also determined to show strong
characteristics (i.e. motivation, level of knowledge, etc.) of another segment, they
were classified into that one.
Question 7: Are you here with your family?
The eighth question was used to find out the level of knowledge of the interviewee.
This question was also used by MHM to determine which segment the visitors fall
into. If the visitor has specialist knowledge, for example, the visitor could fall into the
aficionado, sensualist, expert, or self developer segment, depending on the motivation
Question 8: How would you best describe your level of knowledge of the
subjects covered in this museum?
o Specialist Knowledge
o General Knowledge
o No Knowledge
The ninth question was used to find out the visitor motivations—intellectual,
emotional, or social—for coming to the museum. This question was also included for
determining segment information. If the visitor does not fall into the family segment,
the motivation is the next thing that is considered to decide which of the segments the
visitors fall into.
Question 9: What best describes your motivation for coming to the museum?
(answer ―yes‖ or ―no‖ to each as I list them).
o You have academic or professional interest in the subject.
o You have personal interest in the subject.
o You are looking for peaceful quiet contemplation.
o To spend time with friends
o To spend time with family

27
o To improve your own knowledge.
o To have an emotionally moving experience.
o To get a better understanding of people and cultures.
o To experience what the past was like.
o To stimulate your own creativity.
The first three questions (10-12) in the Exhibits section were included to find the
―gateway exhibit‖ in each of the galleries, which objects visitors favored, and which
objects they disliked. It was important to find the gateway object and why it was the
most noticeable in order to identify what visitors are attracted to. Knowing this
information, the curators could continue to improve that gallery.
Question 10: Did anything in particular catch your eye as you walked in to this
room? What was it? What attracted you to that object?
Question 11: Did you have a favorite object in this room? What was it? Is
there any reason you favored this object?
Question 12: What did you least like about this room? Is there any reason you
did not favor this?
The three questions in the Labels section (13-15) were included to learn more about
the visitors‘ general reading habits. The answer to the first of these questions was
used to determine how many people read the labels in a particular gallery while the
second and the third were used to find out what the visitors would have liked to learn
from the labels and whether what they read was easy to understand. It is useful for
the museum to find out where they can improve on their labeling to ensure the
greatest potential for learning and increase the ease of understanding the labeling.
Question 13: Did you read the labels or panels in this gallery? (point to labels
and panels) If yes, move on to 5. If no, proceed to personal interview.

28
Question 14: Were the labels easy to understand? If they were not, is there any
reason?
Question 15: After reading the labels, were there any questions you had about
the objects that were not answered in the label?
Question 16 was included to obtain the visitors‘ opinions on the gallery. A visitor
may be more willing to provide suggestions to the gallery, than to say what they least
liked about the gallery (question 12). The answers to this question provide useful
information for improving the gallery.
Question 16: Do you have any suggestions or comments on this gallery?
The demographics questions at the end of the interview are included mostly for
marketing purposes, since the museum uses them to identify the audiences they need
to target the most. They also use them as a ―check‖ to make sure the interns are
maintaining a random sample. The Interpretation Unit also regularly collects this
information with all of the studies they conduct and it was a requirement to include it
for their purposes.
Question 17: What is your first language?
Question 18: In which country do you currently live?
Question 19: Who are you here with?
o Alone
o Children
o Adults
o School party
o Organized group
Question 20: What age group do you fall into?
o 8-11
o 12-14
o 15
o 16
o 17-19
29
o 20-24
o 25-34
o 35-44
o 45-54
o 55-59
o 60-64
o 65+
o Prefer not to say
5.3 Creating Maps
The Interpretation Unit suggested a series of galleries as options for the team to use in
their study. In this list were galleries that were recently changed or will be renovated
within the next year. The sponsor indicated that certain galleries had greater priority
than others, and the team explored these galleries, choosing three for the study: Room
26 North America, Room 70 Roman Empire, and Rooms 62-63 Egyptian Death and
Afterlife. The North America gallery, though not a priority, was chosen due to its
small size allowing for a good place to start. Both the Roman Empire gallery and the
Egyptian Death and Afterlife gallery were of high priority.
After examining the three galleries, the team noticed that the museum assigned a
number to almost every exhibit, usually written on the glass case. Cases were
represented on the maps as rectangles. In creating the gallery maps, these numbers
were used to indicate the correct layout of the objects in each gallery and the
orientation of the visitors in relation to them. Also, when visitors indicated their
favorite exhibits, these numbers helped to determine to which exhibit they were
referring.
The cases without numbers assigned by the museum were numbered consecutively
beginning after the last assigned number. The Roman Empire gallery, for example,
had many exhibits not in cases. These were indicated with circles and ovals and
assigned letters. This gallery also had wall mosaics, which were referred to as W1,
W2, etc.
In order to represent panels within a gallery, small rectangles were used and were
enumerated as P1, P2, etc. The panels located inside of the cases were drawn as small

30
squares. Any benches inside the gallery were labeled as well. Entrances to the
gallery were labeled with cardinal directions.
5.4 Trial Studies
After the trial runs, the team determined that one person could efficiently track visitor
movement, record dwell time, and conduct interviews. Therefore, a larger sample
size could be achieved with one person in each gallery simultaneously.
5.5 Data Analysis
5.5.1 Qualitative
The following paragraphs are examples of the qualitative analysis that can be
determined from the study. The range of possibilities for analysis is very extensive
and may open new doors of understanding of visitors. The Interpretation Unit will be
able to use this analysis to determine future research questions.
North America, Room 26
The North America room did not have a gateway object. The gateway object is
usually the focal point of the room, or the first object seen when one walks into the
room. The fact that the North America gallery does not have a gateway object can be
seen both by simple observation of the room and by close examination of the
collected data. The data shows that no object in the room stood out more than the
others, and no single object received attention from more than nine visitors out of 75
observed. One object did get slightly more attention from visitors, but this may
correlate to a strange phenomenon where people turned left when they entered any
gallery. Turning left seems to be a common phenomenon seen in galleries without a
gateway object. The object mentioned above that received the most attention is case 9,
the first glass case on the wall when walking into the gallery from the west and
turning to the left. This case contains objects from the Arctic, such as kayaks, Yup‘ik
masks, gut and fox skin clothing, and Alaskan head gear.

31
Dwell times in the North America gallery were very similar for people who answered
as having either specialist or general knowledge (average of about 300-400 seconds).
Dwell times were much shorter for people who claimed to have little or no knowledge
(average of about 90-150 seconds). This may possibly mean that the labels in this
gallery are designed for people with prior knowledge and does not consider someone
with none. In an interview with a repeat social visitor who comes to the museum
about once a month, the man said he often felt like the labels were too advanced for
him. He had a hard time understanding large words and meanings.
Roman Empire, Room 70
The Roman Empire Gallery is an interesting room to observe. It is a very long room
filled with a lot of objects. On one end of the room, when entering from the north,
there is a gateway object on the left, the Head of Augustus. The head is in its own
case and it is the first object most people see when they first enter the room from that
direction. On the other end of the room, when entering from the south, there is no
gateway object. There is one statue standing alone, but it has a very small label that
does not sufficiently engage visitors. The difference between the two entrances
provides a great comparison of the effectiveness of using a gateway object. To
further the argument that gateway objects might actually cause dwell times to
decrease, rather than improve engagement, visitors entering from the northern
entrance, with the Augustus head, have a shorter average and median dwell time than
those who entered from the south. It seems as though from the visitors‘ perspective
that the gateway objects of the room sometimes appear to be the highlight of the room,
and possibly the only object of interest there. Of course, it is very plausible that there
may be other factors causing the difference in dwell times. It may be that people
moving through from the north to south are on their way out of the museum through
the main museum entrance at the South. This could mean that they are not spending
as much time in galleries due to fatigue or other engagements. A larger sample for
this gallery would help to clarify whether this is true but this example illustrates the
kind of use that the Interpretation Unit could make of the data. The addition of a

32
question that asks the visitor how long they have been in the museum will also help to
develop credibility for the argument.
The dwell times in this Gallery were not dependent on level of knowledge. Visitors
who answered as having general, specialist, or little to no knowledge all had a similar
median dwell time.
Egyptian Death and Afterlife, Rooms 62-63
The objects in case 7 got the most attention in the Egyptian galleries. There are
mummies of the Ptolemaic and Roman periods in this case. It is located near the
northern entrance to the room, but can easily be seen from the south entrance, and is
not far from the east entrance as well. This may well be the gateway object for this
room.
Out of 75 observed visitors in this gallery, none were experts, self-developers or
aficionados. This is most likely due to the high frequency of tourists and young
children in school groups. This combination makes the room very crowded and very
noisy, situations unsuitable for those three audiences segments.
The dwell times of this gallery are similar to those of the North America. Visitors
who answered as having general knowledge remained in the gallery longer than those
who responded as having little or no knowledge (on average 300-400 seconds longer).
The collected data was analyzed under the following categories: dwell time, exhibit
popularity, labels, visiting patterns, and demographics.
5.5.2 Dwell Times
Dwell time is the total amount of time the visitor spent in the gallery. Determining
the dwell times of the galleries helps the museum to determine which galleries have
enough engaging elements or objects and which galleries need to be improved. For
instance, if one gallery has greater dwell time than another or a certain gallery‘s dwell
time is steadily declining over time, there may be a problem. There are other factors,

33
or variables, that could potentially affect the dwell times, such as the time of day, time
of year, visitor demographics, and countless others. Thus, analyzing dwell times is
only the first step to finding a problem with a gallery, but it is usually an obvious sign
that something needs to be re-examined within that gallery.
For each gallery, the median dwell time, longest dwell time, and shortest dwell time
was calculated. Using the median dwell time instead of the mean allows for a more
accurate representation of the dwell time data. The longest and shortest dwell times
are calculated in order to find out whether that number is increasing or decreasing
over time. The median, longest, and shortest dwell times of the different galleries are
not compared since they have different content and attract potentially different
audiences. The quantitative results for dwell time of each gallery can be found in
Appendix D. Histograms, or frequency distributions, were created for each gallery,
shown below in Figures 3, 4, and 5.
Figure 3: North America Dwell Times Frequency Distribution
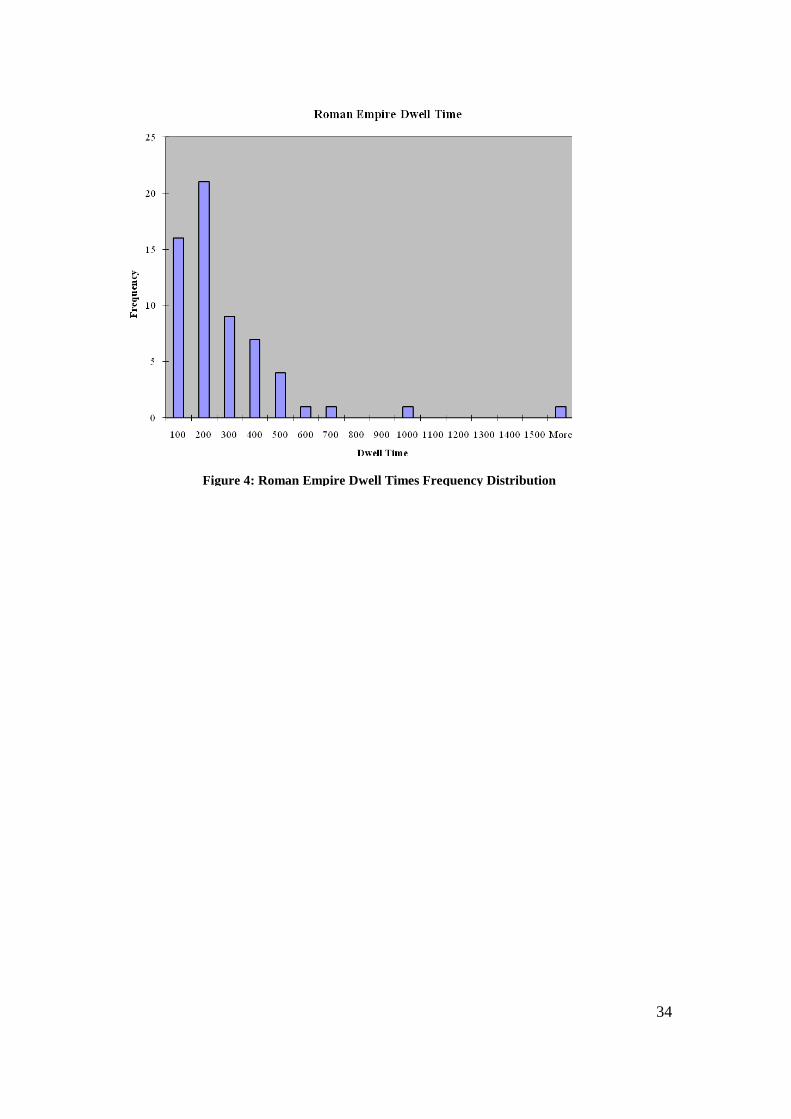
34
Figure 4: Roman Empire Dwell Times Frequency Distribution

35
5.5.3 Average Exhibit Time
Average exhibit time is the average amount of time the visitor spent at each exhibit in
the gallery. Determining the average exhibit times in the galleries helps to determine
what the museum could do to improve their galleries a bit more specifically than the
general dwell time. For example, if the museum is trying to attract more attention to
Exhibit A but its average exhibit time is not increasing over time, there is something
that may need to be redesigned. Also, if an exhibit is attracting a lot of attention, the
museum can learn from the tactics they applied and use them in the future.
5.5.4 Exhibit Popularity
Exhibit popularity was determined by the exhibit at which the visitor spent the most
time. If a visitor spends a lot of time at an exhibit, it is likely that they are learning
something, and the more time they spend the more they learn. This may also help to
Figure 5: Egyptian Death and Afterlife Dwell Times Frequency
Distribution

36
determine which labels are working well and which ones need improvement, since
people may tend to spend more time at an exhibit if they are reading the label.
The most popular exhibit was determined for each gallery. If a visitor spent the same
amount of time at more than one exhibit, both exhibits were counted as the most
popular. By analyzing tracking results and using visitor responses to the interview
questions, the team was also able to determine which exhibits were the most
noticeable, most photographed, and most discussed.
5.5.5 Most Photographed
The most photographed exhibit in a gallery is the one which the most visitors
photographed. Although this is still a topic of research, the museum could potentially
use this factor to determine the relation between photographers and non-English
speakers, since they may be looking for an alternate form of engagement besides
reading. Also, the museum is looking into people who just take a picture and leave
without looking at the exhibit any further. The most photographed exhibits were
determined by counting the P‘s for each object on the team‘s tracking maps.
5.5.6 Most Discussed
The most discussed exhibit in a gallery is the one which the most visitors discussed.
This was important to determine since discussion usually indicates engagement and
learning. Learning is a social process, and the fact that the visitors are discussing
what they are seeing amongst themselves means they are reflecting on what they are
seeing and reading. Thus, the most discussed objects are the ones most likely
succeeding in providing informative labels along with an interesting visual. The most
discussed exhibits were determined by counting the amount of D‘s on the team‘s
tracking maps.
The quantitative results for most popular exhibit, most photographed exhibit, and
most discussed exhibit, of each gallery can be found in Appendix D.
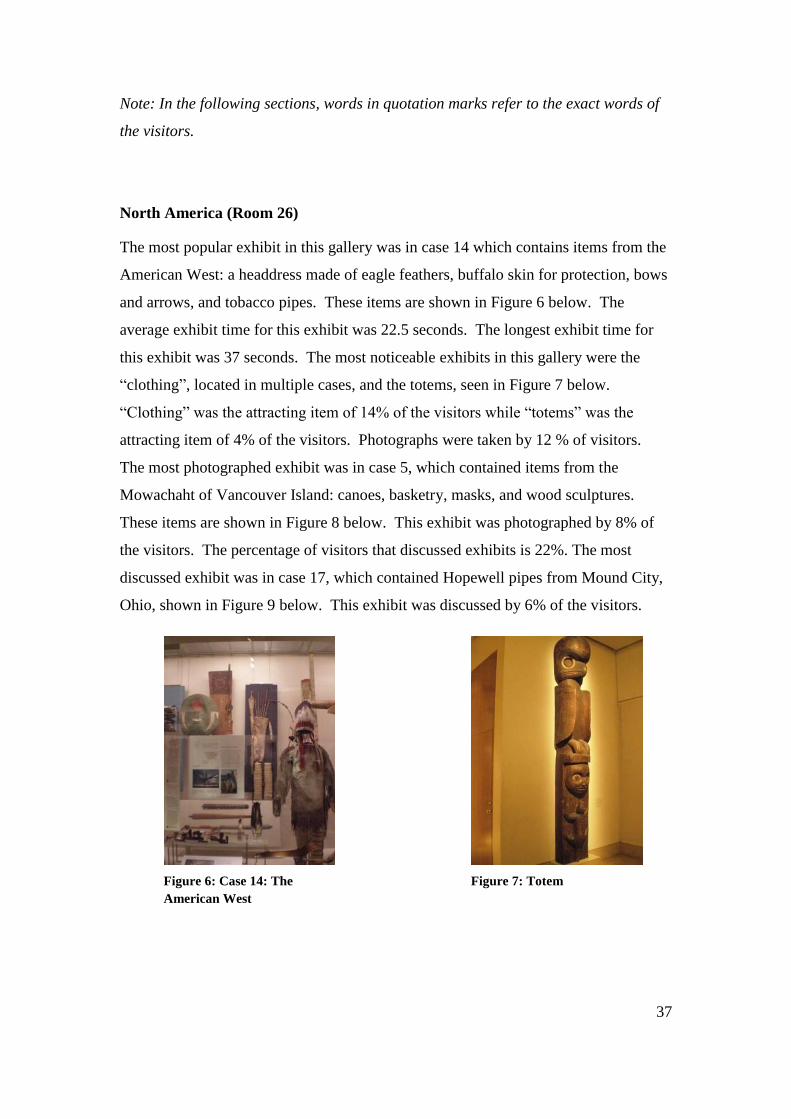
37
Note: In the following sections, words in quotation marks refer to the exact words of
the visitors.
North America (Room 26)
The most popular exhibit in this gallery was in case 14 which contains items from the
American West: a headdress made of eagle feathers, buffalo skin for protection, bows
and arrows, and tobacco pipes. These items are shown in Figure 6 below. The
average exhibit time for this exhibit was 22.5 seconds. The longest exhibit time for
this exhibit was 37 seconds. The most noticeable exhibits in this gallery were the
―clothing‖, located in multiple cases, and the totems, seen in Figure 7 below.
―Clothing‖ was the attracting item of 14% of the visitors while ―totems‖ was the
attracting item of 4% of the visitors. Photographs were taken by 12 % of visitors.
The most photographed exhibit was in case 5, which contained items from the
Mowachaht of Vancouver Island: canoes, basketry, masks, and wood sculptures.
These items are shown in Figure 8 below. This exhibit was photographed by 8% of
the visitors. The percentage of visitors that discussed exhibits is 22%. The most
discussed exhibit was in case 17, which contained Hopewell pipes from Mound City,
Ohio, shown in Figure 9 below. This exhibit was discussed by 6% of the visitors.
Figure 6: Case 14: The
American West Figure 7: Totem

38
Roman Empire (Room 70)
The most popular exhibit in this gallery was in case 18, which contained crocodile
armor, shown below in Figure 10. The average exhibit time for this exhibit was 8
seconds. The longest exhibit time for this exhibit was 12 seconds. The most
noticeable exhibits in this gallery were the busts shown in Figure 11, the mosaics
shown in Figure 12, and the bronze head of Augustus shown in Figure 13. The
exhibit containing the ―busts‖ was the attracting object of 14% of visitors, the bronze
head of Augustus was the attracting object of 5% of visitors, and ―mosaics‖ was the
attracting object of 3% of visitors. Photographs were taken by 20% of visitors. The
most photographed exhibit was the crocodile armor in case 18. This exhibit was
photographed by 8% of visitors. The percentage of visitors that discussed exhibits
was 13%. The most discussed exhibit was in case 12, which contained the Portland
Vase, shown in Figure 14. This exhibit was discussed by 5% of the visitors.
Figure 9: Case 17: Hopewell Pipes
from Mound City, Ohio Figure 8: Case 5: The Mowachaht of
Vancouver Island

39
Figure 10: Case 18: Crocodile
Armor Figure 11: Busts
Figure 12: Mosaics
Figure 13: Bronze Head of
Augustus
Figure 14: Portland Vase

40
Egyptian Death and Afterlife (Rooms 62 & 63)
The most popular exhibit in this gallery was case 3, which contained information
about mummification as well as a mummy that was not in a coffin. This is shown in
Figure 15. The average exhibit time for this exhibit was 56.33 seconds. The longest
exhibit time for this exhibit was 108 seconds. The most noticeable exhibits in this
gallery were: the exhibit in case 9 (Figure 16), the mummies, the sarcophagi, and case
3 (Figure 15). Exhibit 9 was the attracting exhibit of 4% of the visitors, ―mummies‖
was the attracting exhibit of 15% of the visitors, ―sarcophagi‖ was the attracting
exhibit to 11% of the visitors, and case 3 was the attracting exhibit to 6% of the
visitors. Photographs were taken by 32% of the visitors. The most photographed
exhibit was in case 9 which contained the three parts of a coffin: the mummy board,
the inner coffin, and the outer coffin. This is shown in Figure 16. This exhibit was
photographed by 21% of the visitors. The percentage of visitors that discussed
exhibits in the gallery was 23%. The most discussed exhibit was in case 7, which
contained mummies from the Ptolemaic and Roman periods, shown in Figure 17.
This exhibit was discussed by 11% of the visitors.
Figure 15: Case 3: Mummification Figure 16: Case 9: Three Parts of
a Coffin

41
5.5.7 Gateway Object
The most noticeable exhibit in a gallery, also known as the ―gateway object‖, is the
exhibit which is the most attractive from the point of view of the visitor, most likely
because the museum has put it in such a location where it appears important. The
object usually has a strong narrative attached to it to engage the visitor and make them
curious and willing to find out more. The ―gateway object‖ can even be used to direct
the visitor to another object in the gallery via its label. To determine which exhibits
were the most noticeable, the response to the question regarding the exhibit which
caught the visitor‘s eye was used. By determining what the statistically most
noticeable exhibit is, curators can find out whether the intended ―gateway object‖ and
the ―gateway object‖ found in a tracking study are the same.
5.5.8 Label Reading
The percentage of visitors that read labels was also calculated for each gallery. Since
the second iteration of the tracking methodology did not include recording the time
spent reading, this was determined purely through the interview. This still required a
certain level of trust, however, as visitors sometimes answered untruthfully, most
Figure 17: Case 7: Mummies from the Ptolemaic and Roman
Periods
42
likely fearing that they may be tested on the material. Some visitors even commented
on this fear prior to the questionnaire. After reviewing previous studies and
consulting with the British Museum‘s Interpretation Unit, determining it solely
through the interview appeared to be the best strategy.
Calculating the percentage of visitors reading labels is useful in determining whether
the labels are effective from gallery to gallery and in one gallery over a period of time.
There may always be other reasons for lower percentages, such as the increased
percentage of non-English speaking visitors, but calculating the percentage of visitors
helps the museum to determine where they can be conducting more research.
In the North America gallery, 73% of all visitors read labels. More people read labels
in this gallery than in any other gallery the team observed. In the Roman Empire
gallery, 63% of all visitors read labels. Fewer people read labels in this gallery than
in any other gallery that the team observed. In the Egyptian Death and Afterlife
gallery, 70% of all visitors read labels.
5.5.9 Visiting Patterns
Visiting patterns were determined using several interview questions. The most
common companions of the visitor, the greatest number of visits within the past year,
and the percentage of first-time visitors were determined for each gallery. The most
common paths taken through each gallery were determined by the maps. The maps
were analyzed and arrows of varying sizes were drawn to represent the various
visiting habits (see Appendix C). The quantitative results for visiting patterns of each
gallery can be found in Appendix D.
North America (Room 26) Visiting Patterns
The most common companions of the visitor in this gallery were adults. The greatest
number of visits in the past 12 months indicated by a visitor was 20. In this gallery,
61% of all visitors were first-time visitors. This gallery had the smallest percentage

43
of first-time visitors of all the galleries the team observed. The most common path
through the North America gallery was a clockwise circle around the outside.
Roman Empire (Room 70) Visiting Patterns
The most common companions of the visitor in this gallery were adults. The greatest
number of visits in the past 12 months indicated by a visitor was six. In this gallery,
62% of all visitors were first-time visitors. The most common path through the
Roman Empire gallery was through the center aisle of the gallery.
Egyptian Death and Afterlife (Rooms 62 & 63) Visiting Patterns
The most common companions of the visitor in this gallery were adults. The greatest
number of visits in the past 12 months indicated by a visitor was four. In this gallery,
77% of all visitors were first-time visitors. This gallery had the largest percentage of
first-time visitors of all the galleries the team observed. The most common path
through the Egyptian Death and Afterlife gallery was through the center of the gallery.
5.5.10 Walkthrough and Refusal Rates
For those who walked through a gallery without looking at a single exhibit, called
walkthroughs, and those who refused to be interviewed or did not speak English,
called refusals, maps created by the team were still used and the paths were
considered for the final data. After all data was collected, the percentage of refusals
and walkthroughs was determined.
Curators may potentially use the percentage of walkthroughs in a gallery to conduct
further research on the topic. Sometimes visitors will walk straight through a gallery
without looking at a single object just because they are on their way to another gallery
or they are exiting the museum. In this case, it does not necessarily indicate that the
gallery had no ―gateway exhibit,‖ though it may. In some instances, visitors may
walk straight through because nothing has caught their eye. There is virtually no way

44
of determining the reason for walkthroughs, unless the walkthroughs are all
interviewed.
The information collected from the maps of refusals is still useful because it adds to
dwell time and most common paths data. Just because a visitor did not speak English
or refused to interview, does not mean the rest of their data should be disregarded.
North America (Room 26) Walkthrough and Refusal Rates
In this gallery, a total of 75 visitors were observed. Of these, 21 visitors (28%) were
walkthroughs, 22 visitors (29%) were refusals and 32 visitors (43%) were interviewed.
This gallery had the smallest percentage of visitors who were interviewed of all the
galleries the team observed.
Roman Empire (Room 70) Walkthrough and Refusal Rates
In this gallery, a total of 79 visitors were observed. Of these, 24 visitors (30%) were
walkthroughs, 20 visitors (25%) were refusals and 35 visitors (45%) were interviewed.
This gallery had the largest percentage of walkthroughs of all the galleries the team
observed.
Egyptian Death and Afterlife (Rooms 62 & 63) Walkthrough and Refusal Rates
In this gallery, a total of 71 visitors were observed. Of these, 16 visitors (23%) were
walkthroughs, 22 visitors (31%) were refusals and 33 visitors (46%) were interviewed.
This gallery had the smallest percentage of walkthroughs of all the galleries the team
observed. This gallery had the greatest percentage of refusals of all the galleries the
team observed. This gallery also had the greatest percentage of visitors who were
interviewed of all the galleries the team observed.

45
5.5.11 Demographics
General demographic information was collected for the museum through interview
questions. The gender breakdown, most common age range, least common age range,
most common first language, and most common country of residence was determined
from this data.
The museum is interested in collecting demographic information for marketing
purposes. If they know the general demographics of their visitors, designers can more
accurately create such things as advertisements and exhibit posters to target and
efficiently attract the right age groups, nationalities, and address any other
demographics to which they have access. Also, this data can be used to make
comparisons to other galleries and across various types of data. For instance, the fact
that there are more children in the Egyptian Death and Afterlife gallery could be
because of a certain exhibit or the fact that there are more females could be because
there are more mothers. The quantitative results for demographics of each gallery can
be found in Appendix D.
North America (Room 26) Demographics
In this gallery, 57% of all observed visitors were male and 43% were female. The
most common age range was 25-34. The least common age was 16. A chart of the
number of visitors in each age group is shown below in Figure 18. The most common
first language was English and the most common country of residence was England.
Charts of the first language and country of residence of visitors are shown below in
Figure 19 and Figure 20.

46
Figure 18: North American Age Group Distribution
Figure 19: North America First Language

47
Figure 20: North America Country of Residence
Roman Empire (Room 70) Demographics
In this gallery, 63% of all observed visitors were male and 37% were female. The
most common age range was 25-34. The least common ages were 15, 16, and 65 and
over. A chart of the number of visitors in each age group is shown below in Figure 21.
The most common first language was English and the most common country of
residence was England. Charts of the first language and country of residence of
visitors are shown below in Figure 22 and Figure 23.

48
Figure 21: Roman Empire Age Groups
Figure 22: Roman Empire First Language

49
Figure 23: Roman Empire Country of Residence
Egyptian Death and Afterlife (Rooms 62 & 63) Demographics
In this gallery, 46% of all observed visitors were male and 54% were female. The
most common age range was 25-34. The least common age was 15 and 65 and over.
A chart of the number of visitors in each age group is shown below in Figure 24. The
most common first language was English and the most common country of residence
was USA. Charts of the first language and country of residence of visitors are shown
below in Figure 25 and Figure 26.

50
Figure 24: Egyptian Death and Afterlife Age Groups
Figure 25: Egyptian Death and Afterlife First Language

51
Figure 26: Egyptian Death and Afterlife Country of Residence
Overall Demographics
The data from all three galleries was combined to obtain a broader sample size in
order to show a more accurate picture of the museum. The chart of the overall age
groups is shown in Figure 27 below. The chart of overall first language is shown in
Figure 28 below and the chart of overall country of residence is shown in Figure 29.
Figure 27: Overall Age Group

52
Figure 28: Overall First Language
Figure 29: Overall Country of Residence
Please note that while some pie charts in sections 5.11 may have different colors
corresponding to the same visitor category (i.e. the languages and countries of
residence), this is only due to a fault within Microsoft Excel. For example, in the
country of residence charts, USA appears as a different color in each chart. Since it
would be easier to read if each of the countries and languages had corresponding
colors, the WPI team recommended to future interns to use better software, if
available. It is possible to make the colors the same in Excel, but the process is
extremely tedious.

53
5.5.12 Segment Breakdown
The audience segments were determined by the visitor‘s answers to the interview
questions. The Segment breakdown was also determined for each gallery. Each
visitor was classified into one of the following segments: family, aficionado,
sensualist, expert self developer, repeat social visitor, sightseer, and organized group.
Figures 34, 35, and 36 in section 5.5.13 below show the percentage of visitors who
fell into each audience segment for each observed gallery.
5.5.13 Comparisons with British Museum Data
The data from each gallery was compared to the data from the British Museum as a
whole in the MHM study. This was done in order to determine whether different
galleries attract different demographics. With this information the museum can
present the information in a way that targets specific audiences. The charts below
display comparisons between each gallery and the British Museum.
Figure 30: Comparison of Origin of Visitors between All Three Galleries and the British Museum

54
Figure 31: Comparison of Knowledge Levels between North America and the British Museum
Figure 32: Comparison of Knowledge Levels between Roman Empire and the British Museum

55
Figure 33: Comparison of Knowledge Levels between Egyptian Death and Afterlife and the British Museum
Figure 34: Segment Comparison between North America and the British Museum

56
Figure 35: Segment Comparison between Roman Empire and the British Museum
Figure 36: Segment Comparison between Egyptian Death and Afterlife and the British Museum

57
Figure 37: Gender Comparison between North America and the British Museum
Figure 38: Gender Comparison between Roman Empire and the British Museum

58
Figure 39: Gender Comparison between Egyptian Death and Afterlife and the British Museum
Figure 40: Age Group Comparison between North America and the British Museum

59
Figure 41: Age Group Comparison between Roman Empire and the British
Museum
Figure 42: Age Group Comparison between Egyptian Death and Afterlife and the British
Museum

60
6. Conclusions
The objective of this IQP was to develop a guidebook, which future Interpretation
Unit interns can use in order to effectively evaluate galleries. By tracking and
interviewing visitors, the team was able to revise tracking methodologies and
interview questions in order to develop a set of efficient methods. Considering the
comfort of the visitor, such as the understandability of the interview questions, was
just as important as addressing the position of the interns. When developing tracking
methods, the positions where the interns should stand and how they can track more
inconspicuously were suggested by the team.
The WPI team advised interns to use the material provided in the guidebook to help
them with their evaluations but to nevertheless be open to altering the procedures if
they find a better alternative. The content of the Intern Guidebook included specific
methodologies and suggestions regarding creating maps, tracking and interviewing
visitors, analyzing data, and using the basic functions of Excel.
After reading the developed Intern Guidebook, each intern should be able to:
Determine the median dwell time of the gallery
Determine the most popular exhibit in the gallery
Determine the gateway exhibit
Determine the visitor orientation
Determine most traveled paths in the gallery
Determine audience segments
Determine correlations between segments and data
In addition to creating the guidebook, the WPI team also did a small amount of data
analysis. Using their own developed methodologies, the team tracked and
interviewed visitors and analyzed the collected data. The team analyzed the data
using the guidelines above and made conclusions about what the data could mean and
how the museum could use the data for its benefit. The team also created graphs to
better represent the collected data and to more effectively draw conclusions.

61
There is a large amount of analysis that can be useful to the museum. However, the
WPI team did not dedicate an ample amount of time to data analysis. The team‘s
efforts were mostly focused on the Intern Guidebook. The sample size collected in
the study was too small for adequate and conclusive analysis. Again, this is also
because much of the team‘s time was spent focusing on a useful methodology for the
museum.
Suggestions for Future Research
After completing the Intern Guidebook and their visitor studies, the team developed
several questions, which can be answered through future research by interns or IQP
groups. The time constraint did not allow the team to look into these questions
themselves but they feel that it would be useful for the Interpretation Unit to pursue
them in the future. The following questions were proposed:
How do audience segments correlate to all other tracking information, such as
dwell time, exhibit popularity, and gateway objects?
How can new types of software be used to better analyze the data?
How does the time of day affect the tracking data?
Why do people walk through galleries without a single glance at any object?
Maybe a second interview can be developed to probe the minds of
walkthroughs.
Observe the next person that walks into the room, without alternating doors or
counting off three people.

62
Works Cited
Ballard, B. (2001). The British Museum . Retrieved November 6, 2007, from
http://www.britainexpress.com/London/british-museum.htm
Bennett, T. (1995). The Birth of the Museum. London: Routledge.
Bitgood, S., Patterson, D., & Benefield, A. (1988). Exhibit Design and Visitor
Behavior: Empirical Relationships. Environment and Behavior , 474-491.
Buckingham, D., & Scanlon, M. (2000). That is edutainment: media, pedagogy and
the market. Sydney.
Carliner, S. (2001). Modeling Information for Three-dimensional Space: Lessons
Learned from Museum Exhibit Design. Technical Communication , 554-570.
Carradice, I. (2001). Development and Evaluation of the HSBC Money Gallery.
London: The British Museum.
Ciolfi, L., & Bannon, L. J. (2002). Learning From Museum Visits: Shaping Design
Sensitivities. Limerick: University of Limerick, Ireland.
Cleary, C. J., Ernst, C. L., Moscardini, M., and Stanford, R. B. (2007). British
Museum Gallery Study: An Analysis of the Effectiveness of Select Galleries for
Families. Retrieved from Worcester Polytechnic Institute Electronic Projects
Collection: http://www.wpi.edu/Pubs/E-project/Available/E-project-042507-
070939/
Dean, D. (1994). Museum Exhibition: Theory and Practice. London: Routledge.
Dufresne-Tasse, C., & Lefebvre, A. (1994). The Museum in Adult Education: A
Psychological Study of Visitor Reactions. International Review of Education ,
496-484.
Edmonds, E., Muller, L., & & Connell, M. (2006). On Creative Engagement. Visual
Communication, 5, 307-322.
Falk, J., & Dierking, L. (2000). Learning from Museums: Visitor Experiences and the
Making of Meaning. Walnut Creek: AltaMira Press.
Funding Agreement Between the British Museum and the Department for Culture,
Media and Sport. (2005/06-2007/08). Retrieved November 6, 2007, from
http://www.culture.gov.uk/NR/rdonlyres/A3132C73-C233-477C-AF54-
FD99B8879780/0/fa_bm.pdf
Goddard, R. (2008, February 14). Interpretation Manager, The British Museum,
Interview. (S. Carlyle, G. Timothy, & A. Klebanov, Interviewers)

63
Goode, G. B. (1889). The Museums of the Future. The National Museum. Washington:
U. S. Government Printing Office.
Hein, G. E. (1998). Learning in the Museum. London: Routledge.
Hein, G. E. (2006). Museum Education. In S. MacDonald, A Companion to Museum
Studies (pp. 340-353). Manchester: Blackwell Publishing.
Hogle, J. G. (1996). Considering Games as Cognitive Tools: In search of Effective
Edutainment. Athens: University of Georgia Press.
Hooper-Greenhill, E. (1999). The Education Role of the Museum. London: Routledge.
Keene, S. (1998). Digital Collections: Museums and the Information Age. Oxford:
Butterworth & Heinemann.
Klein, H. J. (1993). Tracking Visitor Circulation in Museum Settings. Environment
and Behavior, 25 (6), 783-800.
McIntyre, A. (2008, February 13). Consultant, Morris Hargraves McIntyre, Interview.
(S. Carlyle, G. Timothy, & K. Anatoly, Interviewers)
Melton, A. (1935). Problems of Installation in Museums of Art. AAM New Series NO.
14 . Washington: American Association of Museums.
Morris Hargraves Mcintyre. (2007). Visitor Insight Monitor Year Two.
Okan, Z. (2003). Edutainment: Is Learning at Risk? British Journal of Education
Technology , 34 (3), 255-264.
Trustees of the British Museum. (2006/07-2007/08). British Museum Annual Reports
and Accounts. Retrieved November 6, 2007, from
http://www.britishmuseum.org/PDF/TAR06-07.pdf
Trustees of the British Museum. (n.d.). Museum Governances and Policies. Retrieved
November 6, 2007, from
http://www.britishmuseum.org/the_museum/about_us/management_and_gove
rnance/museum_governance.aspx

64
Appendix A: Interview Questions
Gallery: Number:
Hi my name is … and I‘m working on behalf of the British Museum. We are looking
to find out more about our visitors and what you think about the museum. May I have
a few minutes of your time for a brief interview?
(Thank you. Please do not feel pressured to answer in any particular way. We will not
be offended by any negative responses.)
1. Is this your first ever visit to the British Museum?
2. If not their first time: How long ago was your last visit?
12 months ago or less
Between one and two years ago
Between two and five years ago
More than five years ago
3. Including today, how many times have you visited in the past 12 months?
4. Including today, how many times have you visited in the past 3 months?
5. What was your reason for coming to the museum today?
To see a specific gallery or exhibit?
A general visit to the museum?
Attend a talk, tour, or special event?
To visit the shop?
To visit the café?
Meet friends
Other_______________
6. Are you here with your family?
7. How would you best describe your level of knowledge of the subjects
covered in this museum?

65
Specialist knowledge
General knowledge
Little to no knowledge
8. I’m going to list a few motivations for attending the British Museum,
please respond by saying yes if they apply to you, no if they do not. (Use
card for this question)
You have academic or professional interest in the subject.
You have personal interest in the subject.
You are looking for peaceful quiet contemplation.
To spend time with friends
To spend time with family
To improve your own knowledge.
To have an emotionally moving experience.
To get a better understanding of people and cultures.
To experience what the past was like.
To stimulate your own creativity.
9. Which of those would you say is your main motivation? (make note above)
I would now like to ask you some questions pertaining directly to this room
Exhibits
10. Did anything in particular catch your eye as you walked in to this room?
What was it? What attracted you to that object?
11. Did you have a favorite object in this room? What was it? Is there any
reason you favored this object?
12. What did you least like about this room? Is there any reason you did not
favor this?
Labels
13. Did you read the labels or panels in this gallery? (point to labels and
panels) If yes, move on to 5. If no, proceed to personal interview.
14. Were the labels easy to understand? If they were not, is there any reason?
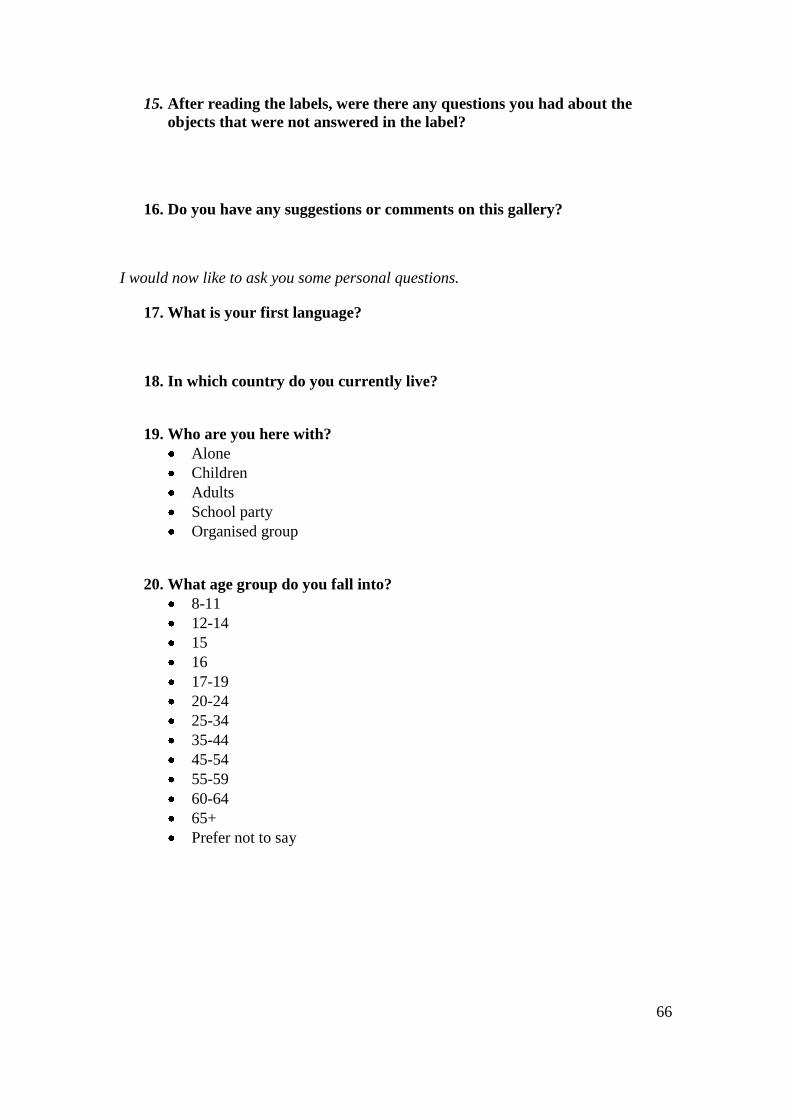
66
15. After reading the labels, were there any questions you had about the
objects that were not answered in the label?
16. Do you have any suggestions or comments on this gallery?
I would now like to ask you some personal questions.
17. What is your first language?
18. In which country do you currently live?
19. Who are you here with?
Alone
Children
Adults
School party
Organised group
20. What age group do you fall into?
8-11
12-14
15
16
17-19
20-24
25-34
35-44
45-54
55-59
60-64
65+
Prefer not to say

67
Appendix B: Gallery Maps
Room 26: North America
Date Number Gender Start Time Stop Time
P4 P1
16
14
15
13
11
12
9
10
1
2
3
4
5
6
7
8
20 17
ben
ch
21
22*
19 18
23* 24* West
East
P3
P2

68
Room 62: Egyptian Death and Afterlife
Date Number Gender Start Time Stop Time
P14
P15
P11
P12
P13
West
EXIT
CLOSED
29 28
27 26
23
19
17b* 17
20
22
21
21
25
24
18
East
To Room 63

69
Room 63: Egyptian Death and Afterlife
Date Number Gender Start Time Stop Time
P7
West
To Room 62 15
13
14
South
North
P6 P5
P4
11
P8
P9
16
1 2
P10
6
P2
3
12
4 5
8
9 10
7
P3
P1
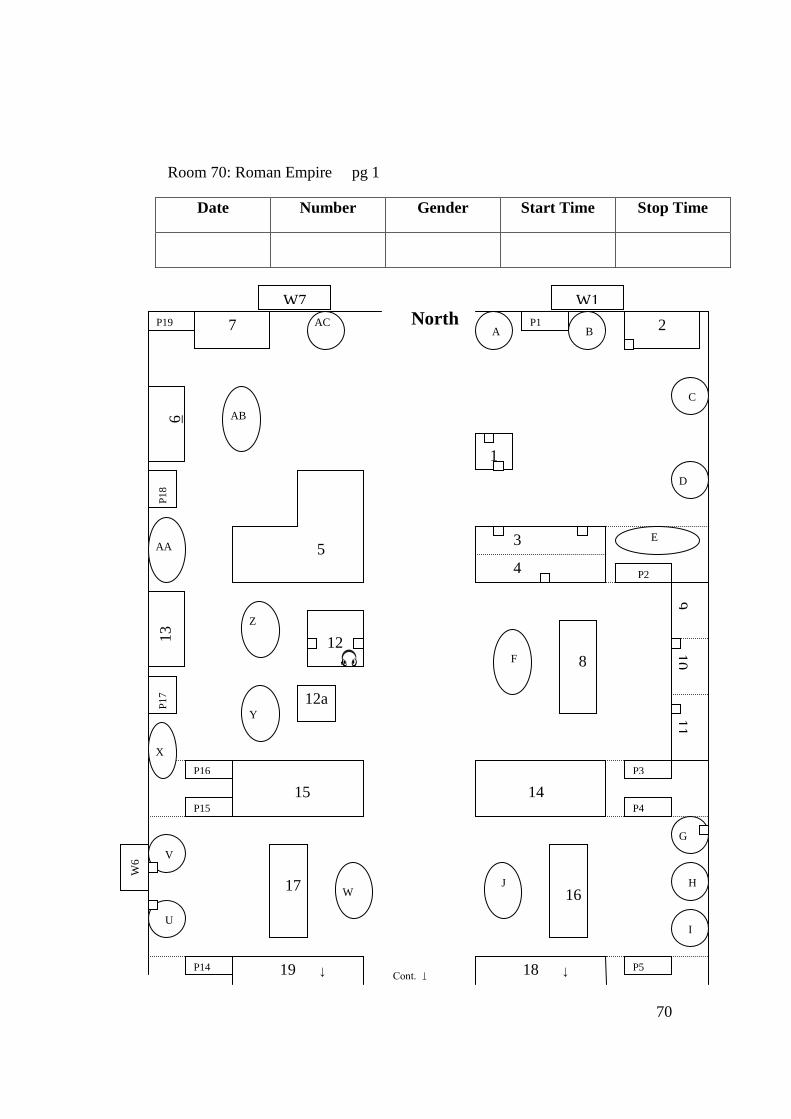
70
Room 70: Roman Empire pg 1
Date Number Gender Start Time Stop Time
2
1
P1
3
4 P2
Cont. ↓
9
10
11
14
8
18 ↓
16
7
5
P1
8
6
13
15
12
12a
P1
7
17
W6
19 ↓
P19
P4
P3
P5
P15
P16
P14
A
C
B
D
E
F
G
H
I
J
U
V
W
X
Y
Z
AA
AB
AC North
W1
W2
W7

71
Room 70: Roman Empire pg 2
Cont. ↑
South
19 ↑ 18 ↑
25
29
33
W5
34
28
27
26
30
21
22
23
P9
W4 W3
32 35
20
24
31
P13 P6
P1
2
P8
P7
P10
P11
K
L
M
N O
P
Q
R
S
T

72
Appendix C: Visitor Traffic Patterns
Room 26:
The North America
Date Number Gender Start Time Stop Time
P4 P1
16
14
15
13
11
12
9
10
1
2
3
4
5
6
7
8
20 17
ben
ch
21
22*
19 18
23* 24* West
East
P3
P2

73
Room 70:
Roman Empire pg 1
Date Number Gender Start Time Stop Time
2
1
P1
3
4 P2
Cont. ↓
9
10
11
14
8
18 ↓
16
7
5
P18
6
13
15
12
12a
P17
17
W6
19 ↓
P19
P4
P3
P5
P15
P16
P14
A
C
B
D
E
F
G
H
I
J
U
V
W
X
Y
Z
AA
AB
AC
North
W1
W2
W7
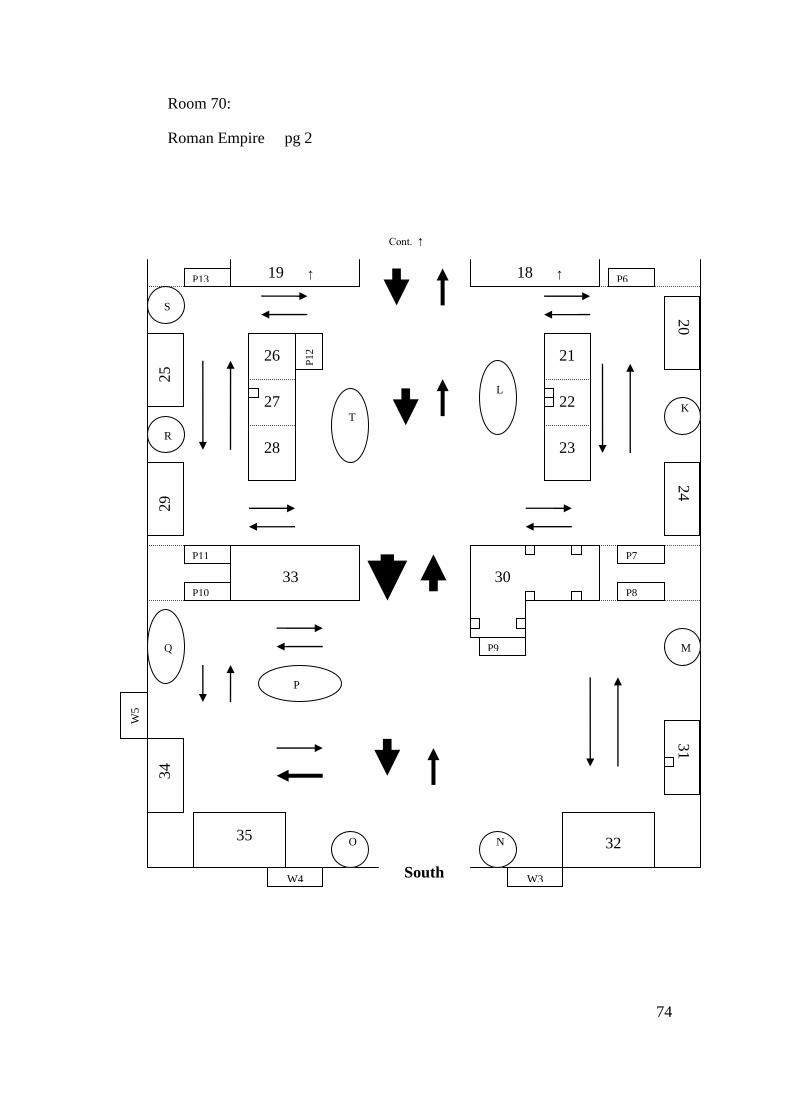
74
Room 70:
Roman Empire pg 2
Cont. ↑
South
19 ↑ 18 ↑
25
29
33
W5
34
28
27
26
30
21
22
23
P9
W4 W3
32 35
20
24
31
P13 P6
P1
2
P8
P7
P10
P11
K
L
M
N O
P
Q
R
S
T

75
Room 62:
Egyptian Death and Afterlife
Date Number Gender Start Time Stop Time
P1
4
P1
5
P1
1
P1
2
P1
3
West
EXIT CLOSED 29 28
27 26
23
19
17b* 17
20
22
21
21
25
24
18
East
To Room 63

76
Room 63:
Egyptian Death and Afterlife
Date Number Gender Start Time Stop Time
P7
15
13
14
So
uth
No
rth
P6 P5
P4
11
P8
P9
16
1 2
P1
0
6
P2
3
12
4 5
8
9 10
7
P3
P1
West
To Room 62

77
Appendix D: Quantitative Data
Data Analysis – North America, Room 26
Dwell Time
Average Dwell Time: 318 s (5.3 min)
Longest Dwell Time: 1413 s (23.55 min)
Shortest Dwell Time: 18 s
Average Exhibit Time: 16.4 s
Exhibit Popularity
Most Popular Exhibit: 14
Most Noticeable Exhibit: Clothing x7, totems x2
Most Photographed Exhibit: 5
Most Discussed Exhibit: 17
Labels
Percentage of People Reading Labels: 73.08 %
Visiting Patterns
Most Common ―Here With‖: Adults
Greatest Number of Visits in Past 12 Months: 20
Percentage of first time visitors 60.71 %
Demographics
Gender Breakdown: 56.9% Male / 43.1% Female
Most Common Age Range: 25-34
Least Common Age Range: 16
Most Common First Language: English
Most Common Country of Residence: England

78
Data Analysis – Roman Empire, Room 70
Dwell Time
Average Dwell Time: 229.3 s (3.82 min)
Longest Dwell Time: 1731 s (28.85 min)
Shortest Dwell Time: 23 s
Average Exhibit Time: 11.77 s
Exhibit Popularity
Most Popular Exhibit: 18
Most Noticeable Exhibit: 18
Most Photographed Exhibit: Busts x8, Bust of Augustus x3, Mosaics x2
Most Discussed Exhibit: 12
Labels
Percentage of People Reading Labels: 62.86 %
Visiting Patterns
Most Common ―Here With‖: Adults
Greatest Number of Visits in Past 12 Months: 6
Percentage of first time visitors 61.76 %
Demographics
Gender Breakdown: 63.3 % Male / 36.7 Female
Most Common Age Range: 25-35
Least Common Age Range: 15, 16, 65+
Most Common First Language: English
Most Common Country of Residence: England

79
Data Analysis – Egyptian Death and Afterlife, Rooms 62-63
Dwell Time
Average Dwell Time: 438 s (7.3 min)
Longest Dwell Time: 1530 s (25.5 min)
Shortest Dwell Time: 48 s
Average Exhibit Time: 15.34 s
Exhibit Popularity
Most Popular Exhibit: 3
Most Noticeable Exhibit: #9 x2, Mummies x7, Sarcophagi x5, #3 x3
Most Photographed Exhibit: 9
Most Discussed Exhibit: 7
Labels
Percentage of People Reading Labels: 70.0 %
Visiting Patterns
Most Common ―Here With‖: Adults
Greatest Number of Visits in Past 12 Months: 3-4
Percentage of first time visitors 76.67 %
Demographics
Gender Breakdown: 45.6 % Male / 54.4 % Female
Most Common Age Range: 25-34
Least Common Age Range: 15, 65+
Most Common First Language: English
Most Common Country of Residence: USA

British Museum
Intern Guidebook
Methodology for Evaluating a Gallery
WPI Student Research Team
Winter 2008

1
Table of Contents
WHAT IS INCLUDED IN THIS REPORT? ....................................................................................... 2
EVALUATING A GALLERY .............................................................................................................. 3
OBJECTIVES .......................................................................................................................................... 3
GETTING STARTED............................................................................................................................ 5
CREATING MAPS ................................................................................................................................... 6
THE QUESTIONNAIRE ............................................................................................................................ 6
THE EVALUATION PROCESS .......................................................................................................... 8
OBSERVING THE VISITOR ...................................................................................................................... 8
Tips for Observing Visitors .............................................................................................................. 9
INTERVIEWING THE VISITOR ............................................................................................................... 10
Tips for Interviewing Visitors ........................................................................................................ 10
THE DATA ........................................................................................................................................... 11
BASIC FUNCTIONS OF EXCEL .............................................................................................................. 11
Charts ............................................................................................................................................ 13
Histograms ..................................................................................................................................... 15
ENTERING THE DATA .......................................................................................................................... 19
Walkthroughs and Refusals ........................................................................................................... 20
ANALYZING THE DATA ....................................................................................................................... 21
Determining Audience Segments ................................................................................................... 21
Dwell Time ..................................................................................................................................... 23
Exhibit Popularity .......................................................................................................................... 24
Labels............................................................................................................................................. 26
Visiting Patterns ............................................................................................................................ 26
Demographics ................................................................................................................................ 28
Segments ........................................................................................................................................ 30
Walkthroughs and Refusals ........................................................................................................... 30
MAKING CHARTS ............................................................................................................................. 31
MAPS ..................................................................................................................................................... 31

2
What is included in this report?
The British Museum Interpretation Unit receives help from a number of student
interns each year. These interns are set upon a variety of tasks, including the
evaluation of galleries. Renovated galleries and those on the verge of being renovated
are commonly evaluated. In order to properly compare evaluations, it is important that
a consistent method of evaluation is used every time.
The following report is a set of guidelines for evaluating galleries in the British
Museum compiled particularly for interns of the Interpretation Unit. The report
includes tracking maps for determining dwell time, exhibit viewing time, and visitor
paths. It also includes a questionnaire to determine the audience segment of the
tracked visitor, as well as specific likes and dislikes about a particular gallery. The
questionnaire also contains questions the British Museum asks every year regarding
general demographic information.
By using the information presented in this report, interns can become acquainted with
visitor studies and gallery evaluation. They are, however, encouraged to review
previous studies, many of which can be provided by the Interpretation Unit. The
findings on the enclosed CD are also helpful to review in order to see how the
methodologies discussed in this document were put into practice.

3
Evaluating a Gallery
In order to properly evaluate a gallery, you should follow these recommended
procedures. A checklist of objectives follows, which will aid in determining whether
the evaluation process is successful. The ―Getting Started‖ section explains the
fundamentals of an efficient evaluation strategy. The sections that follow outline the
processes of creating maps and interviews, tracking, and interviewing the visitors.
Finally, a data collection section is included to explain how to enter all gathered data
for the museum‘s future reference.
Objectives
The objectives of the process of tracking and interviewing are:
Determine the median dwell time of the gallery – The dwell time of a
visitor is the total amount of time (in seconds) the visitor spends in the gallery.
The median dwell time of a gallery is the dwell time value that falls in the
middle of the collected data when all the individual dwell times are listed in
order (i.e., shortest to longest). Median is used rather than mean because it
allows for a more accurate representation of typical visitor dwell time. For
example, the median of the following times is 94.
79, 88, 88, 88, 94, 98, 101, 103, 104
Determine the most popular exhibit in the gallery – The most popular
exhibit in a gallery is determined by the amount of time the visitors spent at
the exhibits. The exhibit with the longest viewing time is recorded in the data
collection stage for each map. The exhibit which appears most often, the
mode, in the column entitled ―Longest Exhibit Time (seconds)/Exhibit Name‖
is the most popular.
4
Determine the most popular gateway exhibit – The gateway exhibit is the
exhibit the visitor views first upon entering the gallery. The exhibit which
appears most often, the mode, in the column entitled ―Attracting Object‖ is the
most popular.
Determine the visitor orientation – Visitor orientation is the general path the
visitor takes through the gallery denoted on gallery maps by lines and arrows.
Orientation also refers to the direction the visitor travels when first entering
the gallery, the exhibits the visitor views, the places the visitor stops (or sits
down), and the amount of time spent doing each of the actions performed.
Determine most traveled paths in the gallery – This is similar to
determining visitor orientation. The most traveled paths are determined using
maps and counting the number of times a visitor took a certain path as
opposed to another. For instance, if the visitor decided to turn left instead of
going straight or turning right, this action becomes part of a path. Examples of
such marked-up maps are found at the end of this document.
Determine audience segments – Audience segments are various types of
visitors determined by visiting frequency, motivations for coming to the
museum, and levels of knowledge. For instance, a self-developer is a visitor
with general interest in the subjects covered in the museum and a sightseer is
simply a visitor who has come because the museum is on their ―list of things
to do.‖ For a full list of segments, see the ―Questionnaire‖ section below.
Determine correlations between segments and data – The correlations
between the audience segments and the rest of the data are patterns which can
be drawn from visitor behavior and their segment. For example, if the most
5
popular gateway exhibit for families is in case nine or the most traveled path is
around the room in a clockwise direction, these are correlations.
Getting Started
The first step in evaluating a gallery is to become familiar with its layout and the
location of all exhibits. It is worthwhile to take some time to do this since it will be
easier to determine the best place to stand or walk when observing visitors. By
knowing the location of the greatest visitor traffic, you will have an easier time
navigating through the gallery. Also, spending a few hours simply observing people
in the gallery could be useful. By noting certain patterns in their behavior, you may
be able to draw more conclusions and gather more valuable qualitative data.
You may also want to read this entire document, as well as the study conducted by the
WPI team, prior to beginning your evaluations. These reports contain information
that will be useful in conducting your study, analyzing data, and creating a report.
Keep in mind, however, that the suggestions and data in these reports are not final.
You are encouraged to make your own conclusions, observations, and suggestions
regarding this study.
Once you are familiar with the galleries and reports, it is time to create maps similar
to those at the end of this report. If the WPI team or any other interns have already
evaluated any gallery being studied, you can reuse those maps. Use the map legend at
the end of this report in order to maintain consistency. Mark all exhibits, labels,
panels, exits, and other objects (i.e. a bench) on the map. Record the dwell times,
exhibit viewing times, and the paths of the visitors on this map of the gallery.
Example maps are found at the end of this guidebook. The purpose of the map is to
display the path of the visitor and record exhibit times. It also allows for determining
visitor orientation.

6
Creating Maps
The symbols used to represent objects on the maps are shown on the map legend.
Most of the exhibits that are in glass cases are numbered by the curators. The
numbers are usually found on the corners of the glass. There may be some cases that
do not have assigned numbers; the WPI team numbered any cases without numbers
assigned by the museum consecutively, beginning after the last assigned number.
These numbers have asterisks next to them on the maps to indicate they were not
assigned by the museum. If there are a large number of uncased exhibits, they are
represented with letters rather than numbers. You are advised to number exhibits in
this manner as well.
Some galleries have exhibits hanging on the walls; these are represented as W1, W2,
etc. Their placement on the map is outside the borders to allow space for the exhibits
beneath them to be shown. An example of this is seen in the map of room 70, Roman
Empire, found at the end of this guidebook. Panels are shown with small rectangles
and represented with P1, P2, etc. The panels located inside of the cases are drawn as
small squares inside the case. Remember to mark any benches, chairs or other objects
on the map, since the visitor may interact with these objects as well as the exhibits.
The Questionnaire
You should use the questionnaire included in this report for consistency from year to
year. The questionnaire contains questions asked in the MHM survey, demographic
information that the museum collects each year, and open-ended questions pertaining
to the gallery. The main purpose of the questionnaire is to determine the audience
segments of the visitors. This questionnaire works well in determining the audience
segments because of the specific questions asked, and the answers that are provided.
The segments in the following list are the same as the ones MHM uses, and should be
used to allow for comparison.

7
Family – Mixed age groups, wanting fun and educational trip for children.
Defined as any group with adults (aged 16+) and children (aged 15 or under)
in it
Aficionado – Specialist who wants to commune with objects in the collection,
and use existing knowledge as a base to go deeper
Sensualist – Non-specialist or specialist wanting a deeply moving experience
through engagement with the collections
Expert – Specialist wanting to deepen knowledge further by engaging deeply
with the collection
Self Developer – Non-specialist wanting to informally improve general
knowledge about subjects covered in the Museum
Repeat Social Visitor – Repeat visitor meeting up with others at the Museum.
Uses the Museum as a social space and wants to feel a sense of ownership in
surroundings
Sightseer – First-time visitor making a general visit. Mainly these are tourists
who want to ‗do‘ the Museum.
For instructions on how to place visitors in these segments, see the data analysis
section of this report.

8
The other questions are used to determine the effectiveness of labels, likes and
dislikes of the visitor, and demographics. Once all data is collected, you should enter
it into Excel for analysis.
The Evaluation Process
Before heading to the gallery for observation, be sure to have everything you need.
Bring the following items with you:
Clipboard
Enough maps for your session
Enough questionnaires for your session
Pen
Stopwatch
In order to randomize the process of tracking, choose an entrance at the beginning of
each tracking session and count off three visitors, tracking the third. After you have
finished tracking and interviewing a visitor, watch a different entrance and repeat the
process.
Observing the Visitor
When the visitor enters and exits the gallery, record the exact time, including seconds
on the map. The map contains spaces for recording the date, the visitor number, and
the visitor‘s gender. The visitor number for each gallery is recorded as the observer‘s
initial and consecutive numbers. For example, Adam would write A1, A2, A3, etc.
for each visitor he observed, and Ben would write B1, B2, B3, etc. for the visitors he
observed. This allows more than one person to be observing in the gallery at once
without confusing the numbers. When an observer returns to a gallery, the first visitor
number is the one where they last left off. Ultimately, this allows the total number of
visitors to be determined in the end.
On the map, record the path the visitor takes through the gallery with a line and
arrows indicating the direction the visitor is traveling. Each time the visitor stops,

9
mark an X on the map as well as the number of seconds the visitor is stopped. The
stopwatch can be used to record the seconds. If a visitor does not stop while looking
at an exhibit, this is determined to be a glance, marked with a G, and is later recorded
as one second. If a visitor walks straight through the gallery without stopping or
looking at anything, mark ―walkthrough‖ on the map and do not interview the visitor.
It is important to still record walkthroughs to obtain a walkthrough rate for the gallery.
Special codes are marked on the map to indicate various things a visitor may do while
in the gallery:
D - The visitor engaged in discussion with someone while viewing an exhibit
P - The visitor took a photograph of an exhibit.
A - The visitor listened to an audio tour while viewing an exhibit.
These are later used to determine such statistics as the most discussed and most
photographed exhibits.
Tips for Observing Visitors
Observe visitors through the glass cases or in reflections if possible. This may
be difficult in some crowded galleries, such as the Egyptian Death and
Afterlife gallery observed by the WPI team.
Make yourself as inconspicuous as possible.
Do not sit down on the benches or the chairs. This creates a variable, since the
visitor you are observing may have sat down if you had not been there.
Try not to block the exhibits from the visitor‘s view. This throws off the
exhibit viewing time.

10
Try to anticipate which door the visitor will use to exit the gallery. This will
make it easier to catch them and ask them for an interview. It is still not a
problem if you catch them even halfway through the next gallery.
Interviewing the Visitor
Approach the visitor as he or she exits the gallery, introducing yourself and the
questionnaire; use the prompt on the top of the first page of the questionnaire as a
guideline. There will be visitors who refuse to participate in the interview; just mark
―refusal‖ on the map and move on to the next visitor. The information collected from
the maps of refusals is still useful because it adds to your dwell time and most
common paths data. Just because a visitor did not speak English or refused to
interview, does not mean the rest of their data should be disregarded. Before you start
the interview, remember to write down the time. It is important that the dwell time
recorded does not include the time spent interviewing the visitor. Also, make sure the
visitor number on the map matches the one on the interview. When interviewing a
visitor, try to speak audibly, clearly, and slowly; many foreign visitors have trouble
understanding English. For some, this will be the difference between an accurate
answer and a misunderstanding. When the interview is complete, thank the visitor for
his or her time and prepare for the next observation.
Tips for Interviewing Visitors
When asking questions pertaining to the gallery, do not use the words
―gallery‖ and ―exhibit‖. Instead of ―gallery‖, say ―room‖, and instead of
―exhibit‖, say object. Some people confuse the word ―gallery‖ with the entire
museum and ―exhibit‖ with the entire gallery, and this will ensure there is no
misunderstanding.
In the case of foreign visitors (though others may prefer this as well), do not
hesitate to allow them to read the question as you read it aloud to them. For
some, this will be the difference between an accurate answer and a
misunderstanding.

11
Reword the question if the interviewee does not understand what it means. Do
not feel pressured to strictly follow the interview at the end of this document.
The Data
After observing and interviewing the visitors, the data collected is entered into a
database, where it is stored until all data collection is complete. At this point, you
will analyze the data and draw conclusions. In order to store data in an organized
fashion and to analyze it easily, it is recommended that you use a spreadsheet. Excel
is a spreadsheet program that can be used to make calculations or charts from
numerical data. Excel is easy to use and allows the data to be kept organized. The
―Data Template‖ Excel file on the enclosed CD is an example of such a spreadsheet,
which you can use for entering the data collected in these visitor studies.
Basic Functions of Excel
In order analyze the data, use the built-in functions of Excel. The basic functions are:
Average – Finds the average value of the entered numbers or selected cells
Count – Counts the number of cells with numerical values
Maximum – Finds the largest value in the list of numbers or selected cells
Median – Finds the median value of the entered numbers or selected cells
Minimum – Finds the smallest value in the list of numbers of selected cells
Sort – Sorts the values from largest to smallest, smallest to largest, or
alphabetically
Sum – Finds the sum of the entered numbers or selected cells.
To find the average of a set of values:
1. Select a blank cell.
2. Type =average( followed by the numbers you wish to average.
3. Press enter. The average of the values appears in the cell.

12
To find the median of a set of values:
4. Select a blank cell.
5. Type =median( followed by the numbers you wish to find the median of.
6. Press enter. The median of the values appears in the cell.
To take the sum of the data:
1. Select a blank cell.
2. Type =sum( followed by the numbers you wish to add.
3. Press enter. The sum of the values appears in the cell.
To find the largest or smallest value of the data:
1. Select a blank cell.
2. Type =max( or =min(.
3. Select the cells you wish to analyze.
4. Press enter. The largest or the smallest value appears in the cell.
To sort the values from smallest to largest, largest to smallest, or alphabetically:
1. Select the cells you wish to sort.
2. To sort from smallest to largest or alphabetically from ‗a‘ to ‗z‘, click the sort
button (located in the toolbar) shown here.
3. To sort from largest to smallest or alphabetically from ‗z‘ to ‗a‘, click the sort
button (located in the toolbar) shown here.
To count the number of cells containing numerical values:
1. Select a blank cell.
2. Type =count( .
3. Select the cells you wish to analyze.
4. Press enter. The number of cells with numerical values is calculated.
Note: When using the basic functions, typing in the numbers can always be substituted
by selecting the cells in which they are contained. For instance, to determine the sum
of a set of numbers, you can type =sum( and then select the cells you wish to add.

13
Charts
To create a chart:
1. Highlight the data you wish to include in your chart.
2. Press the button shown here, located in the toolbar.
3. Select the type of chart you wish to create.
4. Press Next.
5. Enter the Chart Title and Axis Titles
6. Press Next.
7. Choose where the chart will appear, in a new sheet, or as an object in the
current sheet.
8. Press Finish.

14
When making a pie chart, or a bar graph, the data has to be in the format similar to
this:
Language
Dutch 2
English 18
French 1
German 1
Greek 2
Italian 1
Norwegian 1
Persian 1
Portuguese 2
Russian 2
Spanish 4
The first column is the category; the second is the number of visitors that fall in that
category.
Note: The colors of the sections in each pie chart may not correspond to the same
language or country. For instance, in one chart USA may be one color and in
another it is different. This is due to the fact that you may have different countries or
different quantities of countries in your data. Fixing this issue in Excel is a long,
tedious, and unnecessary process and will not be explained in this report. Interns
are advised to use other software, if available, to make the pie charts.

15
Histograms
A Histogram is a graph of frequency distribution. The distribution is displayed as
bars whose widths represent intervals into which the data is divided and whose
heights represent the frequencies of those intervals. The intervals are called bins. The
bin range as well as the interval depends on the data range. If your data ranges from 0
to 100, a good interval to use is 10. Your bin range would be:
10
20
30
40
50
60
70
80
90
100
1. Select an appropriate interval.
2. Enter the bin range (as seen above) into a blank column in Excel.
3. Under the Tools menu, select Data Analysis.

16
a. If Data Analysis is not present, you will need to install it. To do so:
Select Add-Ins.
b. Check the box next to Analysis ToolPak and Analysis ToolPak –
VBA

17
c. Press OK
4. Select Histogram and press OK.
5. Input Range is the data being analyzed. Press the button next to the Input
Range box.
6. Highlight the data you wish to analyze.
7. Press the button shown here to return to the previous menu.
8. Press the Button next to the Bin Range box.
9. Highlight the Bin Range column you created in step 2.
10. Press the button shown here to return to the previous menu.
11. Select Output Range to select where the histogram will appear in your
spreadsheet.

18
12. Press the Button next to the Bin Range box.
13. Select a blank cell where you wish the histogram to be placed.
14. Press the button shown here to return to the previous menu.
15. Check the box next to Chart Output to produce a chart
16. Press OK
17. You should see something similar to this:

19
Bin 10 contains data between 0 and 10, and so on. ―More‖ contains any data that is
greater than your highest bin.
Entering the Data
Using the data template on the attached CD, enter the data you have collected. The
following guidelines will help you organize your data into a simple format that will be
easy to view and analyze. To enter the data:
1. Open the Data Template Excel file located on the accompanying CD.
2. Save the file as “Gallery Name” Data.
3. Enter the date, visitor number, and gender from the top of the map into the
first three columns.
Note: The next set of columns in the template is in the order of the interview questions
allowing easy input of data.
4. In the next several columns, enter the answers to the interview questions.
The answers to the Motivation question are categorized as Intellectual (I), Emotional
(E), and Social (S). The following list shows which categories the answers fall under:
You have academic or professional interest in the subject (I).
You have personal interest in the subject (I).
You are looking for peaceful quiet contemplation (E).
To spend time with friends (S).
To spend time with family (S).
To improve your own knowledge (I).
To have an emotionally moving experience (E).
To get a better understanding of people and cultures (I).
To experience what the past was like (I).
To stimulate your own creativity (E).
When entering the motivation data, count the number of I‘s, E‘s, and S‘s to which the
visitor answered ―yes‖ and enter each as that number over the total. For example, if
the visitor answered ―yes‖ to the first, third, fourth, and ninth question, enter this as
(2/5, 1/3, 1/2).

20
There is a ―notes‖ column for any extra information about the visitor. The last
column in this set is for the visitor segment. This column may be left blank until the
segment is determined.
5. Enter the total time spent in the gallery in seconds under the dwell time
column.
6. Determine the exhibit at which the visitor spent the most time. Enter the time
and exhibit name into the next column.
7. Calculate the average of the time spent at all exhibits in the gallery, counting
glances as one second. Enter this value into the next column. If the average is
a long decimal, format the cell to only show two decimal places. (right click
on the cell, select format cells, and select the number option)
8. Count the number of exhibits at which the visitor stopped. Enter this value
into the next column.
9. The ―other‖ column is for discussion, audio tours, and photographs. For
instance, if a visitor took a photograph of Exhibit 11, enter this as P11. If the
visitor engaged in discussion at Exhibit 12, enter this as D12. If the visitor
listened to an audio guide at Exhibit 7, enter this as A7. A sample entry looks
like this: D5, D10, P7, P13, A1, D2.
Walkthroughs and Refusals
Enter the data for ―walkthroughs‖ and ―refusals‖ differently than with all other
visitors. If a visitor is a ―walkthrough‖ or a ―refusal‖, you will want to make the
entire row containing their data black or gray. This will help you when you are
analyzing the ratio of walkthroughs and refusals to all other visitors.
To enter walkthrough data:
1. Select the entire row of cells.
2. Click the arrow in the button shown (located on the toolbar) and select the
black color. The row turns black.

21
3. Click the arrow in the button shown (located on the toolbar) and select the
white color. The text turns white.
4. Only enter data in the first three columns (date, visitor number, and gender).
To enter refusal data:
1. Select the entire row of cells.
2. Click the arrow in the button shown (located on the toolbar) and select the
gray color. The row turns gray.
3. Enter “Refusal” into all interview answers.
4. Enter the following data: dwell time, longest exhibit time, average exhibit
time, and number of exhibits stopped at into the proper columns.
Analyzing the Data
Determining Audience Segments
The first step in data analysis is to determine the visitors‘ segments. The different
segments are: Family, Aficionado, Sensualist, Expert, Self Developer, Sightseer and
Repeat Social Visitor (Third Spacer). This is done by reviewing the following items
and then following the flow chart below:
Answers to the “Family” interview question – Used to determine whether
the visitor could potentially fall under the family segment.
Visiting frequency – Used to determine whether the visitor could potentially
fall under the sightseer or repeat social visitor segment.
Visitor motivation for coming to the museum –This is called the IES of the
visitor. Determine which letter, I, E, or S, has the greatest value and this
becomes their motivation (Intellectual, Emotional, or Social). Also take into
account the main motivation behind the visit. Used for all segments except
for family.

22
Level of knowledge of subjects in museum – Used to determine whether the
visitor could potentially fall under aficionado, sensualist, expert, or self
developer.
General Notes on Segments
Self Developers and Experts have an intellectually based motivation for visiting the
museum. The difference between them is the level of knowledge of the visitor. If the
visitor has extensive or expert knowledge, the visitor would be an Expert. If the
visitor just had general, little or no knowledge, the visitor would be a Self Developer.
Aficionados and Sensualists have an emotionally based motivation for visiting the
museum. The difference between the two is also based on the visitor‘s level of
knowledge. An Aficionado is an expert with an emotional motivation, therefore
visitors with extensive or expert knowledge are Aficionados and visitors with general,
little, or no knowledge are sensualists.
Sightseers and Repeat Social Visitors have a socially based motivation for visiting the
museum. Visitors are also categorized into these segments when they do not fit into
any other segments. The difference between them is determined by the visiting habits
of the person. If it is the visitor‘s first time visiting the British Museum, he or she is a
Sightseer. If the visitor has been to the British Museum more than once, he or she is a
repeat social visitor.
Once all of the visitor segments are determined the data can be analyzed. The data
are placed in the following categories: dwell time, exhibit popularity, labels, visiting
patterns, demographics, segments, and walkthroughs and refusals.

23
Dwell Time
You will need to determine the following dwell times and enter them into your
spreadsheet. This will aid in determining segment correlations and will help the
Interpretation Unit with gallery evaluation.
Median dwell time
To determine the median dwell time:
1. Select the cells containing the dwell times.
2. Sort the dwell times (either from largest to smallest or smallest to largest).
3. In a blank cell in the same column, take the median of the values.
Family Visitor?
Yes
Aficionado
No
Motivation?
Emotional Intellectual Social
Specialist? Specialist? Frequency?
Yes No Yes No Been
before
First
Time
Sensualist Expert Self
Developer
Repeat
Social
Sightseer Family
Segment Flow Chart (Taken from “Visitor Insight Monitor – Year Two” by MHM)

24
Longest dwell time
To determine the longest dwell time:
1. Select the cells containing the dwell times.
2. In a blank cell in the same column, calculate the maximum of the values.
Shortest dwell time
To determine the shortest dwell time:
1. Select the cells containing the dwell times.
2. In a blank cell in the same column, calculate the minimum of the values.
Average exhibit time
To determine average exhibit time:
1. Select the cells containing the exhibit times.
2. In a blank cell in the same column, calculate the average of the values.
Note: Do not include walkthroughs in the median, average, and shortest dwell time,
but do include refusals.
Exhibit Popularity
You will need to also determine certain factors which influence exhibit popularity.
The following factors as well as the rest of the data will aid in determining the
segment correlations.
Most popular exhibit
To determine the most popular exhibit:
1. Copy the exhibit names in the column labeled ―Longest Exhibit Time
(seconds)/Exhibit Name” into a blank column.
2. Sort the values in the newly created column of exhibit names.
3. Locate the most commonly occurring exhibit name.

25
Most noticeable exhibit
The most noticeable exhibit is determined by the visitors‘ answers to the question:
Did anything in particular catch your eye as you walked in to this room?
To determine the most noticeable exhibit:
1. Copy the answers in the column labeled ―Attracting Object‖ into a blank
column
2. If several answers are different but are referring to the same object, give them
one common name. ―Coffin‖ and ―sarcophagus‖ would be examples of
answers that mean the same thing.
3. Sort the values in this new column.
4. Locate the most commonly occurring answer.
Most photographed exhibit
To determine the most photographed exhibit:
1. Copy the data in the column labeled ―Other‖ into a blank column.
2. Delete anything that is not labeled with a P to obtain all ―photographed‖ data.
3. Sort the values in this newly created column of photographed exhibits.
4. Locate the most common exhibit number.
Most discussed exhibit
To determine the most discussed exhibit:
1. Copy the data in the column labeled ―Other‖ into a blank column.
2. Delete anything that is not labeled with a D to obtain all ―discussed‖ data.
3. Sort the values in this newly created column of discussed exhibits.

26
4. Locate the most common exhibit number.
Labels
It is useful for the museum to know the effectiveness of the labels in the gallery. This
is determined by asking the visitor whether they read the panels or labels and if they
were easy to understand. You should calculate the percentage of visitors reading the
panels or labels.
To determine the percentage of people reading labels:
1. Copy the data in the column labeled ―Panels Read? (Y/N)‖ into a blank
column.
2. Sort the new column alphabetically.
3. Count the number of Y’s and the number of N’s (do not count refusals).
4. In a blank cell, divide the number of Y‘s by the total (Y+N).
The result will be a decimal. To show the result as a percentage:
1. Right click on the cell.
2. Select Format Cells.
3. Select the Percentage option.
4. Press Enter.
Visiting Patterns
You will need to analyze the various visiting patterns in order to be able to make
correlations between the different segments and their visiting behavior. This data will
help the museum to determine what they can do to improve their galleries to make
them better suited for one or more of these segments.
Most common visitor companion
To determine the most common visitor companion:
1. Select the cells under the “Here With” column.
27
2. Sort these cells alphabetically for easier viewing.
3. Find the most commonly appearing companion(s).
Greatest number of visits within the past 12 months
To determine the greatest number of visits within the past 12 months:
1. Select the cells under the “How many visits in past 12 months?” column.
2. In a blank cell in the same column, calculate the maximum of these values.
Percentage of first time visitors
To determine the percentage of first time visitors:
1. Copy the data in the column labeled ―First ever visit? (Y/N)‖ into a blank
column.
2. Sort the new column alphabetically.
3. Count the number of Y’s and the number of N’s (do not count refusals).
4. In a blank cell, divide the number of Y‘s by the total (Y+N).
The result will be a decimal. To show the result as a percentage:
1. Right click on the cell.
2. Select Format Cells.
3. Select the Percentage option.
4. Press Enter.
Most common paths through galleries
Use the maps as shown in the Maps section at the end of this report to analyze the
most common paths through the galleries. In the end, the thicker the arrows on the
maps, the more visitors took that path. In order to do so:
1. Print out one a blank copy of each map and take out all of your marked-up
maps except for the walkthroughs.

28
2. On the blank copies, draw two arrows in both directions at every location on
the map that is between exhibits (use the map at the end of this document as a
guideline). Also draw arrows in both directions at each of the exits.
3. Examine each marked-up map of a single gallery and mark a tick next to the
corresponding arrow every time the visitor walks in the corresponding
direction.
4. After you are finished with one map, total all of the ticks and write the total
next to each of the arrows. Repeat this process for the rest of the gallery maps.
5. When you are finished, open one of the maps in Word.
6. Use the chart below to determine the thickness of the arrows you need to draw.
To draw the arrows:
a. Click the arrow button on the toolbar below (shown here).
b. Draw the arrow in the desired location.
c. Make sure the arrow is selected. Change the thickness of the arrow
using the line thickness button on the toolbar below (shown here).
Note: The options under the line thickness button will be unavailable if the
arrow is not selected.
Number of Visitors Thickness
0-10 1 pt
11-20 3 pt
21-30 6.5 pt
31-40 10 pt
Demographics
From the answers visitors provide to the last several interview questions, you will
need to determine the following demographic information. The Interpretation Unit
requires these demographics as part of every study they conduct. Also, knowing these
demographics can help to determine how they relate to the segments you are going to
find.

29
Gender breakdown
To determine the percentage of males versus females:
1. Copy the data in the column labeled ―Gender‖ into a blank column.
2. Sort the new column alphabetically.
3. Count the number of M’s and the number of F’s (do not count refusals).
4. In one blank cell, divide the number of M‘s by the total (number of M‘s +
number of F‘s).
5. In another blank cell, divide the number of F‘s by the total (number of M‘s +
number of F‘s).
The results will be decimals. To show these results as percentages:
1. Right click on each of the cells.
2. Select Format Cells.
3. Select the Percentage option.
4. Press Enter.
Most common age group
1. Select the cells under the “Age Group” column.
2. Sort these cells for easier viewing.
3. Locate the most commonly appearing age group.
Least common age group
1. Select the cells under the “Age Group” column.
2. Sort these cells for easier viewing.
3. Locate the least commonly appearing age group.

30
Most common first language
1. Select the cells under the “First Language” column.
2. Sort these cells for easier viewing.
3. Locate the most commonly appearing first language.
Most common country of residence
1. Select the cells under the “Country of Residence” column.
2. Sort these cells for easier viewing.
3. Locate the most commonly appearing country of residence.
Segments
The percentage of each segment should be calculated for the gallery. This can be
done by creating a table with the numbers of each segment, then calculating the
percent.
Walkthroughs and Refusals
The walkthrough rate and refusal rate should be calculated for the gallery. This is
done by counting the number of walkthroughs, number of refusals and the number of
interviews. The walkthrough and refusal rate are the percentage of walkthroughs and
refusals.

31
Making Charts
Refer to the Basic Functions section for how to make a pie chart. A pie chart should
be made for each of the following:
Segment Breakdown
Age Group Breakdown
First Language Breakdown
Country of Residence Breakdown
Visitor Companion Breakdown
A histogram should also be made for the dwell times.

32
Maps
Room 26:
North America
Date Number Gender Start Time Stop Time
P4 P1
16
14
15
13
11
12
9
10
1
2
3
4
5
6
7
8
20 17
ben
ch
21
22*
19 18
23* 24* West
East
P3
P2
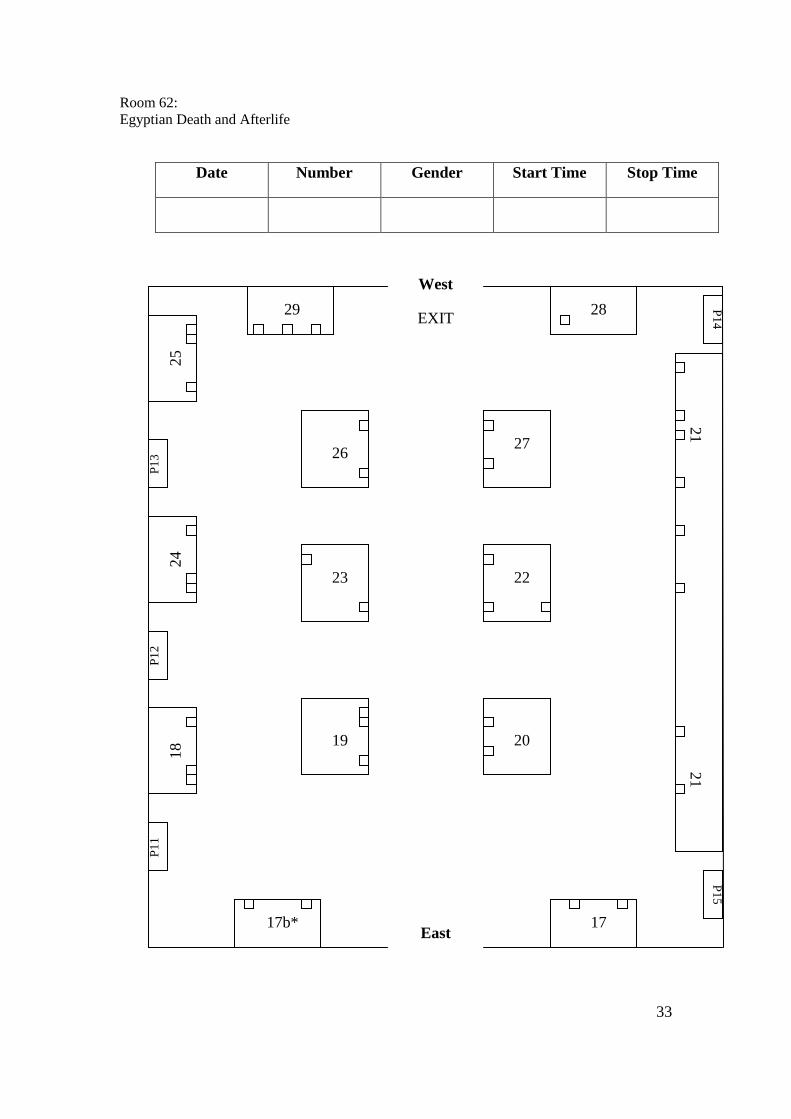
33
Room 62:
Egyptian Death and Afterlife
Date Number Gender Start Time Stop Time
P1
4
P1
5
P1
1
P1
2
P1
3
West
EXIT
CLOSED
29 28
27 26
23
19
17b* 17
20
22
21
21
25
24
18
East
To Room 63

34
Room 63:
Egyptian Death and Afterlife
Date Number Gender Start Time Stop Time
P7
West
To Room 62 15
13
14
South
North
P6 P5
P4
11
P8
P
9
16
1 2
P1
0
6
P2
3
12
4 5
8
9 10
7
P3
P
1
East
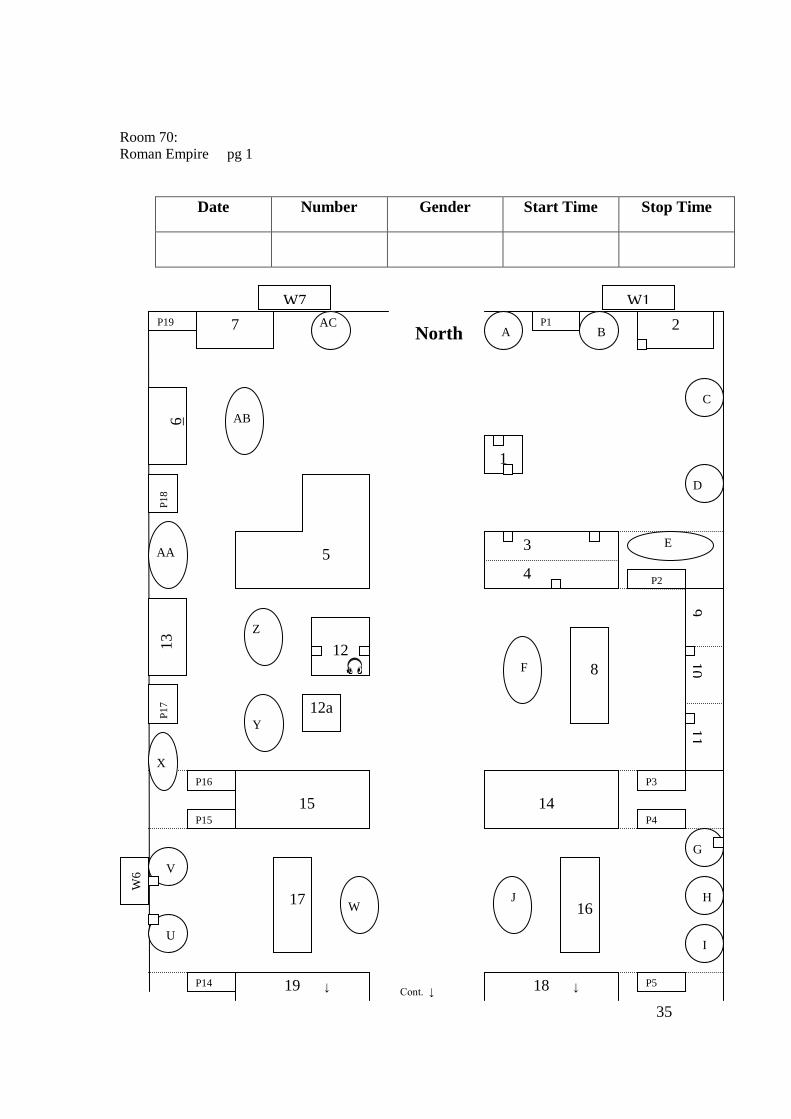
35
Room 70:
Roman Empire pg 1
Date Number Gender Start Time Stop Time
2
1
P1
3
4 P2
Cont. ↓
9
10
11
14
8
18 ↓
16
7
5
P1
8
6
13
15
12
12a
P1
7
17
W6
19 ↓
P19
P4
P3
P5
P15
P16
P14
A
C
B
D
E
F
G
H
I
J
U
V
W
X
Y
Z
AA
AB
AC North
W1
W2
W7

36
Room 70:
Roman Empire pg 2
Cont. ↑
South
19 ↑ 18 ↑
25
29
33
W5
34
28
27
26
30
21
22
23
P9
W4 W3
32 35
20
24
31
P13 P6
P1
2
P8
P7
P10
P11
K
L
M
N O
P
Q
R
S
T

37

38
Room 26:
North America
P4 P1
16
14
15
13
11
12
9
10
1
2
3
4
5
6
7
8
20 17
ben
ch
21
22*
19 18
23* 24* West
East
P3
P2