The Brilliant Factory: Optimize, Predict, and...
26
The Brilliant Factory: Optimize, Predict, and Prevent David Sweenor | Global Product Marketing Manager | Advanced Analytics @DavidSweenor
Transcript of The Brilliant Factory: Optimize, Predict, and...

The Brilliant Factory:
Optimize, Predict, and Prevent David Sweenor | Global Product Marketing Manager | Advanced Analytics
@DavidSweenor

Embed Analytics Everywhere
Optimize, Predict, and Prevent
Data
Supplier
Sensor
Factory
Design
Data
Ble
nd
ing
Machine Learning
& Data Mining
Machine learning crunches data to build a
predictive model
Pre
dic
tive
Mo
de
l De
plo
ye
d
Predictive Model P
red
ictiv
e S
co
re G
en
era
ted
The predictive model acts on unseen”
data
Become scrap
Be out of
compliance
Trigger an
alarm
Become and
outlier
Exhibit
abnormal
behavior
Likelihood to…
Breakdown or
become
defective
The output is a score
An
aly
tics
Em
be
dd
ed
into
Bu
sin
es
s
Dashboards
Mobile
Web
Process improvement

Direct Mail Campaign
Data
Mailing List
1M prospects
Assumptions
• $2 to mail each prospect
• 1 out of 100 will buy
• $220 profit for each response
Catalogue
Mail Cost $2
Results
• Profit = Revenue - Cost
• =($220*10,000) – (1M * $2)
• =$200,000
Assumptions
Analytical Model output:
• 25% of the entire list are 3x more likely to respond
The Value of a Prediction
Mailing List
250K prospects
Catalogue
Mail Cost $2
Results
• Profit = Revenue - Cost
• =($220*7,500) – (250K * $2)
• =$1,150,000
• 5.75x improvement by mailing fewer people
Adapted from Predictive Analytics: The Power to Predict Who Will Click, Buy, Lie or Die by Eric Siegel
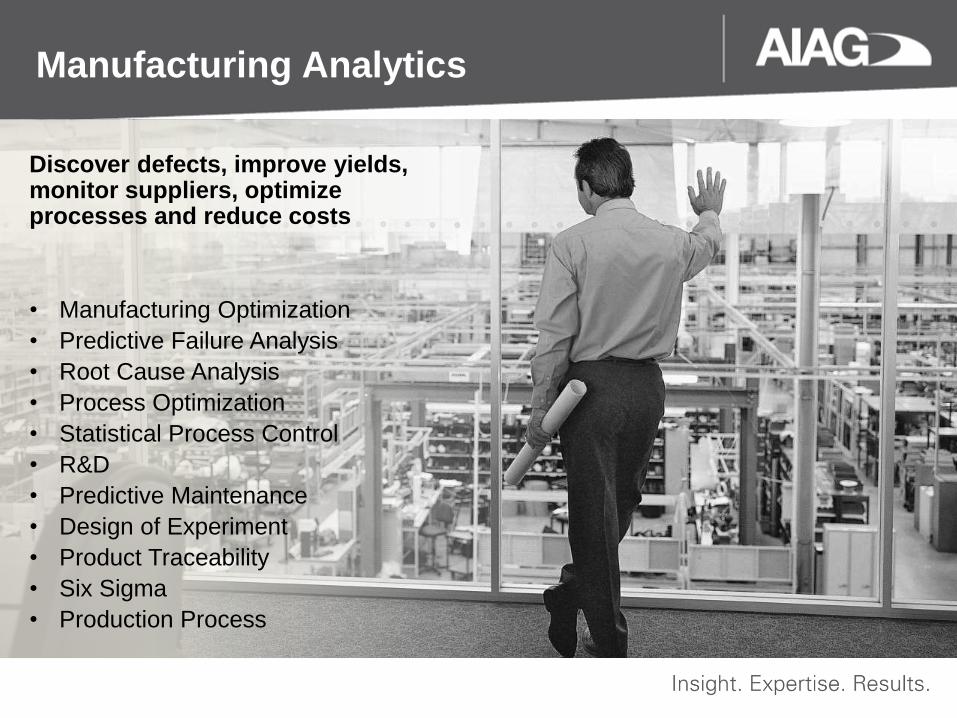
Manufacturing Analytics
Discover defects, improve yields, monitor suppliers, optimize processes and reduce costs
• Manufacturing Optimization
• Predictive Failure Analysis
• Root Cause Analysis
• Process Optimization
• Statistical Process Control
• R&D
• Predictive Maintenance
• Design of Experiment
• Product Traceability
• Six Sigma
• Production Process

The Internet of Things Impacts All of Us

Why are Analytics essential to IoT?
"Data is inherently dumb, it doesn't
actually do anything unless you know
how to use it and how to act on it,
because algorithms are where the real
value lies; algorithms define action,”
Source: Gartner Symposium Nov 2015 in Barcelona, Peter Sondergaard, senior vice president and head of
research at the analyst house http://www.v3.co.uk/v3-uk/news/2433966/algorithms-key-for-turning-dumb-data-into-real-business-benefits

Business need • Differentiate a commoditized business and
product to enhance margins and react to an
offshore competitor seizing market share.
Data required for analysis
• Historical Equipment data - performance
• Sensor data – temperature, maintenance
• Real time social data - Sentiment data
analysis
• Geospatial data – Lat/Long position data
Solution and results
• Aligning social sentiment with equipment
performance for higher quality
• Differentiated value proposition
• Higher margins
• Predictive performance and service
Creating Value with a Social French Fryer

Industrial Automation and Manufacturing
.
Building Automation,
Energy, Utilities
Healthcare Life Sciences
Transport Logistics Retail
Cost Savings via
Automation
43%
Opportunity for
Innovation
48%
Process
Improvements
50%
Process
Improvements
38%
Opportunity for
Innovation
40%
Cost Savings via
Automation
52%
Cost Savings via
Automation
35%
Opportunity for
Innovation
38%
Demand From
End Users
40%
Need Competitive
Advantage
33%
Need for Faster
Decision Making
41%
Opportunity for
Innovation
43%
Process
Improvements
42%
Cost Savings via
Automation
46%
Opportunity for
Innovation
57%
The impact of analytics on IoT

The ability to collect data will
always outstrip the ability to
transmit and store it
Pushing Analytics to the Edge

Big Data Streams from Connected Cars
• Cars – connected car data, network, contextual
• OEMs & Dealerships – vehicle diagnostics, in-car service consumption
• Insurance companies – aggregated/anonymized driving data, incident data
• Fleet customers – fleet performance, compare against competition

Big Data Streams from Connected Cars – con’t
• Federal / State DoT – breakdown data, accident data, environmental data
• Smart Cities – real-time traffic flow, incident alert, parking
• Advertisers – customer/passenger demographics
• Other B2B – content usage, frequency, length, etc.

Are you moving data
to and fro?
There is a better way!
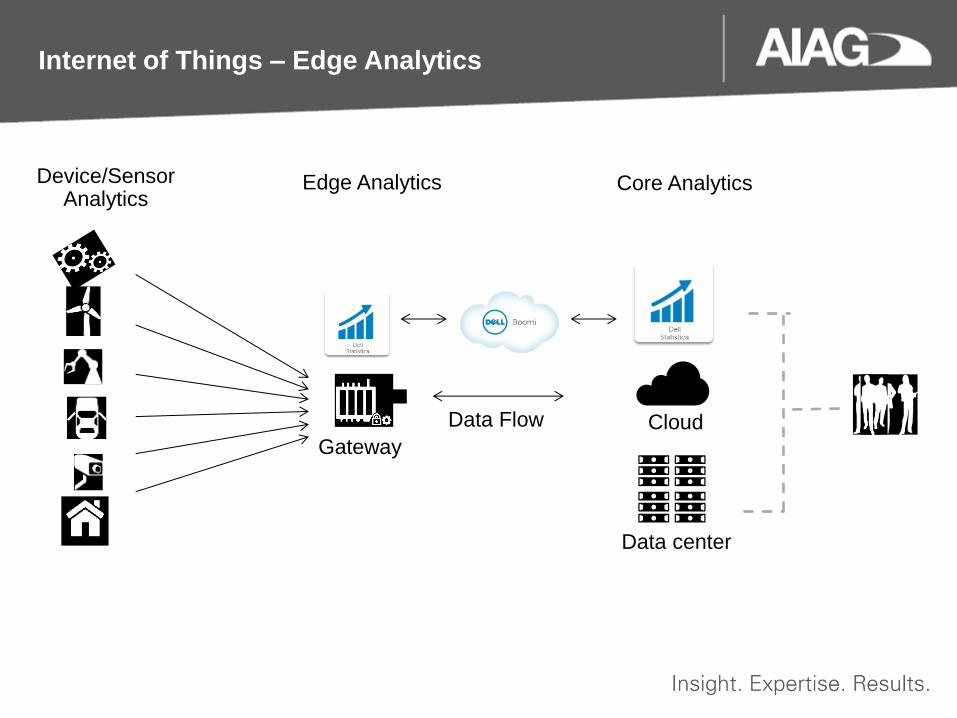
Data Flow
Gateway
Edge Analytics Core Analytics
Cloud
Cloud
Data center
Device/Sensor Analytics
Internet of Things – Edge Analytics
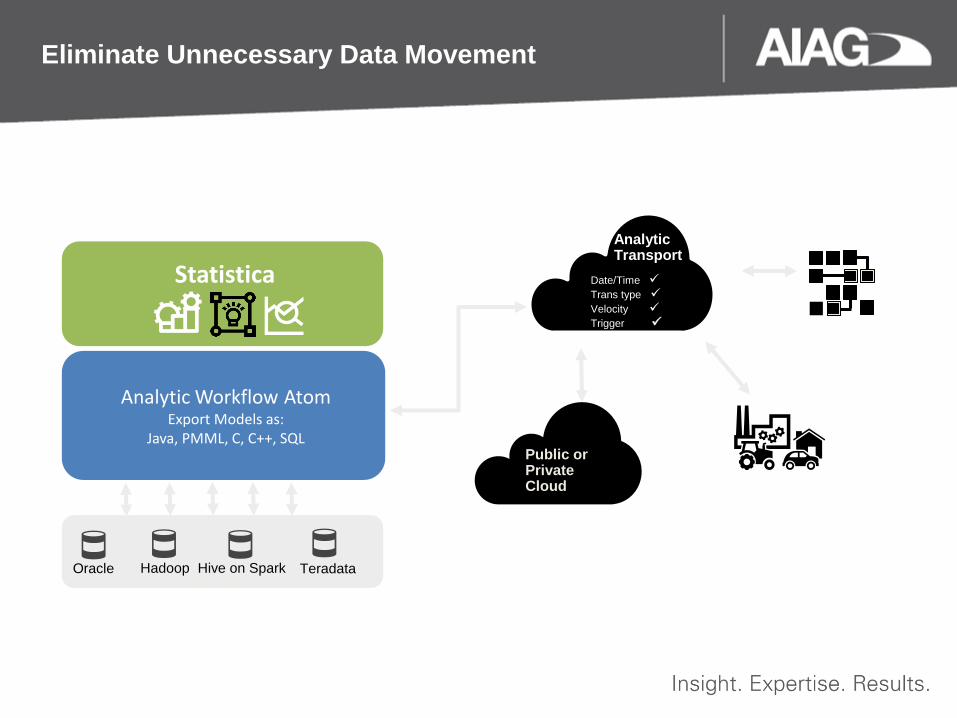
Eliminate Unnecessary Data Movement
Analytic Transport
Date/Time
Trans type
Velocity Trigger
Public or Private Cloud
Statistica
Analytic Workflow Atom Export Models as:
Java, PMML, C, C++, SQL
Oracle Hadoop Hive on Spark Teradata In-Database Analytics

How does work get done in your organization?
Image Source: IBM/Vermont Historical Society
Image Source: Google Maps
How many people keep reinventing the wheel?

Distribute analytic output to LOB
Network (Entity) Analytics Airport Predictive Maintenance Dashboard
Real-time streaming Process Flow Visualization

Democratizes Analytics to the Entire Organization
Data scientists
Use the global community for analytic modules
Build advanced analytic flows once; reuse and share
Empowered with in-database processing
Engineers
Automated data preparation
Wizards and templates with reusable configurations
No knowledge of SQL or databases required
Operators
Embed analytics in LOB apps
Recipes & Quick Starts
CI driven by shortage of expertise, thus a greater need for democratization and decentralization

Promote and Distribute Best Practices
Distribute & share analytics across the world
Take your math to where the data lives
Avoid duplicate infrastructure
Site 1 Tulsa, OK
Site 3 Sao Paolo, Brazil
Site 4 California
Site 2 Taiwan
Analytics Platform

Regional USA energy company turns to predictive analytics in pursuit of cleaner air and regulatory compliance.
Power utility plant optimizes coal-fired
cyclones without infrastructure retrofits
Business challenge The company wanted to use complex streaming data and existing
control technology to address competing goal functions and achieve
significantly better operations without the need for expensive
infrastructure projects.
Solution Statistica monitors and analyzes complex power plant operations in
real time and identifies specific settings for multiple parameters that will
reliably produce desired performance of high-dimensional, continuous
processes.
Results • Significantly improved & stabilized low NOx operations for cyclone
furnaces
• Optimized robust performance of 340 Mega Watt Cyclone with OFA
ports
• Optimized simultaneously for competing goal functions: minimum
emissions, maximum efficiency, and greatest reliability
• Fully documented by Electronic Power Research Institute (EPRI)
Published: June 2016 | Expires: June 2018
Read the EPRI case study report >

“We quickly identified the right claims to investigate and saved
$500K in warranty chargebacks.”
Automotive tech manufacturer increases efficiency
of warranty scoring and defense against claims
Business challenge In the warranty of mechatronic systems and electric motors, manual claims
classification required over 50% of engineers’ and analysts' time on data
retrieval, alignment, and preparation. Also, the company was unable to identify
quality issues early enough to pursue proactive process improvement.
Solution Dell Statistica’s auto-classification solution uses text mining and concept-
extraction; builds prediction models for each failure classification; builds a
workflow with rules to classify narratives to highest-probability failure mode;
and deploys for automatic scoring of new warranty narratives.
Results • Enhanced accuracy due to automatic text classification
• Enables proactive and preventive measures instead of reactionary
• Provides competitive advantage and drives down warranty costs
“Defending against a warranty claim, we
needed to analyze several years of data
in a short period of time, impossible
without Statistica. We quickly identified
the right claims to investigate and saved
$500K in warranty chargebacks.”
National Warranty Manager
Published: March 2015 | Expires: March 2017

When your reputation is built on the highest standards of quality,
performance and durability, Statistica shines.
Solar tech producer drives quality with predictive
analytics
Business challenge Over 10,000 streaming, automated parameters required real-time monitoring and
analysis to meet ever-higher demands of product quality—and to anticipate
manufacturing issues—in this extremely competitive industry.
Solution Statistica Enterprise integrated easily with the company’s existing MRP system
and offered practical algorithmic capabilities in a scalable, web-enabled
platform that maintains performance in the face of increasing complexity.
Results • Optimizes manufacturing efficiency by enabling hundreds of end-users
and engineers to monitor and respond to mission-critical data
• Maintains company’s competitive edge through application of predictive
process monitoring for potential quality issues
• Supports real-time processes 24/7
“This technology has enabled [us] to stay
in business in the face of very strong
headwinds and competitive pressures.”
Director of IT
Major solar tech producer
Published: June 2016 | Expires: June 2018

“Statistica offers an empirical line of sight between what we do in assembly and its effect on finished product.”
Lower manufacturing costs and higher quality
through predictive analytics v. “tribal knowledge”
Business challenge Even with sophisticated data-collection, our customer sought to improve
quality and reduce product failures by replacing "tribal knowledge" with
additional empirical data analysis that would more accurately relate
equipment parameters to product performance.
Solution Using Data Miner to identify correlation of complex parameters to product quality
outcomes, we built models that enabled engineers to test “what-if” scenarios and
optimize multiple, competing outcomes (e.g., power v. fuel efficiency).
Results • Streamlined multiple processes, e.g., reduced trim balance problems 45%
• Replaced metrology equipment costs and reduced product cycle time
• Reduced time & personnel costs needed for product adjustments
• Increased throughput with reduced scrap and rework
Published: August 2016 | Expires: August 2018
Read the Quality Digest article >
By 2018 more than half of large organizations around the globe will compete using Advanced Analytics and proprietary algorithms, causing
disruption on a grand scale.
Source: Gartner, Inc., Magic Quadrant for Advanced Analytics Platforms, Lisa Kart, Gareth Herschel, Alexander Linden, Jim Hare, 9 February 2016.
Gartner does not endorse any vendor, product or service depicted in its research publications, and does not advise technology users to select only those vendors with the highest ratings or other designation. Gartner research publications consist of the opinions of Gartner's research organization and should not be construed as statements of fact. Gartner disclaims all warranties, expressed or implied, with respect to this research, including any warranties of merchantability or fitness for a particular purpose.
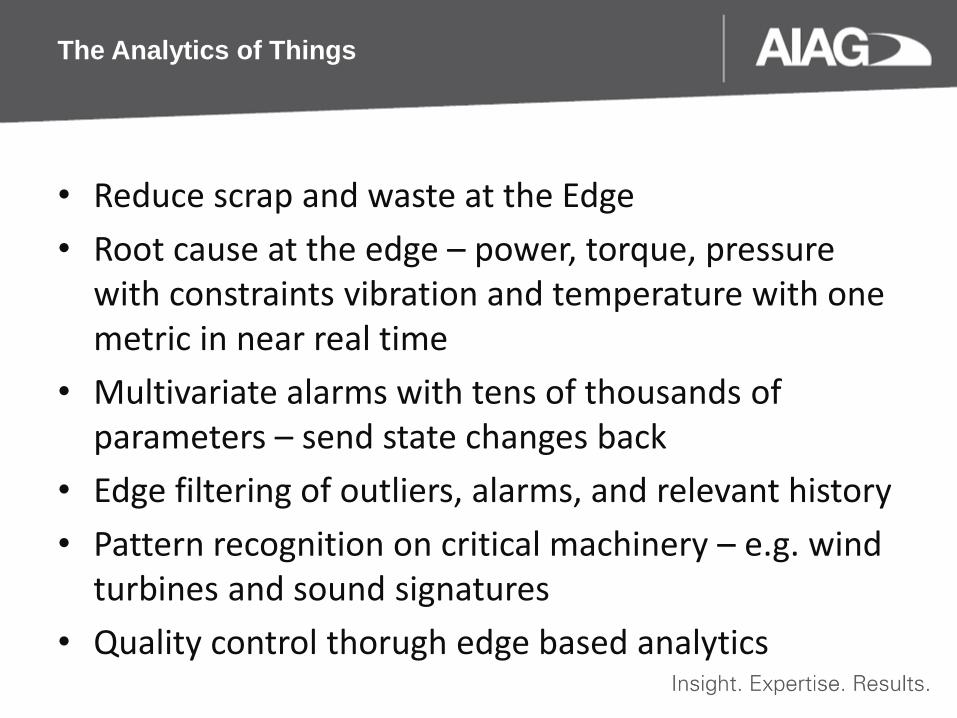
The Analytics of Things
• Reduce scrap and waste at the Edge
• Root cause at the edge – power, torque, pressure with constraints vibration and temperature with one metric in near real time
• Multivariate alarms with tens of thousands of parameters – send state changes back
• Edge filtering of outliers, alarms, and relevant history
• Pattern recognition on critical machinery – e.g. wind turbines and sound signatures
• Quality control thorugh edge based analytics

The Industrial IoT will transform and disrupt entire
industries while creating opportunities for new business
models
The ability to collect data will always outstrip our ability to transmit and store it pushing analytics to the edge
Statistica addresses some of the broadest set of analytic use cases including IoT Edge Analytics.
.
Key Takeaways

Embed Analytics Everywhere
Questions?
John K Thompson | GM of Advanced Analytics | @johnkthompson60
dell.com/statistica Questions?
David Sweenor | Global Product Marketing Manager | Advanced Analytics
@DavidSweenor
dell.com/statistica