Cloud Lending Solutions Overview - Lending Innovation Starts Here™

The bright side of lending by government owned banks: Evidence from the financial crisis in
Japan
Yupeng Lina
Anand Srinivasanb
Takeshi Yamadac
Abstract
This paper investigates the effect of lending by government owned banks on real investment and employment for publicly traded industrial firms in Japan, focusing on a period that covers the financial crisis in the 1990s caused by the burst of the real estate bubble. We find that increases in government owned bank lending has strong impact on investment during the crisis. In contrast, increases in government owned bank lending has little effect on employment growth. The positive effects of increases in government owned bank lending are focused on non-zombie firms. Firms that are more credit constrained show larger increases in investment with increases in government owned bank lending. Thus, our results show that government owned bank interventions can be effective in mitigating credit constraints and stimulating investment even for publicly traded companies.
_____________________________________________________________________ The authors thank Michael Brennan, Bruce Grundy, Derek Neal, Andrew Rose, David Yermack, Luigi Zingales, seminar participants at Deakin University, Development Bank of Japan, Federal Reserve Bank of Chicago, Hitosubashi University, Institute of Policy Studies (Ministry of Finance, Government of Japan), National University of Singapore, Queensland University of Technology, University of Adelaide, University of Melbourne, the Econometric Society Australasian Meeting, the 2012 NBER-EASE meeting in Taipei, the 2012 China International Conference in Finance, the 2012 Asian Finance Association conference for helpful comments. This paper was earlier titled ‘The bright side of lending by state(government) owned banks: evidence from Japan.’ aDept. of Finance, NUS Business School, Mochtar Riady Building, 15 Kent Ridge Drive, Singapore 117592. E-mail: [email protected] bDept. of Finance and Risk Management Institute, National University of Singapore, Mochtar Riady Building, 15 Kent Ridge Drive, Singapore 117592. E-mail: [email protected] c The University of Adelaide Business School, South Australia, Australia 5005. E-mail: [email protected]

2
The bright side of lending by government owned banks: Evidence from the financial crisis in
Japan
Abstract
This paper investigates the effect of lending by government owned banks on real investment and employment for publicly traded industrial firms in Japan, focusing on a period that covers the financial crisis in the 1990s caused by the burst of the real estate bubble. We find that increases in government owned bank lending has strong impact on investment during the crisis. In contrast, increases in government owned bank lending has little effect on employment growth. The positive effects of increases in government owned bank lending are focused on non-zombie firms. Firms that are more credit constrained show larger increases in investment with increases in government owned bank lending. Thus, our results show that government owned bank interventions can be effective in mitigating credit constraints and stimulating investment even for publicly traded companies.

3
1. Introduction
During the financial crisis of 2008-2009, most governments around the world have aggressively
moved to mitigate the real effects of the crisis by providing guarantees of bank debt and/or
recapitalization of banks. Nevertheless, questions remain about the effectiveness of such policies
since banks tend to hoard liquidity during a crisis, thereby, effectively blunting the impact of
governmental actions (Acharya, Shin and Yorulmazer, 2011, Diamond and Rajan, 2011). Besides
supporting the banks by infusing capital or providing credit guarantees, the government can directly
lend to the operating firms. For example, during the financial crisis of 2008-2009, the US government
provided direct loans to General Motors as part of the government’s Troubled Asset Relief Program
(TARP). Theoretically, Mankiew (1986) and Bebchuk and Goldstein (2011) show that, when private
credit supply is reduced and government acts as ‘lender of last resort’ during crisis, such a policy can
have beneficial real effects on the economy. Despite its importance as a potential policy tool, the
empirical effectiveness of such direct lending during a crisis has not been studied to the best of our
knowledge.
Specifically, we investigate the lending decision of government owned banks and the impact of
government bank lending on firm level investment. We focus on differential impact of such lending
during the crisis caused by the bursting of the real estate bubble in early 1990’s in Japan. In addition,
we examine differences in the effect of such lending across firms with different sets of credit
constraints. We also examine the effect of such lending on firm level employment.
Two contrasting views exist on the role of government in credit markets – the political view that
suggests that involvement of government results in inefficient credit allocation and inefficient
investment (Shleifer and Vishny, 1994), and the market failure view (Stiglitz, 1989a, 1989b) that
envisages a positive role for government in minimizing the impact of credit market failures. The
setting of our study lends itself naturally to studying the impact of government lending on mitigating
the effects of market failure. Nevertheless, we do consider the possibility that GOB lending, even
during a crisis, may continue to be driven by reasons other than mitigation of credit constraints.

4
To test the effects of GOB lending, we use the Nikkei Needs database, which has been used
extensively in studies of Japanese public companies. This database provides a comprehensive sample
of the identity of the lenders for publicly traded firms in Japan, which allows us to identify the degree
of lending from GOBs and private banks. Supplementing the above data set with the PACAP database,
we construct a firm-year panel data set that spans the period from 1977 to 1996 for all publicly traded
companies in Japan.1 This data set is used to identify the impact of lending by GOBs on these
companies.
We first examine the determinants of increases in GOB lending. We find that GOBs significantly
increase lending during the crisis, and increase lending to firms that have lower cash flows and rely
more on external financing. This provides preliminary evidence that suggests GOB lending is directed
towards firms having more credit constraints.
However, a potentially complicating factor is the presence of zombie lending (evergreen lending
to poorly performing companies) that was identified by Peek and Rosengren (2005) and Caballero,
Hoshi and Kashyap (2008) as existing in Japan. Are increases in GOB lending focused on zombie
firms? Unconditionally, there is no relationship between being a zombie firm and increases in GOB
lending. During the crisis, zombie firms are less likely to be the recipient of GOB lending.
Next, we examine the differential effect of increases in GOB lending on real investment by
corporations during crisis and non-crisis periods. We find a strong incremental effect on investment
during the crisis period, over and above the effect during normal times. In particular, in a baseline
specification, an increase of one yen in GOB lending results in a ¥0.84 increase of investment during
normal times and a further increase of ¥0.51 during the crisis. Since the crisis was a sudden
exogenous event, leading to a sharp increase in financial constraints for all firms, this result provides
strong evidence that increases in GOB lending does mitigate financial constraints.
We conduct several further tests to examine this question. First, we sort firms by several credit
constraint measures and examine differential effects of increases in GOB lending across these
different measures. The measures we use are - the Rajan-Zingales measure of external financial
1 All results are robust to inclusion of a longer time period till 2007. The reason limiting the data sample to 1996 is to avoid the effects of GOB reform as well as bank recapitalizations in Japan after this period.

5
dependence, dummy variables that classify firms into Keiretsu versus non-Keiretsu firms, leverage,
firm size, and Altman’s Z score. We find that the overall impact of GOB lending on investment is
almost always larger on firms that are more constrained relative to those that are less constrained.
Second, we examine the interactive effect of increases in GOB lending and Tobin’s Q, and of
increases in GOB lending and cash flow, - on firm investment. If a firm uses the increases in GOB
loans inefficiently, i.e., the loan was made for political reasons, the firm should increase investment
regardless of the market signal (i.e., Tobin’s Q). On the other hand, if a firm uses GOB loans
efficiently, we expect the sensitivity of investment to Tobin’s Q to increase. If increases in GOB
lending mitigate financial constraints, we should find that increases in GOB lending reduce
investment sensitivity to cash flow. Our study finds both effects, suggesting firms use increases in
GOB loans efficiently.
Third, we find that increases in investment due to increases in GOB lending are concentrated on
non-zombie firms, which provides further evidence that GOBs do not favor supporting inefficient
firms. For the zombie firms, the effect of an increase in GOB lending on investment is statistically
zero, both in normal and crisis times, in contrast to the strong effects documented earlier. Any quid
pro quo of increase in GOB lending to zombie firms should have resulted in large effects for zombie
firms and smaller effects for non-zombie firms.
As a last test for testing the potential inefficiency of the increases in investment associated with
increases in GOB lending, we examine long run stock price performance of firms with increases in
GOB lending. Using equally weighted calendar-time event portfolio returns, we do not find any
abnormal performance using Fama-French 3 factor model over a three year horizon. However, using
value weighted returns, we find small positive abnormal returns - around 0.7% per year for non-crisis
periods, and around 0.3% per year for the crisis periods. If the increases in investments induced by
GOB lending were inefficient from a shareholders perspective, we would observe negative abnormal
returns.
Taken together, our results suggest that GOB lending during the 1990’s crisis helped healthy
companies mitigate credit constraints, consistent with government lending mitigating market failures.

6
We conduct similar tests for employment growth. Consistent with earlier studies, we find a
positive effect of increases in GOB lending on employment growth. However, the economic
magnitudes are small. For example, an increase in the GOB lending that equals 1% of firm’s capital
(i.e., an increase of 0.01 in the GOB lending to capital ratio) results in an increase of approximately
0.13% employment growth. In contrast to our results for real investments, we find no incremental
effect of GOB lending on employment growth during the crisis.
A major concern in our results stems from the endogeneity of GOB lending. For example,
governments may choose to extend loans to firms that hire more people or invest more. In addition to
using time invariant factors, such as firm fixed effects, in the regressions, we employ several
alternative measures to control for endogeneity – propensity score matching and Arellano and Bond
GMM estimation.
An important instrument we use to identify the likelihood of increases in GOB lending is the
percentage of directors that are former government bureaucrats that serve on the board of the firm. We
posit that having former government bureaucrats on the board might increase the likelihood of
receiving more GOB lending, but do not directly affect firm’s investment or employment. The results
using these different methods of endogeneity corrections for investment are largely consistent with
our base panel data results.
The strong economic impact of GOB lending that we find on investment is consistent with the
stated policy objectives of GOB lending. Although our study provides evidence of the benefits (i.e.,
the bright side) of GOB lending, it should be acknowledged that we do not have access to individual
loan contract terms. Thus, we are unable to directly examine if government owned banks provided
firms with subsidized loan rates. Therefore, we are unable to comment on the net benefit of such
direct lending - which would be the benefit of increased investment and employment minus the cost
of the government subsidy. However, we can conclude that government owned bank system is
effective in impacting real activities, especially for firms with constraints, and for firms during the
Japanese crisis of the 1990s.
7
Our paper primarily contributes to the literature on the role of government during a crisis. The
crises of Japan in the 1990’s provides a good laboratory for understanding the effect of direct
government lending vis-à-vis the crisis of 2008 in the US, particularly because of the similarity of the
two crises (Hoshi and Kashyap, 2010). Further, it has been argued that government owned banks in
Japan were an effective instrument by which the Japanese government stimulated the economic
growth (Horiuchi and Sui, 1993). We show that direct lending can be an effective tool for impacting
corporate activity during an economic crisis and this finding may be applicable to other advanced
economies as well.
Our results complement those in Giannetti and Simonov (2013) who show that state funded
recapitalizations of Japanese banks in the late 1990’s resulted in more zombie lending by the
recapitalized banks, if the size of the capital injection was too small. This further suggests that direct
lending should be seriously considered as an alternative tool to stimulate corporate investment.
Our paper also contributes to the debate on the efficiency of lending by government owned banks.
Several papers document the negative effects of such lending - both at the level of the macroeconomy
(Barth et al, 1999, La Porta et al, 2002, Dinç, 2005) as well as at the firm level (Sapienza, 2004,
Carvalho, 2012). In conjunction with the results documented by Imai (2009) on politically motivated
lending by GOBs in Japan, our results suggest that both the political and market failure views could
co-exist as rationales for GOB lending. None of the above papers focus specifically on a crisis, hence,
the difference in results suggests that there are positive effects of such lending that have not been
highlighted in the literature.
The remainder of this paper is organized as follows. Section 2 provides institutional details on the
1990’s crisis in Japan as well as an overview of government owned banks in Japan. We describe our
data set and variables in Section 3. Section 4 performs the empirical analysis and Section 5 concludes
with directions for future research.
2. Institutional Details of the Japanese banking market
2.1 The Japanese Financial Crisis of the 1990’s

8
During the 1984-1989 period, the Japanese capital markets and the real economy expanded rapidly.
The Nikkei 225 Stock Index was around 10,000 levels in 1984 and reached a peak of 38,916 on
December 29, 1989. Similarly, the land price index rose rapidly during the late 1980s. Meanwhile, the
private investment also expanded dramatically (see Figure 1). The business press has extensively
referred to this period as a bubble period.
Concerned with the overheating in the asset markets, the Bank of Japan increased the official
discount rate and imposed limits on commercial bank lending to real estate related projects. These
policies resulted in much tighter credit market conditions. Both stock and real estate prices fell
sharply during 1990-1992. The Nikkei 225 Stock Index started to fall in early 1990, reaching 20,222
by October 1, 1990, which was followed by declines in real estate prices. This deflation in asset prices
caused the Japanese economy to contract significantly. Concerned with default risk, private banks in
Japan reduced or suspended their lending, imposing negative impacts on bank loan supply. According
to a survey by the Japanese Banking Association, private banks suspended 6,956 transactions for
firms with capitalization of more than 1 million yen in 1989.2 In 1992, this number reached as high as
15,854, which was more than twice of the number of suspensions in 1989.
In the meanwhile, GOBs stepped in and provided funds to fill in the financing gap during the
crisis period. Figure 2 compares aggregate private lending and GOB lending to the Japanese private
non-financial sector, using flow of funds data from the Bank of Japan. The figure shows net increases
in GOB lending after 1990 as private lending decreased sharply during the crisis. Even when private
lending was shrinking (i.e., net increases in private lending being negative) after 1993, GOB lending
did not contract, which suggests that GOB intervened to mitigate the effect of shrinking private
lending. Also, according to a statistic compiled by the Bank of Japan, the fraction of aggregate long
term loans extended by GOBs increased from 2% of total annual long term funds in 1989 to more
than 30% in 1993.3
Figure 3 shows the time series pattern of the increase in GOB lending, both in terms of number
of firms and magnitude for listed non-financial corporations in our data sample. We find that there is a
2 Suspension is defined as non-renewal of existing loan contracts. 3 Long term funds include equity funds, long term bonds and long term bank debts.

9
sharp increase in the number of firms that experienced an increase in GOB lending after the onset of
the crisis in 1990. We also observe that the magnitude of GOB lending increased through the crisis.
Based on the above facts, we define the period starting from 1990 to 1994 as the crisis period and
we define 1995 onwards as the post crisis period. The GDP growth in the second quarter of 1995
increased to 2.9% and economic growth recovered until 1997, which is consistent with Figure 1 where
the capital investment started to recover from 1995. Since there were bank defaults and banking
system restructuring from 1997, we exclude data after the end of 1996 in our main empirical tests.
2.2 Government Owned Banks in Japan
Japan has various types of government banks to provide loans to a different set of borrowers.4
These government banks have received most of their funds from the Fiscal Investment and Loan
Program (FILP) which is mainly funded by the postal saving and insurance system.5 Similar to the
general accounting budgets of the government, the FILP budgets are proposed by the Ministry of
Finance.
The GOBs supply long term credit to firms whose projects are regarded as important for the
economic development (Horiuchi and Sui, 1993). Meanwhile, Ministry of International Trade and
Industry (MITI) also actively recommends potential borrowers to these government owned banks.6
For example, Japan Development Bank and Export-Import Bank have been established to provide
long-term loans to large firms in industries that government considers important for its policy
objectives. Government banks that provide loans to smaller firms, such as Japan Finance Corporation
for Small Business and People’s Finance Corporation, have been established for the aim of mainly
providing credit for firms that might have difficulty receiving loans from private banks. There are also
a few government banks that have been established to provide government credit for the development
4 They are Japan Development Bank, People’s Finance Corporation, Agricultural Forestry and Fisheries Finance Corporation, Hokkaido and Tohoku Development Corporation, Local Public Enterprise Finance Corporation, Environmental Sanitation Business Finance Corporation, Export Import Bank of Japan, Housing Loan Corporation, Small Business Finance Corporation, Small Business Credit Insurance Corporation, Commerce and Industry Finance Corporation and Okinawa Development Finance Corporation. Local Public Enterprise Finance Corp and Housing Loan Corporation are most likely not included in our sample as they are less likely to lend to private corporations. For details, see Imai (2009). 5 FILP is no longer funded by the postal savings system since 2001, and is financed by issuing bonds that are considered equivalent to government bonds. 6 MITI has been reorganized and changed its name to ministry of Economic, Trade and Industry in 2001.

10
of certain regions such as the Hokkaido and Tohoku Development Corporation and the Okinawa
Development Finance Corporation (See Imai, 2009). Although the government owned banks exist to
provide credit in line with the government’s policy objectives, they are also very active in searching
business, can decide credit allocation independently from the government, and can also act like
private commercial banks to supply loans in the form of syndicated loans. They also regularly monitor
the performance of borrowers during the loan commitment by requiring operation reports from their
borrowers or consulting other private banks to obtain information.7 Due to the dominance of the
private banking sector, the proportion of corporate financing provided by GOBs is relatively small in
terms of loans outstanding. For our sample of listed non-financial firms, the average value of GOB
lending is around 15% of the total corporate borrowing from banks (see Figure 4).
3. Data and Summary Statistics
3.1 Data and key variables
Our main sample consists of all listed companies in Japan, excluding financial institutions and
utility companies, from 1977 to 1996. We deliberately choose to end the main sample in 1996 to
avoid any effects of economic downturn which started in 1997, any confounding effects of
recapitalization of Japanese banks in the late 1990’s, and the effects of restructuring of GOB which
started from 1999. Particularly, the recapitalizations of private banks by the government may have
had the effect of providing a guarantee effect for private banks, which would reduce the difference
between government and private loans. In unreported tables, we include all data till 2007, using the
economic downturn from 1997 as a second crisis, and find all our results are robust to the inclusion of
the period after 1997.8
Accounting information, bank loan information and historical stock prices are obtained from the
Nikkei Corporate Financial Database (Nikkei), Nikkei Bank Loan Database and Pacific-Basin Capital
Markets Research Center (PACAP), respectively. The Nikkei Bank Loan database includes loans
7 The reorganization of Japanese government owned banks resulted in three banks (i.e., Development Bank of Japan, Japan Finance Corporation and Shoko Chukin Bank) and Japan International Cooperation Agency, as of 2008. 8 The increase in the consumption tax rate from 3% to 5% and the termination of special tax reduction program in 1997 are considered major factors that killed the nascent economic recovery which started in 1995.

11
outstanding of individual banks for each company at the fiscal-year-end. We obtain 22,009 firm-year
observations with adequate loan information and 19,076 firm-year observations with both loan and
stock price information from 1977 to 1996.9
We identify nine major government owned banks in Japan that supply credit to companies. These
banks are 100% owned by the Japanese government during our entire sample period. We construct a
continuous variable ‘Government Owned Bank,’ that is computed as the ratio of the net annual
increase in all government owned bank loans outstanding to total capital in the current year. Total
capital is defined as the total amount of tangible fixed assets of the firm. Thus,
GovernmentOwnedBank ,
TotalLoansoutstandingfromGOBstofirmiinyeart TotalloansoutstandingfromGOBstofirmiinyeart 1TotalCapitaloffirmiinyeart 1
This is the principal measure that we use in the empirical analysis. Following prior literature on
investments in Japan (Kang and Stultz, 2000, Goyal and Yamada, 2004), we define investment as the
change in tangible fixed asset plus depreciation. We define employment as the total number of
employees at the end of the year. This number includes full-time employees, employees on term
contracts, temporary employees (loaned employees from other companies), and employees on leave
of absence. It does not include directors. The following is some of the important variables used in the
empirical analysis, which includes sales growth, cash by asset, size, wage, book leverage, ROA, cash
flow and Tobin’s Q. Tobin’s Q is proxied by the ratio of the market value of assets to total book assets
(Chung and Pruitt, 1994). A detailed definition of all variables is presented in the Appendix.
3.2 Summary statistics
Table 1 presents summary statistics from 1977 to 1996 for the key variables. Table 1 Panel A
shows that the proportion of government owned bank loan to total borrowing is around 6.7% on
average, suggesting that the market share of government owned bank is small compared with that of
private banks. However, in our sample, over 12,176 out of 22,009 firm years, which is over 55% of
our sample, record loan outstanding from GOBs, suggesting that the penetration of GOB influence is
9 We delete firms that do not have any information on the borrowing from banks.

12
deep despite their low market share.10 Panels B and C of Table 1 stratify the sample for borrowers
with an increase in government owned bank lending in a given year (Government Owned Banki,t >0),
and those without such an increase (Government Owned Banki,t ≤0). We find that firms that
experience an increase in GOB loans have higher employment growth and investment. In particular,
such firms have 0.2% higher employment growth and 0.029 higher investment to capital ratio
compared with other firms. Given that the overall average of employment growth is 0.3%, and the
overall average of the investment to capital ratio is 0.085, the difference in firms that receive an
increase in GOB lending is not only statistically significant but also economically significant. For
example, an increase in GOB lending is associated with an increase of 34% for the investment to
capital ratio, and an increase of around 66% for the employment growth relative to their respective
mean values.
We also find that firms with increases in GOB lending tend to have greater leverage than other
firm years. Also, these firms have lower Tobin’s Q (0.930 vs. 1.024), lower cash flow to capital ratio
(0.212 vs. 0.353) and lower cash by asset ratio (0.115 vs. 0.149), which implies that these firms not
only have lower market valuations but also are more cash constrained. Our findings are consistent
with those by Sapienza (2004) who documents that GOBs generally favor providing loans to
depressed firms.
Figure 4 shows increase in GOB loans to our sample of publicly traded non-financial firms
during our sample period. In contrast to the aggregate change in GOB lending to the corporate sector
in Figure 2, the share of lending by GOBs to publicly traded companies in Japan increases only
around 4% from 1990 to 1994 (the crisis period), which is a relatively small amount.11 In Figure 5 we
compute the correlation between GOB lending and private lending in our sample for each year to
examine if GOB lending substitutes for private bank lending. To the extent that GOBs intend to
mitigate credit constraints, we expect to find a negative correlation, particularly during the crisis,
which indeed is the case. We find that the correlation is also negative prior to the crisis, suggesting
that GOB lending substitute private bank lending after the late 1980s. The above figures provide
10 This number is computed independently and is not available in Table 1. 11 Our finding suggests that large increase in aggregate GOB lending have been concentrated on SMEs and private enterprises.

13
preliminary evidence that GOBs in Japan stepped in to mitigate the reduction in private bank lending
during the crisis, which provides our foundation for the remainder of the empirical tests.
4. Empirical Results
4.1 Increase in GOB lending and firm characteristics
The results in Section 2 provide evidence that on the aggregate level, GOB lending is negatively
correlated with private bank lending. Further, univariate results in section 3 also provide similar
evidence at the firm level. In this section, we reexamine the firm level results, using a multivariate
regression to control for other potential determinants of increases in GOB lending.
Specifically, we are interested in investigating two issues – (1) Do GOB’s target more credit
constrained firms during the crisis, and (2) How likely are zombie firms to be the recipients of GOB
lending. Our measures of financial constraints are quite standard – the Rajan-Zingales (RZ) measure
being the main measure. Other measures used include leverage and cash flow. Likewise, classifying a
firm as a zombie follows the method suggested by Caballero, Hoshi and Kashyap (2008). Specifically,
we create a lower bound for interest that a firm could pay during the fiscal year:
R ,∗ rs BS , 1/5 rl BL , rcb , Bond ,
where rs is short term loan prime rate, BS is the short term loan outstanding, rl is long term prime rate,
BL is the long term loan outstanding , rcb is the observed minimum coupon rate for convertible bond
and Bond is the outstanding of bonds. If the interest expenditure of the firm during that fiscal year is
lower than this lower bound, which implies that the firm is heavily subsidized, we define the firm to
be a zombie firm.12
As a first step, in panel A, we examine the relation between firm characteristics and increases in
GOB lending, both using a dummy variable to capture increases in GOB lending, as well as the
12
As documented by Fukuda and Nakamura (2011), Caballero, Hoshi and Kashyap (2008)'s measure could possible classify a good firm as zombie as healthy firms' interest rate could lower than the prime lending rate. In unreported tables, we modify Caballero, Hoshi and Kashyap (2008)'s measure with two additional criterions. In particular, firms whose earnings before interest and taxes (EBIT) exceeded the hypothetical risk-free interest payments were excluded from being classified as zombies and firms that were unprofitable and highly leveraged (higher than 0.5) and had increased their external borrowings were classified as zombies. Our results remain the same using this alternative measure.

14
continuous measure defined in Section 3.1. Unconditionally, we find that there is a large likelihood of
an increase in GOB lending during the crisis. Further, using some of the financial constraint measures
(leverage, cash flow, the RZ measure), increases in GOB lending are more likely for more constrained
firms. Interesting, there is no relationship between increases in GOB lending and the zombie measure.
In Panel B, we reexamine the interactions of the financial constraint measures with the crisis
dummy. We find some evidence for increases to high leverage firms. Interestingly, we find the
increases in GOB lending for zombie firms during the crisis reduces significantly. This provides
further evidence that GOB lending is not in any way concentrated on zombie firms, either in normal
times, or during the crisis. We will revisit the zombie issue later again to ensure that the results
obtained are not driven by differential reactions of zombie firms.
4.2 Effect of GOB lending on capital investment
Next, we examine the effect of government owned bank lending on real investment. The
empirical specification is based on the q-theory of investment, where investment is a function of
Tobin’s Q ratio. We also augment the model with firm specific financial variables such as internal
cash flow (Fazzari, Hubbard, and Petersen 1988) as well as year and firm fixed effects to account for
unobservable time and firm heterogeneity.
,
, ,
,
,, , , 1
In the above equation, suffix i refers to firm i and t refers to fiscal year t. We compute the industry
adjusted investment to capital ratio by taking the difference of this variable from its industry median
value. This industry adjustment is motivated in part by the Japanese government policy that has
targeted and supported certain industries as part of the government’s industrial policy (Hoshi and
Kashyap, 2001).13,14 Such policy induced investment changes should be reflected in the industry
median, and therefore taking the difference of the firm level to industry should isolate the impact of
firm specific factors. 13 For example, in the early 1990s, the Japanese government considered the animation and cartoon industry as an important export industry. 14 All results are robust to using unadjusted values and using industry dummies. An earlier version of the paper had both sets of results. Due to length considerations, these are omitted from the present version. The advantage of using industry adjusted values is that this method would account for time variation in industry level investment.

15
Government Owned Banki,t, as defined earlier, is the net increase in government owned bank
loans outstanding at the end of the current year, relative to the previous year, scaled by the capital at
the end of the previous year. By using this variable, we estimate the marginal increase in investment
for a unit increase in GOB lending from its coefficient.
We define cash flow, CFi,t, as net income before extraordinary items and depreciation, Ki,t-1 is
tangible fixed asset, and Q is Tobin’s Q. Vector F consists of firm specific financial variables, νi is the
firm fixed effect, ut is the year fixed effect, and ei,t is the idiosyncratic error. In several tests, we
augment equation (1) by interacting Government Owned Bank with crisis dummy, as well as proxies
for financial constraints faced by the borrowing firm. (See appendix for details of the variables.)
Table 3 reports the results for our baseline specification in equation 1. Reported t-statistics and p-
values are based on robust standard errors clustered at the firm level. In Model (1), the estimated
coefficient on ‘government owned bank’ is positive and significant at the 1% level, suggesting that
increases in GOB lending stimulate firm investment. In particular, the coefficient on “government
owned bank” is 0.973, suggesting that a ¥1 increase in government owned bank lending will result in
¥0.973 increase in firm investment. The coefficients on Tobin’s Q are positive and significant at the 1%
level. This is consistent with the q theory that firms with more growth opportunities will invest more.
The positive and significant coefficient on cash flow reflects that firms are sensitive to cash flow
fluctuations suggesting that financial frictions do play a role in determining firm investment. This
regression suggests that government owned bank lending can help to boost investment, regardless of
whether the given period is a crisis period or a non-crisis period.
In Model (2), we further investigate the incremental effects of government owned bank lending
on firm level investment during the crisis. The results show that the coefficient on the interacted term
is positive and significant, suggesting that government owned bank lending have greater impacts on
investment during crisis. More specifically, an increase of one yen in GOB lending results in an
increase of investment between ¥0.86 in normal times, and a further increase of ¥0.54 during crisis
times. Thus, there is a multiplier effect of GOB lending since one yen of GOB lending stimulates total
investment of more than one yen during crisis periods.

16
In Model (3), we examine the robustness of these results by including other control variables
in the regression. The role of additional control variables in Model (3) is to account for time varying
firm characteristics that might not be captured by the above adjustments. These additional control
variables are motivated by prior literature – for example, firms with high leverage are more likely to
be financially constrained or distressed, or both, relative to firms with lower leverage. We posit that
firm size is inversely related to financial constraints, and ROA is an alternative proxy for future
growth opportunities, although high ROA could also mean that firm has more cash at its disposal and
is less financially constrained. Under both interpretations of ROA, one would still expect a positive
impact on investment. Although we find that all additional control variables have the expected effects
on investment, the magnitude and statistical significance of the effect of GOB lending on investment
is not affected by the inclusion of these additional control variables.
Although the net effect of increase in GOB lending on investment in Model (3) reduces to 0.839
compared with that of Model (1), the coefficient is both statistically and economically significant. To
estimate the economic significance of this effect, we use the mean value of ‘government owned bank,’
which is 0.026 from Table 1 Panel B. When we multiply this number with the coefficient estimate of
0.839, we obtain the mean increase in the investment to capital ratio to be 0.021. Thus, compared with
the average level of investment to capital ratio of 0.085, the ratio increases almost 25%, which is close
to the estimate from our univariate analysis in Section 4.2.
In Models (4) and (5), we stratify the sample into firms that experience a decrease in private
bank (henceforth, PB) lending in the given year relative to the previous year, and those that do not.
We posit that firms that experience a decrease in lending from PBs are more likely to be credit
constrained, relative to firms that did not experience such a decrease. To the extent that decreases in
PB lending could be caused by changing economic conditions, such as lower growth prospects, these
should be captured by other control variables such Q, ROA and year fixed effects. Although we find
strong positive effects of GOB lending on investment in both samples, the sub-sample of firms that
experience decrease in PB lending shows a stronger incremental effect during the crisis. Thus, our
result suggests that GOB lending mitigates credit constraints caused by reduction in PB lending

17
during crisis periods. In non-crisis times, we find that the effect of GOB lending on investment is
much smaller for firms that experience a decrease in PB lending than for those that do not experience
a decrease, suggesting that the former might use the proceeds from GOB loans for other purposes than
investments. As Japanese GOBs also provide loans for working capital, these firms might use GOB
loans to substitute the decrease in PB loans for this purpose.
4.3 Alternative tests for efficiency of investment
One may argue that GOB lending might lead firms to take inefficient investments if firms that
experience reductions in PB lending have lower (unobservable) growth opportunities that are not
captured by our model. We address the issue in this section by using different model specifications,
using different subsamples, and examining the impact on shareholder wealth of GOB lending.
4.3.1 Impact of GOB lending on high growth and high cash flow sensitivity firms
To the extent that GOB lending mitigates credit constraints, this may enable firms to better
capture growth opportunities. Thus, we might expect that investment sensitivity to Q be higher for
firm with increases in GOB lending. In addition, investment sensitivity to cash flow should be lower
if credit constraints are mitigated by GOB lending. On the other hand, if GOB lending is directed to
politically motivated investment projects, there might be no incremental effect of GOB lending on
high growth firms, nor should the cash flow sensitivity of financially constrained firms be mitigated
by GOB lending. To examine these effects we interact GOB lending with Tobin’s Q and cash flow in
our investment regressions.
The results of this estimation are presented in Table 4 (all control variables used in Table 3 are
also used, but not presented to conserve space). In Model (1), we interact the Q ratio of the firm at the
end of the previous year with ‘government owned bank.’ We find a strong incremental effect of GOB
lending on high growth firms. A GOB loan made to a firm that has a 0.01 higher Q ratio results in an
increased investment of ¥.0067 relative to the lower Q firm. We also find that GOB lending decreases
firm’s investment sensitivity to cash flows (Model 2) which is consistent with reduction of financial

18
constraints. Thus, our results show that GOB loans are used efficiently by firms to capture growth
opportunities and to reduce cash flow constraints, although we find no differential impact during crisis
period (Models 3 and 4).
4.3.2 Impact of GOB lending on zombie firms and non-zombie firms
One of the concerns in interpreting the positive GOB effect on investment is that it could simply
reflect the government subsidization (Shleifer and Vishny, 1994). Unfortunately, the data set we have
does not have any contract terms of the loan. In this section, we use alternative approach to release the
concern by investigating the relationship between GOB lending and their ever-greening behavior
(Hoshi, 2000; Hoshi and Kashyap, 2004).
During the 1990s, banks continued to roll over loans to insolvent borrowers, or zombie firms,
gambling that firms will recover or that government might eventually bailout the firm. However, it
has widely been documented that such lending to zombie firms reflect the banks' inefficient
subsidization and hampered the economy recovery (Hoshi, 2000; Caballero, Hoshi and Kashyap, 2008;
Giannetti and Simonov, 2013). Caballero, Hoshi and Kashyap (2008) also point out that the
government encouraged private banks to direct their lending particularly to small and medium
enterprises (SMEs), claiming that increase in lending to these SMEs should "ease the credit crunch".
However, keeping zombie firms afloat could save unemployment rate from deteriorating, which could
potentially benefit the politicians (Shleifer and Vishny, 1994). If the above argument is correct, the
effects that we observe should be focused on zombie firms and lower for non-zombie firms.
To test this, we stratify firms based on measures of zombies and investigate whether the GOB
effects are mainly concentrated in zombie firms. We first employ Caballero, Hoshi and Kashyap
(2008)'s measure. In addition, we further create industry level zombie measure to alleviate any
measurement error in the firm level measure. In particular, we classify the construction, wholesale,
retail sale, real estate and service industry as zombie dominated industries as previous literature
documents that these companies in these industries more likely to have evergreened loans (Hoshi,
2000; Hoshi and Kashyap, 2004; Caballero, Hoshi and Kashyap, 2008).

19
The result in Table 5 shows that the GOB effect in investment is mainly concentrated in non-
zombie firms and non-zombie industry. The effects of increases in GOB lending on investment is
insignificant for zombie firms or high zombie industry. This result is consistent with our argument
that GOBs stimulate investment mainly through the channel of easing credit crunch. It also mitigates
our concern that GOBs might be ever-greening zombie firms.
4.3.3 Impact of GOB lending on firms with higher financial constraints and distress risk
In this sub-section, we further examine the results by stratifying firms based on various measures
of financial constraints and distress risk that have been used in the literature. We use the following
measures – a dummy variable for whether or not the firm belongs to a keiretsu group,15 a measure of
the firm’s external financial dependence by Rajan and Zingales (1998) or the RZ measure, leverage,
Altman’s Z score, and size based on a firm’s ranking in a given year.16 Note that the last three firm
specific measures could proxy for financial constraints as well as for financial distress. Also, many
keiretsu firms not only have internal capital market among group firms or a main bank that mitigates
their financial constraints but also have lower distress risk due to potential cross-subsidization among
group firms. In this regard, the RZ measure is our only measure that proxies external financial
constraints and not financial distress. As the RZ measure is computed at the industry level, it is most
exogenous with respect to GOB lending at the firm level. In contrast, other measures of credit
constraints may be positively correlated with increases in GOB lending.
To the extent that GOBs have the incentive to minimize the likelihood of distressed firms
becoming bankrupt or laying off employees, this correlation works against finding incremental effects
of GOB lending. For example, if constrained firms need to use the proceeds of the GOB loan to repay
other creditors, or pay employees, this would reduce the measured effect of GOB lending on
15 Keiretsu is a group of large Japanese financial and industrial corporations whose member firms cross-hold shares. In a keiretsu, each firm maintains its operational independence while retaining very close commercial relationships with other firms and main bank in the group. Thus, these firms are less likely to be financial constrained. 16 We computed the Rajan and Zingales (RZ) measure using Japanese data. Our measure differs markedly from the original estimates using US data published in Rajan and Zingales (1998). In particular, two things are striking – the Japanese RZ measure has zero correlation with the RZ measure for the US. Second, there are several industries where the sign of external financial dependence differs – that is, an industry classified as being dependent on external financing in the US having a positive RZ score, is classified as not being dependent on external financing in Japan having a negative RZ score.

20
investment. In this case, our measured effect would understate the true effects of GOB lending on
investment.
However, if GOBs behave in a manner similar to private banks, the measured effect might reflect
the selection ability of GOBs being able to screen good firms with unobservable quality, rather than
mitigating credit constraints.17 However, this type of endogeneity might be less relevant for GOB
lending as previous research showed that GOBs lend to distressed and constrained firms (Sapienza,
2004). Nevertheless, to address these concerns, we adjust for endogeneity using a variety of methods
in Section 5.5.
In this section, we follow a simple approach by stratifying our sample into firm years that are
classified as being constrained or distressed using each of the five measures discussed above, and
estimate Equation (1) for each sub-sample. In Table 6 Panel A, we present our base results, and in
Panel B we add an additional interaction term for GOB lending with the crisis. Generally, we would
expect the effect of GOB lending on investment to be more for constrained or distressed firms.
However, if constrained firms receive more GOB lending during the crisis, GOB lending may be
correlated with distress and/or financial constraints, which could bias our results. In subsequent
sections we provide auxiliary analysis to mitigate this issue.
The results in Panel A show that there is a significant difference between the effects of GOB
lending on constrained and/or distressed firms versus unconstrained or non/distressed firms. In all
cases, the marginal impact of GOB lending on constrained or distressed firms is larger relative to
unconstrained firms. For example, for firms with a high RZ measure, the net effect an increase of ¥1
in GOB lending leads to an increase of ¥1.2 in investment, similar to a multiplier effect found in
Table 3. Likewise, the marginal effect of GOB lending for non-Keiretsu firms is ¥1.21, whereas for
Keiretsu firms, it ¥0.69. Other firm specific variables show similar differences, which are quite large
economically. However, these firm specific variables may be correlated with the likelihood of
increases in GOB lending which makes interpretation of these magnitudes difficult. As mentioned
earlier, the RZ measure, which is more likely to be exogenous to increases in GOB lending, provides
17 In addition, there is a possibility that private market participants might perceive an increase in GOB loans to a firm as evidence of an implicit government guarantee, which is turn might result in a lowering of credit constraints for the firm.

21
the strongest evidence that GOB lending leads to increases in investment among financially
constrained firms.
In Panel B, we examine the incremental effect during crisis for the same subsamples of firms.
The results show several interesting patterns. First, for virtually all the measures, the impact of GOB
lending on constrained firms is much larger than unconstrained firms during normal times. Second,
constrained firms do not show any incremental effect of GOB lending during the crisis; In contrast,
unconstrained firms have a strong positive incremental effect of GOB lending during the crisis. Thus,
the marginal value of GOB lending on investment increases for unconstrained firms during the crisis
relative to normal times, which is quite likely because the crisis makes such firms more constrained.
However, for the firms that are already constrained, such firms may have little room to further
increase investment, showing no additional effects during the crisis. 18
In Panel C, we examine the incremental effect of GOB lending on high Q firms. Recall from
Table 4 that GOB lending had a stronger effect on high growth firms, consistent with efficiency
arguments. Here, we further investigate if this effect varies by credit constraints that a firm faces. First,
the incremental effect of GOB and Q is positive and significant for all sub-samples except for the low
leverage sub-sample, which provides a robustness test for our earlier results. Second, the incremental
effect of GOB is greater on high growth firms for several cases, – for firms with high RZ index, the
incremental effect is 0.67 versus 0.55 for low RZ firms. Similarly, we find larger incremental effects
for high leverage and low Z score firms.
In contrast, for non-keiretsu and small firms, we observe opposite effects where the incremental
effect is lower for large and keiretsu firms. However, the total effect of GOB lending is still larger for
non-Keiretsu firms and small firms, while the incremental effect for high growth firms is lower. For
example, for the non-Keirestu firms, the unconditional effect of GOB lending is 0.71 and the
incremental effect is 0.51, leading to a total incremental effect to be close to 1.2 that is much higher
than that for Keiretsu firms.
18 Virtually all the results in Panels A and B in Table 4 have been replicated using a single regression using interaction variables for combined sub-samples As we find consistent results, we choose a sub-sample presentation for the ease of interpretation. We apply Hausman test to investigate the statistical differences between the coefficients for different subsamples.

22
4.3.4 Impact of GOB lending on stock price performance
To further examine whether the increases in investments are efficient from a shareholder’s
perspective, we examine abnormal stock returns for firms that experience increases in GOB lending in
a given year. We use the calendar time-based regression approach to estimate abnormal return of
firms that receive increases in GOB lending. Because we cannot observe the announcement date of
the loan, we assume end of June of each year as the event date since most Japanese firms have fiscal-
year-end at end-March and accounting information from the previous fiscal year should be available
by end-June. For each month, we form a portfolio consisting of all firms that participated in the event
within the previous 1 year (3 years). We calculate the one month value-weighted (VW) and equally
weighted (EW) returns for the portfolio and repeat this for each month. Finally, we regress each
vector of one-month returns on the monthly Fama-French factors and examine the intercept.19
The results are reported in Panel A and B in Table 7. We find that none of the intercepts (alpha)
is significantly negative, suggesting that the shareholders are not negatively impacted by increases in
GOB lending. For the value weighted portfolio, we find positive abnormal returns from 0.3% to 0.7%
in three of the four regressions, whereas for the equally weighted portfolio, the abnormal returns are
generally zero. This suggests that larger firms derive greater benefits of increases in GOB lending.
4.4 Employment
In this subsection, we examine the effect of GOB lending on employment growth, using the
following empirical model.
Employment Growthi,t=α Government Owned Banki.t + βXi,t + γFi,t + vi + ut + ei,t (2)
Suffix i refers to firm i and t refers to fiscal year t. The dependent variable is the growth of total
employees from previous year. Vector X consists of non-financial factors including size, sales growth,
19 For June of each year from 1977 to 1997, we sorted all the stocks listed on the Tokyo Stock Exchange, excluding those of financial companies, into two groups according to the market value of their equity (small [S] and big [B]); we also classified them into three groups (low [L], medium [M], and high [H]) on the basis of their book-to-market ratios. We formed six portfolios (S/L, S/M, S/H, B/L, B/M, and B/H) from the intersections of the two size groups and the three book-to-market groups. We calculated monthly value-weighted returns on the six portfolios from July of year t to June of year t + 1 and rebalanced the portfolios in June of year t + 1. Our SMB portfolio equaled the monthly difference between the simple average returns on the S/L, S/M, and S/H portfolios and the simple average returns on the B/L, B/M, and B/H portfolios.

23
cash flow, ROA, and wage. Vector F consists of financial factors that include book leverage,
“Government Owned Bank”, and the interaction term between crisis dummy and “Government
Owned Bank”. The control variables are motivated by prior literature on firm-specific determinants of
employment (see Nickell and Nicolitsas, 1999, Sharpe, 1994). Similar to the investment equation
(Equation 1), vi is the firm fixed effect that controls for firm level heterogeneity, ut is the year fixed
effect, and ei,t is the idiosyncratic error.
Table 8 reports estimates from regressing employment on government owned bank loan dummy
and various control variables. Model (1) in Table 8 shows that the coefficient on the “government
owned bank” is positive and significant, suggesting that firms that receive increase in GOB lending
hire more people than non-supported firms. The coefficient estimate in Model (1) suggests that an
increase in the GOB lending of 1% of the firm’s capital results in an increase of approximately 0.13%
for employment growth. In contrast to the investment results (Table 3), the estimated coefficients on
interaction term between “government owned bank” and crisis dummy is insignificant, suggesting that
there is no incremental effect for government owned bank lending during crisis period.
Other control variables have signs consistent with prior literature. For example, Sharpe (1994)
showed that leverage is an important determinant of employment, as firms with high risk of financial
distress are likely to reduce employment growth. Consistent with this argument, we find higher
leverage is associated with lower employment growth. In Model (1) we also find that size and sales
growth have positive and significant effects on employment. Following Nickell and Nicolitsas (1999),
we also control for cash flow, ROA, and wage. We find firms that have higher cash flow and ROA
have higher employment growth. We also find a negative coefficient on the wage variable, which
implies higher staff costs reduce a firm’s incentive to hire.
Similar to the investment equation, we examine the impact of an increase in government owned
bank lending on employment growth by stratifying firms that experience a decrease in PB lending
(Model 3) and those that do not (Model 4). In contrast to the investment results, the firms that
experience a decrease in PB lending do not have any incremental employment effects during the crisis.

24
In fact, the marginal effect of GOB lending on employment is greater for firms do not experience a
decrease in PB lending.
Next, we examine the incremental impact of GOB lending by stratifying firms into constrained
and unconstrained firms. We present the results in Table 9. We find that the unconditional impact of
GOB lending for constrained and unconstrained firms is similar in magnitude, in contrast to the large
differences observed for investment (see Panel A). Also, consistent with the results in Table 6, the
marginal impact of GOB lending during the crisis is insignificant for almost all the measures with the
exception of leverage and Z-score size.
The above suggests that employment growth is not significantly enhanced by GOB lending, in
contrast to other literature that shows significant effects (Carvalho, 2010). One conjecture on the
cause of these results is that the Japanese firms (at least in this period) practiced lifetime employment
policies, due to which the incremental impact of GOB lending during the crisis is insignificant.
However, we leave investigation of this question to future research.
4.5 Endogeneity of increases in GOB lending
One concern about the empirical results documented so far is that the increases in GOB lending
may be endogenous to firms’ capital investment or employment growth. In particular, GOBs may
target firms that are perceived to have higher employment growth, or have higher investment to
capital ratio. Evidence based on countries other than Japan showed that GOBs tend to lend to
distressed and constrained borrowers. However, if GOBs in Japan have screening and monitoring
ability similar to private banks, our results might reflect better selection ability of GOBs. However,
some of our findings do not necessarily support this hypothesis. For example, the univariate statistics
in Table 1 suggest that GOBs in Japan increase lending to lower Q, higher leverage, lower cash flow
firms, lower cash, lower Z score firms, which are observably more credit constrained. Further, the
multivariate evidence generally supports the role of GOB lending in mitigation of credit constraints.
To examine the endogeneity problem, and to rule out the effects of selection ability, we use two

25
approaches – namely propensity score matching and GMM estimation using the Arellano-Bond
estimator to address selection problem and reverse causality concern.
4.5.1 Propensity score matching to account for endogeneity
We account for endogeneity in the increase in GOB lending by means of propensity score
matching, a methodology proposed by Heckman (1990) and Heckman, Ichimura and Todd (1997). In
this approach, each firm that receives an increase in GOB lending (treatment group) is matched with
another firm that was equally likely to have received an increase in GOB lending, but in fact did not
(the control group). The differences for the key variables (i.e., investment and employment growth) in
the two samples would reflect the treatment effect of an increase in GOB lending.
In the first stage, a logistic regression is conducted to compute the underlying probability of
being in the treatment group. Next, each observation in the treatment group is matched to another set
of observations that are in the control group that have an approximately equal likelihood of being in
the treatment group as the given observation itself, where the probabilities are based on covariation
with observable variables in this regression. In our model, for the first stage regression, we use firm
size, leverage, sales, ROA, size of GOB loans in the previous year, industry and year dummy
variables as predictors of a given firm’s likelihood of receiving an increase in GOB lending. Some of
these variables are also used in the investment and employment growth equations (Equations 1 and 2).
We include the Amakudari as an additional determinant in the first stage regression. “Amakudari”
is a practice to employ retired bureaucrats on the board of directors of Japanese private and public
corporations. Because retired bureaucrats can provide a channel to access critical information within
the government, “Amakudari” is viewed as a subtle area of contact between the government and the
private corporations. Consistent with this conjecture, prior studies document that “Amakudari
directors” help the firms to predict the government actions and facilitate transaction with government
(see Raj and Yamada, 2009; Horiuchi and Shimizu, 2001), which provide foundation for the argument
that “Amakudari” can proxy for the strength of the connection between government and firms. As
politically connected firms are more likely to be funded, we might expect that firms with more

26
“Amakudari directors” are able to get increases in lending from government owned banks. Meanwhile,
we can reasonably expect that there should be no direct relation between “Amakudari” and firm
investment (employment). Thus, we argue that “Amakudari” can be viewed as good instrument for
government owned bank lending that should be positive related to increases in GOB lending, but not
directly impacting firm investment or employment. We use the fraction of directors relative to the
total number of directors to account for the fact that larger boards may have larger number of ex-
bureaucrats.
Note that the propensity score matching does not require the presence of additional variable that
is uncorrelated with the investment, as the method assumes that the selection of treatment group is
based on observable characteristics. Using propensity scores to construct a matched sample of
treatment and control group observations, we calculate average differences between these two set of
observations for employment growth and investment to capital ratio. The results are reported in Table
10, which shows separate results for the entire period and for the crisis period. For the entire sample,
we find that firms that receive an increase in GOB lending have both greater investment to capital
ratio and employment growth compared to the control sample by 0.017 and 0.9%, respectively. A
similar result holds during the crisis, where the magnitude of the effect for investment is significantly
larger than the overall sample.
4.5.2 Arellano Bond estimation
Lastly, we further apply the Arrellano-Bond estimation method (1991) to rule out the potential
biases caused by the endogenous variables. The Arrellano-Bond (1991) GMM estimator allows for
more flexibility in specifying which variables are to be taken as endogenous or truly exogenous and to
assign appropriate instruments to endogenous variables. Moreover, the qualities of all the designations
can be tested by different standard tests and we can evaluate whether the variables of interest are
independent of the error term. The Arrellano-Bond (1991) method also enables us to take into account
the possible auto correlation in the dependent variables.

27
We designate firm size as truly exogenous and Tobin’s Q in previous year as predetermined. As
most of other independent variables can be potentially jointly determined with investment or
employment structure, we use a conservative approach and designate all other independent variables
as being endogenous. We use these variables, lagged 3 to lagged 6 periods, as instruments. We also
include “Amakudari” as an additional IV in the estimation.
The stability of our regression is evaluated in four tests. First, we test whether the idiosyncratic
disturbance is auto correlated at the second lag following Arrellano and Bond (1991). This test
enables us to justify the number of order in auto correlations. If the second order autocorrelation is
significant, the second lagged value of endogenous variables cannot be viewed as instruments because
the error terms will be correlated with the instruments. In such a case, we have to use the third lagged
value of the endogenous variables as instruments. Second, we examine the Hansen J-statistic of over
identification restrictions for all instruments. A significant J-statistic indicates improper
instrumentation for endogeneity. Third, we conduct test for the exogeneity of firm size, Tobin’s Q and
‘Amakudari.’ Lastly, we test for the exogeneity of difference of the additional instrumental variables.
We report the results of the four tests discussed here in a row titled “regression diagnostics" and
indicate each test is passed using “a,” “b,” “c,” and “d” in Table 10. Consistent with earlier
multivariate results, we find that an increase in GOB lending effectively stimulates firm investment
and employment. For the investment regression, we find that the effect of GOB lending is significant
only during crisis period. For employment, we find an insignificant result during the crisis, but a
significant result in normal times, similar to the panel regression results. The regression diagnostics
suggests that the instruments are valid as J-statistic for all instruments and additional instruments are
all insignificant.
4.5.3 Summary of results from endogeneity corrections
The results of this section broadly support the notion that GOB lending has positive effects on
investment. The results using the Arellano-Bond method suggest that the incremental effect for
investment exists only during the crisis, whereas the propensity score matching suggests that the GOB

28
lending effects exist both during crisis and normal periods. Taken together with our earlier panel
regression results, the above results confirm that investment is positively impacted by GOB lending
both during crisis and non-crisis periods, with strong evidence for incremental effects during crisis
periods.
For employment, our results using the propensity score matching method imply that there is GOB
effect on employment during the crisis, whereas the Arellano-Bond method does not indicate an
incremental effect. However, the results using the propensity score matching method imply there are
effects both in crisis and non-crisis periods. Therefore, the two different methods of endogeneity
correction show no clear differences in the effect of GOB lending on employment between crisis and
normal times
5 Conclusion
Using Japanese firm-level data that cover the period of the Japanese financial crisis in the 1990s,
we examine the determinants of GOB lending and their effects on corporate investment and
employment. Compared with previous studies that examined the impact of GOBs in emerging
markets, where GOBs often dominate the banking sector, our study examines a market where GOBs
co-exist with a developed private banking sector. During financial crisis, private banks are often
plagued by adverse incentives, such as hoarding liquidity, that cause the contraction of corporate
lending and increase credit rationing. It is well documented that Japanese commercial banks extended
loans to otherwise financially insolvent firms (i.e., zombie firms) to avoid realizing losses on their
balance sheets during the financial crisis. As Japanese GOBs (during our observation period) are
statutory institutions that are not subject to the same capital requirements and accounting standards as
private banks, they are free from such adverse incentives. Therefore, we might expect GOBs to play a
complementary role as “lender of last resort,” during financial crisis. Yet, GOBs can be still
influenced by political incentives.
Our findings shows that GOBs increase lending during crisis periods, particularly for firms that
are more likely to face financial constraints, rather than support otherwise financially insolvent firms.

29
Our tests further show that GOB lending has a positive and significant effect on investment during the
crisis, for more credit constrained firms, and for firms with higher growth prospects. Further, such
firms appear to have positive stock market performance. This shows that lending by GOBs can
enhance efficiency of the firm's investment by mitigating credit constraints. In contrast, we find
relatively small incremental effects of GOB lending on employment growth, both during crisis and
non-crisis periods.
There are a few caveats in understanding our results. To the extent that publicly traded firms
have access to several sources of financing, the results of this study are likely to provide a lower
bound on the potential benefits of GOB loans. On the other hand, Japanese GOBs are likely to possess
lending technologies that are similar to private banks. Therefore, our results might differ from direct
government loans such as those provided using TARP by the US government to operating companies
during the financial crisis. Further, to the extent that many companies in Japan have an implicit
lifetime employment guarantee for their employees, the findings here are likely to understate the
benefits of lending by GOBs in other economies such as the US where employers do not typically
have such implicit guarantees for employment. Lastly, since we do not have the terms of the loans
provided by government owned banks, we are unable to examine whether the strong economic effects
that we document are due to subsidized rates of these loans. Despite such caveats, our study provides
strong evidence of positive real impacts of GOB loans on firm activity, which appears that
government, at least in the context of Japan, achieves the general social objective of GOB lending,
namely increases investment and employment.

30
References Acharya, Viral V., Hyun Song Shin., Tanju Yorulmazer., 2011. Crisis Resolution and Bank Liquidity. Review of Financial Studies, 24, 2166–2205. Arellano, M., Bond, S.R., 1991.Some tests of specification for panel data: Monte Carlo evidence and an application to employment equations. Review of Economic Studies, 58, 277-297. Barth, James R., Gerard Caprio Jr., and Ross Levine., 1999. Financial regulation and performance. Working Paper. Washington DC: World Bank. Bebchuk ., Lucian., Goldstein, Itay., 2011. Self-Fulfilling Credit Market Freezes. Review of Financial Studies, 24, 3519-3555. Boot, Arnoud W., Anjan V. Thakor, 1991, Off-balance sheet liabilities, deposit insurance and capital regulation. Journal of Banking and Finance 15, 825-846. Caballero, R. J., Hoshi, T., and A. K. Kashyap., 2008. Zombie Lending and Depressed Restructuring in Japan. American Economic Review 98, 1943-1977. Campello, M., Giambona, E., Graham, J., Harvey, C., 2010. Liquidity management and corporate investment during a financial crisis. Review of Financial Studies, forthcoming. Carvalho, D.R., 2012. The real effect of government owned banks: Evidence from an emerging market. Journal of Finance, forthcoming. Chung, K.H., Pruitt, S.W., 1994. A simple approximation of Tobin’s q. Financial Management 23, 70-74. Diamond, D., W., Rajan, Raghuram., 2011. Illiquid Banks, Financial Stability, and Interest Rate Policy. NBER Working Papers. Dinc, S.I., 2005. Politicians and banks: political influence on government owned banks in emerging markets. Journal of Financial Economics 77, 453-479. Duygan-Bump, B., Levkov, A., Montoriol-Garriga, J., 2010. Financing constraints and unemployment: Evidence from Great Recession. Federal Reserve Bank of Boston Working Paper. Fazzari, S. M., R. G. Hubbard, and B. C. Petersen. 1988. Financing constraints and corporate investment. Brookings Papers on Economic Activity 1:141–95. ———. 2000. Investment-cash flow sensitivities are useful: A comment. Quarterly Journal of Economics 115, 695–705. Giannetti, M., Simonov, A., 2013. On the real effects of bank bailouts: Micro-evidence from Japan. American Economic Journal: Macroeconomics 5(1), 135-167. Goyal, Vidhan K., Yamada, Takeshi., 2004. Asset price shocks, financial constraint, and investment: Evidence from Japan. Journal of Business 77, 175-199. Heckman, J., 1990, Varieties of selection bias, American Economic Review, 80, 313-318. Heckman, J., Ichimura, H. and Todd, P., 1997. Matching as an econometric evaluation estimator: Evidence from evaluating a job training program, Review of Economic Studies, 64, 605-654.

31
Horuchi, A., Shimizu, K., 2001. Did Amakudari Undermine the Effectiveness of Regulator Monitoring in Japan, Journal of Banking and Finance, 25, 573-596 Horiuchi, A., Sui, Q.Y., 1993. Influence of the Japan Development Bank loans on corporate investment behavior. Working Paper. Hoshi, T., 2000. Naze Nihon wa Ryūdōsei no Wana kara Nogarerareainoka? (Why is the Japanese Economy Unable to Get Out of a Liquidity Trap?) in Mitsuhiro Fukao and Hiroshi Yoshikawa eds. Zero Kinri to Nihon Keizai (Zero Interest Rate and the Japanese Economy),Tokyo Nihon Keizai Shimbunsha. (in Japanese). Hoshi, T., A. K. Kashyap., 1990. Evidence of q and investment for Japanese firms. Journal of the Japanese and International Economies 4, 371–400. ———. 1999. The Japanese banking crisis: Where did it come from and how will it end? In NBER macroeconomics annual, ed. Ben Bernanke and Julio Rotemberg. Cambridge, MA: MIT Press. ———. 2001. Corporate Financing and Governance in Japan: The Road to the Future. Cambridge MA: MIT Press. ———. 2004. Japan’s Financial Crisis and Economic Stagnation. Journal of Economic Perspectives, 18, 3-26 . ———. 2010. "Will the U.S. bank recapitalization succeed? Eight lessons from Japan," Journal of Financial Economics 97, 398-417 Imai, M., 2009. Political determinants of government loans in Japan. Journal of Law and Economics 52, 41-70. Kang, J., R. M. Stulz, 2000. Do banking shocks affect borrowing firm performance? Journal of Business 73, 1–23. Khwaja, A.I., Mian, A.2008. Tracing the impact of banking liquidity shock: evidence from an emerging market. American Economics Review 98, 1413-1442. Krueger., Anne O., 1990. Government Failures in Development, Journal of Economic Perspectives 3, 9-23. La Porta, R., Lopez-de-Slianes, F., Shleifer, A., 2002. Government ownership of banks. Journal of Finance 57, 256-301. Mankiw, N.G., 1986.The Allocation of credit and financial collapse, Quarterly Journal of Economics
101, 455-470. Nickell, S., Nicolitsas, D., 1999. How does financial pressure affect firms? European Economic Review 43, 1435-1456. Raj, M., Yamada, T., 2009. Business and Government Nexus: Retired Bureaucrats in Corporate Boardrooms. Working paper. Rajan R., Zingales, L., 1998. Financial Dependence and Growth. American Economic Review 88, 559-86.

32
Sapienza, P., 2004.The effects of government ownership on bank lending. Journal of Financial Economics 72, 357-384. Sharpe, S.A., 1994. Financial market imperfections, firm leverage, and the cyclicality of employment. American Economics Review 84, 1060-1074. Shleifer, A., Vishny, R.W., 1994. Politicians and firms. Quarterly Journal of Economics 109, 995-1025. Stiglitz, J., A. Weiss, 1981. Credit rationing in markets with imperfect information. American Economic Review 71, 393-410. Stiglitz, J., 1989a, The Economic Role of the State, A. Heertje (ed.), Basil Blackwell and Bank Insinger de Beaufort NV, 9–85. Stiglitz, J., 1989b, Markets, Market Failures, and Development. The American Economic Review 79, 197-203.

33
Appendix - Definitions of variables
All variables are obtained from the Nikkei Needs database, except for the market value of equity, the stock return, and the Amakudari variable. The source of the data items is provided in their respective definitions. Book Leverage: Total Debt divided by Total Asset (FB067). Total Debt is defined as the sum of the following data items: We classify total debt into short term and long term. We define short term debt as the sum of the following: Short Term loans, bank overdraft and due loan within a year (FB074), Commercial Paper (FB075), Long term debt that matures within one year (FB076), Corporate Bonds and Convertible Bonds redeemable within one year (FB077), and Derivative Debt (FB0159). We define long term debt as the sum of the following data items: Corporate Bonds and Convertible Bonds with maturity more than one year (FB098), Long Term Loan (FB101) and Unconsolidated affiliate long term debt (FB102). Book to Market: The ratio of Book Value of Common Equity (FB126) in the previous fiscal year to Market Value of Common Equity (6 Month after filing date). Book Value of Common Equity is the sum of Book Common Equity and Deferred Taxes (FE019). Cash Flow: Net Income before extraordinary items and depreciation (FC029), scaled by capital (FB032) in the previous year. Cash by Asset: Amount of Cash available (FB003) scaled by Total Assets (FB067). Capital: Tangible Fixed Asset (FB032). Crisis: A dummy variable that takes a value of 1 for observations in years 1990-1994. Employment: Total Number Employees including part time employees of the firm at the end of the year (FE056). Investment: Changes in Tangible Fixed asset (FB032) plus depreciation (FE011). No. Amakudari/ No. Directors : The ratio of the number of Amakudari Directors to the total number of directors in the firm at the end of the given year. An Amakudari director is one who is a retired government bureaucrat appointed to the board of the company. The source of this data is Kigyo Keiretsu Soran published by Toyo Keizai. Quick Ratio: Ratio of current asset (FB068) to current liabilities (FB121). Rajan and Zingales (RZ) ratio: Investment minus cash flow from operations divided by capital expenditures. We first estimate the sum of the difference between investment and cash flow for each firm during the whole sample period (Investment – Cash flow). Then, we divide this total difference by the total investment by the given firm over the entire period. We compute the median of this ratio for all firms in the industry as the RZ ratio for the given firm. As computed above, positive values represent industries with high external finance requirements and negative value show industries that do not depend on external finance. ROA: Net Income (FC051) divided by Total Asset (FB067). Sales Growth: Sales in current year – Sales in previous year, scaled by the sales in the previous year. Data item for Sales is FC001.

34
Government owned bank: The net increase in government owned bank loan outstanding to a firm in the given year relative to the previous year divided by the total capital (FB032) in previous year. The total loans outstanding for government owned bank in each year is given by total lending by all institutions with financial institution code 299999, which corresponds to total lending by all government financial institutions. Stock Return: Annual return over the fiscal year, computed using PACAP data for the common equity of the firm. Tobin’s Q: the Market Value of Assets scaled by their replacement values. It is computed by taking the sum of Market Value of Common Equity, Value of preferred Stock (FB123), Long term debt, Short Term debt minus Current Assets, divided by Total Assets. See Total Asset: Total Asset (FB067) Wage: Labor Expenses (FE087) divided by total number of employees (FE056). Z Score: 3.3* Earnings before Interest and Taxes (FC051)/Total Assets (FB067) +1.2*(Current Asset (FB001) - Current Liability (FB121)) / Total Assets (FB067) +0.6* Market Value of Equity / Book Value of Total Liabilities (FB121) +1.4* Retain Earnings (FC059)/ Total Asset (FB067)+0.999* Sales (FC001)/ Total Assets (FB067).

35
Table 1
Summary Statistics Panel A reports the summary statistics of key variables for all observations during whole sample period. Panel B reports the summary statistics of variables for firm year observations with increases in government owned bank lending. Panel C reports the summary statistics of variables for firm year observations without increases in government owned bank lending. Investment is defined as changes in tangible fixed asset plus depreciation divided by total capital in the previous year. Government Owned Bank is defined as the net increase in government owned bank loan outstanding to a firm in the given year relative to the previous year divided by the total capital in previous year. Employment growth is the change in the total number of employees divided by number of total employees in the previous year. The sample period is from 1977 to 1996. Details of variable definitions are stated in the appendix. ***, ** and * indicate statistically significant at 1%, 5% and 10% level respectively.
Panel A – Overall Sample N Mean Std 25% 50% 75%
Investment 20441 0.085 0.182 -0.017 0.044 0.135 Employment growth (%) 20110 0.3 6.8 -0.24 0.15 2.89Government Owned Bank 20110 -0.0003 0.0218 -0.002 0 0 Total asset(×102 Billion) 22009 1.805 4.489 0.207 0.467 1.270 Cash flow 20441 0.330 0.634 0.075 0.188 0.404 Book leverage 22009 0.280 0.182 0.139 0.261 0.402
Cash by asset 22009 0.144 0.085 0.085 0.130 0.186 Sales growth 20441 0.057 0.164 -0.017 0.045 0.109 Tobin's Q 19076 1.009 0.788 0.559 0.834 1.229 Wage(million) 22009 2.785 2.224 1.187 2.056 3.779 Government Owned Bank Loans /Total loans 19992 0.0674 0.1420 0.0000 0.0072 0.0661 Z score 21890 2.6989 1.8149 1.6868 2.3116 3.1488 ROA 22009 0.021 0.027 0.009 0.019 0.034 Quick Ratio 22009 1.571 0.974 1.054 1.280 1.738

36
Table 1(continued)
Panel B – Observations with increase in government owned bank loan N Mean Std 25% 50% 75%
Investment 3350 0.110 0.181 0.012 0.070 0.150 Employment growth (%) 3350 0.5 6.5 -2 0.17 2.3 Government Owned Bank 3350 0.026 0.031 0.005 0.013 0.034Total asset(×102 Billion) 3350 4.117 7.402 0.367 1.082 4.037Cash flow 3350 0.212 0.319 0.038 0.117 0.286 Book leverage 3350 0.381 0.185 0.238 0.373 0.520
Cash by asset 3350 0.115 0.066 0.067 0.109 0.155 Sales growth 3350 0.068 0.157 -0.004 0.047 0.107 Tobin's Q 3032 0.930 0.630 0.562 0.820 1.138 Wage(million) 3350 2.982 2.452 1.193 2.103 4.085 Government Owned Bank Loans /Total loans 3350 0.155 0.173 0.038 0.093 0.215 Z score 3341 2.069 1.189 1.318 1.880 2.556 ROA 3350 0.016 0.021 0.007 0.014 0.025 Quick Ratio 3350 1.243 0.508 0.961 1.144 1.408
Panel C – Observations without increase in government owned bank loan N Mean Std 25% 50% 75%
Investment 17091 0.081 0.182 -0.022 0.037 0.131 Employment growth (%) 16760 0.3 6.9 -2.4 0.1 3.0 Government Owned Bank 16760 -0.006 0.015 -0.003 0.000 0.000 Total asset(×102 Billion) 18659 1.38 3.58 1.93 4.22 10.41 Cash flow 17091 0.353 0.676 0.086 0.204 0.425 Book leverage 18659 0.262 0.175 0.123 0.244 0.378
Cash by asset 18659 0.149 0.087 0.088 0.134 0.191 Sales growth 17091 0.055 0.165 -0.019 0.044 0.109 Tobin's Q 16044 1.024 0.813 0.558 0.838 1.248 Wage(million) 18659 2.750 2.179 1.184 2.050 3.724 Government Owned Bank Loans /Total loans 16642 0.050 0.128 0.000 0.001 0.036 Z score 18549 2.812 1.884 1.761 2.391 3.262 ROA 18659 0.022 0.028 0.009 0.020 0.035 Quick Ratio 18659 1.629 1.024 1.072 1.314 1.810

37
Table 1 (continued)
Panel D – Differences between firms with increases in Government Owned Bank lending and other
firms Difference in Mean Difference in Median
Investment 0.030*** 0.033*** Employment growth (%) 0.2*** 0.07*** Government Owned Bank 0.032*** 0.013*** Total asset(×102 Billion) 2.72*** 0.66*** Cash flow -0.141*** -0.087*** Book leverage 0.119*** 0.129***
Cash by asset -0.033*** -0.026*** Sales growth 0.013*** 0.003*** Tobin's Q -0.094*** -0.017*** Wage(million) 0.232*** 0.052*** Government Owned Bank Loans /Total loans
0.105*** 0.092***
Z score -0.75*** -0.510***
ROA -0.006**
-0.006** Quick Ratio -0.387*** -0.169**

38
Table 2
The determinants of increases in Government Owned Bank Lending
The dependent variable in column (1) in Panel A equals 1 if there is an increase in government owned bank loan outstanding to a firm in the given year relative to the previous year. The dependent variables in column (2), Panel A, and all specifications in panel B, is Government Owned Bank which is defined as the net increase in government owned bank loan outstanding to a firm in the given year relative to the previous year divided by the total capital in previous year. All panel B regressions include control variables from specification (2) of panel A which are not reported. Crisis is a dummy variable that takes a value of 1 for observations in years 1990 to 1994. The sample period for this table is from 1988 to 1996 due to the availability of zombie measure. See Appendix for a detailed definition of all variables. Standard errors are corrected for within-firm clustering and T statistics are reported in parentheses. ***, ** and * indicate statistically significant at 1%, 5% and 10 %level respectively.
Panel A (1) (2) PROBIT OLS
Crisis 0.277*** 0.004*** (8.504) (11.313)
Cash flow t-1 -0.458*** -0.001** (-4.656) (-2.410)
Sale growth t-1 0.108 0.001 (1.356) (1.092)
Size t-1 0.252*** 0.000 (13.232) (1.405)
Book leverage t-1 1.599*** -0.003 (10.186) (-1.625)
ROA t-1 4.850*** 0.018** (5.163) (2.109)
Keiretsu 0.058 -0.002*** (0.963) (-3.731)
Zombie -0.084 0.001 (-0.724) (0.465)
High RZ ratio 0.172*** 0.001*** (3.182) (2.977)
N 12264 12264
Panel B (1) (2) (3) (4)
Crisis× Cash flow t-1 -0.0004 (-0.119)
Crisis× Book leverage t-1 0.009*** (3.885)
Crisis× High RZ ratio 0.001 (1.006)
Crisis× Zombie -0.004** (-2.405)
N 12264 12264 12264 12264

39
Table 3
Government Owned Bank Effect on Investment
The dependent variable is the investment for firm i at year t, adjusted by the industry’s median investment in that year. All regressions include year, firm dummies and constant term. Investment is defined as changes in tangible fixed asset plus depreciation divided by total capital in the previous year. Government Owned Bank is defined as the net increase in government owned bank loan outstanding to a firm in the given year relative to the previous year divided by the total capital in previous year. Crisis is a dummy variable that takes a value of 1 for observations in years 1990 to 1994. The sample period is from 1977 to 1996. See Appendix for a detailed definition of all variables. Standard errors are corrected for within-firm clustering and T statistics are reported in parentheses. ***, ** and * indicate statistically significant at 1%, 5% and 10 %level respectively.
(1) (2) (3) (4) (5)
Private bank
lending decreases
Private bank
lending does not decrease
Government owned bank 0.973*** 0.862*** 0.839*** 0.548*** 0.942*** (8.840) (6.938) (6.835) (3.984) (5.454)
Government owned bank ×Crisis dummy 0.536** 0.510** 0.591** 0.356 (2.575) (2.427) (2.021) (1.240)
Tobin's Qt-1 0.031*** 0.031*** 0.031*** 0.025*** 0.032*** (6.169) (6.220) (6.531) (3.735) (4.253)
Cash flow 0.081*** 0.081*** 0.074*** 0.092*** 0.065*** (5.609) (5.615) (4.975) (3.347) (4.808)
Book leverage -0.064** -
0.147*** -0.005
(-2.550) (-4.674) (-0.144) Size 0.059*** 0.045*** 0.067***
(6.584) (3.806) (4.539) ROA 0.270** 0.184 0.583***
(2.445) (1.063) (3.503) N 17629 17629 17629 8246 9383
adj. R-sq 0.090 0.091 0.099 0.161 0.098
Firm and Year fixed effect YES YES YES YES YES

40
Table 4
Government Owned Bank Effect on Investment Sensitivity to Q and Cash flow
The dependent variable is the investment for firm i at year t, adjusted by the industrial median investment in that year. Investment is defined as changes in tangible fixed asset plus depreciation divided by total capital in the previous year. Government Owned Bank is defined as the net increase in government owned bank loan outstanding to a firm in the given year relative to the previous year divided by the total capital in previous year. Crisis is a dummy variable that takes a value of 1 for observations in years 1990 to 1994. Other Controls that are not reported in these regressions, but included in the estimation are :“Government owned bank”, Tobin’s Q, Cash flow, Book leverage, ROA and Size. In model 3, we also include “Government owned bank× Crisis dummy" and “Tobin’s Q× Crisis dummy” respectively as controls. In model 4, we include “Government owned bank× Crisis dummy" and “Cash flow× Crisis dummy”. All regressions include year dummies, firm dummy and a constant term. The sample period is from 1977 to 1996. Detailed variable definitions are provided in the appendix. Standard errors are corrected for within-firm clustering and. T statistics are reported in parentheses. ***, ** and * indicate statistically significant at 1%, 5% and 10% level respectively.
(1) (2) (3) (4) Government owned bank × Tobin's Qt-
1 0.670*** 0.760***
(8.318) (7.231) Government owned bank × Tobin's Qt-
1 × Crisis dummy -0.278
(-1.643)
Government owned bank × Cash flow -0.585*** -0.520***
(-5.364) (-4.584) Government owned bank × Cash flow×
Crisis dummy -0.366
(-0.891)
Other Controls YES YES YES YES N 17629 17629 17629 17629
adj. R-sq 0.102 0.100 0.103 0.101 Firm and Year fixed effect YES YES YES YES

41
Table 5
Government Owned Bank Effect on Investment: Zombies versus Non-Zombies
The dependent variable is the investment for firm i at year t, adjusted by the industrial median investment in that year. Investment is defined as changes in tangible fixed asset plus depreciation divided by total capital in the previous year. Government Owned Bank is defined as the net increase in government owned bank loan outstanding to a firm in the given year relative to the previous year divided by the total capital in previous year. Crisis is a dummy variable that takes a value of 1 for observations in years 1990 to 1994. The definition of zombies in column (1) and (2) follows Caballero et.al (2008). In columns (3) and (4), we define construction, wholesale, retail sale, real estate and service industry as zombie industries. All regressions include year dummies, firm dummy and a constant term. The sample period is from 1990 to 1996. Detailed variable definitions are provided in the appendix. Standard errors are corrected for within-firm clustering and. T statistics are reported in parentheses. ***, ** and * indicate statistically significant at 1%, 5% and 10% level respectively.
(1) (2) (3) (4)
Non- Zombies Zombies Non- Zombie Industry
Zombie Industry
Government owned bank
0.607** 5.215 0.802*** 0.280
(2.292) (0.693) (2.844) (0.590) Government owned bank
×Crisis dummy
0.743** -4.777 0.645* 0.811 (2.390) (-0.702) (1.940) (1.411)
Cash flow 0.082*** 0.035*** 0.158*** 0.044** (3.167) (3.132) (4.006) (2.124)
Q 0.027*** -0.057 0.013 0.039** (2.679) (-0.917) (1.471) (1.990)
N 7176 517 5748 1945 adj. R-sq 0.134 -0.017 0.129 0.092
Firm and Year fixed effect
YES YES YES YES

42
Table 6
Government Owned Bank Effect on Investment for financially constrained firms
The dependent variable is the investment for firm i at year t, adjusted by the industrial median investment in that year. Investment is defined as changes in tangible fixed asset plus depreciation divided by total capital in the previous year. Government Owned Bank is defined as the net increase in government owned bank loan outstanding to a firm in the given year relative to the previous year divided by the total capital in previous year. Crisis is a dummy variable that takes a value of 1 for observations in years 1990 to 1994. Other Controls in Table 2 are used in all estimations but not reported to conserve space. The sample period is from 1977 to 1996. Detailed variable definitions are provided in the appendix. We apply Hausman test to investigate the differences between coefficients for sub-samples. Standard errors are corrected for within-firm clustering and .T statistics are reported in parentheses. ***, ** and * indicate statistically significant at 1%, 5% and 10% level respectively. Panel A –Overall effect
Keiretsu Non-Keiretsu
Low RZ High RZ Low Leverage
High Leverage
Low Z score
High Small firm
Large Firm
Government owned bank
0.691*** 1.209*** 0.726*** 1.197*** 0.518*** 1.076*** 1.045*** 0.742*** 1.474*** 0.631***
(8.440) (15.151) (8.315) (15.543) (4.161) (16.342) (13.344) (8.087) (13.571) (9.758) Other Controls YES YES YES YES YES YES YES YES YES YES
N 4356 13100 8756 8873 8502 9127 8177 9452 8064 9565 adj. R-sq 0.098 0.104 0.089 0.111 0.129 0.113 0.093 0.141 0.109 0.119
Firm and Year fixed effect
YES YES YES YES YES YES YES YES YES YES
Constraint-Unconstraint
0.518*** 0.471*** 0.558*** 0.303*** 0.843***

43
Panel B – Effect of GOB during crisis Keiretsu Non-
Keiretsu Low RZ High RZ Low
LeverageHigh
Leverage Low High Small
firm Large Firm
Government owned bank
0.571*** 1.129*** 0.582*** 1.143*** 0.285 1.047*** 1.070*** 0.490*** 1.450*** 0.493***
(3.322) (7.124) (3.699) (6.266) (1.594) (6.857) (6.008) (3.016) (11.766) (6.853) Government owned
bank ×Crisis dummy 0.611** 0.370 0.686** 0.259 1.333*** 0.134 -0.129 1.139*** 0.109 0.690*** (2.178) (1.264) (2.148) (0.950) (3.574) (0.561) (-0.467) (3.355) (0.421) (4.316)
Other Controls YES YES YES YES YES YES YES YES YES YES N 4356 13100 8756 8873 8502 9127 8177 9452 8064 9565
adj. R-sq 0.100 0.105 0.090 0.111 0.131 0.113 0.093 0.143 0.109 0.121 Firm and Year fixed
effect YES YES YES YES YES YES YES YES YES YES
Constraint-Unconstraint 0.558*** 0.561*** 0.762*** 0.58*** 0.957*** Constraint-Unconstraint
(Interact terms) -0.241*** -0.427** -0.427*** -1.268*** -0.581***
Panel C – Effect of GOB on high growth firms
Keiretsu Non-Keiretsu
Low RZ High RZ Low Leverage
High Leverage
Low High Small firm
Large Firm
Government owned bank
0.090 0.710*** 0.362*** 0.476*** 0.295 0.509*** 0.365*** 0.273** 1.192*** 0.085
(0.728) (5.499) (2.841) (3.608) (1.504) (5.027) (2.719) (2.045) (6.386) (0.877) Government owned
bank × Q 0.869*** 0.512*** 0.554*** 0.674*** 0.266 0.662*** 0.881*** 0.517*** 0.249* 0.797*** (6.487) (4.924) (3.933) (6.728) (1.473) (7.360) (6.226) (4.840) (1.861) (7.554)
Other Controls YES YES YES YES YES YES YES YES YES YESN 4356 13100 8756 8873 8502 9127 8177 9452 8064 9565
adj. R-sq 0.107 0.106 0.091 0.116 0.129 0.119 0.097 0.143 0.110 0.125 Firm and Year fixed
effect YES YES YES YES YES YES YES YES YES YES
Constraint-Unconstraint
0.620*** 0.114*** 0.214 0.092*** 1.107***
Constraint-Unconstraint
(Interact terms)
-0.357*** 0.120 0.396*** 0.364*** -0.548***

44
Table 7
Impact of Government Owned Bank Lending on Firm Performance Panels A(B) report the Calendar time-based regressions of one (three) year long-run stock return performance of firms that experience increases in government owned bank lending. Detailed variable definitions are provided in the appendix. ***, ** and * indicate statistically significant at 1%, 5% and 10%level respectively. T statistics are reported in parentheses. Panel A: Abnormal returns (1 Year)
Non-crisis period Crisis period Non-crisis period Crisis period EW EW VW VW
Intercept -0.0001 0.002 0.006*** 0.003 (-0.09) (1.44) (3.07) (1.57)
RMRF 0.973*** 1.04*** 0.973*** 1.008*** (27.12) (33.97) (22.51) (27.03)
SMB 0.549*** 0.347*** -0.174*** -0.196*** (13.36) (6.61) (-3.35) (-3.07)
HML 0.076 -0.146 -0.002 -0.181 (1.414) (1.16) (-0.03) (-0.12)
N 168 60 168 60 adj. R-sq 0.839 0.96 0.77 0.92
Panel B: Abnormal returns (3 Year)
Non-crisis period Crisis period Non-crisis period Crisis period EW EW VW VW
Intercept 0.0001 0.002 0.007*** 0.003* 0.09 (1.35) (3.89) (1.67)
RMRF 0.992*** 1.039*** 0.987*** 1.006*** (29.29) (36.43) (25.81) (28.06)
SMB 0.568*** 0.363*** -0.198*** -0.185*** (14.15) (7.43) (-4.27) (3.02)
HML 0.086* -0.134 0.0205 -0.005 (1.60) (1.15) (0.33) (-0.04)
N 168 60 168 60 adj. R-sq 0.85 0.97 0.82 0.94

45
Table 8
Government Owned Bank Effect on Employment Growth
The dependent variable is the employment growth for firm i at year t, adjusted by industrial median employment growth. The definition of employment includes temporary employee and full time employees. Government Owned Bank is defined as the net increase in government owned bank loan outstanding to a firm in the given year relative to the previous year divided by the total capital in previous year. Crisis is a dummy variable that takes a value of 1 for observations in years 1990 to 1994. The sample period is from 1977 to 1996. Detailed variable definitions are provided in the appendix. Standard errors are corrected for within-firm clustering and .T statistics are reported in parentheses. ***, ** and * indicate statistically significant at 1%, 5% and 10% level respectively.
(1) (2) (3) (4)
Private bank lending decreases
Private bank lending does not
decrease Government owned
bank 0.133*** 0.151*** 0.101** 0.154***
(5.261) (5.009) (2.206) (3.471) Government owned
bank ×Crisis dummy -0.090 -0.002 -0.152 (-1.464) (-0.020) (-1.526)
Book leverage -0.055*** -0.055*** -0.072*** -0.043*** (-6.093) (-6.071) (-5.642) (-3.405)
Size 0.012*** 0.012*** 0.011** 0.011*** (4.032) (4.065) (2.568) (2.755)
Sales growth 0.058*** 0.058*** 0.050*** 0.058*** (9.374) (9.361) (5.868) (7.135)
Cash flow 0.012*** 0.012*** 0.016*** 0.010*** (4.380) (4.379) (4.079) (2.851)
ROA 0.284*** 0.285*** 0.233*** 0.401*** (7.778) (7.792) (4.180) (6.827)
Wage -0.009*** -0.009*** -0.009*** -0.009*** (-7.086) (-7.060) (-4.924) (-5.027)
N 20110 20110 9443 10667 adj. R-sq 0.189 0.189 0.221 0.189
Firm and Year fixed effect
YES YES YES YES

46
Table 9
Government Owned Bank Effect on Employment Growth by firm characteristics
The dependent variable is the employment growth for firm i at year t, adjusted by industrial median employment growth. The definition of employment includes temporary employee and full time employees. Government Owned Bank is defined as the net increase in government owned bank loan outstanding to a firm in the given year relative to the previous year divided by the total capital in previous year. Crisis is a dummy variable that takes a value of 1 for observations in years 1990 to 1994. Detailed variable definitions are provided in the appendix. Other control variables used in Table 6 are used in the estimation but not reported to conserve space. The sample period is from 1977 to 1996. We apply Hausman test to investigate the differences between coefficients for sub-samples. Standard errors are corrected for within-firm clustering and .T statistics are reported in parentheses. ***, ** and * indicate statistically significant at 1%, 5% and 10% level respectively. Panel A
Keiretsu Non-Keiretsu Low RZ High RZ Low Leverage
High Leverage
Low High Small firm
Large Firm
Government owned bank 0.137*** 0.125*** 0.136*** 0.127*** 0.053 0.151*** 0.127*** 0.129*** 0.144*** 0.115*** (4.409) (4.813) (4.973) (4.400) (1.444) (6.081) (4.759) (4.118) (4.330) (4.735)
Other Controls YES YES YES YES YES YES YES YES YES YES N 4578 15342 10438 9672 9985 10125 9814 10296 9892 10218
adj. R-sq 0.141 0.204 0.213 0.166 0.226 0.184 0.189 0.215 0.197 0.197 Firm and Year fixed effect YES YES YES YES YES YES YES YES YES YES Constraint-Unconstraint -0.012 -0.009 0.098*** -0.002 0.029
Panel B
Keiretsu Non-Keiretsu
Low RZ High RZ Low Leverage
High Leverage
Low High Small firm
Large Firm
Government owned bank 0.137*** 0.150*** 0.168*** 0.133*** 0.059 0.175*** 0.150*** 0.128*** 0.160*** 0.133*** (2.855) (3.895) (4.089) (3.000) (1.210) (4.489) (3.583) (2.938) (4.280) (4.940)
Government owned bank ×Crisis dummy
-0.003 -0.120 -0.166* -0.029 -0.036 -0.115 -0.120 0.004 -0.076 -0.095 (-0.035) (-1.576) (-1.804) (-0.355) (-0.393) (-1.537) (-1.336) (0.041) (-0.944) (-1.556)
Other Controls YES YES YES YES YES YES YES YES YES YES N 4578 15342 8769 8860 9985 10125 9814 10296 9892 10218
adj. R-sq 0.141 0.205 0.117 0.097 0.226 0.184 0.189 0.215 0.197 0.197Firm and Year fixed
effect YES YES YES YES YES YES YES YES YES YES
Constraint-Unconstraint 0.013 -0.035** 0.116*** 0.022* 0.027 Constraint-Unconstraint
(Interaction term) -0.117 0.137 -0.079 -0.124 0.019
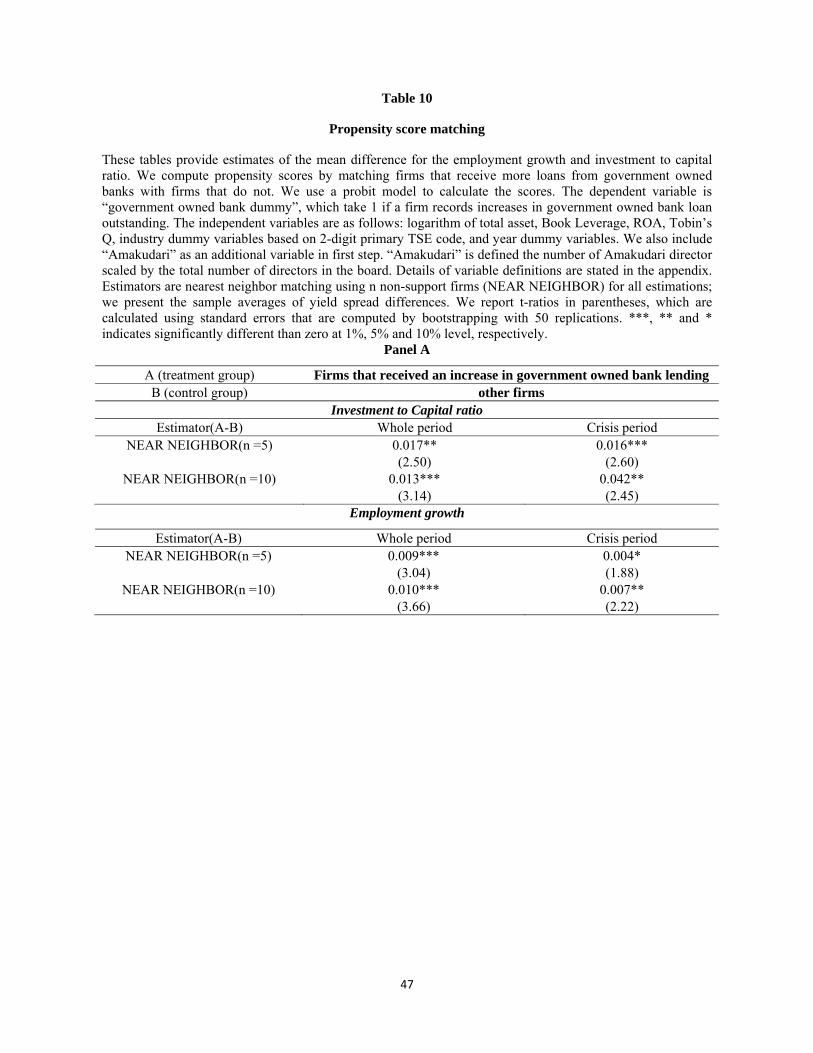
47
Table 10
Propensity score matching
These tables provide estimates of the mean difference for the employment growth and investment to capital ratio. We compute propensity scores by matching firms that receive more loans from government owned banks with firms that do not. We use a probit model to calculate the scores. The dependent variable is “government owned bank dummy”, which take 1 if a firm records increases in government owned bank loan outstanding. The independent variables are as follows: logarithm of total asset, Book Leverage, ROA, Tobin’s Q, industry dummy variables based on 2-digit primary TSE code, and year dummy variables. We also include “Amakudari” as an additional variable in first step. “Amakudari” is defined the number of Amakudari director scaled by the total number of directors in the board. Details of variable definitions are stated in the appendix. Estimators are nearest neighbor matching using n non-support firms (NEAR NEIGHBOR) for all estimations; we present the sample averages of yield spread differences. We report t-ratios in parentheses, which are calculated using standard errors that are computed by bootstrapping with 50 replications. ***, ** and * indicates significantly different than zero at 1%, 5% and 10% level, respectively.
Panel A
Employment growth
A (treatment group) Firms that received an increase in government owned bank lending B (control group) other firms
Investment to Capital ratio Estimator(A-B) Whole period Crisis period
NEAR NEIGHBOR(n =5) 0.017** 0.016*** (2.50) (2.60)
NEAR NEIGHBOR(n =10) 0.013*** 0.042** (3.14) (2.45)
Estimator(A-B) Whole period Crisis period NEAR NEIGHBOR(n =5) 0.009*** 0.004*
(3.04) (1.88) NEAR NEIGHBOR(n =10) 0.010*** 0.007**
(3.66) (2.22)
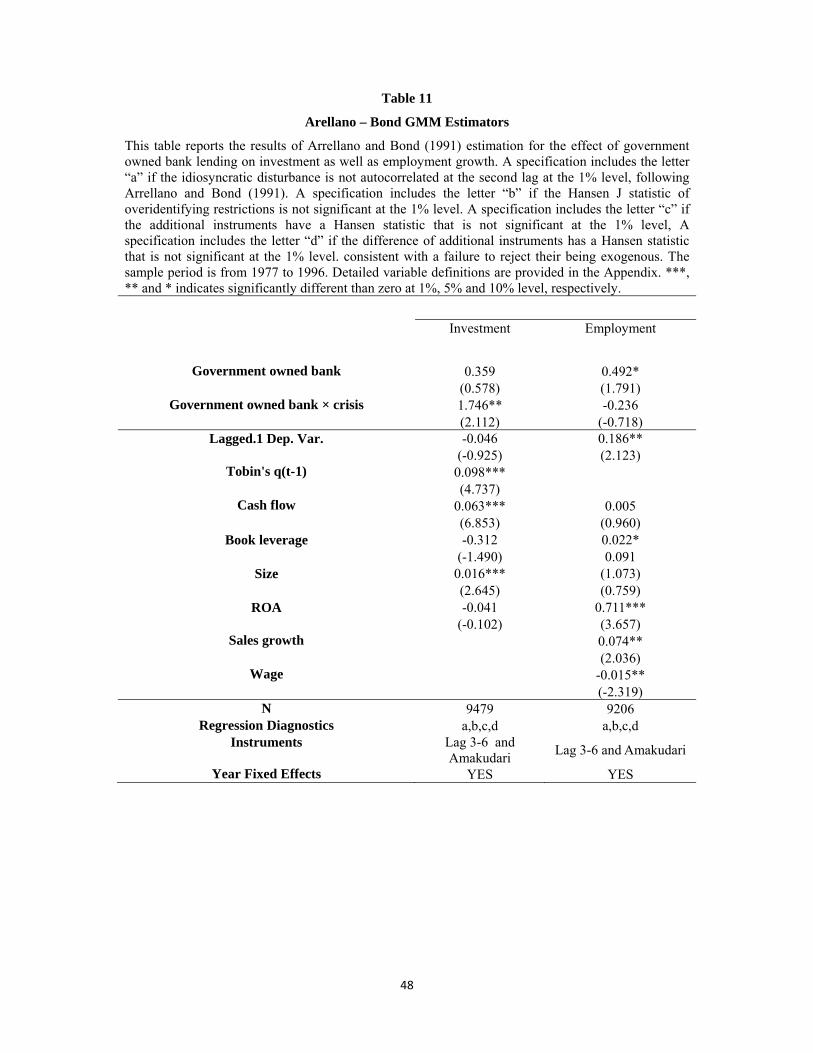
48
Table 11
Arellano – Bond GMM Estimators
This table reports the results of Arrellano and Bond (1991) estimation for the effect of government owned bank lending on investment as well as employment growth. A specification includes the letter “a” if the idiosyncratic disturbance is not autocorrelated at the second lag at the 1% level, following Arrellano and Bond (1991). A specification includes the letter “b” if the Hansen J statistic of overidentifying restrictions is not significant at the 1% level. A specification includes the letter “c” if the additional instruments have a Hansen statistic that is not significant at the 1% level, A specification includes the letter “d” if the difference of additional instruments has a Hansen statistic that is not significant at the 1% level. consistent with a failure to reject their being exogenous. The sample period is from 1977 to 1996. Detailed variable definitions are provided in the Appendix. ***, ** and * indicates significantly different than zero at 1%, 5% and 10% level, respectively.
Investment Employment
Government owned bank 0.359 0.492* (0.578) (1.791)
Government owned bank × crisis 1.746** -0.236 (2.112) (-0.718)
Lagged.1 Dep. Var. -0.046 0.186** (-0.925) (2.123)
Tobin's q(t-1) 0.098*** (4.737)
Cash flow 0.063*** 0.005 (6.853) (0.960)
Book leverage -0.312 0.022* (-1.490) 0.091
Size 0.016*** (1.073) (2.645) (0.759)
ROA -0.041 0.711*** (-0.102) (3.657)
Sales growth 0.074** (2.036)
Wage -0.015** (-2.319)
N 9479 9206 Regression Diagnostics a,b,c,d a,b,c,d
Instruments Lag 3-6 and Amakudari
Lag 3-6 and Amakudari
Year Fixed Effects YES YES

49
Figure 1 Capital Investment and Employment Growth.
Investment is defined as changes in tangible fixed asset plus depreciation divided by total capital in the previous year. The definition of employment includes temporary employee and full time employees. The following graph plots the median value of investment and of employment growth for each year for publicly traded firms in our sample.
Figure 2
Government Owned Bank Lending and Private Bank Lending Aggregate corporate loan outstanding from private banks and government owned banks during 1979 to 1996 in for Japan. Source: Flow of Funds, The Bank of Japan.
‐0.04
‐0.02
0
0.02
0.04
0.06
0.08
0.1
0.12
0.14
1978
1979
1980
1981
1982
1983
1984
1985
1986
1987
1988
1989
1990
1991
1992
1993
1994
1995
1996
INVESTMENT TO CAPITAL RATIO EMPLOYMENT GROWTH

50
Figure 3 Time series patter of Government Owned Bank lending
This figure plots the time series pattern of increases in government owned bank lending (mean value million Yen) of the firm (right axis) and the total number of firms in a given year that receive an increases in GOB lending based on our data sample of publicly traded firms. .
‐200000
‐100000
0
100000
200000
300000
400000
500000
PRIVATE LOAN GOVERNMENT LOAN
0
0.05
0.1
0.15
0.2
0.25
0.3
‐400
‐200
0
200
400
600
800
INCREASE IN GOB LENDING(MEAN) % FIRM WITH INCREASE IN GOB LENDING

51
Figure 4 Government Owned Bank loan and Private Bank loan
Corporate loan outstanding from private banks and government owned banks for listed firms in our sample.
Figure 5 Correlation between Government Owned Bank lending and Private Bank Lending
The following graph depicts the cross-sectional correlation between increases in lending from government owned banks loans and increases in lending by private banks for publicly traded firms in our sample.
70%
75%
80%
85%
90%
95%
100%
PRIVATEBANKLOAN GOVERNMENTOWNEDBANKLOAN
‐0.4
‐0.2
0
0.2
0.4
0.6
0.8
CORRELATION BETWEEN GOVERNMENT OWNED BANK LENDING AND PRIVATE BANK LENDING

52