The BLUES Project - The University of Tennessee Health ... Blues Project.pdf · The BLUES Project...
28
The BLUES Project: Targeting Social Determinants of Health to Address the City’s High Infant Death Rate Kimberly Lamar, PhD PI/Program Director The University of Tennessee Health Science Center Department of Preventive Medicine © Copyright 2010, The Blues Project All Rights Reserved; Research currently under peer review for publication
Transcript of The BLUES Project - The University of Tennessee Health ... Blues Project.pdf · The BLUES Project...
The BLUES Project: Targeting Social Determinants of Health to Address
the City’s High Infant Death Rate
Kimberly Lamar, PhDPI/Program Director
The University of Tennessee Health Science CenterDepartment of Preventive Medicine
©Copyright 2010, The Blues Project All Rights Reserved; Research currently under peer review for publication
Presentation OverviewPresentation Overview
� History of the BLUES Project
� Overview of infant mortality in Tennessee
� The BLUES Project intervention� The BLUES Project intervention
� Outcomes of the BLUES Project in Shelby County
� Future directions and program expansion
The BLUES ProjectThe BLUES Project
• The Blues Project (BLUES) is a collaborative effort with researchers at the University of Tennessee Health Science Center and BlueCross BlueShield of Tennessee to impact the high infant mortality rate in Memphis, TN.
• Designed initially to be clinic/site-based alternative to Nurse Home Visitation Programs.Programs.
• Since 2005, the BLUES model has matured to be an evidence-based, holistic approach to delivery of health services and for addressing health disparities.
• Our goal is to help families have full term, healthy babies, assist parents in developing their own support systems, and empower mothers AND fathers to set and achieve attainable life goals.
• BLUES address health, social, behavioral and environmental risk factors for infant mortality, maternal and child health outcomes.
Infant Mortality Infant Mortality -- TennesseeTennessee
� The infant mortality rate (IMR) is the number of deaths of infants under one year of age per 1,000 live births in a given population.
� IMR is used to compare the health and well-being of populations across and within countries.
� In 2006, Tennessee’s IMR was ranked 45th in the nation (8.7 per 1,000 live births), with only five states having higher infant death rates.
� In 2006, the black infant death rate (16.8 per 1, 000 live births) was 2.5 times the rate for white babies (6.6 per 1,000 live births)
� In 2007, 718 babies born in Tennessee died before their first birthdays.
*Source: Tennessee Department of Health; Infant Mortality in Tennessee: 1997-2006.
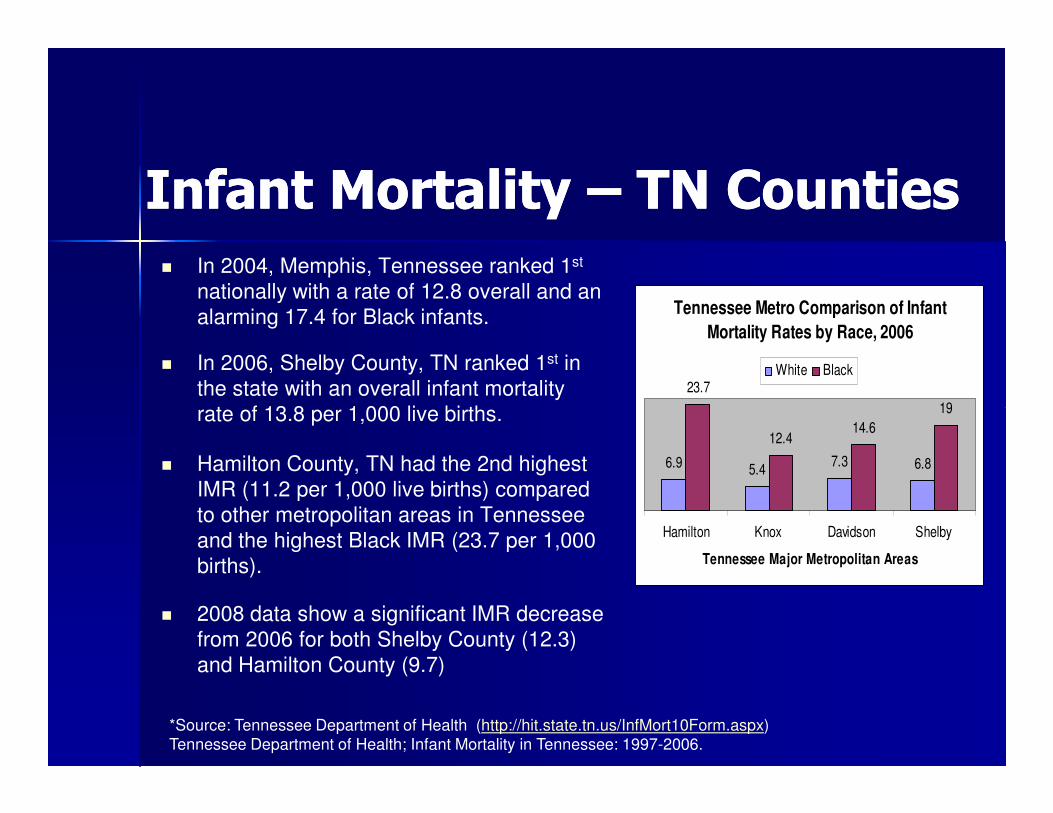
Infant Mortality Infant Mortality –– TN CountiesTN Counties� In 2004, Memphis, Tennessee ranked 1st
nationally with a rate of 12.8 overall and an alarming 17.4 for Black infants.
� In 2006, Shelby County, TN ranked 1st in the state with an overall infant mortality rate of 13.8 per 1,000 live births.
Tennessee Metro Comparison of Infant
Mortality Rates by Race, 2006
23.7
19
White Black
rate of 13.8 per 1,000 live births.
� Hamilton County, TN had the 2nd highest IMR (11.2 per 1,000 live births) compared to other metropolitan areas in Tennessee and the highest Black IMR (23.7 per 1,000 births).
� 2008 data show a significant IMR decrease from 2006 for both Shelby County (12.3) and Hamilton County (9.7)
6.9 5.47.3 6.8
12.414.6
19
Hamilton Knox Davidson Shelby
Tennessee Major Metropolitan Areas
*Source: Tennessee Department of Health (http://hit.state.tn.us/InfMort10Form.aspx)Tennessee Department of Health; Infant Mortality in Tennessee: 1997-2006.
Infant Mortality – Risk Factors
� Prematurity (<37 weeks gestation) and Low birth weight (LBW<2500 grams) are major causes of infant mortality (IM)1.
� IM strongly associated with various maternal socioeconomic, environmental and behavioral risk factors2,3.
� Poverty
� Minority race/ethnicity
� Low parental education
� Single parent households
1Abel MH, Low birth weight and interactions between traditional risk factors. The Journal of Genetic Psychology, 2001. 158(4): p. 443-456.
2Leslie, J.C., et al., Infant mortality, low birth weight, and prematurity among Hispanic, white, and African American women in North Carolina. Am J Obstet Gynecol, 2003. 188(5): p. 1238-40.
3Cramer, J.C., Social factors and infant mortality: identifying high-risk groups and proximate causes. Demography, 1987. 24(3): p. 299-322.
The BLUES InterventionThe BLUES Intervention
• The BLUES Model is 3-fold :
• Health
• Social Support
• Community Outreach
• BLUES offers:
1. Immediate access to prenatal and continued care for mom and baby for the insured and uninsured.
2. Prenatal and Postnatal education
3. Individualized case management
4. Support and Empowerment
5. Family planning (BIRTH SPACING)
6. Information to help moms and dads continue their education and secure employment
7. Referrals to community resources and services
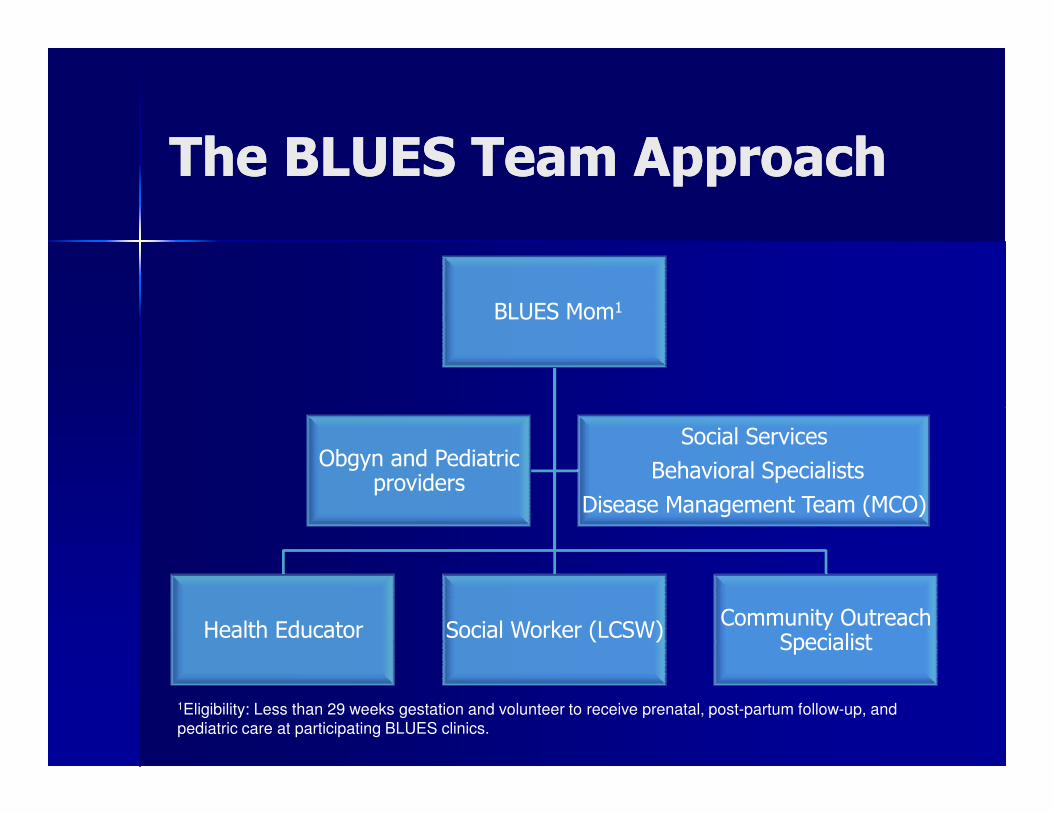
The BLUES Team ApproachThe BLUES Team Approach
BLUES Mom1
Health Educator Social Worker (LCSW)Community Outreach
Specialist
Obgyn and Pediatric providers
Social Services
Behavioral Specialists
Disease Management Team (MCO)
1Eligibility: Less than 29 weeks gestation and volunteer to receive prenatal, post-partum follow-up, and pediatric care at participating BLUES clinics.
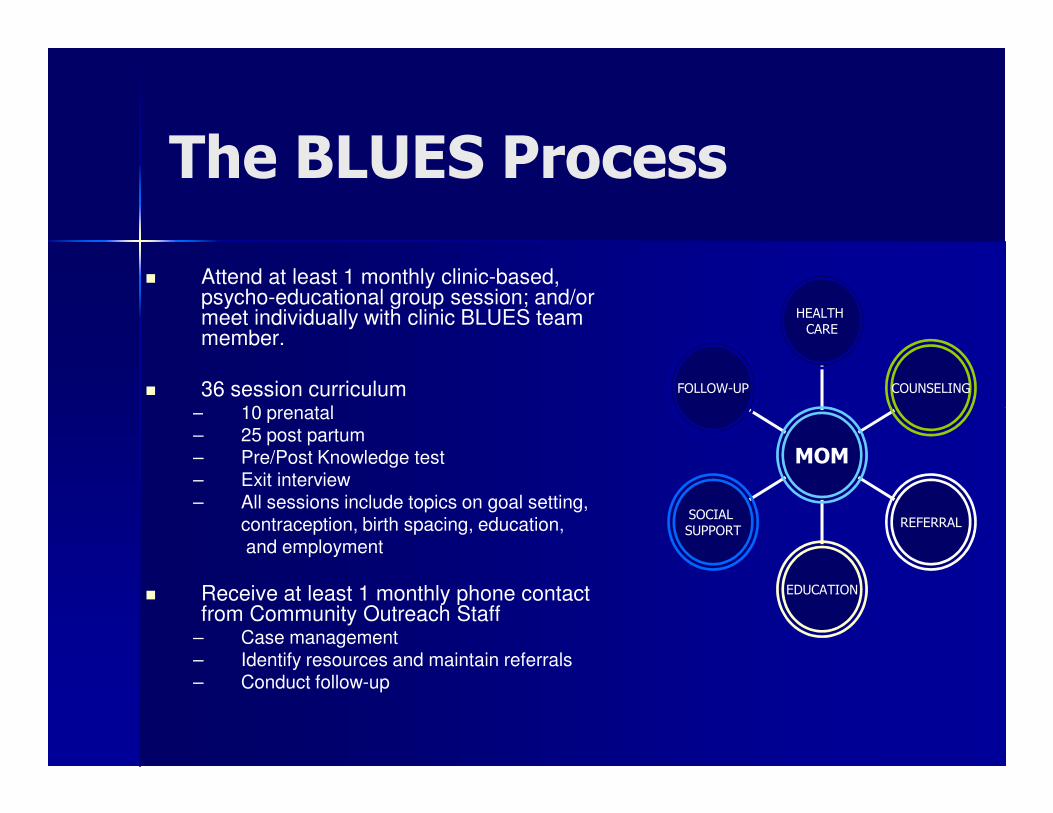
The BLUES Process
� Attend at least 1 monthly clinic-based, psycho-educational group session; and/or meet individually with clinic BLUES team member.
� 36 session curriculum– 10 prenatal
FOLLOW-UP COUNSELING
HEALTH CARE
– 10 prenatal– 25 post partum– Pre/Post Knowledge test– Exit interview– All sessions include topics on goal setting,
contraception, birth spacing, education,and employment
� Receive at least 1 monthly phone contact from Community Outreach Staff
– Case management– Identify resources and maintain referrals– Conduct follow-up
SOCIAL SUPPORT
EDUCATION
REFERRAL
MOM
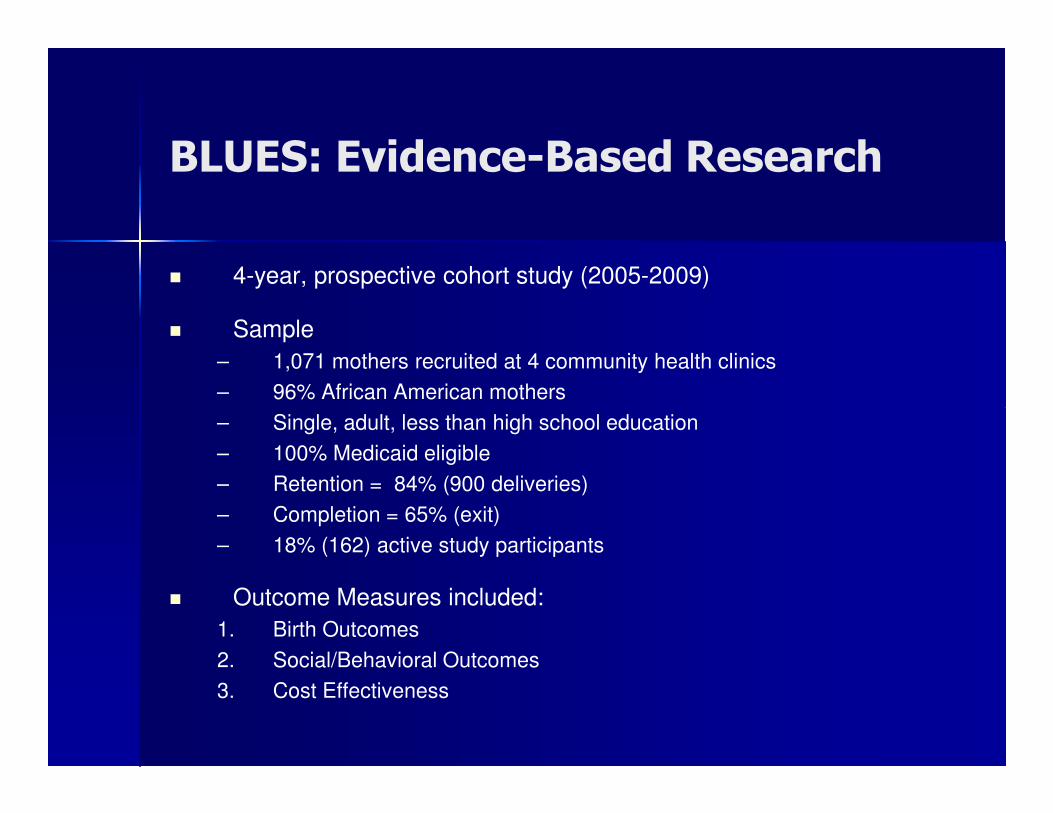
BLUES: Evidence-Based Research
� 4-year, prospective cohort study (2005-2009)
� Sample
– 1,071 mothers recruited at 4 community health clinics
– 96% African American mothers
– Single, adult, less than high school education
– 100% Medicaid eligible
– Retention = 84% (900 deliveries)
– Completion = 65% (exit)
– 18% (162) active study participants
� Outcome Measures included:
1. Birth Outcomes
2. Social/Behavioral Outcomes
3. Cost Effectiveness
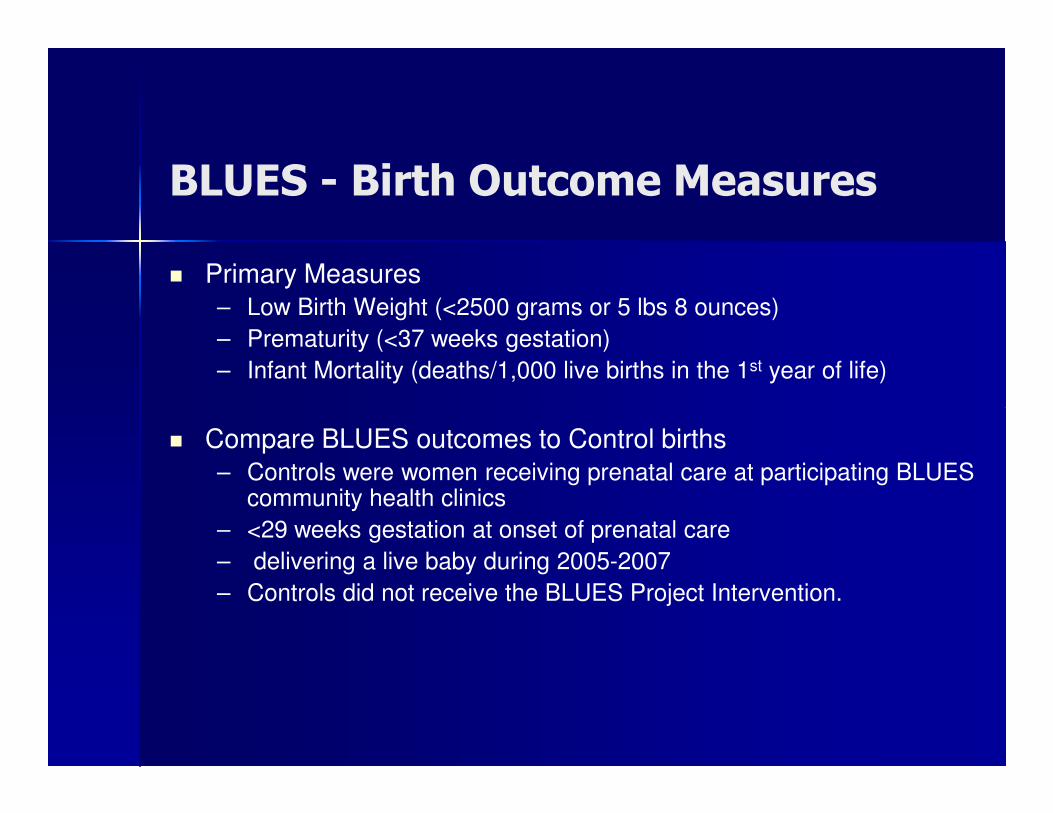
BLUES - Birth Outcome Measures
� Primary Measures– Low Birth Weight (<2500 grams or 5 lbs 8 ounces)
– Prematurity (<37 weeks gestation)
– Infant Mortality (deaths/1,000 live births in the 1st year of life)
� Compare BLUES outcomes to Control births– Controls were women receiving prenatal care at participating BLUES
community health clinics
– <29 weeks gestation at onset of prenatal care
– delivering a live baby during 2005-2007
– Controls did not receive the BLUES Project Intervention.
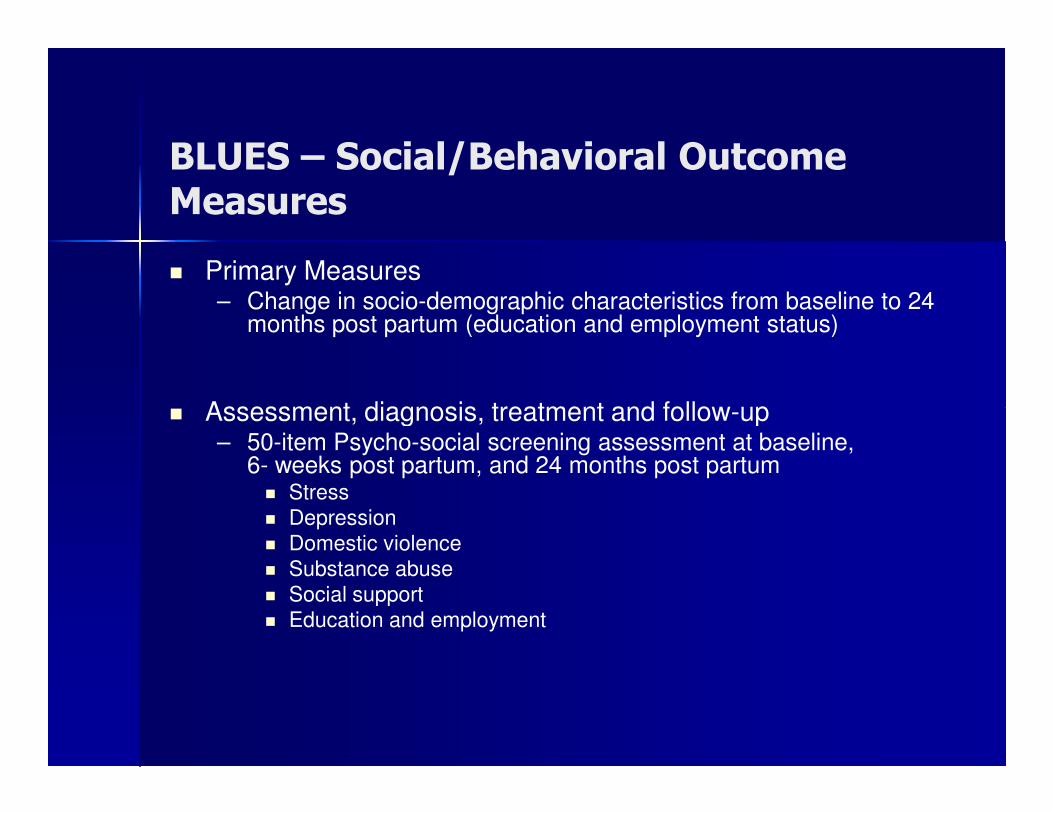
BLUES – Social/Behavioral Outcome Measures
� Primary Measures– Change in socio-demographic characteristics from baseline to 24
months post partum (education and employment status)
� Assessment, diagnosis, treatment and follow-up� Assessment, diagnosis, treatment and follow-up– 50-item Psycho-social screening assessment at baseline,
6- weeks post partum, and 24 months post partum� Stress� Depression� Domestic violence � Substance abuse � Social support � Education and employment
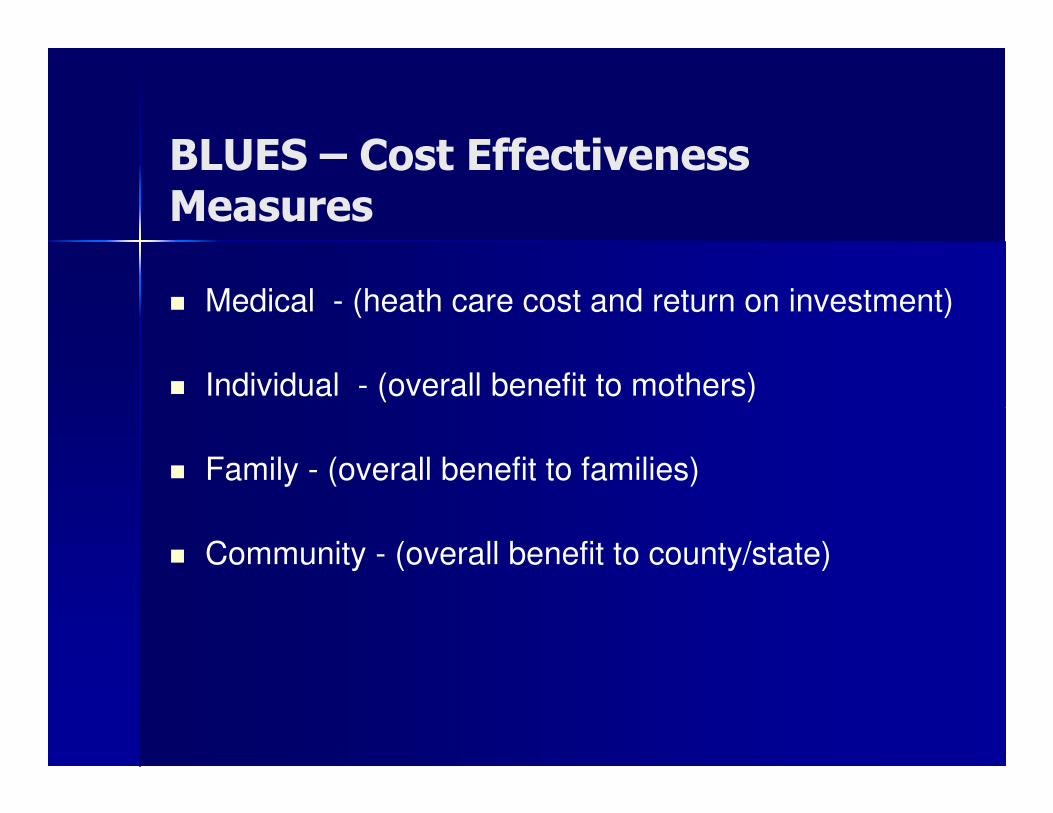
BLUES – Cost Effectiveness Measures
� Medical - (heath care cost and return on investment)
� Individual - (overall benefit to mothers)
� Family - (overall benefit to families)
� Community - (overall benefit to county/state)
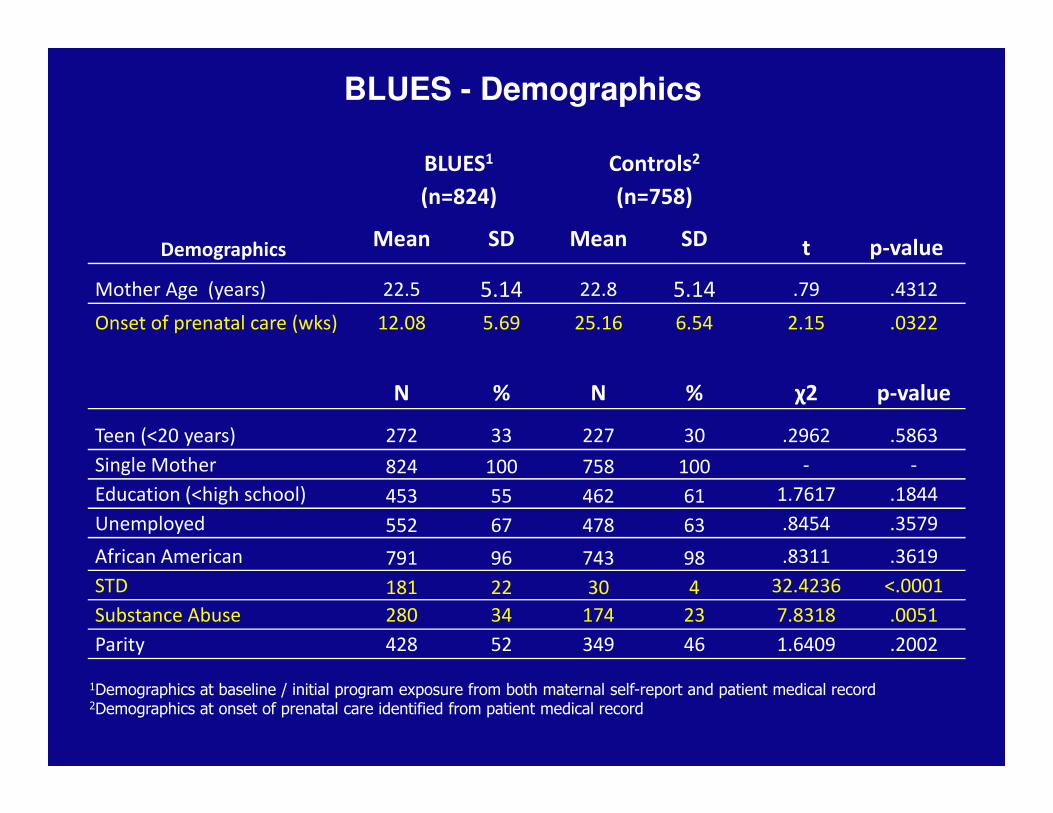
Demographics
BLUES1
(n=824)
Controls2
(n=758)
t p-value Mean SD Mean SD
Mother Age (years) 22.5 5.14 22.8 5.14 .79 .4312
Onset of prenatal care (wks) 12.08 5.69 25.16 6.54 2.15 .0322
N % N % χ2 p-value
BLUES - Demographics
Teen (<20 years) 272 33 227 30 .2962 .5863
Single Mother 824 100 758 100 - -
Education (<high school) 453 55 462 61 1.7617 .1844
Unemployed 552 67 478 63 .8454 .3579
African American 791 96 743 98 .8311 .3619
STD 181 22 30 4 32.4236 <.0001
Substance Abuse 280 34 174 23 7.8318 .0051
Parity 428 52 349 46 1.6409 .2002
1Demographics at baseline / initial program exposure from both maternal self-report and patient medical record2Demographics at onset of prenatal care identified from patient medical record
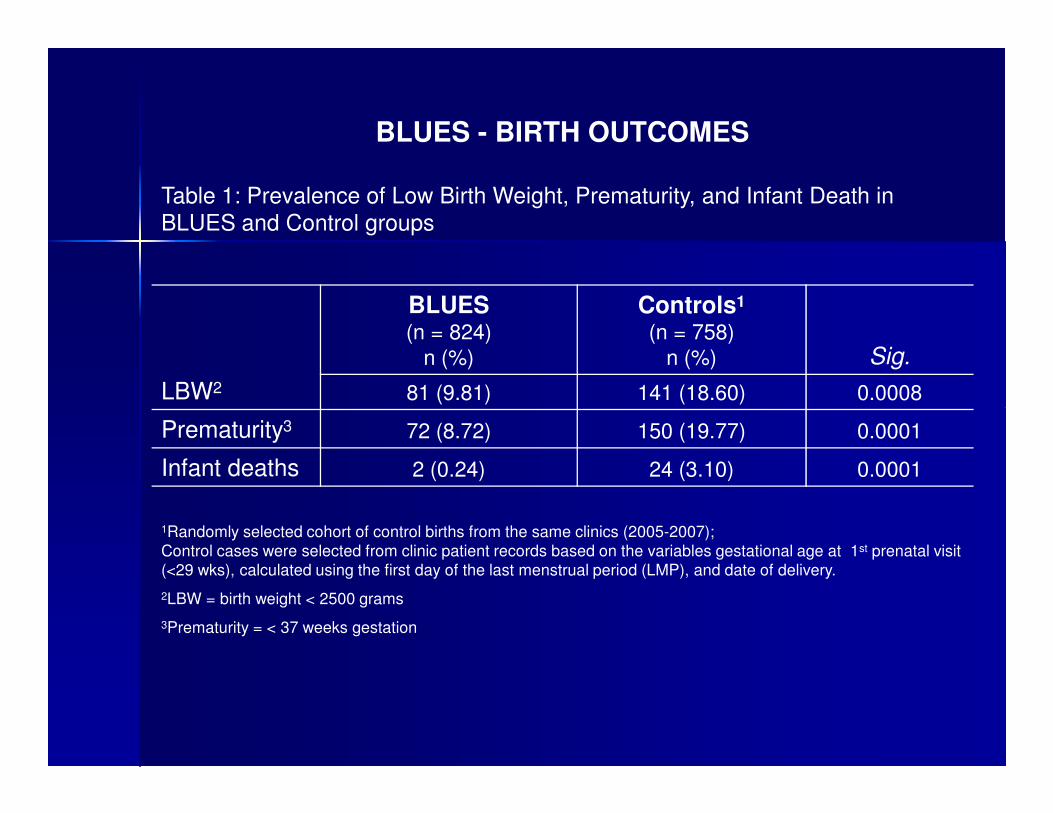
BLUES - BIRTH OUTCOMES
Table 1: Prevalence of Low Birth Weight, Prematurity, and Infant Death in BLUES and Control groups
LBW2
BLUES(n = 824)
n (%)
Controls1
(n = 758)n (%) Sig.
81 (9.81) 141 (18.60) 0.0008
Prematurity3 72 (8.72) 150 (19.77) 0.0001
Infant deaths 2 (0.24) 24 (3.10) 0.0001
1Randomly selected cohort of control births from the same clinics (2005-2007); Control cases were selected from clinic patient records based on the variables gestational age at 1st prenatal visit (<29 wks), calculated using the first day of the last menstrual period (LMP), and date of delivery.
2LBW = birth weight < 2500 grams
3Prematurity = < 37 weeks gestation
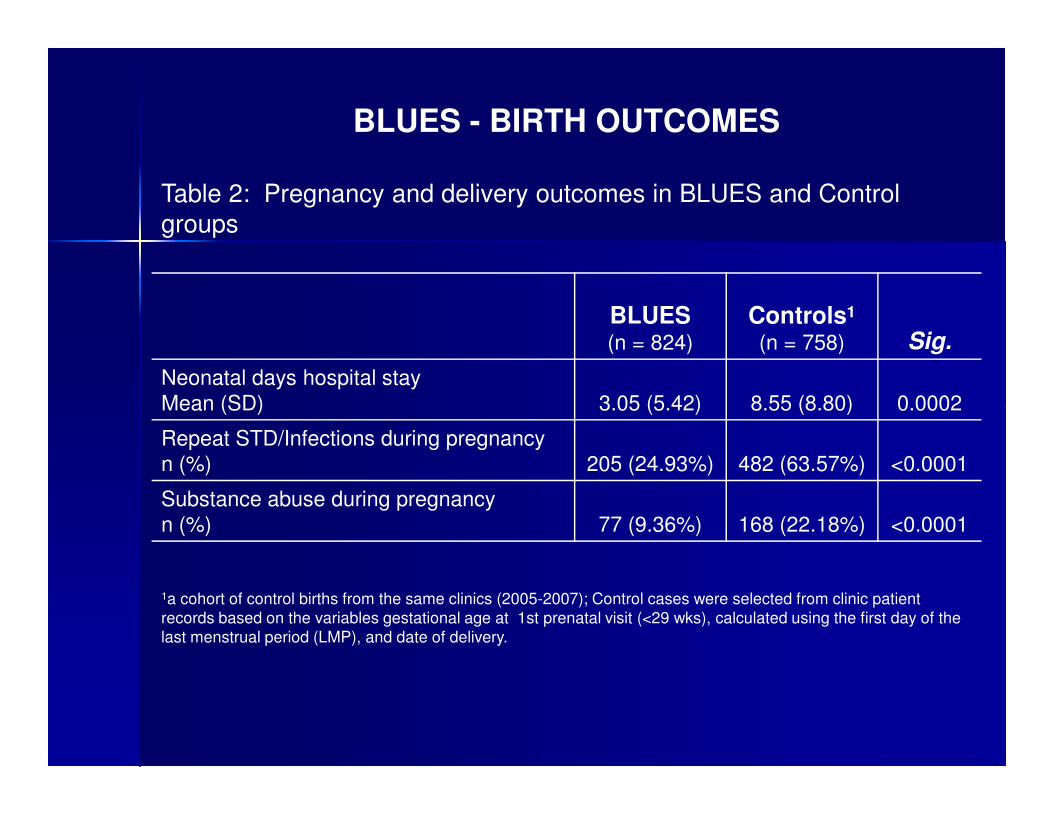
BLUES - BIRTH OUTCOMES
Table 2: Pregnancy and delivery outcomes in BLUES and Control groups
BLUES(n = 824)
Controls1
(n = 758) Sig.
Neonatal days hospital stayMean (SD) 3.05 (5.42) 8.55 (8.80) 0.0002Mean (SD) 3.05 (5.42) 8.55 (8.80) 0.0002
Repeat STD/Infections during pregnancyn (%) 205 (24.93%) 482 (63.57%) <0.0001
Substance abuse during pregnancyn (%) 77 (9.36%) 168 (22.18%) <0.0001
1a cohort of control births from the same clinics (2005-2007); Control cases were selected from clinic patient records based on the variables gestational age at 1st prenatal visit (<29 wks), calculated using the first day of the last menstrual period (LMP), and date of delivery.
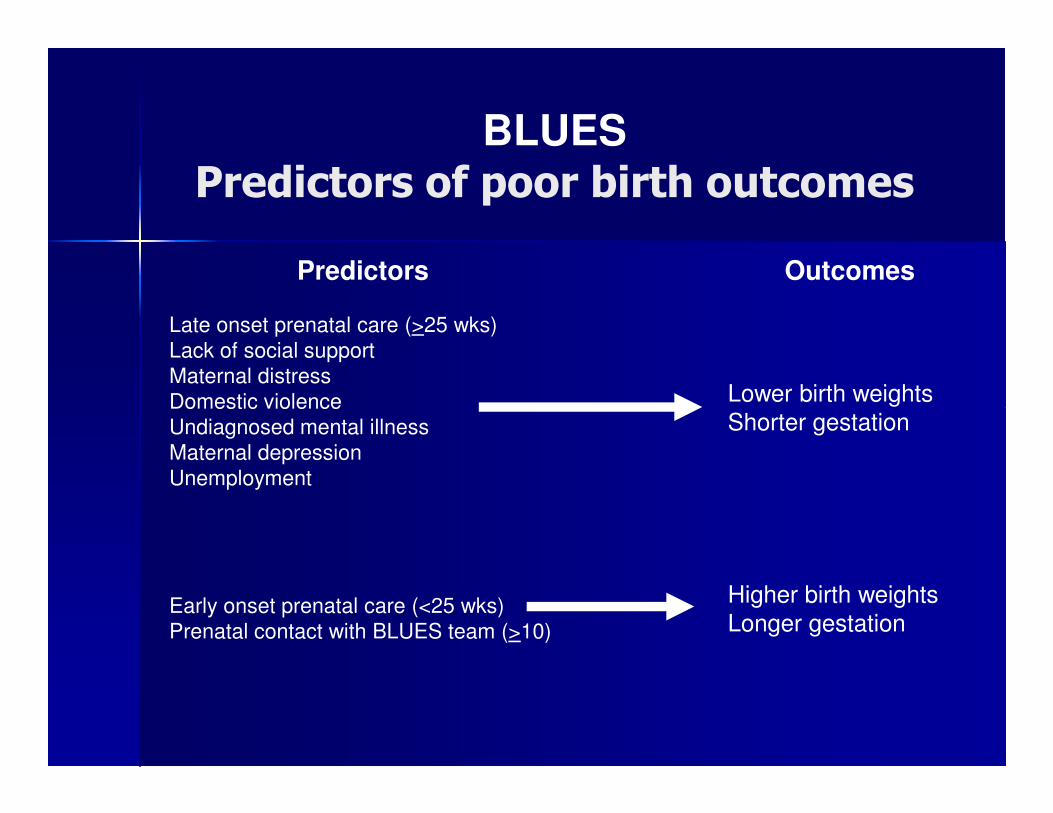
BLUES
Predictors of poor birth outcomes
Predictors
Late onset prenatal care (>25 wks)Lack of social supportMaternal distressDomestic violence
Outcomes
Lower birth weightsDomestic violenceUndiagnosed mental illnessMaternal depressionUnemployment
Early onset prenatal care (<25 wks)Prenatal contact with BLUES team (>10)
Shorter gestation
Higher birth weightsLonger gestation
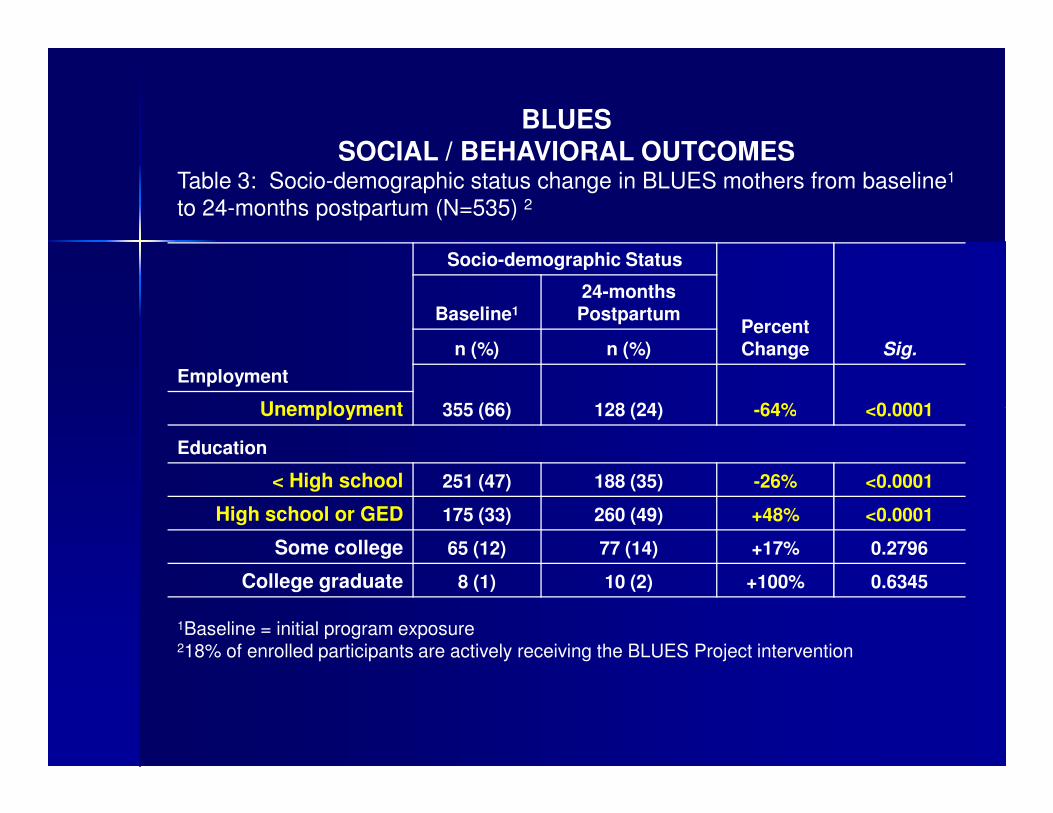
BLUESSOCIAL / BEHAVIORAL OUTCOMES
Table 3: Socio-demographic status change in BLUES mothers from baseline1
to 24-months postpartum (N=535) 2
Employment
Socio-demographic Status
Percent Change Sig.
Baseline1
24-months Postpartum
n (%) n (%)
355 (66) 128 (24) -64% <0.0001Unemployment 355 (66) 128 (24) -64% <0.0001Unemployment
Education
< High school 251 (47) 188 (35) -26% <0.0001
High school or GED 175 (33) 260 (49) +48% <0.0001
Some college 65 (12) 77 (14) +17% 0.2796
College graduate 8 (1) 10 (2) +100% 0.6345
1Baseline = initial program exposure218% of enrolled participants are actively receiving the BLUES Project intervention
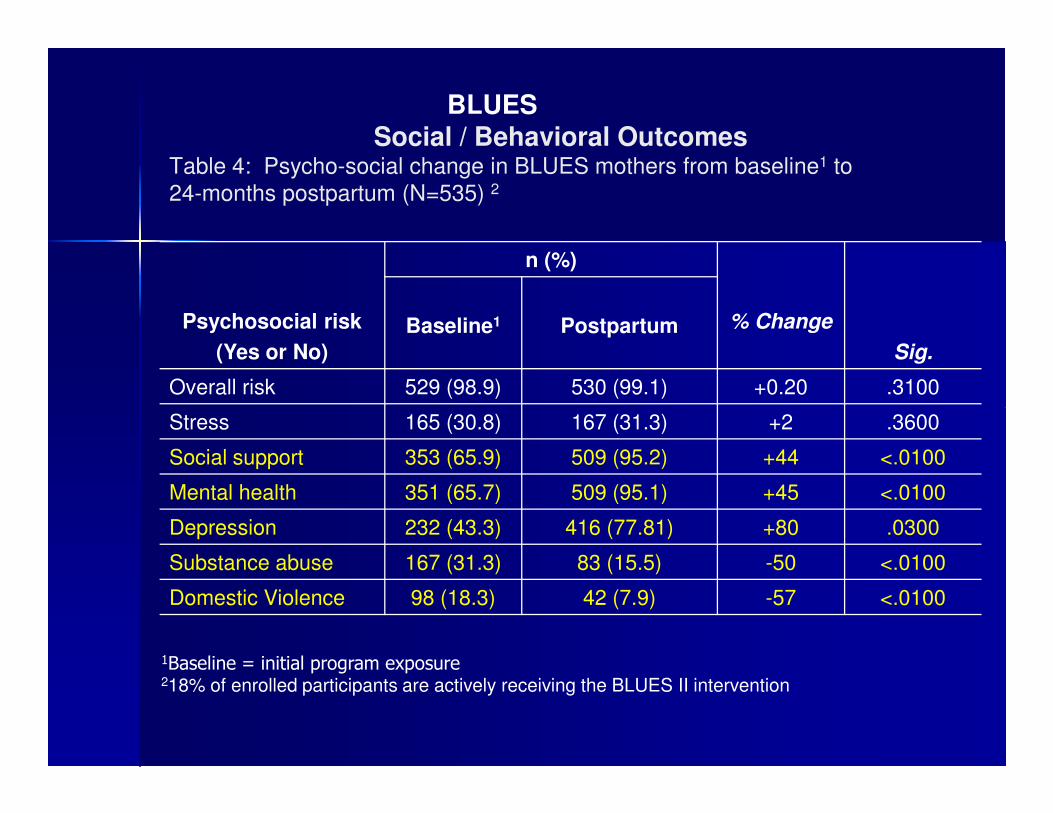
BLUESSocial / Behavioral Outcomes
Table 4: Psycho-social change in BLUES mothers from baseline1 to 24-months postpartum (N=535) 2
Psychosocial risk
(Yes or No)
n (%)
% Change
Sig.
Baseline1 Postpartum
Overall risk 529 (98.9) 530 (99.1) +0.20 .3100
1Baseline = initial program exposure218% of enrolled participants are actively receiving the BLUES II intervention
Stress 165 (30.8) 167 (31.3) +2 .3600
Social support 353 (65.9) 509 (95.2) +44 <.0100
Mental health 351 (65.7) 509 (95.1) +45 <.0100
Depression 232 (43.3) 416 (77.81) +80 .0300
Substance abuse 167 (31.3) 83 (15.5) -50 <.0100
Domestic Violence 98 (18.3) 42 (7.9) -57 <.0100
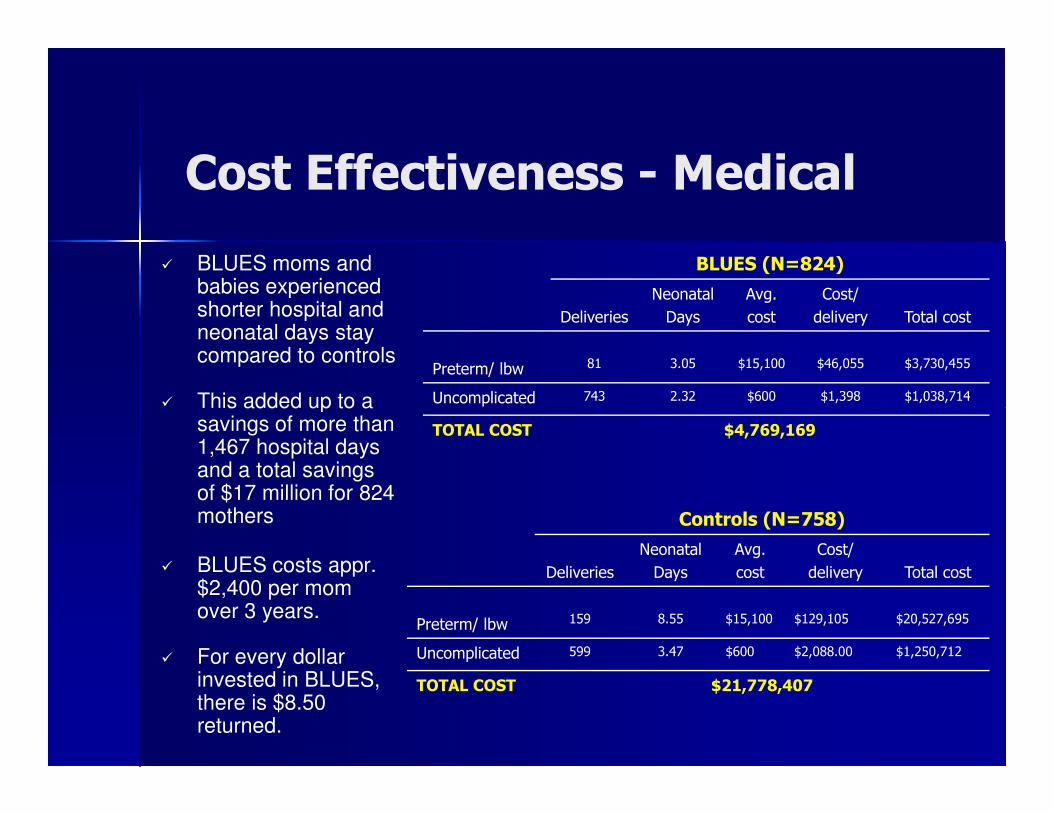
� BLUES moms and babies experienced shorter hospital and neonatal days stay compared to controls
� This added up to a
BLUES (N=824)
Deliveries
Neonatal
Days
Avg.
cost
Cost/
delivery Total cost
Preterm/ lbw 81 3.05 $15,100 $46,055 $3,730,455
Uncomplicated 743 2.32 $600 $1,398 $1,038,714
Cost Effectiveness - Medical
� This added up to a savings of more than 1,467 hospital days and a total savings of $17 million for 824 mothers
� BLUES costs appr. $2,400 per mom over 3 years.
� For every dollar invested in BLUES, there is $8.50 returned.
TOTAL COST $4,769,169
Controls (N=758)
Deliveries
Neonatal
Days
Avg.
cost
Cost/
delivery Total cost
Preterm/ lbw 159 8.55 $15,100 $129,105 $20,527,695
Uncomplicated 599 3.47 $600 $2,088.00 $1,250,712
TOTAL COST $21,778,407
1. Healthy, uncomplicated pregnancy and delivery
2. Increased social support
3. Increased screening, diagnosis, referrals, and treatment for mental and/or behavioral health services
Cost Effectiveness - Individual
4. Increased empowerment and self-sufficiency
5. Healthier mothers – (physically, mentally, and emotionally)
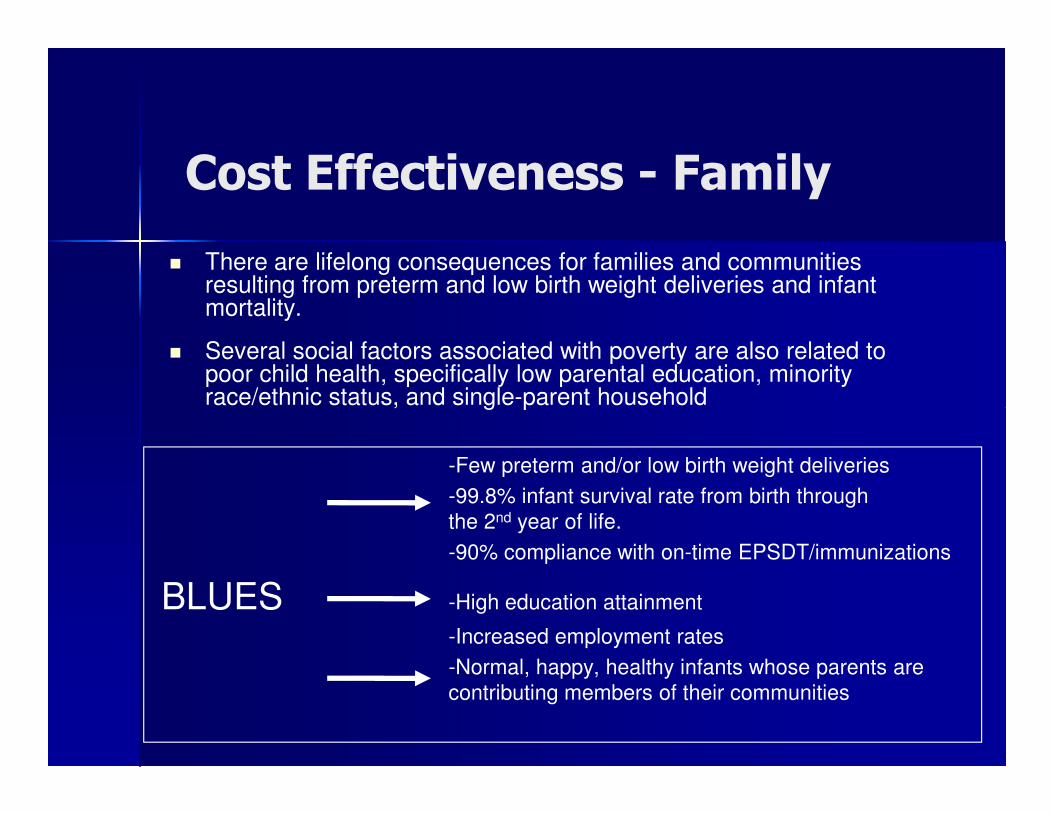
� There are lifelong consequences for families and communities resulting from preterm and low birth weight deliveries and infant mortality.
� Several social factors associated with poverty are also related to poor child health, specifically low parental education, minority race/ethnic status, and single-parent household
Cost Effectiveness - Family
race/ethnic status, and single-parent household
-Few preterm and/or low birth weight deliveries
-99.8% infant survival rate from birth through the 2nd year of life.
-90% compliance with on-time EPSDT/immunizations
BLUES -High education attainment
-Increased employment rates
-Normal, happy, healthy infants whose parents are contributing members of their communities
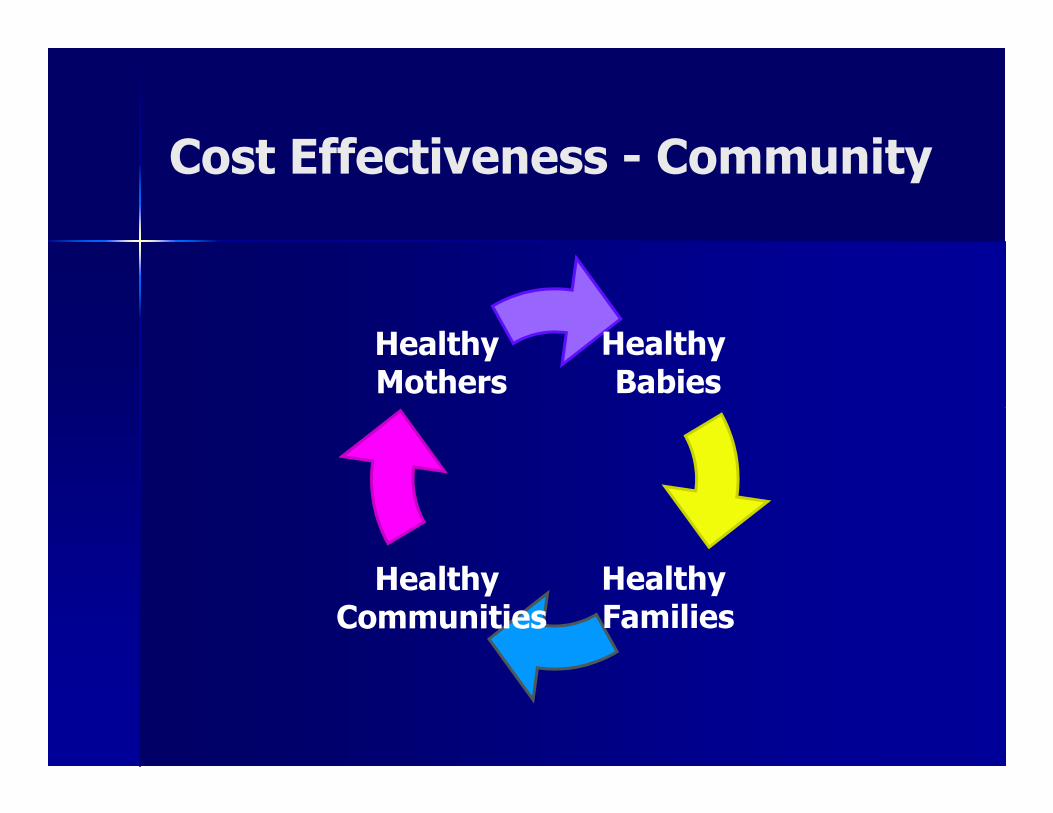
Cost Effectiveness - Community
Healthy Babies
Healthy Mothers
Healthy Communities
Healthy Families
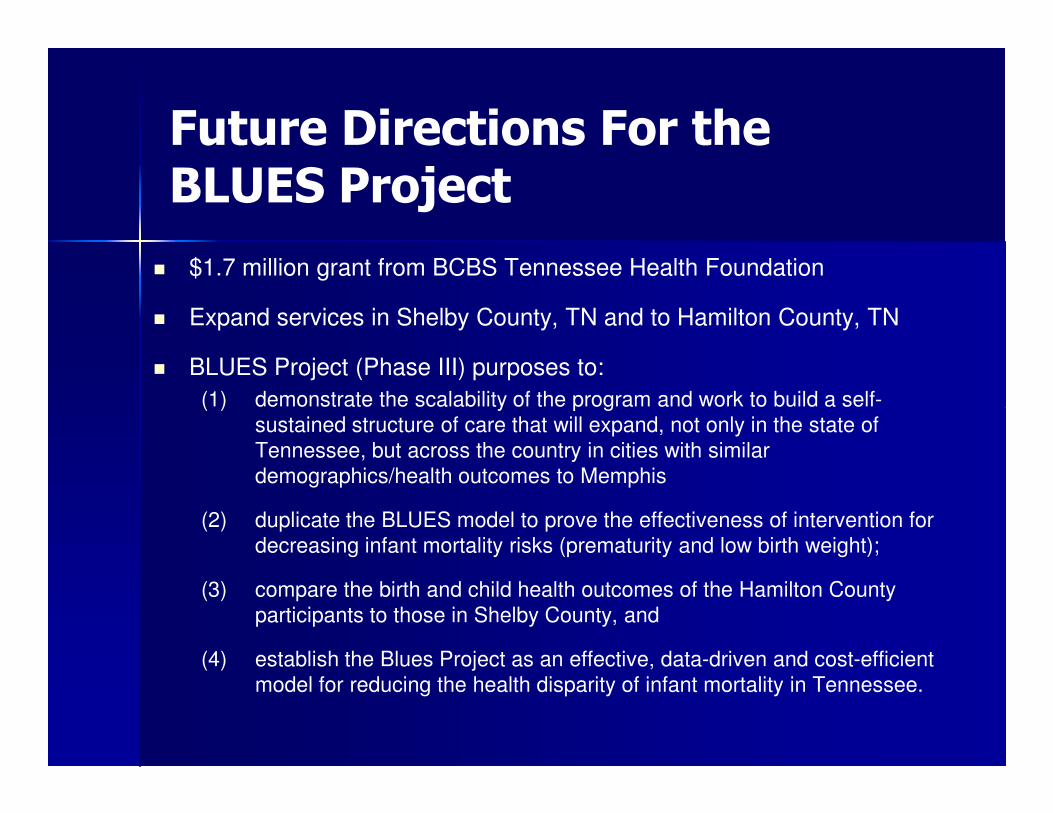
Future Directions For the BLUES Project
� $1.7 million grant from BCBS Tennessee Health Foundation
� Expand services in Shelby County, TN and to Hamilton County, TN
� BLUES Project (Phase III) purposes to:
(1) demonstrate the scalability of the program and work to build a self-(1) demonstrate the scalability of the program and work to build a self-sustained structure of care that will expand, not only in the state of Tennessee, but across the country in cities with similar demographics/health outcomes to Memphis
(2) duplicate the BLUES model to prove the effectiveness of intervention for decreasing infant mortality risks (prematurity and low birth weight);
(3) compare the birth and child health outcomes of the Hamilton County participants to those in Shelby County, and
(4) establish the Blues Project as an effective, data-driven and cost-efficient model for reducing the health disparity of infant mortality in Tennessee.
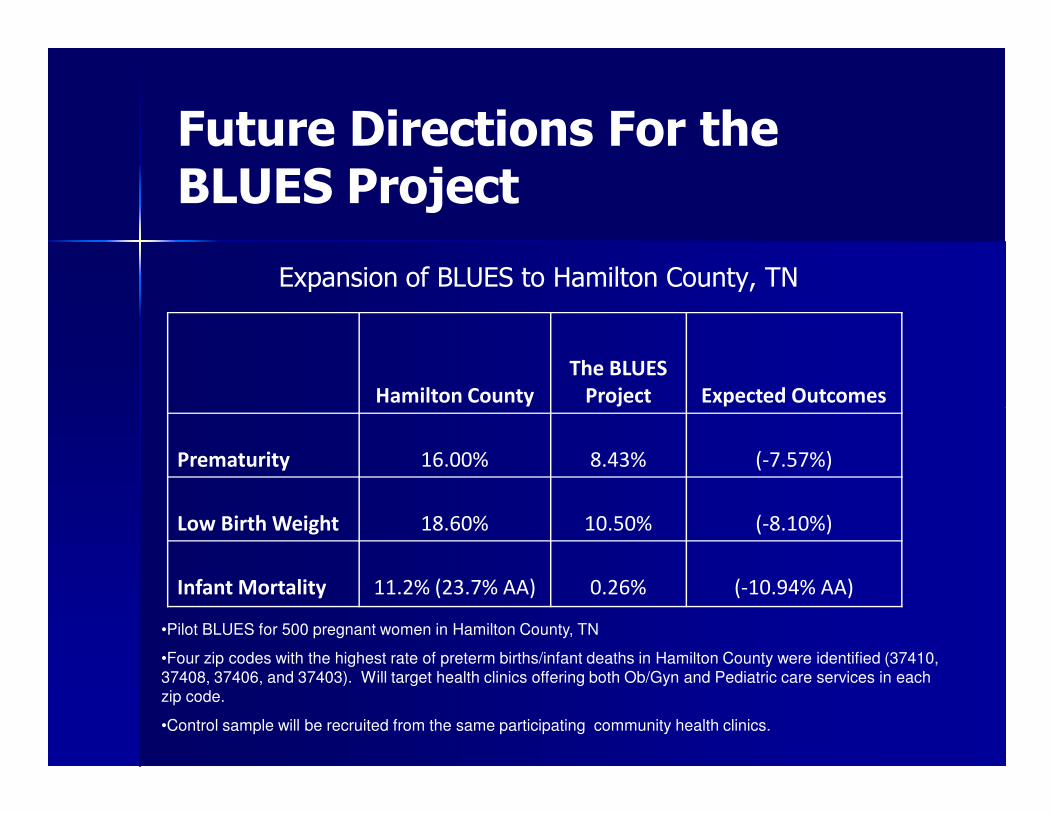
Future Directions For the BLUES Project
Expansion of BLUES to Hamilton County, TN
Hamilton County
The BLUES
Project Expected OutcomesHamilton County Project Expected Outcomes
Prematurity 16.00% 8.43% (-7.57%)
Low Birth Weight 18.60% 10.50% (-8.10%)
Infant Mortality 11.2% (23.7% AA) 0.26% (-10.94% AA)
•Pilot BLUES for 500 pregnant women in Hamilton County, TN
•Four zip codes with the highest rate of preterm births/infant deaths in Hamilton County were identified (37410, 37408, 37406, and 37403). Will target health clinics offering both Ob/Gyn and Pediatric care services in each zip code.
•Control sample will be recruited from the same participating community health clinics.
Summary
� The BLUES Project serves a large number of women and is the result of widespread community collaboration.
� Over 1,000 at-risk mothers have been served by the BLUES Project since its inception in 2005.
� Overall, BLUES is proving to be an effective model for reducing infant mortality, premature delivery and low birth weight, particularly for African American infants.
Conclusions
� BLUES demonstrates the impact that social support can yield; not only in terms of birth outcomes, but overall health and quality of life for at-risk mothers.
� The BLUES model is holistic in scope compared to other programs and empowers women to overcome social and programs and empowers women to overcome social and economic barriers adversely affecting their health and that of their children.
� We can conclude that this cost-effective, collaborative approach to health care holds promise for improving the health and social outcomes of our mothers, children, families, and communities.

Contact Information:Contact Information:
Kimberly Lamar, PhD, MPH, MSEHKimberly Lamar, PhD, MPH, MSEH
PI/Program DirectorPI/Program Director
The University of Tennessee Health Science CenterThe University of Tennessee Health Science Center
Department of Preventive MedicineDepartment of Preventive MedicineDepartment of Preventive MedicineDepartment of Preventive Medicine
600 Jefferson Avenue, 3600 Jefferson Avenue, 3rdrd FloorFloor
Office:Office: 901901--448448--51695169
Fax:Fax: 901901--448448--37703770
[email protected]@uthsc.edu