The Blueprint Thesis - Blueprint Growth Institute · The Blueprint Thesis A Different Approach to...
22
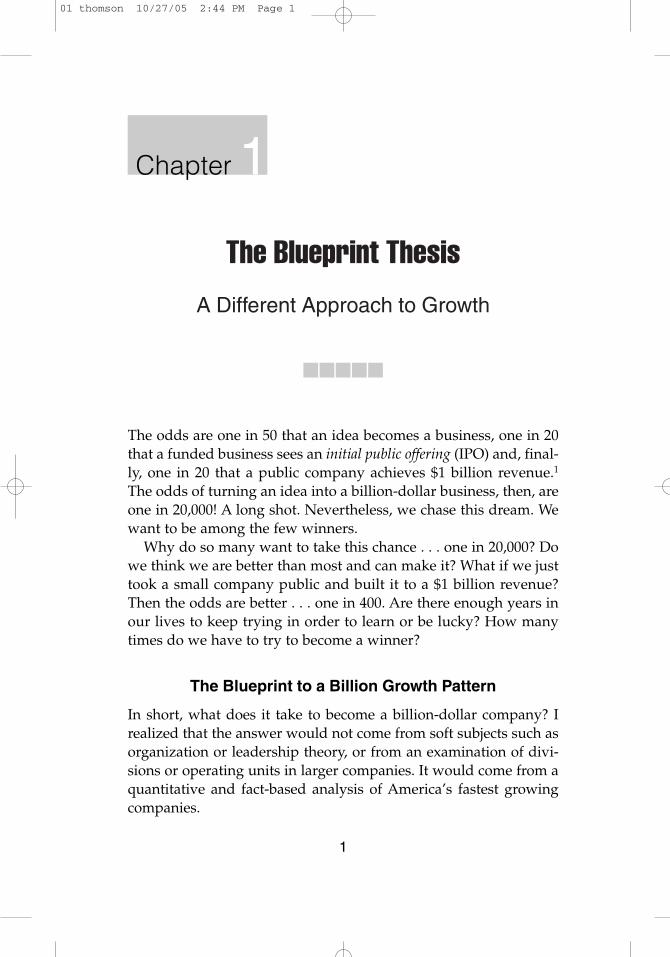
The Blueprint Thesis A Different Approach to Growth ■■■■■ The odds are one in 50 that an idea becomes a business, one in 20 that a funded business sees an initial public offering (IPO) and, final- ly, one in 20 that a public company achieves $1 billion revenue. 1 The odds of turning an idea into a billion-dollar business, then, are one in 20,000! A long shot. Nevertheless, we chase this dream. We want to be among the few winners. Why do so many want to take this chance . . . one in 20,000? Do we think we are better than most and can make it? What if we just took a small company public and built it to a $1 billion revenue? Then the odds are better . . . one in 400. Are there enough years in our lives to keep trying in order to learn or be lucky? How many times do we have to try to become a winner? The Blueprint to a Billion Growth Pattern In short, what does it take to become a billion-dollar company? I realized that the answer would not come from soft subjects such as organization or leadership theory, or from an examination of divi- sions or operating units in larger companies. It would come from a quantitative and fact-based analysis of America’s fastest growing companies. 1 Chapter 1 01 thomson 10/27/05 2:44 PM Page 1
Transcript of The Blueprint Thesis - Blueprint Growth Institute · The Blueprint Thesis A Different Approach to...
The Blueprint ThesisA Different Approach to Growth
�����
The odds are one in 50 that an idea becomes a business, one in 20that a funded business sees an initial public offering (IPO) and, final-ly, one in 20 that a public company achieves $1 billion revenue.1
The odds of turning an idea into a billion-dollar business, then, areone in 20,000! A long shot. Nevertheless, we chase this dream. Wewant to be among the few winners.
Why do so many want to take this chance . . . one in 20,000? Dowe think we are better than most and can make it? What if we justtook a small company public and built it to a $1 billion revenue?Then the odds are better . . . one in 400. Are there enough years inour lives to keep trying in order to learn or be lucky? How manytimes do we have to try to become a winner?
The Blueprint to a Billion Growth Pattern
In short, what does it take to become a billion-dollar company? Irealized that the answer would not come from soft subjects such asorganization or leadership theory, or from an examination of divi-sions or operating units in larger companies. It would come from aquantitative and fact-based analysis of America’s fastest growingcompanies.
1
Chapter 1
01 thomson 10/27/05 2:44 PM Page 1

Furthermore, the analysis had to hinge on what is often over-looked: revenue performance. Every company can invest, even over-invest, to grow. However, not every company can create revenuegrowth. How many times have you heard a CEO announcing quar-terly results stating that earnings did not meet expectationsbecause of a revenue shortfall, yet expenditures met or exceededbudget?
My research began by looking for all of the American companiesthat grew to $1 billion revenue since going public after 1980. I iden-tified 387 companies out of 7,454. These 387 U.S. companies will bereferred to as the Blueprint Companies.
The Blueprint Companies have a simple but definable character-istic: They not only grew fast, they exhibited exponential revenuegrowth. Exponential is super-compounding. It describes compa-nies that can double revenue every year, for example. Growth ratesmay slow as revenue approaches $1 billion, but these companiesstill grew at an exponential rate. The non-$1 billion companies hadrandom, linear, or no growth (see Figure 1.1).
This book focuses on these 387 companies and that part of their
2 Blueprint to a Billion
$250M $1,000M
07 14
Years 7 140Years
FIGURE 1.1
Revenue Growth:The Masses versus Blueprint Companies
Companies that did not achieve $1B Blueprint Companies that achieved $1B
Source: Standard & Poor’s Compustat, Blueprint analysis
01 thomson 10/27/05 2:44 PM Page 2

growth up to the $1 billion revenue mark. The success patternbeyond this point is not explored in order to concentrate on thiskey benchmark.
When the Blueprint Companies were compared to the remaining5,048 companies that went public since 1980 and are still active in2005 (2,019 of these companies have since gone out of business), Iwas amazed at the impact such a few companies have achieved(see Figure 1.2).2
The disproportionate success of the Blueprint Companies makesit apparent that they are the heart of America’s innovation andgrowth. These companies are the best-in-class set from which thisstudy draws from. This highly disproportionate ratio suggests thatunless their different approach is utilized, the odds were—andare—higher for business teams to be part of the 95 percent than the
The Blueprint Thesis 3
Blueprint Companies represent 5 percent of American compa-nies that went public since 1980 and account for 56 percent ofemployment in 2005 and 64 percent of market value!
95
5
7,454 9.8M $4,481B
56 64
44 36
Source: Standard & Poor’s Compustat, Blueprint analysis
FIGURE 1.2
Blueprint Companies Are America’s Growth Engine
Number of Number of MarketCompanies Employees Value
Growthcompaniesbelow $1Brevenue andcompanies outof business
BlueprintCompanies
01 thomson 10/27/05 2:44 PM Page 3
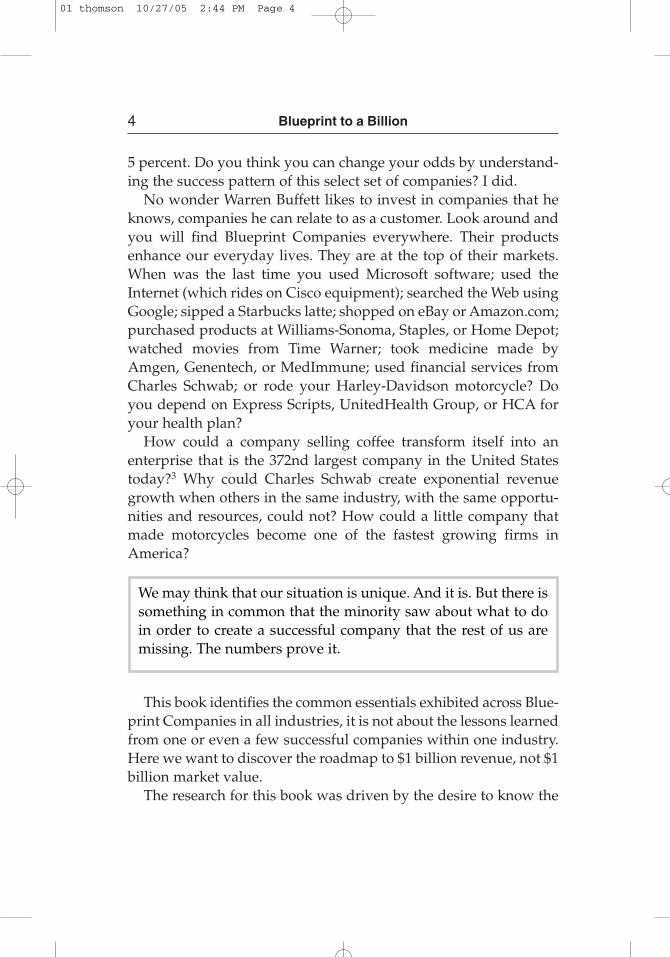
5 percent. Do you think you can change your odds by understand-ing the success pattern of this select set of companies? I did.
No wonder Warren Buffett likes to invest in companies that heknows, companies he can relate to as a customer. Look around andyou will find Blueprint Companies everywhere. Their productsenhance our everyday lives. They are at the top of their markets.When was the last time you used Microsoft software; used theInternet (which rides on Cisco equipment); searched the Web usingGoogle; sipped a Starbucks latte; shopped on eBay or Amazon.com;purchased products at Williams-Sonoma, Staples, or Home Depot;watched movies from Time Warner; took medicine made byAmgen, Genentech, or MedImmune; used financial services fromCharles Schwab; or rode your Harley-Davidson motorcycle? Doyou depend on Express Scripts, UnitedHealth Group, or HCA foryour health plan?
How could a company selling coffee transform itself into anenterprise that is the 372nd largest company in the United Statestoday?3 Why could Charles Schwab create exponential revenuegrowth when others in the same industry, with the same opportu-nities and resources, could not? How could a little company thatmade motorcycles become one of the fastest growing firms inAmerica?
This book identifies the common essentials exhibited across Blue-print Companies in all industries, it is not about the lessons learnedfrom one or even a few successful companies within one industry.Here we want to discover the roadmap to $1 billion revenue, not $1billion market value.
The research for this book was driven by the desire to know the
4 Blueprint to a Billion
We may think that our situation is unique. And it is. But there issomething in common that the minority saw about what to doin order to create a successful company that the rest of us aremissing. The numbers prove it.
01 thomson 10/27/05 2:44 PM Page 4

answers to the what questions such as, “What role did customersplay in shaping an exponential growth company?” “What was theinvestment profile for creating exponential growth—overinvest togrow or become cash flow positive early and scale?” I wantedanswers that could be applied to the top and bottom lines in orderto achieve exponential growth.
Significant Insights about Blueprint Companies
By first looking at the financial patterns of Blueprint Companiesand defining the actions required to create their financial impact, Ifound that it is possible to reverse engineer the behaviors and skillsrequired. This eliminated the behaviors and actions that were notrelevant. As a result, this revealed a set of significant insights thattruly created impact.
The common revenue pattern across the Blueprint Companies isa unique pattern that only these kinds of companies demonstrate.Like a rocket, these companies need to be on the right flight trajec-tory and have the speed to break the pull of gravity—to escapebeing a mediocre, low-orbiting projectile.
Looking at the revenue curves, I identified three discernible pat-terns as shown in Figure 1.3.
The exponential revenue growth curves have three parts: (1) avariable runway; (2) an inflection point where revenue breaks outinto an exponential trajectory; and (3) variable growth rates to $1billion revenue. Regarding the variable runway, the companies onthe left side of Figure 1.3 have a discernibly shorter runway thanthose on the right side. They have a common inflection point. Insome cases, the companies on the left had a similar growth rate asthe companies on the right—just the timing was different.
When researchers study business trends, they typically starttheir analysis at the company’s founding year, or at the year of IPO.The Blueprint models are anchored at the inflection point—the pointwhere the business demonstrates its breakout to exponential rev-enue growth. Why? The pattern for starting a company is different
The Blueprint Thesis 5
01 thomson 10/27/05 2:44 PM Page 5
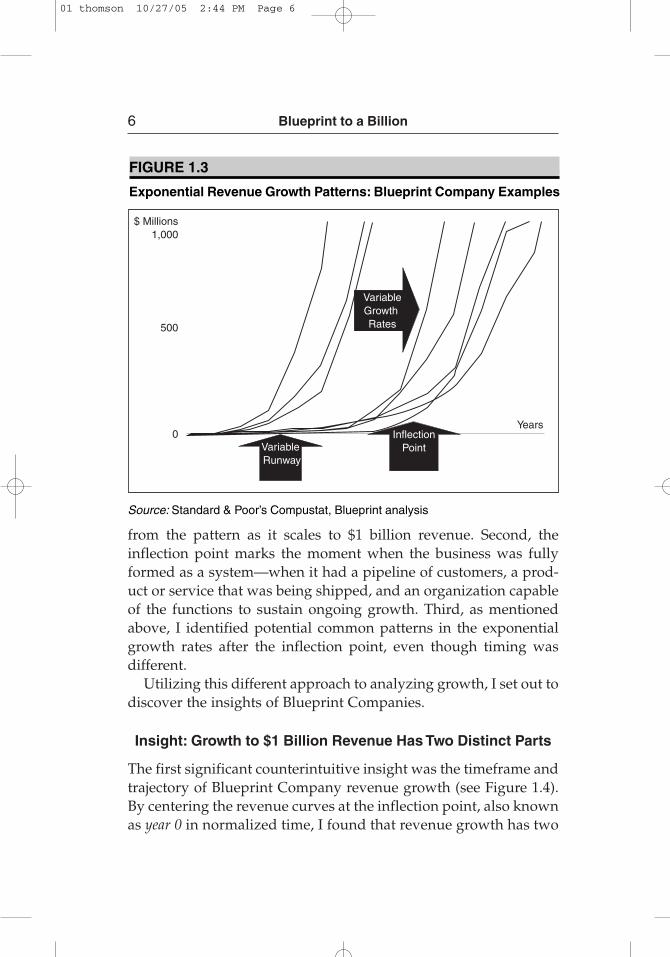
from the pattern as it scales to $1 billion revenue. Second, theinflection point marks the moment when the business was fullyformed as a system—when it had a pipeline of customers, a prod-uct or service that was being shipped, and an organization capableof the functions to sustain ongoing growth. Third, as mentionedabove, I identified potential common patterns in the exponentialgrowth rates after the inflection point, even though timing was different.
Utilizing this different approach to analyzing growth, I set out todiscover the insights of Blueprint Companies.
Insight: Growth to $1 Billion Revenue Has Two Distinct Parts
The first significant counterintuitive insight was the timeframe andtrajectory of Blueprint Company revenue growth (see Figure 1.4).By centering the revenue curves at the inflection point, also knownas year 0 in normalized time, I found that revenue growth has two
6 Blueprint to a Billion
VariableGrowth Rates
Variable Runway
InflectionPoint
$ Millions1,000
500
0Years
Source: Standard & Poor’s Compustat, Blueprint analysis
FIGURE 1.3
Exponential Revenue Growth Patterns: Blueprint Company Examples
01 thomson 10/27/05 2:44 PM Page 6

distinct parts: the time to the inflection point was highly variablefrom the founding year to the inflection point, which was then fol-lowed by three trajectories to $1 billion revenue that centered on afour-, six-, or twelve-year trajectory. Since the nature of the curveshad fairly consistent exponential revenue growth, this creates aunique opportunity to benchmark growth trajectories.
One might naturally assume that the time to the inflection pointis correlated with the trajectory that the business follows to $1 bil-lion revenue. Not true. For example, Google went from its found-ing to the inflection in two years and went up the front side of thefour-year trajectory to become one of the fastest growing compa-nies. In contrast, Cisco took seven years to get to the inflection
The Blueprint Thesis 7
$1,000
0
Revenue ($M)
InflectionPoint
Normalized Time(Years)
4 Years 12 Years6 Years
Source: Standard & Poor’s Compustat, Blueprint analysis
FIGURE 1.4
Growth Has Two Parts: Variable Time to Inflection and Three Trajectories to $1 Billion Revenue
Examples: Broadcom Career Education Dreyer’s Ice CreamCisco Medimmune Fifth Third BancorpGoogle Microsoft FastenaleBay Starbucks Tractor Supply
–10 0 10
01 thomson 10/27/05 2:44 PM Page 7
point before going up the four-year trajectory. In an extreme exam-ple of a lengthy timeline to the inflection point, Fifth Third Bancorphad its beginnings in the middle of the 19th century. The companypassed through the inflection point in the late 1980s to ascend onthe back side of the 12-year trajectory to achieve $1 billion in 1994.
With this insight, I started to look at companies at the inflectionpoint. My own business skills fit best with companies from theinflection point to $1 billion revenue versus ones coming from thegarage to the inflection. This was a key understanding on the jour-ney to find where my own quantitative skills, combined with 20years of business experience, could best be utilized. So, whereshould you focus?
Insight: Blueprint Companies Can Grow in Any Sector
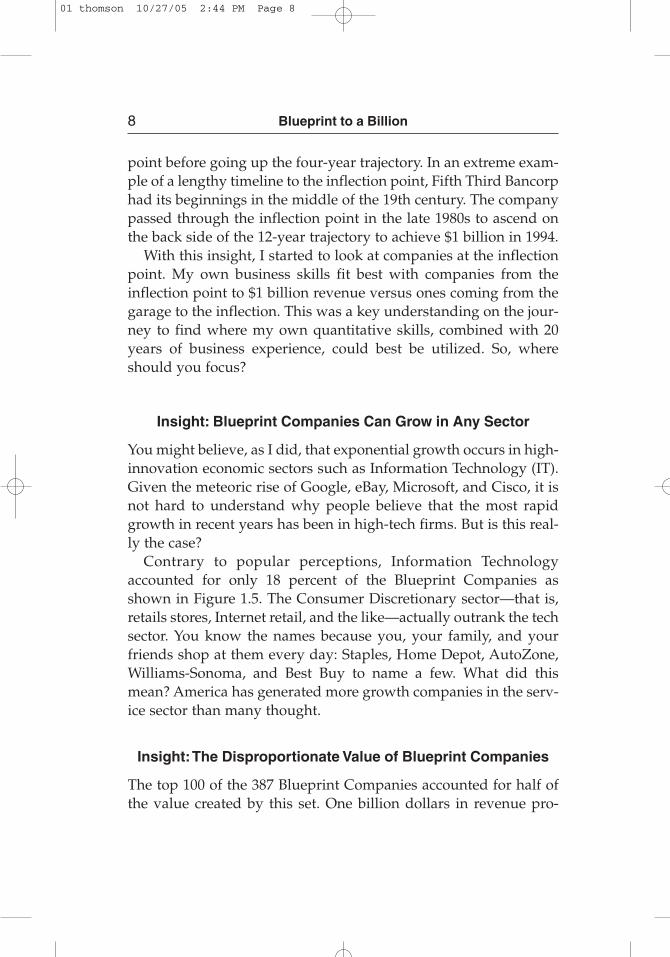
You might believe, as I did, that exponential growth occurs in high-innovation economic sectors such as Information Technology (IT).Given the meteoric rise of Google, eBay, Microsoft, and Cisco, it isnot hard to understand why people believe that the most rapidgrowth in recent years has been in high-tech firms. But is this real-ly the case?
Contrary to popular perceptions, Information Technologyaccounted for only 18 percent of the Blueprint Companies asshown in Figure 1.5. The Consumer Discretionary sector—that is,retails stores, Internet retail, and the like—actually outrank the techsector. You know the names because you, your family, and yourfriends shop at them every day: Staples, Home Depot, AutoZone,Williams-Sonoma, and Best Buy to name a few. What did thismean? America has generated more growth companies in the serv-ice sector than many thought.
Insight:The Disproportionate Value of Blueprint Companies
The top 100 of the 387 Blueprint Companies accounted for half ofthe value created by this set. One billion dollars in revenue pro-
8 Blueprint to a Billion
01 thomson 10/27/05 2:44 PM Page 8
vides management with the opportunity to create shareholderreturns extraordinaire. Yet while some Blueprint Companies werehighly prized by the market at a billion dollars, others were not.
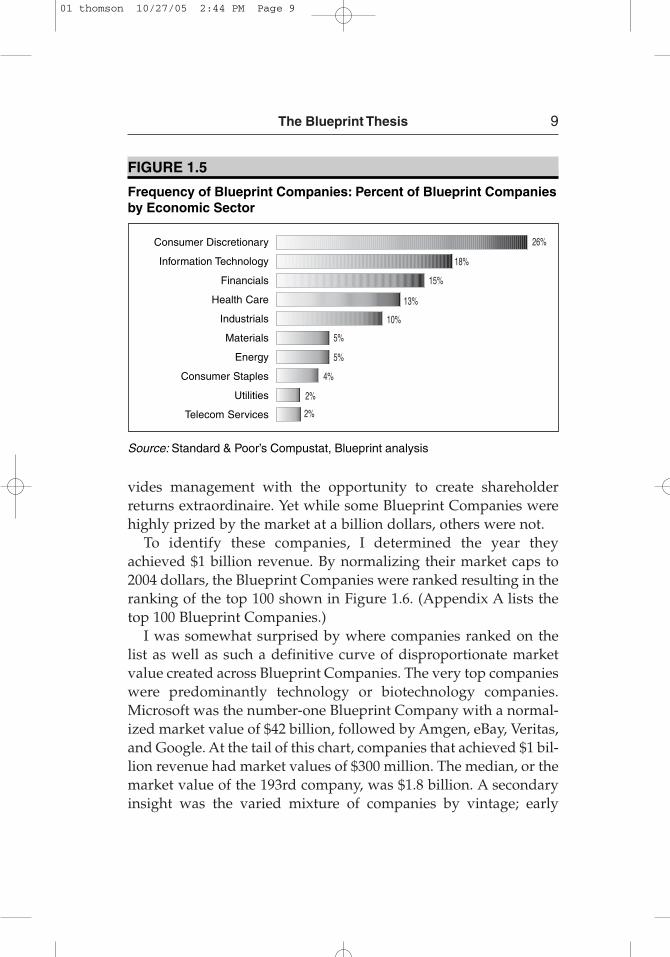
To identify these companies, I determined the year theyachieved $1 billion revenue. By normalizing their market caps to2004 dollars, the Blueprint Companies were ranked resulting in theranking of the top 100 shown in Figure 1.6. (Appendix A lists thetop 100 Blueprint Companies.)
I was somewhat surprised by where companies ranked on thelist as well as such a definitive curve of disproportionate marketvalue created across Blueprint Companies. The very top companieswere predominantly technology or biotechnology companies.Microsoft was the number-one Blueprint Company with a normal-ized market value of $42 billion, followed by Amgen, eBay, Veritas,and Google. At the tail of this chart, companies that achieved $1 bil-lion revenue had market values of $300 million. The median, or themarket value of the 193rd company, was $1.8 billion. A secondaryinsight was the varied mixture of companies by vintage; early
The Blueprint Thesis 9
26%
18%
15%
13%
10%
5%
5%
4%
2%
2%
Source: Standard & Poor’s Compustat, Blueprint analysis
FIGURE 1.5
Frequency of Blueprint Companies: Percent of Blueprint Companiesby Economic Sector
Consumer Discretionary
Information Technology
Financials
Health Care
Industrials
Materials
Energy
Consumer Staples
Utilities
Telecom Services
01 thomson 10/27/05 2:44 PM Page 9

1990s companies such as Cisco, as well as new companies such aseBay, had similar superior market values when normalized.
These Blueprint Companies show up as the most highly valuedcompanies on our stock exchanges. If you look on the NASDAQ100 Index, over 60 percent are Blueprint Companies.
The top 100 Blueprint Companies account for half the marketvalue of all 387 Blueprint Companies—an unbelievable impactfrom such a few companies.
Why does the Information Technology sector have the cachet itdoes when it comes to investors? Because it has generated the mostvalue for shareholders (see Figure 1.7). Consumer Discretionaryfell in comparison to Information Technology. For a sector (con-sumer) with 50 percent more Blueprint Companies than Informa-tion Technology, you can only conclude that IT companies werevalued significantly more than their counterparts in the Consumersector.
Is there an interesting play for the future to bring technology to
10 Blueprint to a Billion
387100
45
0
Top 100Blueprint Companies(see Appendix A)
Normalized Market Value($B)
Number of Companies
Source: Standard & Poor’s Compustat, Blueprint analysis
FIGURE 1.6
Disproportionate Value of Blueprint Companies
01 thomson 10/27/05 2:44 PM Page 10

the industries in the Consumer Discretionary sector? To get the bestof both: high probability with higher market capitalization? Areyou wondering what the smartest investors might have to sayabout this observation? (If you are looking for this answer, you willenjoy the interview with private equity investor Roger McNameein Chapter 10.)
Insight:The 7 Essentials to Achieve Exponential Growth
During my tenure as a consultant at McKinsey & Company, Ilearned that business dynamics can identify the underlying inter-linked forces that lead to exponential growth. While it is impossi-ble to model the particular business dynamics for each BlueprintCompany, I could determine the dynamic essentials that seemedcommon to most of them. I call these the 7 Essentials. These are theessentials necessary to create exponential growth. Despite the diver-sity of companies and industries, I found these common essentialsacross the total set of companies and industries that I examined.
To prove that these seven common essentials are unique toBlueprint Companies, I compared companies in the same indus-
The Blueprint Thesis 11
$427B
240
193
177
72
55
42
17
14
13
Source: Standard & Poor’s Compustat, Blueprint analysis
FIGURE 1.7
The Market Value of Blueprint Companies ($B)
Information Technology
Consumer Discretionary
Health Care
Financials
Industrials
Materials
Energy
Utilities
Consumer Staples
Telecom Services
01 thomson 10/27/05 2:44 PM Page 11

try—one set drawn from the Blueprint list, the other from a groupof companies that had the same opportunities but had failed togrow at an exponential rate.
As I presented the Blueprint to CEO roundtables, investors, andmanagement teams, they challenged me to simplify the insights.The insights could not to be too simple, however, for while theymight be more easily understood, they might not be convincing. Inactual fact, the 7 Essentials are aligned to create financial impact inwhat I call The Essentials Triangle™ framework (see Figure 1.8). Theinbound side requires a Big Idea or value proposition. To create
12 Blueprint to a Billion
Despite the diversity of corporate histories in different econom-ic sectors, the seven common essentials rose to the surface againand again. Five or more of these seven showed up in over 90percent of the Blueprint Companies studied. These 7 Essentialsare necessary to achieve and sustain exponential growth.
The Big Idea
Create and SustainExponentialRevenue GrowthValue
proposition
Market
Board
Managementteam
Businessreturns
Alliances
Customers
Create and Sustain Exponential Returns
Source: Blueprint analysis
FIGURE 1.8
The Essentials Triangle
01 thomson 10/27/05 2:44 PM Page 12
exponential revenue growth from the Big Idea, there are threeessentials required. To capture the opportunity for exponentialreturns, there are three more essentials required. The frameworkfor these essentials is The Essentials Triangle. Each side of this tri-angular framework aligns with a company’s financial statement.
Blueprint Companies create a Big Idea that delivers break-through value for their customers. It is superior to competitorsbecause the company fulfills an unmet need the best way. Not justat the beginning, but all the way to $1 billion revenue. Most com-panies accept the status quo of their industries. Not Blueprint inno-vators. They look for blockbuster ideas with quantum leap valuepropositions.
Blueprint Companies that create and sustain exponential rev-enue growth give the management team the option to create a busi-ness model of exponential returns. Attractive markets, customers,and alliances enable exponential revenue growth. Blueprint Com-panies use them all to achieve exponential revenue growth.
Blueprint Companies create a business model of exponentialreturns by managing expenses and investments to deliver positivereturn on investment (ROI) and cash flow early and consistently.For the technology companies, the role model for exponentialreturns, I found that cash flow, on average, was a constant percent-age of revenue. Therefore, the absolute value of cash flow paral-leled the exponential growth of revenue depending on thetrajectory—four, six, or twelve years. Cash flow and return oninvestment are the primary drivers of market value (or sharehold-er value). To achieve these returns, the management team had toexecute all seven essentials. No one leader could do them all.
The 7 Essentials of Blueprint Companies are described in the fol-lowing sections.
1. Create and Sustain a Breakthrough Value Proposition
A value proposition states the benefits customers receive fromusing a company’s products or services in terms that the customerunderstands.
The Blueprint Thesis 13
01 thomson 10/27/05 2:44 PM Page 13

The best Blueprint Companies not only have compelling valuepropositions, they have breakthrough value propositions. Thereare three kinds:
• Shapers of a New World, truly create a new market for theirproducts and services.
• Niche Shapers, follow New World Shapers with products orservices that redefine a specific market segment.
• Category Killers, optimize a market by attacking the existingincumbents with a better-faster-cheaper value offer.
A Shaper of a New World would be eBay, Microsoft, Amgen, orGenentech; a Niche Shaper would be Starbucks; and a CategoryKiller would be Home Depot or Staples that offer lower pricescompared to specialized retailers. While I initially thought that the greatest number of Blueprint Companies would be Shapers ofa New World, I found over 43 percent of top Blueprint Companiesto be either Niche Shapers or Category Killers. This finding coun-ters the notion that most great companies require new innovationwaves or eras in order to grow.
2. Exploit a High Growth Market Segment
Opportunities exist in a lot of industries. Some industries havemore opportunities than others. Fresh industries such as Biotech-nology and Internet Retail spawned multiple Blueprint Companiesin the 1990s. However, industries such as Specialty Stores generat-ed the highest number of Blueprint Companies with 18 firms. Thisoccurred because there were multiple market segments to addresswithin this industry: office supplies, teenager fashion, and pet sup-plies to name a few. Right behind Specialty Stores was Propertyand Casualty Insurance with 15 companies. There was not onetechnology industry in the top five, which is astonishing. In con-trast, there are numerous cases where a single company arises outof an industry to become the only player to achieve $1 billion inrevenues—witness Harley-Davidson. When we interviewed the
14 Blueprint to a Billion
01 thomson 10/27/05 2:44 PM Page 14

CEOs in these top industries, we found a set of lessons that can beapplied to companies in any industry. More important, we heardthese CEOs indicate that their industries are not expected to be theleaders going forward in terms of generating the equivalent num-ber of new Blueprint Companies. This means that there is an op-portunity for other industries to become America’s leaders.
3. Marquee Customers Shape the Revenue Powerhouse
Customers can be more than customers. The best of them can serveas an extension of your sales force—they become your most effec-tive sales team! I call these Marquee Customers—that is, customerswho shape the company by testing and deploying the product, rec-ommending the company to their peers, and simply by providingexponential revenue growth on a per-customer basis. Think ofthese customers as one of a company’s most important assets.
Marquee Customers often exist with consumer companies. Forexample, eBay’s top customers are part of a feedback system thathelps shape eBay’s new services. These top customers are also apowerful word-of-mouth sales force to attract other customers.
The underlying driver for corporate exponential revenue growthis exponential revenue growth within each Marquee Customer.Maximizing customer lifecycle revenues is fundamental to achiev-ing exponential revenue growth per customer.
4. Leverage Big Brother Alliances for Breaking into New Markets
The complement to Marquee Customers is a Big Brother–LittleBrother alliance relationship. These alliances, in which a biggercompany helps a smaller one, provide credibility to the LittleBrother, give it market intelligence, and lead it to Marquee Custom-ers. It is a two-way street. Big Brothers also need Little Brothers tohelp them remain on the cutting edge of innovation. During ourinterviews with the Big Brother Masters, we learned that under-
The Blueprint Thesis 15
01 thomson 10/27/05 2:44 PM Page 15

standing the win–win motivations between partners can takelonger and is more important than their alliance agreement.Surprisingly, we found that Big Brothers find it as difficult findingthe right Little Brother as Little Brothers have in trying to get accessto the right Big Brother champion.
5. Become the Masters of Exponential Returns
A fairly common management behavior suggests that allocatingmore resources toward developing and introducing products willsolve innovation problems.4 This often leads to directing too muchinvestment resulting in an overinvestment situation. The technolo-gy industries serve to illustrate what it takes to create the highestvalue per company. To achieve such high market values relative tocompanies in other industries, they were cash flow positive earlyand sustained this positive cash flow to $1 billion revenue. I foundthat shareholder value is maximized by three factors: high revenueand revenue growth, high return on investment, and sustained rev-enue growth. To maximize shareholder value, a return on investedcapital that significantly exceeds the cost of capital is required.Delivering consistent performance across these three factors is thepath to success. Blueprint Companies implemented a process forexecuting, measuring key financial and customer metrics as well asproviding the incentive to their organization to achieve exponen-tial returns.
Shareholder returns for being a top-performing Blueprint Com-pany are more than compelling: Blueprint Companies on the four-year trajectory delivered an average of 87 percent returns to theirshareholders while exceeding analysts’ expectations 80 percent ofthe time!
6. The Management Team: Inside-Outside Leadership
One of the pivotal essentials that enables the other essentials to besimultaneously executed is a strategic leadership pairing in which
16 Blueprint to a Billion
01 thomson 10/27/05 2:44 PM Page 16
one leader (or team) faces outward toward markets, customers,alliances, and the community with the other leader (or team) focus-ing inward so as to optimize operations. Contrary to the somewhatpopular belief that one leader is “the” leader, this Inside-Outsideleadership pair is highly prevalent among Blueprint Companies:Microsoft, eBay, Yahoo!, Tractor Supply to name just a few. Theinside executive is typically the chief operating officer (COO); theexternal-facing executive is the chief executive officer (CEO).Together, they manage forward and innovate continuously,whether in product or marketing innovation. They make swiftdecisions—and quickly correct their mistakes. Most important,they have complete trust in and respect for one another. This pairworks to execute all the essentials simultaneously.
Leadership characteristics that distinguished the Inside-Outsidepairing include the consistent communication about the compa-ny’s direction and priorities; consistent values, particularly duringdefining moments; problem-solving skills; and having a passion toaddress customers’ unmet needs. They are hands-on leaders whocare about the business first—not hands off and self-centered.
7. The Board: Comprised of Essentials Experts
Blueprint boards were not packed with investors, as one wouldthink. Blueprint Companies recruited customers, alliance partners,and other Blueprint CEOs on the board and that makes a big dif-ference. I call them Essentials Experts because their role is linked tothe shaping and execution of one or more of the essentials. Becausemost investors have not scaled Blueprint Companies to $1 billion
The Blueprint Thesis 17
The bottom line is this: Board composition is a reflection of the execution of the essentials. It is important to balance man-agement and investors board members with outside memberswho are CEOs, customers, alliance partners, and communitymembers.
01 thomson 10/27/05 2:44 PM Page 17

revenue, CEOs who happened to be CEOs from BlueprintCompanies often were recruited to provide insight into exponen-tial growth. In contrast, boards composed of investors and man-agement tended to be associated with struggling companies.
Linking the Essentials
Do you have to do it all? You may be asking this question and sodid many of my initial readers and thought partners. The answeris: yes. This research shows how the Blueprint Companies execut-ed these essentials to average or above levels of performance whencompared to their counterparts in the masses that did not make itto $1 billion. Blueprint Companies created explicit processes forexecuting and linking the 7 Essentials. The creation of these pro-cesses was driven from previous experiences, intuitive problemsolving, or understanding what success required. Chapter 9 illus-trates that what differentiates Blueprint from non-BlueprintCompanies is the consistent execution of all essentials.
You may be thinking that the Blueprint Companies are just luckyand that is a fair question to be asking. MedImmune’s story may beinstructive.
MedImmune, Inc., one of the top 100 Blueprint Companies, wasat a crossroads in late 1993 with critics pondering its future. Thecompany had invested in the development of a drug, RespiGam, apolyclonal antibody that ultimately proved to be an importantadvance in preventing hospitalization of high-risk infants from a serious lower respiratory tract disease, Respiratory SyncytialVirus. Unfortunately, the path to success was bumpier than thecompany liked. Initially, the United States Food and Drug Admini-stration (FDA) did not approve MedImmune’s application to mar-ket the product. To answer the questions raised by the FDA, MedImmune’s management team, led by CEO Dr. Wayne T.Hockmeyer, conducted an additional clinical trial costing millionsof additional dollars and taking another year to complete. “Thestrategy that we pursued was ‘bet the farm,’” Dr. Hockmeyer told
18 Blueprint to a Billion
01 thomson 10/27/05 2:44 PM Page 18

The Washington Post at the time.5 He added that “employees weretense. They were single minded. They were focused. The entireorganization hummed.”
The company’s perseverance with RespiGam paid off, as it didwith its concurrent investment in the next-generation product,Synagis, which became the first monoclonal antibody approved bythe FDA to prevent an infectious disease. Synagis was approved inthe summer of 1998 and went on the market a few months later. AWashington Post article the following year called it “one of the mostsuccessful new products in the history of the biotech industry.”6
Now a $1-billion-a-year product with sales worldwide, Synagis hasproven the Post’s predictions to be right on. I asked Melvin D.Booth, MedImmune’s president and chief operating officer from1998 until 2004 (when MedImmune went from approximately $100million to $1 billion in total revenues), about the role of luck:
MedImmune focused on what I consider to be the top threeessentials of great business building: making sure it alwayshad the best team, focusing on delivering leading-edgeinnovation, and creating a new market for important, unmetmedical needs. MedImmune’s persistence and hard work,knowledge of the latest scientific advancements, and jointcommitment to getting the products approved add proof thatthe company’s ultimate success was not based just on luck. Theluck MedImmune did have involved such things as beingfortunate to have had FDA reviewers that understood thesafety and efficacy data submitted for RespiGam and Synagis,which at the time were among the first biological products tobe submitted to the agency.
How You Can Apply the Blueprint
You know you are on the right track in solving a problem when thesolution that you identify can help solve multiple problems. Inother words, you have identified the overarching problem and, in
The Blueprint Thesis 19
01 thomson 10/27/05 2:44 PM Page 19

the process, you discover the other interrelated problems. This wasone important problem-solving insight that I learned during myconsulting career. If solutions for the central problem of exponen-tial growth in business could be found, you could apply the Blue-print to a Billion™ approach to many associated problems such as:
• Strategy. You can use the Blueprint financial pattern, along withthe 7 Essentials, to contribute to shaping the business strategyand strategic initiatives. The Blueprint Companies provide aninvaluable set of financial and essentials benchmarks. They area reference tool to guide your particular situation.
• Leadership. The 7 Essentials can help you identify the skillsand roles of top-performing leaders, as well as the degree ofcross-functional leadership required to become a great com-pany. Also, they can serve as a guide for assessing manage-ment teams and roles to ensure that the team is managing allof the essentials for superior performance.
• Teams. For either functional or cross-functional teams, thesefindings can serve as a guide to align their performance or toprovide invaluable business context for cross-functionalteamwork.
• Financial Performance. The financial models explained in thisbook can serve as a valuable benchmark when planning forgrowth.
• Picking the Up-and-Coming Blueprint Companies. Viewing thehighest growth companies through the lens of the Blueprintessentials helps in selecting the best investments (personal orcorporate), choosing alliance partners, screening for newcustomers, supply-chain procurement (vendor selection),and even interviewing for a new employer.
• Education. This quantitative approach to business buildingcan be a contribution to corporate and academic education.
The Timeless Blueprint
Over the past three years, as I have presented these Blueprintobservations, people ask if I am using the most recent data—as
20 Blueprint to a Billion
01 thomson 10/27/05 2:44 PM Page 20
though the pattern changes with this quarter’s hot companies orhot sectors. The good news is that the pattern is consistent. With astatistically significant population, outcomes are more a questionof frequency versus a unique outcome.
Think of this work as a search for the pattern of those companiesthat have gone before us. The enduring essentials, linked to finan-cial performance, remain true for building great companies. Unlikea number of other business research efforts, this work is not static.The list of Blueprint Companies naturally evolves. That said, whatI hope to prove is that these findings are part of a megatrend.Therefore, 10 years from now, the expectation should be to find agrowing number of Blueprint Companies and to see that they exe-cuted these same 7 Essentials to achieve exponential growth.
What is new and exciting is that some of today’s “hot-growthcompanies” fit the Blueprint pattern. For example, in the 2004 issueof BusinessWeek’s special report on “Hot Growth Companies,” thewinners identified for highest shareholder return were BlueprintCompanies with their two-year returns shown in parentheses:Career Education (184 percent), International Game Technology(142 percent), and Apollo Group (135 percent).7
In fact, the United States has been generating BlueprintCompanies in good economic times and bad. Looking at the pat-tern for this timeless consistency, I found that an average of 31 newBlueprint Companies per year has been generated in this country(see Figure 1.9). You may be thinking, as I did, that this averageshould be highly volatile. During the past five years the pattern hasactually been quite consistent! Compared to the pre-2000 period,the United States continues to track with an average of 28 to 37companies each year. Right in line with the 10-year average of 31.
The United States’ challenge is not to sustain the run rate in thelow 30s, but to better the 10-year average of 31 companies per year.The options to address this challenge are that either more companies mustbe funded or the success rate of funded companies must be improved.
As you immerse yourself in the coming chapters, keep one keypoint in mind. This book is not about one unique company, itsinnovation, time period, innovation era, or the financial returns
The Blueprint Thesis 21
01 thomson 10/27/05 2:44 PM Page 21

achieved; it is about the common success-based pattern shared byall, independent of economic cycle. It is about how you can use the7 Essentials to better your business, organization, or teams in orderto produce exponential growth. It is about executing the 7Essentials and linking them. It is about taking the actions that mat-ter while avoiding pitfalls.
Can you imagine building a house without a blueprint? A blue-print serves as a common framework for teamwork, terminology,design, linking parts, and as a measure for progress. Whatever youare building, your execution will be enhanced if you employ ablueprint. Whether you aspire to achieve exponential growth or areexperiencing it today, the application of the 7 Essentials, which aredetailed in the following chapters, should help you achieve enhanced execution.
The book builds these 7 Essentials in a logical order, startingwith the Big Idea in the Essentials Triangle framework, so thatwhen you arrive at the Linking the Essentials chapter, Chapter 9,you will have the background and foundation to put it all togeth-er. As we transition from this Blueprint Thesis, you will find eachessential described with frameworks augmented by illustrations,stories, and interviews by leaders who have created BlueprintCompanies.
22 Blueprint to a Billion
98
20 24 22
4349
21
3329 31
37
28
1994 96 2000 02 04
FIGURE 1.9
Rate of Blueprint Companies Achieving $1 Billion
Number of Companies/YearAverage = 31
Source: Standard & Poor’s Compustat, Blueprint analysis
01 thomson 10/27/05 2:44 PM Page 22