The Blackburn with Darwen, Hyndburn, Rossendale and Ribble … · This report is the Travel to Work...
48
The Blackburn with Darwen, Hyndburn, Rossendale and Ribble Valley Labour Market Intelligence Report Part of the 2018 Lancashire Labour Market Intelligence Toolkit
Transcript of The Blackburn with Darwen, Hyndburn, Rossendale and Ribble … · This report is the Travel to Work...
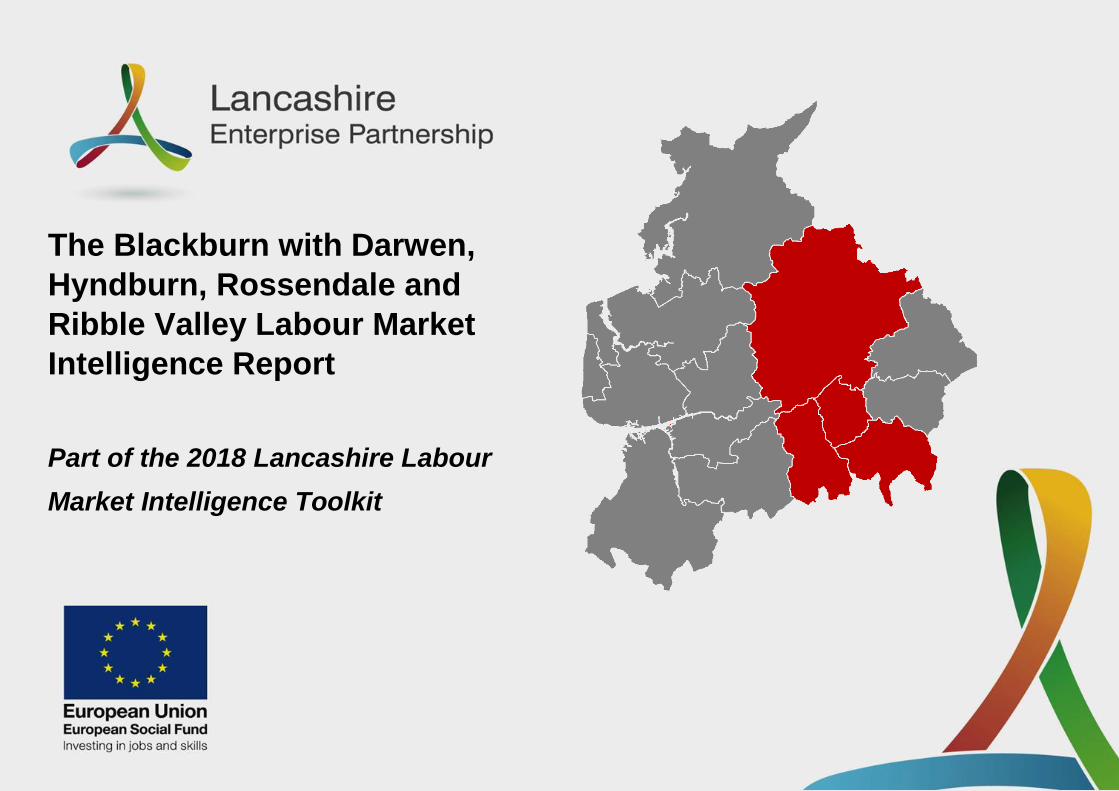
The Blackburn with Darwen,
Hyndburn, Rossendale and
Ribble Valley Labour Market
Intelligence Report
Part of the 2018 Lancashire Labour
Market Intelligence Toolkit
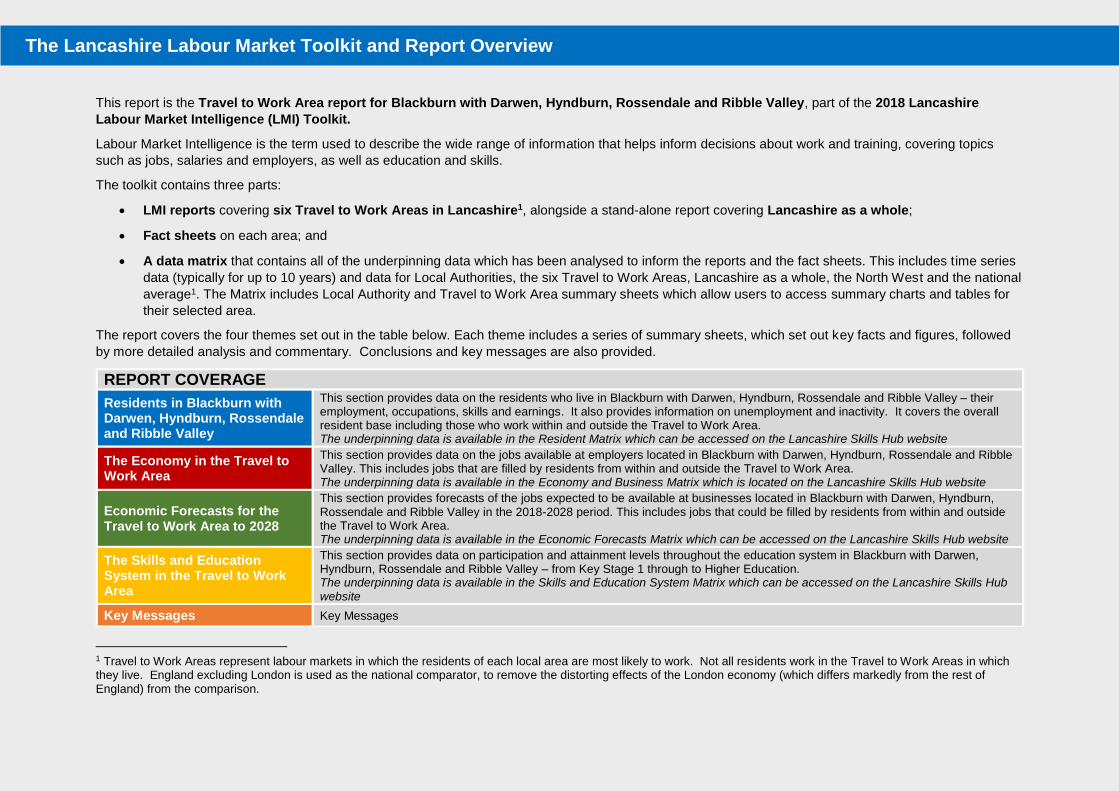
This report is the Travel to Work Area report for Blackburn with Darwen, Hyndburn, Rossendale and Ribble Valley, part of the 2018 Lancashire
Labour Market Intelligence (LMI) Toolkit.
Labour Market Intelligence is the term used to describe the wide range of information that helps inform decisions about work and training, covering topics
such as jobs, salaries and employers, as well as education and skills.
The toolkit contains three parts:
LMI reports covering six Travel to Work Areas in Lancashire1, alongside a stand-alone report covering Lancashire as a whole;
Fact sheets on each area; and
A data matrix that contains all of the underpinning data which has been analysed to inform the reports and the fact sheets. This includes time series
data (typically for up to 10 years) and data for Local Authorities, the six Travel to Work Areas, Lancashire as a whole, the North West and the national
average1. The Matrix includes Local Authority and Travel to Work Area summary sheets which allow users to access summary charts and tables for
their selected area.
The report covers the four themes set out in the table below. Each theme includes a series of summary sheets, which set out key facts and figures, followed
by more detailed analysis and commentary. Conclusions and key messages are also provided.
1 Travel to Work Areas represent labour markets in which the residents of each local area are most likely to work. Not all residents work in the Travel to Work Areas in which they live. England excluding London is used as the national comparator, to remove the distorting effects of the London economy (which differs markedly from the rest of England) from the comparison.
REPORT COVERAGE
Residents in Blackburn with Darwen, Hyndburn, Rossendale and Ribble Valley
This section provides data on the residents who live in Blackburn with Darwen, Hyndburn, Rossendale and Ribble Valley – their employment, occupations, skills and earnings. It also provides information on unemployment and inactivity. It covers the overall resident base including those who work within and outside the Travel to Work Area. The underpinning data is available in the Resident Matrix which can be accessed on the Lancashire Skills Hub website
The Economy in the Travel to Work Area
This section provides data on the jobs available at employers located in Blackburn with Darwen, Hyndburn, Rossendale and Ribble Valley. This includes jobs that are filled by residents from within and outside the Travel to Work Area. The underpinning data is available in the Economy and Business Matrix which is located on the Lancashire Skills Hub website
Economic Forecasts for the Travel to Work Area to 2028
This section provides forecasts of the jobs expected to be available at businesses located in Blackburn with Darwen, Hyndburn, Rossendale and Ribble Valley in the 2018-2028 period. This includes jobs that could be filled by residents from within and outside the Travel to Work Area. The underpinning data is available in the Economic Forecasts Matrix which can be accessed on the Lancashire Skills Hub website
The Skills and Education System in the Travel to Work Area
This section provides data on participation and attainment levels throughout the education system in Blackburn with Darwen, Hyndburn, Rossendale and Ribble Valley – from Key Stage 1 through to Higher Education. The underpinning data is available in the Skills and Education System Matrix which can be accessed on the Lancashire Skills Hub website
Key Messages Key Messages
The Lancashire Labour Market Toolkit and Report Overview
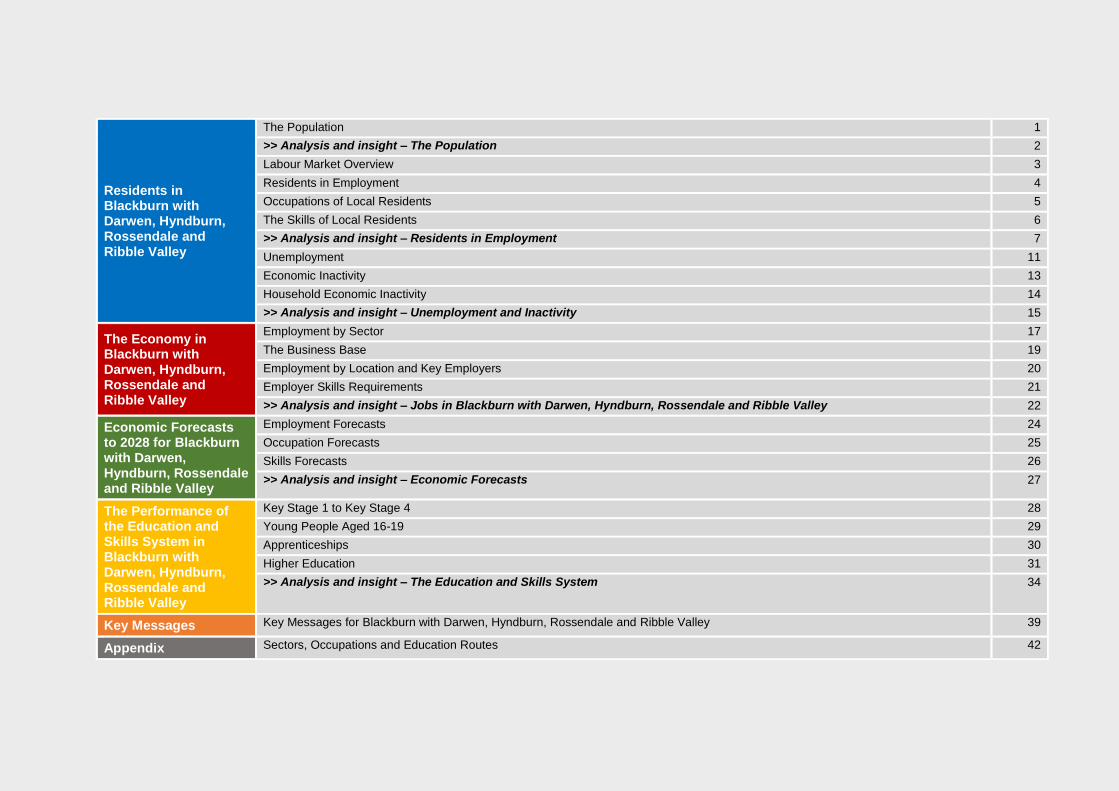
Residents in Blackburn with Darwen, Hyndburn, Rossendale and Ribble Valley
The Population 1
>> Analysis and insight – The Population 2
Labour Market Overview 3
Residents in Employment 4
Occupations of Local Residents 5
The Skills of Local Residents 6
>> Analysis and insight – Residents in Employment 7
Unemployment 11
Economic Inactivity 13
Household Economic Inactivity 14
>> Analysis and insight – Unemployment and Inactivity 15
The Economy in Blackburn with Darwen, Hyndburn, Rossendale and Ribble Valley
Employment by Sector 17
The Business Base 19
Employment by Location and Key Employers 20
Employer Skills Requirements 21
>> Analysis and insight – Jobs in Blackburn with Darwen, Hyndburn, Rossendale and Ribble Valley 22
Economic Forecasts to 2028 for Blackburn with Darwen, Hyndburn, Rossendale and Ribble Valley
Employment Forecasts 24
Occupation Forecasts 25
Skills Forecasts 26
>> Analysis and insight – Economic Forecasts 27
The Performance of the Education and Skills System in Blackburn with Darwen, Hyndburn, Rossendale and Ribble Valley
Key Stage 1 to Key Stage 4 28
Young People Aged 16-19 29
Apprenticeships 30
Higher Education 31
>> Analysis and insight – The Education and Skills System 34
Key Messages Key Messages for Blackburn with Darwen, Hyndburn, Rossendale and Ribble Valley 39
Appendix Sectors, Occupations and Education Routes 42
Report Contents
Overview of the Population Population Growth: The Past 10 Years (2006-2016)
Population Forecasts: The Next 10 Years (2018-2028)
Population by Age Band
BwD, H, R and RV Lancashire North West
England minus London
0-14 70,400 20% 18% 18% 18%
15-19 22,000 6% 6% 6% 6%
20-24 19,700 6% 6% 7% 6%
25-34 44,300 12% 12% 13% 13%
35-44 44,100 12% 12% 12% 12%
45-54 51,800 15% 14% 14% 14%
55-64 42,200 12% 12% 12% 12%
65+ 61,900 17% 20% 18% 19%
The Population in Blackburn with Darwen, Hyndburn, Rossendale and Ribble Valley – Who Lives in the Area?
Sources: Mid-Year Population Estimates, Census, Mid-Year Population Projections, 2016 Click to return to contents page 1
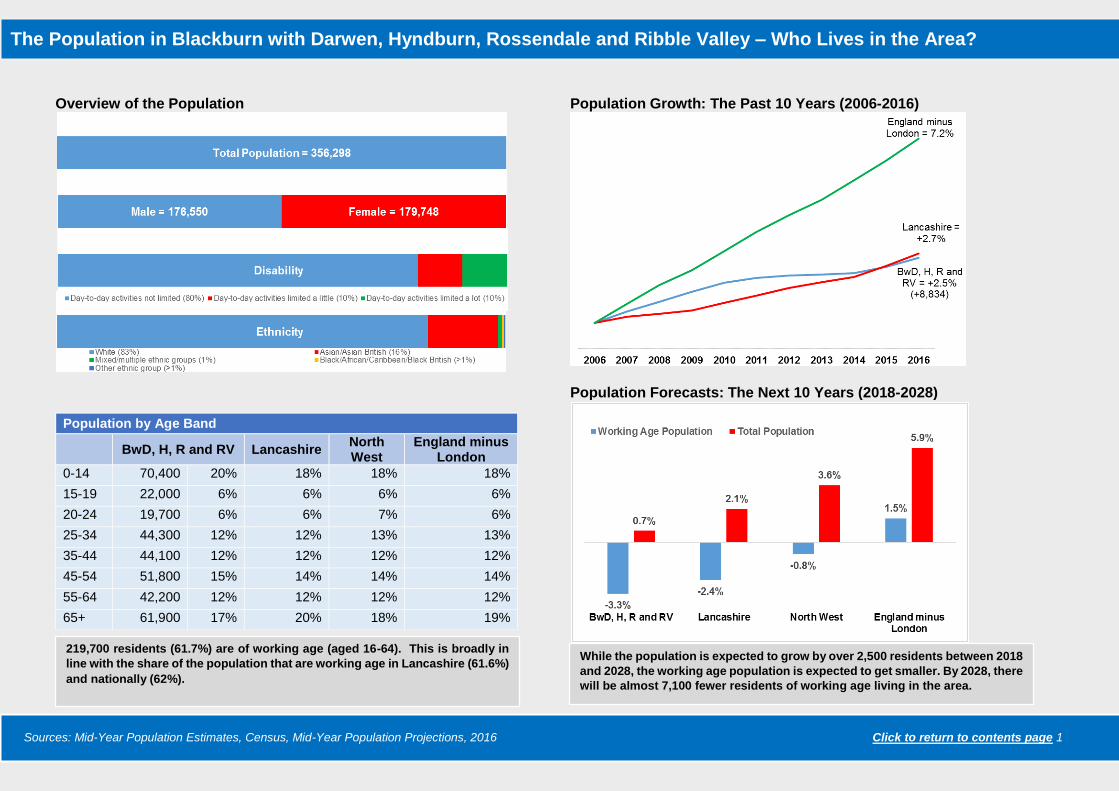
219,700 residents (61.7%) are of working age (aged 16-64). This is broadly in
line with the share of the population that are working age in Lancashire (61.6%)
and nationally (62%).
While the population is expected to grow by over 2,500 residents between 2018
and 2028, the working age population is expected to get smaller. By 2028, there
will be almost 7,100 fewer residents of working age living in the area.
Total Population
The Blackburn with Darwen, Hyndburn, Rossendale and Ribble Valley
Travel to Work Area is home to a population of 356,298 people, just under
one quarter of the Lancashire total (24.0%). The population is the second
largest of the six Travel to Work Areas in Lancashire, marginally lower
than in Preston, Chorley and South Ribble (366,270).
Blackburn with Darwen is the largest of the four local authority areas, with
just over 147,000 residents (41.3% of the Travel to Work Area total).
Hyndburn, Rossendale and Ribble Valley have 81,000, 70,000 and 59,000
residents respectively.
The population of the TTW area has grown by 2.5% over the past ten
years (2006-2016), with an additional 8,834 residents. This rate of growth
is slightly below the population growth seen in Lancashire as a whole
(+2.7%), and well below the rate of growth seen nationally over the same
period (+7.2%).
Gender and Ethnic Make-Up of the Population
The population is split almost evenly between males and females, with a
slightly higher proportion of females in Ribble Valley (50.9%) than in the
other three areas.
Just under 83% of the population across the Travel to Work is of white
ethnicity, with Asian / Asian British people accounting for a further 16%.
Blackburn with Darwen differs markedly from the other three local authority
areas, with 28.1% of its population from the Asian / Asian British ethnic
group, compared to 11.2% in Hyndburn, 5.0% in Rossendale and 1.3% in
Ribble Valley. This is by far the highest Asian / Asian British population in
Lancashire.
Population Demographics
The age profile of Blackburn with Darwen, Hyndburn, Rossendale and
Ribble Valley is slightly younger, on average, than is the case in
Lancashire as a whole, across the North West or nationally. The 0-14
years age group accounts for 20% of the total population, compared to
18% in Lancashire and nationally. Only 17% are aged over 65, compared
to 20% in Lancashire and 19% nationally.
Working Age Population
There are 219,700 people of working age (16-64 year olds) in Blackburn
with Darwen, Hyndburn, Rossendale and Ribble Valley, 61.7% of the total
population. This is just under one quarter (24.0%) of the Lancashire total.
Both Blackburn with Darwen and Rossendale have a higher proportion of
residents of working age than is the case in Lancashire as a whole, at
62.4%. Ribble Valley is below the Lancashire average at 59.5%.
The working age population has fallen slightly over the past ten years, by
1,100 people, or -0.5%, in contrast to the population as a whole. This is a
much slower rate of growth than seen in the working age population
nationally over the same period (+3.6%) but has not been as severe as
across Lancashire as a whole, where the working age population has
fallen by 1.0%.
Population Projections
The population of Blackburn with Darwen, Hyndburn, Rossendale and
Ribble Valley is expected to continue to grow over the next ten years, with
the Office for National Statistics forecasting an additional 2,547 residents
(+0.7%). This is a slower rate of growth than is expected for Lancashire
as a whole (+2.1%). Rossendale (4.0%) and Ribble Valley (2.7%) are
expected to have by far the fastest rate of growth, while small population
declines are anticipated for Blackburn with Darwen and Hyndburn.
In contrast, the working age population within the area is expected to fall,
by 7,052 people, or -3.3%, speeding up the decline seen over the past ten
years. The change in Rossendale is expected to be negligible, although
strong declines are expected in Blackburn with Darwen (-3,296), Hyndburn
(-2,311) and Ribble Valley (-1,258).
The Population in Blackburn with Darwen, Hyndburn, Rossendale and Ribble Valley – Who Lives in the Area?
Sources: Mid-Year Population Estimates, Census, Mid-Year Population Projections, 2016 Click to return to contents page 2
Employment Residents who have a job or are self-employed
(either within or outside the Travel to Work Area)
Unemployment Residents without a job, who have been actively seeking
work (within the last four weeks)
Inactivity Residents who are not in work and have not sought work in the last four weeks
(e.g. looking after family/home, studying, long-term sick and retired)
What is happening in the Blackburn with Darwen, Hyndburn,
Rossendale and Ribble Valley Travel to
Work Area?
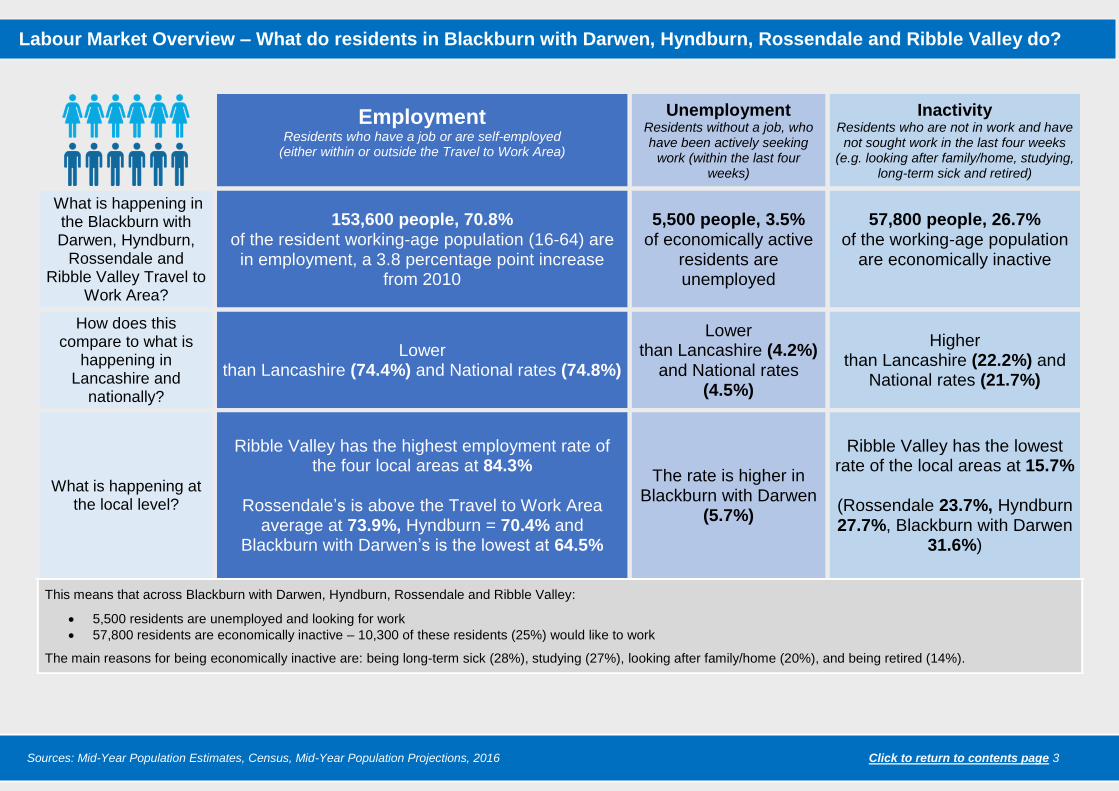
153,600 people, 70.8% of the resident working-age population (16-64) are in employment, a 3.8 percentage point increase
from 2010
5,500 people, 3.5% of economically active
residents are unemployed
57,800 people, 26.7% of the working-age population
are economically inactive
How does this compare to what is
happening in Lancashire and
nationally?
Lower than Lancashire (74.4%) and National rates (74.8%)
Lower than Lancashire (4.2%)
and National rates (4.5%)
Higher than Lancashire (22.2%) and
National rates (21.7%)
What is happening at the local level?
Ribble Valley has the highest employment rate of the four local areas at 84.3%
Rossendale’s is above the Travel to Work Area
average at 73.9%, Hyndburn = 70.4% and Blackburn with Darwen’s is the lowest at 64.5%
The rate is higher in Blackburn with Darwen
(5.7%)
Ribble Valley has the lowest rate of the local areas at 15.7%
(Rossendale 23.7%, Hyndburn 27.7%, Blackburn with Darwen
31.6%)
This means that across Blackburn with Darwen, Hyndburn, Rossendale and Ribble Valley:
5,500 residents are unemployed and looking for work
57,800 residents are economically inactive – 10,300 of these residents (25%) would like to work
The main reasons for being economically inactive are: being long-term sick (28%), studying (27%), looking after family/home (20%), and being retired (14%).
Labour Market Overview – What do residents in Blackburn with Darwen, Hyndburn, Rossendale and Ribble Valley do?
Sources: Mid-Year Population Estimates, Census, Mid-Year Population Projections, 2016 Click to return to contents page 3
Where do residents work?
Residents who work…
Blackburn with Darwen, Hyndburn,
Rossendale and Ribble Valley
Lancashire England minus
London
No. %
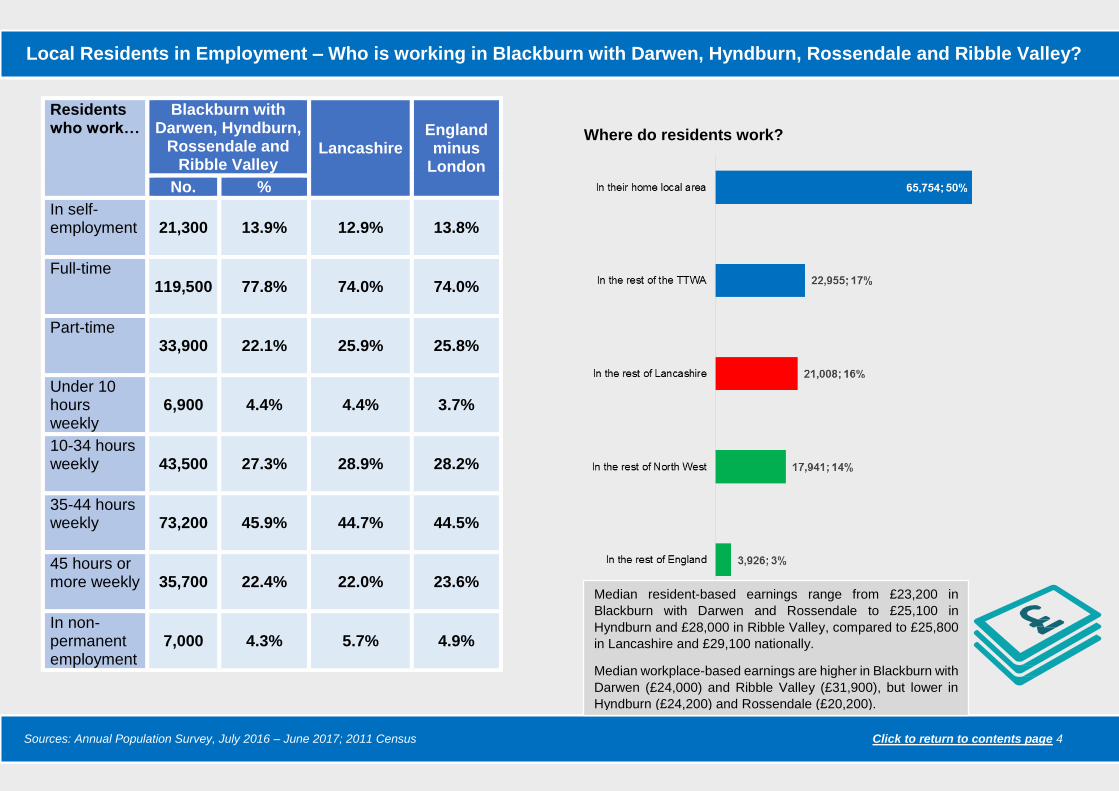
In self-employment
21,300 13.9% 12.9% 13.8%
Full-time
119,500 77.8% 74.0% 74.0%
Part-time
33,900 22.1% 25.9% 25.8%
Under 10 hours weekly
6,900 4.4% 4.4% 3.7%
10-34 hours weekly
43,500 27.3% 28.9% 28.2%
35-44 hours weekly
73,200 45.9% 44.7% 44.5%
45 hours or more weekly
35,700 22.4% 22.0% 23.6%
In non-permanent employment
7,000 4.3% 5.7% 4.9%
Local Residents in Employment (2) – Who is working in Preston, Chorley and South Ribble? June 2016 – July 2017
Sources: Annual Population Survey Click to return to contents page Sources: Annual Population Survey, July 2016 – June 2017 **Due to sample sizes, a precise 2017 rate is unavailable for South Ribble Click to return to contents page 3 Sources: Annual Population Survey, July 2016 – June 2017; 2011 Census Click to return to contents page 4
Local Residents in Employment – Who is working in Blackburn with Darwen, Hyndburn, Rossendale and Ribble Valley?
Median resident-based earnings range from £23,200 in
Blackburn with Darwen and Rossendale to £25,100 in
Hyndburn and £28,000 in Ribble Valley, compared to £25,800
in Lancashire and £29,100 nationally.
Median workplace-based earnings are higher in Blackburn with
Darwen (£24,000) and Ribble Valley (£31,900), but lower in
Hyndburn (£24,200) and Rossendale (£20,200).
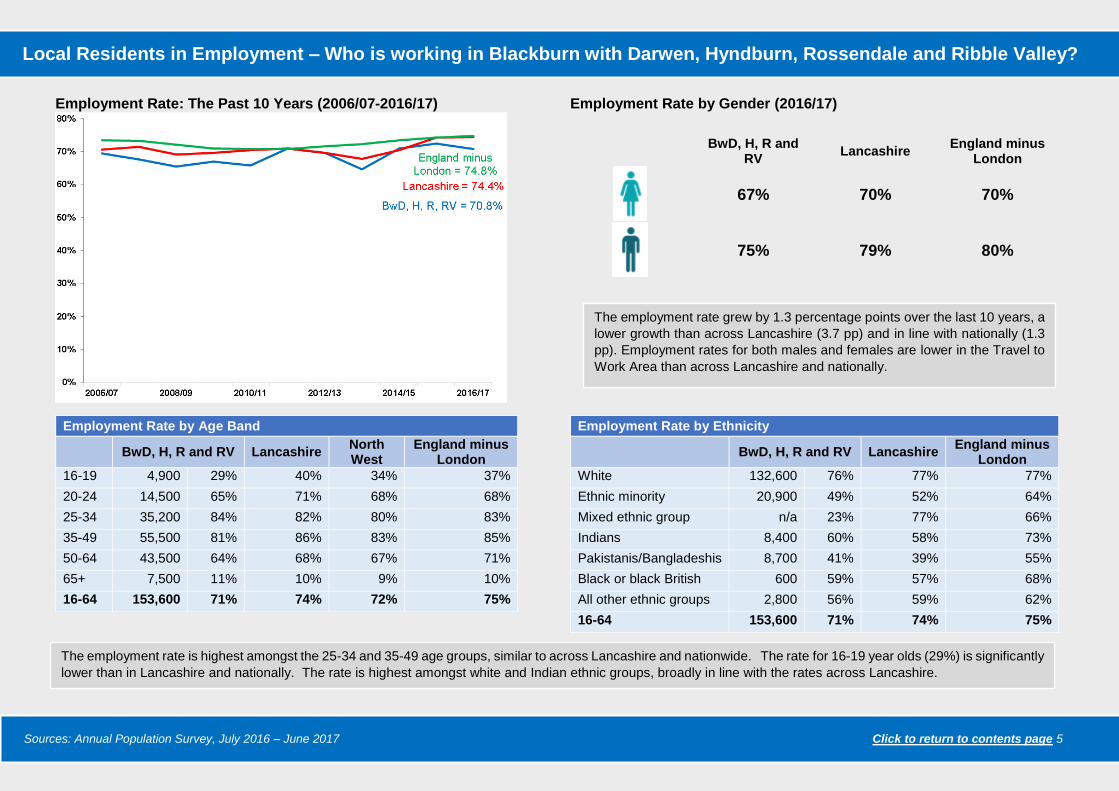
Employment Rate: The Past 10 Years (2006/07-2016/17) Employment Rate by Gender (2016/17)
BwD, H, R and
RV Lancashire
England minus London
67% 70% 70%
75% 79% 80%
Employment Rate by Age Band
BwD, H, R and RV Lancashire North West
England minus London
16-19 4,900 29% 40% 34% 37%
20-24 14,500 65% 71% 68% 68%
25-34 35,200 84% 82% 80% 83%
35-49 55,500 81% 86% 83% 85%
50-64 43,500 64% 68% 67% 71%
65+ 7,500 11% 10% 9% 10%
16-64 153,600 71% 74% 72% 75%
Employment Rate by Ethnicity
BwD, H, R and RV Lancashire England minus
London
White 132,600 76% 77% 77%
Ethnic minority 20,900 49% 52% 64%
Mixed ethnic group n/a 23% 77% 66%
Indians 8,400 60% 58% 73%
Pakistanis/Bangladeshis 8,700 41% 39% 55%
Black or black British 600 59% 57% 68%
All other ethnic groups 2,800 56% 59% 62%
16-64 153,600 71% 74% 75%
The employment rate grew by 1.3 percentage points over the last 10 years, a
lower growth than across Lancashire (3.7 pp) and in line with nationally (1.3
pp). Employment rates for both males and females are lower in the Travel to
Work Area than across Lancashire and nationally.
The employment rate is highest amongst the 25-34 and 35-49 age groups, similar to across Lancashire and nationwide. The rate for 16-19 year olds (29%) is significantly
lower than in Lancashire and nationally. The rate is highest amongst white and Indian ethnic groups, broadly in line with the rates across Lancashire.
Sources: Annual Population Survey, July 2016 – June 2017 Click to return to contents page 5
Local Residents in Employment – Who is working in Blackburn with Darwen, Hyndburn, Rossendale and Ribble Valley?
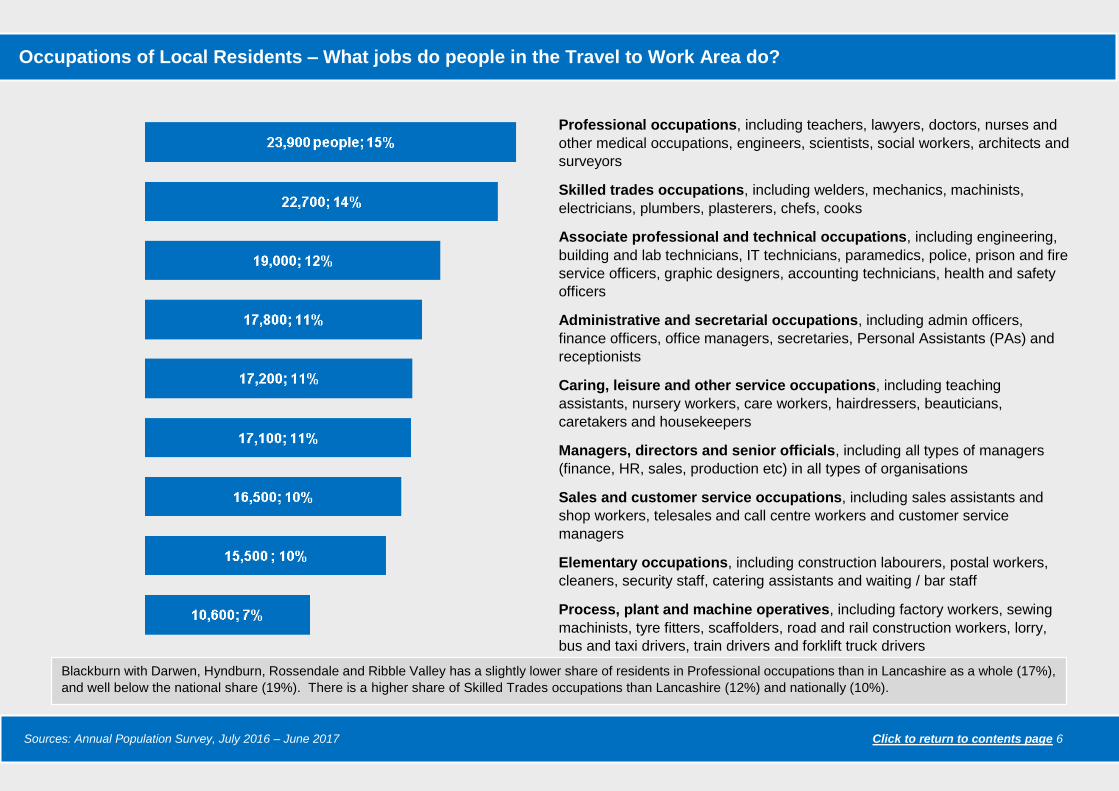
Occupations of Local Residents – What jobs do people in the Travel to Work Area do?
Sources: Annual Population Survey, July 2016 – June 2017 Click to return to contents page 6
Professional occupations, including teachers, lawyers, doctors, nurses and
other medical occupations, engineers, scientists, social workers, architects and
surveyors
Skilled trades occupations, including welders, mechanics, machinists,
electricians, plumbers, plasterers, chefs, cooks
Associate professional and technical occupations, including engineering,
building and lab technicians, IT technicians, paramedics, police, prison and fire
service officers, graphic designers, accounting technicians, health and safety
officers
Administrative and secretarial occupations, including admin officers,
finance officers, office managers, secretaries, Personal Assistants (PAs) and
receptionists
Caring, leisure and other service occupations, including teaching
assistants, nursery workers, care workers, hairdressers, beauticians,
caretakers and housekeepers
Managers, directors and senior officials, including all types of managers
(finance, HR, sales, production etc) in all types of organisations
Sales and customer service occupations, including sales assistants and
shop workers, telesales and call centre workers and customer service
managers
Elementary occupations, including construction labourers, postal workers,
cleaners, security staff, catering assistants and waiting / bar staff
Process, plant and machine operatives, including factory workers, sewing
machinists, tyre fitters, scaffolders, road and rail construction workers, lorry,
bus and taxi drivers, train drivers and forklift truck drivers
Blackburn with Darwen, Hyndburn, Rossendale and Ribble Valley has a slightly lower share of residents in Professional occupations than in Lancashire as a whole (17%),
and well below the national share (19%). There is a higher share of Skilled Trades occupations than Lancashire (12%) and nationally (10%).
A greater share of the resident population have no qualifications (6% v 3%), while a larger share of those in work have qualifications at NVQ4 and above (41% v 37%).
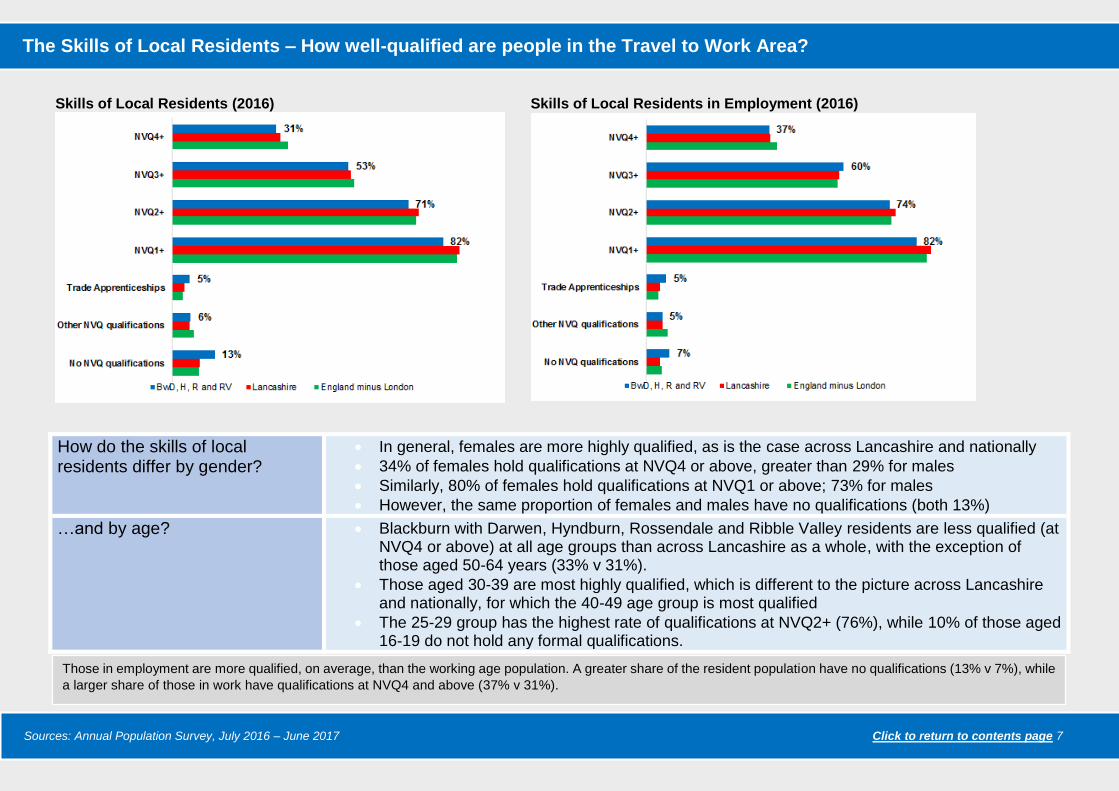
Skills of Local Residents (2016) Skills of Local Residents in Employment (2016)
How do the skills of local residents differ by gender?
In general, females are more highly qualified, as is the case across Lancashire and nationally
34% of females hold qualifications at NVQ4 or above, greater than 29% for males
Similarly, 80% of females hold qualifications at NVQ1 or above; 73% for males
However, the same proportion of females and males have no qualifications (both 13%)
…and by age? Blackburn with Darwen, Hyndburn, Rossendale and Ribble Valley residents are less qualified (at NVQ4 or above) at all age groups than across Lancashire as a whole, with the exception of those aged 50-64 years (33% v 31%).
Those aged 30-39 are most highly qualified, which is different to the picture across Lancashire and nationally, for which the 40-49 age group is most qualified
The 25-29 group has the highest rate of qualifications at NVQ2+ (76%), while 10% of those aged 16-19 do not hold any formal qualifications.
The Skills of Local Residents – How well-qualified are people in the Travel to Work Area?
Those in employment are more qualified, on average, than the working age population. A greater share of the resident population have no qualifications (13% v 7%), while
a larger share of those in work have qualifications at NVQ4 and above (37% v 31%).
Sources: Annual Population Survey, July 2016 – June 2017 Click to return to contents page 7
Residents in Employment in Blackburn with Darwen, Hyndburn,
Rossendale and Ribble Valley
Approximately 153,600 (70.8%) of residents of working age (aged 16-64)
are in employment. This includes residents who work both within and
outside the Travel to Work Area. Blackburn with Darwen, Hyndburn,
Rossendale and Ribble Valley has the lowest employment rate of the
Travel to Work Areas across Lancashire and is well below both the
Lancashire (74.4%) and national (74.8%) average.
The employment rate has fluctuated over the past ten years, although it
has broadly remained on or below the averages across Lancashire and
nationally. Overall, the employment rate has increased (by 1.3 percentage
points) and this is slower than the increase across Lancashire (3.7
percentage points) but is in line with the growth nationally (1.3 percentage
points).
The employment rate varies widely within the Travel to Work Area. The
low employment rate is driven by Blackburn with Darwen, where 64.5% of
working age residents are employed. In contrast, the employment rate in
Ribble Valley (84.3%) is well above both the Lancashire and national
average, while the Rossendale rate (73.9%) is in line with the Lancashire
rate. For Blackburn with Darwen to close the gap with the Lancashire
average, an additional 9,000 working age residents would need to enter
employment (equivalent to a 15% increase).
Characteristics of those in Employment
In line with national trends, the employment rate for men (75%) is higher
than the employment rate for women (67%). The difference in the rates (of
eight percentage points) is smaller than the difference in Lancashire and
nationally. This does however mask differences at the local area,
particularly in relation to Rossendale, where the employment rate for
females (74.1%) marginally exceeds the rate for males (73.7%).
The employment rate varies by age group and is highest amongst those
aged 25-49, as is the case across Lancashire and nationally. The key
differences in the employment profile by age relate to the youngest and
oldest age groups. While the employment rate for those aged 16-19 is
significantly lower in Blackburn with Darwen, Hyndburn, Rossendale and
Ribble Valley than in Lancashire and nationally, the rate for those age 65+
is higher.
There are also variances by ethnicity. The employment rate is highest
amongst white and Indian groups, and these are broadly in line with the
employment rates for these groups in Lancashire and nationally. There is
a particularly low employment rate amongst the mixed ethnic group in
Blackburn with Darwen, Hyndburn, Rossendale and Ribble Valley,
especially when compared to the Lancashire and national average. As is
the case across Lancashire, there is also particularly low employment
rates amongst the Pakistani and Bangladeshi group.
Types of Employment
The basis on which residents are employed varies. One in seven working
age residents (13.9%) in Blackburn with Darwen, Hyndburn, Rossendale
and Ribble Valley are self-employed. This is one of the higher rates across
the Travel to Work Areas and is slightly higher than Lancashire (12.9%)
and national (13.8%) average. The relatively high rate across the Travel
to Work Area reflects particularly high levels of self-employment in Ribble
Valley (20.4%), while Hyndburn (13.2%) and Blackburn with Darwen and
Rossendale (both 12.0%) are much closer to the Lancashire average.
Over three quarters of working age residents in employment are employed
on a full time basis, with over two thirds working over 35 hours per week.
There is a greater tendency for full-time working in the Travel to Work Area
than across Lancashire and nationally, although the profile of the number
of hours that people typically work largely aligns with the Lancashire and
national profiles.
There are also residents who work on a non-permanent basis, including
fixed period contracts, agency temping casual work, casual work and
seasonal work. This applies to 4.3% of working age residents in Blackburn
with Darwen, Hyndburn, Rossendale and Ribble Valley, compared to 4.9%
nationally and 5.7% across Lancashire. The rate of non-permanent work
varies across local areas, from 4.3%-4.8% in Hyndburn and Blackburn
with Darwen (where data allows comparisons to be made).
Residents in Employment in Blackburn with Darwen, Hyndburn, Rossendale and Ribble Valley
Sources: Annual Population Survey, July 2016 – June 2017 Click to return to contents page 8
Occupations
Residents in employment hold jobs across all occupational categories. The
largest occupational group amongst residents is professional occupations,
accounting for 14.8% of those in employment. This is followed by skilled
trades and associate, professional and technical occupations.
The occupational profile of residents largely aligns with the Lancashire and
national profile. The greatest differences with the national profile include
the higher proportion of residents working in skilled trades and sales and
customer service occupations, and the lower proportion of residents
working in professional and elementary occupations. Although these
differences only tend to be 2-3 percentage points, they mask further
variation at the local level.
Key points to note at the local level include:
Highly skilled occupations: Overall, over one third (37%) of residents
from the Travel to Work Area are employed in highly skilled occupations
(managers, directors and senior officials; professional occupations; and
associate professional and technical occupations). This is slightly below
the Lancashire average (39%), and well below the national average (44%).
Although a much higher proportion of Rossendale’s residents work in
highly skilled occupations (46%), the proportion is much lower in both
Blackburn with Darwen and Ribble Valley (both 36%) and in
Hyndburn(33%). Amongst Blackburn with Darwen’s residents, the
managers, directors and senior officials occupational group is
underrepresented, although there is a larger share of professional and
associate professional and technical occupations than the Travel to Work
Area as a whole.
Across the remaining occupational groups: Ribble Valley has a
particularly high proportion of residents (15%) working in administrative
and secretarial occupations, compared to Blackburn with Darwen (11%),
Hyndburn (9%) and Rossendale (8%) which largely align with the
Lancashire (11%) and national (10%) average.
Hyndburn has a particularly high proportion of residents (19%) working in
skilled trade occupations, while the proportion in Blackburn with Darwen
(12%) is largely in line with the Lancashire (12%) and national (11%)
average.
In line with the Lancashire wide average, Hyndburn and Blackburn with
Darwen have a high proportion of residents working in caring, leisure and
service occupations (13% and 11% respectively), whereas Ribble Valley
is in line with the national average (10%).
Hyndburn also has a higher proportion of residents working in sales and
customer service than across the other local areas, while process, plant
and machine occupations are more common in Blackburn with Darwen
and elementary occupations in Ribble Valley.
Travel to Work
Sixty-seven per cent of residents live and work within the Blackburn with
Darwen, Hyndburn, Rossendale and Ribble Valley Travel to Work Area.
Half of residents in employment work in their home local area, while 17%
work within the wider Travel to Work Area. The large majority of residents
who work outside the area, travel to other parts of Lancashire (16%) or
across the wider North West region (14%).
Earnings
Across the Travel to Work Area, the median earnings of residents are
below the national average, ranging from £23,100 in Rossendale and
£23,200 in Blackburn with Darwen to £25,100 in Hyndburn and £28,000 in
Ribble Valley. This is equivalent to between 79% and 96% of the national
average (£29,100). The median earnings of Hyndburn residents (£25,100)
is just below the average for Lancashire (£25,800).
When the median earnings of residents from each local area (i.e. resident-
based earning) are compared to the median earnings of the jobs based in
each area (i.e. workplace-based earnings), the data suggests that:
Residents from Rossendale and Hyndburn typically travel to
access higher paid employment, with workplace-based earnings
lower than resident based earnings.
Sources: Annual Population Survey, July 2016 – June 2017; 2011 Census Click to return to contents page 9
Residents in Employment in Blackburn with Darwen, Hyndburn, Rossendale and Ribble Valley
Jobs in Ribble Valley typically pay more than the national average,
despite Ribble Valley residents earning below the national
average, suggesting others commute into the area for the high
paid jobs.
It should also be noted that workplace-based earnings across the Travel to
Work Area are equivalent to between 69% and 110% of the national
average.
The Skills Profile
Overall, the working age population in Blackburn with Darwen, Hyndburn,
Rossendale and Ribble Valley are slightly less qualified than the working
age population across Lancashire and nationally. At all skills levels,
including higher level skills (level 4+), the area underperforms the
Lancashire and national average. There is also a larger proportion of
working age residents that hold no qualifications.
At the local level the profile varies, with the poor overall performance
driven by Blackburn with Darwen and Hyndburn, with both areas typically
lagging behind the Lancashire and national average at all levels. The skills
profile of residents in Ribble Valley, however, is quite different, with 42%
holding qualifications at Level 4 or above (compared to 35% nationally and
33% in Chorley). Similarly, a higher proportion of residents hold
qualifications at Level 3 or above (71% compared to 55% nationally) and
Level 2 or above (89% compared to 74%). The skills profile for
Rossendale also outperforms the national average at these two levels.
Residents who are in employment are, on average, more qualified than the
working age population. For example, 60% of those in employment hold
qualifications at Level 3 or above compared to 53% of the working age
population. The difference is the same as skills levels increase, with 37%
of those in employment holding qualifications at Level 4 or above,
compared to 31% of the working age population. This highlights the
importance of qualifications in securing employment.
Residents in Employment in Blackburn with Darwen, Hyndburn, Rossendale and Ribble Valley
Sources: Annual Population Survey, July 2016 – June 2017; 2011 Census Click to return to contents page 10
Unemployment Rate: The Past 10 Years (2006/07-2016/17) Unemployment Rate by Gender (2016/17)
BwD, H, R and RV
Lancashire England minus
London
3% 4% 4%
4% 5% 5%
Unemployment Rate by Age Band
BwD, H, R and RV Lancashire North West
England minus London
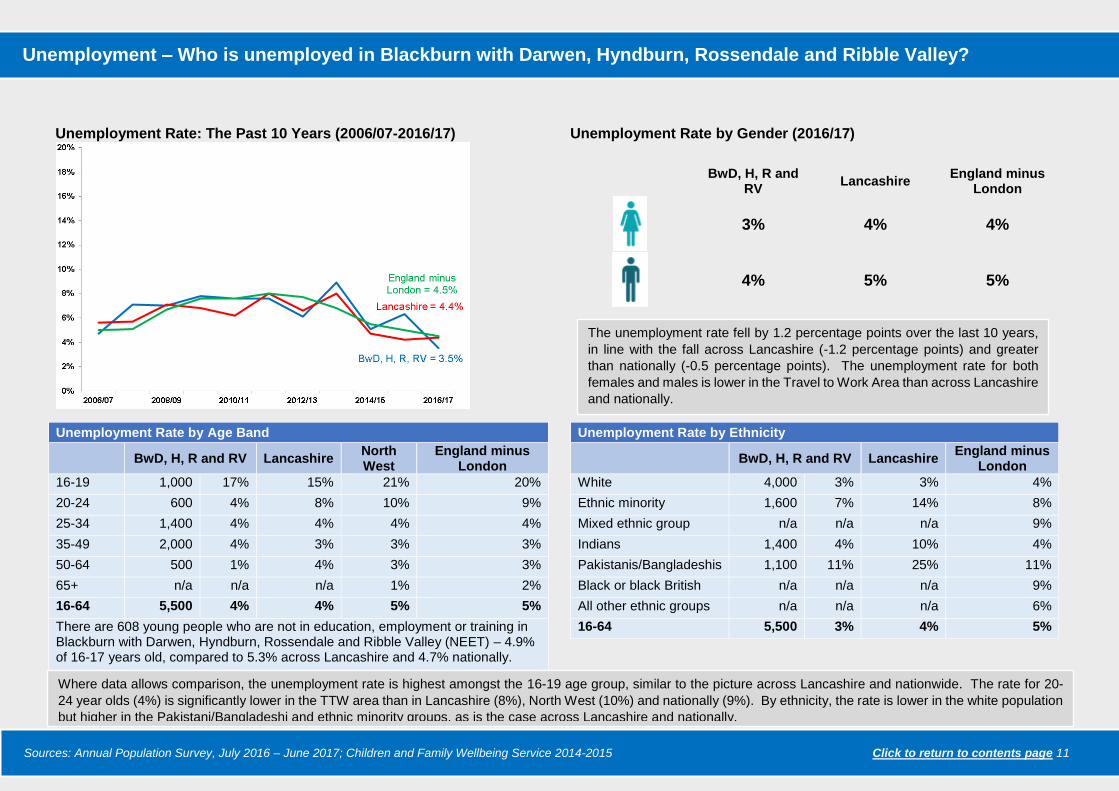
16-19 1,000 17% 15% 21% 20%
20-24 600 4% 8% 10% 9%
25-34 1,400 4% 4% 4% 4%
35-49 2,000 4% 3% 3% 3%
50-64 500 1% 4% 3% 3%
65+ n/a n/a n/a 1% 2%
16-64 5,500 4% 4% 5% 5%
There are 608 young people who are not in education, employment or training in Blackburn with Darwen, Hyndburn, Rossendale and Ribble Valley (NEET) – 4.9% of 16-17 years old, compared to 5.3% across Lancashire and 4.7% nationally.
Unemployment Rate by Ethnicity
BwD, H, R and RV Lancashire England minus
London
White 4,000 3% 3% 4%
Ethnic minority 1,600 7% 14% 8%
Mixed ethnic group n/a n/a n/a 9%
Indians 1,400 4% 10% 4%
Pakistanis/Bangladeshis 1,100 11% 25% 11%
Black or black British n/a n/a n/a 9%
All other ethnic groups n/a n/a n/a 6%
16-64 5,500 3% 4% 5%
Unemployment – Who is unemployed in Blackburn with Darwen, Hyndburn, Rossendale and Ribble Valley?
Sources: Annual Population Survey, July 2016 – June 2017; Children and Family Wellbeing Service 2014-2015 Click to return to contents page 11
The unemployment rate fell by 1.2 percentage points over the last 10 years,
in line with the fall across Lancashire (-1.2 percentage points) and greater
than nationally (-0.5 percentage points). The unemployment rate for both
females and males is lower in the Travel to Work Area than across Lancashire
and nationally.
Where data allows comparison, the unemployment rate is highest amongst the 16-19 age group, similar to the picture across Lancashire and nationwide. The rate for 20-
24 year olds (4%) is significantly lower in the TTW area than in Lancashire (8%), North West (10%) and nationally (9%). By ethnicity, the rate is lower in the white population
but higher in the Pakistani/Bangladeshi and ethnic minority groups, as is the case across Lancashire and nationally.
Residents BwD, H, R
and RV Lancashire
England minus
London
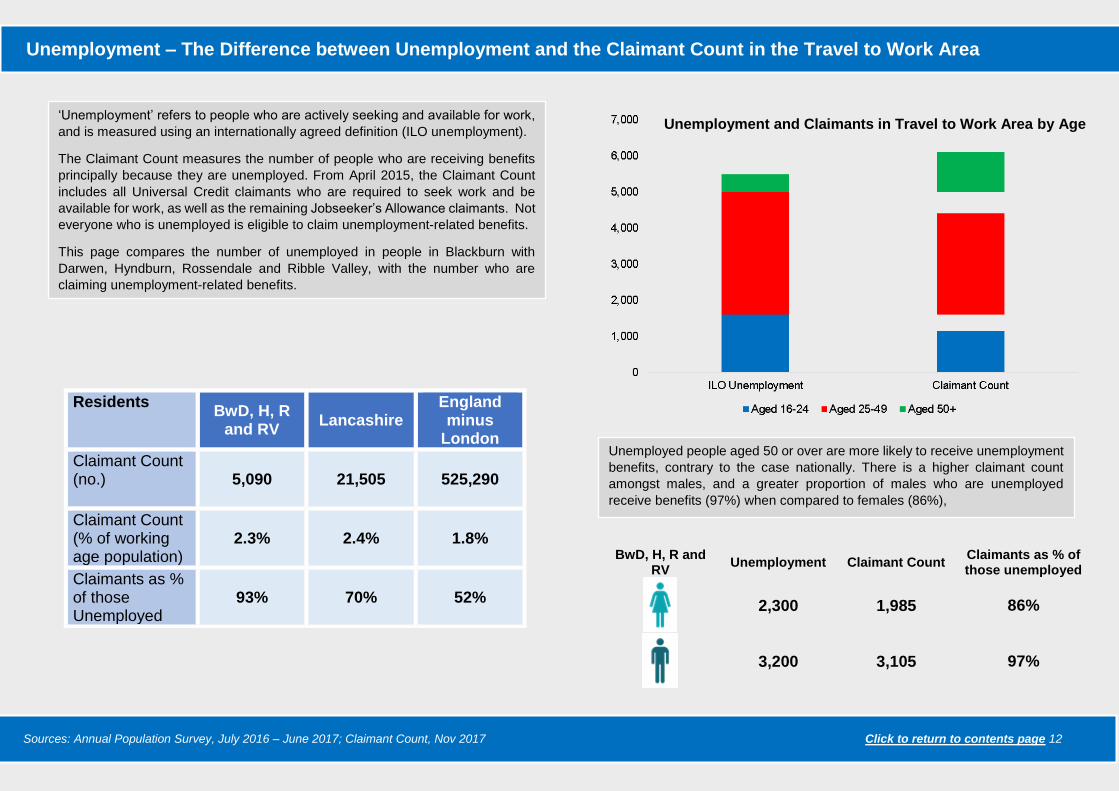
Claimant Count (no.)
5,090 21,505 525,290
Claimant Count (% of working age population)
2.3% 2.4% 1.8%
Claimants as % of those Unemployed
93% 70% 52%
BwD, H, R and RV
Unemployment Claimant Count Claimants as % of those unemployed
2,300 1,985
86%
3,200 3,105
97%
Sources: Annual Population Survey, July 2016 – June 2017; Claimant Count, Nov 2017 Click to return to contents page 12
Unemployment – The Difference between Unemployment and the Claimant Count in the Travel to Work Area
‘Unemployment’ refers to people who are actively seeking and available for work,
and is measured using an internationally agreed definition (ILO unemployment).
The Claimant Count measures the number of people who are receiving benefits
principally because they are unemployed. From April 2015, the Claimant Count
includes all Universal Credit claimants who are required to seek work and be
available for work, as well as the remaining Jobseeker’s Allowance claimants. Not
everyone who is unemployed is eligible to claim unemployment-related benefits.
This page compares the number of unemployed in people in Blackburn with
Darwen, Hyndburn, Rossendale and Ribble Valley, with the number who are
claiming unemployment-related benefits.
Unemployment and Claimants in Travel to Work Area by Age
Unemployed people aged 50 or over are more likely to receive unemployment
benefits, contrary to the case nationally. There is a higher claimant count
amongst males, and a greater proportion of males who are unemployed
receive benefits (97%) when compared to females (86%),
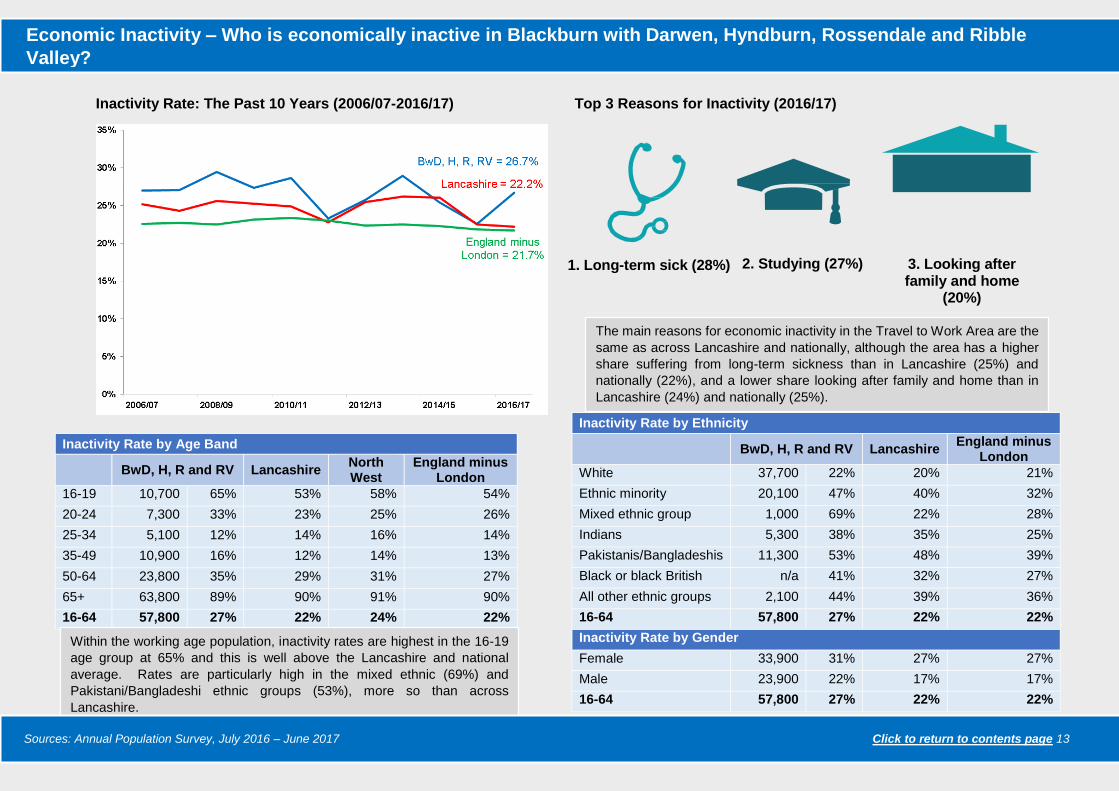
Inactivity Rate: The Past 10 Years (2006/07-2016/17) Top 3 Reasons for Inactivity (2016/17)
Inactivity Rate by Ethnicity
BwD, H, R and RV Lancashire England minus
London
White 37,700 22% 20% 21%
Ethnic minority 20,100 47% 40% 32%
Mixed ethnic group 1,000 69% 22% 28%
Indians 5,300 38% 35% 25%
Pakistanis/Bangladeshis 11,300 53% 48% 39%
Black or black British n/a 41% 32% 27%
All other ethnic groups 2,100 44% 39% 36%
16-64 57,800 27% 22% 22%
Inactivity Rate by Gender
Female 33,900 31% 27% 27%
Male 23,900 22% 17% 17%
16-64 57,800 27% 22% 22%
Inactivity Rate by Age Band
BwD, H, R and RV Lancashire North West
England minus London
16-19 10,700 65% 53% 58% 54%
20-24 7,300 33% 23% 25% 26%
25-34 5,100 12% 14% 16% 14%
35-49 10,900 16% 12% 14% 13%
50-64 23,800 35% 29% 31% 27%
65+ 63,800 89% 90% 91% 90%
16-64 57,800 27% 22% 24% 22%
Within the working age population, inactivity rates are highest in the 16-19
age group at 65% and this is well above the Lancashire and national
average. Rates are particularly high in the mixed ethnic (69%) and
Pakistani/Bangladeshi ethnic groups (53%), more so than across
Lancashire.
The main reasons for economic inactivity in the Travel to Work Area are the
same as across Lancashire and nationally, although the area has a higher
share suffering from long-term sickness than in Lancashire (25%) and
nationally (22%), and a lower share looking after family and home than in
Lancashire (24%) and nationally (25%).
2. Studying (27%) 3. Looking after family and home
(20%)
1. Long-term sick (28%)
Sources: Annual Population Survey, July 2016 – June 2017 Click to return to contents page 13
Economic Inactivity – Who is economically inactive in Blackburn with Darwen, Hyndburn, Rossendale and Ribble
Valley?
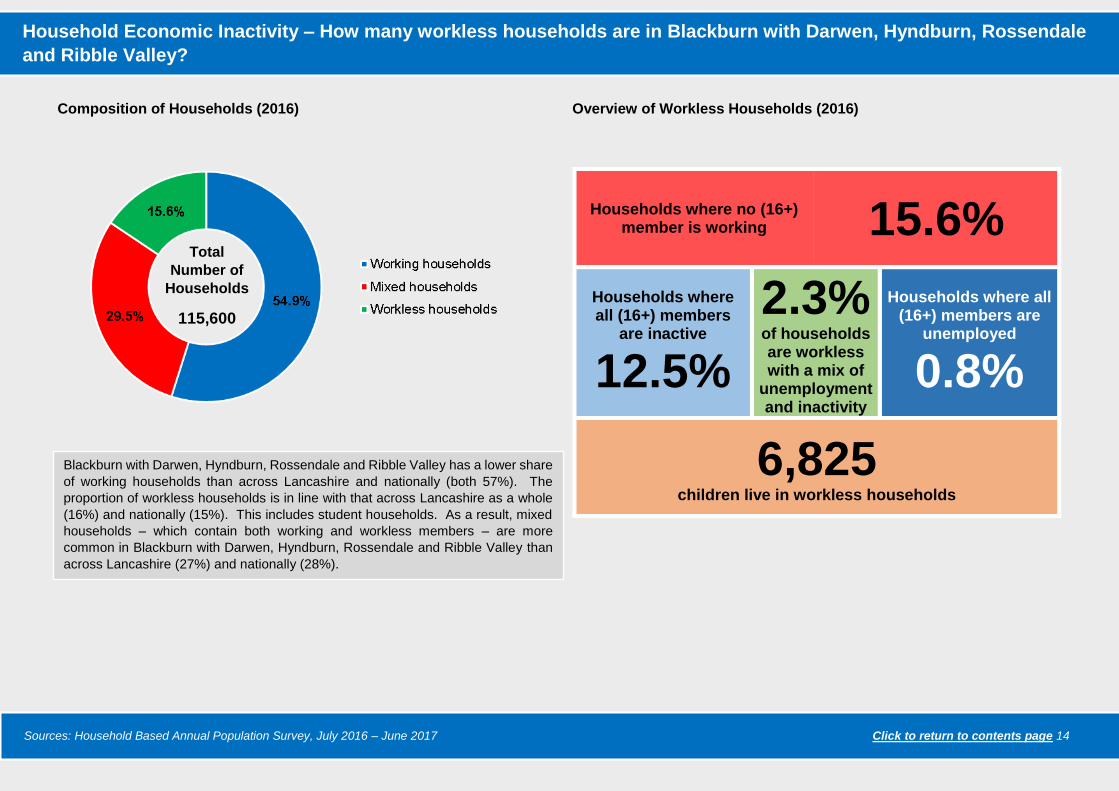
Composition of Households (2016)
Overview of Workless Households (2016)
Households where no (16+) member is working 15.6%
Households where all (16+) members
are inactive
12.5%
2.3% of households are workless with a mix of
unemployment and inactivity
Households where all (16+) members are
unemployed
0.8%
6,825 children live in workless households
Sources: Household Based Annual Population Survey, July 2016 – June 2017 Click to return to contents page 14
Household Economic Inactivity – How many workless households are in Blackburn with Darwen, Hyndburn, Rossendale
and Ribble Valley?
Blackburn with Darwen, Hyndburn, Rossendale and Ribble Valley has a lower share
of working households than across Lancashire and nationally (both 57%). The
proportion of workless households is in line with that across Lancashire as a whole
(16%) and nationally (15%). This includes student households. As a result, mixed
households – which contain both working and workless members – are more
common in Blackburn with Darwen, Hyndburn, Rossendale and Ribble Valley than
across Lancashire (27%) and nationally (28%).
Total
Number of
Households
115,600

Unemployment in Blackburn with Darwen, Hyndburn, Rossendale
and Ribble Valley
Based on the ILO definition of unemployment, 5,500 people are
unemployed in Blackburn with Darwen, Hyndburn, Rossendale and Ribble
Valley. This equates to 3.5% of economically active residents and is lower
than the Lancashire (4.2%) and national (4.5%) average. It is also one of
the lowest rates across the Lancashire Travel to Work Areas (along with
Preston, Chorley and South Ribble).
The unemployment rate has fluctuated over the past ten years and has
been particularly low since 2015. Overall, it has decreased by 1.2
percentage points, representing a fall equal to that across Lancashire (-1.2
percentage points) and greater than nationally (-0.5 percentage points).
The low unemployment rate is likely to reflect a particularly low level of
unemployment in Ribble Valley and Hyndburn (based on historical data as
current data is not available for these local areas due to the small sample
size). In contrast, unemployment in Blackburn with Darwen (5.7%)
exceeds both the Lancashire and national average.
Characteristics of those who are unemployed
In line with national trends, the unemployment rate for men (4%) is higher
than the unemployment rate for women (3%). The unemployment rates for
both genders are below the Lancashire and national averages, which are
5% for men and 4% for women.
Where data is available, it shows that the unemployment rate varies by
age group and is highest amongst those aged 16-19 (17%). In
comparison, the rate for 16-19 year olds is lower in Lancashire (15%) but
higher nationally (20%).
There are also variances by ethnicity. As is the case across Lancashire
and nationally, unemployment is higher amongst Pakistani/Bangladeshi
and ethnic minority groups.
The claimant count
Focusing on those who are receiving benefits principally because they are
unemployed, there are over 5,000 claimants in Blackburn with Darwen,
Hyndburn, Rossendale and Ribble Valley. This is equivalent to 2.3% of the
working age population, marginally lower than the Lancashire average
(2.4%) but above the national average (1.8%). As with unemployment, the
low claimant rate is reflective of the low levels of claimants in Ribble Valley
(0.7%) and Rossendale (2.1%), while the rates in Blackburn with Darwen
(2.9%) and Hyndburn (2.6%) exceed the Lancashire and national
averages.
Not all of those who are unemployed will receive and/or claim benefits. In
the Travel to Work Area, the number receiving unemployment-related
benefits equates to 93% of those who are unemployed compared to 70%
in Lancashire and 52% nationally. Across the local areas, a much lower
proportion of unemployed residents receive benefits in Blackburn with
Darwen (74%) than across other areas.
When the ILO unemployment and claimant counts are broken down and
compared in terms of age and gender, the data shows that, contrary to the
national picture, unemployed people aged over 50 are more likely to
receive unemployment benefits. It also shows that, as there is a higher
claimant count amongst males, a higher proportion of males who are
unemployed receive benefits (97%) when compared to females (86%).
This is similar to the case across Lancashire or nationally, although a
much higher proportion of those who are unemployed receive benefits in
the Travel to Work Area.
Economic Inactivity in Blackburn with Darwen, Hyndburn,
Rossendale and Ribble Valley
Across Blackburn with Darwen, Hyndburn, Rossendale and Ribble Valley,
57,800 people are economically inactive (i.e. are not in work and have not
sought work in the last four weeks for a variety of reasons). This equates
to 26.7% of the working age population and is higher than the inactivity
rate in Lancashire (22.2%) and nationally (21.7%). This is the highest
economic inactivity rate across all six Travel to Work Areas.
Unemployment and Inactivity in Blackburn with Darwen, Hyndburn, Rossendale and Ribble Valley
Sources: Annual Population Survey, July 2016 – June 2017; Claimant Count, Nov 2017 Click to return to contents page 15
As with employment and unemployment, levels of inactivity vary by local
area. The high rate within the Travel to Work Area is reflective of high
levels of inactivity in Blackburn with Darwen (31.6%) and Hyndburn
(27.7%) which are both well above the Lancashire and national average.
In contrast, Ribble Valley’s inactivity rate is much lower (15.7%).
Reasons for economic inactivity
The three main reasons for inactivity in Blackburn with Darwen, Hyndburn,
Rossendale and Ribble Valley – long term sickness (28% of those who are
inactive), studying (27%), and looking after family and home (20%) – are
the same as across Lancashire and nationally. Although, the Travel to
Work Area has a lower share looking after family and home than in
Lancashire (25%). The other main reason is being retired, which accounts
for 14% of those who are inactive in the Travel to Work Area compared to
16% in Lancashire and 15% nationally.
Characteristics of those who are inactive
As is the case nationally, a much higher proportion of working age females
(31%) are economically inactive than males (22%). The higher economic
inactivity rate across the Travel to Work Area is reflective of a higher
inactivity rate amongst males (22% compared to 17% in Lancashire and
nationally). This does however mask differences at the local area,
particularly in relation to Rossendale, where the inactivity rate for males
and females is the same (24%).
The inactivity rate varies by age group and is highest amongst those aged
16-19, as is the case across Lancashire and nationally. The key
differences in the inactivity profile by age relate to the youngest age
groups. The inactivity rate for those aged 16-19 and 20-24 is substantially
higher Blackburn with Darwen, Hyndburn, Rossendale and Ribble Valley
than in Lancashire and nationally.
There are also variances by ethnicity. The inactivity rate is highest
amongst the mixed ethnic group in the Travel to Work Area (69%),
contrary to the picture in Lancashire (22%) and nationally (28%). Other
groups with high inactivity rates include the Pakistani and Bangladeshi
ethnic groups, as is the case across Lancashire and nationally.
Economic Activity by Household
Of the 115,600 households located in the Travel to Work Area, a lower
share are classed as working households (55%) than in Lancashire and
nationally (both 57%).
The share of workless households in Blackburn with Darwen, Hyndburn,
Rossendale and Ribble Valley (16%) is broadly in line with that for
Lancashire (16%) and nationally (15%). This includes student households.
The Travel to Work Area has a greater proportion of mixed households
(30%) – which contain both working and workless members – than in
Lancashire as a whole (27%) and nationally (28%) In line with varying
trends on employment, unemployment and inactivity, there are variances
in the household profile at the local level including:
Working households are much more prevalent in Ribble Valley
and Rossendale (accounting for 64% and 60% of households
respectively). This compares to just 46% in Blackburn with
Darwen, well below the Lancashire and national average.
Workless households, including student households, are more
prevalent in Blackburn with Darwen and Hyndburn (accounting for
18% and 16% of households respectively) than in Ribble Valley
where there is a particularly low concentration of workless
households (12%).
Mixed households: are more prevalent in Blackburn with Darwen
(accounting for 36% of households) than in Ribble Valley (24%),
and Rossendale and Hyndburn (both 26%).
Focusing on workless households, the large majority of workless
households in Blackburn with Darwen, Hyndburn, Rossendale and Ribble
Valley are occupied by residents who are economically inactive. Overall, in
12.5% of households all (16+) members are inactive, while in 2.3% of
households all (16+) members are unemployed and in 0.8% of households
there is a mix of unemployment and inactivity. Over 6,800 children live in
households where no-one is in work.
Sources: Annual Population Survey, July 2016 – June 2017; Household Based Annual Population Survey, July 2016 – June 2017 Click to return to contents page 16
Unemployment and Inactivity in Preston, Chorley and South Ribble Unemployment and Inactivity in Blackburn with Darwen, Hyndburn, Rossendale and Ribble Valley
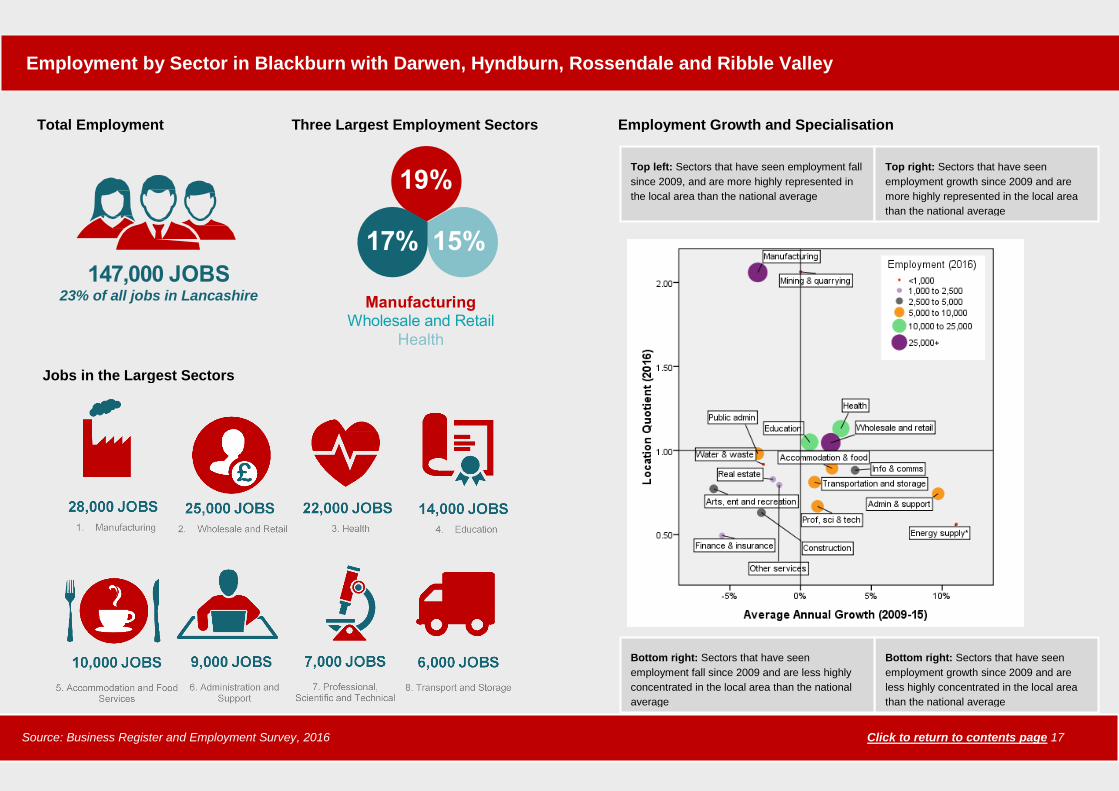
Top left: Sectors that have seen employment fall
since 2009, and are more highly represented in
the local area than the national average
Bottom right: Sectors that have seen
employment growth since 2009 and are
less highly concentrated in the local area
than the national average
Top right: Sectors that have seen
employment growth since 2009 and are
more highly represented in the local area
than the national average
Bottom right: Sectors that have seen
employment fall since 2009 and are less highly
concentrated in the local area than the national
average
Employment by Sector in Blackburn with Darwen, Hyndburn, Rossendale and Ribble Valley
Source: Business Register and Employment Survey, 2016 Click to return to contents page 17
Employment Growth and Specialisation
19%
17% 15%
Manufacturing
Wholesale and Retail
Health
Three Largest Employment Sectors
Jobs in the Largest Sectors
147,000 JOBS 23% of all jobs in Lancashire
Total Employment
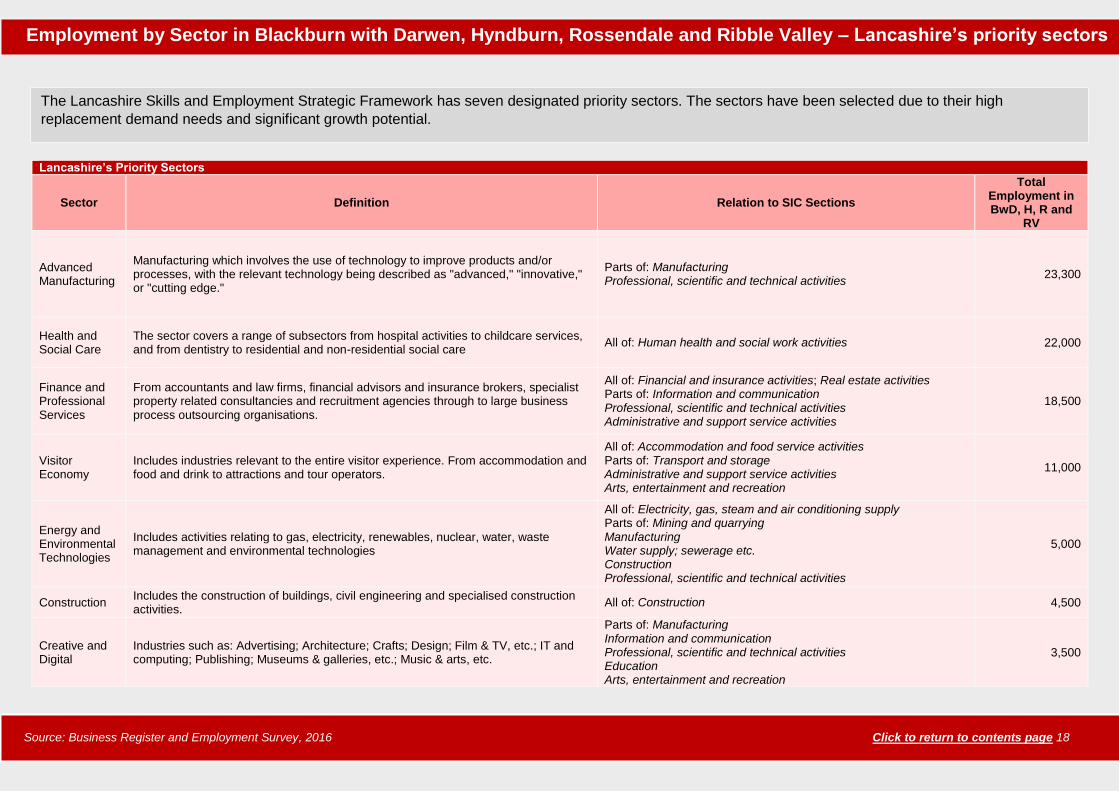
Lancashire’s Priority Sectors
Sector Definition Relation to SIC Sections
Total Employment in BwD, H, R and
RV
Advanced Manufacturing
Manufacturing which involves the use of technology to improve products and/or processes, with the relevant technology being described as "advanced," "innovative," or "cutting edge."
Parts of: Manufacturing Professional, scientific and technical activities
23,300
Health and Social Care
The sector covers a range of subsectors from hospital activities to childcare services, and from dentistry to residential and non-residential social care
All of: Human health and social work activities 22,000
Finance and Professional Services
From accountants and law firms, financial advisors and insurance brokers, specialist property related consultancies and recruitment agencies through to large business process outsourcing organisations.
All of: Financial and insurance activities; Real estate activities Parts of: Information and communication Professional, scientific and technical activities Administrative and support service activities
18,500
Visitor Economy
Includes industries relevant to the entire visitor experience. From accommodation and food and drink to attractions and tour operators.
All of: Accommodation and food service activities Parts of: Transport and storage Administrative and support service activities Arts, entertainment and recreation
11,000
Energy and Environmental Technologies
Includes activities relating to gas, electricity, renewables, nuclear, water, waste management and environmental technologies
All of: Electricity, gas, steam and air conditioning supply Parts of: Mining and quarrying Manufacturing Water supply; sewerage etc. Construction Professional, scientific and technical activities
5,000
Construction Includes the construction of buildings, civil engineering and specialised construction activities.
All of: Construction 4,500
Creative and Digital
Industries such as: Advertising; Architecture; Crafts; Design; Film & TV, etc.; IT and computing; Publishing; Museums & galleries, etc.; Music & arts, etc.
Parts of: Manufacturing Information and communication Professional, scientific and technical activities Education Arts, entertainment and recreation
3,500
Employment by Sector in Blackburn with Darwen, Hyndburn, Rossendale and Ribble Valley – Lancashire’s priority sectors
Source: Business Register and Employment Survey, 2016 Click to return to contents page 18
The Lancashire Skills and Employment Strategic Framework has seven designated priority sectors. The sectors have been selected due to their high
replacement demand needs and significant growth potential.
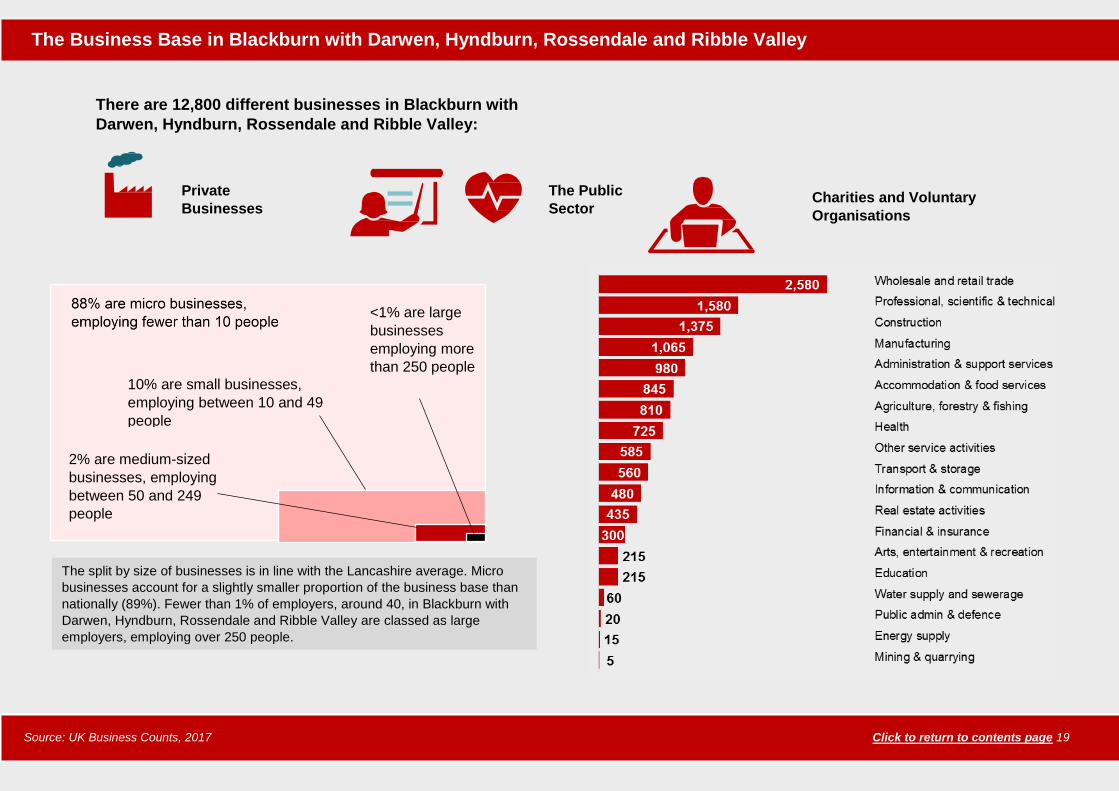
There are 12,800 different businesses in Blackburn with
Darwen, Hyndburn, Rossendale and Ribble Valley:
10% are small businesses,
employing between 10 and 49
people
2% are medium-sized
businesses, employing
between 50 and 249
people
Charities and Voluntary
Organisations
Source: UK Business Counts, 2017 Click to return to contents page 19
The Business Base in Blackburn with Darwen, Hyndburn, Rossendale and Ribble Valley
Private
Businesses
The Public
Sector
The split by size of businesses is in line with the Lancashire average. Micro
businesses account for a slightly smaller proportion of the business base than
nationally (89%). Fewer than 1% of employers, around 40, in Blackburn with
Darwen, Hyndburn, Rossendale and Ribble Valley are classed as large
employers, employing over 250 people.
<1% are large
businesses
employing more
than 250 people
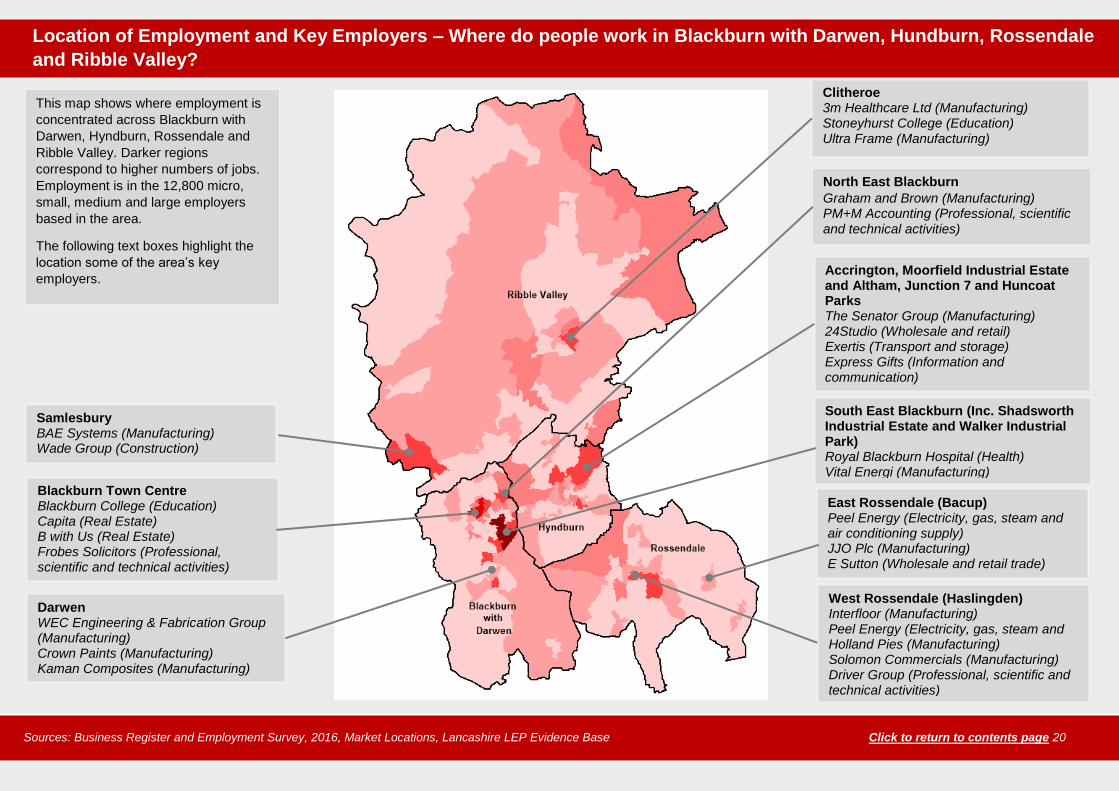
Location of Employment and Key Employers – Where do people work in Blackburn with Darwen, Hundburn, Rossendale
and Ribble Valley?
Sources: Business Register and Employment Survey, 2016, Market Locations, Lancashire LEP Evidence Base Click to return to contents page 20
Blackburn Town Centre Blackburn College (Education) Capita (Real Estate) B with Us (Real Estate) Frobes Solicitors (Professional, scientific and technical activities)
Accrington, Moorfield Industrial Estate and Altham, Junction 7 and Huncoat Parks The Senator Group (Manufacturing) 24Studio (Wholesale and retail) Exertis (Transport and storage) Express Gifts (Information and communication)
Clitheroe 3m Healthcare Ltd (Manufacturing) Stoneyhurst College (Education) Ultra Frame (Manufacturing)
West Rossendale (Haslingden) Interfloor (Manufacturing) Peel Energy (Electricity, gas, steam and Holland Pies (Manufacturing) Solomon Commercials (Manufacturing) Driver Group (Professional, scientific and technical activities)
South East Blackburn (Inc. Shadsworth Industrial Estate and Walker Industrial Park) Royal Blackburn Hospital (Health) Vital Energi (Manufacturing)
Darwen WEC Engineering & Fabrication Group (Manufacturing) Crown Paints (Manufacturing) Kaman Composites (Manufacturing)
Samlesbury BAE Systems (Manufacturing) Wade Group (Construction)
North East Blackburn
Graham and Brown (Manufacturing) PM+M Accounting (Professional, scientific and technical activities)
This map shows where employment is
concentrated across Blackburn with
Darwen, Hyndburn, Rossendale and
Ribble Valley. Darker regions
correspond to higher numbers of jobs.
Employment is in the 12,800 micro,
small, medium and large employers
based in the area.
The following text boxes highlight the
location some of the area’s key
employers.
East Rossendale (Bacup) Peel Energy (Electricity, gas, steam and air conditioning supply) JJO Plc (Manufacturing) E Sutton (Wholesale and retail trade)
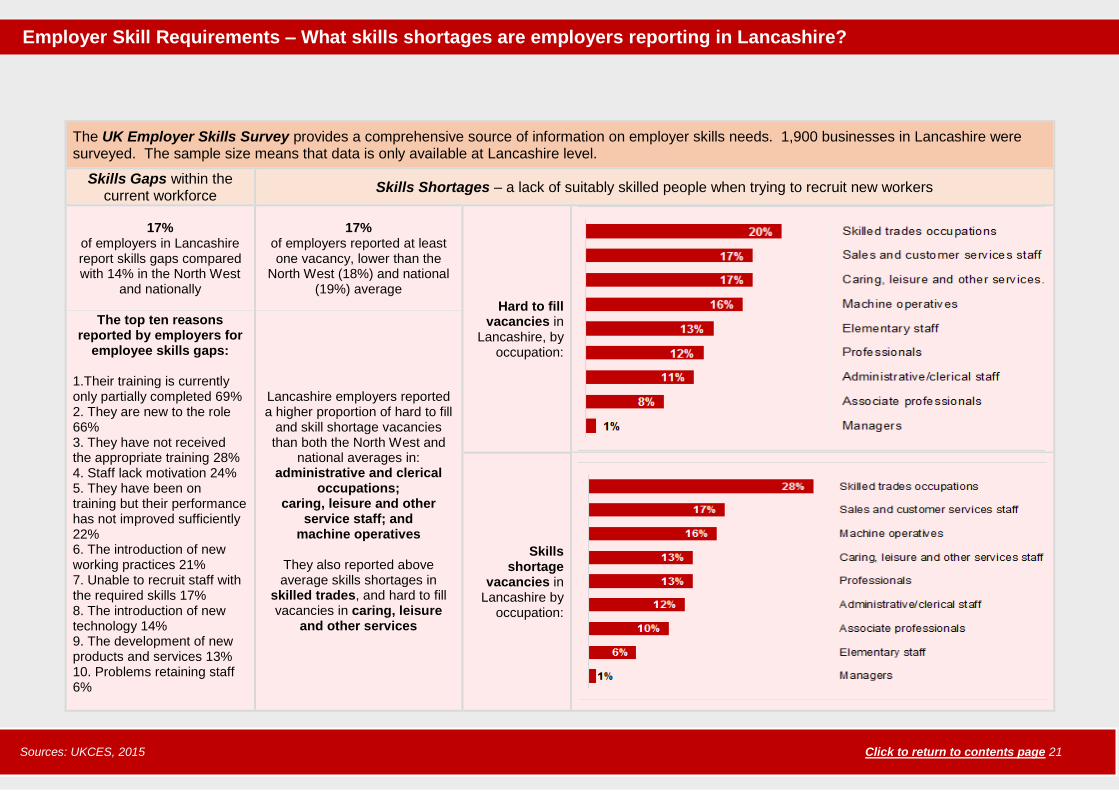
The UK Employer Skills Survey provides a comprehensive source of information on employer skills needs. 1,900 businesses in Lancashire were surveyed. The sample size means that data is only available at Lancashire level.
Skills Gaps within the current workforce
Skills Shortages – a lack of suitably skilled people when trying to recruit new workers
17% of employers in Lancashire report skills gaps compared with 14% in the North West
and nationally
17% of employers reported at least one vacancy, lower than the
North West (18%) and national (19%) average
Hard to fill vacancies in
Lancashire, by occupation:
The top ten reasons reported by employers for
employee skills gaps:
1.Their training is currently only partially completed 69% 2. They are new to the role 66% 3. They have not received the appropriate training 28% 4. Staff lack motivation 24% 5. They have been on training but their performance has not improved sufficiently 22% 6. The introduction of new working practices 21% 7. Unable to recruit staff with the required skills 17% 8. The introduction of new technology 14% 9. The development of new products and services 13% 10. Problems retaining staff 6%
Lancashire employers reported a higher proportion of hard to fill
and skill shortage vacancies than both the North West and
national averages in: administrative and clerical
occupations; caring, leisure and other
service staff; and machine operatives
They also reported above average skills shortages in
skilled trades, and hard to fill vacancies in caring, leisure
and other services
Skills shortage
vacancies in Lancashire by
occupation:
Employer Skill Requirements – What skills shortages are employers reporting in Lancashire?
Sources: UKCES, 2015 Click to return to contents page 21
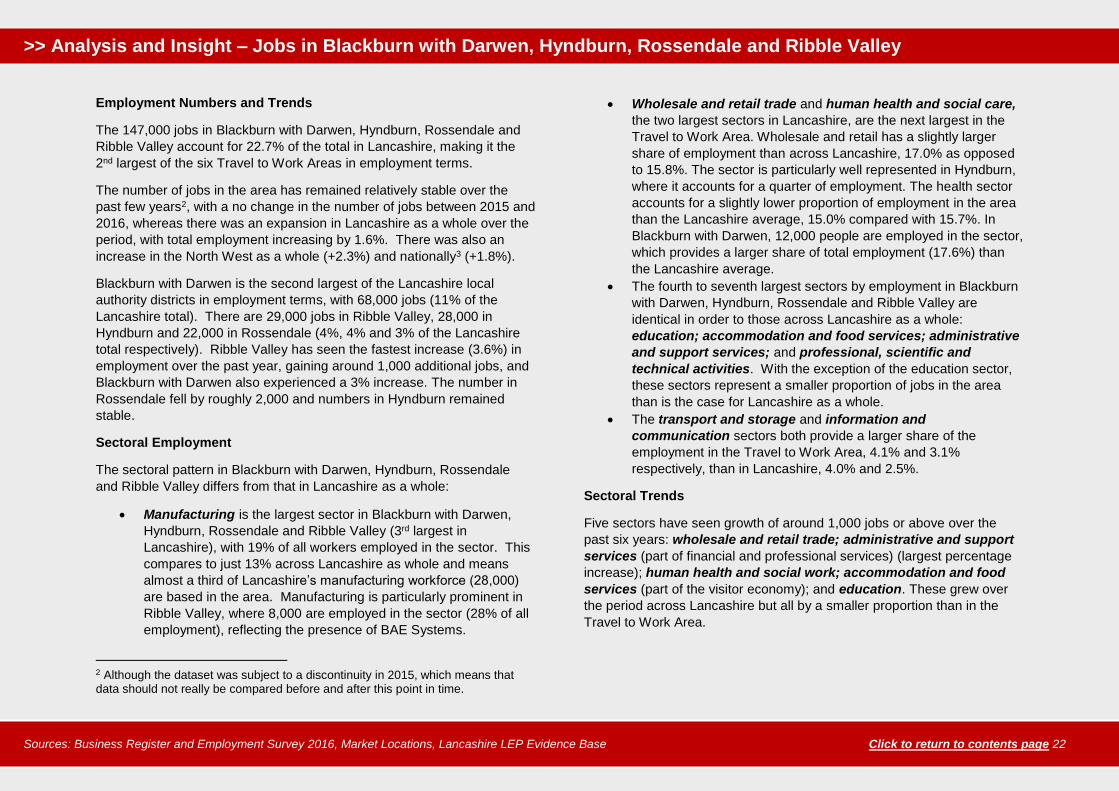
Employment Numbers and Trends
The 147,000 jobs in Blackburn with Darwen, Hyndburn, Rossendale and
Ribble Valley account for 22.7% of the total in Lancashire, making it the
2nd largest of the six Travel to Work Areas in employment terms.
The number of jobs in the area has remained relatively stable over the
past few years2, with a no change in the number of jobs between 2015 and
2016, whereas there was an expansion in Lancashire as a whole over the
period, with total employment increasing by 1.6%. There was also an
increase in the North West as a whole (+2.3%) and nationally3 (+1.8%).
Blackburn with Darwen is the second largest of the Lancashire local
authority districts in employment terms, with 68,000 jobs (11% of the
Lancashire total). There are 29,000 jobs in Ribble Valley, 28,000 in
Hyndburn and 22,000 in Rossendale (4%, 4% and 3% of the Lancashire
total respectively). Ribble Valley has seen the fastest increase (3.6%) in
employment over the past year, gaining around 1,000 additional jobs, and
Blackburn with Darwen also experienced a 3% increase. The number in
Rossendale fell by roughly 2,000 and numbers in Hyndburn remained
stable.
Sectoral Employment
The sectoral pattern in Blackburn with Darwen, Hyndburn, Rossendale
and Ribble Valley differs from that in Lancashire as a whole:
Manufacturing is the largest sector in Blackburn with Darwen,
Hyndburn, Rossendale and Ribble Valley (3rd largest in
Lancashire), with 19% of all workers employed in the sector. This
compares to just 13% across Lancashire as whole and means
almost a third of Lancashire’s manufacturing workforce (28,000)
are based in the area. Manufacturing is particularly prominent in
Ribble Valley, where 8,000 are employed in the sector (28% of all
employment), reflecting the presence of BAE Systems.
2 Although the dataset was subject to a discontinuity in 2015, which means that data should not really be compared before and after this point in time.
Wholesale and retail trade and human health and social care,
the two largest sectors in Lancashire, are the next largest in the
Travel to Work Area. Wholesale and retail has a slightly larger
share of employment than across Lancashire, 17.0% as opposed
to 15.8%. The sector is particularly well represented in Hyndburn,
where it accounts for a quarter of employment. The health sector
accounts for a slightly lower proportion of employment in the area
than the Lancashire average, 15.0% compared with 15.7%. In
Blackburn with Darwen, 12,000 people are employed in the sector,
which provides a larger share of total employment (17.6%) than
the Lancashire average.
The fourth to seventh largest sectors by employment in Blackburn
with Darwen, Hyndburn, Rossendale and Ribble Valley are
identical in order to those across Lancashire as a whole:
education; accommodation and food services; administrative
and support services; and professional, scientific and
technical activities. With the exception of the education sector,
these sectors represent a smaller proportion of jobs in the area
than is the case for Lancashire as a whole.
The transport and storage and information and
communication sectors both provide a larger share of the
employment in the Travel to Work Area, 4.1% and 3.1%
respectively, than in Lancashire, 4.0% and 2.5%.
Sectoral Trends
Five sectors have seen growth of around 1,000 jobs or above over the
past six years: wholesale and retail trade; administrative and support
services (part of financial and professional services) (largest percentage
increase); human health and social work; accommodation and food
services (part of the visitor economy); and education. These grew over
the period across Lancashire but all by a smaller proportion than in the
Travel to Work Area.
>> Analysis and Insight – Jobs in Blackburn with Darwen, Hyndburn, Rossendale and Ribble Valley
Sources: Business Register and Employment Survey 2016, Market Locations, Lancashire LEP Evidence Base Click to return to contents page 22
Employment has fallen in eight sectors. In percentage terms, the fall has
been greatest in arts, entertainment and recreation, which has seen the
loss of 2,000 jobs (-40%) since 2009, a larger relative fall than in
Lancashire as whole. The largest number of jobs, around 6,000, have
been lost in the manufacturing sector, approximately half the decline in
Lancashire as a whole, although more recently employment growth has
been recorded in the sector. Employment in public administration and
defence; other service activities; financial and insurance activities;
and construction all fell by at least 500 jobs over the period.
Local Authority District Sectoral Employment
Blackburn with Darwen’s role as a service centre for the wider area is
clear from the sectoral make-up of employment in the local authority.
Nearly one quarter of employment (24%) in the area is public sector
employment, with the human health and social work sector the largest
sector of all, employing 12,000. Blackburn with Darwen is the location of
the majority of the Travel to Work Area’s professional, scientific and
technical (4,000); information and communication (3,500); and financial
and insurance (1,000) employment.
Hyndburn’s economy is characterised by the dominance of the wholesale
and retail sector which employs 7,000 people, approximately a quarter of
all employment.
Rossendale’s employment base is heavily manufacturing-based, with
more than one in five of the local authority’s jobs (4,500) in the sector.
Rossendale also has a large percentage of jobs in wholesale and retail
(18%) and administrative and support services (11%).
Ribble Valley’s employment is extremely manufacturing-based, with
8,000 people, 28% of total employment employed in the sector, which is
twice the size of any other. Besides manufacturing Ribble Valley also has
a high concentration of accommodation and food services employment,
the 4,000 jobs in the sector equate to 14% of the local authority total,
making it the joint second largest sector.
Employment Locations
Employment is distributed across the Blackburn with Darwen, Hyndburn,
Rossendale and Ribble Valley area, with concentrations in the key
centres, along transport routes particularly the M65 and at major
employment locations such as Samlesbury Aerospace Enterprise Zone.
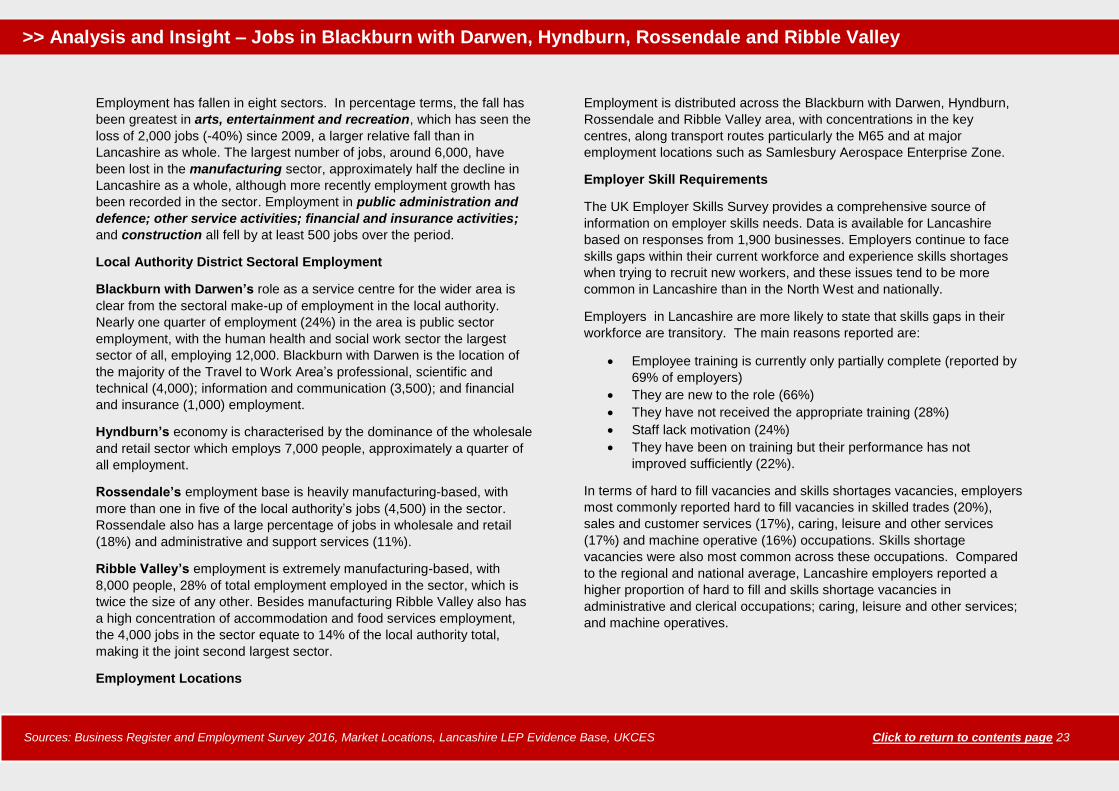
Employer Skill Requirements
The UK Employer Skills Survey provides a comprehensive source of
information on employer skills needs. Data is available for Lancashire
based on responses from 1,900 businesses. Employers continue to face
skills gaps within their current workforce and experience skills shortages
when trying to recruit new workers, and these issues tend to be more
common in Lancashire than in the North West and nationally.
Employers in Lancashire are more likely to state that skills gaps in their
workforce are transitory. The main reasons reported are:
Employee training is currently only partially complete (reported by
69% of employers)
They are new to the role (66%)
They have not received the appropriate training (28%)
Staff lack motivation (24%)
They have been on training but their performance has not
improved sufficiently (22%).
In terms of hard to fill vacancies and skills shortages vacancies, employers
most commonly reported hard to fill vacancies in skilled trades (20%),
sales and customer services (17%), caring, leisure and other services
(17%) and machine operative (16%) occupations. Skills shortage
vacancies were also most common across these occupations. Compared
to the regional and national average, Lancashire employers reported a
higher proportion of hard to fill and skills shortage vacancies in
administrative and clerical occupations; caring, leisure and other services;
and machine operatives.
>> Analysis and Insight – Jobs in Blackburn with Darwen, Hyndburn, Rossendale and Ribble Valley
Sources: Business Register and Employment Survey 2016, Market Locations, Lancashire LEP Evidence Base, UKCES Click to return to contents page 23
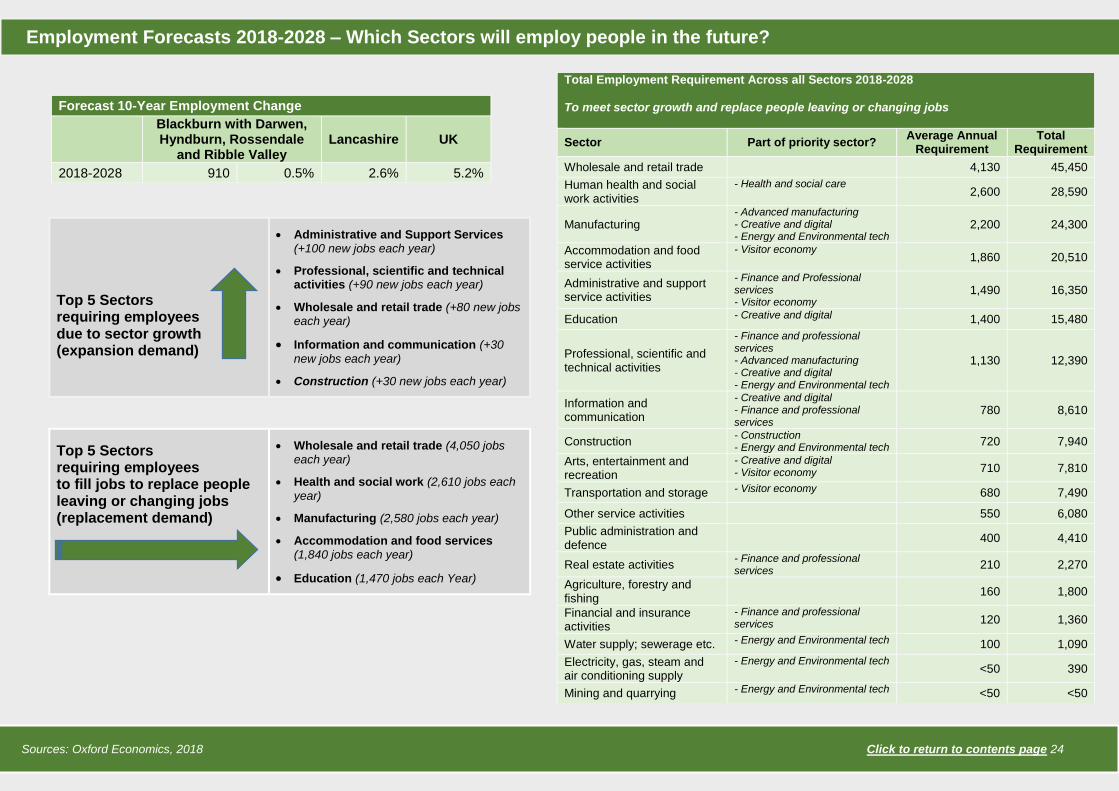
Top 5 Sectors requiring employees due to sector growth (expansion demand)
Administrative and Support Services (+100 new jobs each year)
Professional, scientific and technical activities (+90 new jobs each year)
Wholesale and retail trade (+80 new jobs each year)
Information and communication (+30
new jobs each year)
Construction (+30 new jobs each year)
Top 5 Sectors requiring employees to fill jobs to replace people leaving or changing jobs (replacement demand)
Wholesale and retail trade (4,050 jobs each year)
Health and social work (2,610 jobs each
year)
Manufacturing (2,580 jobs each year)
Accommodation and food services (1,840 jobs each year)
Education (1,470 jobs each Year)
Total Employment Requirement Across all Sectors 2018-2028 To meet sector growth and replace people leaving or changing jobs
Sector Part of priority sector? Average Annual
Requirement Total
Requirement
Wholesale and retail trade 4,130 45,450
Human health and social work activities
- Health and social care 2,600 28,590
Manufacturing - Advanced manufacturing - Creative and digital - Energy and Environmental tech
2,200 24,300
Accommodation and food service activities
- Visitor economy 1,860 20,510
Administrative and support service activities
- Finance and Professional services - Visitor economy
1,490 16,350
Education - Creative and digital 1,400 15,480
Professional, scientific and technical activities
- Finance and professional services - Advanced manufacturing - Creative and digital - Energy and Environmental tech
1,130 12,390
Information and communication
- Creative and digital - Finance and professional services
780 8,610
Construction - Construction - Energy and Environmental tech
720 7,940
Arts, entertainment and recreation
- Creative and digital - Visitor economy 710 7,810
Transportation and storage - Visitor economy 680 7,490
Other service activities 550 6,080
Public administration and defence
400 4,410
Real estate activities - Finance and professional services
210 2,270
Agriculture, forestry and fishing
160 1,800
Financial and insurance activities
- Finance and professional services 120 1,360
Water supply; sewerage etc. - Energy and Environmental tech 100 1,090
Electricity, gas, steam and air conditioning supply
- Energy and Environmental tech <50 390
Mining and quarrying - Energy and Environmental tech <50 <50
Forecast 10-Year Employment Change
Blackburn with Darwen, Hyndburn, Rossendale
and Ribble Valley Lancashire UK
2018-2028 910 0.5% 2.6% 5.2%
Employment Forecasts 2018-2028 – Which Sectors will employ people in the future?
Sources: Oxford Economics, 2018 Click to return to contents page 24
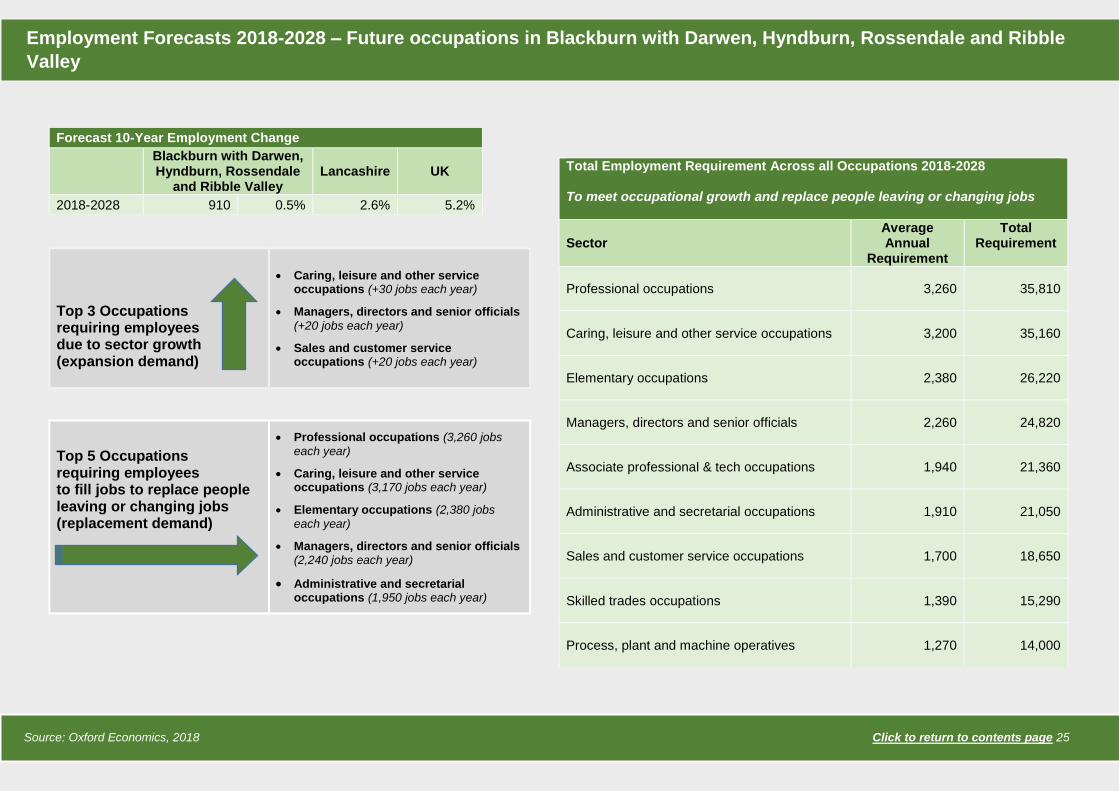
Top 3 Occupations requiring employees due to sector growth (expansion demand)
Caring, leisure and other service occupations (+30 jobs each year)
Managers, directors and senior officials
(+20 jobs each year)
Sales and customer service occupations (+20 jobs each year)
Top 5 Occupations requiring employees to fill jobs to replace people leaving or changing jobs (replacement demand)
Professional occupations (3,260 jobs
each year)
Caring, leisure and other service occupations (3,170 jobs each year)
Elementary occupations (2,380 jobs
each year)
Managers, directors and senior officials (2,240 jobs each year)
Administrative and secretarial occupations (1,950 jobs each year)
Forecast 10-Year Employment Change
Blackburn with Darwen, Hyndburn, Rossendale
and Ribble Valley Lancashire UK
2018-2028 910 0.5% 2.6% 5.2%
Total Employment Requirement Across all Occupations 2018-2028 To meet occupational growth and replace people leaving or changing jobs
Sector Average Annual
Requirement
Total Requirement
Professional occupations 3,260 35,810
Caring, leisure and other service occupations 3,200 35,160
Elementary occupations 2,380 26,220
Managers, directors and senior officials 2,260 24,820
Associate professional & tech occupations 1,940 21,360
Administrative and secretarial occupations 1,910 21,050
Sales and customer service occupations 1,700 18,650
Skilled trades occupations 1,390 15,290
Process, plant and machine operatives 1,270 14,000
Source: Oxford Economics, 2018 Click to return to contents page 25
Employment Forecasts 2018-2028 – Future occupations in Blackburn with Darwen, Hyndburn, Rossendale and Ribble
Valley
Change in employment by highest qualification, 2018-2028
Change in employment by highest qualification level, 2018-
2028
Sources: Oxford Economics Click to return to contents page
Employment Forecasts 2018-2028 – How will skills change in Blackburn with Darwen, Hyndburn, Rossendale and Ribble
Valley?
Source: Oxford Economics, 2018 Click to return to contents page 26
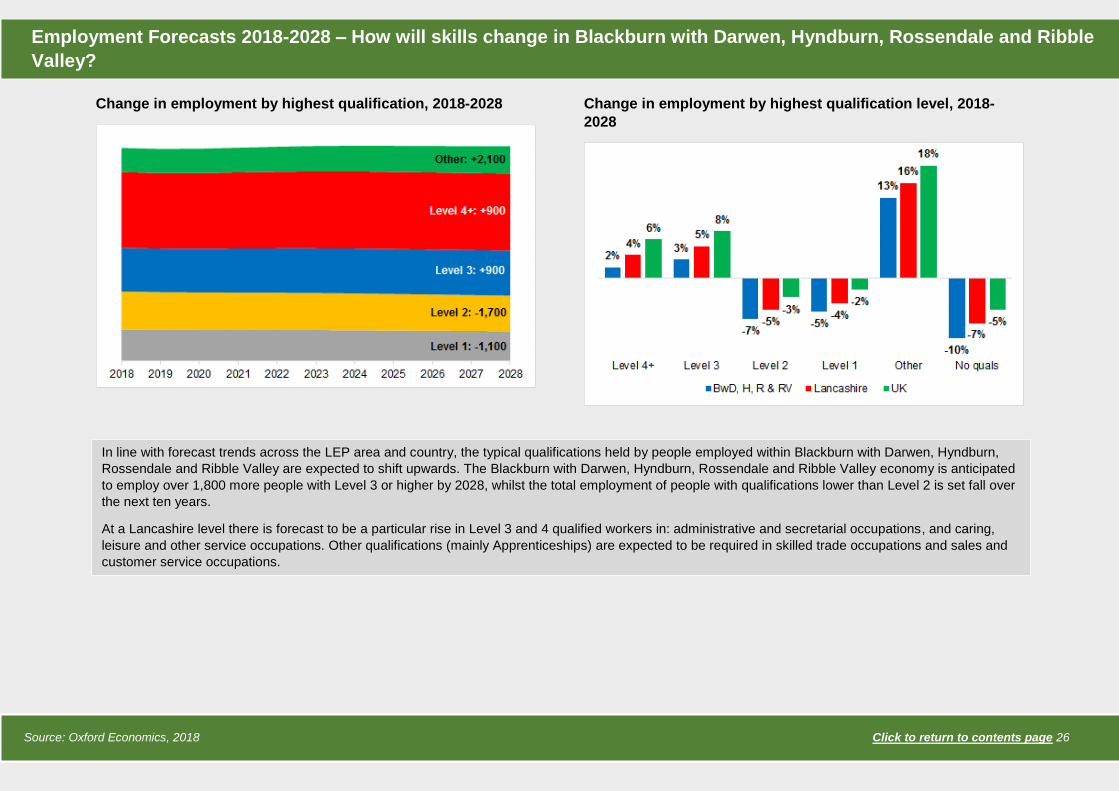
In line with forecast trends across the LEP area and country, the typical qualifications held by people employed within Blackburn with Darwen, Hyndburn,
Rossendale and Ribble Valley are expected to shift upwards. The Blackburn with Darwen, Hyndburn, Rossendale and Ribble Valley economy is anticipated
to employ over 1,800 more people with Level 3 or higher by 2028, whilst the total employment of people with qualifications lower than Level 2 is set fall over
the next ten years.
At a Lancashire level there is forecast to be a particular rise in Level 3 and 4 qualified workers in: administrative and secretarial occupations, and caring,
leisure and other service occupations. Other qualifications (mainly Apprenticeships) are expected to be required in skilled trade occupations and sales and
customer service occupations.
Employment Forecasts – Total Employment
Forecasts provide an indication of the future growth of an economy, but
are not set in stone. Between 2018 and 2028, over 900 new jobs are
expected to be created in Blackburn with Darwen, Hyndburn, Rossendale
and Ribble Valley, representing a 0.5% increase in total employment. This
is lower than the growth forecast across Lancashire as a whole (2.6%) and
nationally (5.2%) over the same period.
Job Opportunities
There will be a wide range of job opportunities available between 2018
and 2028, with recruitment across all sectors and occupations, including in
each of Lancashire’s priority sectors and in sectors which have recently
experienced overall employment decline such as manufacturing,
accommodation and food and arts, entertainment and recreation. This will
include recruitment for new jobs created through sector growth (expansion
demand) and jobs that become available as people leave or change jobs
(replacement demand).
Typically across all sectors and occupations, replacement demand will be
much greater than expansion demand, meaning that people are more
likely to enter existing rather than newly created jobs. The high levels of
replacement demand reflect factors such as the ageing population with
many current workers due to retire from the workforce over this period.
Job Opportunities by Sector
Wholesale and retail trade will provide the highest number of
opportunities in the Travel to Work Area – requiring over 45,000 people to
fill jobs between 2018 and 2028. On average, this will equate to 4,100
people being recruited to the sector each year.
This is followed by human health and social work activities, where
there is a total requirement for over 28,500 people between 2018 and
2028 – or approximately 2,600 people per annum on average, and
manufacturing and accommodation and food services, which will both
have opportunities for over 20,000 people (or over 1,800 per annum).
Other sectors offering opportunities for over 5,000 people between 2018
and 2028 include:
Administrative and support service activities (1,490 per annum)
Education (1,400 per annum)
Professional, scientific and technical activities (1,130 per annum)
Information and communication (780 per annum)
Construction (720 per annum)
Arts, entertainment and recreation (710 per annum)
Transportation and storage (680 per annum)
Other service activities (550 per annum)
Job Opportunities by Occupation
Across the sectors, a range of occupations will be available. In Blackburn
with Darwen, Hyndburn, Rossendale and Ribble Valley there will be
opportunities for at least 14,000 people within each occupational group
(equivalent to at least 1,270 per annum) between 2018 and 2028.
Requirements will be highest for professional occupations, with
opportunities for almost 36,000 people (3,300 per annum), followed by
caring, leisure and other service occupations with opportunities for
over 35,100 people (3,200 per annum). There will also be opportunities for
over 20,000 people in elementary; manager, director and senior
official; associate professional and technical; and administrative and
secretarial roles.
Skills Requirements
In line with trends forecast for Lancashire and nationally, demand for
higher level skills is expected to increase, as reflected by an upwards shift
in the skills profile of the workforce. By 2028, a higher number of people
employed in the local economy will hold qualifications at Level 3 and
above, while the number in employment with qualifications at level 2 or
below or no qualifications will fall. The number of people in employment
with other qualifications, such as apprenticeships is also expected to
increase. This trend typically applies across all occupations.
Employment Forecasts – What opportunities will be available in Blackburn with Darwen, Hyndburn, Rossendale and
Ribble Valley in the future?
Source: Oxford Economics Click to return to contents page 27
Age Group
Performance Measure
What is happening in Blackburn with Darwen, Hyndburn, Rossendale and Ribble
Valley?
National
comparison
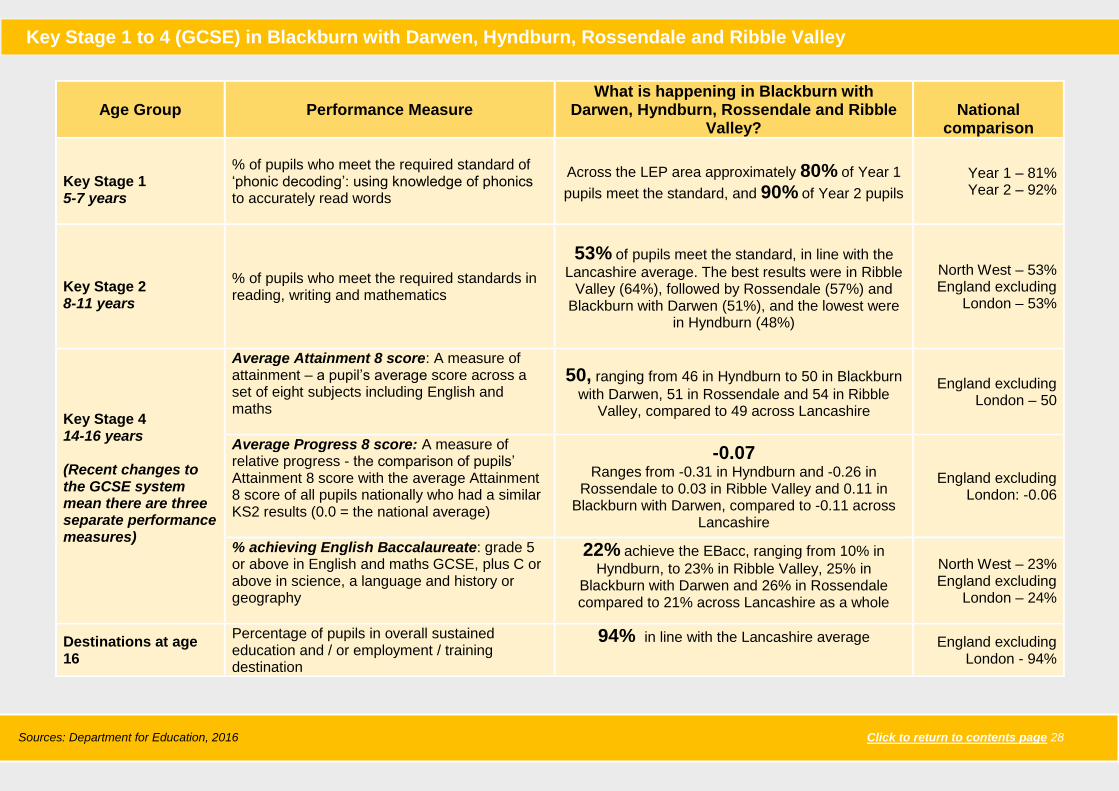
Key Stage 1 5-7 years
% of pupils who meet the required standard of ‘phonic decoding’: using knowledge of phonics to accurately read words
Across the LEP area approximately 80% of Year 1
pupils meet the standard, and 90% of Year 2 pupils
Year 1 – 81% Year 2 – 92%
Key Stage 2 8-11 years
% of pupils who meet the required standards in reading, writing and mathematics
53% of pupils meet the standard, in line with the
Lancashire average. The best results were in Ribble Valley (64%), followed by Rossendale (57%) and
Blackburn with Darwen (51%), and the lowest were in Hyndburn (48%)
North West – 53% England excluding
London – 53%
Key Stage 4 14-16 years (Recent changes to the GCSE system mean there are three separate performance measures)
Average Attainment 8 score: A measure of attainment – a pupil’s average score across a set of eight subjects including English and maths
50, ranging from 46 in Hyndburn to 50 in Blackburn
with Darwen, 51 in Rossendale and 54 in Ribble Valley, compared to 49 across Lancashire
England excluding London – 50
Average Progress 8 score: A measure of relative progress - the comparison of pupils’ Attainment 8 score with the average Attainment 8 score of all pupils nationally who had a similar KS2 results (0.0 = the national average)
-0.07 Ranges from -0.31 in Hyndburn and -0.26 in
Rossendale to 0.03 in Ribble Valley and 0.11 in Blackburn with Darwen, compared to -0.11 across
Lancashire
England excluding London: -0.06
% achieving English Baccalaureate: grade 5 or above in English and maths GCSE, plus C or above in science, a language and history or geography
22% achieve the EBacc, ranging from 10% in
Hyndburn, to 23% in Ribble Valley, 25% in Blackburn with Darwen and 26% in Rossendale compared to 21% across Lancashire as a whole
North West – 23% England excluding
London – 24%
Destinations at age 16
Percentage of pupils in overall sustained education and / or employment / training destination
94% in line with the Lancashire average England excluding London - 94%
Key Stage 1 to 4 (GCSE) in Blackburn with Darwen, Hyndburn, Rossendale and Ribble Valley
Sources: Department for Education, 2016 Click to return to contents page 28

Level 2 attainment by age 19
Level 3 attainment by age 19
Level 3 attainment by age 19
87% of students in Blackburn with Darwen, Hyndburn, Rossendale and Ribble Valley enter sustained education or employment after Key
Stage 5
69% enter sustained education
18% enter sustained
employment
54% Higher education
institutions
11% Further education
institutions
Of which 8% are apprentices
Young people aged 16-19 – Attainment by age 19 in Blackburn with Darwen, Hyndburn, Rossendale and Ribble Valley?
Sources: Department for Education, 2016 *therefore national average score for mainstream schools = 0.0 Click to return to contents page 28
KS5 Destinations
Sources: Department for Education, 2016 Click to return to contents page 29

Apprenticeship starts 2016/17 in Blackburn with Darwen,
Hyndburn, Rossendale and Ribble Valley by age
Apprenticeships in Blackburn with Darwen, Hyndburn,
Rossendale and Ribble Valley by subject
Apprenticeships in Blackburn with Darwen, Hyndburn,
Rossendale and Ribble Valley by Level
Apprenticeships – Apprenticeship starts in Blackburn with Darwen, Hyndburn, Rossendale and Ribble Valley
Sources: Department for Education, 2016 Click to return to contents page 30
The age profile of apprentices in Blackburn with Darwen, Hyndburn,
Rossendale and Ribble Valley is younger than typical. A larger proportion of
apprenticeship starts in the area are by under 19s than in Lancashire (25%)
and nationally (25%).
The proportion of advanced and higher starts is in line with wider geographies:
48% compared with 48% in Lancashire and 47% nationally.
The profile of subjects studied is largely similar to the Lancashire wide and
national picture, with the main differences including:
o A lower proportion of apprentices (29%) start business
administration and law than across Lancashire (30%), but still more
than nationally (28%).
o The proportion that start health, public services and care (27%) is
below both the Lancashire (30%) and national level (28%)
o The proportion that start engineering and manufacturing
technology and leisure, travel and tourism is higher than the
Lancashire average (15% compared to 14% for engineering and
manufacturing technology, and 5% compared to 3% for leisure, travel
and tourism).
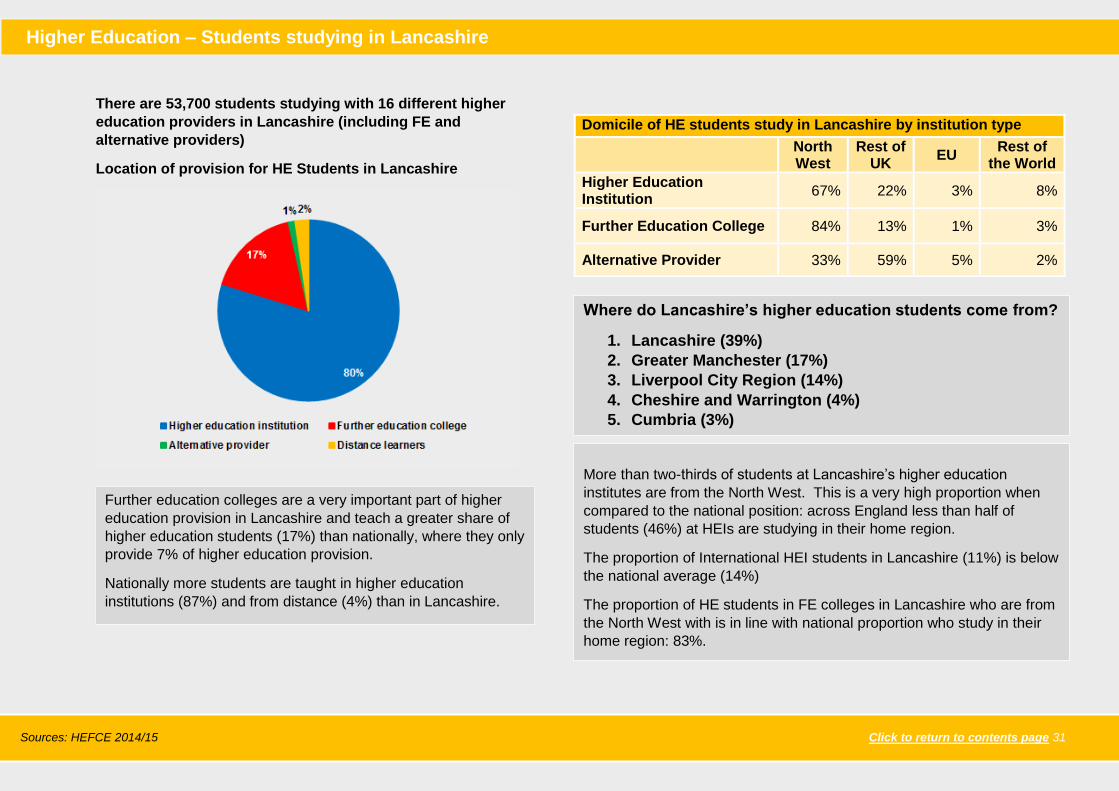
There are 53,700 students studying with 16 different higher
education providers in Lancashire (including FE and
alternative providers)
Location of provision for HE Students in Lancashire
Domicile of HE students study in Lancashire by institution type
North West
Rest of UK
EU Rest of
the World
Higher Education Institution
67% 22% 3% 8%
Further Education College 84% 13% 1% 3%
Alternative Provider 33% 59% 5% 2%
Higher Education – Students studying in Lancashire
Sources: HEFCE 2014/15 Click to return to contents page 31
Where do Lancashire’s higher education students come from?
1. Lancashire (39%)
2. Greater Manchester (17%)
3. Liverpool City Region (14%)
4. Cheshire and Warrington (4%)
5. Cumbria (3%)
Further education colleges are a very important part of higher
education provision in Lancashire and teach a greater share of
higher education students (17%) than nationally, where they only
provide 7% of higher education provision.
Nationally more students are taught in higher education
institutions (87%) and from distance (4%) than in Lancashire.
More than two-thirds of students at Lancashire’s higher education
institutes are from the North West. This is a very high proportion when
compared to the national position: across England less than half of
students (46%) at HEIs are studying in their home region.
The proportion of International HEI students in Lancashire (11%) is below
the national average (14%)
The proportion of HE students in FE colleges in Lancashire who are from
the North West with is in line with national proportion who study in their
home region: 83%.
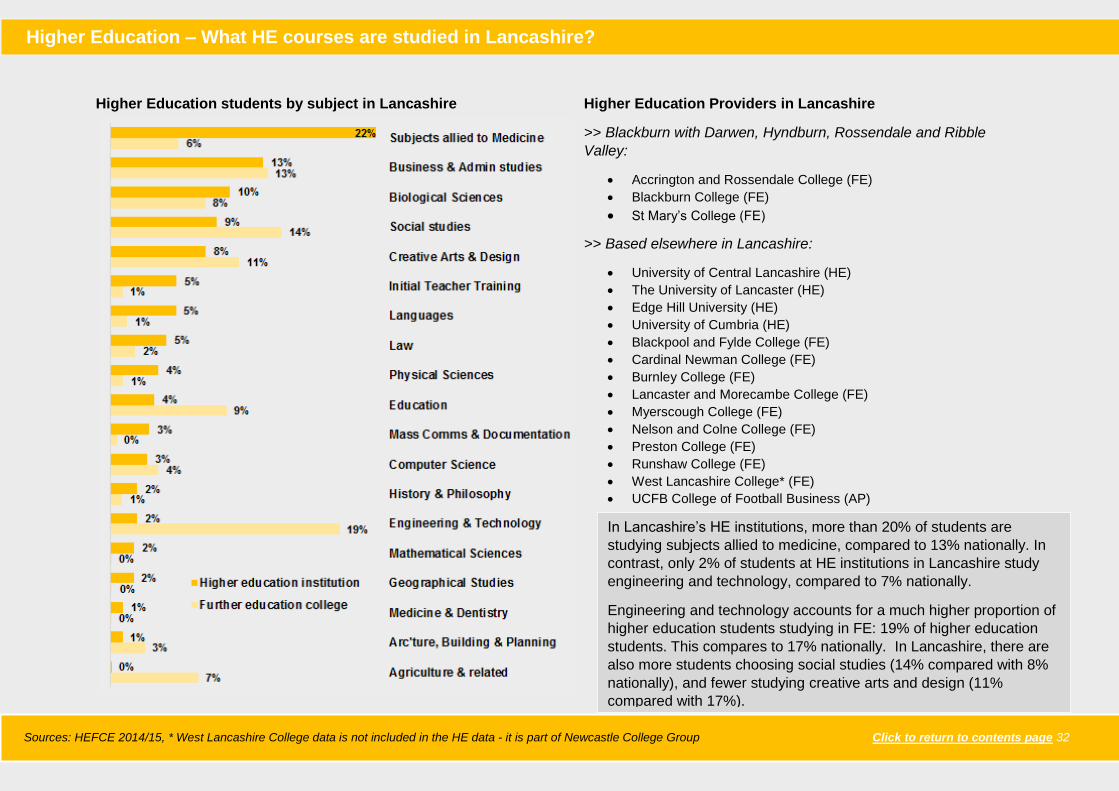
Higher Education students by subject in Lancashire
Higher Education Providers in Lancashire
>> Blackburn with Darwen, Hyndburn, Rossendale and Ribble
Valley:
Accrington and Rossendale College (FE)
Blackburn College (FE)
St Mary’s College (FE)
>> Based elsewhere in Lancashire:
University of Central Lancashire (HE)
The University of Lancaster (HE)
Edge Hill University (HE)
University of Cumbria (HE)
Blackpool and Fylde College (FE)
Cardinal Newman College (FE)
Burnley College (FE)
Lancaster and Morecambe College (FE)
Myerscough College (FE)
Nelson and Colne College (FE)
Preston College (FE)
Runshaw College (FE)
West Lancashire College* (FE)
UCFB College of Football Business (AP)
Higher Education – What HE courses are studied in Lancashire?
Sources: HEFCE 2014/15, * West Lancashire College data is not included in the HE data - it is part of Newcastle College Group Click to return to contents page 32
In Lancashire’s HE institutions, more than 20% of students are
studying subjects allied to medicine, compared to 13% nationally. In
contrast, only 2% of students at HE institutions in Lancashire study
engineering and technology, compared to 7% nationally.
Engineering and technology accounts for a much higher proportion of
higher education students studying in FE: 19% of higher education
students. This compares to 17% nationally. In Lancashire, there are
also more students choosing social studies (14% compared with 8%
nationally), and fewer studying creative arts and design (11%
compared with 17%).

Lancashire Residents Participating in Higher Education
Where do Lancashire’s students go to work?
Sources: HEFCE 2014/15; ONS Longitudinal Education Outcomes data 2005/06 to 2015/16 Click to return to contents page 33
HE Destinations
Higher Education – Where do Lancashire’s students work after graduating?
The top 5 LEP area destinations:
1. Lancashire (37%)
2. Greater Manchester (19%)
3. Liverpool City Region (12%)
4. Cheshire and Warrington (4%)
5. London (4%)
60% of Lancashire residents who participate in higher education go
into employment in Lancashire. This proportion is similar to the
national average for a LEP (59%).
A higher proportion stay to study and then work locally than the LEP
average (29%), while the proportion who leave to study outside
Lancashire and then return for to work locally is lower than the LEP
average (30%).
Outcomes achieved by students of Lancashire’s Higher
Education Institutions:
One year
After one year 79% of graduates from Lancashire’s Higher
Education Institutions are in sustained employment. 10% of
graduates have no sustained destination, slightly lower than the
average for all institutions in the North West where the figure is
11%.
Three years
After three years, the proportion in sustained employment rises to
81%, and only 7% have no sustained destination, again below the
North West figure (8%).
Five years
After five years, the proportion in sustained employment remains
at 81%. The number with no sustained destination drops again to
6%, still below the regional average (7%).
The Education and Skills System
Data is available for all levels of the education and skills system, from Key
Stage 1 through to Higher Education. The data to Key Stage 5 shows how
well education, skills and training providers and residents in the Travel to
Work Area are performing, as well as providing an indication of the
choices that residents make after leaving school.
Data for Higher Education is available at the Lancashire level. It is based
on data gathered for the higher education institutions (including further
education colleges and alternative providers that deliver higher education)
based in Lancashire and therefore generally covers students that study in
the area, regardless of where they come from unless otherwise stated.
Key Stage 1 and 2
Across the LEP area between 80% and 81% of Year 1 pupils meet the
required standard of phonic decoding compared to 80% in the North West
and 81% across England as a whole.
Data that is available for the Travel to Work Area shows that by the end of
Key Stage 2, 53% of pupils are meeting the required standards in reading,
writing and mathematics in Blackburn with Darwen, Hyndburn, Rossendale
and Ribble Valley. This is the third highest of Lancashire’s six Travel to
Work Areas in line with the Lancashire and national average (both 53%).
Performance across the four local authorities varies greatly. Hyndburn and
Blackburn with Darwen have below average performance, with 48% and
51% meeting the required standard respectively. Rossendale pupils
perform above average at 57% and Ribble Valley the best with 64%.
Key Stage 4 (GCSE)
In terms of measuring performance at Key Stage 4 (GCSE), the
Department for Education implemented a new secondary school
accountability system in 2016, using Attainment 8 and Progress 8
measures.
Attainment 8 measures the average achievement of pupils in up to 8
qualifications including English (double weighted if the combined English
qualification, or both language and literature are taken), maths (double
weighted), three further qualifications that count in the English
Baccalaureate (EBacc) and three further qualifications that can be GCSE
qualifications (including EBacc subjects) or any other non-GCSE
qualifications on the DfE approved list.
Progress 8 aims to capture the progress a pupil makes from the end of
Key Stage 2 to the end of Key Stage 4. It compares pupils’ achievement –
their Attainment 8 score – with the average Attainment 8 score of all pupils
nationally who had a similar starting point (or ‘prior attainment’), calculated
using assessment results from the end of primary school. Progress 8 is a
relative measure, therefore the national average Progress 8 score for
mainstream schools is zero.
Across Blackburn with Darwen, Hyndburn, Rossendale and Ribble Valley:
The average attainment 8 score is 50 exceeding 49 in
Lancashire and level with 50 nationally (excluding London).
Behind Preston, Chorley and South Ribble, West Lancashire and
Lancaster and Morecambe (all 51), this is the fourth highest
average score across the Lancashire Travel to Work Areas.
Performance across the four local authorities varies, Blackburn
with Darwen (50) and Rossendale (51) are roughly in line with the
average for the area, whereas Hyndburn performs below (46), and
Ribble Valley above average (54).
On average, pupils make greater progress from the end of Key
Stage 2 to the end of Key Stage 4 than across Lancashire as a
whole, but not nationally (excluding London), or when London is
included. The average progress 8 score in Blackburn with
Darwen, Hyndburn, Rossendale and Ribble Valley is -0.07
(compared to -0.11 for Lancashire and -0.06 for England minus
London). Behind Preston, Chorley and South Ribble and West
Lancashire, this is the third strongest progress score of the six
Lancashire Travel to Work Areas. Progress is strongest in
Blackburn with Darwen and Ribble Valley (which have a positive
scores of 0.11 and 0.03 respectively, indicating that pupils there
make greater progress than the national average when London is
The Education and Skills System in Blackburn with Darwen, Hyndburn, Rossendale and Ribble Valley
Sources: Department for Education, 2016 Click to return to contents page 34
included), compared to average progress scores of -0.21 in
Rossendale and -0.31 in Hyndburn.
Over a fifth (22%) achieve the English Baccalaureate (a grade 5
or above in English and maths and a grade C or above in science,
a language, and geography or history), outperforming the
Lancashire average (21%), but below the average nationally
(excluding London 24%). Each of the local authority areas except
Hyndburn (10%) is above the Lancashire average, while
Blackburn with Darwen (25%) and Rossendale (26%) also
outperform the national average (23% in Ribble Valley).
Upon completion of Key Stage 4, 94% remain in sustained education
and/or an employment / training destination. Behind Preston, Chorley and
South Ribble, West Lancashire and Lancaster and Morecambe, this is the
fourth highest proportion across all of the Lancashire Travel to Work Areas
and in line with the Lancashire and national average (94%). There is little
variance by local area.
Young People aged 16-19
Between aged 16 and 19, attainment at Level 2 / Key Stage 4 (equivalent
to GCSE) and Level 3 / Key Stage 5 (equivalent to A-Levels) is measured.
Across Blackburn with Darwen, Hyndburn, Rossendale and Ribble Valley,
by the age of 19:
86% have achieved Level 2 and 73% have achieved Level 2
with English and maths, below the Lancashire (87%) and above
the national average (71%) in the former, equal to the Lancashire
(73%) and above the national average (71%) in the latter. The
strongest performance is in Ribble Valley (92% and 78%),
followed by Rossendale (86% and 71%) and Hyndburn (85% and
74%) which meet the Lancashire average in one measure each,
whilst Blackburn with Darwen falls below both the Lancashire and
national average (83% and 70%).
62% achieve Level 3 by the age of 19, again outperforming the
Lancashire (59%) and national averages (56%). As with Level 2,
the strong performance is driven by Ribble Valley (70%) and
Blackburn with Darwen also outperforms the Lancashire average
(61%), whilst Rossendale (59%) in line with the Lancashire
average and Hyndburn (57%) below it, both surpass the national
average.
Upon completion of Key Stage 5, 87% of leavers enter sustained
education or employment – which along with Burnley and Pendle is the
lowest of the six Travel to Work Areas, below the Lancashire (88%) and
national (89%) averages. This proportion varies across the local
authorities within the area, ranging from 84% in Hyndburn to 87% in
Blackburn with Darwen, 88% in Rossendale and 90% in Ribble Valley.
The split between education (69%) and employment (18%) is largely in line
with the split across Lancashire and does not differ greatly across the local
areas. This differs slightly from the national profile (65% and 24%) where a
higher proportion enter sustained employment, although education remains
the preferred choice.
The large majority of those entering sustained education (79%) go to
Higher Education Institutions (within and outside Lancashire), while
approximately one in six attend further education institutions. Less than
one in ten students start an apprenticeship upon completion of Key Stage
5, in line with the Lancashire and national average.
Apprenticeships
More employers are choosing apprenticeships as a way to get the people
and skills they need. In 2016/17, there were over 4,600 apprenticeship
starts in Blackburn with Darwen, Hyndburn, Rossendale and Ribble Valley.
This was the highest number of starts across the Travel to Work Areas
and accounted for more than a quarter (26%) of the starts across
Lancashire as a whole (slightly above the area’s share of the working age
population).
The highest number of starts were in Blackburn with Darwen (40%),
followed by Hyndburn (27%), Rossendale (19%) and Ribble Valley (14%).
The Education and Skills System in Blackburn with Darwen, Hyndburn, Rossendale and Ribble Valley
Sources: Department for Education, 2016 Click to return to contents page 35
Almost half of the starts (44%) were by learners aged 25+, while the
remainder were split between learners aged under 19 (28%) and aged 19-
24 (28%).
Across the Travel to Work Area, the apprentice age profile is younger than
typical with a larger proportion of starts accounted for by under 19s when
compared with the Lancashire and national average (both 25%). This is
driven by Ribble Valley and Hyndburn (where 33% and 30% of starts are
accounted for by under 19s compared to 28% in Blackburn with Darwen
and just 24% in Rossendale). In contrast, a higher proportion of starts in
Rossendale (47%) are accounted for by those aged 25 and over (this
compares to 45% in Blackburn with Darwen, 42% in Hyndburn and 47% in
Ribble Valley) and is higher than the national average (46%) and in line
with Lancashire (47%).
There are three main levels of apprenticeships:
Intermediate apprenticeship: This is classed as Level 2 and
equivalent to 5 good GCSEs
Advanced apprenticeship: This is classed as Level 3 and
equivalent to 2 A-Levels
Higher apprenticeship: This can cover level 4, 5, 6 and 7 and is
equivalent to foundation degrees and above.
Over half of the apprenticeship starts in Blackburn with Darwen, Hyndburn,
Rossendale and Ribble Valley in 2016/17 were on intermediate
apprenticeships, while a further 40% were advanced apprenticeships. The
remaining 8% were higher apprenticeships.
The proportion of advanced and higher level starts in the Travel to Work
Area (51%) is higher than the Lancashire (48%) and national (47%)
average. This applies across all local areas (where advanced and higher
level apprenticeships account for between 52% and 54% of starts) except
Rossendale where the figure is 48%.
A wide range of subjects are covered by apprenticeships, including
subjects which align with Lancashire’s priority sectors.
The most frequently commenced apprenticeship in Blackburn with
Darwen, Hyndburn, Rossendale and Ribble Valley is business
administration and law (which accounted for 29% of starts in 2016/17),
followed by health, public services and care (accounting for 27% of starts).
There were also at least 500 starts in engineering and manufacturing
technology and retail and commercial enterprise (accounting for 15% and
12% of starts respectively).
Other subjects studied include construction, planning and the built
environment (5%); leisure travel and tourism (5%); information and
communication technology (3%); education and training (3%); and
agriculture/horticulture and animal care (1%).
The profile of subjects studied is largely similar to the Lancashire wide and
national picture, with the main differences including:
A lower proportion of apprentices (29%) start business
administration and law than across Lancashire (30%) and but
higher than nationally (28%). Ribble Valley (25%) and Rossendale
(26%) bring the figure below the Lancashire average, whereas
31% starts in Blackburn with Darwen and 30% Hyndburn are in
this subject.
The proportion that start health, public services and care (27%)
is below the national (28%) and Lancashire average (30%). This
varies by local area and is the most popular choice in Rossendale
(accounting for 30% of starts) and least in Ribble Valley
(accounting for 21%).
The proportion that start apprenticeships in engineering and
manufacturing technology isnbetween the Lancashire and
national average (15% compared to 14% and 16%) and below
both for retail and commercial enterprise, 12% compared to
13% and 15%. Engineering and manufacturing starts are highest
in Rossendale (18%), Hyndburn (17%) and Ribble Valley (16%),
and retail and commercial enterprise in Ribble Valley at 19%.
Sources: Department for Education, 2016; HEFCE 2014/15 Click to return to contents page 36
The Education and Skills System in Blackburn with Darwen, Hyndburn, Rossendale and Ribble Valley

Higher Education in Lancashire
Overall, there are 53,700 studying at 16 different higher education
providers in Lancashire. The large majority (80%) are based at the four
higher education institutions– the University of Lancaster, the University of
Central Lancashire (which has its main campus based in Preston),
University of Cumbria and Edge Hill University. A further 17% are based in
further education colleges. The remainder are either based at an
alternative provider (1%) or are distance learners (2%).
Compared to the national profile, a much higher share of students in
Lancashire study at further education colleges (17% compared to 7%). In
contrast, a smaller share of learners attend higher education institutions
(80% compared to 87%) or are distance learners (2% compared to 4%).
The higher education institutions and further education colleges have a
strong regional draw. Approximately two thirds of students at Lancashire’s
higher education institutions are from the North West, which is much
higher than the proportion of students (46%) that typically study at higher
education institutions in their home region across England. At Lancashire
based further education providers, the proportion of higher education
students from the North West is even higher (84%) in line with the national
average (83%).
Overall, almost two fifths of students are from Lancashire and choose to
stay in Lancashire to undertake higher education. Other LEP areas from
which students are attracted include Greater Manchester, Liverpool City
Region, Cheshire and Warrington and Cumbria. International students
account for between 3% (at further education providers) and 8% (at higher
education institutions) of higher education students in Lancashire. The
latter is below the national average (10%).
A wide range of subjects are available, covering all sectors and priority
sectors. The popularity of subjects varies by provider type. Across higher
education institutions, the most popular subject choice is subjects allied to
medicine (accounting for 22% of students), followed by business and
admin studies (13%), biological sciences (10%), social studies (9%) and
creative arts and design (8%). When compared with the national profile,
the key differences include:
A much higher proportion of students studying subjects allied to
medicine in Lancashire (22% compared to 13% nationally).
A lower proportion of students studying engineering and
technology (2% compared to 4%)
At further education colleges the most popular HE subjects are
engineering and technology (accounting for 19% of students), followed by
social studies (14%), business and admin studies (13%), creative arts and
design (11%) and education (9%). When compared with the national
profile, the key differences include:
A higher proportion of students studying engineering and
technology (19% compared to 17% nationally) and social studies
(14% compared to 8%)
A lower proportion of students studying creative arts and design
(11% compared to 17%)
Higher Education Destinations
Data on higher education destinations is available for: (a) higher education
students studying in Lancashire regardless of where they are originally
from; and (b) Lancashire residents participating in higher education
regardless of where they are studying.
Lancashire based higher education students: Over a third (37%) of
students studying in Lancashire stay in Lancashire upon completion of
their higher education studies. Other popular destinations include Greater
Manchester, Liverpool City Region and Cheshire and Warrington, which is
to be expected given the high proportion of students that originate from
across the North West. The other most popular destination is London,
although this only applies to 4% of students.
One year after completing higher education, 79% of Lancashire’s students
are in sustained employment, and this increases to 81% five years after.
The Education and Skills System in Blackburn with Darwen, Hyndburn, Rossendale and Ribble Valley
Sources: HEFCE 2014/15; ONS Longitudinal Education Outcomes data 2005/06 to 2015/16 Click to return to contents page 37
This is slightly higher than the North West average of 77% and 79%
respectively.
Lancashire residents participating in higher education: In terms of
Lancashire residents that participate in higher education, 60%
subsequently enter employment in Lancashire. This is similar to the
national average for LEP areas (59%). However, this is made up of a
much higher proportion of students that stay for study and employment
(39% in Lancashire compared to the LEP average of 29%) than those who
leave for study and return for employment (21% in Lancashire compared
to LEP average of 30%).
The Education and Skills System in Blackburn with Darwen, Hyndburn, Rossendale and Ribble Valley
Sources: HEFCE 2014/15; ONS Longitudinal Education Outcomes data 2005/06 to 2015/16 Click to return to contents page 38
Key messages for partners across Blackburn with Darwen,
Hyndburn, Rossendale and Ribble Valley
The data and analysis set out in this Travel to Work Area Report and in the
wider Labour Market Intelligence Toolkit provides an overview of
employment and skills in Blackburn with Darwen, Hyndburn, Rossendale
and Ribble Valley, and across Lancashire more widely.
This provides local partners with intelligence that can be used to identify
and set skills and employment priorities and to design, influence, develop
and implement intervention that supports skills development and tackles
skills and employment issues, maximising the resources available.
This intervention could take a variety of forms, ranging from providing
advice and guidance to learners and employers through to delivering
projects targeted at specific groups such as unemployed adults, and
designing and shaping the curriculum in schools, further education and
higher education providers.
This section of the report summarises the key messages to help guide
partners in Blackburn with Darwen, Hyndburn, Rossendale and Ribble
Valley.
A Major Population and Employment Centre
As the second largest of the Lancashire Travel to Work Areas in both
population and employment terms, the Blackburn with Darwen, Hyndburn,
Rossendale and Ribble Valley economy has an important role to play. The
main centre of population and employment in the East of Lancashire,
Blackburn with Darwen is the main administrative centre for this part of the
LEP area and acts as a service centre for residents from across and
outside the Travel to Work Area.
Overall the area has experienced both population and employment growth
in recent years, although this has been below the national average and
has varied at the local level.
A Diverse Economy with Varied Employment Opportunities
The Blackburn with Darwen, Hyndburn, Rossendale and Ribble Valley
economy is diverse, offering a range of employment opportunities to
residents from within and outside the Travel to Work Area. The
employment opportunities available cover all sectors, including
Lancashire’s priority sectors, and all occupations. In contrast to Lancashire
as a whole, and illustrating the importance of this area to Lancashire’s
manufacturing base, the largest sector in employment terms is
manufacturing, accounting for nearly 1 in 5 of all jobs. Wholesale and
retail and health, followed by education and accommodation and food
service activities. Each of these sectors, and particularly construction, are
well represented in the Travel to Work Area.
The composition of the business base, further adds to the diversity of the
employment opportunities. In addition to key large employers, there is also
a significant SME base in each sector offering jobs at all skills levels.
Employment is distributed across the area, with concentrations in the key
centres and along transport routes.
Overall, the diversity and distribution of the employment base helps to
support a reasonably high concentration of residents to both live and work
in Blackburn with Darwen, Hyndburn, Rossendale and Ribble Valley.
Future Employment Opportunities
Employment is forecast to grow between 2018 and 2028, with the creation
of just under 1,000 new jobs. The level of growth in Blackburn with
Darwen, Hyndburn, Rossendale and Ribble Valley is expected to be
considerably slower than the Lancashire wide average, although with
focussed investment, growth could be stronger. Forecasts indicate that
there will be recruitment across all sectors and occupations, including in
each of Lancashire’s priority sectors, and sectors that have recently
experienced employment decline such as manufacturing. This will include
recruitment for the relatively small number of new jobs created through
sector growth, and jobs that become available as people leave or change
jobs.
Key Messages for Blackburn with Darwen, Hyndburn, Rossendale and Ribble Valley
Click to return to contents page 39
In Blackburn with Darwen, Hyndburn, Rossendale and Ribble Valley, the
sectors offering the most employment opportunities each year are
expected to be wholesale and retail, human health and social work,
manufacturing, accommodation and food services and administrative and
support services. In terms of occupations, recruitment is expected to be
highest for professional, caring and elementary occupations reflecting a
move towards an ‘hourglass’ shaped labour market with opportunities at
the top and bottom end but fewer mid-level roles.
A key trend, which will be of particular importance to local partners, is the
forecast change in skills requirements. In line with trends forecast for
Lancashire and nationally, demand and the need for residents to have
higher level skills is expected to increase.
Specifically, the number of people in employment in Blackburn with
Darwen, Hyndburn, Rossendale and Ribble Valley, which hold
qualifications at Level 3 or above is expected to increase, while the
number in employment with qualifications at Level 2 or below or no
qualifications will fall. The number of people in employment with other
qualifications, such as apprenticeships is also expected to increase. This
trend typically applies across all occupations.
Both the forecast growth in the economy and the changing skills
requirements highlight the need to ensure that the local labour supply is of
an appropriate scale and suitably qualified to meet the future needs of
employers and support local economic growth. This will require partners to
address a series of challenges as set out in the following sections.
Maximising Labour Supply in Blackburn with Darwen, Hyndburn,
Rossendale and Ribble Valley
While the population is expected to grow very slightly over the next ten
years across Blackburn with Darwen, Hyndburn, Rossendale and Ribble
Valley, the population is ageing – as is the case nationally - and this will
present challenges for the economy, and especially local employers, in
terms of labour supply and recruitment.
In particular, the working age population in Blackburn with Darwen,
Hyndburn, Rossendale and Ribble Valley is expected to fall, reversing the
growth seen over the past 10 years. To add to the challenge, this is a
Lancashire wide trend (with decline at the Lancashire level expected to be
less severe than in Blackburn with Darwen, Hyndburn, Rossendale and
Ribble Valley) further limiting the labour supply that will be available from
neighbouring areas.
This challenge reinforces the need to maximise the participation of local
residents in the economy. The Travel to Work Area has a slightly less
well-qualified population than Lancashire as a whole, and a lower
proportion of working age residents in employment. There also continues
to be a significant cohort of unemployed and inactive adults, many of
whom would like to work, as well as adults with low or no qualifications.
Identifying opportunities to engage these groups will help to boost
prosperity and tackle wider labour market challenges across the area.
There are also variances by gender, age and ethnicity and across the local
areas, including lower levels of employment and higher levels of
unemployment and inactivity in Blackburn with Darwen, which are masked
by the Travel to Work Area average and which will require targeted
intervention.
In addition to increasing participation, there is a need to consider how
residents that are already in work are employed (i.e. the quality of the jobs
in which people work) and if support can be provided to aid development
and progression, and to ensure that these residents are able to continue to
find work as employer and skills requirements continue to change.
Meeting Employers Skills Needs – Now and in the Future
In recent years, there has been an increasing focus on responding to and
meeting employer needs as a means of supporting local economic growth.
In addition to the forecast changes in skills levels, employers continue to
report skills gaps in the current workforce and skills shortages when trying
to recruit new workers. Some of the most commonly reported reasons for
skills gaps amongst employers relate to employees and potential recruits
undertaking and completing relevant training.
Key Messages for Blackburn with Darwen, Hyndburn, Rossendale and Ribble Valley
Click to return to contents page 40
The data available suggests that training provision linked to all sectors and
occupations is available across Lancashire, and generally the most
popular subject choices for apprenticeships and higher education align
with key sectors and employment opportunities locally. Ensuring that the
content, availability and level of this provision, aligns with employer needs
is an important priority for local partners, especially as a number of
changes in the way people learn and their learning choices, including
changes through Technical Education reform, are implemented.
Alongside this, and of equal importance, there is a need to ensure that
young people – the future labour supply – are aware of employer
requirements and are supported to gain the skills, qualifications and
employability skills they need to succeed in the labour market.
Educational attainment varies across the Travel to Work Area, and
although attainment levels by the age of 19 are good on average, there is
a need to strengthen the performance of the education system in those
areas where pupils currently make below average levels of progress (e.g.
Hyndburn).
Click to return to contents page 41
Key Messages for Blackburn with Darwen, Hyndburn, Rossendale and Ribble Valley

The table below shows (in broad terms) the relationship between sectors (including Lancashire’s priority sectors), occupations and the emerging technical
education routes which will provide a pathway into many skilled occupations in future. There is a large degree of overlap between occupations and sectors,
with many occupations found across a large number of sectors, e.g. management roles, administrative occupations and support roles such as IT, human
resources, etc. The allocation of a technical education route to a specific sector therefore is somewhat simplistic – many routes will be relevant to a number
of sectors.
It is also important to note that many occupations require similar underlying skills and qualifications, including numeracy, literacy and IT skills. Technical
education is only one route into employment – many people will progress into higher education, where the link between subject studied and occupation
subsequently taken up can be less direct.
Sectors, Occupations and Education Routeways
Sector Relationship to Lancashire’s Priority Sectors
Occupations* Technical Education Routes**
Agriculture, forestry and fishing n/a Vast majority of jobs are in skilled trades and elementary occupations, e.g. farmers, groundsmen, farm workers etc, plus a small number of higher level occupations e.g. managers, veterinarians, environmental professionals
Agriculture, environmental and animal care
Mining and quarrying Some elements are part of Energy and Environmental Technologies
One-third work in higher level occupations, including engineers, production managers, health and safety officers etc 20% are process, plant and machine operatives, e.g. plant workers Relatively high proportion of administrative and secretarial occupations
Construction Engineering and manufacturing
Electricity, gas, steam and air conditioning supply
Energy and Environmental Technologies
Water supply, sewerage, waste management and remediation
Some elements are part of Energy and Environmental Technologies
Click to return to contents page 42
Appendix: Sectors, Occupations and Educational Routes
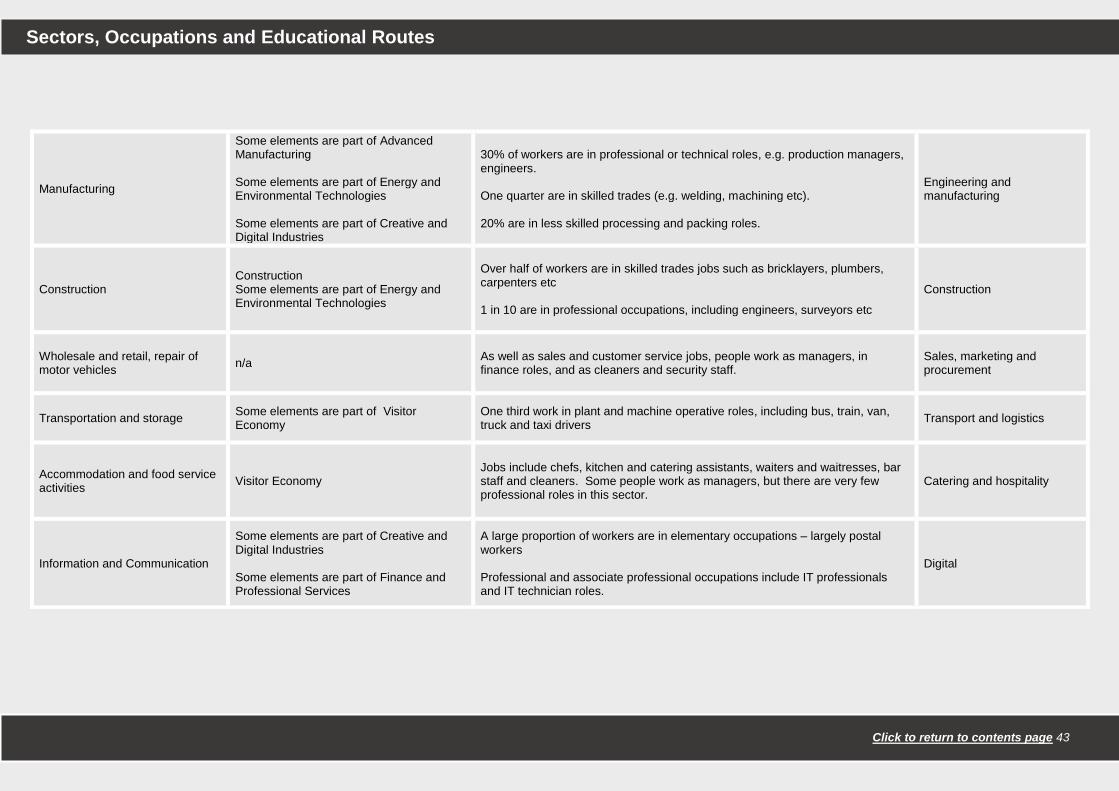
Manufacturing
Some elements are part of Advanced Manufacturing Some elements are part of Energy and Environmental Technologies Some elements are part of Creative and Digital Industries
30% of workers are in professional or technical roles, e.g. production managers, engineers. One quarter are in skilled trades (e.g. welding, machining etc). 20% are in less skilled processing and packing roles.
Engineering and manufacturing
Construction Construction Some elements are part of Energy and Environmental Technologies
Over half of workers are in skilled trades jobs such as bricklayers, plumbers, carpenters etc 1 in 10 are in professional occupations, including engineers, surveyors etc
Construction
Wholesale and retail, repair of motor vehicles
n/a As well as sales and customer service jobs, people work as managers, in finance roles, and as cleaners and security staff.
Sales, marketing and procurement
Transportation and storage Some elements are part of Visitor Economy
One third work in plant and machine operative roles, including bus, train, van, truck and taxi drivers
Transport and logistics
Accommodation and food service activities
Visitor Economy Jobs include chefs, kitchen and catering assistants, waiters and waitresses, bar staff and cleaners. Some people work as managers, but there are very few professional roles in this sector.
Catering and hospitality
Information and Communication
Some elements are part of Creative and Digital Industries Some elements are part of Finance and Professional Services
A large proportion of workers are in elementary occupations – largely postal workers Professional and associate professional occupations include IT professionals and IT technician roles.
Digital
Sectors, Occupations and Educational Routes
Click to return to contents page 43
Sectors, Occupations and Educational Routes
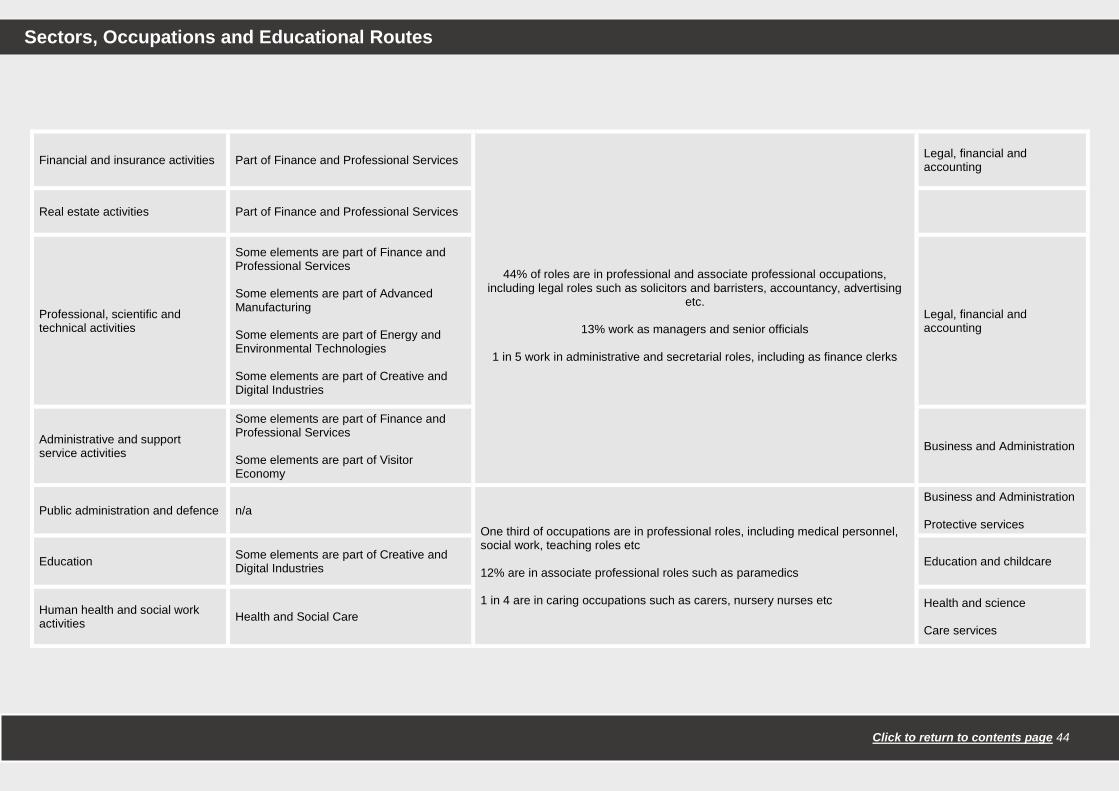
Financial and insurance activities Part of Finance and Professional Services
44% of roles are in professional and associate professional occupations,
including legal roles such as solicitors and barristers, accountancy, advertising etc.
13% work as managers and senior officials
1 in 5 work in administrative and secretarial roles, including as finance clerks
Legal, financial and accounting
Real estate activities Part of Finance and Professional Services
Professional, scientific and technical activities
Some elements are part of Finance and Professional Services Some elements are part of Advanced Manufacturing Some elements are part of Energy and Environmental Technologies Some elements are part of Creative and Digital Industries
Legal, financial and accounting
Administrative and support service activities
Some elements are part of Finance and Professional Services Some elements are part of Visitor Economy
Business and Administration
Public administration and defence n/a
One third of occupations are in professional roles, including medical personnel, social work, teaching roles etc 12% are in associate professional roles such as paramedics 1 in 4 are in caring occupations such as carers, nursery nurses etc
Business and Administration Protective services
Education Some elements are part of Creative and Digital Industries
Education and childcare
Human health and social work activities
Health and Social Care Health and science Care services
Sectors, Occupations and Educational Routes
Click to return to contents page 44

Arts, entertainment and recreation Parts included in Visitor Economy; Parts included in Creative and Digital
Relatively few people are employed in professional roles One-third of people work in caring, leisure and other service occupations, such as hairdressing and beauty therapy
Associate professional occupations include artistic occupations such as artists, authors, actors, dancers, musicians, photographers
Creative and design
Other service activities n/a Hair and beauty
Source: BRES, Annual Population Survey * Occupations data based on broad sector definitions and applied to SIC sections ** Technical education routes will prepare people for occupations which may be found within a number of sectors
Sectors, Occupations and Educational Routes
Click to return to contents page 45