The Black CAPM - AER NERA The Black CAPM.pdf · financial model, such as the Capital Asset Pricing...
76
March 2012 The Black CAPM A report for APA Group, Envestra, Multinet & SP AusNet
Transcript of The Black CAPM - AER NERA The Black CAPM.pdf · financial model, such as the Capital Asset Pricing...

March 2012
The Black CAPM A report for APA Group, Envestra, Multinet & SP AusNet
Project Team
Simon Wheatley
Brendan Quach
NERA Economic Consulting Darling Park Tower 3 201 Sussex Street Sydney NSW 2000 Tel: +61 2 8864 6500 Fax: +61 2 8864 6549 www.nera.com

The Black CAPM Contents
NERA Economic Consulting
Contents
Executive Summary i
1 Introduction 1
1.1 Statement of Credentials 2
2 Theory 3
2.1 The Sharpe-Lintner CAPM 3 2.2 The Black CAPM 4
3 Empirical Evidence 6
3.1 Methodology 7 3.2 Data 9 3.3 Estimates 10 3.4 Forecasts 13 3.5 Cost of Equity 18
4 Commercial and Regulatory Use of the CAPM 20
4.1 Flexibility in Choice of Parameters 20 4.2 Numerical Example 22
5 Interpreting Survey Evidence 25
5.1 Review 25 5.2 Interpretation 27
6 Davis and Handley Critiques 28
6.1 Issues Raised by Davis 28 6.2 Issues Raised by Handley 29
7 Conclusions 31
Appendix A. Litzenberger-Ramaswamy Methodology 36
Appendix B. Terms of Reference 37
B.1. Background 37 B.2. Questions 37 B.3. Expert Report 38 B.4. Contact 38

The Black CAPM Contents
NERA Economic Consulting
Appendix C. Curriculum Vitae 39
Simon M. Wheatley 39
Brendan Quach 45

The Black CAPM List of Tables
NERA Economic Consulting
List of Tables
Table 1 Estimates of the cost of equity for a regulated energy utility iv Table 3.1 Estimates of the mean excess return to a zero-beta portfolio 11 Table 3.2 An evaluation of the Black CAPM and Sharpe-Lintner CAPM 16 Table 3.3 Toro-Vizcarrondo and Wallace tests of the SL CAPM versus the Black CAPM 18 Table 3.4 Estimates of the cost of equity for a regulated energy utility 19 Table 7.1 Estimates of the cost of equity for a regulated energy utility 34

The Black CAPM List of Figures
NERA Economic Consulting
List of Figures
Figure 3.1 Sample mean excess return against sample standard deviation of excess return 12 Figure 3.2 Recursive estimates of the zero-beta excess return 14

The Black CAPM Executive Summary
NERA Economic Consulting i
Executive Summary
This report has been prepared for APA Group, Envestra, Multinet and SP AusNet by NERA Economic Consulting (NERA). APA Group, Envestra, Multinet and SP AusNet have asked NERA to examine a number of issues concerning the Black Capital Asset Pricing Model (CAPM) that arise from the Australian Energy Regulator’s recently published Draft Distribution Determination Aurora Energy Pty Ltd 2012–13 to 2016–17 (“the AER’s Aurora Draft Decision”) and other recent AER decisions.
Rule 87 of the National Gas Rules sets out provisions relating to the rate of return (or WACC) as follows:
‘(1) The rate of return on capital is to be commensurate with prevailing conditions in the market for funds and the risks involved in providing reference services.
(2) In determining a rate of return on capital:
(a) it will be assumed that the service provider:
(i) meets benchmark levels of efficiency; and
(ii) uses a financing structure that meets benchmark standards as to gearing and other financial parameters for a going concern and reflects in other respects best practice; and
(b) a well accepted approach that incorporates the cost of equity and debt, such as the Weighted Average Cost of Capital, is to be used; and a well accepted financial model, such as the Capital Asset Pricing Model, is to be used.’
APA Group, Envestra, Multinet and SP AusNet have asked NERA:
whether an empirical version of the Black CAPM is better able than an empirical version of the Sharpe-Lintner (SL) CAPM to produce an estimate of the cost of equity that meets the requirements of Rule 87 (1) that the rate of return on capital be commensurate with prevailing conditions in the market for funds;
whether the Black CAPM is a well accepted financial model, as required by rule 87(2)(b); and
what is our estimate of the cost of equity that uses an empirical version of the Black CAPM.
To answer these questions, we:
examine whether an empirical version of the SL CAPM or Black CAPM better explains the cross-section of mean returns to Australian stocks;
examine whether past estimates of the zero-beta excess return can predict future estimates of the zero-beta excess return;
examine whether currently available data indicate that an empirical version of the SL CAPM or Black CAPM will provide a better estimate, using mean squared error (MSE) as a criterion, of the future mean excess return to a zero-beta portfolio;

The Black CAPM Executive Summary
NERA Economic Consulting ii
examine whether the evidence indicates that companies and institutions that state that they use the CAPM use the SL CAPM, the Black CAPM or both models; and
examine how one should interpret survey evidence on the use by companies and institutions of the SL CAPM.
We also:
address issues surrounding the use of the Black CAPM that Handley and Davis raise in their January 2011 reports for the AER. 1
We show that recent evidence provided by CEG (2008) and Lajbcygier and Wheatley (2012) indicates that: 2
an empirical version of the Black CAPM better explains the cross-section of mean returns to Australian stocks than does an empirical version of the SL CAPM. Estimates of the mean excess return to a zero-beta portfolio are of the same order of magnitude as the market risk premium (MRP) and differ significantly from zero;
there is a strong and significant positive relation between past estimates of the zero-beta excess return and future estimates of the zero-beta excess return – in other words, past estimates of the zero-beta excess return can predict future estimates of the zero-beta excess return; and
currently available data indicate that an empirical version of the Black CAPM will provide a better estimate, using MSE as a criterion, of the future mean excess return to a zero-beta portfolio than an empirical version of the SL CAPM.
We also conclude that:
the evidence indicates that institutions that state that they use the CAPM often use the SL CAPM together with the Black CAPM because they use Blume-adjusted estimates of equity betas when there is little rationale for doing so; 3 and
survey evidence that most but not all companies use the CAPM does not reveal why a significant fraction of companies do not use the CAPM – the evidence does not, for example, show whether firms with low-beta assets or firms with high-beta assets avoid using an empirical version of the SL CAPM because of the known problems the model has in pricing these assets.
Finally, we note that:
1 Davis, K., Cost of equity issues: A report for the AER, January 2011.
Handley, J., Peer review of draft report by Davis on the cost of equity, January 2011. 2 CEG, Estimation of, and correction for, biases inherent in the Sharpe CAPM formula, September 2008.
Lajbcygier, P. and S. M. Wheatley, An evaluation of some alternative models for pricing Australian stocks, Monash University, March 2012.
3 A Blume-adjusted estimate of beta is a weighted average of a least squares estimate and one.

The Black CAPM Executive Summary
NERA Economic Consulting iii
the Black CAPM is a more general model than the SL CAPM – so one cannot conclude that the evidence does not support the Black CAPM but does support the SL CAPM;
the Black CAPM does not imply that the zero-beta rate associated with a proxy for the market portfolio that includes only stocks should lie between the lending and borrowing rates; and
what concerns companies and regulators is not whether the SL CAPM is true but whether the empirical version of the SL CAPM that the AER uses has a tendency to underestimate the returns required on low-beta assets – the evidence, as we note, is that it does.
Table 1 below displays four estimates of the cost of equity that use an empirical version of the Black CAPM. The estimates use two different estimates of the mean return to a zero-beta portfolio in excess of the risk-free rate. One of the estimates, 8.15 per cent per annum, is an estimate that CEG (2008) provides that uses the 300 largest stocks formed into 10 equally weighted portfolios from 1974 to 2007. 4 The other estimate, 6.99 per cent per annum, is an estimate that Lajbcygier and Wheatley (2012) provide that uses the 100 largest stocks from 1963 to 1973 and the 500 largest stocks from 1974 to 2010. 5
The estimates of the cost of equity in Table 1 also use two different estimates of the MRP that we provide in our March 2012 report Prevailing Conditions and the Market Risk Premium: A report for APA Group, Envestra, Multinet & SP AusNet. One of the estimates, 8.44 per cent per annum, uses a regime-switching model for volatility while the other estimate, 7.69 per cent, uses the Dividend Growth Model (DGM).
Table 1 indicates that the four estimates of the cost of equity do not differ substantially from one another. We prefer, though, to use the estimate of the mean return to a zero-beta portfolio in excess of the risk-free rate of 6.99 per cent per annum that Lajbcygier and Wheatley (2012) provide because it is based on the longest time series. 6 The estimate that we provide in our March 2012 report of an MRP, derived from a regime-switching model, is an average of the forecasts that the model makes over each of the next five years. The value for the MRP that the DGM attempts to estimate is a complicated average of the MRP over all future years. So we judge the estimate of the MRP provided by the regime-switching model of 8.44 per cent per annum to provide the most suitable guide as to the MRP prevailing in the market over the five years of a regulatory period.
With a risk-free rate of 3.99 and a beta of 0.8 that the AER uses in its Aurora Draft Decision, an estimate of the cost of equity that uses a an estimate of the mean return to a zero-beta
4 CEG, Estimation of, and correction for, biases inherent in the Sharpe CAPM formula, September 2008. 5 Lajbcygier, P. and S. M. Wheatley, An evaluation of some alternative models for pricing Australian stocks, Monash
University, March 2012. 6 Lajbcygier, P. and S. M. Wheatley, An evaluation of some alternative models for pricing Australian stocks, Monash
University, March 2012.

The Black CAPM Executive Summary
NERA Economic Consulting iv
portfolio in excess of the risk-free rate of 6.99 per cent per annum and an estimate of the MRP of 8.44 per cent per annum is, from Table 1, 12.14 per cent per annum. 7
Table 1 Estimates of the cost of equity for a regulated energy utility
Zero-beta source
MRP source
Risk-free rate
Zero-beta excess return MRP Beta
Cost of equity
CEG NERA 3.99 8.15 8.44 0.80 12.37
NERA NERA 3.99 6.99 8.44 0.80 12.14
CEG NERA 3.99 8.15 7.69 0.80 11.77
NERA NERA 3.99 6.99 7.69 0.80 11.54
Note: The beta of 0.8 is an assumed value.
Sources: CEG, Estimation of, and correction for, biases inherent in the Sharpe CAPM formula, September 2008.
Lajbcygier, P. and S. M. Wheatley, An evaluation of some alternative models for pricing Australian stocks, Monash University, March 2012.
To understand how the cost of equity in Table 1 is computed, note that the cost of equity produced by the Black CAPM in excess of the risk-free rate is: 8
],)[E()E( 00 mjj zz
where
jz = the return to asset j in excess of the risk-free rate;
mz = the return to the market portfolio in excess of the risk-free rate;
j = asset j’s beta, which measures the contribution of the asset to the risk,
measured by standard deviation of return, of the market portfolio; and
0 = the return to a zero-beta portfolio in excess of the risk-free rate.
Thus if the risk-free rate is 3.99 per cent per annum and 448)E(6.99,0 .zm and
,.j 80 then the cost of equity must be:
7 See equation (3) in Section 2 below and the accompanying discussion. 8 A risk-free rate of 3.99 per cent per annum is obtained by applying the AER’s method of interpolation to the observed
yields on 10-year Commonwealth Government Securities (CGS), as measured over the 20-day averaging period to 16 December 2011.

The Black CAPM Executive Summary
NERA Economic Consulting v
annum.percentper1412]996448[80996993 ......
To summarise, in our opinion:
an empirical version of the Black CAPM is better able than an empirical version of the SL CAPM to produce an estimate of the cost of equity that meets the requirements of Rule 87 (1) that the rate of return on capital be commensurate with prevailing conditions in the market for funds;
the Black CAPM is a well accepted financial model, as required by rule 87(2)(b); and
an estimate of the cost of equity that uses an empirical version of the Black CAPM is 12.14 per cent per annum.

The Black CAPM Introduction
NERA Economic Consulting 1
1 Introduction
This report has been prepared for APA Group, Envestra, Multinet and SP AusNet by NERA Economic Consulting (NERA). APA Group, Envestra, Multinet and SP AusNet have asked NERA to examine a number of issues concerning the Black Capital Asset Pricing Model (CAPM) that arise from the Australian Energy Regulator’s recently published Draft Distribution Determination Aurora Energy Pty Ltd 2012–13 to 2016–17 (“the AER’s Aurora Draft Decision”).
APA Group, Envestra, Multinet and SP AusNet have asked NERA:
whether an empirical version of the Black CAPM is better able than an empirical version of the Sharpe-Lintner (SL) CAPM to produce an estimate of the cost of equity that meets the requirements of Rule 87 (1) of the National Gas Rules (NGR) that the rate of return on capital be commensurate with prevailing conditions in the market for funds;
whether the Black CAPM is a well accepted financial model, as required by rule 87(2)(b) of the NGR; and
what is our estimate of the cost of equity that uses an empirical version of the Black CAPM.
To answer these questions, we:
examine whether the SL CAPM or Black CAPM better explains the cross-section of mean returns to Australian stocks;
examine whether past estimates of the zero-beta excess return can predict future estimates of the zero-beta excess return;
examine whether currently available data indicate that the SL CAPM or Black CAPM will provide a better estimate, using mean squared error (MSE) as a criterion, of the future mean excess return to a zero-beta portfolio;
examine whether the evidence indicates that companies and institutions that state that they use the CAPM use the SL CAPM, the Black CAPM or both models; and
examine how one should interpret survey evidence on the use by companies and institutions of the SL CAPM.
We also:
address issues surrounding the use of the Black CAPM that Handley and Davis raise in their January 2011 reports for the AER. 9
9 Davis, K., Cost of equity issues: A report for the AER, January 2011.
Handley, J., Peer review of draft report by Davis on the cost of equity, January 2011.

The Black CAPM Introduction
NERA Economic Consulting 2
The remainder of this report is structured as follows:
Section 2 – describes the theory behind the Black CAPM;
Section 3 – examines the empirical evidence on the Black CAPM;
Section 4 – examines commercial and regulatory use of the CAPM;
Section 5 – examines how one should interpret survey evidence on the use of the CAPM;
Section 6 – addresses issues that Handley and Davis raise; and
Section 7 – provides conclusions.
Appendix A describes the Litzenberger-Ramaswamy estimator that we use, the scope of this engagement is set out in the terms of reference that appear in Appendix B and Appendix C contains the curriculum vitae of each author of this report.
1.1 Statement of Credentials
This report has been jointly prepared by Simon Wheatley and Brendan Quach.
Simon Wheatley is a Special Consultant with NERA, and was until 2008 a Professor of Finance at the University of Melbourne. Since 2008, Simon has applied his finance expertise in investment management and consulting outside the university sector. Simon’s interests and expertise are in individual portfolio choice theory, testing asset-pricing models and determining the extent to which returns are predictable. Prior to joining the University of Melbourne, Simon taught finance at the Universities of British Columbia, Chicago, New South Wales, Rochester and Washington.
Brendan Quach is a Senior Consultant at NERA with eleven years experience as an economist, specialising in network economics and competition policy in Australia, New Zealand and Asia Pacific. Since joining NERA in 2001, Brendan has advised a wide range of clients on regulatory finance matters, including approaches to estimating the cost of capital for regulated infrastructure businesses.
In preparing this report, each of the joint authors (herein after referred to as ‘we’ or ‘our’ or ‘us’) confirms that we have made all the inquiries we believe are desirable and appropriate to answer the questions put to us and no matters of significance that we regard as relevant have, to our knowledge, been withheld from this report. We have been provided with a copy of the Federal Court guidelines Federal Court of Australia, Practice Note CM 7, Expert Witnesses in Proceedings in the Federal Court of Australia dated 1 August 2011. We have reviewed those guidelines and this report has been prepared consistently with the form of expert evidence required by those guidelines.
We have undertaken consultancy assignments for APA Group, Envestra, Multinet and SP AusNet in the past. However, we remain at arm’s length, and as independent consultants.

The Black CAPM Theory
NERA Economic Consulting 3
2 Theory
We begin by describing the theory that underlies the SL CAPM and Black CAPM.
2.1 The Sharpe-Lintner CAPM
Sharpe (1964) and Lintner (1965) show that if risk-averse investors:
(i) choose between portfolios on the basis of the mean and variance of each portfolio’s return measured over a single period;
(ii) share the same investment horizon and beliefs about the distribution of returns;
(iii) face no taxes (or the same rate of tax on all forms of income) and there are no transaction costs; and
(iv) can borrow or lend freely at a single risk-free rate,
then the market portfolio of risky assets must be mean-variance efficient.10 A portfolio that is mean-variance efficient is a portfolio that has the highest mean return for a given level of risk, measured by variance of return.
If the market portfolio is mean-variance efficient, the following condition will hold:
],)[E()E( fmjfj rrrr (1)
where
E(rj) = is the mean return on asset j;
rf = is the risk-free rate;
j = asset j’s beta, which measures the contribution of the asset to the risk, measured by standard deviation of return, of the market portfolio; and
E(rm) = the mean return to the market portfolio of risky assets.
In the SL CAPM, a risk-averse investor will never invest solely in a single risky asset but rather will hold a share of the market portfolio. So, in the model, an investor cares not about how risky an individual asset would be if held alone, but by how the asset contributes to the risk of the market portfolio.
As Roll (1977) makes clear, however, the SL CAPM predicts that the market portfolio of all risky assets must be mean-variance efficient – it does not predict that the market portfolio of stocks must be mean-variance efficient.11 The empirical version of the model that the AER
10 Sharpe, William F., Capital asset prices: A theory of market equilibrium under conditions of risk, Journal of Finance 19, 1964, pages 425-442.
Lintner, John, The valuation of risk assets and the selection of risky investments in stock portfolios and capital budgets, Review of Economics and Statistics 47, 1965, pages 13-37.
11 Roll, R., A critique of the asset pricing theory’s tests: Part I, Journal of Financial Economics 4, 1977, pages 129-176.

The Black CAPM Theory
NERA Economic Consulting 4
uses measures the risk of an asset relative to a portfolio of stocks alone. Stocks have readily available and transparent prices relative to other risky assets such as debt, property and human capital. Stocks, though, make up a relatively small fraction of all risky assets, so the return to a portfolio of stocks need not track closely the return to the market portfolio of all risky assets. So it should be no surprise to find that the empirical version of the SL CAPM that the AER uses does not adequately describe the data.
While the SL CAPM is an attractively simple theory, it has been known for well over 40 years that empirical versions of the model tend to underestimate the returns to low-beta assets and overestimate the returns to high-beta assets. Mehrling (2005), for example, reports that:12
‘The very first [Wells Fargo] conference was held in August 1969 at the University of Rochester in New York State ... The focus of the first Wells Fargo conference was on empirical tests of the CAPM ... the most significant output of the first conference was the paper of Fischer Black, Michael Jensen, and Myron Scholes (BJS), titled “The Capital Asset Pricing Model: Some Empirical Tests,” eventually published in 1972. ... One important consequence of the BJS tests was to confirm earlier suggestions that low-beta stocks tend to have higher returns and high-beta stocks tend to have lower returns than the theory predicts.’
This empirical regularity prompted Black (1972), Vasicek (1971) and Brennan (1971) to examine whether relaxing the assumption that investors can borrow or lend freely at a single rate can produce a model that better fits the data.13
2.2 The Black CAPM
Brennan (1971) shows that if one replaces assumption (iv) with:
(v) investors can borrow at a risk-free rate rb and lend at a risk-free rate rl < rb, then
bzlzmjzj rrrrrrr )E()],E()[E()E()E( (2)
where
E(rz) = the mean return to a zero-beta portfolio.
Although three authors contributed to the development of the model, the model is generally known simply as the Black CAPM. The Black CAPM can be alternatively expressed as stating that:
],)[E()E( 00 mjj zz (3)
where
12 Mehrling, Perry, Fischer Black and the revolutionary idea of finance, Wiley, 2005, pages 104-105. 13 Black, Fischer, Capital market equilibrium with restricted borrowing, Journal of Business 45, 1972, pages 444-454.
Brennan, Michael, Capital market equilibrium with divergent borrowing and lending rates, Journal of Financial and Quantitative Analysis 6, 1971, pages 1197-1205.
Vasicek, Oldrich, Capital market equilibrium with no riskless borrowing, Memorandum, Wells Fargo Bank, 1971.

The Black CAPM Theory
NERA Economic Consulting 5
jz = the return to asset j in excess of the risk-free rate;
mz = the return to the market portfolio in excess of the risk-free rate; and
0 = the return to a zero-beta portfolio in excess of the risk-free rate.
If 0 = 0, the model collapses to the SL CAPM, illustrating the fact that the Black CAPM is a more general model than the SL CAPM. If 0 > 0, as empirically is the case, then the SL CAPM will underestimate the mean returns to low-beta assets. The Black CAPM, by construction, will neither underestimate the returns to low-beta assets nor overestimate the returns to high-beta assets.
It is important to recognise that the Black CAPM, like the SL CAPM, predicts that the market portfolio of all risky assets must be mean-variance efficient – it does not predict that the market portfolio of stocks must be mean-variance efficient.14 The Black CAPM states that the risk of an asset should be measured relative to the market portfolio of all risky assets whereas empirical versions of the model measure the risk of an asset relative to a portfolio of stocks alone. It follows that one should not expect the zero-beta rate in an empirical version of the model to lie between the risk-free borrowing and lending rates. This is because the Black CAPM does not impose the restriction that the mean return to a portfolio that has a zero beta relative to the market portfolio of stocks must lie between the risk-free borrowing and lending rates.
14 Roll, Richard, A critique of the asset pricing theory’s tests: Part I, Journal of Financial Economics 4, 1977, pages 129-176.
The Black CAPM Empirical Evidence
NERA Economic Consulting 6
3 Empirical Evidence
In recent advice provided to the AER, Davis (2011) states that: 15
‘It is my opinion that (i) the Black CAPM does not resolve the problems of the Sharpe CAPM; (ii) is not better supported than the Sharpe CAPM by available empirical evidence; (iii) its implementation is problematic because of problems in reliably estimating the zero beta return..’
In this section we examine:
whether the Black CAPM can resolve the problem of underestimating the return to low-beta assets that is associated with the SL CAPM;
whether the empirical evidence indicates that the Black CAPM is better supported by the empirical evidence; and
whether there are problems in reliably estimating the zero-beta return,
where we emphasise that all references to the CAPM in this section are to empirical versions of the model and not the model itself unless otherwise made clear.
In particular, we examine the empirical evidence on:
whether the SL CAPM or Black CAPM better explains the cross-section of mean returns to Australian stocks – in other words, whether an estimate of the mean excess return to a zero-beta portfolio differs significantly from zero;
whether past estimates of the zero-beta excess return can predict future estimates of the zero-beta excess return; and
whether currently available data indicate that an empirical version of the SL CAPM or Black CAPM will provide a better estimate, using MSE as a criterion, of the future mean excess return to a zero-beta portfolio.
We examine the evidence on these issues using the recent work of CEG (2008), who test the SL CAPM against the Black CAPM using Australian portfolio data from 1974 to 2007 and the two-pass methodology of Fama and MacBeth and the recent work of Lajbcygier and Wheatley (2012), who test the SL CAPM against the Black CAPM using individual Australian stock data from 1963 to 2010 and the two-pass methodology of Fama and MacBeth (1973), Litzenberger and Ramaswamy (1979) and Shanken (1992). 16
15 Davis, K., Cost of equity issues: A report for the AER, January 2011, page 21. 16 CEG, Estimation of, and correction for, biases inherent in the Sharpe CAPM formula, September 2008.
Fama, E. F. and J. D. Macbeth, Risk, return and equilibrium: Empirical tests, Journal of Political Economy, 1973, pages 607-636.
Lajbcygier, P. and S. M. Wheatley, An evaluation of some alternative models for pricing Australian stocks, Monash University, March 2012.
The Black CAPM Empirical Evidence
NERA Economic Consulting 7
The two-pass methodology works in the following way. In the first pass, in each month the beta of each stock is estimated using past data. In the second pass, returns in excess of the risk-free rate are regressed, again each month, on these past estimates of beta. The intercept in each month’s cross-sectional regression is an estimate of the excess return to a zero-beta portfolio for the month. The SL CAPM predicts that the average of these zero-beta excess return estimates should not differ significantly from zero while the Black CAPM places no restriction on the mean excess return to a zero-beta portfolio.
We note that:
estimates of the mean excess return to a zero-beta portfolio computed using the methodology of Fama and MacBeth (1973), Litzenberger and Ramaswamy (1979) and Shanken (1992) lie significantly above zero; 17
the standard error attached to an estimate of the mean excess return to a zero-beta portfolio that uses data from 1963 to 2010 is not dramatically greater than the standard error attached to an estimate of the MRP that uses data from 1883 to 2011;
past estimates of the zero-beta excess return predict future estimates of the zero-beta excess return; and
currently available data indicate that the Black CAPM will provide a better estimate, using MSE as a criterion, of the future mean excess return to a zero-beta portfolio than the SL CAPM.
We begin by describing the two-pass methodology.
3.1 Methodology
In the first pass, for each stock j and month t least squares estimates are computed of the parameters of the time-series regression
,S,...,,s,zz sjtsmtjtjtsjt 21 (4)
where
sjtz = the return to stock j in excess of the risk-free rate over month t-s;
jt = the regression intercept;
Litzenberger, R. and K. Ramaswamy, The effects of personal taxes and dividends on capital asset prices: Theory and empirical evidence, Journal of Financial Economics, 1979, pages 163-195.
Shanken, J., On the estimation of beta pricing models, Review of Financial Studies, 1992, pages 1-33. 17 Fama, E. F. and J. D. Macbeth, Risk, return and equilibrium: Empirical tests, Journal of Political Economy, 1973,
pages 607-636.
Litzenberger, R. and K. Ramaswamy, The effects of personal taxes and dividends on capital asset prices: Theory and empirical evidence, Journal of Financial Economics, 1979, pages 163-195.
Shanken, J., On the estimation of beta pricing models, Review of Financial Studies, 1992, pages 1-33.

The Black CAPM Empirical Evidence
NERA Economic Consulting 8
jt = the beta of stock j; and
sjt = the regression disturbance.
Like Litzenberger and Ramaswamy (1979), CEG (2008) and Lajbcygier and Wheatley (2012) choose the number of months S used to compute the estimates to be 60. 18 In the second pass, for each month t estimates are computed of the parameters of the cross-sectional regression
,T,...,,t,N,...,,j,ˆzˆz tjttjtmtjtjt 2121)1( 0 (5)
where
jt = the least squares estimate of jt computed using data from t-S to t-1;
and
t0 = the return to a zero-beta portfolio in excess of the risk-free rate,
or of the cross-sectional regression
,T,...,,t,N,...,,j,ˆz tjtjtttjt 212110 (6)
where
t1 = the MRP.
CEG use (6) to compute estimates of the excess return to a zero-beta portfolio while Lajbcygier and Wheatley use (5).
To test hypotheses about the mean over time of the excess return to a zero-beta portfolio, one can compare the sample mean of the time series of estimates of the excess return to its standard error computed in the usual way, that is, under the assumption that the series of estimates is independently and identically distributed over time. There are, however, two problems with doing so. The first problem is that since the least squares estimate of a stock’s beta measures the beta with error, the second-pass estimator of the excess return to a zero-beta portfolio will be biased. There are two ways of addressing this problem. The first way is to place stocks into portfolios, like Fama and MacBeth (1973), so as to diversify away much of the measurement error but to do so in such a manner as to retain as much of the cross-sectional variation in the second-pass regressors as possible. 19 This is the method that CEG (2008) choose. 20 The second way is to modify the second-pass estimator, as
18 CEG, Estimation of, and correction for, biases inherent in the Sharpe CAPM formula, September 2008.
Lajbcygier, P. and S. M. Wheatley, An evaluation of some alternative models for pricing Australian stocks, Monash University, March 2012.
Litzenberger, R. and K. Ramaswamy, The effects of personal taxes and dividends on capital asset prices: Theory and empirical evidence, Journal of Financial Economics, 1979, pages 163-195.
19 Fama, E. F. and J. D. Macbeth, Risk, return and equilibrium: Empirical tests, Journal of Political Economy, 1973, pages 607-636.
20 CEG, Estimation of, and correction for, biases inherent in the Sharpe CAPM formula, September 2008.

The Black CAPM Empirical Evidence
NERA Economic Consulting 9
Litzenberger and Ramaswamy (1979) and Shanken (1992) do, to take into account the errors-in-variables problem. 21 This is the method that Lajbcygier and Wheatley (2012) choose. 22 We describe the modified estimator that they use in Appendix A of the report.
The second problem with the two-pass procedure is that the Fama-MacBeth method of computing standard errors does not properly take into account the measurement error associated with the beta estimates and so can misstate the precision with which the mean over time of the excess return to a zero-beta portfolio is estimated. Shanken (1992) shows that if, conditional on the factors, returns are homoscedastic, Fama-MacBeth standard errors will overstate the precision with which the mean is estimated. 23 He notes, though, that for models in which the factors are portfolio returns the extent to which the standard errors overstate the precision are likely to be small. So, like Kalay and Michaely (2000), in their empirical work, CEG (2008) and Lajbcygier and Wheatley (2012) use Fama-MacBeth standard errors and do not adjust the standard errors for the measurement error associated with the beta estimates. 24
3.2 Data
CEG (2008) extract monthly returns from January 1964 to December 2007 for individual stocks from the Share Price and Price Relative (SPPR) database originally constructed by the Australian Graduate School of Management. 25 Similarly, Lajbcygier and Wheatley (2012) extract monthly returns from March 1958 to December 2010 for individual stocks and the imputation credits that the stocks deliver from the SPPR database. 26 In some of their tests, CEG exclude stocks that have low market capitalisation. Lajbcygier and Wheatley exclude foreign stocks listed in Australia and, to minimise the impact of market microstructure effects, in each year they exclude stocks that have low market capitalisation. While CEG ignore imputation credits, Lajbcygier and Wheatley adjust returns for the provision of imputation credits under the assumption that the value of a one-dollar credit distributed has a market value of 35 cents. 27
The SPPR database does not contain market capitalisations before December 1973 and so Lajbcygier and Wheatley (2012) augment the database with the market capitalisations of the
21 Litzenberger, R. and K. Ramaswamy, The effects of personal taxes and dividends on capital asset prices: Theory and empirical evidence, Journal of Financial Economics, 1979, pages 163-195.
Shanken, J., On the estimation of beta pricing models, Review of Financial Studies, 1992, pages 1-33. 22 Lajbcygier, P. and S. M. Wheatley, An evaluation of some alternative models for pricing Australian stocks, Monash
University, March 2012. 23 Shanken, J., On the estimation of beta pricing models, Review of Financial Studies, 1992, pages 1-33. 24 CEG, Estimation of, and correction for, biases inherent in the Sharpe CAPM formula, September 2008.
Kalay, A. and R. Michaely, Dividends and taxes: A Re-examination, Financial Management, 2000, pages 55-75.
Lajbcygier, P. and S. M. Wheatley, An evaluation of some alternative models for pricing Australian stocks, Monash University, March 2012.
25 CEG, Estimation of, and correction for, biases inherent in the Sharpe CAPM formula, September 2008. 26 Lajbcygier, P. and S. M. Wheatley, An evaluation of some alternative models for pricing Australian stocks, Monash
University, March 2012. 27 This value is the value laid down by the Australian Competition Tribunal in its recent decision on the market value of a
one-dollar credit distributed. See
Australian Competition Tribunal, Application by Energex Limited (Gamma) (No 5) [2011] ACompT 9, May 2011.

The Black CAPM Empirical Evidence
NERA Economic Consulting 10
largest 100 stocks listed on the Melbourne Stock Exchange at the end of 1962, 1967 and 1972.28 They collect these data from the Stock Exchange official record, the Stock Exchange of Melbourne official record and the Australian Financial Review.
Finally, CEG (2008) and Lajbcygier and Wheatley (2012) use time series of yields on 10-year Commonwealth Government Securities provided by the Reserve Bank. 29
3.3 Estimates
Table 3.1 provides a summary of the results that CEG (2008) and Lajbcygier and Wheatley (2012) provide. 30 The results that CEG and Lajbcygier and Wheatley produce are, not surprisingly, similar. The results indicate that the SL CAPM can be easily rejected at conventional levels of significance because estimates of the mean excess return to a zero-beta portfolio lie significantly above zero. There are differences, though, between the standard errors of the two sets of results. The standard errors attached to the estimates that Lajbcygier and Wheatley produce are smaller. They are smaller for two reasons:
Lajbcygier and Wheatley use more data; and
Lajbcygier and Wheatley use individual security data rather than portfolio data and, as Litzenberger and Ramaswamy (1979) emphasise, the use of individual security data can produce more precise estimates. 31
The standard errors attached to the estimates that Lajbcygier and Wheatley (2012) produce are, indeed, of a similar magnitude as the standard errors attached to the estimates that the AER uses of the MRP. 32 An estimate of the unconditional MRP from 1883 to 2011, computed using the data that Brailsford, Handley and Maheswaran (2012) supply and that we update, adjusted for the value that the market places on imputation credits, is 6.096 with a standard error of 1.461. 33, 34, 35 This evidence suggests that it will be difficult to argue that
28 Lajbcygier, P. and S. M. Wheatley, An evaluation of some alternative models for pricing Australian stocks, Monash University, March 2012.
29 CEG, Estimation of, and correction for, biases inherent in the Sharpe CAPM formula, September 2008.
Lajbcygier, P. and S. M. Wheatley, An evaluation of some alternative models for pricing Australian stocks, Monash University, March 2012.
30 CEG, Estimation of, and correction for, biases inherent in the Sharpe CAPM formula, September 2008.
Lajbcygier, P. and S. M. Wheatley, An evaluation of some alternative models for pricing Australian stocks, Monash University, March 2012.
31 Litzenberger, R. and K. Ramaswamy, The effects of personal taxes and dividends on capital asset prices: Theory and empirical evidence, Journal of Financial Economics, 1979, pages 163-195.
32 Lajbcygier, P. and S. M. Wheatley, An evaluation of some alternative models for pricing Australian stocks, Monash University, March 2012.
33 The unconditional expectation of a random variable is the mean of its marginal probability distribution. The conditional expectation of a random variable, on the other hand, is the mean of the probability distribution of a random variable conditional on some other variable or variables.
34 We adjust returns for the provision of imputation credits under the assumption that the value of a one-dollar credit distributed has a market value of 35 cents This value is the value laid down by the Australian Competition Tribunal in its recent decision on the market value of a one-dollar credit distributed. See
Australian Competition Tribunal, Application by Energex Limited (Gamma) (No 5) [2011] ACompT 9, May 2011.

The Black CAPM Empirical Evidence
NERA Economic Consulting 11
there are problems in estimating the mean excess return to a zero-beta portfolio but not in estimating the unconditional MRP.
Table 3.1 Estimates of the mean excess return to a zero-beta portfolio
Sample Zero-beta
excess return
Standard error
Panel A: CEG (2008)
10 equally weighted portfolios of largest 300 stocks from 1974 to 2007 8.147 2.865
10 equally weighted portfolios of largest 100 stocks from 1974 to 2007 10.309 4.426
Panel B: Lajbcygier and Wheatley (2012)
Largest 100 stocks from 1963 to 1973 & largest 500 stocks from 1974 to 2010 6.985 2.231
Largest 500 stocks from 1974 to 2010 8.146 2.132
Source: Table 4 of CEG (2008) and Table B.1 of Lajbcygier and Wheatley (2012).
Note: Data are from the Reserve Bank and from the Share Price and Price Relative Database originally constructed by the Australian Graduate School of Management.
The low standard errors attached to the estimates of the mean excess return to a zero-beta portfolio that Lajbcygier and Wheatley (2012) produce reflect the low variability in the time series of estimates of the excess return to a zero-beta portfolio. 36 For example, the standard deviation of the times series of estimates computed using the 500 largest stocks and data from 1974 to 2010 is 12.1 per cent on an annual basis whereas the standard deviation of the excess return to the market portfolio from 1883 to 2011 is 16.6 per cent. Thus even though more data are available with which to estimate the MRP than are available with which to estimate the mean excess return to a zero-beta portfolio, there is not a dramatic difference between the precision with which the MRP is estimated and the precision with which the zero-beta excess return is estimated.
Handley (2011) notes that Roll and Ross (1994) emphasise that: 37
35 Brailsford, T., J. Handley and K. Maheswaran, The historical equity risk premium in Australia: Post-GFC and 128 years of data, Accounting and Finance, 2012, pages 237-247.
36 Lajbcygier, P. and S. M. Wheatley, An evaluation of some alternative models for pricing Australian stocks, Monash University, March 2012.
37 As Roll and Ross acknowledge, the veracity of the statement depends on how one tests for a cross-sectional relation between return and beta.
Handley, J., Peer review of draft report by Davis on the cost of equity, January 2011, page 14-15.

The Black CAPM Empirical Evidence
NERA Economic Consulting 12
‘The finding that a market index proxy does not explain cross-sectional returns is consistent with even a very close, but unobserved, true market index being efficient.’
Figure 3.1 Sample mean excess return against sample standard deviation of excess
return
‐10
‐5
0
5
10
15
20
25
30
35
0 5 10 15 20 25 30 35 40 45 50
Annualised
sam
ple m
ean excess return
Annualised sample standard deviation of excess return
Source: Lajbcygier and Wheatley (2012).
Note: Data are from 1974 to 2010 and are from the Reserve Bank and from the Share Price and Price Relative Database originally constructed by the Australian Graduate School of Management. The hyperbola is the sample minimum variance set constructed from 10 portfolios formed on the basis of past estimates of beta. The triangle is the market portfolio.
To investigate whether the market portfolio is close to being efficient, Lajbcygier and Wheatley (2012) plot sample mean excess return against the sample standard deviation of excess return for the market portfolio and for portfolios that are in the sample minimum variance set using data from 1974 to 2010 for 10 value-weighted portfolios formed from the largest 500 stocks on the basis of past estimates of beta. 38 Portfolios that are in the sample minimum variance set are portfolios that have minimum risk in sample – measured by sample
Roll, R. and S.A. Ross, On the cross-sectional relation between expected returns and betas, Journal of Finance, 1994, pages 101-121.
38 Lajbcygier, P. and S. M. Wheatley, An evaluation of some alternative models for pricing Australian stocks, Monash University, March 2012.
The Black CAPM Empirical Evidence
NERA Economic Consulting 13
standard deviation of return – for given sample mean return. We reproduce this plot here as Figure 3.1. The figure shows that the market portfolio is far from being efficient.
3.4 Forecasts
In advice offered to the AER, Handley (2011) suggests that there may be sufficient variation through time in the zero-beta excess return that estimates of the excess return based on past data may be of little use going forward. 39 For example, he states that:
‘Roll (1977 p.134) shows that for any portfolio which lies on the positively sloped segment of the efficient set (of risky assets) there exists a unique zero beta portfolio. This means that the zero-beta asset and the return thereon is sample specific (in relation to the set of assets under consideration, the particular proxy for the market portfolio and the time period under consideration). This therefore diminishes the efficacy of using previous empirical studies to estimate the expected return on the zero-beta portfolio.’
To determine whether estimates of the mean excess return to a zero-beta portfolio based on past data are of use going forward, Lajbcygier and Wheatley (2012) examine recursive estimates.40 The kth recursive estimate uses the first k observations to form an estimate of the mean excess return to a zero-beta portfolio. So as k increases, the size of the sample used to estimate the mean grows. Figure 3.2 below plots recursive estimates of the mean excess return to a zero-beta portfolio computed using the largest 100 stocks from 1963 to 1973 and the largest 500 stocks from 1974 to 2010. Estimates of the mean that are based on relatively few months of data will be imprecise while estimates based on a relatively large number of months are likely to be more precise – at least so long as the mean excess return to a zero-beta portfolio does not vary substantially through time. The figure shows this to be case. Estimates that use less than 20 years of data – those estimates made before 1983 – vary considerably through time while estimates that use at least 20 years of data – those estimates made after 1982 – vary little.
The question that we wish to answer is whether currently available data indicate that the SL CAPM or Black CAPM will provide a better estimate of the future mean excess return to a zero-beta portfolio. To answer this question, it will be useful first to discover whether knowing an average of past mean excess returns to a zero-beta portfolio would historically have been of use in predicting the mean excess return to a zero-beta portfolio. In other words, it will be useful to know whether there is so much variation in the mean excess return to a zero-beta portfolio that even if one were to know what the values of the mean had been in the past, the information would not be of help in predicting the excess return. Clark and West (2007) develop a statistic that can answer this question. 41
39 Handley, J., Peer review of draft report by Davis on the cost of equity, January 2011, page 14-15. 40 Lajbcygier, P. and S. M. Wheatley, An evaluation of some alternative models for pricing Australian stocks, Monash
University, March 2012. 41 Clark, T.E and K.D. West, Approximately normal tests for equal predictive accuracy in nested models, Journal of
Econometrics, 2007, pages 291–311.

The Black CAPM Empirical Evidence
NERA Economic Consulting 14
Figure 3.2 Recursive estimates of the zero-beta excess return
‐20
‐10
0
10
20
30
40
50
60
70
1962 1967 1972 1977 1982 1987 1992 1997 2002 2007 2012
Source: Lajbcygier and Wheatley (2012).
Note: Data are from the Share Price and Price Relative Database originally constructed by the Australian Graduate School of Management.
Clark and West (2007) note that even if a model is true, it may be that a more restrictive model that is untrue may deliver out-of sample forecasts that have a lower MSE than forecasts that use the true but less restrictive model – particularly when the forecasts are based on relatively short time series. 42 The reason for this is that the more general model will have more parameters than the restrictive model and so the forecasts that it generates will be less precise. If the restrictive model is sufficiently far from being correct and one generates forecasts from a sufficiently long time series, then, of course, the bias associated with forecasts generated by the more restrictive model will more than offset the loss of precision. This will be true because:
VarianceBiasMSE 2 (7)
Clark and West develop a way of adjusting downwards the MSE associated with a more general model to reflect the increase in the MSE that will come about from having to estimate more parameters. Lajbcygier and Wheatley (2012) use their method to adjust the MSE associated with forecasts of the zero-beta excess return that use the Black CAPM, which is a
42 Clark, T.E and K.D. West, Approximately normal tests for equal predictive accuracy in nested models, Journal of Econometrics, 2007, pages 291–311.

The Black CAPM Empirical Evidence
NERA Economic Consulting 15
more general model than the SL CAPM. Clark and West also develop a test that can be used with recursive estimates to compare a general model to a more restrictive model. 43 This test can be used to determine whether knowing the parameters of the more general model would have enabled one historically to generate forecasts that were better, using MSE as a criterion, than forecasts generated by the more restrictive model. Clark and West also provide simulations that enable one to determine significance given a value for their test statistic.
Lajbcygier and Wheatley (2012) show that the use of the test, that Clark and West (2007) introduce, to determine whether knowing an average of past mean excess returns to a zero-beta portfolio would historically have been of use in predicting the mean excess return to a zero-beta portfolio, amounts to testing whether the quantity: 44
k
tt
T
kk ˆ
kˆ
T 1010
11
(8)
where
= the minimum number of observations used to compute an estimate of the mean excess return to a zero-beta portfolio; and
tˆ 0 = the least squares estimate of the zero-beta excess return t0 computed
from (5) or (6)
is significantly different from zero. In other words, the test simply amounts to asking whether an average of past estimates of the zero-beta excess return is useful for forecasting future zero-beta excess returns.
Lajbcygier and Wheatley (2012) follow Welch and Goyal (2008) and choose the minimum number of observations used to compute an estimate of the mean excess return to a zero-beta portfolio to be 20 years, that is, 240 months. 45 Table 3.2 below shows that with this choice the Clark-West statistic rejects at the 5 per cent level the hypothesis that knowing an average of past mean excess returns to a zero-beta portfolio would not have been of use in predicting the mean excess return to a zero-beta portfolio.
The analysis so far, however, does not provide an answer to the question of whether currently available data indicate that the SL CAPM or Black CAPM will provide a better estimate of the future mean excess return to a zero-beta portfolio. The Clark and West (2007) tests only indicate whether knowing an average of past mean excess returns to a zero-beta portfolio
43 Lajbcygier, P. and S. M. Wheatley, An evaluation of some alternative models for pricing Australian stocks, Monash University, March 2012.
44 Clark, T.E and K.D. West, Approximately normal tests for equal predictive accuracy in nested models, Journal of Econometrics, 2007, pages 291–311.
Lajbcygier, P. and S. M. Wheatley, An evaluation of some alternative models for pricing Australian stocks, Monash University, March 2012.
45 Lajbcygier, P. and S. M. Wheatley, An evaluation of some alternative models for pricing Australian stocks, Monash University, March 2012.
Welch, I. and A. Goyal, A comprehensive look at the empirical performance of equity premium prediction, Review of Financial Studies, 2008, pages 1455-1508.

The Black CAPM Empirical Evidence
NERA Economic Consulting 16
would have been, in the past, of use in predicting the mean excess return to a zero-beta portfolio. 46 To answer the question of whether currently available data indicate that the SL CAPM or Black CAPM will provide a better estimate of the future mean excess return to a zero-beta portfolio, we use the estimates provided by Table 3.1 that use all of the data that are available to us.
Table 3.2 An evaluation of the Black CAPM and Sharpe-Lintner CAPM
Mean squared error
Black CAPM (unadjusted)
Black CAPM (adjusted)
Sharpe-Lintner CAPM Clark-West statistic
10.230 9.825 10.623 3.040*
Source: Lajbcygier and Wheatley (2012).
Note: Data are from the Reserve Bank and from the Share Price and Price Relative Database originally constructed by the Australian Graduate School of Management. Mean squared errors are based on monthly returns measured in per cent.
*The Clark-West statistic indicates that one can reject the hypothesis at the 5 per cent level that knowing an average of past mean excess returns to a zero-beta portfolio would not have been of use in predicting the mean excess return to a zero-beta portfolio.
Toro-Vizcarrondo and Wallace (1968) examine a framework containing a simple regression with T observations of a dependent variable on K non-stochastic independent variables. 47 Consider the restriction θ = θ0 where θ is one of the regression’s parameters. Toro-Vizcarrondo and Wallace show that, under the null that:
)MSE()MSE( 0 ˆ (9)
where
)MSE( = the MSE associated with the unrestricted least squares estimator for θ; and
)MSE( 0 = the MSE associated with the restricted least squares
estimator for θ,
the F- statistic for a test of the restriction θ = θ0 will be F distributed with one and T-K degrees of freedom and non-centrality parameter one. This analysis implies that under the null that the SL CAPM and Black CAPM will provide equally good estimates of the future mean excess return to a zero-beta portfolio, the F- statistic for a test of the restriction
46 Clark, T.E and K.D. West, Approximately normal tests for equal predictive accuracy in nested models, Journal of Econometrics, 2007, pages 291–311.
47 Toro-Vizcarrando, C. and T. D. Wallace, A test of the mean square error criterion for restrictions in linear regression, Journal of the American Statistical Association, 1968, pages 558-572.

The Black CAPM Empirical Evidence
NERA Economic Consulting 17
0
1
10
T
stT
(10)
will be F distributed with one and T-1 degrees of freedom and non-centrality parameter one. This F-test statistic is simply:
2
10
10
11
T
st
T
st ˆ
Ts/ˆ
T (11)
where
T
stˆ
T 10
1 = the sample mean of estimates of the zero-beta excess return
computed using (5) or (6); and
T
stˆ
Ts
10
1 = the standard error of the sample mean.
Thus the F-test statistic is simply the square of the t-test statistic that is the ratio of the sample mean to its standard error
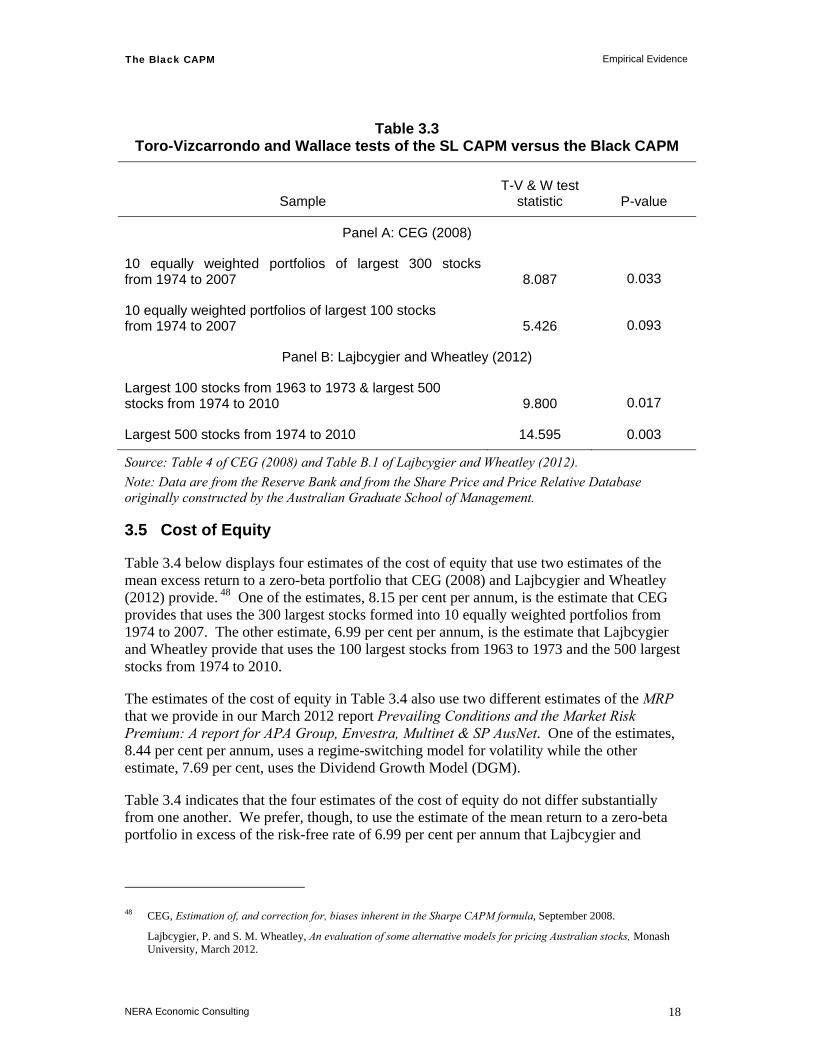
Table 3.3 tests the null hypothesis that the SL CAPM and Black CAPM will provide equally good estimates of the future mean excess return to a zero-beta portfolio using MSE as a criterion. Apart from the case where CEG restrict the sample to include only the largest 100 stocks by market capitalisation, one can easily reject the hypothesis that the SL CAPM will provide a better estimate of the future mean excess return to the zero-beta portfolio at conventional levels of significance.
We hope that these tests go some way towards addressing the concern that Handley (2011) expresses that:
‘It is well understood that all cost of capital estimates are subject to error. So whilst it may be argued that the Black CAPM is more “realistic” than the Sharpe CAPM, the onus is on the proponents to show that this outweighs the benefits associated with using a riskfree rate which is largely observable.’
Finally in this section, we use some of the estimates of the mean excess return to a zero-beta portfolio provided in Table 3.1 to generate estimates of the cost of equity for a regulated energy utility.
The Black CAPM Empirical Evidence
NERA Economic Consulting 18
Table 3.3 Toro-Vizcarrondo and Wallace tests of the SL CAPM versus the Black CAPM
Sample T-V & W test
statistic
P-value
Panel A: CEG (2008)
10 equally weighted portfolios of largest 300 stocks from 1974 to 2007 8.087 0.033
10 equally weighted portfolios of largest 100 stocks from 1974 to 2007 5.426 0.093
Panel B: Lajbcygier and Wheatley (2012)
Largest 100 stocks from 1963 to 1973 & largest 500 stocks from 1974 to 2010 9.800 0.017
Largest 500 stocks from 1974 to 2010 14.595 0.003
Source: Table 4 of CEG (2008) and Table B.1 of Lajbcygier and Wheatley (2012).
Note: Data are from the Reserve Bank and from the Share Price and Price Relative Database originally constructed by the Australian Graduate School of Management.
3.5 Cost of Equity
Table 3.4 below displays four estimates of the cost of equity that use two estimates of the mean excess return to a zero-beta portfolio that CEG (2008) and Lajbcygier and Wheatley (2012) provide. 48 One of the estimates, 8.15 per cent per annum, is the estimate that CEG provides that uses the 300 largest stocks formed into 10 equally weighted portfolios from 1974 to 2007. The other estimate, 6.99 per cent per annum, is the estimate that Lajbcygier and Wheatley provide that uses the 100 largest stocks from 1963 to 1973 and the 500 largest stocks from 1974 to 2010.
The estimates of the cost of equity in Table 3.4 also use two different estimates of the MRP that we provide in our March 2012 report Prevailing Conditions and the Market Risk Premium: A report for APA Group, Envestra, Multinet & SP AusNet. One of the estimates, 8.44 per cent per annum, uses a regime-switching model for volatility while the other estimate, 7.69 per cent, uses the Dividend Growth Model (DGM).
Table 3.4 indicates that the four estimates of the cost of equity do not differ substantially from one another. We prefer, though, to use the estimate of the mean return to a zero-beta portfolio in excess of the risk-free rate of 6.99 per cent per annum that Lajbcygier and
48 CEG, Estimation of, and correction for, biases inherent in the Sharpe CAPM formula, September 2008.
Lajbcygier, P. and S. M. Wheatley, An evaluation of some alternative models for pricing Australian stocks, Monash University, March 2012.

The Black CAPM Empirical Evidence
NERA Economic Consulting 19
Wheatley (2012) provide because it is based on the longest time series. 49 The estimate that we provide in our March 2012 report of an MRP, derived from a regime-switching model, is an average of the forecasts that the model makes over each of the next five years. The value for the MRP that the DGM attempts to estimate is a complicated average of the MRP over all future years. So we judge the estimate of the MRP provided by the regime-switching model of 8.44 per cent per annum to provide the most suitable guide as to the MRP prevailing in the market over the five years of a regulatory period.
With a risk-free rate of 3.99 and a beta of 0.8 that the AER uses in its Aurora Draft Decision, an estimate of the cost of equity that uses a an estimate of the mean return to a zero-beta portfolio in excess of the risk-free rate of 6.99 per cent per annum and an estimate of the MRP of 8.44 per cent per annum is, from Table 1, 12.14 per cent per annum. 50
Table 3.4 Estimates of the cost of equity for a regulated energy utility
Zero-beta source
MRP source
Risk-free rate
Zero-beta excess return MRP Beta
Cost of equity
CEG NERA 3.99 8.15 8.44 0.80 12.37
NERA NERA 3.99 6.99 8.44 0.80 12.14
CEG NERA 3.99 8.15 7.69 0.80 11.77
NERA NERA 3.99 6.99 7.69 0.80 11.54
Note: The beta of 0.8 is an assumed value.
Sources: CEG, Estimation of, and correction for, biases inherent in the Sharpe CAPM formula, September 2008.
Lajbcygier, P. and S. M. Wheatley, An evaluation of some alternative models for pricing Australian stocks, Monash University, March 2012.
49 Lajbcygier, P. and S. M. Wheatley, An evaluation of some alternative models for pricing Australian stocks, Monash University, March 2012.
50 A risk-free rate of 3.99 per cent per annum is obtained by applying the AER’s method of interpolation to the observed yields on 10-year Commonwealth Government Securities (CGS), as measured over the 20-day averaging period to 16 December 2011.

The Black CAPM Commercial and Regulatory Use of the CAPM
NERA Economic Consulting 20
4 Commercial and Regulatory Use of the CAPM
In this section we examine how commercial enterprises and regulatory bodies use the CAPM.
The tendency of the SL CAPM to underestimate the returns to low-beta assets and overestimate the returns to high-beta assets meant that the more general Black CAPM became the most widely accepted pricing model among academics for much of the 1970s and 1980s. It is less clear, on the other hand, that the model has ever gained widespread explicit acceptance among practitioners. We will argue, though, that one cannot rule out:
a widespread implicit acceptance of the model by practitioners.
We will emphasise that practitioners have an enormous amount of flexibility in choosing what values of the parameters of the SL CAPM to use. If practitioners use this flexibility to compute more conservative estimates of the cost of equity, they are in practice using a combination of the Black CAPM and SL CAPM. To illustrate this idea, we will examine a simple numerical example.
4.1 Flexibility in Choice of Parameters
Bruner, Eades, Harris and Higgins (1998) examine the choices made by 27 large corporations, 10 leading financial advisers, and seven best selling textbooks and trade books and conclude that while 85 per cent of the 27 corporations say that they use the SL CAPM to evaluate projects, they have considerable flexibility in choosing the parameters of the model. 51 Companies must decide:
what risk-free rate to use;
how to estimate beta; and
what value for the MRP to use.
Bruner, Eades, Harris and Higgins find that firms use a variety of different measures of the risk-free rate and note that:
‘The difference between realized returns on the 90-day T-bill and the ten-year T-bond has averaged 150 basis points over the long-run; so choice of a risk-free rate can have a material effect on the cost of equity.’
They also find that firms use a variety of sources for estimates of beta and note that even the mean estimate, across all the firms that they survey, varies significantly across providers – even when one limits one’s attention to provider defaults. 52 They note that:
51 Bruner, R.F., K.M. Eades, R.S. Harris and R.C. Higgins, Best practices in estimating the cost of capital: Survey and synthesis, Financial Management, 1998, pages 13-28.
52 As Bruner, Eades, Harris and Higgins note:

The Black CAPM Commercial and Regulatory Use of the CAPM
NERA Economic Consulting 21
‘the mean beta of our sample companies according to Bloomberg is 1.03, while the same number according to Value Line is 1.24.’
They find that the mean range across Bloomberg unadjusted, Bloomberg adjusted, Value Line and S & P betas for an individual company is almost twice as large. They find that the mean range for an individual company is 0.42.
Bruner, Eades, Harris and Higgins (1998) also find a substantial range of different values for the MRP that companies can choose. 53 They note that using Ibbotson Associates’ data from 1926 to 1995, an estimate of the MRP computed as an arithmetic average relative to Treasury bills is 8.5 per cent per annum while an estimate of the MRP computed as a geometric average relative to Treasury bonds is 5.4 per cent per annum.
The impact of the flexibility that companies face in choosing parameters for the SL CAPM is that companies have the flexibility to choose among a wide range of estimates for the cost of equity. Bruner, Eades, Harris and Higgins (1998) show, for example, that the cost of equity for Black and Decker can be estimated to be as low as 12.10 per cent per annum or as high as 20.25 per cent per annum depending on the choice made about what risk-free rate to choose, what beta to use and what value for the MRP to use. 54
Thus Bruner, Eades, Harris and Higgins summarise their findings in the following way: 55
‘The results show close alignment among all these groups on the use of common theoretical frameworks and on many aspects of estimation. We find large variation, however, for the joint choices of the risk-free rate, beta, and the equity market risk premium.’
As Bruner, Eades, Harris and Higgins note: 56
‘even research supporting the CAPM has found that empirical data are better explained by an intercept higher than a risk-free rate and a price of beta risk less than the market risk premium. Ibbotson Associates (1994) offers such a modified CAPM in addition to the standard CAPM and other models, in its cost of capital service.’
Given this empirical evidence and the flexibility that companies have in choosing the parameters of the SL CAPM, one can rule out the idea that companies choose the parameters of the model to produce conservative estimates of the cost of
‘With the Bloomberg service, it is possible to estimate a beta over many differing time periods, market indices, and as smoothed or unadjusted. The figures presented here represent the base-line or default-estimation approach used if other approaches are not specified.’
53 Bruner, R.F., K.M. Eades, R.S. Harris and R.C. Higgins, Best practices in estimating the cost of capital: Survey and synthesis, Financial Management, 1998, pages 13-28.
54 Bruner, R.F., K.M. Eades, R.S. Harris and R.C. Higgins, Best practices in estimating the cost of capital: Survey and synthesis, Financial Management, 1998, pages 13-28.
55 Bruner, R.F., K.M. Eades, R.S. Harris and R.C. Higgins, Best practices in estimating the cost of capital: Survey and synthesis, Financial Management, 1998, pages 13-28.
56 Bruner, R.F., K.M. Eades, R.S. Harris and R.C. Higgins, Best practices in estimating the cost of capital: Survey and synthesis, Financial Management, 1998, pages 13-28.

The Black CAPM Commercial and Regulatory Use of the CAPM
NERA Economic Consulting 22
equity – that is, estimates that are neither too low nor too high. If companies behave in this way – and, again, one cannot rule out such behaviour – then they are acting as if they are using a combination of the Black CAPM and SL CAPM to compute a cost of equity. We will provide a numerical example in what follows that illustrates this idea.
4.2 Numerical Example
We will show that because practitioners often use Blume-adjusted estimates of beta without a clear rationale for doing so that they are in effect using a combination of the SL CAPM and Black CAPM.
A Blume-adjusted estimate of beta is given by:
10),1( jjjjj wwˆw
~ (12)
where
wj = a weight;
j~ = the Blume-adjusted estimate; and
j = the least-squares estimate.
Thus a Blume-adjusted estimate of beta is a weighted average of a least squares estimate and one. Bloomberg chooses the weight wj to be one third.
There are two rationales for using Blume-adjusted estimates of beta:
the true betas of firms tend to regress towards the mean of all betas of one over time as the risks of the activities undertaken by firms change; and
adjusted estimates of betas can be more precise than unadjusted least squares estimates because they take into account prior beliefs about the cross-sectional distribution of betas.
A market-capitalisation weighted average of all betas must be one. So the beta of a randomly selected firm will tend to regress towards one over time if the activities that it undertakes change. If, on the other hand, the activities that the firm undertakes do not change, there will be no reason to suspect that the beta of the firm will change. There is, for example, no evidence that the activities undertaken by the AER control firms have changed or will change in the immediate future in such a way as to suggest that the beta of a portfolio of the firms will regress towards one over time.

The Black CAPM Commercial and Regulatory Use of the CAPM
NERA Economic Consulting 23
The other rationale for using Blume-adjusted betas is to take into account prior beliefs about the cross-sectional distribution of betas. Koller, Goedhart and Wessels (2010) note that if a practitioner has such prior beliefs, the Blume weight should be:57
,w
j
j 22
2
(13)
where
= the cross-sectional standard deviation of betas; and
j = the standard error of the least squares estimate of the beta of asset j.
This formula says that less weight will be attached to the least squares estimate and more weight will be attached to the mean of the prior distribution of one the higher the standard error of the estimate, that is, the less precise the least squares estimate. Importantly, the weight attached to the least squares estimate will not be the same for all estimates.
To illustrate how prior beliefs about the cross-sectional distribution of betas can be taken into account by a practitioner we will consider a simple example that uses the nine AER control firms. Suppose that there is a belief that the cross-sectional distribution of betas has a mean of one and a standard deviation of 0.05. In other words, suppose the prior belief is that the cross-sectional dispersion of betas is very low. Suppose also that a least squares estimate of beta is around 0.6 with a standard error of around 0.05, as Henry finds the average least squares estimate of the beta of one of the nine AER control firms and its standard error to be.58
Then, using equation (13), the weight a practitioner will place on the average least squares estimate will be:
50
050050
05022
2
...
.w
(14)
Thus, using equation (12), the practitioner’s estimate of the beta of the equity of one of the nine AER control firms will be:
0.8)501(6050 ...
~j (16)
This estimate is, coincidentally, the estimate that the AER uses. Thus if the AER were to go through an exercise of combining an empirical estimate of the beta of the equity of one of the nine AER control forms with a strong prior belief about the cross-sectional distribution of betas, they would arrive at the same cost of equity that they choose. We do not believe that
57 Koller, T.; Goedhart, M.; Wessels, D. Valuation: Measuring and Managing the Value of Companies, John Wiley & Sons, 2010, page 253.
58 Henry, O., Econometric advice and beta estimation, Novermber 2008.

The Black CAPM Commercial and Regulatory Use of the CAPM
NERA Economic Consulting 24
the exercise makes much sense, because the exercise requires the regulator to have an unreasonably strong prior belief. With a more reasonable set of prior beliefs, the weight placed on the average least squares estimate would be much closer to one reflecting the precision of the least squares estimates. There is an alternative way, however, by which a regulator could arrive at the same result that does not require that it holds a strong prior belief about the cross-sectional dispersion of betas.
The estimates of the mean excess return to a zero-beta portfolio that we report in Section 3 are sufficiently high that an empirical version of the Black CAPM predicts that the mean returns to all equities are approximately the same. An outcome where the returns required on all equities are the same will also be generated if one uses the SL CAPM and a beta of one for all equities. So another way by which a regulator could arrive at the same result would be for it to place a weight of 0.5 on an estimate of the cost of equity delivered by the SL CAPM and the empirical estimate of the beta of the equity of an energy utility of 0.6 and a weight of 0.5 on an estimate delivered by the Black CAPM.
Thus a regulator will arrive at the same result whether they:
use the SL CAPM, an empirical estimate of beta of 0.6 and strong prior beliefs about the cross-sectional distribution of betas; or
average an estimate of the cost of equity delivered by the SL CAPM and the empirical estimate of the beta of the equity of an energy utility of 0.6 and an estimate delivered by the Black CAPM.
Since the use of daily and weekly data generally allows one to estimate the beta of a portfolio relatively precisely and the activities that many firms undertake do not change substantially through time, we believe that the implicit use by the AER of Blume-adjusted estimates represents an implicit use of the Black CAPM.
The crucial unanswered question, though, is why, given the evidence that we summarise in Section 3, the regulator would choose to place such a high weight on an estimate of the cost of equity generated by the SL CAPM and such a low weight on an estimate of the cost of equity generated by the Black CAPM.

The Black CAPM Interpreting Survey Evidence
NERA Economic Consulting 25
5 Interpreting Survey Evidence
A number of surveys indicate that most but not all firms use the SL CAPM to estimate the cost of equity. What is not clear from these surveys, however, is what the characteristics are of the significant fraction of firms that do not use the SL CAPM to compute a cost of equity. Also unclear is the extent to which firms rely on estimates provided by the SL CAPM because the survey evidence also indicates that an indeterminate but positive proportion of the firms that use the SL CAPM also use other methods such as adding a premium for equity to the cost of debt. 59
The empirical evidence indicates that the SL CAPM tends to underestimate the returns to low-beta assets and overestimate the returns to high-beta assets. For example, Franks and Myers (2008) state that: 60
‘The CAPM does not explain differences in returns averaged over stocks and long periods of time.’
In particular, Myers states, consistent with the evidence that we summarise in Section 3, that:61
‘Empirical evidence shows that average returns for low-beta firms are higher than predicted by the classical CAPM.’
This empirical evidence leads one to expect that firms with low-beta assets and firms with high-beta assets should rationally avoid using the SL CAPM. It is not clear, though, from the survey evidence whether this expectation is borne out. There is simply not enough information provided by published surveys to determine whether the expectation is borne out or whether it is not borne out. Thus, based on the survey evidence, one cannot rule in or rule out the idea that firms with low-beta assets and firms with high-beta assets avoid using the SL CAPM.
5.1 Review
There are a large number of surveys that have been conducted. We review the results of two of the most recent surveys, to which the AER has in the past referred. We will begin by reviewing the Australian survey evidence.
5.1.1 Australian evidence
Truong, Partington and Peat (2008) conducted a survey of 285 companies that elicited 87 responses. 62 Of these 87 respondents, 72 per cent used the CAPM. Although Truong,
59 Truong, G., G. Partington and M. Peat, Cost of capital estimation and capital budgeting practice in Australia, Australian Journal of Management, 2008, pages 95-122.
60 Franks, J, M. Lally, S. Myers, Recommendations to the New Zealand Commerce Commission on an Appropriate Cost of Capital, December 2008.
61 Franks, J, M. Lally, S. Myers, Recommendations to the New Zealand Commerce Commission on an Appropriate Cost of Capital, December 2008.

The Black CAPM Interpreting Survey Evidence
NERA Economic Consulting 26
Partington and Peat are not explicit about the form of CAPM that these respondents use, there is no indication that the respondents make explicit use of the Black CAPM. As we argue in Section 4, however, one cannot rule out the idea that the 72 per cent of respondents who use the CAPM make some implicit use of the Black CAPM. Since many respondents use more than one method to compute the cost of equity, it is not possible to determine from Truong, Partington and Peat’s survey what method firms use that do not use the SL CAPM. Truong, Partington and Peat also provide no information about the characteristics of the 28 per cent of firms that do not use the CAPM.
As we note, Truong, Partington and Peat (2008) also find that many companies use other methods of estimating the cost of equity. 63 They find that 47 per cent of responders use the cost of debt plus some premium for equity to estimate the cost of equity, 34 per cent of responders use the cost of debt to estimate the cost of equity, 15 per cent use earnings to price ratios to estimate the cost of equity and 11 per cent use average historical returns to estimate the cost of equity. Thus it is unclear to what extent firms rely on estimates provided by the SL CAPM to compute a cost of equity.
5.1.2 US evidence
Graham and Harvey (2001) conducted a survey of 4,440 companies that elicited 392 responses. 64 Of these 392 respondents, 73.5 per cent used the CAPM. Although Graham and Harvey are not explicit about the form of the CAPM that these respondents use, there is no indication that the respondents make explicit use of the Black CAPM. Again, as we argue in Section 4, though, one cannot rule out the idea that the 73.5 per cent of respondents who use the CAPM make some implicit use of the Black CAPM. Indeed, Graham and Harvey emphasise that:
‘While the CAPM is popular, we show later that it is not clear that the model is applied properly in practice. Of course, even if it is applied properly, it is not clear that the CAPM is a very good model.’
In contrast to Truong, Partington and Peat (2008), Graham and Harvey examine the characteristics of companies that use and companies that do not use the CAPM. 65 Unfortunately, however, they do not examine whether firms with low-beta assets and firms with high-beta assets avoid using the model. As with Truong, Partington and Peat’s survey, since many respondents use more than one method to compute the cost of equity, it is not possible to determine from Graham and Harvey’s survey what method firms use that do not use the SL CAPM.
62 Truong, G., G. Partington and M. Peat, Cost of capital estimation and capital budgeting practice in Australia, Australian Journal of Management, 2008, pages 95-122.
63 Truong, G., G. Partington and M. Peat, Cost of capital estimation and capital budgeting practice in Australia, Australian Journal of Management, 2008, pages 95-122.
64 Graham, J. And C. Harvey, The theory and practice of corporate finance: Evidence from the field, Journal of Financial Economics, 2001, pages 187-243.
65 Truong, G., G. Partington and M. Peat, Cost of capital estimation and capital budgeting practice in Australia, Australian Journal of Management, 2008, pages 95-122.
The Black CAPM Interpreting Survey Evidence
NERA Economic Consulting 27
Graham and Harvey (2001) also find, like Truong, Partington and Peat (2008), that many companies use other methods of estimating the cost of equity. 66 They find that 39 per cent of responders use average historical returns to estimate the cost of equity, 34 per cent of responders use a multi-beta CAPM and 16 per cent use an earnings or dividend discount model to estimate the cost of equity. Thus, again, it is unclear to what extent firms rely on estimates provided by the SL CAPM to compute a cost of equity.
5.2 Interpretation
Companies that use the SL CAPM that have equity betas that are close to one will compute an estimate of the cost of equity that is similar to the cost of equity that they would compute using the Black CAPM. Companies that use the SL CAPM that have equity betas that are not close to one will compute an estimate of the cost of equity that is dissimilar to the cost of equity that they would compute using the Black CAPM. It is not possible to determine from the survey evidence whether firms that have equity betas that are not close to one use the SL CAPM or avoid using the SL CAPM. Thus it is difficult to view the survey evidence as providing strong support for the use of the SL CAPM in preference to the Black CAPM.
66 Graham, J. And C. Harvey, The theory and practice of corporate finance: Evidence from the field, Journal of Financial Economics, 2001, pages 187-243.
Truong, G., G. Partington and M. Peat, Cost of capital estimation and capital budgeting practice in Australia, Australian Journal of Management, 2008, pages 95-122.
The Black CAPM Davis and Handley Critiques
NERA Economic Consulting 28
6 Davis and Handley Critiques
In this section we address issues raised by the AER’s consultants, Davis and Handley, in reports written for the regulator in 2011. 67 We address first issues raised by Davis.
6.1 Issues Raised by Davis
As we show in Section 3, the evidence indicates that an empirical version of the SL CAPM tends to substantially underestimate the returns to low-beta assets and that an empirical version of the Black CAPM would eliminate this tendency. This is the same conclusion drawn by CEG and Professor Grundy. 68
In contrast, Davis (2011) argues that:69
‘With borrowing and lending opportunities available, the zero beta expected return will lie within the range given by those borrowing and lending rates. While it will be above the risk-free interest rate, it will not lie above the available borrowing rate.’
‘This observation is relevant for assessing the implications of early CAPM studies which found that the relationship between security returns and beta was flatter and with higher intercept than consistent with the Sharpe CAPM. One interpretation of that result is that it is consistent with the Black CAPM – for which the intercept is the zero beta expected return which is higher than the risk-free interest rate. There are, however, other interpretations. One is that the market portfolio used in the tests is not mean-variance efficient. If so, the intercept of the estimated equation will not be an unbiased estimator of the zero-beta expected return. Another interpretation (along the lines suggested by Lewellyn, Nagle and Shanken, 2010) is that the estimated zero-beta expected returns are so different to the risk free interest rate as to not be credible, implying that the Black CAPM is not supported.’
‘One problem in implementing the Black CAPM is that the expected return on the zero beta portfolio is not ex ante observable, unlike the risk free interest rate. It is tempting to infer the zero beta return from the intercept of a cross sectional regression of individual security (or portfolio) returns on betas of those securities (portfolios). However, this is subject to the criticisms made above (ie that the results simply demonstrate use of a market portfolio which is not mean-variance efficient) and thus that the intercept term may be a biased estimate of the zero-beta rate even if the Black CAPM applies.’
There are a number of problems with this analysis.
First, it is important to realise that the SL CAPM is a special case of the Black CAPM. In other words, as we make clear in Section 3, the Black CAPM is a more general model than the SL CAPM. So, one cannot conclude that the evidence does not support the Black CAPM
67 Davis, K., Cost of equity issues: A report for the AER, January 2011.
Handley, J., Peer review of draft report by Davis on the cost of equity, January 2011. 68 CEG, Estimation of, and correction for, biases inherent in the Sharpe CAPM formula, September 2008. 69 Davis, K.., Cost of equity issues: A Report for the AER, January 2011, page 11.

The Black CAPM Davis and Handley Critiques
NERA Economic Consulting 29
but does support the SL CAPM. If the evidence leads one to reject the Black CAPM, that same evidence must lead one to also reject the SL CAPM.
Second, while we agree that in the Black CAPM the zero-beta rate should in theory lie between the lending and borrowing rates, we note that the tests whose results we report in Section 3 are not tests of the SL CAPM or Black CAPM but of empirical versions of the models. As we make clear in Section 2, theory does not imply that the zero-beta rate associated with a proxy for the market portfolio that includes only stocks should lie between the lending and borrowing rates. We are, of course, sympathetic to the idea that a model that states that the mean returns to all stocks are identical is too simple a model. The high estimates of the mean excess return to a zero-beta portfolio reported in Section 3, though, are evidence that an empirical version of the SL CAPM does not work well and that an empirical version of the Black CAPM does a better job of describing the data – even if it is a simple model.
Third, while we agree that there is plenty of evidence to indicate that the market portfolio of stocks is not mean-variance efficient, if the market portfolio of stocks is not efficient, empirical versions of the neither the SL CAPM nor Black CAPM can be true. Thus while an argument that the market portfolio of stocks is not efficient does not support the use of an empirical version of the Black CAPM, it also does not support the continued use of the SL CAPM by the AER.
There are also two technical errors contained in the discussion that Davis provides.
First, a portfolio that is not mean-variance efficient need not have a unique zero-beta rate associated with it. So it makes no sense to talk about ‘the’ zero-beta rate associated with an inefficient proxy for the market portfolio. There may be many zero-beta rates associated with the portfolio.
Second, Fama (1976) shows that in a Fama-MacBeth regression that uses ordinary least squares, the intercept to which Davis refers will by construction be the realised return on ‘a’ zero-beta portfolio regardless of whether the proxy one uses for the market portfolio is efficient.70 So it makes no sense to say that: 71
‘the intercept of the estimated equation will not be an unbiased estimator of the zero-beta expected return.’
6.2 Issues Raised by Handley
In a peer review, commissioned by the AER, of the report written by Davis (2011), Handley (2011) disputes whether a low-beta bias exists. 72 He states that: 73
70 Fama, E., Foundations of Finance, 1976, pages 329-330. 71 Davis, K.., Cost of equity issues: A Report for the AER, January 2011, page 11. 72 Handley, J., Peer review of draft report by Davis on the cost of equity, January 2011. 73 Handley, J., Peer review of draft report by Davis on the cost of equity, January 2011, page 4.

The Black CAPM Davis and Handley Critiques
NERA Economic Consulting 30
‘whilst a number of possible explanations have been proposed for the low-beta bias, it is important to keep in mind that there is at least one very influential explanation by Roll (1977) which seriously questions whether the low-beta bias even exists.’
‘Accordingly, CEG is incorrect to suggest that:
“The existence of bias in the AER implementation of the CAPM can reasonably be regarded as being universally accepted by those who have examined the empirical data. ... This is one of the few areas of consensus amongst finance experts”’
Handley has misinterpreted what Roll (1977) has to say. 74 Roll emphasises that:
the SL CAPM predicts that the market portfolio of all assets should be mean-variance efficient and not that the market portfolio of stocks should be efficient; and so
a test of the mean-variance efficiency of a portfolio of stocks should not be viewed as a test of the SL CAPM.
Roll’s entire discussion of how one should interpret tests of an empirical version of the SL CAPM, however, takes as a given that an empirical version of the SL CAPM that uses the market portfolio of stocks as a proxy for the market portfolio will tend to underestimate the mean returns to low-beta assets and overestimate the returns to high-beta assets. The issue that concerns Roll is whether this evidence can be used to infer whether the SL CAPM itself is true or false. The issue that concerns us, on the other hand, is whether an empirical version of the SL CAPM produces accurate estimates of required returns.
We agree with Roll that a test of the efficiency of the market portfolio of stocks cannot be viewed as a test of the SL CAPM itself. Discovering whether the model is really true, though, is not an issue that concerns us. What concerns us, again, is whether the empirical version of the SL CAPM that the AER uses has a tendency to underestimate the returns required on low-beta assets. The evidence, as we note, is that it does.
74 Roll, Richard, A critique of the asset pricing theory’s tests: Part I, Journal of Financial Economics 4, 1977, pages 129-176.

The Black CAPM Conclusions
NERA Economic Consulting 31
7 Conclusions
This report has been prepared for APA Group, Envestra, Multinet and SP AusNet by NERA Economic Consulting (NERA). APA Group, Envestra, Multinet and SP AusNet have asked NERA to examine a number of issues concerning the Black Capital Asset Pricing Model (CAPM) that arise from the Australian Energy Regulator’s recently published Draft Distribution Determination Aurora Energy Pty Ltd 2012–13 to 2016–17 (“the AER’s Aurora Draft Decision”) and other recent AER decisions.
Rule 87 of the National Gas Rules sets out provisions relating to the rate of return (or WACC) as follows:
‘(1) The rate of return on capital is to be commensurate with prevailing conditions in the market for funds and the risks involved in providing reference services.
(2) In determining a rate of return on capital:
(a) it will be assumed that the service provider:
(i) meets benchmark levels of efficiency; and
(ii) uses a financing structure that meets benchmark standards as to gearing and other financial parameters for a going concern and reflects in other respects best practice; and
(b) a well accepted approach that incorporates the cost of equity and debt, such as the Weighted Average Cost of Capital, is to be used; and a well accepted financial model, such as the Capital Asset Pricing Model, is to be used.’
APA Group, Envestra, Multinet and SP AusNet have asked NERA:
whether an empirical version of the Black CAPM is better able than an empirical version of the Sharpe-Lintner (SL) CAPM to produce an estimate of the cost of equity that meets the requirements of Rule 87 (1) that the rate of return on capital be commensurate with prevailing conditions in the market for funds;
whether the Black CAPM is a well accepted financial model, as required by rule 87(2)(b); and
what is our estimate of the cost of equity that uses an empirical version of the Black CAPM.
To answer these questions, we:
examine whether an empirical version of the SL CAPM or Black CAPM better explains the cross-section of mean returns to Australian stocks;
examine whether past estimates of the zero-beta excess return can predict future estimates of the zero-beta excess return;
examine whether currently available data indicate that an empirical version of the SL CAPM or Black CAPM will provide a better estimate, using mean squared error (MSE) as a criterion, of the future mean excess return to a zero-beta portfolio;

The Black CAPM Conclusions
NERA Economic Consulting 32
examine whether the evidence indicates that companies and institutions that state that they use the CAPM use the SL CAPM, the Black CAPM or both models; and
examine how one should interpret survey evidence on the use by companies and institutions of the SL CAPM.
We also:
address issues surrounding the use of the Black CAPM that Handley and Davis raise in their January 2011 reports for the AER. 75
We show that recent evidence provided by CEG (2008) and Lajbcygier and Wheatley (2012) indicates that: 76
an empirical version of the Black CAPM better explains the cross-section of mean returns to Australian stocks than does an empirical version of the SL CAPM. Estimates of the mean excess return to a zero-beta portfolio are of the same order of magnitude as the market risk premium (MRP) and differ significantly from zero;
there is a strong and significant positive relation between past estimates of the zero-beta excess return and future estimates of the zero-beta excess return – in other words, past estimates of the zero-beta excess return can predict future estimates of the zero-beta excess return; and
currently available data indicate that an empirical version of the Black CAPM will provide a better estimate, using MSE as a criterion, of the future mean excess return to a zero-beta portfolio than an empirical version of the SL CAPM.
We also conclude that:
the evidence indicates that institutions that state that they use the CAPM often use the SL CAPM together with the Black CAPM because they use Blume-adjusted estimates of equity betas when there is little rationale for doing so; 77 and
survey evidence that most but not all companies use the CAPM does not reveal why a significant fraction of companies do not use the CAPM – the evidence does not, for example, show whether firms with low-beta assets or firms with high-beta assets avoid using an empirical version of the SL CAPM because of the known problems the model has in pricing these assets.
Finally, we note that:
75 Davis, K., Cost of equity issues: A report for the AER, January 2011.
Handley, J., Peer review of draft report by Davis on the cost of equity, January 2011. 76 CEG, Estimation of, and correction for, biases inherent in the Sharpe CAPM formula, September 2008.
Lajbcygier, P. and S. M. Wheatley, An evaluation of some alternative models for pricing Australian stocks, Monash University, March 2012.
77 A Blume-adjusted estimate of beta is a weighted average of a least squares estimate and one.

The Black CAPM Conclusions
NERA Economic Consulting 33
the Black CAPM is a more general model than the SL CAPM – so one cannot conclude that the evidence does not support the Black CAPM but does support the SL CAPM;
the Black CAPM does not imply that the zero-beta rate associated with a proxy for the market portfolio that includes only stocks should lie between the lending and borrowing rates; and
what concerns companies and regulators is not whether the SL CAPM is true but whether the empirical version of the SL CAPM that the AER uses has a tendency to underestimate the returns required on low-beta assets – the evidence, as we note, is that it does.
Table 7.1 below displays four estimates of the cost of equity that use an empirical version of the Black CAPM. The estimates use two different estimates of the mean return to a zero-beta portfolio in excess of the risk-free rate. One of the estimates, 8.15 per cent per annum, is an estimate that CEG (2008) provides that uses the 300 largest stocks formed into 10 equally weighted portfolios from 1974 to 2007. 78 The other estimate, 6.99 per cent per annum, is an estimate that Lajbcygier and Wheatley (2012) provide that uses the 100 largest stocks from 1963 to 1973 and the 500 largest stocks from 1974 to 2010. 79
The estimates of the cost of equity in Table 7.1 also use two different estimates of the MRP that we provide in our March 2012 report Prevailing Conditions and the Market Risk Premium: A report for APA Group, Envestra, Multinet & SP AusNet. One of the estimates, 8.44 per cent per annum, uses a regime-switching model for volatility while the other estimate, 7.69 per cent, uses the Dividend Growth Model (DGM).
Table 7.1 indicates that the four estimates of the cost of equity do not differ substantially from one another. We prefer, though, to use the estimate of the mean return to a zero-beta portfolio in excess of the risk-free rate of 6.99 per cent per annum that Lajbcygier and Wheatley (2012) provide because it is based on the longest time series. 80 The estimate that we provide in our March 2012 report of an MRP, derived from a regime-switching model, is an average of the forecasts that the model makes over each of the next five years. The value for the MRP that the DGM attempts to estimate is a complicated average of the MRP over all future years. So we judge the estimate of the MRP provided by the regime-switching model of 8.44 per cent per annum to provide the most suitable guide as to the MRP prevailing in the market over the five years of a regulatory period.
With a risk-free rate of 3.99 and a beta of 0.8 that the AER uses in its Aurora Draft Decision, an estimate of the cost of equity that uses a an estimate of the mean return to a zero-beta
78 CEG, Estimation of, and correction for, biases inherent in the Sharpe CAPM formula, September 2008. 79 Lajbcygier, P. and S. M. Wheatley, An evaluation of some alternative models for pricing Australian stocks, Monash
University, March 2012. 80 Lajbcygier, P. and S. M. Wheatley, An evaluation of some alternative models for pricing Australian stocks, Monash
University, March 2012.

The Black CAPM Conclusions
NERA Economic Consulting 34
portfolio in excess of the risk-free rate of 6.99 per cent per annum and an estimate of the MRP of 8.44 per cent per annum is, from Table 7.1, 12.14 per cent per annum. 81
Table 7.1 Estimates of the cost of equity for a regulated energy utility
Zero-beta source
MRP source
Risk-free rate
Zero-beta excess return MRP Beta
Cost of equity
CEG NERA 3.99 8.15 8.44 0.80 12.37
NERA NERA 3.99 6.99 8.44 0.80 12.14
CEG NERA 3.99 8.15 7.69 0.80 11.77
NERA NERA 3.99 6.99 7.69 0.80 11.54
Note: The beta of 0.8 is an assumed value.
Sources: CEG, Estimation of, and correction for, biases inherent in the Sharpe CAPM formula, September 2008.
Lajbcygier, P. and S. M. Wheatley, An evaluation of some alternative models for pricing Australian stocks, Monash University, March 2012.
To understand how the cost of equity in Table 7.1 is computed, note that the cost of equity produced by the Black CAPM in excess of the risk-free rate is: 82
],)[E()E( 00 mjj zz
where
jz = the return to asset j in excess of the risk-free rate;
mz = the return to the market portfolio in excess of the risk-free rate;
j = asset j’s beta, which measures the contribution of the asset to the risk,
measured by standard deviation of return, of the market portfolio; and
0 = the return to a zero-beta portfolio in excess of the risk-free rate.
Thus if the risk-free rate is 3.99 per cent per annum and 448)E(6.99,0 .zm and
,.j 80 then the cost of equity must be:
81 See equation (3) in Section 2 below and the accompanying discussion. 82 A risk-free rate of 3.99 per cent per annum is obtained by applying the AER’s method of interpolation to the observed
yields on 10-year Commonwealth Government Securities (CGS), as measured over the 20-day averaging period to 16 December 2011.

The Black CAPM Conclusions
NERA Economic Consulting 35
annum.percentper1412]996448[80996993 ......
To summarise, in our opinion:
an empirical version of the Black CAPM is better able than an empirical version of the SL CAPM to produce an estimate of the cost of equity that meets the requirements of Rule 87 (1) that the rate of return on capital be commensurate with prevailing conditions in the market for funds;
the Black CAPM is a well accepted financial model, as required by rule 87(2)(b); and
an estimate of the cost of equity that uses an empirical version of the Black CAPM is 12.14 per cent per annum.

The Black CAPM Appendix A
NERA Economic Consulting 36
Appendix A. Litzenberger-Ramaswamy Methodology
This appendix describes the modified estimator that Lajbcygier and Wheatley (2012) use. 83 The modified estimator that Lajbcygier and Wheatley use is the estimator that Shanken (1992) recommends one employ. This estimator is given by:
))
()1(()1()1(
2
1
2
1
1
220
mtmtmtjt
tN
jjtjtjt
tN
jmtjtjtjtt
zˆzˆ
zˆˆˆˆˆˆˆ
(7)
where 84
tN = the number of stocks at time t;
2mt = an unbiased estimate of the variance of the market return
smtz computed using data from months t-S through t-1;
= ))3)(1(()1( KSS/KS ; and
K = the number of factors – which here is one, the return to the market portfolio.
83 Lajbcygier, P. and S. M. Wheatley, An evaluation of some alternative models for pricing Australian stocks, Monash University, March 2012.
84 See pages 21 and 22 of Shanken (1992).
Shanken, Jay, On the estimation of beta pricing models, Review of Financial Studies, 1992, pages 1-33.

The Black CAPM Appendix B
NERA Economic Consulting 37
Appendix B. Terms of Reference
B.1. Background
Rule 87 of the National Gas Rules sets out provisions relating to the rate of return (or WACC) as follows:
“(1) The rate of return on capital is to be commensurate with prevailing conditions in the market for funds and the risks involved in providing reference services.
(2) In determining a rate of return on capital:
(a) it will be assumed that the service provider:
(i) meets benchmark levels of efficiency; and
(ii) uses a financing structure that meets benchmark standards as to gearing and other financial parameters for a going concern and reflects in other respects best practice; and
(b) a well-accepted approach that incorporates the cost of equity and debt, such as the Weighted Average Cost of Capital, is to be used; and a well-accepted financial model, such as the Capital Asset Pricing Model, is to be used.”
B.2. Questions
The Victorian gas distribution and transmission businesses (APA Group, Envestra, Multinet and SP AusNet) have sought your expert opinion, which will assist the businesses in measuring the cost of equity and the WACC in a way that is consistent with Rule 87, in their forthcoming access arrangement proposals.
Specifically, the four Victorian gas businesses have asked NERA to answer these questions:
1. Whether an empirical version of the Black CAPM is better able than an empirical version of the Sharpe-Lintner (SL) CAPM to produce an estimate of the cost of equity that meets the requirements of Rule 87 (1) that the rate of return on capital be commensurate with prevailing conditions in the market for funds?
2. Whether the Black CAPM is a well-accepted financial model, as required by Rule 87(2)(b)?
3. What is your estimate of the cost of equity that uses an empirical version of the Black CAPM?

The Black CAPM Appendix B
NERA Economic Consulting 38
B.3. Expert Report
The businesses emphasise that the report prepared by you will be provided to the AER in support of the businesses’ revised access arrangements. Accordingly the report may become a public document.
The report may also be relied upon in any subsequent appeal proceedings. For that reason, the businesses have attached a copy of the Federal Court’s “Guidelines for Expert Witnesses in Proceedings in the Federal Court of Australia”.
Please read and familiarise yourself with the Code of Conduct and comply with it at all times in the course of your engagement.
The report must contain the following:
1. The terms of reference;
2. The qualifications of the person(s) preparing the report;
3. Identify any pre-existing relationship the person(s) have with the businesses;
4. Clearly and fully set out all the relevant facts;
5. Explain the person’s (persons’) process of reasoning;
6. Set out each of the expert’s opinions separately from the factual findings or assumptions;
7. Reference any documents relied on by the person(s);
8. Include specified wording at the end of the report stating that “[the person(s)] has made all the inquiries that [the person(s)] believes are desirable and appropriate and that no matters of significance that [the person(s)] regards as relevant have, to [the person’s (persons’)] knowledge, been withheld”; and
9. State that the person(s) have been provided with a copy of the Federal Court’s “Guidelines for Expert Witnesses in Proceeding in the Federal Court of Australia” (Attachment 1) and that the Report has been prepared in accordance with those Guidelines.
B.4. Contact
Jeremy Rothfield will be the day-to-day contact for you.

The Black CAPM Appendix C
NERA Economic Consulting 39
Appendix C. Curriculum Vitae
Overview
Simon is a consultant and was until 2008 a Professor of Finance at the University of Melbourne. Since 2008, Simon has applied his finance expertise in investment management and consulting outside the university sector. Simon’s interests and expertise are in individual portfolio choice theory, testing asset-pricing models and determining the extent to which returns are predictable. Prior to joining the University of Melbourne, Simon taught finance at the Universities of British Columbia, Chicago, New South Wales, Rochester and Washington.
Personal
Nationalities: U.K. and U.S.
Permanent residency: Australia
Employment
Special Consultant, NERA Economic Consulting, 2009-present
External Consultant, NERA Economic Consulting, 2008-2009
Quantitative Analyst, Victorian Funds Management Corporation, 2008-2009
Adjunct, Melbourne Business School, 2008
Professor, Department of Finance, University of Melbourne, 2001-2008
Associate Professor, Department of Finance, University of Melbourne, 1999-2001
Associate Professor, Australian Graduate School of Management, 1994-1999
Visiting Assistant Professor, Graduate School of Business, University of Chicago, 1993-1994
Visiting Assistant Professor, Faculty of Commerce, University of British Columbia, 1986
Assistant Professor, Graduate School of Business, University of Washington, 1984-1993
Visiting Fellow, Australian Graduate School of Management, 1981
Simon M. Wheatley 5 Maple Street Blackburn VIC 3130 Tel: +61 3 9878 7985 E-mail: [email protected]

The Black CAPM Appendix C
NERA Economic Consulting 40
Education
Ph.D., University of Rochester, USA, 1986; Major area: Finance; Minor area: Applied statistics; Thesis topic: Some tests of international equity market integration; Dissertation committee: Charles I. Plosser (chairman), Peter Garber, Clifford W. Smith, Rene M. Stulz
M.A., Economics, Simon Fraser University, Canada, 1979
M.A., Economics, Aberdeen University, Scotland, 1977
Publicly Available Reports
The Market Risk Premium: A report for CitiPower, Jemena, Powercor, SP AusNet and United Energy, 20 February 2012, http://www.aer.gov.au/content/item.phtml?itemId=752660&nodeId=fe0280e7e2113c467dfc4b3b076e1623&fn=Vic%20DNSPs%20(NERA)%20-%2020%20February%202012.pdf Cost of Equity in the ERA DBNGP Draft Decision: A report for DBNGP, 17 May 2011, http://www.erawa.com.au/cproot/9669/2/20110620%20-%20DBNGP%20(WA)%20%20-%20Sub%2055%20-%20Att%207%20-%20NERA%20Economic%20Consulting%20Cost%20of%20equity%20in%20the%20draft%20decision.pdf The Market Risk Premium: A report for Multinet Gas and SP AusNet, 29 April 2011, http://www.aer.gov.au/content/index.phtml/itemId/745782 Cost of Capital for Water Infrastructure Company Report for the Queensland Competition Authority, 28 March 2011, http://www.qca.org.au/files/W-NERA-EconomicConsulting-FinalReport-WACC-0411.pdf The Cost of Equity: A report for Orion, 2 September 2010, http://www.comcom.govt.nz/assets/Pan-Industry/Input-Methodologies/Draft-Reasons-Papers/Draft-Reasons-EDBs/Draft-Determination-X-Sub/Orion-Cross-Submission-Attachment-on-EDBs-and-GPBs-Input-Methodologies-Draft-Determination-and-Reasons-Paper-NERA-Report-2-September-2010.pdf
New Gamma Issues Raised by AER Expert Consultants: A report for JGN, 17 May 2010, http://www.aer.gov.au/content/item.phtml?itemId=736652&nodeId=dea014515519350384275dccc6b56018&fn=JGN%20further%20submission%20on%20gamma%20(18%20May%202010).pdf
The Required Rate of Return on Equity for a Gas Transmission Pipeline: A Report for DBP, 31 March 2010, http://www.erawa.com.au/cproot/8512/2/20100503%20D29252%20DBNGP%20-%20Submission%208%20-%20Annexure%201%20-%20The%20Required%20Rate%20of%20Return%20on%20Equity%20for%20a%20Gas%20Transmission%20Pipeline.pdf

The Black CAPM Appendix C
NERA Economic Consulting 41
Jemena Access Arrangement Proposal for the NSW Gas Networks: AER Draft Decision: A report for Jemena, 19 March 2010, http://www.aer.gov.au/content/item.phtml?itemId=735229&nodeId=4dc041cfe6e30a2c2b91e833cad31191&fn=Appendix%205.1%20-%20NERA%20-%20FAMA%20French%20Report.pdf
Payout Ratio of Regulated Firms: A report for Gilbert + Tobin, 5 January 2010, http://www.aer.gov.au/content/item.phtml?itemId=735236&nodeId=10e87413b13d1da23cd55faf20a6918d&fn=Appendix%206.3D%20-%20NERA%20(4%20Jan%2010,%20ETSA)%20Payout%20ratio%20of%20regulated%20firms.pdf
Review of Da, Guo and Jagannathan Empirical Evidence on the CAPM: A report for Jemena Gas Networks, 21 December 2009, http://www.ipart.nsw.gov.au/files/Submission%20-%20Alternative%20approaches%20to%20the%20determination%20of%20the%20cost%20of%20equity%20-%20Jemena%20-%20Sandra%20Gamble%20-%2022%20December%202009%20-%20APD%20-%20Website.PDF
The Value of Imputation Credits for a Regulated Gas Distribution Business: A report for WA Gas Networks, 18 August 2009, summarized in: http://www.erawa.com.au/cproot/8357/2/20100215%20WAGN%20-%20Proposed%20Revisions%20to%20the%20AA%20for%20the%20WAGN%20Gas%20Distribution%20Systems%20Submission%20-%20Public%20Version.pdf
Cost Of Equity - Fama-French Three-Factor Model Jemena Gas Networks (NSW), 12 August 2009, http://www.aer.gov.au/content/item.phtml?itemId=730699&nodeId=4fcc57398775fe84685434e0b749d76a&fn=Appendix%209.1%20-%20NERA%20-%20Cost%20of%20equity%20-%20Fama-French%20Model.pdf
Estimates of the Cost of Equity: A report for WAGN, 22 April 2009, summarized in: http://www.erawa.com.au/cproot/8357/2/20100215%20WAGN%20-%20Proposed%20Revisions%20to%20the%20AA%20for%20the%20WAGN%20Gas%20Distribution%20Systems%20Submission%20-%20Public%20Version.pdf
AER’s Proposed WACC Statement – Gamma: A report for the Joint Industry Associations, 30 January 2009, http://www.aer.gov.au/content/item.phtml?itemId=726698&nodeId=80cf978278d317e99c34ae1878525573&fn=JIA%20Appendix%20Q%20-%20NERA%20-%20AER's%20proposed%20WACC%20statement-Gamma.pdf
The Value of Imputation Credits: A report for the ENA, Grid Australia and APIA, 11 September 2008, http://www.ena.asn.au/udocs/24092008aersub/Appendix%20K%20-%20The%20value%20of%20imputation%20credits%20-%20NERA.pdf

The Black CAPM Appendix C
NERA Economic Consulting 42
Consulting Experience
NERA, 2008-present
Lumina Foundation, Indianapolis, 2009
Industry Funds Management, 2010
Academic Publications
Do measures of investor sentiment predict returns? (with Robert Neal), 1998, Journal of Financial and Quantitative Analysis 33, 523-547.
Adverse selection and bid-ask spreads: Evidence from closed-end funds (with Robert Neal), 1998, Journal of Financial Markets 1, 121-149.
Shifts in the interest-rate response to money announcements: What can we say about when they occur? (with V. Vance Roley), 1996, Journal of Business and Economic Statistics 14, 135-138.
International investment restrictions and closed-end country fund prices, (with Catherine Bonser-Neal, Greggory Brauer, and Robert Neal), 1990, Journal of Finance 45, 523-547 (reprinted in International Capital Markets Volume III, 2003, G. Andrew Karolyi and Rene M. Stulz, editors, Edward Elgar Publishing, Cheltenham, Glos).
A critique of latent variable tests of asset pricing models, 1989, Journal of Financial Economics 21, 177-212.
Some tests of international equity market integration, 1988, Journal of Financial Economics 21, 177-212 (reprinted in International Capital Markets Volume I, 2003, G. Andrew Karolyi and Rene M. Stulz, editors, Edward Elgar Publishing, Cheltenham, Glos).
Some tests of the consumption-based asset pricing model, 1988, Journal of Monetary Economics 22, 193-215.
Working Papers
Imputation credits and equity returns (with Paul Lajbcygier), 2012.
An evaluation of some alternative models for pricing Australian stocks (with Paul Lajbcygier), 2009.
Intertemporal substitution, small-sample bias, and the behaviour of U.S. household consumption (with Kogulakrishnan Maheswaran and Robert Porter), 2007.
Keeping up with the Joneses, human capital, and the home-equity bias (with En Te Chen), 2003.
Evaluating asset pricing models, 1998.

The Black CAPM Appendix C
NERA Economic Consulting 43
Time-non-separable preferences or artifact of temporal aggregation? (with Robert Porter), 2002.
Testing asset pricing models with infrequently measured factors, 1989.
Refereeing Experience
Referee for Accounting and Finance, the Australian Journal of Management, Economic Letters, Financial Analysts Journal, Financial Management, Journal of Accounting and Economics, Journal of Business, Journal of Empirical Finance, Journal of Finance, Journal of Financial and Quantitative Analysis, Journal of Financial Economics, Journal of Futures Markets, Journal of International Economics, Journal of International Money and Finance, Journal of Money, Credit, and Banking, Journal of Monetary Economics, Management Science, National Science Foundation, Pacific-Basin Finance Journal, and the Review of Financial Studies.
Program Committee for the Western Finance Association in 1989 and 2000.
Teaching Experience
International Finance, Melbourne Business School, 2008
Corporate Finance, International Finance, Investments, University of Melbourne, 1999-2008
Corporate Finance, International Finance, Investments, Australian Graduate School of Management, 1994-1999
Investments, University of Chicago, 1993-1994
Investments, University of British Columbia, 1986
International Finance, Investments, University of Washington, 1984-1993
Investments, Macroeconomics, Statistics, University of Rochester, 1982
Accounting, 1981, Australian Graduate School of Management, 1981
Teaching Awards
MBA Professor of the Quarter, Summer 1991, University of Washington
Computing Skills
User of SAS since 1980. EViews, Excel, EXP, LaTex, Matlab, Powerpoint, Visual Basic. Familiar with the Australian School of Business, Compustat and CRSP databases. Some familiarity with Bloomberg, FactSet and IRESS.

The Black CAPM Appendix C
NERA Economic Consulting 44
Board Membership
Anglican Funds Committee, Melbourne, 2008-2011
Honours
Elected a member of Beta Gamma Sigma, June 1986.
Fellowships
Earhart Foundation Award, 1982-1983
University of Rochester Fellowship, 1979-1984
Simon Fraser University Fellowship, 1979
Inner London Education Authority Award, 1973-1977
Ph. D. Dissertations Supervised
En Te Chen, University of Melbourne (2006), To Invest or not to Invest? Theory and Evidence on Stock Holdings over the Life-Cycle. Current position: Lecturer, Queensland University of Technology, Queensland
Kogulakrishnan Maheswaran, University of Melbourne (2005), Some international evidence on the impact of liquidity constraints on consumption smoothing. Current position: Vice President, Morgan Stanley, New York
Piruna Polsiri, University of Melbourne (2004), The effects of concentrated ownership on firm restructurings: evidence from Thailand. Current position: Director of DBA/MBA Programs, Dhurakij Pundit University, Thailand
Valter Lazarri, University of Washington (1993), Two essays in finance. Current position: Director of MBA Program, Bocconi University, Milan

The Black CAPM Appendix C
NERA Economic Consulting 45
Brendan Quach
Overview
Brendan Quach has eleven years experience as an economist, specialising in network economics, and competition policy in Australia, New Zealand and Asia Pacific. Since joining NERA in 2001, Brendan has advised clients on the application of competition policy in Australia, in such industries as aviation, airports, electricity, rail and natural gas. Brendan specialises in regulatory and financial modelling and the cost of capital for network businesses. Prior to joining NERA, Brendan worked at the Australian Chamber of Commerce and Industry, advising on a number of business issues including tax policy, national wage claims and small business reforms.
Qualifications
1991-1995 AUSTRALIAN NATIONAL UNIVERSITY Bachelor of Economics. (High Second Class Honours)
1991-1997 AUSTRALIAN NATIONAL UNIVERSITY Bachelor of Laws.
Career Details
2001 - NERA ECONOMIC CONSULTING Economist, Sydney
1998-1999 AUSTRALIAN CHAMBER OF COMMERCE AND INDUSTRY Economist, Canberra
1996 AUSTRALIAN BUREAU OF STATISTICS Research Officer, Canberra
Senior Consultant NERA Economic Consulting Darling Park Tower 3 201 Sussex Street Sydney NSW 2000 Tel: +61 2 8864 6502 Fax: +61 2 8864 6549 E-mail: [email protected] Website: www.nera.com

The Black CAPM Appendix C
NERA Economic Consulting 46
Project Experience
Industry Analysis
2011 Energy Networks Association Review of the regulatory frameworks for energy networks
Brendan is currently advising the ENA on the Australian Energy Regulator’s (AER’s) potential Rule change proposal. Advice currently focuses on a range of issues including the propose-respond framework, expenditure incentives, the cost of capital and the potential role of judicial reviews.
2011 MSAR Office for the Development of the Energy Sector Development of a New Tariff Structure
Brendan is currently leading a team reviewing Macau’s current electricity tariffs. This requires NERA to model and analyse long- and short-run marginal costs, sunk costs and generation dispatch. Our work for the Macau Government will be incorporated into the potential development of new tariffs for residential, commercial and casino customers.
2010 Industry Funds Management/Queensland Investment Corporation Due diligence, Port of Brisbane
Brendan was retained to advise on various regulatory and competition matters likely to affect the future financial and business performance of the Port of Brisbane, in the context of its sale by the Queensland government.
2010-2011 Minter Ellison /UNELCO Review of regulatory decision by the Vanuatu regulator
Assisted in the development of an expert report on a range of matters arising from the Vanuatu regulator’s decision to reset electricity prices under four concession contracts held by UNELCO. The matters considered included the methodology employed to calculate the new base price, the appropriateness of the rate of return, the decision by the regulator to reset future prices having regard to past gains/losses.
2010 Gilbert + Tobin/Confidential – Telecommunications Incentive Arrangements for Regulated Telecommunications
Services Brendan provided strategic advice to Gilbert + Tobin on possible regulatory arrangements that allow for the efficient delivery of fixed line telecommunications services in the context of the government mandated roll out the National Broadband Network.

The Black CAPM Appendix C
NERA Economic Consulting 47
2009-10 EnergyAustralia – NSW Electricity Distribution Review of Public Lighting Services
Brendan provided advice to EnergyAustralia during its electricity distribution price review on the provision of public lighting services. Our work provided strategic and regulatory advice to EnergyAustralia during the appeal of the AER’s revenue determination for the 2009-2014 period.
2009 CitiPower/Powercor Efficiency carryover mechanisms
Assisted in the development of an expert report submitted to the AER on the consistency of carrying-forward accrued negative amounts arising from the application of the ESC’s efficiency carryover mechanism with the National Electricity Law and the National Electricity Rules.
2009 Prime Infrastructure Sale of Dalrymple Bay Coal Terminal (DBCT)
Brendan provided regulatory advice to a number of potential bidders for the assets of DBCT. Advice included an assessment of the rate of return parameters, depreciation, regulatory modelling and the regulatory arrangements in Queensland.
2008-09 MSAR Office for the Development of the Energy Sector Review of Electricity Cost and Tariff Structures
Review of current and projected costs of electricity provision in Macau, including modelling and analysis of marginal costs and sunk cost attribution to various consumer classes. Our work for the Macau Government has incorporated the development of potential tariff structures (specifically rising block tariff structures) and scenarios, including modelling revenue recovery and cross subsidies.
2008 Singaporean Ministry for Trade and Industry Electricity Industry Review
NERA was retained by the Singaporean Ministry for Trade and Industry (MTI) to provide a comprehensive review of the Singaporean electricity market. Brendan was involved in the analysis of the costs and benefits arising from the restructuring and reform of the Singaporean electricity industry since the mid 1990’s, the estimated costs and benefits of future security of supply and energy diversification approaches. The project required NERA to undertake quantitative dispatch modelling of the Singaporean electricity market.

The Black CAPM Appendix C
NERA Economic Consulting 48
2008 Ministerial Council Energy Retailer of Last Resort
Assisted in the development of a joint expert report with Allens Arthur Robinson (AAR) that: reviewed the existing jurisdictional retailer of last resort (RoLR) frameworks; advised the MCE on the development of an appropriate national policy framework for RoLR and developed a suggested base set of proposals for a national RoLR scheme.
2005-06 Freehills/South Australian Gas Producers, NSW and South Australia
Gas supply agreement arbitration Assisted in the development of an economic expert report in the arbitration of the price to apply following review of a major gas supply agreement between the South Australian gas producers and a large retailer in NSW and South Australia.
2005-2006 Australian Energy Market Commission (AEMC), Australia Advised the AEMC on its review of the Electricity Rules relating to transmission revenue determination and pricing, which included providing briefing papers to the Commission on specific issues raised by the review.
2005-2006 Minter Ellison/ South West Queensland Gas Producers, Queensland
Gas supply agreement arbitration Advised Minter Ellison and the Producers in an arbitration of the price to apply following review of a major gas supply agreement between the South West Queensland gas producers and a large industrial customer.
2005 International Utility, Queensland Generator sale, due diligence
Part of the due diligence team acting on behalf of a large international utility in the purchase of two coal fired generators in Queensland, Australia. Provided advice on the features of the Australian electricity market and regulatory environment.
2003 Auckland City Council, New Zealand Rationalisation Options Study
Conducting a rationalisation options study to examine alternative business models for Metrowater. Our report assessed different vertical and horizontal integration options for Metrowater.

The Black CAPM Appendix C
NERA Economic Consulting 49
2003 Metrowater, New Zealand Institutional Restructuring
Prepared advice for the board of the Auckland City Water and wastewater service provider, Metrowater on options for institutional and regulatory reform of the entire Auckland regional water sector.
2002 - 2003 Rail Infrastructure Corporation, Australia Research to RIC on their proposed access undertaking.
Provided research and advice into various components of RICs proposed access undertaking with the ACCC including the cost of capital, asset valuation and pricing principles.
2002 Argus Telecommunications, Australia Critique of CIE’s bandwidth pricing principles.
Provided a critique of a CIE report on bandwidth pricing principles for the fibre optic networked run owned by Argus Telecommunications.
2001 Screenrights, Australia Advice on valuing retransmission of local TV
A review and analysis of different methodologies in valuing retransmission of local television on pay TV services.
Regulatory and Financial Analysis
2012 Queensland Competition Authority Review of the retail water regulatory models
Brendan undertook an independent quality assurance assessment of the financial models relied on by the QCA to set the regulated revenues of SunWater. The review considered: SunWater’s Financial model, a model used by SunWater to calculate future electricity prices, an renewals annuity model, as well as the QCA’s regulatory model. These models established a set of recommended prices for each of the 30 irrigation schemes operated by SunWater for the period 2014 to 2019.
2011 Queensland Competition Authority Review of the retail water regulatory models
Undertook an independent quality assurance assessment of the models used to calculate regulated revenues for Queensland Urban Utilities, Allconnex Water, and Unitywater. The review considered: the formulation of the WACC; the intra year timing of cashflows; and the structural, computational and economic integrity of the models.
The Black CAPM Appendix C
NERA Economic Consulting 50
2011 Queensland Competition Authority Review of the wholesale water regulatory models
Undertook an independent quality assurance assessment of the models used to calculate regulated revenues for LinkWater, Seqwater; and WaterSecure. The review considered: the formulation of the WACC; the intra year timing of cashflows; and the structural, computational and economic integrity of the models.
2011 Multinet Gas and SP AusNet - Gas Distribution Report on the market risk premium
Co-authored a report that examined a number of issues arising from the draft decision on Envestra’s access proposal for the SA gas network. The report considered whether: the historical evidence supported the use of a long term average of 6 per cent; there is any evidence to warrant a MRP at it long term average; and the evidence relied on by the AER to justify its return to a MRP of 6 per cent.
2011 Dampier to Bunbury Natural Gas Pipeline - Gas Transmission Cost of Equity
Co-authored two reports that updated the cost of equity for a gas transmission business and responded to issues raised by the regulator in its draft decision. The report re-estimated the cost of equity of a gas distribution business using the Sharpe Lintner CAPM, Black CAPM, Fama-French three-factor model and a zero beta version of the Fama-French three-factor model.
2010-2011 Queensland Competition Authority Weighted Average Cost of Capital (WACC) for SunWater
Retained to provide two expert reports on the WACC for SunWater a Queensland rural infrastructure business. The first report considered issues pertaining to whether a single or multiple rates of return can be applied across SunWater’s network segments. The second report focuses market evidence on the appropriate rate of return for SunWater.
2011 Mallesons Stephens Jaques, on behalf of ActewAGL Distribution Determining the averaging period
Assisted in the development of an expert report that considered the economic and financial matters arising from the Australian Energy Regulator’s decision to reject ActewAGL’s proposed risk free rate averaging period.
2010 Orion Energy, New Zealand Information disclosure regime
Provided advice and assistance in preparing submissions by Orion to the New Zealand Commerce Commission, in relation to the Commission’s proposed weighted average cost of capital for an

The Black CAPM Appendix C
NERA Economic Consulting 51
electricity lines businesses. Issues addressed included the financial model used to calculate the required return on equity, the appropriate term for the risk free rate and the WACC parameter values proposed by the Commission.
2010 Ministerial Council on Energy, Smart Meter Working Group, The costs and benefits of electricity smart metering infrastructure in rural and remote communities This report extends NERA’s earlier analysis of the costs and benefits of a mandatory roll out of smart meters, by consider the implications of a roll out in rural and remote communities in the Northern Territory, Western Australia and Queensland. The project has focused on eight case study communities and has examined the implications of prepayment metering and remoteness on the overall costs and benefits of a roll out.
2010 Grid Australia, Submission to the AER on the proposed amendments to the transmission revenue and asset value models Developed and drafted a submission to the AER on the proposed amendments to the AER's post-tax revenue model (PTRM) and roll forward model (RFM). The proposal focused on a number of suggestions to simplify and increase the usability of the existing models.
2010 Dampier to Bunbury Natural Gas Pipeline (DBNGP) - Gas Transmission
Cost of Equity Co-authored a report that examined four well accepted financial models to estimate the cost of equity for a gas transmission business. The report of estimating the cost of equity of a gas distribution business using the Sharpe Lintner CAPM, Black CAPM, Fama-French three-factor model and a zero beta version of the Fama-French three-factor model.
2009-10 Jemena - Gas Distribution Cost of Equity
Co-authored two reports on the use of the Fama-French three-factor model to estimate the cost of equity for regulated gas distribution business. The report examined whether the Fama-French three-factor model met the dual requirements of the National Gas Code to provide an accurate estimate of the cost of equity and be a well accepted financial model. Using Australian financial data the report also provided a current estimate of the cost of equity for Jemena.

The Black CAPM Appendix C
NERA Economic Consulting 52
2009 WA Gas Networks - Gas Distribution Cost of Equity
Co-authored a report that examined a range of financial models that could be used to estimate the cost of equity for a gas distribution business. The report of estimating the cost of equity of a gas distribution business using the Sharpe Lintner CAPM, Black CAPM, Fama-French three-factor model and Fama-French two-factor model. The report examined both the domestic and international data.
2009 CitiPower and Powercor – Victorian Electricity Distribution Network Reliability Incentive Mechanism (S-factor)
Brendan provided advice to CitiPower and Powercor on the proposed changes to the operation of the reliability incentive mechanism. The advice considered the effects of the proposed changes to the operation of the two distribution network service providers. Specifically, how the ‘S-factors’ would be changed and implications this has to the revenue streams of the two businesses. A comparison was also made with the current ESC arrangements to highlight the changes to the mechanism.
2009 CitiPower and Powercor – Victorian Electricity Distribution Network Reliability Incentive Mechanism (S-factor)
Brendan provided advice to CitiPower and Powercor on the proposed changes to the operation of the reliability incentive mechanism. The advice considered the effects of the new arrangements on the business case for undertaking a series of reliability projects. Specifically, the project estimated the net benefit to the businesses of three reliability programs.
2009 Jemena and ActewAGL - Gas Distribution Cost of Equity
Co-authored a report on alternative financial models for estimating the cost of equity. The report examined the implication of estimating the cost of equity of a gas distribution business using the Sharpe Lintner CAPM, Black CAPM and Fama-French models. The report examined both the domestic and international data.
2008 Joint Industry Associations - APIA, ENA and Grid Australia Weighted Average Cost of Capital
Assisted in the drafting of the Joint Industry Associations submission to the Australian Energy Regulator’s weighted average cost of capital review. The submission examined the current market evidence of the cost of capital for Australian regulated electricity transmission and distribution businesses.

The Black CAPM Appendix C
NERA Economic Consulting 53
2008 Joint Industry Associations - APIA, ENA and Grid Australia Weighted Average Cost of Capital
Expert report for the Joint Industry Associations on the value of imputation credits. The expert report was attached to their submission to the Australian Energy Regulator’s weighted average cost of capital review. The report examined the current evidence of the market value of imputation credits (gamma) created by Australian regulated electricity transmission and distribution businesses.
2007-2008 Smart Meter Working Group, Ministerial Council on Energy – Assessment of the costs and benefits of a national mandated rollout of smart metering and direct load control Part of a project team that considered the costs and benefits of a national mandated rollout of electricity smart meters. Brendan was primarily responsible for the collection of data and the modelling of the overall costs and benefits of smart metering functions and scenarios. The analysis also considering the likely costs and benefits associated with the likely demand responses from consumers and impacts on vulnerable customers.
2007 Electricity Transmission Network Owners Forum (ETNOF), Submission to the AER on the proposed transmission revenue and asset value models Developed and drafted a submission to the AER on the proposed post-tax revenue model (PTRM) and roll forward model (RFM) that would apply to all electricity transmission network service providers (TNSPs). The proposal focused ensuring that the regulatory models gave effect to the AER’s regulatory decisions and insures that TNSPs have a reasonable opportunity to recover their efficient costs.
2007 Victorian Electricity Distribution Business Review of Smart Meter model
Reviewed the smart meter model developed by a Victorian distributor and submitted to the Victorian Essential Service Commission (ESC). The smart meter model supported the business’ regulatory proposal that quantified the revenue required to meet the mandated roll out of smart meters in Victoria. The smart meter model the quantified the expected, meter, installation, communications, IT and project management costs associated with the introduction of smart meters. Further, the estimated the expected change in the business’ meter reading and other ongoing costs attributed with the introduction of smart meter infrastructure.

The Black CAPM Appendix C
NERA Economic Consulting 54
2007 Energy Trade Associations - APIA, ENA and Grid Australia Weighted Average Cost of Capital
Expert reports submitted to the Victorian Essential Services Commission evaluating its draft decision to set the equity beta at 0.7, and its methodology for determining the appropriate real risk free rate of interest, for the purpose of determining the allowed rate of return for gas distribution businesses.
2007 Babcock and Brown Infrastructure, Qld Review of Regulatory Modelling
Provided advice to Babcock and Brown Infrastructure on the regulatory modelling of revenues and asset values of the Dalrymple Bay Coal Terminal (DBCT). DBCT has undertaken a substantial capital investment to increase the capacity of the port. Brendan’s role was to advise DBCT on variety of issues including the calculation of interest during construction, appropriate finance charges, cost of capital and regulatory revenues which were submitted to the Queensland Competition Authority (QCA).
2007- ActewAGL, ACT Transition to National Electricity Regulation
Providing on-going advice to ActewAGL, the ACT electricity distribution network service provider, on its move to the national energy regulation. The advice covers the revenue and asset modelling, the development of a tax asset base, the new incentives for efficient operating and capital expenditure and processes for compliance, monitoring and reporting of its regulatory activities.
2007 - 2008 Smart Meter Working Group, Ministerial Council on Energy – Assessment of the costs and benefits of a national mandated rollout of smart metering and direct load control Brendan was a member of NERA team that investigated the costs and benefits of a national mandated rollout of electricity smart meters. Brendan’s prime responsibility was to undertake the modelling of the costs and benefits of smart metering. NERA’s assignment required an assessment of smart metering functions and scenarios, and also considering the likely demand responses from consumers and impacts on vulnerable customers.
2005- TransGrid, NSW Review of Regulatory Systems
Providing strategic advice to TransGrid, the NSW electricity transmission network service provider, on its current regulatory processes. The advice covers TransGrid’s internal systems and processes for compliance, monitoring and reporting of its regulatory activities.

The Black CAPM Appendix C
NERA Economic Consulting 55
2006 Grid Australia, National Submission to application by Stanwell to change the national
Electricity Rules (Replacement and Reconfiguration investments) Developed and drafted a submission to the AEMC on the appropriateness of the draft Rule change that extended the application of the regulatory test to replacement and reconfiguration investments.
2006 Grid Australia, National Submission to application by MCE to change the national
Electricity Rules (Regulatory Test) Developed and drafted a submission to the AEMC on the appropriateness of the draft Rule change which changed the Regulatory Test as it applies to investments made under the market benefits limb.
2006 Office of the Tasmanian Energy Regulator Implications of the pre-tax or post-tax WACC
Provided a report to OTTER on the potential implications of changing from a pre-tax to a post-tax regulatory framework.
2006 Babcock Brown Infrastructure Regulatory Modelling of Dalrymple Bay Coal Terminal
Developed the economic model used to determine revenues at Dalrymple Bay Coal Terminal. This included updating the model for capital expenditure to upgrade capacity at the terminal, account for intra-year cash flows, and the proper formulation of the weighted average cost of capital and inflation.
2006 Queensland Competition Authority, Queensland Review of Regulatory Revenue Models
Advised the QCA on the financial and economic logic of its revenue building block model that projects the required revenue for the Queensland gas distribution businesses and tariffs for the next 5 years.
2006 Envestra, South Australia Review of RAB Roll Forward Approach
Assisted Envestra in responding to the Essential Services Commission of South Australia’s consultation paper on Envestra’s 2006/07 to 2010/11 gas access proposal. This involved reviewing Envestra’s RAB roll forward modelling and the Allen Consulting Group’s critique thereof.
2006 Transpower, New Zealand Review of Regulatory Systems
Provided assistance to Transpower, the sole electricity company in New Zealand, in responding to the New Zealand Commerce

The Black CAPM Appendix C
NERA Economic Consulting 56
Commission’s announcement of its intention to declare control of Transpower. This involved developing an expert report commenting on the Commission’s methodology for analysing whether Transpower’s has earned excess profits in the context of New Zealand’s “threshold and control” regime.
2006 Pacific National Rail industry structure and efficiency
Assisted with the development of a report which examined options for addressing issues arising in vertically-separated rail industries. This involved examining a number of case study countries including the UK, US and Canada.
2005 Australian Energy Markets Commission, Australia Transmission pricing regime
Advisor to the AEMC’s review of the transmission revenue and pricing rules as required by the new National Electricity Law.
2005 Queensland Rail, Australia Weighted Average Cost of Capital
Provided a report for Queensland Rail on the appropriate weighted average cost of capital for its regulated below rail activities.
2004-2005 ETSA Utilities Review of Regulatory Modelling
Advised ETSA Utilities on the financial and economic logic of ESCOSA’s regulatory models used to determine the regulatory asset base, the weighted average cost of capital, regulatory revenues and distribution prices.
2003- 2005 TransGrid, NSW Review of Regulatory Revenues
Assisted TransGrid in relation to its application to the ACCC for the forthcoming regulatory review which focused on asset valuation and roll forward, cost of capital and financial/regulatory modelling.
2004 Prime Infrastructure, Australia Weighted Average Cost of Capital
Provided a report for Prime Infrastructure on the appropriate weighted average cost of capital for its regulated activities (coal shipping terminal).
2004 PowerGas, Singapore Review of Transmission Tariff Model
Advised the Singaporean gas transmission network owner on the financial and economic logic of its revenue building block model that

The Black CAPM Appendix C
NERA Economic Consulting 57
projects PowerGas’ revenue requirements and tariffs for the next 5 years.
2003 ActewAGL, ACT Review of Regulatory Revenues
Provided strategic advice to ActewAGL in developing cost of capital principles, asset valuation and incentive mechanisms as part of their current pricing reviews for their electricity and water businesses.
2003 Orion Energy, New Zealand Threshold and Control Regime in the Electricity Sector
Provided advice and assistance in preparing submissions by Orion to the Commerce Commission, in relation to the Commission’s proposed changes to the regulatory regime for electricity lines businesses. Issues addressed included asset valuation, and the form of regulatory control.
2003 EnergyAustralia, NSW Pricing Strategy Under a Price Cap
Advised EnergyAustralia on IPART’s financial modelling of both regulated revenues and the weighted average price cap.
2002-03 TransGrid, NSW, Advice in Relation to the Regulatory Test
Modelled the net present value of a range of investment options aimed at addressing a potential reliability issue in the Western Area of New South Wales. This work was undertaken in the context of the application of the ACCC’s “regulatory test” which is intended to ensure only efficient investment projects are included in the regulatory asset base.
2002 Rail Infrastructure Corporation (RIC), Australia Review of the Cost of Capital Model
Provided advice to RIC and assisted in drafting RIC’s submission to the Australian Competition and Consumer Commission (ACCC) on the appropriate cost of capital. This included building a post-tax revenue model of RIC’s revenues in the regulatory period.
2002 PowerGrid, Singapore Review of Transmission Tariff Model
Advised the Singaporean electricity transmission network owner on the financial and economic logic of its revenue building block model that projects PowerGrid’s revenue requirements and tariffs for the next 10 years.

The Black CAPM Appendix C
NERA Economic Consulting 58
2002 EnergyAustralia, Australia Review of IPART’s Distribution Tariff Model
Advised EnergyAustralia, a NSW distribution service provider, on the economic logic of the revenue model that projects EnergyAustralia’s revenue requirements and tariffs for the 2004-2009 regulatory period.
2002 Essential Services Commission of South Australia Review Model to Estimating Energy Costs
Reviewed and critiqued a model for estimating retail electricity costs for retail customers in South Australia for 2002-2003.
2002 National Competition Council (NCC), Australia Exploitation of Market Power by a Gas Pipeline
Provided a report to the NCC in which we developed a number of tests for whether current transmission prices were evidence of the exploitation of market power by a gas transmission pipeline. Also provided a separate report that applied each of the tests developed. This analysis was relied on by the NCC in determining whether to recommend the pipeline in question be subject to regulation under the Australian Gas Code.
2002 Australian Gas and Lighting, Australia Report on South Australian Retail Tariffs
An independent assessment on the cost components of regulated retail tariffs in South Australia that will be used by AGL in the next review.
2002 New Zealand Telecom, New Zealand Report on the application of wholesale benchmarks in NZ
A report on the application of international benchmarks of wholesale discounts to New Zealand Telecom.
2002 ENEL, Italy Survey of Retailer of Last Resort in NSW
Provided research into the retailer of last resort provisions in the NSW gas sector of an international review for the Italian incumbent utility.
2002 ENEL, Italy Survey of Quality of Service provisions in Victoria and South
Australia Provided research into quality of service regulation for electricity distribution businesses in Victoria and South Australia of an international review for the Italian incumbent utility.
The Black CAPM Appendix C
NERA Economic Consulting 59
2002 Integral Energy, Australia Provided Advice on the Cost of Capital for the 2004 – 2008
Distribution Network Review Provided analysis and strategic advice to Integral Energy on the possible methodologies that IPART may use to calculate the cost of capital in the next regulatory period.
2001 IPART, Australia Minimum Standards in Regulation of Gas and Electricity
Distribution Advised the NSW regulator on the appropriate role of minimum standards in regulatory regimes and how this could be practically implemented in NSW.
2001 TransGrid, Australia Advice on ACCC’s Powerlink WACC decision
Provided a report critically appraising the ACCC’s decision regarding Powerlink’s weighted average cost of capital (WACC).
Competition Policy
2005 Confidential, Australia Merger Analysis
Provided expert opinion as well as strategic guidance to the merging firms on the competitive implications of that merger.
2004 Mallesons Stephen Jaques / Sydney Airports Corporation, Australia
Appeal to declare under Part IIIA Provided strategic and economic advice on aspects of Virgin Blue’s appeal for the declaration of airside facilities at Sydney Airport under Part IIIA of the Trade Practices Act. This cumulated in the production of an expert witness statement by Gregory Houston.
2003 Sydney Airports Corporation, Australia Application to declare under Part IIIA
Expert report to the National Competition Council in connection with the application by Virgin Blue to declare airside facilities at Sydney Airport under Part IIIA of the Trade Practices Act, and the potential impact on competition in the market for air travel to and from Sydney.
2002 - 2003 Blake Dawson Waldron/ Qantas Airways, Australia Alleged predatory conduct
NERA was commissioned to provide advice in relation to potential allegations of anticompetitive behaviour. Developed a paper
The Black CAPM Appendix C
NERA Economic Consulting 60
examining the economic theory behind predation and the way courts in various jurisdictions determine whether a firm has breached competition law.
2002 Phillips Fox and AWB Limited Declaration of the Victorian Intra-State Rail Network
Advised law firm Phillips Fox (and AWB Limited) in its preparation for an appeal (in the Australian Competition Tribunal) of the Minister’s decision not to declare the Victorian intra-state rail network, pursuant to Part IIIA of the Trade Practices Act. This included assisting in the preparation of testimony relating to pricing arrangements for third party access to the rail network and their likely impact on competition in related markets, including the bulk freight transportation services market.
2002 Singapore Power International (SPI) Impact of acquisition of a Victorian distributor on competition
Provided analysis to a company interested in acquiring CitiPower (a Victorian electricity distribution/retail business). Including an assessment of the extent to which the acquisition of CitiPower would lead to a ‘substantial lessening of competition’ in a relevant energy markets, given the company’s existing Australian electricity sector assets. The NERA report was submitted to the ACCC as part of the pre-bid acquisition clearance process.
Other
1999-2000 Australian Chamber of Commerce and Industry, Australia Alienation of Personal Service Income
Involved in analysing the effects of the proposed business tax reform package had on a number of industries which advocated a number of recommendations to the Federal Government. The package also included the provisions to change the definition of personal service income.
1998-2000 Australian Chamber of Commerce and Industry, Australia Various economic policy issues
Provided analysis on economic trends and Government policies to business groups. This covered issues such as industrial relations reform, taxation changes, business initiatives, and fiscal and monetary settings. Also compiled ACCI surveys on business conditions and expectations.

The Black CAPM Appendix C
NERA Economic Consulting 61
1996 Australian Bureau of Statistics, Australia Productivity Measures in the Public Health Sector
Involved in a team that reported on the current methods used to measure output in the public health sector and analysed alternative methods used internationally. This was in response to the ABS investigating the inclusion of productivity changes in the public health sector.

NERA Economic Consulting Darling Park Tower 3 201 Sussex Street Sydney NSW 2000 Tel: +61 2 8864 6500 Fax: +61 2 8864 6549 www.nera.com
NERA Australia Pty Ltd, ABN 34 092 959 665

Multinet Group Holdings Pty Ltd ACN 104 036 937
29 March 2012
By email: [email protected]
Dr Simon Wheatley Special Consultant NERA Economic Consulting 33 Exhibition Street MELBOURNE VIC 3000 Australia
Dear Dr Wheatley,
Registered Office:
• 43-45 Centreway Place • PO Box 449 • Mt Waverley Victoria 3149
Australia • Telephone (03) 8846 9900 • Facsimile {03) 8846 9999
Our Reference: MN.PG.10.02
Expert report in relation to the Black Capital Asset Pricing Model (Black CAPM)
Background
Rule 87 of the National Gas Rules sets out provisions relating to the rate of return (or WACC) as follows:
"(1) The rate of return on capital is to be commensurate with prevailing conditions in the market for funds and the risks involved in providing reference services.
(2) In determining a rate of return on capital:
Questions
(a) it will be assumed that the service provider:
(i) meets benchmark levels of efficiency; and
U) uses a financing structure that meets benchmark standards as to gearing and other financial parameters for a going concern and reflects in other respects best practice; and
(b) a well-accepted approach that incorporates the cost of equity and debt, such as the Weighted Average Cost of Capital, is to be used; and a well-accepted financial model, such as the Capital Asset Pricing Model, is to be used."
The Victorian gas distribution and transmission businesses (APA Group, Envestra, Multinet and SP AusNet) have sought your expert opinion, which will assist the businesses in

Multinet Group Holdings Pty Ltd ACN 104 036 937
measuring the cost of equity and the WACC in a way that is consistent with Rule 87, in their forthcoming access arrangement proposals.
Specifically, the four Victorian gas businesses have asked NERA to answer these questions:
1. Whether an empirical version of the Black CAPM is better able than an empirical version of the Sharpe-Lintner (SL) CAPM to produce an estimate of the cost of equity that meets the requirements of Rule 87 ( 1) that the rate of return on capital be commensurate with prevailing conditions in the market for funds?
2. Whether the Black CAPM is a well-accepted financial model, as required by Rule 87(2)(b )?
3. What is your estimate of the cost of equity that uses an empirical version of the Black CAPM?
Expert report
The businesses emphasise that the report prepared by you will be provided to the AER in support of the businesses' revised access arrangements. Accordingly the report may become a public document.
The report may also be relied upon in any subsequent appeal proceedings. For that reason, the businesses have attached a copy of the Federal Court's "Guidelines for Expert Witnesses in Proceedings in the Federal Court of Australia".
Please read and familiarise yourself with the Code of Conduct and comply with it at all times in the course of your engagement.
The report must contain the following:
1. The terms of reference;
2. The qualifications of the person(s) preparing the report;
3. Identify any pre-existing relationship the person(s) have with the businesses;
4. Clearly and fully set out all the relevant facts;
5. Explain the person 's (persons') process of reasoning;
6. Set out each of the expert's opinions separately from the factual findings or assumptions;
7. Reference any documents relied on by the person( s );
8. Include specified wording at the end of the report stating that "[the person(s)] has made all the inquiries that [the person(s)] believes are desirable and appropriate and that no matters of significance that [the person(s)] regards as relevant have, to [the person's (persons')] knowledge, been withheld"; and
9. State that the person(s) have been provided with a copy of the Federal Court's "Guidelines for Expert Witnesses in Proceeding in the Federal Court of Australia" (Attachment 1) and that the Report has been prepared in accordance with those Guidelines.
2
Multi net Group Holdings Pty Ltd ACN 104 036 937
Contact
Jeremy Rothfield will be the day-to-day contact for you.
Yours sincerely,
Jeremy Rothfield Network Regulation and Compliance Manager
3