The bioenergetics of cycling
20
The Bioenergetics of World Class Cycling Asker E Jeukendrup 1, Nell P Craig 2 & John A Hawley 3 1Department of Sport and ExerciseSciences,The Universityof Birmingham, Edgbaston, Birmingham, UK. 2AustralianCycling Federation & Australian Institute of Sport (TrackCycling Unit), Henley Beach, South Australia. 3ExerciseMetabolism Group, Department of Human Biology and Movement Science, RMtT University, Bundoora,Victoria, Australlia. Jeukendrup, A.E., Craig, N.P., & Hawley, J.A. (2000). The Bioenergetics of Worl Class Cycling. Journal of Science and Medicine in Sport 3 (4): 414-433. Professional cycle racing is one of the most demanding of all sports combining extremes of exercise duration, intensity and frequency. Riders are required to perform on a variety of surfaces (track, road, cross-country, mountain), terrains (level, uphill and downhill) and race situations (criterions, sprints, time trials, mass- start road races) in events ranging in duration from 10 s to 3 wk stage races covenng 200 m to 4,000 km. Fm~hermore, professional road cyclists typically have ~100 race d/yr. Because of the diversity of cycle races, there are vastly different physiological demands associated with the various events. Until recently there was little information on the demands of professional cycling dunng traitKng or competition. However, with the advent of reliable, valid bicycle crank dynanometers, it is now possible to quantify real-time power output, cadence and speed during a variety of track and road cycling races. This article provides novel data on the physiological demands of professional and world-class amateur cyclists and characterises some of the physiological attributes necessary for success in cycling at the 61ite level. Introduction Cycling is one of the most efficient forms of human locomotion requiring less energy per unit mass per unit distance than any form of land transportation (Brooks, 1989; Wilson, 1973). However, unlike walking or running, duI~g cycling man is combined with a machine: accordingly, there are numerous permutations by which performance can be modified and improved. The power required to cycle at a given velocity depends on a complex interaction of many physiological (ie. an athlete's maximal oxygen uptake [VO2max], lactate threshold [LT], economy of movement, gross mechanical efficiency), environmental (wind velocity, temper- ature, humidity, altitude) and mechanical (type of bicycle, wheels, tyres and components) variables. A recent article in this journal described the physiological determinants of endurance cycling performance in moderate to weB-trained cyclists (Coyle, 1999). Here, we present novel data on the physiology and bio- energetics of the world class track and road cyclist during competition. Nomenclature and criteria for classification of a World Class cyclist There is no consensus in the scientific literature as to what constitutes an '61ite', 'world-class', 'trained', 'well trained' or an 'untrained' cyclist. Subjects in several published studies have been classified as '61ite cyclists' whereas subjects with similar physiological characteristics have been termed 'moderately-trained' in 414
-
Upload
sudheesh-karuvan -
Category
Documents
-
view
383 -
download
24
Transcript of The bioenergetics of cycling

The Bioenergetics of World Class Cycling
Asker E Jeukendrup 1, Nell P Craig 2 & John A Hawley 3
1Department of Sport and Exercise Sciences, The University of Birmingham, Edgbaston, Birmingham, UK. 2Australian Cycling Federation & Australian Institute of Sport (Track Cycling
Unit), Henley Beach, South Australia. 3Exercise Metabolism Group, Department of Human Biology and Movement Science, RMtT University, Bundoora, Victoria, Australlia.
Jeukendrup, A.E., Craig, N.P., & Hawley, J.A. (2000). The Bioenergetics of Worl Class Cycling. Journal of Science and Medicine in Sport 3 (4): 414-433.
Professional cycle racing is one of the most demanding of all sports combining extremes of exercise duration, intensity and frequency. Riders are required to perform on a variety of surfaces (track, road, cross-country, mountain), terrains (level, uphill and downhill) and race situations (criterions, sprints, time trials, mass- start road races) in events ranging in duration from 10 s to 3 wk stage races covenng 200 m to 4,000 km. Fm~hermore, professional road cyclists typically have ~100 race d/yr. Because of the diversity of cycle races, there are vastly different physiological demands associated with the various events. Until recently there was little information on the demands of professional cycling dunng traitKng or competition. However, with the advent of reliable, valid bicycle crank dynanometers, it is now possible to quantify real-time power output, cadence and speed during a variety of track and road cycling races. This article provides novel data on the physiological demands of professional and world-class amateur cyclists and characterises some of the physiological attributes necessary for success in cycling at the 61ite level.
I n t r o d u c t i o n Cycling is one of the mos t efficient forms of h u m a n locomotion requiring less energy per un i t m a s s per uni t dis tance t h a n any form of land t ranspor ta t ion (Brooks, 1989; Wilson, 1973). However, unlike walking or running, d u I ~ g cycling m a n is combined with a machine: accordingly, there are n u m e r o u s permuta t ions by which per formance can be modified and improved. The power required to cycle at a given velocity depends on a complex interaction of m a n y physiological (ie. an athlete 's maximal oxygen up take [VO2max], lactate threshold [LT], economy of movement , gross mechanica l efficiency), environmental (wind velocity, temper- ature, humidity, altitude) and mechanica l (type of bicycle, wheels, tyres and components) variables. A recent article in this jou rna l described the physiological de te rminants of endurance cycling per formance in moderate to weB-trained cyclists (Coyle, 1999). Here, we present novel da ta on the physiology and bio- energetics of the world class t rack and road cyclist dur ing competition.
N o m e n c l a t u r e a n d c r i t e r i a f o r c l a s s i f i c a t i o n o f a W o r l d Class cyc l is t There is no consensus in the scientific l i terature as to wha t const i tutes an '61ite', 'world-class', ' trained', 'well t rained' or an 'untrained ' cyclist. Subjects in several publ ished s tudies have been classified as '61ite cyclists' whereas subjects with similar physiological characteris t ics have been te rmed 'moderately-trained' in
414
The Bioenergetics of World Class Cycling
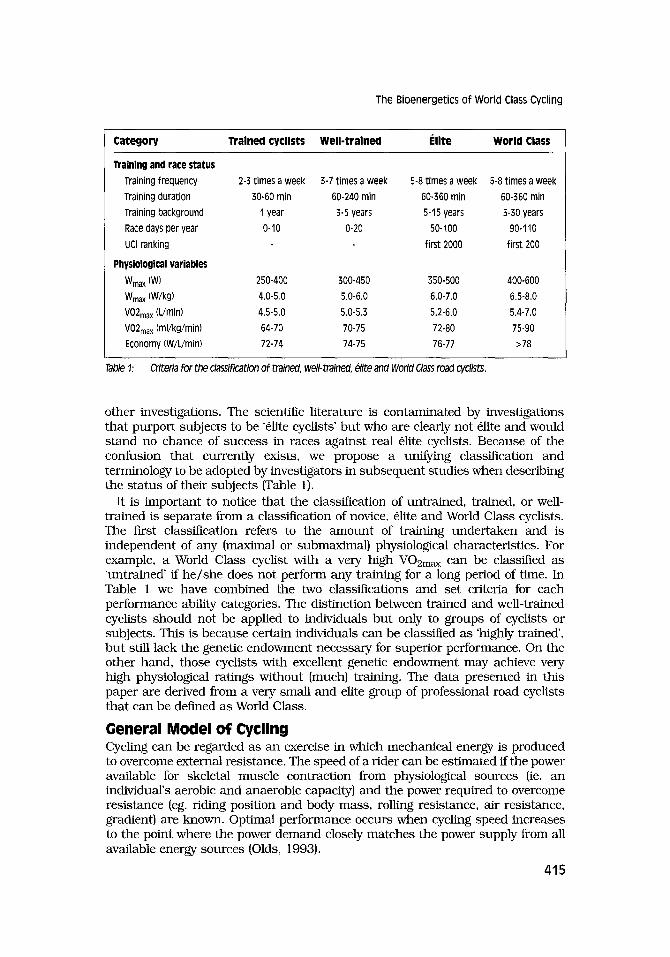
Category Trained cyclists Well-trained Elite World Class
Training and race status
Training frequency 2-3 times a week 3-7 times a week 5-8 times a week 5-8 times a week
Training duration 30-60 min 60.240 rain 60-360 rain 60-360 rain Training background 1 year 3-5 years 5-15 years 5-30 years
Race days per year 0-10 0-20 50-100 90-110
UCl ranking first 2000 first 200
Physiological variables
Wma X {W) 250"400 300-450 350-500 400"600 Wrnax (W/kg) 4.0-5.0 5.0-6.0 6.0-7.0 6.5-8.0
VO2ma x (L/min) 4.5-5.0 5.0-5.3 5.2-6.0 5,4-7.0
VO2ma x (ml/kg/min) 64-70 70-75 72-80 75-90 Economy (W/L/min) 72-74 74-75 76-77 >78
Table 1: Criteria for the classification of trained, well-trained, elite and World Class road cyclists.
other investigations. The scientific literature is contaminated by investigations that purpor t subjects to be '61ite eyelists' bu t who are clearly not 6lite and would s tand no chance of suceess in races against real 6lite cyclists. Because of the confusion that eurrently exists, we propose a unifying classification and terminology to be adopted by investigators in subsequent studies when describing the s ta tus of their subjeets (Table 1).
It is important to notice that the classification of untrained, trained, or well- trained is separate from a classification of novice, ~lite and World Class cyclists. The first classification refers to the amount of training under taken and is independent of any (maximal or submaximal) physiologieal characteristics. For example, a World Class cyclist with a very high VO2max can be classified as 'untrained' ff he / she does not perform any training for a long period of time. In Table 1 we have combined the two classifications and set criteria for each performance ability eategories. The distinetion between trained and well-trained cyclists should not be applied to individuals but only to groups of cyclists or subjeets. This is because eertain individuals can be classified as 'highly trained', bu t still lack the genetic endowment neeessary for superior performance. On the other hand, those cyclists with excellent genetic endowment may achieve very high physiological ratings without (much) training. The data presented in this paper are derived from a very small and elite group of professional road cyclists that ean be defined as World Class.
General Model of Cycling Cycling can be regarded as an exercise in which mechanical energy is produced to overcome external resistance. The speed of a rider can be estimated ff the power available for skeletal muscle contraction from physiological sources (ie. an individual's aerobic and anaerobic capacity) and the power required to overcome resistance (eg. riding position and body mass, rolling resistance, air resistance, gradient) are known. Optimal performance occurs when cycling speed increases to the point where the power demand closely matches the power supply from all available energy sources (Olds, 1993).
415

The Bioenergetics of World Class Cycling
The capacity and power of the aerobic and anaerobic systems for producing adenosine triphosphate (ATP) has been estimated from a number of studies undertaken on humans performing maximal cycling exercise (Bogdanis, et al., 1996; Boobis, et al., 1982; McCartney, et al., 1983) and taking muscle biopsy samples from the vastus lateralis muscle immediately before and after the workbout. When combined with measurements of an individual's VO2max, maximal accumulated oxygen deficit (MAOD), anaerobic or LT and /o r VO 2 kinetics for the aerobic energy system and deficit kinetics for the anaerobic system (Bangsbo, et al., 1990; Craig, et al., 1993; Gastin & Lawson, 1994; Medbo & Tabata, 1989; Medbo, et al., 1988; Withers, et al., 1993), the power and capacity of an energy system can be quantified. By measuring the gross mechanical efficiency (ie. the power output relative to the oxygen uptake [VO2] to produce that power), it is possible to estimate the external power of a biological system from the following equation:
Gross mechanical efficiency (%) = 60 * W / 20934 * VO2
where W is the power output; VO2 is the absolute oxygen uptake (L/rain); and 20934 J is the equivalent of 1 L of oxygen.
Another measure of the functional ability of a cyclist can be obtained by measuring economy of motion: the power output (W) at a submaximal steady- state workload divided by the oxygen uptake (VO2) to ride at that power per unit time (ie. W/L/rain). Finally, the recent advent of a reliable and valid bicycle crank dynanometer (SRM, Schoberer Rad Me~technik, Weldorf, Germany), has made it possible to accurately determine power output during a variety of track and road cycling events (Bassett, et al., 1999; Broker, et al., 1999; Jeukendrup & Van Diemen, 1998; Keen, 1994; Mat in , et al., 1998). These measures will be discussed subsequently.
In a general model of cycling, there are two methods by which a rider may go faster: by decreasing the various sources of resistance, and /o r by increasing the power output. The first concern is how best to combine the cyclist with the bicycle in order to increase power output, which includes improving the cyclist's physiological attributes, modifying the rider's position, cadence and other important physical variables. The second concern is how to reduce the mass and profile of the bike and /o r rider to minimise rolling and air resistance, friction etc. Changes can be made to the bicycle or its components, aerodynamic profile, the rider's clothing and any other equipment. Such modifications are all designed to minimise energy losses.
Many factors can affect the rate of power supply or demand. In terms of power supply, the greatest changes are achieved by improving the athlete's physiological attributes by training (Hawley, et al., 1997; Spangler & Hooker, 1990). Indeed, it has been estimated that a 15% increase in a rider's absolute VO2max (L/min) would provide a 4.5% improvement in 4,000 m performance time in an individual cycling pursuit race (Olds et al., 1993). The weight of a rider plus bicycle is another important factor changing the power demand. Weight slows a rider in three ways: by retarding acceleration, by adding mass (to be carried uphill) and by adding to the rolling resistance. Adding a small amount of weight does not significantly reduce a cyclist's top speed: an extra bicycle mass of 2.7 kg would add only 0.60 s to the time of a 4,000 m individual pursuit rider completing the
416

The Bioenergetics of World Class Cycling
event in a time of 290 s. However, it would adversely affect acceleration speed, (the time taken to reach a given velocity or power output (Martin, et al., 1998).
When cycling on the fiat at speeds <13 k m / h , tyre rolling friction is the dominant retarding force acting against a bicycle and rider. However, 6lite cyclists hardly ever race at such low velocities and rolling resistance is overshadowed by wind resistance at riding speeds >13 k m / h . For example, at speeds >29 km/h , up to 80% of the total power output is used to overcome air resistance (Kyle, 1994; Martin, et al., 1998). In fact, the power necessary to move the rider and bike through the air increases as the cube of the riding velocity: hence, a small increase in speed requires an exponential increase in power output. In addition to the requirements of overcoming air resistance, power is also required to overcome rolling resistance, to impart kinetic energy to the bicycle and rider at the start of an event and to ride up a gradient, the latter of which is related to the mass of the rider and bicycle and the steepness of the slope.
In a recent examination of the evolution of the 'hour record' Bassett et al. (1999) speculated that ~60% of the improvement in the record has come from aerodynamic advances and 40% from the ability of a rider to sustain a higher power output. In te rms of cycling performance, the sport scientist and coach are continually struggling with the question "Where do we spend our time and resources improving the energy supply (ie. training) or decreasing the energy demand (ie. equipment modifications and innovations)?"
The physiological demands of track cycling Track cycling is a generic te rm for all cycling events that take place outdoor and indoor on a banked t rack of a s tandard distance (usually 333 m). Track cycling can be divided into two broad categories: sprint and endurance races. Events range from a 200 m flying sprint lasting ~10 s to the 50 km points score race lasting ~1 h. In addition, there is the prestigious one hour record where competitors lime-trial alone and cover the greatest distance possible. At the Sydney 2000 Olympic Games the world's best t rack cyclists will compete in the following events: Olympic sprint, 1,000 m individual time-trial, individual pursuit, t eam pursuit, Points race, Madison and Keirin.
Unlike road cycling, where the majority of events are performed at submaximal exercise intensities and power outputs (described subsequently), the shorter t rack cycling events require the rider to tax maximally both the aerobic and anaerobic metabolic pathways. These events are often termed the 'mystery zone' by both coaches and sport scientists: the consensus is that in order to be successful, both the aerobic and anaerobic capacities need to be maximally developed through appropriate training. Table 2 provides information on current world track cycling records and the estimated contributions of the energy systems to the different events. The contributions of the energy systems are based on data from several studies (Bangsbo, et al., 1990; Craig, et al., 1993; Craig, et al., 1995; Gastin & Lawson, 1994; Gastin, 1998} which have uUlised the accumulated oxygen deficit method to estimate the aerobic and anaerobic energy contributions dunng exhaustive cycling exercise. It should be noted that the measures on which the data in Table 2 were derived were made on moderately trained subjects. It is likely that the capacity and absolute power of the anaerobic energy systems is far greater in world class cyclists.
Until recently, scientists and coaches have employed mathematical models to
417

The Bioenergetics of World Class Cycling
Event World record Contribution from the power systems (%) (min:s) Alactic Anaerobic Aerobic
glycolytic
200 m Sprint Male 0:09,865 a 40 55 5 Female 0:10.831 40 55 5
Time trial Male (1,000 m) 1:00.148 a 10 40 50 Female (500 m) 0:34.010 20 45 35
Individual pursuit Male (4,000 m) 4:11.114a* 1 14 85 Female (3,000 m) 3:30.816 I 24 75
Team pursuit Male (4,000 m) 3:59.710 1 24 75
1 hr record (kin) Male 56:375 <1 4 >95 Female 48.159 <1 4 >95
a Ridden at altitude. *Ridden in the "Superman' position on the bicycle. This position is now banned by the UCl.
Table 2: Current world record times for selected track cycling events and estimations of the contributions from the energy systems.
estimate the mechanical power requirements of the different track cycling events. While such models have been reasonably accurate (Martin, et al., 1998), the SRM bicycle crank dynamometer has made it possible to accurately quantify instan- taneous power output during track cycling. An additional feature of the SRM dynamometer is that it can also provide useful information to the sport scientist and coach for assessing a rider's technique and bike handling sldlls (Walsh, C.B.V. personal conmmnication). As such, there are now data characterising the demands of 6lite track cyclists during international competition.
4,000 m team pursuit Broker et al. (1999) were the first to report SRM power output profiles on elite track cyclists during simulated competition. These workers collected data on seven members of the United States 4,000 m pursuit team during a 2,000 m ridden at a speed (60 km/h) which would place a team in first position at most international competitions. When cycling at this speed, the riders in first, second, third and fourth position generated average power outputs of 607_+45, 430_+39, 389_+32 and 389_+33 W, respectively. In relative terms, riders in second, third and fourth positions only needed to generate 71, 64 and 640/0 of the power output sustained by the lead cyclist. When the data were averaged over all four riding positions, it ranged from 70-75% (425-455 W) of the power of the lead rider (Broker et al. 1999). These data are in good agreement with that collected on elite Australian team pursuit cyclists during the 1998 World Cup. These data, which are the first to profile power output during 6lite track competition, are displayed in Table 3.
418

The Bioenergetics of World Class Cycling
Cyclist POWER OUTPUT (W) Lead All four % of lead
position positions position
A 541 394 72.8
B 584 447 76.5
C 642 545 84.9
D 599 478 79.8
E 541 442 81.7
Mean (SD 581 +43 461 + _ 5 6 79.2+_4.7
Table 3". Power output data collected on the Australian men's National team during a 4000 m team pursuit race in a 1998 World Cup event.
A - E
0 8
~ - t j
1400
1200
1000
800
000
400
200
0
HR
PO
I , 'l | RPM
0 0.5 1 1,5 2 2.5 3 3.5 4
Time (rain)
250
2OO ~" E
150
t~
100 "~" D...
5o ~
0 4,5
Figure 1: Power output (PO), heart rate (HPJ, cadence (RPM) and speed profile for a cyclist riding a 4000m team pursuit race during a World Cup competition.
The average power output of 607 W reported by Broker et al. (1999) for their lead rider is higher than the 581 W value found for Australian riders under competition conditions (Table 3). Such a discrepancy can probably be explained by the differences in riding speed: the data of Broker et al. (1999) were 'normalised' for a riding speed of 60 km/h , whereas the actual speed during the World Cup competition was 56-58 km/h . In addition, riding skill and technique, riding position, body mass and frontal surface area, equipment design and environmental and track conditions would all be expected to affect riding speed and the power output necessary to sustain that speed. Although the average power output data provide useful information as to the minimum requirements of a 4,000 m team pursuit, the individual rider profile highlights the stochastic demands of this event. Figure 1 presents the power profile, cadence, speed and HR response of a rider during a 4,000 m team pursuit in World Cup competition.
419

The Bioenergetics of World Class Cycling
Instantaneous power output was -1,250 W at the start and only dropped to <1,000 W after the first 8-10 s of the race. Thereafter, depending on the rider's position in the team, power output fluctuates between 600-650 W in the lead position and 350-400 W when riding behind other team members. This clearly illustrates the stochastic power demands of team pursuit racing and highlights the need for rapid response times to accelerate and decelerate into team formation, depending on the rider's position within the race.
4,000 m individual pursuit In contrast with the oscillating power requirements of the 4,000 m team pursuit (Figure 1), the power profile for rider's competing in individual 4,000 m pursuit races is generally much more even. Figure 2 displays the power output profiles for an elite male riding a 4,000 m and an 61ite female riding a 3,000 m race during a World Cup event.
Compared with the profile for the 4,000 m team pursuit (Figure 1) there is a much narrower range of power outputs required to ride competitively at this level. Perhaps surprisingly, power outputs during the first 5-10 s of both races are remarkably similar (-1,000 W for male and female riders). However, despite the shorter race distance, the power output for the female rider is considerably lower for the remainder of the race (363-381 W) compared to the male rider (475-500 W). Interestingly, the female rider demonstrates superior fatigue resistance (ie. has less of a decline in relative power output) over the race duration than the male rider, whose power drop-off is marked, especially during the last 45-60 s of the event. In a mathematical model of the power requirements of the 4,000 m individual pursuit, Broker et al. (1999) estimated that a rider with a body mass of -79 kg who was 1.82 m tall would need an average power output of 479 W for a race time of 4 min 31 s. This estimate agrees well with average power output data we have collected for Australian riders competing in international events and riding comparable times (Craig, N.P., unpublished observations).
D.
n
1200
1000
800
600
400
200
0
Female Individual 3,000 m Pursuit
0 0.5 1 1.5 2 2.5 3 3.5 4 4,5
T ime (min)
Figure 2:
420
Power output profile for a male cyclist riding a 4,000m individual pursuit and a female cyclist riding a 3,000m individual pursuit race during World Cup competition.
The Bioenergetics of World Class Cycling
The phySiOlogical demands of road cycling Road cycling is a generic te rm for cycling events that take place outdoor on the road. This branch of cycling is unique in that it requires competitors to perform on a variety of terrains (ie. level, uphill and downhill) and race situations (ie. individual time-trial, t eam time-trial, drafting in pack formation in the peloton). These events vary in duration from time trials lasting 5 min, to stage races like the Tour de France, which last 3 wk. However, it is important to point out that most World Class cyclists will participate in a combination of events with the primary emphasis on their best discipline. Some riders may also forsake their own individual ambitions during specific races and ride for a designated team leader who has more chance of achieving overall individual success in the long stage races. Accordingly, professional road cyclists spend many hours training and racing, covering between 30,000 and 35,000 k m / y r (Jeukendrup A.E., Unpub- lished observations). This riding volume clearly differentiates the professional cyclist from less genetically endowed, albeit 'well-trained' cyclists previously described in the literature (Coyle, et al., 1991; Hawley, et al., 1997; Lindsay, et al., 1996; Stepto, et al., 1999; Stepto, et al., 2000) who ride, on average, less than half this distance (250 versus 625 km/wk).
Another factor which differentiates the professional cyclists from other cyclists is the number of races they enter: the number of race days in a group of 22 professional cyclists from a European team was 101+6 d/yr, with a range of 88- 112 d /y r (Jeukendrup A.E., Unpublished observations). Because of the wide diversity of road cycling events and because the physiological demands of these events are totally different, they will each be discussed separately.
Time-trials In time-trials individual riders try to cover a fixed distance as fast as possible. The winner is the rider with the shortest time. Time-trials may vary in distance from 3 k m up to 6 km and are often ridden as the first 'stage' of longer stage races (ie. prologue). However, time-trials may be as long as 100 km. In these events, individual maximal sus ta inable power and aerodynamics will ul t imately determine performance time. Although there has been considerable information collected from simulated time-trials in the laboratory during the past few years (Jeukendrup et al. 1996; Lindsay et al. 1996; Palmer et al. 1996) there is little information currently available on time-trials in actual competition, especially in ~lite cyclists. One of the reasons may be the difficulty with measur ing the exercise intensity in a field situation. However, with accurate portable telemetric HR monitors and instantaneous power measuring devices it is now possible to quantify the exercise intensity in training and competition (Jeukendrup & Van Diemen, 1998). The power outputs measured during training/competit ion are related back to the maximal power output (Wma x) determined during a maximal test in the laboratory. Wma x is determined during an incremental cycling test comprising 3-5 min stages with 25-50 W workload increments.
Wma x = Wfinal + (t/T'W)
Where Wfinal is the last completed stage, W is workload increment (W), t is the time spent in the final (uncompleted) stage, and T is the time (s) of the stage duration.
421

The Bioenergetics of World Class Cycling
Recently, Padilla et al. (2000) determined the exercise intensity during time trials in a group of professional cyclists by monitoring HR. Heart rate was recorded in a number of time-trials, including prologues (<10 km), short time- trials (<40 km), long time-trials (>40 km) and uphill time-trials. These workers reported significant difference in HR's between the various time trials, which was largely a fimction of the different duration of the events. The highest HRs were recorded durtng the short prologues (~88-90% of HRmax). The short time-trials of 27.0-36.5 k m were raced at 82-88% of HRma x and the longer (49 km) time trials were raced at a slightly lower intensity of between 79 and 84% of HRmax. Speeds in these events on relatively level roads averaged 4 6 . 3 k m / h , 4 3 . 1 k m / h and 4 4 . 7 k m / h respectively. As would be expected, speed in the uphill time-trial was significantly lower (40 km/h) . Similarly, Lucia et al. (1999) reported that during a 60 k m time-trial in the Tour de France, cyclists spent 95% of race time (70 min) at HR between 88% and 100% of HRmax. In that time trial, it was estimated that the winner maintained an intensity of >90% of VO2max for 70 min, averaging 50 k m / h . It should be noted, however, that time-trials within stage races may not
1400
1200
1000
100
- ~ " ! ' ,,,i ,'~,~',,, . . . . . . . . . . . . . . /", ~ z~/'~ ', \ , ,; ', . ~, . I " , , g v ' , f 40
¢ -20
F ~' t -80
800
600
400
200
0 0;45 1 ;00 1:15 1:30 1:45
T i m e {h:min}
4O0
200 ~ ~ ~,
600
8O
60
40 A .E
2 0 ~
-20 el
-40
-60
-80
0:30 1:00 1:30
T i m e (h:min)
4OO
2OO
0 0:00
Figure 3:
422
Power output ( - - ) and speed (-----) for a male professional cyclist riding a 30kin (1A) and a 381o11 (1B) uphill time trial.

The Bioenergetics of World Class Cycling
always be raced at maximal level. The role of an individual rider within a team often determines the intensity at which a time trial is raced. This is illustrated by the findings of Padilla et al (2000). Riders who were aiming at a high overall ranking rode the 27-70 km time trials at an intensity of 81-88% of Wmax, whereas riders with a strategic role, rode at a slightly lower intensity of 75%-81% of Wma x. Riding "slow" is not an option for any rider because if riders do not finish each days stage within a certain time span from the winner (usually 10%) they are eliminated from the overall race.
Using a power-measuring device, we have collected data dining time trials in major international races. The HR's measured during these time-trials is in good agreement with data from previous studies (Lucia, et al., 1999, Padilla, et al., 2000). Because power output data are highly individual and dependent on a cyclist's mass and anthropometric profile, equipment and, position on the bicycle, this data will be presented as a case study. The data of an uphill time-trial of a professional cyclist are displayed in Figure 3.
The average power output during this 30 km time trial was 381+61 W for an average speed of 30_ + 11 km/h . Whereas most time-trials on a fiat course will be characterised by a relatively constant power profile, this uphill time trial displays a highly intermittent profile with power outputs varying from 260 to 460 W, HR ranging from 135 to 165 bea t s /min and speeds as low as 17 k m / h up to 62 k m / h . A further example of an uphill time-trial is displayed in Figure 3b. This 38 km time-trial was predominantly uphill, bu t included a downhill section. Average power output was 320_+148 W and average speed 33.1 km/h : this illustrates the dissociation between speed and power output (Figure 3b). As has been noted previously, (Jeukendrup & Van Diemen, 1998), speed is often a poor indicator of the exercise intensity during cycling, especially when riding on hilly terrain. In the mountains, speed and exercise intensity seem almost inversely related: the highest speed is recorded at the lowest power output in a downhill section of the race (Figure 3b).
The power output recorded with power measuring devices corresponds to the power outputs calculated from heart rate via a pre-determined relationship between power output and HR in a laboratory (Grazzi, et al., 1999; Padilla, et al., 2000). Padilla et al. (2000) estimated that the power output during uphill time trials was 331-376 W, representing 75-83% of Wma x. There are also case reports of world hour record holders, indicating the extreme physiological demands of time trials (Hawley & Burke, 1998; Padflla & Mujika, 2000). For example, it has been estimated that the current world record holder, Britain's Christopher Boardman, had to produce an average power output of 442 W for 60 min in order to ride at an average speed of 56.375 k m / h . This equates to an average oxygen uptake of 5.6 L/rain or 81 ml /kg /min . Although such a sustainable power output is extreme, a cyclist with a much larger drag coefficient set a previous world 1 h record of 53.040 k m by producing an estimated average power output of 510 W (Padilla and Mujika, 2000). It can be estimated that the VO2 during this ride mus t have been around 6.25 L/min or close to 80 ml /kg /min . This rider had a Wmax of 572 W and was able to sustain close to 90% ofWma x for the duration!
In conclusion, professional cyclists produce exceptional power outputs (>320- 450 W) during time-trials ranging in distance from 5-70 km. The absolute power output will depend on the duration of the time-trial, the course profile and on the role of a cyclist within the team.
423

The Bioenergetics of World Class Cycling
200 '] ~ HR OBLA: 176
160I HR LT: 162
& 120
~ 8o
40 ~
00:00:00' 00:20:00 ' O0:4O:OO 1 0; :00:00 ~ O1:20:00 200
. . . . . . . . . . . . . . . . . . . . . . . . . . . . . . . . . . . . . . . . . . . . HR OBLA: 173
~,~ HR LT: 146
120
8O "T"
4O
0 0 : 0 0 : 0 0 ' 00 :20 :00 ' 0~0:40:00 ' 01 :00 :00 ' T i m e / h h : m m : s s
Figure 4: Heart rates determined during individual time trial and team time trial races (Figure adapted from Padilla et al., 2000).
Team time-trials Team time-trials are usually par t of longer stage races. Teams of 4-9 riders try to cover a fixed distance (usually 100 km) as fast as possible, similar to the individual time-trial. The physiological demands of t eam time-trialing differ sub- stantially from individual time-trials, being more intermittent in nature due to the alternating demands of riding in first position and drafting behind the other riders. In addition to conventional time-trials, there are also a few one-day races in which two riders (two-ups) ride a time-trial (for example Grand Prix des Nations and Grand Prix Eddy Merckx). Unfortunately there is very limited information on the physiological demands during team time trials. A recent s tudy (Padflla et al., 2000) compared the physiological differences between individual time trials and team time trials. As can be seen (Figure 4), the team time-trial is much more intermittent compared to the individual race.
Early studies have reported that drafting behind another r ider/riders reduces the oxygen cost of cycling by 25-40% (Kyle, 1979; McCole, et al., 1990). The largest effect of drafting is seen at high speeds when a cyclist is surrounded by other riders. Drafting is therefore a very important sldll in professional road racing. An excellent example of this drafting skill during a road race is displayed in Figure 5.
This world class cyclist participated in the Tour de France and while the average speed in this 6 h level stage was 40 k m / h , this cyclists with excellent drafting skills managed to reduce his average power output to jus t 98 W. It can be
424

The Bioenergetics of World Class Cycling
'im
8O
(3
O:O0:CO 1:0(t00 ~00:00 30(1(]0 4:00:00 5:0~C0 6:00:.On
l ime (h:rnin)
Figure 5: Power output ( - - ) and speed ( ) during a 220kin road race. The low power ouput relative to the high average speed indicates this rider was a sldlled drafter.
calculated that in optimal conditions with no wind and level roads, and with a good aerodynamic position, riding at that speed would require ~275 W (Martin, et al., 1998). Drafting in a team time trial, however, does not result in the same drafting effect that a rider might obtain in the peloton. Drafting allows for some recovery, however, as can be seen in the HR trace in Figure 4.
In conclusion, compared to individual road race time-trials, team trials are characterised by a more intermittent nature due to the longer periods of drafting and recovery. Average HR and power outputs, however, are comparable to individual time trials of similar duration.
Road races Road races typically last 60 km (criteriums) up to about 300 km and are characterised by a mass (bunch} start. Some road races are as long as 600 km (Paris-Brest-Paris) but most professional classics such as the Tour of Flanders, Paris-Roubaix and the Amstel Gold race are generally 250-300 km. All riders begin together as part of the peloton and the first rider who crosses the finish line is the ~nne r , independent of finish time. Although this is an individual race with only one rider the winner, individuals are usually members of a team and team tactics can determine a large part of the developments and the physiological intensity of a race. The principal concerns affecting road race performance are team tactics and drafting. Because riders remain grouped in the peloton, only the few who are in the front at any one time face the full effects of wind resistance, while others can maintain the peloton's pace by drafting. Usually, breakaway riders can outdistance the petoton only when the complex dynamics of team support allow it. The major exception to this rule occurs when the peloton encounters hills. The average power output during road races over 200 km typically vary between 150 and 300 W (Jeukendrup A.E. et al. Unpublished observations).
425

The Bioenergetics of World Class Cycling
Criterium races are shorter road races held on a small, looped course. Riders perform multiple circuits of the course, with high-speed sharp turns. Bike handling skills and sprint speed become more important in this event, bu t from a physiological point of view criteriums are very similar to other road races.
Stage races Stage races are multiple day events combining time trials and road races (stages) and sometimes team time-trials. Stage races may last 2 days up to 3 wk such as the major three European stage races (The Vuelta a Espafia, The Giro d'Italia and the Tour de France). Each day, overall classification is calculated from the Finish position and times, and there is an overall classification with the leader of the race being the rider with the lowest overall time. In professional stage races, such as the Tour de France, time-trial stages and mounta in stages are often crucially important and will separate contenders from support riders (ie. domestiques) in the overall standings, as well as winners from contenders. Stage races are usually won or lost by very small margins (ie. 200-400 s), which, over the course of a 3 wk stage race lasting ~300,000 s represents 0.07-0.13% of total race time.
Lucia et al. (1999) recorded the HR's of eight professional cyclists during 22 stages of the Tour de France and calculated the time spent in three arbitrarily chosen exercise intensity zones. These zones were determined by measuring ventilatory threshold in a laboratory exercise test before the race. A first ventilatory threshold (VTI) was determined as an increase in VE/VO 2 with an increase of VE/VCO2 and the departure from linearity OfVE. VTII was established using the criteria of an increase in both VE/O 2 and VE/VCO 2. While acknowledging the limitations of this method, and the likelihood that these thresholds may have changed during the 22 d of the Tour de France, the data give an indication of the physiological demands of cycling in stage races. Cyclists spent 71, 23, and 8 h in the low-, medium- and high-intensity zones respectively. The relative contributions were 70%, 23% and 7% of total race time. However, there were substantial differences between time-trials, fiat stages, high mounta in stages, and medium mounta in stages, and between r iders depending on their role within the team.
Associated with the high power outputs sustained by these cyclists over prolonged periods are very high daffy energy expenditures. Saris et al. (1989) studied cyclists during the Tour de France using doubly labelled water techniques and estimated that energy expenditure was 24 M J / d (5,700 kcal/d) with extremes of up to 40 M J / d a y (9,500 kcal/d) during very long, mounta inous stages. More recently power output was measured during stages of the Tour de France and it was demonstrated that the average power output over a 6 h stage was over 240 W with an estimated energy expenditure of 24 MJ or 5,700 kca l /d (Jeukendrup 2000). Garcia-Roves et al (1997) reported average energy intakes during the Vuelta Ciclista a Espafia of 23.5 MJ/d. These data suggest that energy expenditures reported for riders during stages of the Tour de France in the late 1990's have not changed considerably from those determined in the late 1980's. With such extreme and high absolute energy expenditures (Brouns et al., 1989, Jeukendrup, 2000; Saris, 1997; Saris, et al., 1989;) these cyclists have major problems maintaining energy balance. While eating large amounts during the race is impractical or even impossible, t ime to eat is mainly limited to breakfas t and dinner. Appetite is suppressed immediately after exhausting exercise, which sets
426

The Bioenergetics of World Class Cycling
73
72
71
~ 7o .~ 69 ~ 68
67
66
65 5 10 15 20
Time (days)
Figure 6: Body mass of six cyclists during the 1999 Tour de Trance. Values are mean+_SEM.
a further hurdle for a large food intake. However, despite conditions that make it difficult for riders to maintain energy balance, body mass d u i ~ g long stage races like the Tour de France is remarkably well maintained. The body weight of 6 cyclists participating in the Tour de France was recorded daily for 20 d in the morning after an overnight fast and after voiding (Jeukendrup A.E. Unpublished observations). Figure 6 shows that although, there was a trend towards a decreasing body mass at the end of the 3 wk race, this decrease was modest and not statistically significant.
PhySiOlogical measurements of world class track and road CyCliStS With recent advances in the physiological testing of athletes, along with monitoring training and racing responses, it is slowly becoming accepted that sport science can make valid contributions to assist coaches in the preparation of their athletes. However, only recently have data on some of the physiological characteristics of 61ite amateur and professional cyclists been published (Craig, et al., 1998; Hawley & Burke, 1998; Jeukendrup & Van Diemen, 1998; Padilla, et al., 1999). It is of note that most of these data have been obtained from male cyclists: there is currently little published information on the physiological profiles of 61ite female cyclists.
Unfortunately there have been few attempts to identify the key physiological variables associated with 6lite track cyclists. However, an examination of long- itudinal data collected from the Australian Institute of Sport's track cycling laboratory (Craig, N P., unpublished observations), in conjunction with previously published modelling data (Craig, et al., 1993; Olds, et al., 1993) provide an insight into the major factors impacting on success in international track cycling. One of the variables frequently discussed by coaches, sport scientists and cyclists is body mass, which increases the energy cost of acceleration, rolling resistance and the projected frontal area of the cyclist (and hence air resistance). Olds et al. (1995) have estimated that an extra fat mass of 2 kg would increase a 4,000 m individual
427

The Bioenergetics of World Class Cycling
pursuit performance time by 1.5 s or a distance o f - 2 0 m. Longitudinal data from the Australian Institute of Sport's track cycling laboratory indicates that ~lite track cyclists consistently achieve sum of six skinfolds <40 mm immediately prior to major international competition (ie. World Championships or Olympic Games).
A consideration of the relative contributions of the aerobic and anaerobic metabolic energy systems to track cycling events (Table 2) highlights the import- ance of a high aerobic capacity for success in the majority of track cycling events (Craig et a0., 1993). Coupled to a high aerobic capacity (>6 L/min) is a high (-500 W) power output, combined with the ability to attain peak power rapidly (spnnt events). Although many track cycling events are predominantly aerobic activities, the anaerobic energy system also plays an important role in the required energy production (Table 2). This notion is supported by the data of Craig et al. (1993) who reported a significant correlation between MAOD and 4000-m individual pursuit time (r = -0.50, P <0.05). That s tudy (Craig, et al., 1993) also found that s p r i n t trained track cyclists had a significantly greater anaerobic capacity (66.9+2.2 ml/kg) compared to endurance trained track cyclists (57.4_+6.7 ml/kg). Like most physiological variables, anaerobic capacity can be improved with appro- priate training. Medbo and Burgess (1990) reported a 10% increase in MAOD after 6 wk of interval training. Such a change in MAOD could, potentially, improve 4,000 m individual pursuit time by ~12 m (Olds, et al., 1993).
In a recent study, Padilla et al. (1999) summarised some of the physiological characteristics of professional road cyclists and the reader is referred to that paper for a comprehensive review of the subject. These workers determined the maximal and submaximal physiological laboratory responses of members of a Spanish professional road cycling team (Banesto) whose subjects included five-time Tour de France winner Miguel Indurain, as well as riders who had won other stage races (Giro d'Italia, Vuelta a Espafia). According to their role in the team, the cyclists were categorised as either fiat terrain (FT), time trial (Tr), all terrain (AT) or uphill (UH) specialists.
Figure 7 displays the maximal values for power output and the VO 2 (L/min) values determined during an incremental test to exhaustion for the team (]1=24). The maximal protocol employed utilised 4 min stages with workload increments of 35 W so that steady-state measures of blood lactate could also be determined (described subsequently). Unfortunately, respiratory gas exchange measurements were not taken so the VO2max of subjects was estimated from a previously published regression equation (Hawley & Noakes, 1992).
As can be seen (Figure 7), the maximal power outputs and aerobic capacities of
FT TT AT UH
2" 651
g E
r 1 * i
FT ~ AT UH
Figure~
428
The maximal physiological characteristics of professional cyclists (n=24). F[ fiat terrain; T[, time-trial; AT, all terrain; UH, uphill. See text for details. All values are mean+-SD. Data are from Padllla et al. (1999). * P<0.05

The Bioenergetics of World Class Cycling
the FT and TiC riders were significantly higher than the UH riders. The highest Wma x values were measured in the FT riders (461+39 W), which was higher than AT and UH (432+27 and 404_+34 W, P<0.05). T r (457_+46 W) was also significantly higher than UH (P<0.05). Absolute VO2max values were also significantly higher in FT and TI" than UH (5.67_+0.44 and 5.65_+0.53 versus 5.05_+0.39 L/min; P<0.05), bu t none of these were different from AT (5.36+0.30 L/min). These findings are predictable based on the specialised role of the team members, and several anthropometric measurements (not shown) which reveal that the FT and T r riders were also taller, heavier, and had greater body surface areas than their AT and UH counterparts. However, when these same parameters are expressed relative to a riders body mass (BM), a different picture emerges, with the UH riders gaining the ascendancy. The UH riders have the highest power: BM ratio (6.47 (0.33 W/kg) followed by Tr, AT and FT (6.41_+0.12, 6.35_+0.18 and 6.04-+0.29 W/kg, respectively). These values were significantly different between UH and NF. VO2max values expressed relative to BM were significantly lower in FT than all other groups (74.4_+3.0 versus 79.2_+1.1, 78.9-+1.9 and 80.9_+3.9 n l l /kg /min for TF, AT and UH; P<0.05).
Although the mammal data reported on these professional cyclists (Padilla et al. 1999) is impressive, perhaps the single most striking physiological attribute of these riders is their submaMmal exercise capacity, determined by the power output (W) at the individual LT, defined as the exercise intensity that elicited a 1 mM increase in blood lactate above baseline concentrations when riding at -50- 60% of VO2max (Coyle, et al., 1983). Both FT and TT riders had higher power outputs at LT than did AT and UH riders (356_+31,357_+41,322_+43 and 308_+46 W respectively). Perhas to emphasise the point, it has previously been reported that in a group of 6lite cyclists whose average 40 kin time was ~54 min, power output at LT was 311 W (Coyle, et al., 1991). As most professional cyclists com- plete time-trial races of this distance at speeds in excess of 50 k m / h , with many riders able to sustain power outputs over 400 W for the duration (see section on time trials), sport scientists need to exercise caution when classifying their subject pool (see subsequent section).
Another interest ing observat ion is tha t gross efficiency measu red in professional road cyclists is high but not markedly different to well-trained riders. Gross efficiency was recently assessed in a group of 16 professional cyclists during an incremental exercise test. Gross efficiency was 21.4_+0.2% (Jeukendrup A. E. Unpublished observations). This value is slightly higher than values reported for cyclists of a lower ability level (Coyle, et al., 1992). In that study, Coyle et al. (1992) suggested that cycling efficiency was related to the percentage of type I muscle fibres: the more type I fibres a cyclists possessed then the higher their efficiency. Indeed, these workers observed that at a given power output, two cyclists could vary by as much as 15-20% in their absolute oxygen cost for cycling (Coyle, et al., 1992). These workers reported that a group of cyclists with a high proportion of type I fibres (67_+40/0) were capable of generating higher power output (10%) than a group whose muscula ture contained a lower (53_+6%) percentage of type I fibres (Coyle, et al., 1992). It was also concluded that cycling performance was largely determined by gross efficiency, suggesting that a large percentage type I muscle fibres is a necessary prerequisite for success as a professional cyclist (Burke, et al., 1977; Coyle, et al., 1992).
At present, however, a causal relationship between muscle fibre type and gross
429
The Bi0e'nergetics of World Class Cycling
m
O 4 C~I C~I 0 , 1 0 , I 0 , 1
Lr~ o c3 o o o o
z ,
E:: I:= ' - - " I- • ~ ~ ' ~ E . ~ = ~ . .
o '~ ~ a ~ =~._~
g a N o _ a
(1~
~ F ~ ~ a a _~
NN NN
~.J
~o
"¢3
~f
430
cycling efficiency has not been directly demons t ra ted . Longitudinal t ra ining s tudies of professional cyclists are necessary in order to determine whether the relationship between the proportion of type I muscle fibres and cycling performance is causal or coincidental. For example, in the s tudy of Coyle et al. (1992), those cyclists with the highest proportion of type I fibres had also been cycling longer (8.8+0.9 versus 5.0_+3.0 yr, a difference of 76%) than their counterparts with fewer type I fibres. It remains to be determined whether the n umber of years of endurance training can alter fibre type and /o r efficiency. Such studies are important because cycling efficiency has the potential to have large effects on performance. For example, it can be calculated that for an elite cyclist with a mass of 70 kg and a lh sustainable power of 400 W, a 1% improvement in gross efficiency equates to a 48 s improvement in 40-km time- trial time.
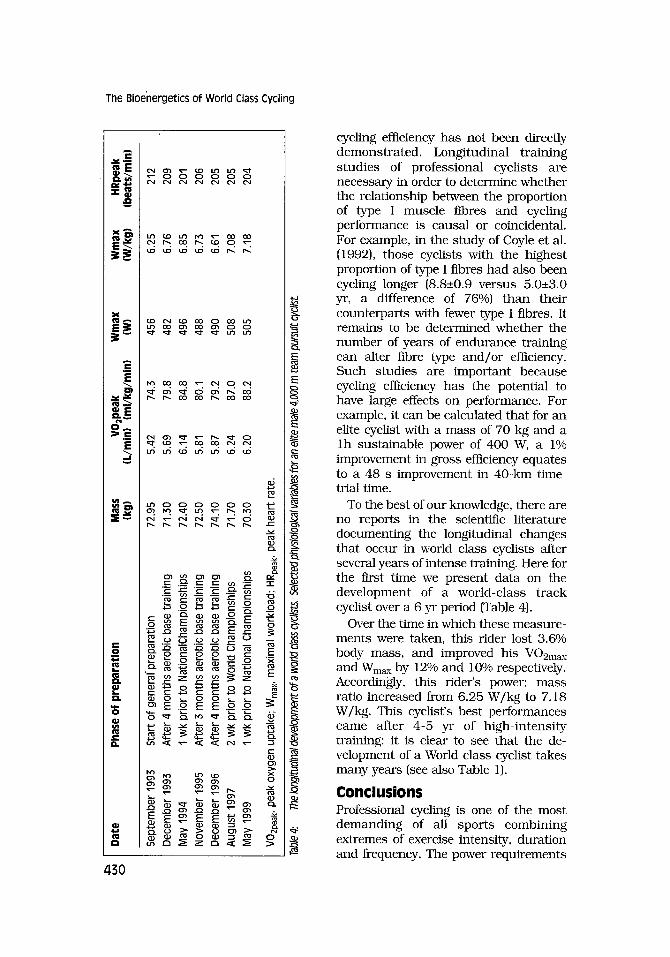
To the best of our knowledge, there are no reports in the scientific literature documenting the longitudinal changes that occur in world class cyclists after several years of intense training. Here for the first time we present data on the development of a world-class t rack cyclist over a 6 yr period (Table 4).
Over the time in which these measure- ments were taken, this rider lost 3.6% body mass , and improved his VO2max and Wma x by 12% and 10% respectively. Accordingly, this rider's power: mass ratio increased from 6.25 W/kg to 7.18 W/kg. This cyclist's best performances came after 4-5 yr of high-intensi ty training: it is clear to see that the de- velopment of a World class cyclist takes many years (see also Table 1).
C o n c l u s i o n s Professional cycling is one of the most demanding of all spor ts combining extremes of exercise intensity, duration and frequency. The power requirements
The Bioenergetics of World Class Cycling
of cycling depend on a complex interaction of many physiological, environmental and mechanical variables. With the recent advent of reliable, valid bicycle crank dynanometers, it has been possible to determine power output profiles during a variety of track and road cycling events. This data reveal that the physiological demands of cycling are extreme: for t rack events lasting 3-5 min riders produce average power outputs of 500-600 W. An average power output of ~440 W, corresponding to a VO 2 of N5.5. L/min, was sustained for 1 b by the current world-record holder in that event. In road races, power outputs are more stochastic in nature and related to the type (time-trial, criterium, mass-s ta r t stage race), length and terrain of the race, as well as team tactics. However, professional cyclists produce power outputs between 325 and 450 W for events ranging in distance from 5 to 70 km, and between 150 W (when drafting) to 300 W during long (~200 km) stage races. The maximal physiological characteristics of pro- fessional road and track cyclists are impressive: values for VO2max and Wma x are typically >5.5 L /min and 450 W, respectively, corresponding to a power:mass ratio of >6.5 W/kg. Perhaps the single most striking physiological attribute of these riders is their submaximal exercise capacity, demonstrated by the high (~350 W) power output at LT. As professional road cyclists frequently ride >30,000 km/yr , including N100 race d/yr, it is not surprising that longitudinal data suggest that the development of a world class cyclists takes a min imum of 4-5 yr.
References Bangsbo, J., Gollnick, P.D., Graham, T.E., Juel, C., Kiens, B., Mizuno, M., & Salfin, B. (1990).
Anaerobic energy production and 02 deficit-debt relationship during exhaustive exercise in humans. Journal of Physiology 422: 539-559.
Bassett, D.R., Kyle, C.R., Passfield, L, Broker, J.P., & Burke, E.R. (1999). Comparing cycling world hour records, 1967-1996: modeling with empirical data. Medicine and Science in Sports and Exercise 31: 1665-1676.
Bogdanis, G.C., Nevill, M.E., Lakomy, H.K.A., Graham, C.M., & Louis, G. (1996). Effects of active recovery on power output dm~rlg repeated mammal sprint cycling. European Journal of Applied Physiology 74:461-469
Boobis, L., Williams, C., & Wootton, S. (1982). Human muscle metabolism during brief maximal exercise. Journa l of Physiology 338:21-22
Broker, J.P., Kyle, C.R., & Burke, E.R. (1999). Racing cyclist power requirements in the 4000-m individual and team pursuit. Medicine and Science in Sports and Exercise 31: 1677-1685.
Brooks, A.N. (1989). Energy consumption of high efficiency vehicles. Cycling Science 1:6-9 Brouns, F., W. H. M. Saris, Stroecken, J., Beckers, E., Thijssen, R., Rehrer, N.J., & ten Hoot, F.
(1989). Eating, drinking, and cycling. A controlled Tour de France simulation study, part I. internat ional Journal of Sports Medicine I0: (Supplement 1): $32-$40.
Burke, E.R., Cerny, F., Costill, D.L., & Fink, W. (1977). Characteristics of skeletal muscle in competitive cyclists. Medicine and Science in Sports and Exercise 9: 109-i 12.
Coyle, E.F. (1999). Physiological determinants of endurance exercise performance. Journal of Science and Medicine in Sport 2: 181-189.
Coyle, E.F., Felmer, M.E., Kautz, S.A., Hamilton, M.T., Montain, S.J., Baylor, A.M., Abraham, L.D., & Petrek, G.W. (1991). Physiological and biomechanical factors associated with elite endurance cycling performance. Medicine and Science in Sports and Exercise 29: 93-107.
Coyle, E.F., W.H. Martin, A.A. Ehsani, J.M. Hagberg, S.A. Bloomfield, D.R. Sinacore, & J.O. Holloszy (1983). Blood lactate threshold in some wefi-trained ischemic heart disease patients. Journal of Applied Physiology 54: 18-23.
Coyle, E. F., L S. Sidossis, J. F. Horowitz, and J. D. Beltz. (1992). Cycling efficiency is related to the percentage of type I muscle fbers. Medicine and Science in Sports and Exercise 24:782-788.
Craig, N. P., Norton, K.I., Bourdon, P.C., Woolford, S.M., Stanef, T., Squires, B., Olds, T.S., Conyers, R.A.J., & Walsh, C.B.V. (1993). Aerobic and anaerobic indices contributing to track endurance cycling performance. European Journal of Applied Physiology 67: 150-158.
Craig, N.P., Norton, K.I., Conyers, R.A.J., Woolford, S.M., Bourdon, P.C., Stanef, T., & Walsh,
431

The Bioenergetics of World Class Cycling
C.B.V. (1995). Influence of test duration and event specificity on maximal accumulated oxygen deficit of high performance track cyclists. Internat ional Journa l of Sports Medicine 16: 534-540.
Craig, N. P., Walsh, C., Martin, D., Woolford, S., Bourdon, P.C., Stanef, T., Barnes, P. & Savage, B. (1998). High performance track, road and mountain cyclists. Test methods manual: sport specif ic guidel ines for the physiological a s s e s s m e n t of el i te athletes, C. J. Gore, ed., Australian Sports Commission, Canberra.
Garcia-Roves, P., N. Terrados, et al. (1997}. Macronutrients intake of top level cyclists during continuous competition-change in the feeding pattern. International Journal of Sports Medicine 19: 61-67.
Gastin, P. (1998). Energetics of high intensity running. Modern Athlete and Coach 36: 3-9. Gastin, P.B., & Lawson, D.L. (1994). Variable resistance all-out test to generate accumulated
oxygen deficit and predict anaerobic capacity. European Journal of Applied Physiology 69: 331-336.
Grazzi, G., N. Aifieri, C. Borsetto, I. Casoni, F. Manfredini, G. Mazzoni, & F. Conconi (1999). The power output/heart rate relationship in cycling: test standardization and repeatability. Medicine and Sc ience in Sports and Exercise 31: 1478-1483.
Hawley, J.A., and Burke, L.M. (1998). The limits to human performance. In: Peak performance: Training and nutrit ional strategies for sport, pp.402-406.
Hawley, J.A., Myburgh, K.H., Noakes, T.D., & Dennis, S.C. (1997). Training techniques to improve fatigue resistance and enhance endurance performance. Journal of Sports Sc iences 15: 325-333.
Hawley, J.A., & Noakes, T.D. (1992). Peak power predicts maximal oxygen uptake and performance time in trained cyclists. European Journal of Applied Physio logy 65: 79-83.
Jeukendrup, A. E., Saris, W.H.M., Brouns, F., & Kester, A.D.M. (1996). A new validated endurance performance test. Medicine and Sc ience in Sport and Exercise 28: 266-270.
Jeukendrup, A.E., & Van Diemen, A. (1998). Heart rate monitoring duling training and competition in cyclists. Journal of Sports Sc iences 16: $91-$99.
Jeukendrup, A. E. (2000). Cycling. IOC Encyclopaedia of Sports Medicine: Nutrition in Sport. R. J. Maughan (Editor)., BlackweU Science, Oxford, pp.562-573.
Keen, P. (1994). The truth behind the race of truth. Cycle Sport 7: 46-50. Kyle, C.R. (1979). Reduction of ~ n d resistance and power output of racing cyclists and runners
travelling in groups. Ergonomics 22: 387-397. Kyle, C. R. (1994). Energy and aerodynamics in cycling. Clinics in Sports Medicine 13: 39-73. Lindsay, F. H., Hawley, J.A., Myburgh, K.H., Schomer, H.H., Noakes, T.D., & Dennis, S.C. (1996).
Improved athletic performance in highly trained cyclists after interval training. Medicine and Sc ience in Sports and Exercise 28: 1427-1434.
Lucia, A., J. Hoyos, A. Carvajal, & J. L. Chicharro. (1999) Heart rate response to professional road cycling: the Tour de France. Internat ional Journal of Sports Medicine 20:167-72.
Martin, J.C., D.L. Milliken, J.E. Cobb, K.L. McFadden, & A.R. Coggan. (1998). Validation of a mathematical model for road-cycling power. Journa l of Applied Biomechanics 14:276-291.
McCamaey, N., Heigenhauser, G.J.F., & Jones, N.L. (1983) Power output and fatigue of human muscle in maximal cycling exercise. Journa l of Applied Physiology 55:218-224.
McCole, S.D., Claney, K., Conte, J.C., Anderson, R., Hagberg, J.M. (1990). Energy expenditure during bicycling. Journal of Applied Physiology 68: 748-53.
Medbo, ,J.I., Burgers, S. (1990). Effect of training on the anaerobic capacity. Medicine and Sc ience in Sports and Exercise 22: 501-507.
Medbo, J. I., Mohn, A.C., Tabata, I., & Sejersted, O.M. (1988). Anaerobic capacity determined by maximal accumulated 02 deficit. Journa l of Applied Physiology: 64:50-60.
Medbo, J.L., & Tabata, I. (1989). Relative importance of aerobic and anaerobic energy release during short-term exhausting bicycle exercise. Journal of Applied Physiology 67: 1881- 1886.
Olds, T. S., Norton, K., & Craig, N.P. (1993). Mathematical model of cycling performance. Journal of Applied Physiology 75: 730-737.
Olds, T.S., Norton, K., Craig, N.P., Olive, S., & Lowe, E. (1995). The limits of the possible: Models of power supply and demand in cycling. The Australian Journal of Science and Medicine in Sport 27: 29-33.
Padilla, S., Mujika, I., Cuesta, G., & Goiriena, J. (1999}. Level ground and uphill cycling ability in professional road cycling. Medicine and Sc ience in Sports and Exercise 31: 878-885.
Padilla, S., & Mujika, I. Scientific approach to the 1-h cycling world record. A case study (2000}.
432

The Bioenergetics of World Class Cycling
Journal of Applied Physiology 89: 1522-1527. Padilla, S., I. Mujika, J. Orbananos, & F. Angulo (2000). Exercise intensity during competition
time trials in professional road cycling. Medicine and Science in Sports and Exercise 32: 850-856.
Palmer, G.S., Dennis, S.C., Noakes, T.D., & Hawley, J.A. (1996). Assessment of the reproducibility of performance testing on an air-braked cycle ergometer. International Jol l rnal of Sports Medicine 17: 293-298.
Saris, W. H. M. (1997). Limits of Human Endurance: lessons from the Tour de France. In: Physiology, s tress and malnutrition: functional correlates, nutrit ional intervention. J. M. Kinney and H. N. Tucker (Eds.). Lippincott: Raven Publishers, pp. 51-463.
Saris, W. H. M., van Erp-Baart, M.A., Brouns, F., Westerterp, K.R., & ten Hoor, F. (1989). Study on food intake and energy expenditure during extreme sustained exercise: the Tour de France. International Journal of Sports Medicine I 0 (Suppl. I):$26-$3 i.
Spangler, D. & Hooker, G. (1990). Scientific training and fitness testing. Cycling Science 21: 23- 26.
Stepto, N.K., J.A. Hawley, S.C. Dennis, & W.G. Hopkins (1999). Effects of different interval- training programs on cycling time-trial performance. Medicine and Science in Sports and Exercise 3 1 : 7 3 6 fl 741.
Stepto, N.K., Martin, D.T., Fallon, K.E., & Hawley, J.A. (2001). Metabolic demands of intense aerobic interval training in competitive cyclists. Medicine and Sc ience in Sports and Exercise (In press).
Wilson, S.S. (1973). Bicycling technology. Scienti f ic American 228: 81-91. Withers, R.T., Van Der Ploeg, G., & Finn, J.P. (1993). Oxygen deficits incurred during 45, 60, 75
and 90 s of maximal cycling on an air-braked ergometer. European Journal of Applied Physio logy 67: 185-191.
433