
The benefits of 4th generation district heating in a 100% ...
12
Aalborg Universitet The benefits of 4th generation district heating in a 100% renewable energy system Sorknæs, Peter; Østergaard, Poul Alberg; Thellufsen, Jakob Zinck; Lund, Henrik; Nielsen, Steffen; Djørup, Søren; Sperling, Karl Published in: Energy DOI (link to publication from Publisher): 10.1016/j.energy.2020.119030 Creative Commons License CC BY 4.0 Publication date: 2020 Document Version Publisher's PDF, also known as Version of record Link to publication from Aalborg University Citation for published version (APA): Sorknæs, P., Østergaard, P. A., Thellufsen, J. Z., Lund, H., Nielsen, S., Djørup, S., & Sperling, K. (2020). The benefits of 4th generation district heating in a 100% renewable energy system. Energy, 213, [119030]. https://doi.org/10.1016/j.energy.2020.119030 General rights Copyright and moral rights for the publications made accessible in the public portal are retained by the authors and/or other copyright owners and it is a condition of accessing publications that users recognise and abide by the legal requirements associated with these rights. ? Users may download and print one copy of any publication from the public portal for the purpose of private study or research. ? You may not further distribute the material or use it for any profit-making activity or commercial gain ? You may freely distribute the URL identifying the publication in the public portal ? Take down policy If you believe that this document breaches copyright please contact us at [email protected] providing details, and we will remove access to the work immediately and investigate your claim. Downloaded from vbn.aau.dk on: December 19, 2021
Transcript of The benefits of 4th generation district heating in a 100% ...

Aalborg Universitet
The benefits of 4th generation district heating in a 100% renewable energy system
Sorknæs, Peter; Østergaard, Poul Alberg; Thellufsen, Jakob Zinck; Lund, Henrik; Nielsen,Steffen; Djørup, Søren; Sperling, KarlPublished in:Energy
DOI (link to publication from Publisher):10.1016/j.energy.2020.119030
Creative Commons LicenseCC BY 4.0
Publication date:2020
Document VersionPublisher's PDF, also known as Version of record
Link to publication from Aalborg University
Citation for published version (APA):Sorknæs, P., Østergaard, P. A., Thellufsen, J. Z., Lund, H., Nielsen, S., Djørup, S., & Sperling, K. (2020). Thebenefits of 4th generation district heating in a 100% renewable energy system. Energy, 213, [119030].https://doi.org/10.1016/j.energy.2020.119030
General rightsCopyright and moral rights for the publications made accessible in the public portal are retained by the authors and/or other copyright ownersand it is a condition of accessing publications that users recognise and abide by the legal requirements associated with these rights.
? Users may download and print one copy of any publication from the public portal for the purpose of private study or research. ? You may not further distribute the material or use it for any profit-making activity or commercial gain ? You may freely distribute the URL identifying the publication in the public portal ?
Take down policyIf you believe that this document breaches copyright please contact us at [email protected] providing details, and we will remove access tothe work immediately and investigate your claim.
Downloaded from vbn.aau.dk on: December 19, 2021

lable at ScienceDirect
Energy 213 (2020) 119030
Contents lists avai
Energy
journal homepage: www.elsevier .com/locate/energy
The benefits of 4th generation district heating in a 100% renewableenergy system
Peter Sorknæs*, Poul Alberg Østergaard, Jakob Zinck Thellufsen, Henrik Lund,Steffen Nielsen, Søren Djørup, Karl SperlingDepartment of Planning, Aalborg University, Rendsburggade 14, 9000, Aalborg, Denmark
a r t i c l e i n f o
Article history:Received 15 May 2020Received in revised form27 August 2020Accepted 3 October 2020Available online 13 October 2020
Keywords:4th generation district heatingLow-temperature district heatingSmart energy systemsEnergyPLAN simulationsGrid lossExcess heat
Abbreviations: 3GDH, 3rd generation district heatinheating; HP, Heat pump; PV, Photo Voltaic; RES, Rene* Corresponding author.
E-mail address: [email protected] (P. Sorknæs
https://doi.org/10.1016/j.energy.2020.1190300360-5442/© 2020 The Author(s). Published by Elsev
a b s t r a c t
District heating is a well-established system for providing energy efficient space and domestic hot waterheating in dwellings in particularly in temperate and cold climate zones. Research has shown that goingfrom the current 3rd generation district heating (3GDH) systems towards 4th generation district heating(4GDH) systems can facilitate a better integration between energy sectors, reduce grid losses and assistthe integration of renewable energy sources. This article investigates the economic and energy effects ofgoing from 3GDH to 4GDH for the specific case of Aalborg Municipality, Denmark based on overall hourlyenergy systems simulations. The analyses include effects from changes in excess heat potentials, changesin grid losses, and changes in efficiencies of conversion units in the district heating. Altogether, theanalyses of the Aalborg case reveal that going from 3GDH to 4GDH decreases the primary energy con-sumption of the entire energy system by around 4.5% and the costs of the system by 2.7%.© 2020 The Author(s). Published by Elsevier Ltd. This is an open access article under the CC BY license
(http://creativecommons.org/licenses/by/4.0/).
1. Introduction
Several studies have found that district heating (DH) has anincreased role to play in the future [1] e and also as part of 100%renewable energy sources (RES)-based energy systems [2,3]. Forinstance, DH provides a meaningful outlet for the inevitable lossesfrom the production of electrofuels [4] and provides access to heatsources that are otherwise not appropriate in single-house appli-cations, such as geothermal energy, and excess heat from industry,power stations, and waste incineration [5,6]. Likewise, DH givesaccess to low-cost energy storage systems [7], and can provide aflexible integration between the electricity and heating sectors byflexible use of e.g. cogeneration of heat and power (CHP) units,electric boilers and heat pumps (HP) [6,8].
Current 3GDH temperature levels are typically in excess of 80 �Cgiving cause to grid losses typically in excess of 20%. At the sametime, the temperature levels of 3GDH limits the possibilities ofutilising excess heat from thermal processes and causes suboptimalefficiencies in heat generation units including HP and CHP plants.
g; 4GDH, 4th generation district hewable energy source.
).
ier Ltd. This is an open access arti
4GDH systems [9] are designed to facilitate the integration be-tween sectors, reduce grid losses, and assist the integration of RESby working at lower temperatures.
Previous studies have already demonstrated this at a generalnational energy system level, such as [10,11] that bothmade holisticenergy system analyses of the effects of 4GDH on future renewableDanish energy systems. However, where national investigationshave used holistic energy system approaches, research using spe-cific case studies to analyse the effects of 4GDH have focused on thedirect effects on the DH system. This can be seen in works, such as,Ianakiev et al. [12] that investigate a DH scheme in Nottinghamwith forward temperatures at around 50e60 �C. Averfalk andWerner [13] creates a generic DH system based on climate condi-tions of Central Europe to estimate the effects on the DH price ofdifferent technologies in 3GDH and 4GDH.
Pakere et al. [14] investigate the effects of 4GDH on a DH systemin a parish in eastern Latvia. Sameti and Haghighat [15] analyse theeffects of 4GDH for a small area of seven buildings, which theycompare with individual heating solutions. Volkova et al. [16]
ating; COP, Coefficient of performance; CHP, Combined heat and power; DH, District
cle under the CC BY license (http://creativecommons.org/licenses/by/4.0/).

P. Sorknæs, P.A. Østergaard, J.Z. Thellufsen et al. Energy 213 (2020) 119030
propose a methodology for transitioning to 4GDH and analyse theeffects of 4GDH for the case of Tallinn in Estonia.
Also Kleinertz et al. [17] look into transitions to 4GDH systems,however, from a more narrow DH perspective and focusingamongst others on temperature levels in grids and storages. Zie-mele et al. [18] present analyses of a DH system’s conversion tobiomass CHP. Askeland et al. [19] investigate the effects of a tran-sition towards 4GDH in Norway finding positive effects on primaryenergy demand e but little effect on Norway’s ability to provideflexibility for the rest of Europe.
Thus looking into the body of literature, there is a group of workon overall energy system analyses focusing on the integration of4GDH into future smart RES-based energy systems e and analysesfocusing on more detailed aspects of the transition, includingtemperature levels in DH systems, grid losses and DH productiontechnologies.
The novelty of this paper is that it bridges the gap between theholistic national analyses with high shares of RES and the DH-focused case study analyses. Bridging this gap is important as itcan provide a more detailed understanding of the effects of thetransition to 4GDH on the entire energy system locally, where someof these aspects can be lost in more generalised national energysystem analyses, and local case studies focusing on the DH systemdoes not show the synergy effects that is expected to be importantin future energy systems based on RES [20]. As such, in this paperthe effects on the entire energy system of going from a 3GDHsystem to a 4GDH system in a RES-based energy system areinvestigated using a specific case.
Part of the investigation is to analyse the effects on the pro-duction units, where HPs in DH systems are particularly susceptibleto temperature levels, where a lowered forward temperature re-sults in higher thermodynamic efficiency. Previous analyses havedemonstrated howgoing below the temperature levels required fordomestic hot water heating and simply going for the minimumrequired for floor-heating can result in very high COP values [21,22].However, this could require substantial retrofitting in terms ofresidential domestic hot water temperature booster technology aswell as potentially changing radiators to floor heating.
A more conservative application of 4GDH is simply to approachthe level at which no temperature boosting of domestic hot water isrequired, as suggested by Ref. [11]. Where 3GDH thus typically hasforward temperatures around 80 �C, a 4GDH forward temperaturein the 55 �Ce65 �C range is thus a relatively conservative level atwhich retrofitting is minimised, and benefits are still harvested. Inthis paper 4GDH temperature levels are defined as 55 �C for theforward temperature and 25 �C for the return temperature, whichhave shown to be sufficient for providing comfortable tempera-tures as well as being legionella-safe with the proper installationsin the individual buildings [10].
The specific case used in this paper is Aalborg Municipality inDenmark, where a 3GDH system has been operating for decades.The analyses focus on three elements where 4GDH has an advan-tage over 3GDH:
� Reduction in grid losses due to a lower temperature differencebetween the heat medium and surrounding soil.
� Improved possibility of utilising excess heat from industrial andservice-sector processes either directly or indirectly throughHPs.
� Effects on the production and storage technologies located atthe DH plants.
The effects of the changes are simulated in the hourly energysystems analysis model EnergyPLAN.
In the next section, EnergyPLAN is presented in further detail,
2
followed by case and scenario descriptions in Section 3. Next resultsfrom the energy systems analyses are presented and discussed,followed by the conclusion in Section 5.
2. Energy systems analyses using EnergyPLAN
EnergyPLAN is a priority list energy system analysis tool, thathourly simulates the energy balance of all energy sectors for a leap-year. It has a particular focus on the integration between sectorsand the exploitation of sources of flexibility for the integration ofvariable RES. Working aggregated, groups of technologies arecombined in one representation in EnergyPLAN; all onshore windturbines are represented by one installed capacity and one hourlytime series, for instance [23].
DH is categorized in three groups in EnergyPLAN depending onsupply technology; systems based on boilers only; systems basedon back-pressure mode CHP plants and systems based on extrac-tion mode CHP plants. Other supplies may also be assigned to thethree separate groups including for instance HPs, industrial excessheat and heat from waste incineration [23].
EnergyPLAN calculates the total annual cost for the entiremodelled energy system, where investments are annualised basedon stated lifetimes and an interest rate [23]. In this paper an interestrate of 3% is used to annualise the investment costs.
The tool is based on what the creators label “analytical pro-gramming”where all situations are handled according to a context-specific prescribed approach [24]. An overview of the fuels, tech-nologies, and energy sectors that can be included in EnergyPLAN isshown in Fig. 1.
EnergyPLAN is useable for supernational, national, regional, andlocal (incl. municipalities) scale energy system analysis, and hasbeen used in a high number of journal articles [25]. EnergyPLAN haspreviously been used for the simulation of municipal or town en-ergy systems in Aalborg [26], Frederikshavn [27], Sønderborg [28],Bornholm [29] (all four in Denmark), Corinaldo [30], Bressanone-Brixen [31] (both in Italy), Gran Canaria [32], and Zagreb [33].Likewise, EnergyPLAN has been used in studies evaluating the en-ergy system effects of going from 3GDH to 4GDH in a nationalcontext [10,11].
3. Case and scenario description
This section introduces the Aalborg energy system includingscenario data and potential 4GDH system benefits in terms ofproduction and storage side benefits, changed DH grid losses, andchange in exploitable excess heat sources.
3.1. Aalborg Municipality and its energy system
Aalborg Municipality is the third most populous municipality inDenmark with a population of 213,558 with 114,194 living in thecity of Aalborg at the end of 2018 and fifth largest in terms of area at1,137 km2 [34]. The municipality has long-term goals of going to-wards 100% RES in the energy system.
The municipality has an extensive DH grid serving not only themain contiguous city more or less fully, but also links to DH systemsin surrounding towns. A few towns within the municipality haveseparate DH systems based on gas CHP and biomass boilers [35].
In 2016, the industries in Aalborg Municipality used 2.35 TWhcoal, 0.92 TWh biomass, 0.42 TWh natural gas, and 0.1 TWh oil.Aalborg is home to the largest energy consumer in Denmark, thecement factory Aalborg Portland. Through extensive heat recovery,this factory supplies a large share of the DH demand in the mu-nicipality. In 2016, a total of 1,176 TJ (0.33 TWh) was recovered forusage in the contiguous DH system in Aalborg, accounting for about
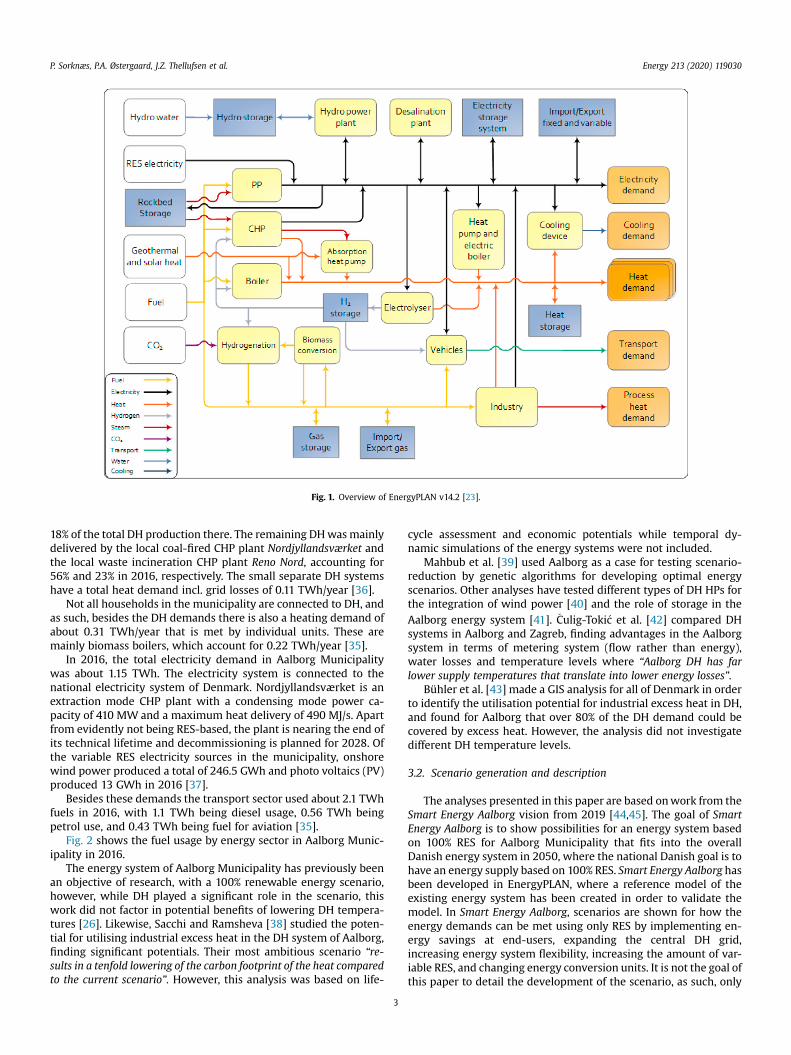
Fig. 1. Overview of EnergyPLAN v14.2 [23].
P. Sorknæs, P.A. Østergaard, J.Z. Thellufsen et al. Energy 213 (2020) 119030
18% of the total DH production there. The remaining DHwasmainlydelivered by the local coal-fired CHP plant Nordjyllandsværket andthe local waste incineration CHP plant Reno Nord, accounting for56% and 23% in 2016, respectively. The small separate DH systemshave a total heat demand incl. grid losses of 0.11 TWh/year [36].
Not all households in the municipality are connected to DH, andas such, besides the DH demands there is also a heating demand ofabout 0.31 TWh/year that is met by individual units. These aremainly biomass boilers, which account for 0.22 TWh/year [35].
In 2016, the total electricity demand in Aalborg Municipalitywas about 1.15 TWh. The electricity system is connected to thenational electricity system of Denmark. Nordjyllandsværket is anextraction mode CHP plant with a condensing mode power ca-pacity of 410 MW and a maximum heat delivery of 490 MJ/s. Apartfrom evidently not being RES-based, the plant is nearing the end ofits technical lifetime and decommissioning is planned for 2028. Ofthe variable RES electricity sources in the municipality, onshorewind power produced a total of 246.5 GWh and photo voltaics (PV)produced 13 GWh in 2016 [37].
Besides these demands the transport sector used about 2.1 TWhfuels in 2016, with 1.1 TWh being diesel usage, 0.56 TWh beingpetrol use, and 0.43 TWh being fuel for aviation [35].
Fig. 2 shows the fuel usage by energy sector in Aalborg Munic-ipality in 2016.
The energy system of Aalborg Municipality has previously beenan objective of research, with a 100% renewable energy scenario,however, while DH played a significant role in the scenario, thiswork did not factor in potential benefits of lowering DH tempera-tures [26]. Likewise, Sacchi and Ramsheva [38] studied the poten-tial for utilising industrial excess heat in the DH system of Aalborg,finding significant potentials. Their most ambitious scenario “re-sults in a tenfold lowering of the carbon footprint of the heat comparedto the current scenario”. However, this analysis was based on life-
3
cycle assessment and economic potentials while temporal dy-namic simulations of the energy systems were not included.
Mahbub et al. [39] used Aalborg as a case for testing scenario-reduction by genetic algorithms for developing optimal energyscenarios. Other analyses have tested different types of DH HPs forthe integration of wind power [40] and the role of storage in theAalborg energy system [41]. �Culig-Toki�c et al. [42] compared DHsystems in Aalborg and Zagreb, finding advantages in the Aalborgsystem in terms of metering system (flow rather than energy),water losses and temperature levels where “Aalborg DH has farlower supply temperatures that translate into lower energy losses”.
Bühler et al. [43] made a GIS analysis for all of Denmark in orderto identify the utilisation potential for industrial excess heat in DH,and found for Aalborg that over 80% of the DH demand could becovered by excess heat. However, the analysis did not investigatedifferent DH temperature levels.
3.2. Scenario generation and description
The analyses presented in this paper are based onwork from theSmart Energy Aalborg vision from 2019 [44,45]. The goal of SmartEnergy Aalborg is to show possibilities for an energy system basedon 100% RES for Aalborg Municipality that fits into the overallDanish energy system in 2050, where the national Danish goal is tohave an energy supply based on 100% RES. Smart Energy Aalborg hasbeen developed in EnergyPLAN, where a reference model of theexisting energy system has been created in order to validate themodel. In Smart Energy Aalborg, scenarios are shown for how theenergy demands can be met using only RES by implementing en-ergy savings at end-users, expanding the central DH grid,increasing energy system flexibility, increasing the amount of var-iable RES, and changing energy conversion units. It is not the goal ofthis paper to detail the development of the scenario, as such, only

Fig. 2. Yearly fuel use by sector in Aalborg Municipality in 2016. Based on data from Ref. [35].
P. Sorknæs, P.A. Østergaard, J.Z. Thellufsen et al. Energy 213 (2020) 119030
the overall principles are described here. To go for 100% RES, thefollowing has been done in the energy system:
� The wind power and PV capacities, and consequently theirproduction, have been increased significantly.
� The industrial and transport demands are changed to be sup-plied by direct electrification, biomass, and liquid and gaseouselectrofuels, that are produced locally using electrolysersalongside a carbon source. The carbon sources utilised are CO2from e.g. biogas production and biomass.
� Part of the individual heating demand is changed to be con-nected to the DH systems, and the remaining individual heatingis supplied by individual HPs in each household.
� In the central DH system, the existing extraction mode CHPplant is scrapped and replaced by a simple cycle gas turbine,HPs, electric boilers, flat plate solar thermal collectors, andincreased utilisation of excess heat from industries and elec-trolysers. Thewaste incineration CHP is kept in operation, as it isexpected that even with increased recycling and use of somebiodegradable waste for biogas production there will still be awaste reminder that has to be handled. Due to the increasedexcess heat utilisation in the central DH system, seasonal pitthermal storage with a combined capacity of 40 GWh is alsoinstalled. It is assumed that the existing aboveground short-term sensible heat storage capacity of 1.58 GWh is maintainedwith an increased cost, as described in section 3.3. This capacityis installed to achieve the lowest total annual costs for the en-ergy system.
� In the separate DH systems that are not connected to the maincontiguous DH grid, flat-plate solar thermal and HPs are addedalongside existing CHP gas engines and fuel boilers. The existingaboveground short-term sensible heat storage capacity of0.13 GWh is also kept in the systems.
100% RES energy system scenarios have been developed for both3GDH and 4GDH systems. The exact capacities are different forthese two cases. The scenario used is the so-called balanced scenariowith increased hydrogen production from Ref. [44], which is themain scenario also described in Ref. [45]. In this scenario, importand export of electricity and gas to and from the energy system ofAalborg Municipality are possible using the national electricity andgas systems, though the yearly net import of electricity and gas iszero. The scenario has been developed and modelled using Ener-gyPLAN, and as such, the balancing is based on hourly productionand consumption. Furthermore, it has been developed based on the
4
following principles:
� All primary energy consumption must be based on 100% RES.� Biomass consumption must not exceed 1.71 TWh/year e cor-responding to the biomass potential in Aalborg Municipality[26].
� The gross import of electricity must not exceed 50 GWh/year.This is a very modest level compared to the main scenarioselectricity production of 3.11 TWh, and is used as a guideline formaking sure that the energy system of Aalborg Municipalitydoes not export large electricity system fluctuations that wouldneed to be handled in other areas.
� The yearly net import of gas must be zero, where the productionof gaseous electrofuels in the energy system of Aalborg Mu-nicipality is used to ensure this balance.
Further details of the scenarios are found in Ref. [44,45]. TheEnergyPLAN models and used distributions can be found at [46].
In this paper, the focus is on the differences between the 3GDHand 4GDH, and as such, these differences are shown in more detailhereafter.
3.3. Effects of 4GDH at the district heating plants
Due to the reduced forward temperature, return temperatureand the lower temperature difference between forward and return,changing from 3GDH to 4GDH will affect the production and heatstorage technologies at the connected DH plants. As shown in Lundet al. [10], transitioning from 3GDH to 4GDH is expected to increasethe COP of HPs and the thermal efficiency of CHP units includingwaste incineration. This work also found that condensing boilerswill see improvements in efficiency, however, this is excluded fromthis analysis as the fuel boilers in this scenario only account forabout 1% of the total DH production. Lund et al. [10] also found thatgoing from 3GDH to 4GDH will decrease the investment cost ofsolar thermal per MWh produced and increase the investment costof thermal storages per MWh capacity.
The scenariomakes extensive use of HPswhere the COPwithin atemperature range can be assumed linearly dependent on theCarnot efficiency. Based on Swedish experience from Fortum, asystem efficiency (defined as the ratio between the actual COP andthe Carnot efficiency) of 64% is applied. This is based on a HPcondenser temperature of 70 �C, and an evaporator temperature of5 �C giving a Carnot factor of 5.28, where the measured COP is 3.4.With 3GDH temperature levels of 80 �C/45 �C the resulting COP is

Table 1Differences for technologies at the DH plant of going from 3GDH to 4GDH.
Technology COP Thermal efficiency Investment cost
HP þ1.0 e e
Simple cycle gas turbine e þ2%-points e
Waste incineration e þ10%-points e
Gas engines e þ5%-points e
Solar thermal e e �162 EUR/MWhHeat storage e e þ0.53 M EUR/GWh
P. Sorknæs, P.A. Østergaard, J.Z. Thellufsen et al. Energy 213 (2020) 119030
2.9 but decreasing temperature levels to 55 �C/25 �C increases thisby a third to 3.9. In both cases, the condenser temperature isassumed 5K above the DH forward temperature to provide areasonable heat exchanger DT. Also, the evaporator temperature isassumed being 5 �C, which is about 5K below the average seawatertemperature in Denmark and thus an appropriate level forextracting heat out of this low-temperature heat source.
As described in Section 3.2, in the main scenario for AalborgMunicipality three types of CHP units are utilised. The CHP units inthe central DH system are a simple cycle gas turbine and steam-based waste incineration CHP, which operate separately of eachother, as is the case currently with the existing waste incinerationplant and central coal-fired CHP plant. For both, the characteristicsare based on [47], where the efficiency of the simple cycle gasturbine is listed with one value for within the generating capacityrange if of 40e125MWee thus with no size dependency. Equally sofor the waste incineration based on a 42 MW waste feed with theproduced steam being used in a steam turbine to produce elec-tricity and heat. Here [47] lists a slight size-dependency withseparate values for feed in of 35, 80 and 220 MW, however, as nochange in sizes is considered here, size dependency is notconsidered.
The simple cycle gas turbine is modelled having an electric ef-ficiency of 44% and a thermal efficiency of 55% in the 4GDH situa-tion, where the electric efficiency is expected to remain unchangedbetween 3GDH and 4GDH, however, the further the temperature ofthe gas turbine exhaust gasses can be lowered with low DH tem-peratures, the better the heat recovery in line with data fromRefs. [48]. Thus, the thermal efficiency is modelled 2%-points lowerwith 3GDH temperature levels than with 4GDH levels. For thewaste incineration CHP, the efficiencies at 4GDH is expected to be25% electric and 76% thermal, where again it is expected that thechange to 4GDH mainly affects the thermal efficiency. This is ex-pected being around 10%-point lower at 3GDH based on data fromFrederiksen and Werner [5].
In the smaller separate DH areas gas engines are used for CHPproduction with an electric efficiency of 39% and a thermal effi-ciency of 55% at the 4GDH temperature levels. These efficiencies arebased on the current yearly average efficiencies, as part of thescenario is to keep the existing gas engines. Thus, any size de-pendency of the efficiency is not important here. Again, the electricefficiency is expected to remain unchanged between 3GDH and4GDH temperature levels, however, the thermal efficiency is ex-pected to be 5%-points lower at the 3GDH temperature levels, as4GDH levels enable a better extracting of heat from the varioussources of the engine - water cooling, oil cooling and exhaust gascooling.
For very low engine cooling water temperatures, there is thetheoretical possibility of too good cooling that while affecting heatuptake positively could also affect electric efficiency, however, thereturn water temperature in these cases is not at such low levels.Even if so, shunting as in e.g. marine engines would not permit this.This naturally also limits the heat efficiency. Data from Refs. [48]indicate steadily increasing heating uptake down to at least tem-peratures of 20 �C, however, below an intercooler temperature of40 �C (for natural gas engines), condensation becomes an issues,which also sets a limit [49]. This is even higher with biogas engineswhere the humidity in the fuel is higher.
For gas turbines, cooling of inlet is even applied in warm cli-mates, and again, data from Ref. [48] demonstrate increased heatuptake for exhaust gas well below the levels applied in this article.For temperatures around 38 �C the effect is noticeable anddepending on application this can simply be through condensationor through the use of exhaust gas cooling using an absorption heatpump [48].
5
For flat-plate solar thermal and the sensible heat storages thecost estimates for 3GDH and 4GDH from Ref. [10] is used, as theheat storage and solar thermal technologies listed there are thesame as those used in this work. As such, the cost for solar thermalis 544 EUR/MWh at 3GDH levels and 382 EUR/MWh at 4GDH levels,based on a fixed cost per m2 collector and increased efficiency atlower temperatures. The sensible heat storages are assumedstratified with the temperature in the top being equal to the for-ward temperature in the DH system and the temperature in thebottom being equal to the return temperature. As such, based on afix cost per volume of storage and energy content per volume ofstorage being proportional to DT, the cost for heat storages is 3.17MEUR/GWh at 3GDH levels and 3.7 M EUR/GWh at 4GDH levels.
Table 1 shows the overview of the found differences of goingfrom 3GDH to 4GDH.
3.4. Grid benefits of 4GDH
DH grid losses aremodelled separately in two groups; one groupwith the largeescale contiguous DH system covering the main cityand more, and a group with the separate small-scale DH systemsplaced farther afield from the central system.
Losses at current temperature levels are known with 27% in thesmall-scale systems and 21% in the large-scale system. These lossesare converted to a loss per degree temperature difference betweenDH pipe water and the surrounding soil as shown in Eqs. (1)e(4).
LossDH ¼ LossForward þ LossReturn (Eq.1)
¼ k*DTForward þ k*DTReturn (Eq.2)
¼ k *�TForward
� TDrop�2� TSoil
�þ k*�TReturn � TDrop
�2� TSoil
�(Eq.3)
¼ k*�TForward þ TReturn � TDrop � 2TSoil
�(Eq.4)
Where DT is the temperature difference between a) the soil and b)the water average temperature between heat producer and con-sumer, and TDrop is the drop in temperature from producer toconsumer.
For a given system, k is a constant factoring in pipe surface area,insulation property and length, and may be determined basedsolely on temperature levels and know losses. For these analyses, kis also constant across the analyses as there are no changes to thepipes or grid layouts.
In the assessment, it is assumed that the temperature drops 4Kalong both the forward and the return pipe e and that the soiltemperature is a constant 8 �C; a design temperature used inDenmark [50]. Losses at other temperature levels are based on the3GDH baseline loss and the temperature difference e corre-sponding to using the same pipes with the same insulation prop-erties. With the temperatures applied here, this gives 4GDH lossesof 18.6% in the small-scale systems and 14.5% in the large-scale

P. Sorknæs, P.A. Østergaard, J.Z. Thellufsen et al. Energy 213 (2020) 119030
system at current heat demands.Relative heat losses in DH grids are also susceptible to heat
savings at the end-user, as grid losses in absolute terms generallywill remain the same. Thus, with losses being related to the tem-perature difference and not related to flows, this provides for aconstant DH grid loss in absolute terms irrespective of savings. Thescenario is based on 30% heat savings which causes the relative DHloss to increase to 27% in the central DH system in the 3GDH case.
3.5. Excess heat potential
The industrial excess heat potential has mainly been identifiedby contact with local stakeholders, Aalborg Portland and the utilitycompany Aalborg Forsyning, alongside contact with the largestretailer of consumer goods in Denmark, COOP Denmark.
Aalborg Portland produces both white and grey cement, and thecurrent utilised excess heat source originate solely from the pro-duction of white cement. The primary source of waste heat is fromwater condensation as the cement burning process is awet process.The limestone is wet when excavated and further water is injectedto create a sufficiently fluid slurry. The hot water vapours arecondensed in a heat exchanger heating up DH water. AalborgPortland has identified more technically possible excess heatsources that could be utilised in the DH system if the temperaturerequirements for them were lowered to 4GDH levels. The newpotential sources at Aalborg Portland can be seen in Table 2, wherea lifetime of 20 years is assumed for annualising the investmentcosts. The costs are also estimated by Aalborg Portland. These po-tentials may be compared to the 2016 heat recovery of 327 GWh.
The HP to reduce the return temperature at Aalborg Portland isexpected to have a COP of 8 at 4GDH temperature levels. Theannualised costs are excluding purchase of electricity for operatingthe HP. This electricity demand is included in the scenarios.
Aalborg Forsyning is the local DH supplier, which previously hasinvestigated potential excess heat sources in other industries thanAalborg Portland. Aalborg Forsyning has not identified any poten-tial heat sources that, like Aalborg Portland, can be used directly inthe DH system, even at 4GDH temperature levels. As such, all po-tentials in other industries include the use of HPs to boost thetemperature to match the forward temperature in the DH system.The sources that Aalborg Forsyning have identified are shown inTable 3. All sources, except the category “Other industries” shownin Table 3, can be utilised in both 3GDH and 4GDH systems but witha different COP for the HP operation. The heat potentials areincluding the electricity consumption of the heat pumps. Theannualised costs are excluding purchase of electricity for operatingthe HPs.
Besides these two, the excess heat potential from supermarkets’refrigeration systems has been assessed. This has been evaluatedbased on phone interview with Technical consultant at COOPDenmark, Bendt Dahl, regarding COOP Denmark’s experiences withrecoverable amounts of excess heat from refrigeration in theirstores, which was assumed to be representative also for similarly-sized supermarkets in other supermarket chains.
Table 2Technical potential new excess energy sources at Aalborg Portland in 4GDH.
Excess heat source H
Increased output from existing units in 4GDH 1Optimisation of existing units 1Heat recovery from grey cement kiln 9HP reducing return temperature to existing units 3Total 3
6
Three different categories were established based on the normalsize of supermarkets in that chain, where Category 1 is assumed tobe able to provide 75 MWh/year/store, Category 2 able to provide100 MWh/year/store, and Category 3 is assumed able to deliver150 MWh/year/store. These potentials will first be used in the in-dividual stores and any excess can be delivered to the DH grid.However, in this it is all categorized as excess heat, as the energysystem impact is the same regardless of whether the internal usedenergy is counted as reduced DH demand or as excess heat deliv-ered to the DH grid. The excess heat is assumed to be delivered tothe grid at 65 �C, despite this it is assumed to be usable in the 3GDHscenario, due to it mostly being available for DH in the summerperiod where the requirements to the forward temperaturegenerally are lower, its geographical dispersion meaning it is closerto the end-user, and the relative low energy potential per store. Thelist of included supermarket chains is shown in Table 4 based on theassumed category.
Using the list in Table 4 and the websites of the supermarketchains, the number of potential stores in each category within thearea of the expanded DH grid in Aalborg Municipality was found.The websites were all accessed the 21st of August 2018, and a totalof 94 stores were found to be relevant, with 72 in Category 3, 14 inCategory 2, and 8 in Category 1. This results in a total technicalexcess heat potential from supermarkets in the 3GDH scenario of8 GWh/year. The exact effect of reducing the DH temperatures to4GDH levels is not known, however, it expected that the utilisationwould increase, due to the reduced DH return temperature. Assuch, it is simply assumed that the potential excess heat is pro-portional to the difference between the temperature of the excessheat source and the return temperature of 3GDH and 4GDH,respectively. With an excess heat temperature of 65 �C, this dif-ference is 25 �C for 3GDH and 45 �C for 4GDH, meaning that thepotential is increased by 60% in 4GDH compared with 3GDH. Assuch, the excess heat potential from supermarkets is assumed to be12.8 GWh/year in the 4GDH scenario.
Summing up the excess heat potentials, the uptake of excessheat from industrial processes is found to be increased from335 GWh direct and 113 GWh indirect via HPs with 3GDH to683 GWh direct and 168 GWh indirect with 4GDH.
4. Results
Though the energy system model is holistic and includes allenergy sectors, the results presented in this section focus on the DHsystem and electricity sector as these are directly affected by thechange from 3GDH to 4GDH. However, when refering to the energysystem then it is the entire modelled energy system, and not onlyDH and electricity. This thus includes industrial fuel uses, individualheating and transport.
The analyses do not address any particular transaction costs forthe transition, but exclusively address the total annual costs - i.e.annualised investment costs, operation and maintenance, and fuelcosts for all sectors of the energy system.
eat potential [GWh] Annualised cost [M EUR]
39 e
08 0.737 0.734 0.4878 1.94

Table 3Technical potential excess heat sources in other industries than Aalborg Portland.
Excess heat source Heat potential [GWh] Annualised cost [M EUR] COP in 3GDH COP in 4GDH
Arla Foods Akafa 12 0.11 4.2 6.6Wastewater treatment plants 98 1.17 3 4Industries at the commercial harbour 3 0.03 4.3 6.8Other industries 21 0.22 e 6.1Total 134 1.53
Table 4Supermarket chains included in the assessment based on category.
Category 1 Category 2 Category 3
Bilka, Føtex, Kvickly, Salling Meny, SuperBrugsen ALDI, Dagli’Brugsen, Fakta, Lidl, Netto, Min Købmand, Rema 1000, SPAR
P. Sorknæs, P.A. Østergaard, J.Z. Thellufsen et al. Energy 213 (2020) 119030
4.1. Annuals costs and energy balance in the main scenarios
The total annual costs e- for the energy system is 624 M EUR inthe 4GDH scenario and 641 M EUR in the 3GDH scenario. Thereduction in energy system costs comes from reduced investmentsin energy producing units, which in turn also reduces the fixedoperation and maintance costs, as the 4GDH energy system cansupply the demands with lower capacities.
The 4GDH scenario has 30 MWe less CHP, 131 MWth less HP, 24MWe less electrolysers, 7 MWe less PV, and 62 MWe less windpower, but 45 MWth more excess heat capacity and 4 MWth morewaste incineration capacity, due to increased utilisation potential ofindustrial excess heat and increased thermal efficiency of the wasteincineration. The reduced wind power capacity is due to thereduced electricity need for the HP in the DH system. In total, the4GDH scenario has 246M EUR less investment costs, correspondingto a reduction in the annual costs of 13 M EUR. The lower capacityalso results in lower fixed operation and maintance costs corre-sponding to 3 M EUR/year.
The total primary energy consumption for the entire energysystem (all energy sectors) for each of the two scenarios are shownin Fig. 3.
Fig. 3. Yearly total primary energy consumption for all sectors in the 4GDH and 3GDHscenarios for Aalborg Municipality.
7
As shown in Fig. 3, going from 3GDH to 4GDH reduces the totalprimary energy consumption of all energy sectors in Aalborg Mu-nicipality from 4.66 TWh/year to 4.45 TWh/year, corresponding toa decrease of 4.5%.
Fig. 4 shows the DH production by technology for the two sce-narios. The Balance category is energy that is produced but notutilised due to temporal differences between production and con-sumption of DH, despite the inclusion of heat storage systems.
From Fig. 4, it can be seen that the DH demand in the 4GDHscenario is 1.56 TWh, and in the 3GDH scenario it is 1.82 TWh, withthe difference being a lower grid loss in the 4GDH scenario. Like-wise, a major difference between the two scenarios is the excessheat from industries, where it is estimated that 0.4 TWh more in-dustrial excess heat can be utilised in the 4GDH scenario, comparedwith the 3GDH scenario. There is also 0.17 TWh excess heat fromthe production of electrofuels; however, this excess heat isassumed to be unaffected by the change in DH temperatures. Theincrease in excess heat from industries in the 4GDH scenario,alongside the reduced grid loss, results in that 0.18 TWh of the heatproduced in the DH system in the 4GDH cannot be utilised. This lostheat is produced in the summer months, where the DH demand islow due to low space heating demands, while excess heat pro-duction is assumed to be constant in absolute terms through thesimulated year. The lower excess heat potential in the 3GDH
Fig. 4. Yearly DH production by technology sectors in the 4GDH and 3GDH scenarios.

Fig. 5. Yearly electricity production by production technology in the 4GDH and 3GDHscenarios.
P. Sorknæs, P.A. Østergaard, J.Z. Thellufsen et al. Energy 213 (2020) 119030
scenario results in higher utilisation of the HP and CHP, comparedwith the 4GDH scenario.
As seen in Fig. 5, the electricity production in both scenarios isbased on variable RES, with wind power accounting for 81e82% ofthe variable RES electricity production and PV accounting for theremainder. The yearly net import of electricity is zero in the 3GDHscenario and 0.01 TWh in the 4GDH scenario. The total electricityproduction including net import in the 4GDH scenario is 3.11 TWhand in the 3GDH scenario it is 3.37 TWh.
The higher electricity production in the 3GDH scenario is due toa higher electricity consumption because of the higher utilisation ofDH HPs with a lower COP. The DH HPs use 0.17 TWh more elec-tricity in the 3GDH scenario than in the 4GDH scenario. As all gasfor the CHP units are produced in the energy system, as described inSection 3.2, the increased use of the CHP units in the 3GDH scenarioalso results in an increased electricity consumption for gas pro-duction of 0.1 TWh, which is mainly used in the electrolysers. Theremaining difference between the two is that the 4GDH scenariohas a higher electricity usage of 0.01 TWh for the DH electricboilers.
4.2. Sensitivity analyses
In this section each of the differences between 4GDH and 3GDHare analysed in more detail, to quantify their individual effect. Theeffect of each of these improvements is analysed by changing one ata time in the 4GDH scenario from the 4GDH level to the 3GDH level.The effect on the solar thermal and heat storages only affect thetotal annual costs of the energy system, but the remaining changesalso result in a changed energy production of the scenario.
To adhere to the scenario restrictions described in Section 3.2,the scenario is balanced by adjusting the capacity of onshore windpower, PV, DH HP, and CHP to ensure that each scenario adheres tothese restrictions. These adjustments have been done through it-erations. In case of needing more primary energy, the priority hasbeen given to increasing the onshore wind power capacity due to ithaving the lowest electricity producing cost. As shown in Fig. 3,electricity from RES is the only other primary energy source besides
8
biomass, which is limited. Increasing the production from onshorewind power will result in increased CEEP, as well as increasedproduction on DH HP, DH electric boilers and the electrofueltechnologies, which will affect the electricity and gas balance. Assuch, the PV, DH HP and CHP capacities are also adjusted to ensurethe balance of these, as adjusting the onshore wind power capacityonly is not always sufficient to ensure the scenario restrictions areadhered to. The changes made do not constitute the only possiblechanges that can be made to adhere to the scenario restrictions, noris it guaranteed to be the lowest cost solutions, as such, theymerelypresent possible adjustments. In the following tables, the MWe foronshore wind power, PV and CHP are changes in the installedproduction capacities, and for DH HP it is the installed capacity inelectricity consumption. The resulting adjustments made to ca-pacities for the sensitivities are found in Table 5.
With these adjustments to the 4GDH scenario the changes toprimary energy consumption and total annual costs shown inTable 6 are found.
As seen in Table 6, decreasing the excess heat potential to 3GDHlevel has the largest impact on both primary energy consumptionand total annual costs, which in both cases are higher than the full4GDH scenario. The reduction of excess heat of 0.4 TWh/year re-sults in an increase of CHP heat production of 0.06 TWh, increase ofHP production of 0.1 TWh, increase of electric boiler production of0.05 TWh, and increased production by fuel boilers of 0.02 TWh.The remaining 0.16 TWh is not produced by other units, as thisamount was non-useable in the DH system.
Increasing the grid loss to 3GDH level has the second largestimpact on the primary energy supply but has a similar impact onthe total annual costs as 3GDH COP for the DH HP. Increasing thegrid loss to 3GDH level increases the total DH demand incl. grid lossby 0.26 TWh/year where the extra DH production originates fromCHP (0.03 TWh), HP (0.09 TWh), electric boilers (0.05 TWh), andthe fuel boilers (0.03 TWh). The remaining 0.06 TWh is from beingable to utilise otherwise non-usable excess heat, especially in thesummer months.
A reduced CHP efficiency only increases the primary energyconsumptionwith 0.02 TWh/year and the total annual costs by 1 MEUR. The effect of 3GDH CHP efficiencies is most evident for thewaste incineration as this produces 0.04 TWh/year less DH, whichinstead is met by the HP and fuel boilers producing 0.01 TWh/yeareach, and the remaining 0.02 TWh is not produced by other units,as this amount were non-useable in the DH system.
The flexible gas engines and simple cycle gas turbine do not seea change in their yearly DH production, as the reduced thermalefficiency simply results in less condensing CHP operation as theDH production can be utilised in more hours of the year, and assuch, CHP operation sees an increase in electricity production of0.01 TWh/year with a corresponding reduction in condensing CHPoperation of 0.01 TWh/year.
The reduced HP COP only has a marginal effect on the system,and in the energy balance it only results in an increase in theelectricity demand of 0.02 TWh.
As described in Section 3.3, the solar thermal and heat storageonly affect the total annual costs of the energy system. 4GDHtemperature level increases the total costs of the heat storages inthe scenario with about 0.05 M EUR/year. The heat storage capacityis 1.705 GWh. The 4GDH temperature level decreases the total costof the solar thermal in the scenario with about 0.4 M EUR/year. Thesolar thermal has a total capacity of 0.05 TWh/year.
As the decrease in excess heat seems to be the largest benefit forthe modelled energy system, it is relevant to analyse the effect ofthe largest excess heat source, Aalborg Portland. As such, a scenariois created where the excess heat from Aalborg Portland is removed.In order to adhere to the scenario restrictions in the 4GDH scenario,

Table 5Capacity adjustments for balancing the sensitivity analysis scenarios.
[MWe] Increased grid loss Reduced HP COP Decreased excess heat utilisation Reduced CHP efficiency
Onshore wind power þ30.5 þ8 þ41 þ5PV e e þ7 e
DH HP e þ9 e e
CHP e e þ20 e
Table 6Result of sensitivity analyses shown alongside the full 4GDH scenario for comparison.
4GDH Increased grid loss Reduced HP COP Decreased excess heat utilisation Reduced CHP efficiency
Primary energy consumption [TWh] 4.45 4.55 4.48 4.6 4.47Total annual costs [M EUR] 624 627 627 630 625
P. Sorknæs, P.A. Østergaard, J.Z. Thellufsen et al. Energy 213 (2020) 119030
the CHP capacity is increased by 20 MWe, onshore wind power isincreased by 30 MW, PV is increased by 42 MW, and the DH HP isincreased by 34 MWe compared with the original 4GDH scenario.The removed excess heat from Aalborg Portland is then replaced by0.13 TWh heat from CHP, 0.41 TWh HP, and the 0.18 TWh surplusproduction of DH is removed, as the summer production of excessheat is now below the summer DH demand. Due to the increasedcapacities for CHP and HP, the DH production on the fuel boilers isreduced by 0.01 TWh, as is the DH production on the electricboilers. For comparison a version of the 3GDH scenario has alsobeen created. Here the wind power capacity is increased by 34 MWand the DH HP is increased by 63 MWe compared with the original3GDH scenario. Here the removed excess heat from Aalborg Port-land is replaced by 0.27 TWh from DH HP and 0.06 from CHP. Forthe 4GDH removing the excess heat from Aalborg Portland in-creases the primary energy consumption by 0.15 TWh and the totalannual costs by 12 M EUR, where in the 3GDH the primary energyconsumption is increased by 0.11 TWh and the total annual costs by15 M EUR. As such, when not including the excess heat from Aal-borg Portland in the scenarios, the advantage of going from 3GDHto 4GDH changes, with a decrease in primary energy consumptionof 3.6% and a decrease in total annual costs of 3%, compared withthe original 4.5% and 2.7%, respectively.
Again, the four 4GDH benefits are analysed separately comparedwith the full 4GDH scenario. The resulting adjustments made tocapacities for the four sensitivities can be found in Table 7.
With these adjustments, the changes to primary energy con-sumption and total annual costs shown in Table 8 are found.
As shown in Table 8, without excess heat production from Aal-borg Portland, the 3GDH effect on the excess heat potential hasnearly no effect on the energy system. Increasing the grid loss to3GDH level shows similar tendencies as with Aalborg Portlandincluded, with increased primary energy consumption and totalannual costs. Reducing the CHP efficiency to 3GDH levels show lessof an effect on the overall energy system without the excess heatfrom Aalborg Portland, though the difference is minor. The reducedHP COP, however, has a larger effect on the energy system without
Table 7Capacity adjustments for balancing the sensitivity analysis scenarios without excess hea
[MWe] Increased grid loss Reduced HP COP
Onshore wind power þ25 þ20PV e e
DH HP e þ7CHP e e
9
the excess heat from Aalborg Portland, as the HPs now have a moredominant role in the DH system producing around 42% of the DH asopposed to around 14% when the excess heat from Aalborg Port-land was included.
5. Conclusion
In this paper, the energy system effects of going from a 3GDHsystem to a 4GDH system in a RES-based energy system is inves-tigated for the specific case of Aalborg Municipality, Denmark. Theanalyses indicate for the specific case that the uptake of excess heatfrom industrial processes can be increased from 335 GWh directlyand 113 GWh indirectly via HPs with 3GDH to 683 GWhdirectly and168 GWh indirectly with 4GDH, where the indirect use requirestemperature boosting through HPs.
Grid losses can be reduced from 21% to 15%, not counting effectsfrom energy savings in buildings. The COP of DH HPs can beincreased from 2.9 to 3.9.
Altogether the total annual energy system costs is founddecreased by around 2.7% from 641 M EUR in the 3GDH scenario to624 M EUR in the 4GDH scenario, and the total primary energyconsumption can be reduced by 4.5% going from 3GDH to 4GDH. Asignificant share of the industrial excess heat in the case originsfrom one company, where removing the industrial excess heat fromthis company reduces the share of industrial excess heat from 25%to 7% in the 3GDH scenario and from 55% to 9% in the 4GDH sce-nario, compared with the total district heating demand. Withoutthis one company’s industrial excess heat the reduction in totalannual cost was found to be 3% and primary energy consumptionwas reduced by 3.6%, indicating that the effect of a large potentialfor utilisation of industrial excess heat especially effects thereduction in primary energy consumption. It was found that thesebenefits were especially due to the increased utilisation of excessheat from industrial processes and the benefits from a decreasedgrid loss.
The increased COP of the DH HP only showed minor benefits forthe overall energy system. However, this was found to be related to
t from Aalborg Portland.
Decreased excess heat utilisation Reduced CHP efficiency
þ2 þ3e e
e e
e e
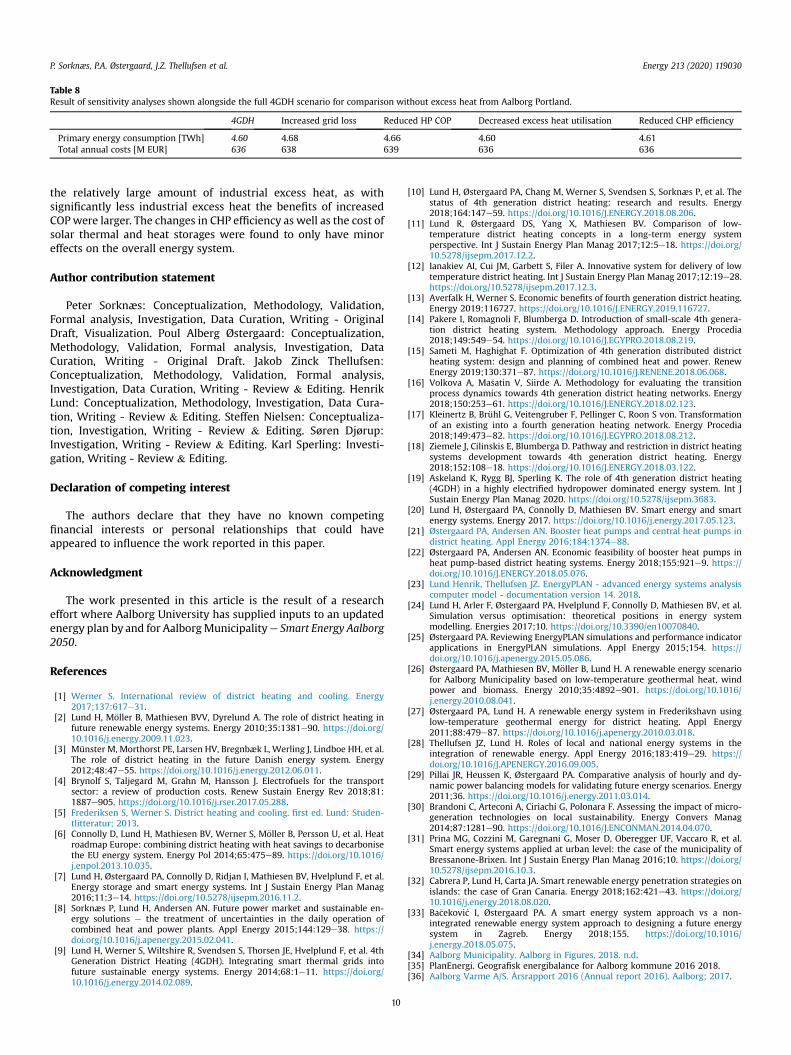
Table 8Result of sensitivity analyses shown alongside the full 4GDH scenario for comparison without excess heat from Aalborg Portland.
4GDH Increased grid loss Reduced HP COP Decreased excess heat utilisation Reduced CHP efficiency
Primary energy consumption [TWh] 4.60 4.68 4.66 4.60 4.61Total annual costs [M EUR] 636 638 639 636 636
P. Sorknæs, P.A. Østergaard, J.Z. Thellufsen et al. Energy 213 (2020) 119030
the relatively large amount of industrial excess heat, as withsignificantly less industrial excess heat the benefits of increasedCOPwere larger. The changes in CHP efficiency as well as the cost ofsolar thermal and heat storages were found to only have minoreffects on the overall energy system.
Author contribution statement
Peter Sorknæs: Conceptualization, Methodology, Validation,Formal analysis, Investigation, Data Curation, Writing - OriginalDraft, Visualization. Poul Alberg Østergaard: Conceptualization,Methodology, Validation, Formal analysis, Investigation, DataCuration, Writing - Original Draft. Jakob Zinck Thellufsen:Conceptualization, Methodology, Validation, Formal analysis,Investigation, Data Curation, Writing - Review & Editing. HenrikLund: Conceptualization, Methodology, Investigation, Data Cura-tion, Writing - Review & Editing. Steffen Nielsen: Conceptualiza-tion, Investigation, Writing - Review & Editing. Søren Djørup:Investigation, Writing - Review & Editing. Karl Sperling: Investi-gation, Writing - Review & Editing.
Declaration of competing interest
The authors declare that they have no known competingfinancial interests or personal relationships that could haveappeared to influence the work reported in this paper.
Acknowledgment
The work presented in this article is the result of a researcheffort where Aalborg University has supplied inputs to an updatedenergy plan by and for AalborgMunicipalitye Smart Energy Aalborg2050.
References
[1] Werner S. International review of district heating and cooling. Energy2017;137:617e31.
[2] Lund H, M€oller B, Mathiesen BVV, Dyrelund A. The role of district heating infuture renewable energy systems. Energy 2010;35:1381e90. https://doi.org/10.1016/j.energy.2009.11.023.
[3] Münster M, Morthorst PE, Larsen HV, Bregnbæk L, Werling J, Lindboe HH, et al.The role of district heating in the future Danish energy system. Energy2012;48:47e55. https://doi.org/10.1016/j.energy.2012.06.011.
[4] Brynolf S, Taljegard M, Grahn M, Hansson J. Electrofuels for the transportsector: a review of production costs. Renew Sustain Energy Rev 2018;81:1887e905. https://doi.org/10.1016/j.rser.2017.05.288.
[5] Frederiksen S, Werner S. District heating and cooling. first ed. Lund: Studen-tlitteratur; 2013.
[6] Connolly D, Lund H, Mathiesen BV, Werner S, M€oller B, Persson U, et al. Heatroadmap Europe: combining district heating with heat savings to decarbonisethe EU energy system. Energy Pol 2014;65:475e89. https://doi.org/10.1016/j.enpol.2013.10.035.
[7] Lund H, Østergaard PA, Connolly D, Ridjan I, Mathiesen BV, Hvelplund F, et al.Energy storage and smart energy systems. Int J Sustain Energy Plan Manag2016;11:3e14. https://doi.org/10.5278/ijsepm.2016.11.2.
[8] Sorknæs P, Lund H, Andersen AN. Future power market and sustainable en-ergy solutions e the treatment of uncertainties in the daily operation ofcombined heat and power plants. Appl Energy 2015;144:129e38. https://doi.org/10.1016/j.apenergy.2015.02.041.
[9] Lund H, Werner S, Wiltshire R, Svendsen S, Thorsen JE, Hvelplund F, et al. 4thGeneration District Heating (4GDH). Integrating smart thermal grids intofuture sustainable energy systems. Energy 2014;68:1e11. https://doi.org/10.1016/j.energy.2014.02.089.
10
[10] Lund H, Østergaard PA, Chang M, Werner S, Svendsen S, Sorknæs P, et al. Thestatus of 4th generation district heating: research and results. Energy2018;164:147e59. https://doi.org/10.1016/J.ENERGY.2018.08.206.
[11] Lund R, Østergaard DS, Yang X, Mathiesen BV. Comparison of low-temperature district heating concepts in a long-term energy systemperspective. Int J Sustain Energy Plan Manag 2017;12:5e18. https://doi.org/10.5278/ijsepm.2017.12.2.
[12] Ianakiev AI, Cui JM, Garbett S, Filer A. Innovative system for delivery of lowtemperature district heating. Int J Sustain Energy Plan Manag 2017;12:19e28.https://doi.org/10.5278/ijsepm.2017.12.3.
[13] Averfalk H, Werner S. Economic benefits of fourth generation district heating.Energy 2019:116727. https://doi.org/10.1016/J.ENERGY.2019.116727.
[14] Pakere I, Romagnoli F, Blumberga D. Introduction of small-scale 4th genera-tion district heating system. Methodology approach. Energy Procedia2018;149:549e54. https://doi.org/10.1016/J.EGYPRO.2018.08.219.
[15] Sameti M, Haghighat F. Optimization of 4th generation distributed districtheating system: design and planning of combined heat and power. RenewEnergy 2019;130:371e87. https://doi.org/10.1016/J.RENENE.2018.06.068.
[16] Volkova A, Ma�satin V, Siirde A. Methodology for evaluating the transitionprocess dynamics towards 4th generation district heating networks. Energy2018;150:253e61. https://doi.org/10.1016/J.ENERGY.2018.02.123.
[17] Kleinertz B, Brühl G, Veitengruber F, Pellinger C, Roon S von. Transformationof an existing into a fourth generation heating network. Energy Procedia2018;149:473e82. https://doi.org/10.1016/J.EGYPRO.2018.08.212.
[18] Ziemele J, Cilinskis E, Blumberga D. Pathway and restriction in district heatingsystems development towards 4th generation district heating. Energy2018;152:108e18. https://doi.org/10.1016/J.ENERGY.2018.03.122.
[19] Askeland K, Rygg BJ, Sperling K. The role of 4th generation district heating(4GDH) in a highly electrified hydropower dominated energy system. Int JSustain Energy Plan Manag 2020. https://doi.org/10.5278/ijsepm.3683.
[20] Lund H, Østergaard PA, Connolly D, Mathiesen BV. Smart energy and smartenergy systems. Energy 2017. https://doi.org/10.1016/j.energy.2017.05.123.
[21] Østergaard PA, Andersen AN. Booster heat pumps and central heat pumps indistrict heating. Appl Energy 2016;184:1374e88.
[22] Østergaard PA, Andersen AN. Economic feasibility of booster heat pumps inheat pump-based district heating systems. Energy 2018;155:921e9. https://doi.org/10.1016/J.ENERGY.2018.05.076.
[23] Lund Henrik, Thellufsen JZ. EnergyPLAN - advanced energy systems analysiscomputer model - documentation version 14. 2018.
[24] Lund H, Arler F, Østergaard PA, Hvelplund F, Connolly D, Mathiesen BV, et al.Simulation versus optimisation: theoretical positions in energy systemmodelling. Energies 2017;10. https://doi.org/10.3390/en10070840.
[25] Østergaard PA. Reviewing EnergyPLAN simulations and performance indicatorapplications in EnergyPLAN simulations. Appl Energy 2015;154. https://doi.org/10.1016/j.apenergy.2015.05.086.
[26] Østergaard PA, Mathiesen BV, M€oller B, Lund H. A renewable energy scenariofor Aalborg Municipality based on low-temperature geothermal heat, windpower and biomass. Energy 2010;35:4892e901. https://doi.org/10.1016/j.energy.2010.08.041.
[27] Østergaard PA, Lund H. A renewable energy system in Frederikshavn usinglow-temperature geothermal energy for district heating. Appl Energy2011;88:479e87. https://doi.org/10.1016/j.apenergy.2010.03.018.
[28] Thellufsen JZ, Lund H. Roles of local and national energy systems in theintegration of renewable energy. Appl Energy 2016;183:419e29. https://doi.org/10.1016/J.APENERGY.2016.09.005.
[29] Pillai JR, Heussen K, Østergaard PA. Comparative analysis of hourly and dy-namic power balancing models for validating future energy scenarios. Energy2011;36. https://doi.org/10.1016/j.energy.2011.03.014.
[30] Brandoni C, Arteconi A, Ciriachi G, Polonara F. Assessing the impact of micro-generation technologies on local sustainability. Energy Convers Manag2014;87:1281e90. https://doi.org/10.1016/J.ENCONMAN.2014.04.070.
[31] Prina MG, Cozzini M, Garegnani G, Moser D, Oberegger UF, Vaccaro R, et al.Smart energy systems applied at urban level: the case of the municipality ofBressanone-Brixen. Int J Sustain Energy Plan Manag 2016;10. https://doi.org/10.5278/ijsepm.2016.10.3.
[32] Cabrera P, Lund H, Carta JA. Smart renewable energy penetration strategies onislands: the case of Gran Canaria. Energy 2018;162:421e43. https://doi.org/10.1016/j.energy.2018.08.020.
[33] Ba�cekovi�c I, Østergaard PA. A smart energy system approach vs a non-integrated renewable energy system approach to designing a future energysystem in Zagreb. Energy 2018;155. https://doi.org/10.1016/j.energy.2018.05.075.
[34] Aalborg Municipality. Aalborg in Figures. 2018. n.d.[35] PlanEnergi. Geografisk energibalance for Aalborg kommune 2016 2018.[36] Aalborg Varme A/S. Årsrapport 2016 (Annual report 2016). Aalborg; 2017.

P. Sorknæs, P.A. Østergaard, J.Z. Thellufsen et al. Energy 213 (2020) 119030
[37] Danish Energy Agency. Master data register of wind turbines may 19 2016 |Danish Energy Agency n.d.
[38] Sacchi R, Ramsheva YK. The effect of price regulation on the performances ofindustrial symbiosis: a case study on district heating. Int J Sustain Energy PlanManag 2017. https://doi.org/10.5278/ijsepm.2017.14.4.
[39] Mahbub MS, Cozzini M, Østergaard PA, Alberti F. Combining multi-objectiveevolutionary algorithms and descriptive analytical modelling in energy sce-nario design. Appl Energy 2016;164:140e51. https://doi.org/10.1016/j.apenergy.2015.11.042.
[40] Østergaard PAPA. Wind power integration in Aalborg Municipality usingcompression heat pumps and geothermal absorption heat pumps. Energy2013;49:502e8. https://doi.org/10.1016/j.energy.2012.11.030.
[41] Østergaard PA. Comparing electricity, heat and biogas storages’ impacts onrenewable energy integration. Energy 2012;37:255e62. https://doi.org/10.1016/j.energy.2011.11.039.
[42] �Culig-Toki�c D, Kraja�ci�c G, Dora�ci�c B, Mathiesen BV, Krklec R, Larsen JM.Comparative analysis of the district heating systems of two towns in Croatiaand Denmark. Energy 2015;92:435e43. https://doi.org/10.1016/j.energy.2015.05.096.
11
[43] Bühler F, Petrovi�c S, Karlsson K, Elmegaard B. Industrial excess heat for districtheating in Denmark. Appl Energy 2017;205:991e1001. https://doi.org/10.1016/J.APENERGY.2017.08.032.
[44] Thellufsen JZ, Lund H, Sorknæs P, Nielsen S, Østergaard PA. Documentation forscenarios in the 2050 Aalborg energy vision. 2019.
[45] Thellufsen JZ, Lund H, Sorknæs P, Østergaard PA, Chang M, Drysdale D, et al.Smart energy cities in a 100% renewable energy context. Renew Sustain En-ergy Rev 2020;129:109922. https://doi.org/10.1016/j.rser.2020.109922.
[46] Thellufsen JZ, Sorknæs P, Lund H, Østergaard PA, Chang M. Aalborg EnergyVision scenarios 2020. https://doi.org/10.5281/ZENODO.4001641.
[47] Danish Energy Agency. Energinet. Technology data - generation of electricityand district heating. 2020.
[48] Danish Gas Technology Centre. Personal communication. Hørsholm,Denmark: [n.d].
[49] Jenbacher A/S. Personal communication. 2018.[50] Bryder KL, Kjærsgaard T. Fjernvarme (district heating). In: Rump T, Hansen B,
editors. Varme ståbi (heating handbook). fourth ed. Copenhagen, Denmark:Nyt Teknisk Forlag; 2004. p. 297.