
THE BEHAVIOUR OF TUGS IN WAVES ASSISTING LNG CARRIERS ... · THE BEHAVIOUR OF TUGS IN WAVES...
9
Proceedings of OMAE 2005 24 th International Conference on Offshore Mechanics and Arctic Engineering 12-17 June 2005 Halkidiki, Greece OMAE2005-67219 THE BEHAVIOUR OF TUGS IN WAVES ASSISTING LNG CARRIERS DURING BERTHING ALONG OFFSHORE LNG TERMINALS Bas Buchner, Pieter Dierx and Olaf Waals MARIN PO Box 28 6700 AA Wageningen The Netherlands ABSTRACT For future offshore LNG terminals tugs are planned to assist LNG carriers during berthing and offloading operations. A model test study was carried out to better understand the tug behaviour in waves and to make a first step in the quantification of the related weather limits. Scale 1:35 model tests were performed in the two important ‘modes’ of a tug during this type of operation: the ‘push’ mode and the ‘pull’ mode. Realistic weather conditions were used and the tugs were working at the unshielded and shielded sides of the LNG carrier. Based on the results presented in this paper, it can be concluded that the motions of tugs in waves are significant, even in wave conditions that are considered to be mild for the berthing and offloading LNG carriers. The resulting push or pull loads may hamper these tug operations significantly. Special measures are necessary to take this behaviour into account in tug design, LNG carrier design and development of operational procedures and equipment. The paper gives insight in the typical tug behaviour in different weather conditions. One should be careful, however, to generalize the present results: with an optimised tug design and operation the tugs can be used in more severe conditions. Figure 1. Assisting tugs in a more sheltered condition. INTRODUCTION The requirements for the uptime of new Offshore terminals for LNG import and export are extremely high (95- 99%). The Offshore industry realises that this requires dedicated mooring and offloading systems, so that the offloading of LNG can proceed in significant waves and swell. Mooring to a dedicated Gravity Based Structure (GBS) and side-by-side/tandem mooring to a Floating Storage and Regassification Unit (FSRU) are considered in this process. This type of mooring problems has been studied in Buchner et al (2001, 2004) and Van der Valk and Watson (2005). It was recognised as well that operational problems can also affect the operability of offshore LNG terminals. Van Doorn and Buchner (2004) discussed these issues for oil offloading terminals and Onassis and Hurdle (2004) studied operational aspects of offshore LNG terminals. As indicated by Onassis and Hurdle (2004), in the design of new offshore LNG terminals tugs are planned for the assistance of the berthing and offloading operations of visiting LNG carriers. This is necessary to assure safe and efficient operations. So far this type of assisting tugs has mainly been used in sheltered conditions in harbours or other more shielded conditions around terminals, see Figure 1. Figure 2. Experience with tugs assisting crude carriers during lightering operations has shown that waves may hamper tug operations significantly (courtesy Capt. Mark Scholma). 1 Copyright © 2005 by ASME
Transcript of THE BEHAVIOUR OF TUGS IN WAVES ASSISTING LNG CARRIERS ... · THE BEHAVIOUR OF TUGS IN WAVES...

Proceedings of OMAE 2005 24th International Conference on Offshore Mechanics and Arctic Engineering
12-17 June 2005 Halkidiki, Greece
OMAE2005-67219
THE BEHAVIOUR OF TUGS IN WAVES ASSISTING LNG CARRIERS DURING BERTHING
ALONG OFFSHORE LNG TERMINALS
Bas Buchner, Pieter Dierx and Olaf Waals MARIN
PO Box 28 6700 AA Wageningen
The Netherlands
ABSTRACT For future offshore LNG terminals tugs are planned to
assist LNG carriers during berthing and offloading operations. A model test study was carried out to better understand the tug behaviour in waves and to make a first step in the quantification of the related weather limits. Scale 1:35 model tests were performed in the two important ‘modes’ of a tug during this type of operation: the ‘push’ mode and the ‘pull’ mode. Realistic weather conditions were used and the tugs were working at the unshielded and shielded sides of the LNG carrier. Based on the results presented in this paper, it can be concluded that the motions of tugs in waves are significant, even in wave conditions that are considered to be mild for the berthing and offloading LNG carriers. The resulting push or pull loads may hamper these tug operations significantly. Special measures are necessary to take this behaviour into account in tug design, LNG carrier design and development of operational procedures and equipment. The paper gives insight in the typical tug behaviour in different weather conditions. One should be careful, however, to generalize the present results: with an optimised tug design and operation the tugs can be used in more severe conditions.
Figure 1. Assisting tugs in a more sheltered condition.
INTRODUCTION The requirements for the uptime of new Offshore
terminals for LNG import and export are extremely high (95-99%). The Offshore industry realises that this requires dedicated mooring and offloading systems, so that the offloading of LNG can proceed in significant waves and swell. Mooring to a dedicated Gravity Based Structure (GBS) and side-by-side/tandem mooring to a Floating Storage and Regassification Unit (FSRU) are considered in this process. This type of mooring problems has been studied in Buchner et al (2001, 2004) and Van der Valk and Watson (2005). It was recognised as well that operational problems can also affect the operability of offshore LNG terminals. Van Doorn and Buchner (2004) discussed these issues for oil offloading terminals and Onassis and Hurdle (2004) studied operational aspects of offshore LNG terminals.
As indicated by Onassis and Hurdle (2004), in the design of new offshore LNG terminals tugs are planned for the assistance of the berthing and offloading operations of visiting LNG carriers. This is necessary to assure safe and efficient operations. So far this type of assisting tugs has mainly been used in sheltered conditions in harbours or other more shielded conditions around terminals, see Figure 1.
Figure 2. Experience with tugs assisting crude carriers
during lightering operations has shown that waves may hamper tug operations significantly (courtesy Capt. Mark Scholma).
1 Copyright © 2005 by ASME

However, for new Offshore LNG import or export terminals, these operations should be carried out in a real offshore environment with the related waves. Experience with tugs assisting crude carriers during lightering operations has shown that waves may hamper these tug operations significantly (see also Figure 2):
• In the pull mode the motions of the tugs in the waves can cause extreme line loads, resulting in breaking of the towline (or even the danger of capsizing of the tug when large loads are applied transverse to the tug).
• In the push mode the motions of the tugs in the waves can induce high impact loads in the fender, resulting in large stresses in the side shell of the LNG carrier.
• Green water on the deck can affect the stability of the tug as well as the safety of the crew.
• Excessive motions can influence the capabilities of the crew that is working on the tug.
• Tugs may need a significant part of their power to stay on station themselves.
• Large tug motions and (relative) wave motions can result in thruster ventilation and reduced thruster efficiency.
Tug operations in waves can consequently be a real
bottleneck in the uptime of a LNG import or export terminal. In Onassis and Hurdle (2005) this problem was addressed briefly, but not quantified in detail. The objectives of the present paper are to better understand the tug behaviour in waves and to make a first step in the quantification of the related weather limits. For this purpose a dedicated set of model tests was carried out.
MODELS AND SET-UP
To better understand the behaviour of tugs in waves, a
pilot study was carried out in the Offshore Basin of the Maritime Research Institute Netherlands (MARIN). A 1:35 scale model of an LNG carrier was used, in combination with a 35 m long tug, having a bollard pull of 50 t/500 kN. A third structure, such as a GBS or FSRU, was not modelled in the present tests. The focus was on the local interaction between the tug and the LNG carrier.
LNG Carrier and Tug models A summary of the particulars of both vessels can be
found in Table 1. Table 1. A summary of the particulars of the LNG carrier
and tug.
Designation Symbol LNG Carrier Tug Unit Length LPP Lpp 274.00 34.80 m Breadth B 44.20 9.13 m Depth D 25.00 4.50 m Draft (even keel) T 11.00 2.73 m Displacement ∆ 99,210 550 tonnes
A picture of the scale model of the tug is shown in
Figure 3. The model had no active propulsion, but two dummy thrusters.
Figure 3. The scale 1:35 tug model with dummy thrusters
and schematic modelling of bow fender characteristics
Towline The modelled towline of the tug consisted of 25 m
Dyneema and a 15 m nylon tail. The nylon tail was used to absorb the snap loads in the towline. The line was relatively short because with a short tow line a quick change can be made between push and pull mode, which might be necessary during the operation. Furthermore the short towline allows a more directly controlled operation than a long towline. The winch for the towline was assumed to be located at the bow of tug. The maximum breaking load (MBL) of the total towline was 4500 kN. The load-elongation curve of the towline is given in Figure 4. In the basin it is modelled with a series of 3 linear springs with different stiffness, that are blocked at certain elongations.
Force - Elongation curve
0
500
1000
1500
2000
2500
3000
0 1 2 3 4 5 6
Elongation [m]
Ap
plied
Fo
rce [
kN
]
Figure 4. The load-elongation curve of the towline.
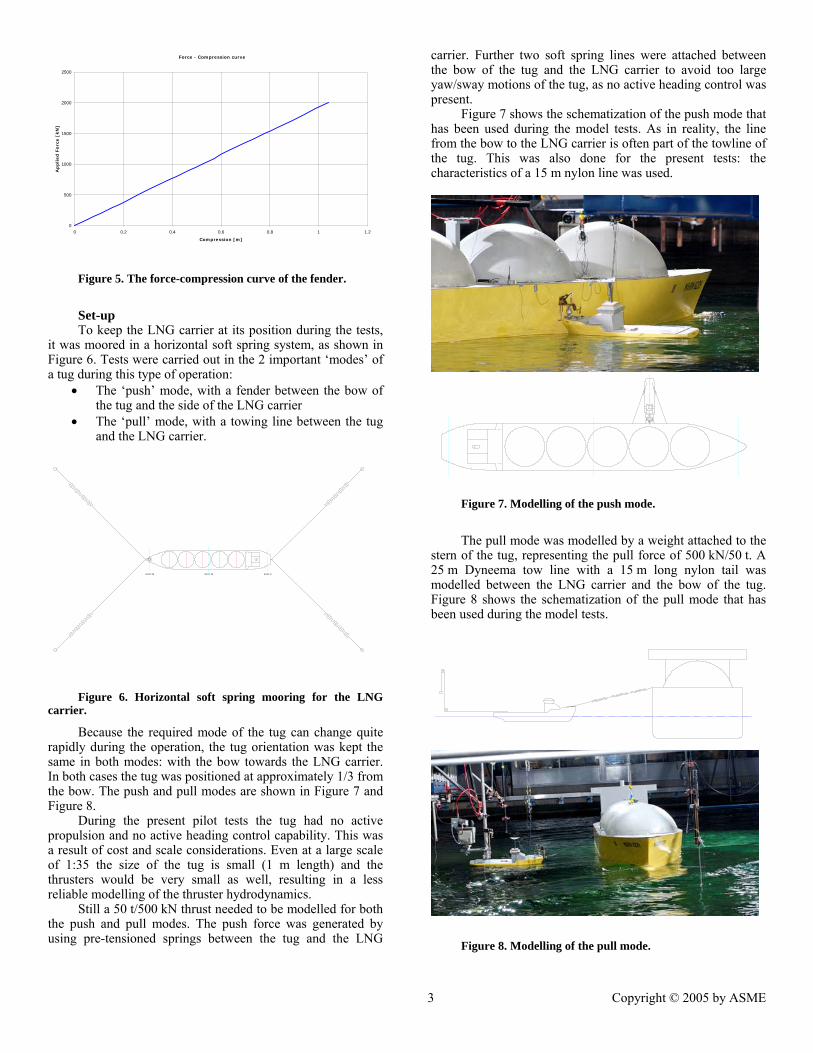
Fender The bow fender is designed to push against another
vessel without damaging the tug and the other vessel. For the present tests a cylindrical rubber fender was modelled with a diameter of 2 m and a length of 2 m. The main characteristic of the fender is its compressibility: Figure 5 shows the force-compression characteristics. For the tests the fender was modelled as a lever arm connected to a spring, as shown on the bow of the tug in Figure 3.
2 Copyright © 2005 by ASME
Force - Compression curve
0
500
1000
1500
2000
2500
0 0.2 0.4 0.6 0.8 1 1.2
Compression [m]
Ap
plied
Fo
rce [
kN
]
Figure 5. The force-compression curve of the fender.
Set-up To keep the LNG carrier at its position during the tests,
it was moored in a horizontal soft spring system, as shown in Figure 6. Tests were carried out in the 2 important ‘modes’ of a tug during this type of operation:
• The ‘push’ mode, with a fender between the bow of the tug and the side of the LNG carrier
• The ‘pull’ mode, with a towing line between the tug and the LNG carrier.
STAT.20 STAT.10 STAT.0
Figure 6. Horizontal soft spring mooring for the LNG
carrier.
Because the required mode of the tug can change quite rapidly during the operation, the tug orientation was kept the same in both modes: with the bow towards the LNG carrier. In both cases the tug was positioned at approximately 1/3 from the bow. The push and pull modes are shown in Figure 7 and Figure 8.
During the present pilot tests the tug had no active propulsion and no active heading control capability. This was a result of cost and scale considerations. Even at a large scale of 1:35 the size of the tug is small (1 m length) and the thrusters would be very small as well, resulting in a less reliable modelling of the thruster hydrodynamics.
Still a 50 t/500 kN thrust needed to be modelled for both the push and pull modes. The push force was generated by using pre-tensioned springs between the tug and the LNG
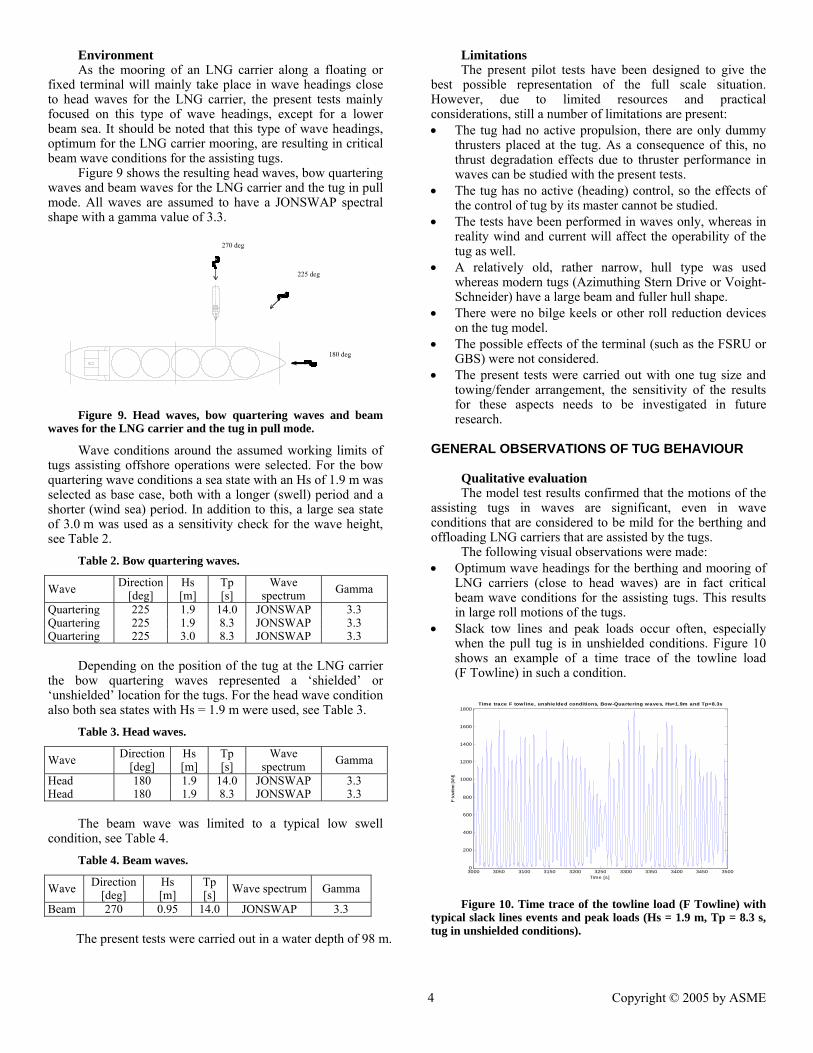
carrier. Further two soft spring lines were attached between the bow of the tug and the LNG carrier to avoid too large yaw/sway motions of the tug, as no active heading control was present.
Figure 7 shows the schematization of the push mode that has been used during the model tests. As in reality, the line from the bow to the LNG carrier is often part of the towline of the tug. This was also done for the present tests: the characteristics of a 15 m nylon line was used.
Figure 7. Modelling of the push mode.
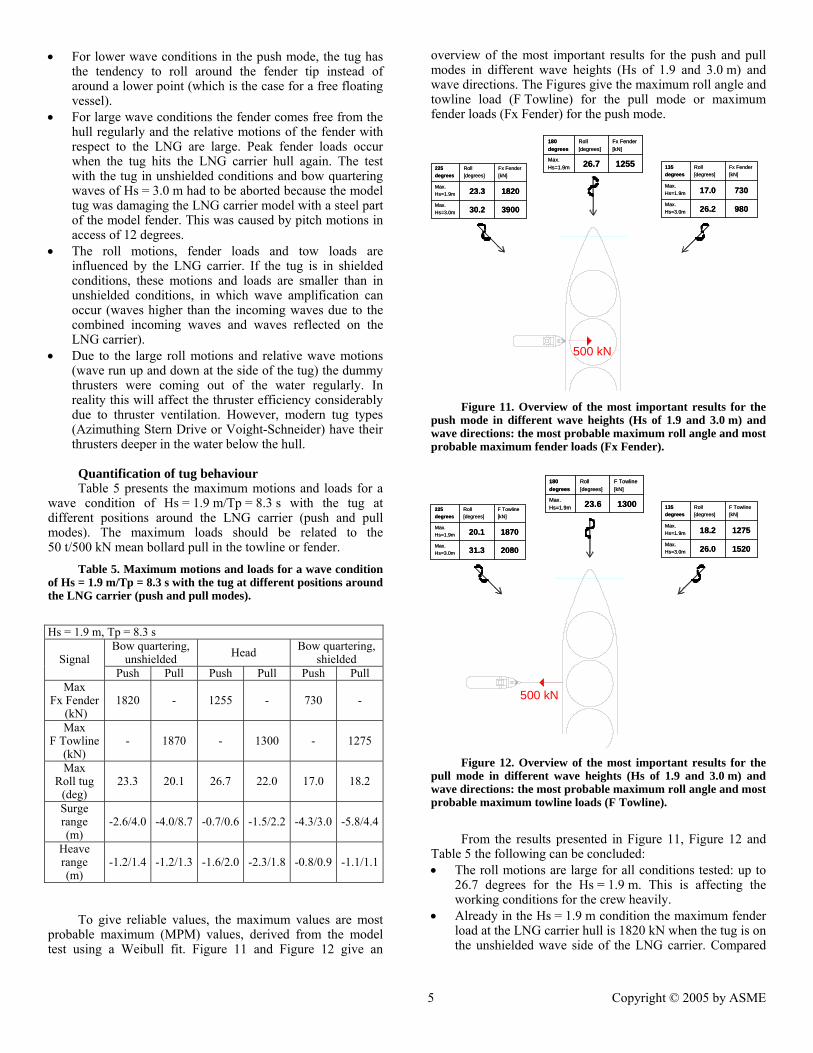
The pull mode was modelled by a weight attached to the
stern of the tug, representing the pull force of 500 kN/50 t. A 25 m Dyneema tow line with a 15 m long nylon tail was modelled between the LNG carrier and the bow of the tug. Figure 8 shows the schematization of the pull mode that has been used during the model tests.
Figure 8. Modelling of the pull mode.
3 Copyright © 2005 by ASME
Environment As the mooring of an LNG carrier along a floating or
fixed terminal will mainly take place in wave headings close to head waves for the LNG carrier, the present tests mainly focused on this type of wave headings, except for a lower beam sea. It should be noted that this type of wave headings, optimum for the LNG carrier mooring, are resulting in critical beam wave conditions for the assisting tugs.
Figure 9 shows the resulting head waves, bow quartering waves and beam waves for the LNG carrier and the tug in pull mode. All waves are assumed to have a JONSWAP spectral shape with a gamma value of 3.3.
270 deg
225 deg
180 deg
Figure 9. Head waves, bow quartering waves and beam
waves for the LNG carrier and the tug in pull mode.
Wave conditions around the assumed working limits of tugs assisting offshore operations were selected. For the bow quartering wave conditions a sea state with an Hs of 1.9 m was selected as base case, both with a longer (swell) period and a shorter (wind sea) period. In addition to this, a large sea state of 3.0 m was used as a sensitivity check for the wave height, see Table 2.
Table 2. Bow quartering waves.
Wave Direction [deg]
Hs [m]
Tp [s]
Wave spectrum Gamma
Quartering 225 1.9 14.0 JONSWAP 3.3 Quartering 225 1.9 8.3 JONSWAP 3.3 Quartering 225 3.0 8.3 JONSWAP 3.3
Depending on the position of the tug at the LNG carrier
the bow quartering waves represented a ‘shielded’ or ‘unshielded’ location for the tugs. For the head wave condition also both sea states with Hs = 1.9 m were used, see Table 3.
Table 3. Head waves.
Wave Direction [deg]
Hs [m]
Tp [s]
Wave spectrum Gamma
Head 180 1.9 14.0 JONSWAP 3.3 Head 180 1.9 8.3 JONSWAP 3.3
The beam wave was limited to a typical low swell
condition, see Table 4. Table 4. Beam waves.
Wave Direction [deg]
Hs [m]
Tp [s] Wave spectrum Gamma
Beam 270 0.95 14.0 JONSWAP 3.3 The present tests were carried out in a water depth of 98 m.
Limitations The present pilot tests have been designed to give the
best possible representation of the full scale situation. However, due to limited resources and practical considerations, still a number of limitations are present: • The tug had no active propulsion, there are only dummy
thrusters placed at the tug. As a consequence of this, no thrust degradation effects due to thruster performance in waves can be studied with the present tests.
• The tug has no active (heading) control, so the effects of the control of tug by its master cannot be studied.
• The tests have been performed in waves only, whereas in reality wind and current will affect the operability of the tug as well.
• A relatively old, rather narrow, hull type was used whereas modern tugs (Azimuthing Stern Drive or Voight-Schneider) have a large beam and fuller hull shape.
• There were no bilge keels or other roll reduction devices on the tug model.
• The possible effects of the terminal (such as the FSRU or GBS) were not considered.
• The present tests were carried out with one tug size and towing/fender arrangement, the sensitivity of the results for these aspects needs to be investigated in future research.
GENERAL OBSERVATIONS OF TUG BEHAVIOUR Qualitative evaluation The model test results confirmed that the motions of the
assisting tugs in waves are significant, even in wave conditions that are considered to be mild for the berthing and offloading LNG carriers that are assisted by the tugs.
The following visual observations were made: • Optimum wave headings for the berthing and mooring of
LNG carriers (close to head waves) are in fact critical beam wave conditions for the assisting tugs. This results in large roll motions of the tugs.
• Slack tow lines and peak loads occur often, especially when the pull tug is in unshielded conditions. Figure 10 shows an example of a time trace of the towline load (F Towline) in such a condition.
3000 3050 3100 3150 3200 3250 3300 3350 3400 3450 35000
200
400
600
800
1000
1200
1400
1600
1800Time trace F towline, unshielded conditions, Bow-Quartering waves, Hs=1.9m and Tp=8.3s
Time [s]
F to
wlin
e [k
N]
Figure 10. Time trace of the towline load (F Towline) with
typical slack lines events and peak loads (Hs = 1.9 m, Tp = 8.3 s, tug in unshielded conditions).
4 Copyright © 2005 by ASME
• For lower wave conditions in the push mode, the tug has the tendency to roll around the fender tip instead of around a lower point (which is the case for a free floating vessel).
• For large wave conditions the fender comes free from the hull regularly and the relative motions of the fender with respect to the LNG are large. Peak fender loads occur when the tug hits the LNG carrier hull again. The test with the tug in unshielded conditions and bow quartering waves of Hs = 3.0 m had to be aborted because the model tug was damaging the LNG carrier model with a steel part of the model fender. This was caused by pitch motions in access of 12 degrees.
• The roll motions, fender loads and tow loads are influenced by the LNG carrier. If the tug is in shielded conditions, these motions and loads are smaller than in unshielded conditions, in which wave amplification can occur (waves higher than the incoming waves due to the combined incoming waves and waves reflected on the LNG carrier).
• Due to the large roll motions and relative wave motions (wave run up and down at the side of the tug) the dummy thrusters were coming out of the water regularly. In reality this will affect the thruster efficiency considerably due to thruster ventilation. However, modern tug types (Azimuthing Stern Drive or Voight-Schneider) have their thrusters deeper in the water below the hull.
Quantification of tug behaviour Table 5 presents the maximum motions and loads for a
wave condition of Hs = 1.9 m/Tp = 8.3 s with the tug at different positions around the LNG carrier (push and pull modes). The maximum loads should be related to the 50 t/500 kN mean bollard pull in the towline or fender.
Table 5. Maximum motions and loads for a wave condition of Hs = 1.9 m/Tp = 8.3 s with the tug at different positions around the LNG carrier (push and pull modes).
Hs = 1.9 m, Tp = 8.3 s
Bow quartering, unshielded Head Bow quartering,
shielded Signal Push Pull Push Pull Push Pull
Max Fx Fender
(kN) 1820 - 1255 - 730 -
Max F Towline
(kN) - 1870 - 1300 - 1275
Max Roll tug
(deg) 23.3 20.1 26.7 22.0 17.0 18.2
Surge range (m)
-2.6/4.0 -4.0/8.7 -0.7/0.6 -1.5/2.2 -4.3/3.0 -5.8/4.4
Heave range (m)
-1.2/1.4 -1.2/1.3 -1.6/2.0 -2.3/1.8 -0.8/0.9 -1.1/1.1
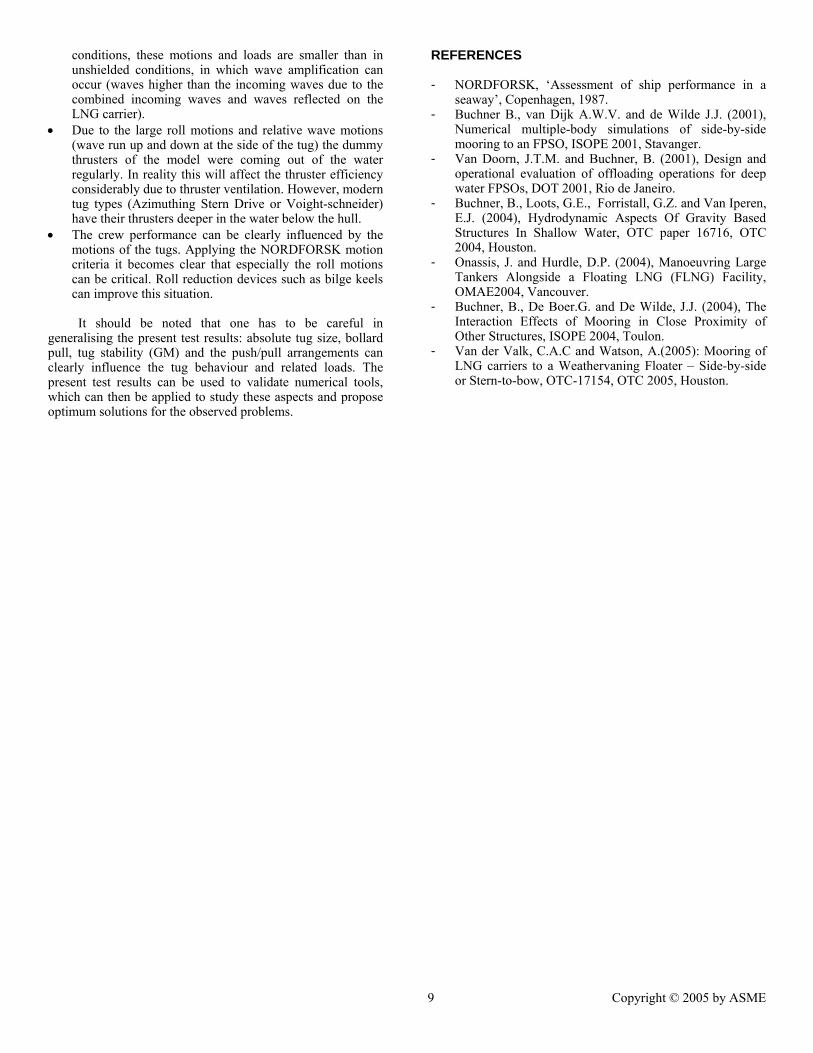
To give reliable values, the maximum values are most
probable maximum (MPM) values, derived from the model test using a Weibull fit. Figure 11 and Figure 12 give an
overview of the most important results for the push and pull modes in different wave heights (Hs of 1.9 and 3.0 m) and wave directions. The Figures give the maximum roll angle and towline load (F Towline) for the pull mode or maximum fender loads (Fx Fender) for the push mode.
500 kN
98026.2Max.Hs=3.0m
73017.0Max.Hs=1.9m
Fx Fender[kN]
Roll[degrees]
135degrees
98026.2Max.Hs=3.0m
73017.0Max.Hs=1.9m
Fx Fender[kN]
Roll[degrees]
135degrees
125526.7Max.Hs=1.9m
Fx Fender[kN]
Roll[degrees]
180degrees
125526.7Max.Hs=1.9m
Fx Fender[kN]
Roll[degrees]
180degrees
390030.2Max.Hs=3.0m
182023.3Max.Hs=1.9m
Fx Fender[kN]
Roll[degrees]
225degrees
390030.2Max.Hs=3.0m
182023.3Max.Hs=1.9m
Fx Fender[kN]
Roll[degrees]
225degrees
Figure 11. Overview of the most important results for the
push mode in different wave heights (Hs of 1.9 and 3.0 m) and wave directions: the most probable maximum roll angle and most probable maximum fender loads (Fx Fender).
500 kN
152026.0Max.Hs=3.0m
127518.2Max.Hs=1.9m
F Towline[kN]
Roll[degrees]
135degrees
152026.0Max.Hs=3.0m
127518.2Max.Hs=1.9m
F Towline[kN]
Roll[degrees]
135degrees
130023.6Max.Hs=1.9m
F Towline[kN]
Roll[degrees]
180degrees
130023.6Max.Hs=1.9m
F Towline[kN]
Roll[degrees]
180degrees
208031.3Max.Hs=3.0m
187020.1Max.Hs=1.9m
F Towline[kN]
Roll[degrees]
225degrees
208031.3Max.Hs=3.0m
187020.1Max.Hs=1.9m
F Towline[kN]
Roll[degrees]
225degrees
Figure 12. Overview of the most important results for the
pull mode in different wave heights (Hs of 1.9 and 3.0 m) and wave directions: the most probable maximum roll angle and most probable maximum towline loads (F Towline).
From the results presented in Figure 11, Figure 12 and
Table 5 the following can be concluded: • The roll motions are large for all conditions tested: up to
26.7 degrees for the Hs = 1.9 m. This is affecting the working conditions for the crew heavily.
• Already in the Hs = 1.9 m condition the maximum fender load at the LNG carrier hull is 1820 kN when the tug is on the unshielded wave side of the LNG carrier. Compared
5 Copyright © 2005 by ASME

to the bollard pull of 50 t/500 kN this is a dynamic amplification of almost 4 times! This can be critical for the hull of the LNG carrier. Special measures are necessary in the tug fender and LNG side construction to account for this type of loads.
• Having a certain shielding of the LNG carrier certainly helps: the maximum fender load reduced from 1820 kN to 1255 kN in head waves and 730 kN in shielded bow quartering waves.
• For the towline load in the pull mode something similar occurs: a most probable maximum load of 1870 kN is found in the unshielded Hs = 1.9 m.
• On the other hand this reduces less clearly in head and shielded bow quartering waves (to around 1300 kN and 1275 kN respectively). This is probably due to the fact that in the pull mode the tug is further away from the LNG carrier, which consequently provides less shielding to the tug than in the push mode.
• The surge motion range of the tug is large: more than 10 m in the pull mode.
SENSITIVITY CHECKS Wave height sensitivity In Table 6 a sensitivity check is presented with respect to
the wave height. In this Table the maximum motions and loads are given for a wave condition of Hs = 3.0 m/ Tp = 8.3 s with the tug at different positions around the LNG carrier (push and pull modes). Comparison with the results in Hs = 1.9 m shows the following: • 1.6 increase in significant wave height results in more
than a factor 2.1 higher fender load in the push mode with an unshielded tug. It should be noted that this test was aborted due to large loading and the maximum in a full test duration could have been (much) larger.
• For the shielded wave heading and the pull mode the difference is less clear. These loads increase less than linearly with the wave height.
Table 6. Maximum motions and loads for a wave condition of Hs = 3.0 m/ Tp = 8.3 s with the tug at different positions around the LNG carrier (push and pull modes).
Hs = 3.0 m, Tp = 8.3 s Bow quartering,
unshielded Bow quartering, shieldedSignal Push Pull Push Pull
Max Fx Fender (kN) 3900*) - 980
Max F Towline (kN) - 2080 - 1520
Max Roll tug (degrees) 30.2*) 31.3 26.2 26.0
Surge range (m) -5.3/12.1 -8.3/5.1 -9.1/6.8
Heave range (m) -1.9/1.9 -1.3/1.5 -1.7/1.9
*) Test aborted due to extreme loading
The unshielded situation is consequently the most critical and sensitive for the tug behaviour when it is close to the LNG carrier. This is due to: • the very non-linear system of a tug that can become free
from the side of the LNG carrier in large waves • the strong wave run up that can occur on the wave side of
the vessel. Wave period sensitivity Table 7 shows the effect of the wave period for the
present tug: instead of the peak period of 8.3 s a longer swell type wave of Tp = 14.0 s is used. The comparison with the shorter wave period is not consistent for all headings and tug modes: • For the push mode in unshielded conditions a clear
reduction in the loads can be observed (to approximately half the load level in the shorter period), but for the pull mode the trend is less clear.
• The roll motion of the tug has reduced significantly, which is due to the fact that the peak period is further away from the natural roll period of the tested tug model (9.9 s). This directly shows that one has to be careful in generalising the present results: tug stability and the related natural period can clearly influence the results. Something similar applies for the absolute tug size compared to the incoming wave length. Table 7. Maximum motions and loads for a wave condition
of Hs = 1.9 m/ Tp = 14.0 s with the tug at different positions around the LNG carrier (push and pull modes).
Hs = 1.9 m, Tp = 14.0 s Bow quartering,
unshielded Head Bow quartering, shielded Signal
push pull push pull push Pull Max
Fx Fender(kN)
820 - 670 - 720 -
Max F Towline
(kN) - 1640 - 865 - 1800
Max Roll tug
(deg) 11.6 16.0 12.1 14.6 9.5 12.0
Surge range (m)
-1.3/1.4 -3.5/4.1 -0.5/0.5 -1.4/1.2 -1.4/1.3 -4.7/6.2
Heave range (m)
-1.3/1.4 -1.3/1.4 -1.5/1.8 -1.7/1.7 -1.1/1.3 -1.4/1.4
Tug behaviour in LNG carrier beam seas Finally the situation of LNG carrier beam waves was
investigated, resulting in bow or stern waves for the tugs (depending on tug mode and tug position with respect to the LNG carrier). A low wave height (Hs = 0.95 m) was chosen because higher sea states would be unrealistic for the LNG carrier mooring in swell waves of Tp = 14 s. Table 8 shows the resulting motions and loads.
6 Copyright © 2005 by ASME

Table 8. Maximum motions and loads for a beam wave swell condition of Hs = 0.95 m/ Tp =14.0 s (push and pull modes).
Unshielded Shielded Signal Push Pull Push Pull Max Fx Fender
(kN) 970 - 730
Max F Towline (kN) - 2250 - 1175
Max Roll tug (degrees) 4.0 9.9 6.2 4.8
Surge range (m) -1.5/1.4 -4.0/7.5 -1.4/1.5 -3.2/2.4
Heave range (m) -1.0/0.9 -0.8/0.9 -0.6/0.8 -0.8/0.9
The results show large surge motions of the tug in the
pull mode. This is a result of the head wave condition for the tug and the long period wave. The resulting maximum towline load of 2250 kN is a factor of 4.5 higher than the bollard pull of the tug.
LOADING OF THE LNG CARRIER HULL For tug support of LNG carrier manoeuvring operations
in harbours and at terminals, typically ‘tug push points ’ are marked on the hull of the LNG carrier. The fender of the tug in the push mode should be applied at these points because this load is preferably applied to a rather stiff and strong vertical frame. However, in an offshore situation these loads are higher than the required push force. The point of application of this point also varies significantly, as will be shown below. This can result in unwanted point-type loads on the side shell of the LNG carrier (although the fender is distributing the load over an area of approximately 4 m2 when fully compressed).
Figure 13 shows the displacement of the fender over the hull of the LNG carrier in bow quartering waves of Hs = 1.9 m (left) and 3.0 m (right), both in shielded (bottom) and unshielded (top) conditions. These graphs clearly show that the fender is moving over a large part of the hull. Even in shielded conditions the smallest displacement window is 3 by 1 meter and this window increases rapidly to areas of more than 25 m2 in unshielded conditions. The fender load will consequently also be applied to locations between two vertical frames. The plate work between the two vertical frames is obviously more sensitive to deformation.
Figure 14 shows again the displacement of the fender tip over the hull of the LNG carrier, but now the related fender loads are given in the other axis. It can be observed from this Figure that the large loads on the hull are distributed over a large horizontal area. Further the highest fender loads seem to occur higher up the side shell of the LNG carrier.
These aspects certainly have to be taken into account in the decisions about tug operational procedures, the choice of equipment and the design of the LNG carrier hull.
-4 -2 0 2 4 6 8-5
-4
-3
-2
-1
0
1
2
3Displacement of Fender relative to LNG carrier hull, Unshielded conditions, bow quartering waves Hs=1.9m Tp=8.3s
Horizontal displacement [m]
Ver
tical
dis
plac
emen
t [m
]
-4 -2 0 2 4 6 8-5
-4
-3
-2
-1
0
1
2
3Displacement of Fender relative to LNG carrier hull, Unshielded conditions, bow quartering waves Hs=3.0m Tp=8.3s
Horizontal displacement [m]
Ver
tical
dis
plac
emen
t [m
]
-4 -2 0 2 4 6 8-5
-4
-3
-2
-1
0
1
2
3Displacement of Fender relative to LNG carrier hull, Shielded conditions, bow quartering waves Hs=1.9m Tp=8.3s
Horizontal displacement [m]
Ver
tical
dis
plac
emen
t [m
]
-4 -2 0 2 4 6 8-5
-4
-3
-2
-1
0
1
2
3Displacement of Fender relative to LNG carrier hull, Shielded conditions, bow quartering waves Hs=3.0m Tp=8.3s
Horizontal displacement [m]
Ver
tical
dis
plac
emen
t [m
]
Figure 13. Two-dimensional time traces (Y-Z) of the
relative motion of the fender tip relative to the LNG carrier hull. The horizontal axis gives the horizontal displacement (range -4 to+8 m), the vertical axis the vertical displacement (range -5 to +3 m). The top figures show the unshielded bow quartering waves of Hs = 1.9 m (left) and Hs = 3.0 m (right). The bottom figures show the shielded bow quartering waves of Hs = 1.9 m (left) and Hs = 3.0 m (right).
Figure 14. Plots of the fender impact loads as function of
horizontal (left figures) and vertical (right figures) displacement of the tug fender relative to the LNG carrier. The top figures show the unshielded bow quartering waves of Hs = 1.9 m. The bottom figures show the unshielded bow quartering waves of Hs = 3.0 m.
ASSESSMENT OF TUG CREW PERFORMANCE IN WAVES
Beside the limits imposed by the large loads in fenders
and towlines, the safety and performance of the crew is an important factor in the workability of the tug in waves. The NORDFORSK ‘Assessment of ship performance in a seaway’
7 Copyright © 2005 by ASME

identifies different types of work or operations at different locations onboard which impose different levels of motions and accelerations as limiting criteria. Figure 15 shows the five areas as identified by NORDFORSK (1987):
1. Fore perpendicular Heavy manual work 2. Bridge Intellectual work 3. Amidships Transit passengers 4. ¼ of ships length from aft Heavy manual work 5. Aft perpendicular Light manual work
3 5 4
2
1
Figure 15. Definition of positions on the tug.
For tugs assisting LNG carriers during berthing and departure operations, locations 1, 2 and 4 were identified as the working areas. The limiting conditions for these locations are given by NORDFORSK in terms of RMS (Root Mean Square/Standard deviation) values. These are defined in Table 9.
Table 9. The limiting conditions for the 4 locations are
given by NORDFORSK in terms of RMS (standard deviation) values.
Max acceleration Location Vertical Lateral Max roll
1 0.15g 0.07g 4.0 deg 2 0.10g 0.05g 3.0 deg 4 0.15g 0.07g 4.0 deg
Applying these limiting conditions to the test results, the
following observation were made: • The maximum RMS value of vertical accelerations is not
exceeded at one of the three locations in any wave condition.
• The maximum RMS value of lateral acceleration is not exceeded at location 1 and 4. At location 2, the bridge, the lateral accelerations are exceeded during bow quartering waves of Hs = 3.0 m and Tp = 8.3 s in the pull mode, and at beam waves of Hs = 1.9 m and Tp = 8.3 s for both the pull mode as well as the push mode.
• The RMS values for roll are exceeded during most model tests. Figure 16 shows the RMS values for roll in different sea states in unshielded conditions.
2
4
6
8
30
210
60
240
90
270
120
300
150
330
180 0
RMS Roll Motions Tug in Push Mode, Unshielded
Wave Direction
RM
S R
oll [
degr
ees]
ο Hs=1.9m Tp=8.3s
+ Hs=1.9m Tp=14.0s
* Hs=1.9m Tp=8.3s
x Hs=1.9m Tp=14.0s
∇ Hs=3.0m Tp=8.3s
♦ Hs=0.95m Tp=14.0s
Figure 16. RMS values for the roll motion of the tug in
push mode in different sea states. (RMS values for the tug in shielded conditions are on average 20% lower)
Although these results are clearly a function of the natural period of the tug and the application of roll reduction devices (which were not present in the present tests), it can be concluded that the roll behaviour of the tug is one of the critical factors for the operability of the tugs in waves.
CONCLUSIONS
Based on the results presented in this paper, it can be
concluded that the motions of tugs in waves can be significant, even in wave conditions that are considered to be mild for the berthing and offloading LNG carriers that are assisted by these tugs. The resulting push or pull loads may hamper these tug operations significantly. For the present tug and configuration the following results were found (one should be careful in generalizing them): • Optimum wave headings for the berthing and mooring of
LNG carriers (close to head waves) are in fact critical beam wave conditions for the assisting tugs. This results in large roll motions of the tugs (up to 26.7 deg for an Hs of 1.9 m).
• Slack tow lines and peak loads occur often, especially when the pull tug is in unshielded conditions. A maximum tow load of 1870 kN is found in the unshielded Hs of 1.9 m.
• For the push mode the fender loads are high as well. In the Hs=1.9 m condition the maximum fender load on the LNG carrier hull is 1820 kN when the tug is on the unshielded wave side of the LNG carrier. Compared to the bollard pull of 500 kN this is a dynamic amplification of almost 4 times. This can be critical for the hull of the LNG carrier. Special measures are necessary for the tug fender design and LNG side construction to account for this type of loads over a large area of the side shell.
• The roll motions, fender loads and tow loads are influenced by the LNG carrier. If the tug is in shielded
8 Copyright © 2005 by ASME
conditions, these motions and loads are smaller than in unshielded conditions, in which wave amplification can occur (waves higher than the incoming waves due to the combined incoming waves and waves reflected on the LNG carrier).
• Due to the large roll motions and relative wave motions (wave run up and down at the side of the tug) the dummy thrusters of the model were coming out of the water regularly. In reality this will affect the thruster efficiency considerably due to thruster ventilation. However, modern tug types (Azimuthing Stern Drive or Voight-schneider) have their thrusters deeper in the water below the hull.
• The crew performance can be clearly influenced by the motions of the tugs. Applying the NORDFORSK motion criteria it becomes clear that especially the roll motions can be critical. Roll reduction devices such as bilge keels can improve this situation. It should be noted that one has to be careful in
generalising the present test results: absolute tug size, bollard pull, tug stability (GM) and the push/pull arrangements can clearly influence the tug behaviour and related loads. The present test results can be used to validate numerical tools, which can then be applied to study these aspects and propose optimum solutions for the observed problems.
REFERENCES
- NORDFORSK, ‘Assessment of ship performance in a seaway’, Copenhagen, 1987.
- Buchner B., van Dijk A.W.V. and de Wilde J.J. (2001), Numerical multiple-body simulations of side-by-side mooring to an FPSO, ISOPE 2001, Stavanger.
- Van Doorn, J.T.M. and Buchner, B. (2001), Design and operational evaluation of offloading operations for deep water FPSOs, DOT 2001, Rio de Janeiro.
- Buchner, B., Loots, G.E., Forristall, G.Z. and Van Iperen, E.J. (2004), Hydrodynamic Aspects Of Gravity Based Structures In Shallow Water, OTC paper 16716, OTC 2004, Houston.
- Onassis, J. and Hurdle, D.P. (2004), Manoeuvring Large Tankers Alongside a Floating LNG (FLNG) Facility, OMAE2004, Vancouver.
- Buchner, B., De Boer.G. and De Wilde, J.J. (2004), The Interaction Effects of Mooring in Close Proximity of Other Structures, ISOPE 2004, Toulon.
- Van der Valk, C.A.C and Watson, A.(2005): Mooring of LNG carriers to a Weathervaning Floater – Side-by-side or Stern-to-bow, OTC-17154, OTC 2005, Houston.
9 Copyright © 2005 by ASME


