THE BEHAVIOR OF TOTAL LIGHTNING ACTMTY … BEHAVIOR OF TOTAL LIGHTNING ACTMTY ... was "going like...
34
• c , THE BEHAVIOR OF TOTAL LIGHTNING ACTMTY IN SEVERE FLORIDA THUNDERSTORMS Earle Williams Parsons Laboratory Massachusetts Institute of Technology Cambridge, Massachusetts 02139 Bob Boldi, Anne Matlin, and Mark Weber Massachusetts Institute of Technology Lincoln Laboratory Lexington, Massachusetts 02420-9185 Steve Hodanish and Dave Sharp National Weather Service Melbourne, Florida 32935 Steve Goodman, Ravi Raghavan, and Dennis Buechler NASA Marshall Space Flight Center Huntsville, Alabama 35806 Submitted to the Special Issue of Atmospheric Research In Honor of Bernard Vonnegut July 1998 https://ntrs.nasa.gov/search.jsp?R=19980236669 2018-07-09T04:00:00+00:00Z
Transcript of THE BEHAVIOR OF TOTAL LIGHTNING ACTMTY … BEHAVIOR OF TOTAL LIGHTNING ACTMTY ... was "going like...

• c ,
THE BEHAVIOR OF TOTAL LIGHTNING ACTMTY
IN SEVERE FLORIDA THUNDERSTORMS
Earle Williams
Parsons Laboratory
Massachusetts Institute of Technology
Cambridge, Massachusetts 02139
Bob Boldi, Anne Matlin, and Mark Weber
Massachusetts Institute of Technology
Lincoln Laboratory
Lexington, Massachusetts 02420-9185
Steve Hodanish and Dave SharpNational Weather Service
Melbourne, Florida 32935
Steve Goodman, Ravi Raghavan, and Dennis Buechler
NASA Marshall Space Flight CenterHuntsville, Alabama 35806
Submitted to the Special Issue of Atmospheric ResearchIn Honor of Bernard Vonnegut
July 1998
https://ntrs.nasa.gov/search.jsp?R=19980236669 2018-07-09T04:00:00+00:00Z
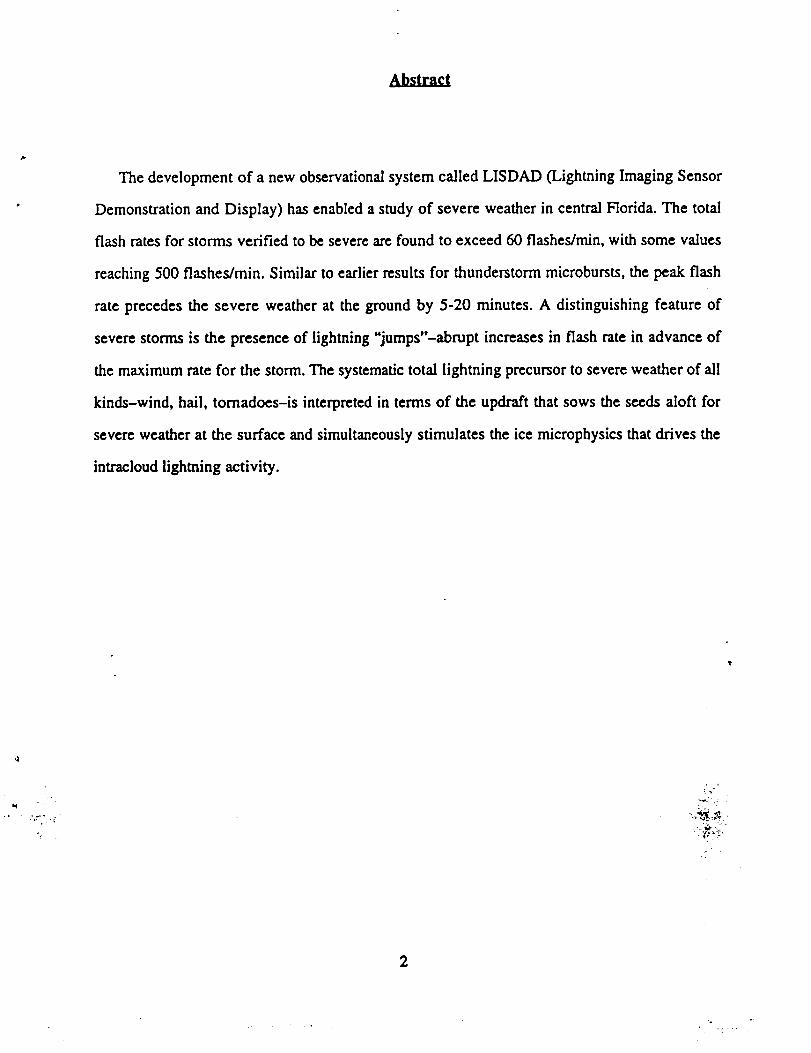
Abstract
The development of a new observational system called LISDAD (Lightning Imaging Sensor
Demonstration and Display) has enabled a study of severe weather in central Florida. The total
flash rates for storms verified to be severe are found to exceed 60 flashes/rain, with some values
reaching 500 flashes/min. Similar to earlier results for thunderstorm microbursts, the peak flash
rate precedes the severe weather at the ground by 5-20 minutes. A distinguishing feature of
severe storms is the presence of lightning "jumps"-abrupt increases in flash rate in advance of
the maximum rate for the storm. The systematic total lightning precursor to severe weather of all
kinds-wind, hail, tornadoes-is interpreted in terms of the updraft that sows the seeds aloft for
severe weather at the surface and simultaneously stimulates the ice microphysics that drives the
intracloud lightning activity.
bl
2

1. INTRODUCTION *
This study is concerned with the electrification of severe weather, an appropriate topic for
this Special Issue in honor of Bernard Vonnegut. The first examination of electrification in a
tornadic supercell storm is found in "Giant Electrical Storms" (Vonnegut and Moore, 1958), a
work inspired by Vonnegut's personal observations of the renowned Worcester, Massachusetts
storm in June 1953. This event strongly influenced Vonnegut's career as a scientist, as it
stimulated his early thinking about the role of convection in the electrification of storms
(Vonnegut, 1953) and the relationship between electricity and tornadoes (Vonnegut, 1960).
Vonnegut and Moore (1958) also drew important attention to issues that remain with us today in
the context of severe thunderstorms: (1) the extraordinarily high flash rates dominated by
intracloud lightning; (in Vonnegut's words, the Worcester storm was "going like gangbusters" as
it went out to sea late that evening); (2) the extraordinary updraft velocities (>100 m/s) inferred
from simple parcel theory considerations; (3) the possible inconsistency between the observed
radar cloud top height and conventional pseudoadiabatic parcel theory; (4) the evidence for
electrification and lightning in a large region of the upper storm, likely devoid of supercooled
water-an essential ingredient for the presently favored precipitation mechanism for thunderstorm
electrification; and (5) the possibility of a negatively charged cloud top in this superlative storm.
Several of these issues will be revisited later in this paper.
The Worcester storm studied by Vonnegut and Moore (1958) was also one of three major
events in 1953 that together focused national attention on severe weather and its formal
definition (D. Burgess, personal communication, 1998). Today, severe weather is defined by
specific thresholds in wind, hail size and vorticity. All of these phenomena have close physical
"This workwas sponsored by the NationalAeronauticsand Space Administration.The viewsexpressedare thoseofthe authorsanddo notreflect the officialpolicy or position of the U.S. Government.t Opinions,Interpretations,conclusions,and recommendationsare thoseof the authorsand are notnecessarilyendorsedby the United StatesAir Force.Correspondingauthoraddress:Eade Williams,MassachusettsInstituteofTechnology,77 MassachusettsAve., Cambridge,Massachusetts02139.

connections with vertical drafts in deep convection, that are themselves not directly measured
with scanning Doppler radars of the NEXRAD type. Cloud electrification and lightning are
particularly sensitive to these drafts because they modulate the supply of supercooled water that
is the growth agent for the ice particles (ice crystals, graupel and hail) believed essential for
electrical charge separation. For these reasons, one can expect correlations at the outset between
lightning activity and the development of severe weather that may aid in understanding and
predicting these extreme weather conditions. The exploration of these ideas historically has been
impeded by lack of good quantitative observations. A recent review of results on severe storm
electrification (Williams, 1998) indicates a general absence of cases for which total lightning
activity is documented over the lifetime of a severe storm. The recent development of LISDAD
(Lightning Imaging Sensor Data Application Display) (Boldi, et al., 1998; Weber, et al., 1998)
has largely remedied this problem. The LISDAD has been used in central Florida to quantify the
behavior of total lightning in all types of severe weather.
2. FORMAL SEVERE WEATHER CRITERIA AND THEIR CONNECTION WITH
VERTICAL DRAFTS
Severe weather is characterized by at least one of the following three conditions, according to
present National Weather Service criteria: (1) hailstones on the ground with effective diameters
greater than 0.75 inches; (2) a sustained surface wind in excess of 50 knots; and (3) the
occurrence of a tornado. All of these surface conditions have their seeds in vertical storm drafts,
the quantity most elusive to direct observations by Doppler radar but a quantity strongly
connected with cloud electrification and lightning. The systematic behavior of total lightning
aloft relative to severe weather at the ground in this study warrants some discussion of these
physical relationships.
4

Severe Hail
Hail growth relies on particle levitation in a vertical airstream of supercooled water. Some
estimates of the updraft strength required for hailstones of various diameters is therefore
provided by the computation of the hailstone fall speed. Results in Figure 1 indicate that a
vertical velocity of 29 m/s is needed to levitate a hailstone with the critical 3/4-inch diameter.
(Fortunately, this air speed is very close to the severe wind speed of 50 knots to be addressed in
the next subsection.) The reduction in size due to melting in the fall to the ground from the 0°C
isotherm will obviously require still larger drafts aloft to account for the critical size at the
ground.
100
5O
_'10
It.w
50
n_
2
NON SEVERE > _ SEVEREI I I II I ...]2 5 10 20 50 100
PARTICLE DIAMETER (mm)
Figure 1. Fall speed of ice spheres vs. sphere diameter at an altitude of 6 km MSI..

Extreme wind at the surface in the vicinity of thunderstorms is often the result of a downdraft
aloft. Mechanisms for downdrafts-gravitational loading by precipitation and cooling by
evaporation and melting of condensate-have their origins in the updraft and are expected to be
enhanced by stronger updrafts. The observed tendency for intracloud lightning to precede
thunderstorm microbursts (Goodman, et al., 1988; Williams, et al., 1989; Malherbe, et al., 1992;
Stanley, et al., 1997) is consistent with this general scenario. It is important to note however that
the great majority of microburst winds do not exceed the formal 50-knot criterion and hence are
not formally severe (Williams, 1998).
Tornadoe_
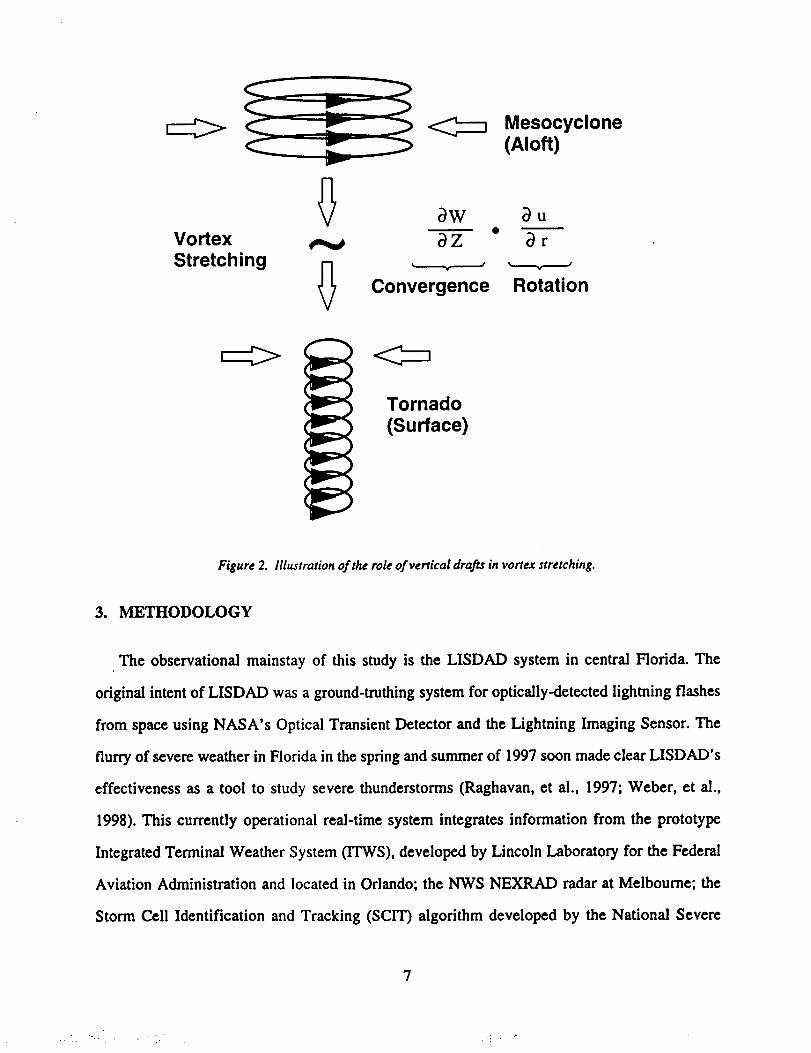
Tornadoes are intense vortices with a dominant vertical component of angular momentum.
Despite numerous theories for tornadogenesis, one feature common to all is the vertical
stretching of vorticity that is modulated by the vertical gradient of vertical draft speed w (i.e.,
dw/dz), as illustrated schematically in Figure 2. For severe storms whose vertical scale is
strongly constrained by the tropopause, vertical stretching will be largely controlled by the
magnitude of the drafts. Evidence will be presented later in this paper that both updrafts and
downdrafts are stretching vertical vorticity.
6
C L_
C "-
Vortex
Stretching
_w_Z
Convergence
Mesocyclone(Aloft)
_)U
Y
Rotation
Tornado
(Surface)
Figure 2. Illustration of the role of vertical drafts in vortex stretching.
3. METHODOLOGY
The observational mainstay of this study is the LISDAD system in central Florida. The
original intent of LISDAD was a ground-truthing system for optically-detected lightning flashes
from space using NASA's Optical Transient Detector and the Lightning Imaging Sensor. The
flurry of severe weather in Florida in the spring and summer of 1997 soon made clear LISDAD's
effectiveness as a tool to study severe thunderstorms (Raghavan, et al., 1997; Weber, et al.,
1998). This currently operational real-time system integrates information from the prototype
Integrated Terminal Weather System (1TWS), developed by Lincoln Laboratory for the Federal
Aviation Administration and located in Orlando; the NWS NEXRAD radar at Melbourne; the
Storm Cell Identification and Tracking (SCIT) algorithm developed by the National Severe

Storms Laboratory (Johnson, et al); the Lightning Detection and Ranging (LDAR) system at the
Kennedy Space Center (Lennon and Maier, 1991); and the National Lightning Detection
Network (NLDN). The LISDAD system offers substantial improvements over the traditional
short-term field experiment in the investigation of thunderstorms. The real-time, round-the-clock
operation virtually guarantees capture of all interesting events. Furthermore, the direct exposure
and use by operational NWS forecasters provides insights about systematic features of the
observations as they occur. Finally, the different data sets that were rather laboriously assembled
in the traditional field experiment after the fact are now available for integrated replay and
inspection immediately following the events of interest.
The emphasis on total lightning as a diagnostic for severe weather in the LISDAD results
gives the LDAR radiation data special importance. The viability of LDAR for accurately
detecting and mapping both intracloud and cloud-to-ground lightning flashes has been verified
through more than 25 years of operation at the NASA Kennedy Space Center (KSC). Its
successful use during the TRIP (Thunderstorm Research International Program) in the 1970's
(Lhermitte and Krehbiel, 1979; Lhermitte and Williams, 1985) demonstrated 50-100 meter rms
errors in source locations for storms directly over KSC, based on observations from two
independent arrays of radio receivers. More recent studies in Orlando with the Office National
d'Etudes and de Recherches Aerospatiale (ONERA) 3D lightning interferometer (Mazur, et al.,
1997) demonstrate reliable detection of lightning at a range of 50 kin, though with an attendant
degradation of location accuracy. Some LDAR radiation is detected from storms on Florida's
west coast at distances from KSC exceeding 200 km. For the rapidly migrating mesocyclones of
interest in this study, analysis to distances up to about 100 km from KSC will be considered.
The LDAR data stream currently ingested by LISDAD consists of individual radio source
locations (x,y,z,t) that have been independently verified by the two independent arrays of
receivers at KSC. This data stream is used to create an LDAR flash rate, a measure of the total
flash rate for individual thunderstorm cells identified by SCIT. In this procedure, any source that

occurswithin 300 msecanda distanceD(r) of a previous source is placed into the same flash as
the previous source. The function D(r) reflects both the typical size of storm cells and the
decreasing accuracy of the LDAR system as the range (r) from the LDAR system increases. For
sources close to the LDAR network, D(r) is 5 km and reflects the size of thunderstorm cells. For
sources far from the LDAR network, D(r) primarily reflects the accuracy of the LDAR system
and is 30 km. A flash can remain active for up to 5 seconds. The number of flashes generated
from a set of sources is not very sensitive to the exact values of the distance window D(r) or the
time window (300 msec). Experiments were performed wherein these values were doubled, with
less than a 20 percent change in the number of flashes generated from a given set of sources.
This indicates that the flashes are relatively compact in space-time coordinates. Many of the
flashes (more than 10 percent) are composed of just a single source. Such flashes have been
given the name 'singletons'. The percentage of all LDAR flashes that are singletons increases
from 12 percent to 30 percent as the distance from the LDAR network to the flash increases from
within 25 km to greater than 50 km. Further details can be found in a recent paper by Boldi, et al
(1998).
The assignment of flashes to specific storm cells is identical for NLDN ground flashes and
LDAR flashes: (1) advect the positions of the cells detected by the SC1T algorithm to the current
time using the ITWS track vectors provided for the respective cells; (2) assign the flash to all
cells within 5 km of the flash location; and (3) if no cell is found within 5 km, then assign the
flash to the closest cell if that cell is within 35 km of the flash location. Using these rules, about
95 percent of the flashes are assigned to a single cell, with the remainder of the flashes being
evenly split between 0 and 2 cell assignments per flash. In examining the fast-moving supercells
discussed in this paper, it was discovered that rule 1 (cell advection) has a large influence on the
computed minute-to-minute flash rates when cells move a distance about equal to their mean
intercell spacing (20-50 km) in the time required for the NEXRAD radar update (five minutes).

For more detailed analysis of the storm structure in the vertical beyond the real-time
processing capability of LISDAD, the original Melbourne Doppler radar data have been analyzed
after the fact. This includes the hand extraction of maximum reflectivity and mesocyclonic
velocity on a tilt-by-tilt basis.
All truth on severe weather otherwise documented with LISDAD remote sensing is based on
observer reports. This aspect of the study is judged to be the least quantitative and most
susceptible to sampling limitations. Errors in the times for severe weather events are difficult to
specify.
4. GENERAL RESULTS
Although the focus of this study is on all types of severe weather in central Florida, it is
useful to begin with some more general results from LISDAD that pertain to ordinary
(nonsevere) thunderstorms as well as the broad spectrum of severe weather in all seasons. The
use of the same rules to compute total flash rates in all thunderstorms regardless of their size and
severity helps to place the results for extreme instability and shear in context.
The pop-up box feature in LISDAD (Boldi, et al., 1998) has been used to study the lightning
histories of numerous Florida thunderstorms of all types. Severe thunderstorms have been
identified on the basis of surface observer reports of hail (dime size or greater), strong wind
(trees blown down), or the occurrence of a tornado. Figure 3 summarizes the peak flash rates
(LDAR for total lightning) for all cases. The most likely maximum flash rate, associated with
small, nonsevere thunderstorms in great abundance, is in the range of 1-10 per minute. A vertical
dashed line is indicated at a flash rate of 60 fpm (1 flash per second). To a large extent, the
storms are organized into nonsevere and severe categories on the basis of peak flash rate alone
(with one important caveat to be discussed presently). No severe cases were found with a peak
flash rate less than 60 fpm. For higher flash rates, the majority of cases were identified as severe.
However, numerous eases with high flash rates (one as high as 500 fpm) were found with no
10

confirmation of severe conditions. Some of these high flash rate cases occurred over sparsely
populated areas where hail (for example) may have been missed. A few cases of high-flash-rate
storms over heavily populated areas suggest that severe storm status was not attained.
Distribution of Maximum Total Flash Rate
20-11 _1 Florida (1996-1998) LISDADII _-I [1 Non-Severe Thunderstorm
II Severe Thunderstorm8'_ 10tl _ In_ li I
E 5Z
00 100 200 300 400 500 600
LDAR Flashes per Minute
Figure 3. Peak flash rates for Florida thunderstorms based on LDAR observations.
The largest LDAR flash rates observed are in the vicinity of 500-600 fpm. The two dry
season supercells discussed in Section 5 both lie in this tail of the flash rate distribution in Figure
3.
• The fraction of thunderstorms found to be severe in Figure 3 is surely larger than one might
find climatologically in Florida. This disproportionality is the result of the emphasis given to
severe weather cases when a systematic behavior in the flash rate evolution became apparent in
the early LISDAD observations.
The most obvious and systematic characteristic of severe thunderstorms is the rapid increase
in intracloud flash rate 1-15 minutes in advance of the severe weather manifestation at the
ground. These increases, termed lightning 'jumps', vary in magnitude from about 20 to over 100
fpm per minute. Specific examples of jumps in specific severe thunderstorms can be seen in
11
..4 -

Figures 6-8. The precursory nature of the lightning jump appears to pertain not just to hail but to
all severe weather, including strong wind and tornadoes. A schematic history of total flash rate
for a severe Florida thunderstorm is shown in Figure 4 where three characteristic times (t 0, t 1,
and t2) are shown. Time to marks the lightning jump, t 1 the peak LDAR flash rate, and t2 the
severe weather on the ground. A summary of such values for a wide range of Florida severe
storm cases is shown in Table 1. On average, the recorded values are consistent with the
evolution depicted in Figure 4. This table also includes values for peak flash rate (LDAR and
NLDN) and estimates of the magnitudes of the precursory lightning jumps. The majority of the
information in Table 1 (exclusive of surface observer reports) was obtained by playback of
individual cases initially identified by NWS or Lincoln Laboratory 0TWS) personnel.
to tl t 2
"jump" Peak SevereWeather
Figure 4. Schematic lightning history in a Florida thunderstorm with tO = jump time; tI = peak flash rate;
and t2 = time of severe weather. Based on calculations of mean time differences from Table 1, if tO = O,
then t I = Z4 rain and t2 = 16 mitt
12

The existenceof lightning jumps is perhaps the most obvious departure from steady-state
behavior for the severe thunderstorms studied. The noted association between enhanced
electrification and the growth of ice particles aloft in the mixed-phase environment would
suggest that the jumps are an accompaniment of strong upsurges in air motion aloft. LISDAD
evidence supports the idea that the upsurges are linked with the growth of large hail. Figure 5
shows the magnitude of the lightning jump versus the maximum hailstone diameter reported on
the ground for all hail cases in Table 1 observed with LISDAD. The positive correlation here
supports a physical connection with stronger electrification associated with stronger upsurges
and larger hail. Rough extrapolation downward to the millimeter-sized graupel characteristic of
ordinary non-severe thunderclouds suggests lightning jumps less than 10 fpm per minute,
consistent with observations.
The systematic flurry of intracloud lightning activity prior to tornadoes and waterspouts in
this study (Table 1) and in Goodman, et al (1998), is not without precedent. Taylor identified
peak intracloud flash rates 10-15 minutes prior to some tornadoes in the 1970s (W. Taylor,
personal communication, 1996). MacGorman (1993) documented a maximum in intracloud
lightning prior to the Binger tornado in 1986. The similar lightning signatures for both tornadoes
and waterspouts in the study lead us to draw no particular physical distinction between these two
phenomena.
13

100
I--OHm
EC
E
e"
m
D.E
O1i-
C
e--O_.J
rr<r_--I
90
80
70
60
50
40
30
20
10
0
|
SevereThreshold
0.5 1.0 1.5
Maximum Hailstone Diameter (inches)
2.0
Figure 5. Lightning _ump ' vs. maximum hailstone size. These results are drawn from Table 1.
14

Table 1.
LISDAD Severe Storm Summary
1998
Feb 23
Feb 23
Feb 23
Feb 23
1997
April 23
May 22June 2
June 13
July 1July 1
July 5
July 6
July 6
July 7
July 8
July8
July8July 9
Juh/9Ju_9July9
July 11
July 12July 15
July 16
July 16
July 29
Juh/31AuquSt 23Oct ober 31
1996
Auqu=10AucJus! 14
August 16
SevereWeather
DescdptlonNSSL SCIT
Cell ID#
tornado 16 567
Iomado 9 69 23
lomado 9 410 98
lomado
tomado/hail
1" hail/wind
waterspoutnickel size hail
16
13
TotalUghtning: Cloud-to-Ground
Peak LDAR LDAR Lightning Ughtnlng: NLDNFlash Rate 'Jump' Peak Rate
(flashes/mln) (flasheI/mln/mln) (flasheI/mln)
163
187
195290
4O
410
12
6
9
47 10
6O 475
3O90
dime size hail 9 106 62
dime to quarter 18 130 32size hail
9 170 32
23
2,519
196, 11
12
_qnd damacjewaterspout
wind damage;dime size hail
qolfball hailnickel size hail
wind damaqe
wind damaqe_qnd; quarter
size hailwind
17
86
dime size had
225
425
180
170
120215
60325
325
170
2OO
140
quarter sizehail
tornado/water
spout1.25 inctl hall
3O0
golf ball sizehail
ojolf ball haildime size hail
78
35
85
50
32
2O50
30
65
65
50
44
70
5
2
10
4
5
5
2
21
2O
198
2O
2O
dime size hall 10 116 22
funnel ck:)ud; 6 550 220 18wind
2 270 221
w_nd 310
so
8O
6O
100
28
14
100
1914w_nd
wind
waterspoutno severe
w@athcr r_rt
AucJusl 16 . 18 250 80
to = time of rapid increase in LDAR flash rate (the lightning 'jump')
h= time of peak LDAR flash rate
t2 = time of first observer report of storm severity
514 44 21
2 240 70 10
10
t= (UT) t, (UT) t= (UT)
0307 0324 0355
0423 0429 0437
0500 0506 0510
0528 0532 0540
1237 1242 13201838 1849 1847-1852
2214 2236 2300
1852 2003 2110
2013 2017 2005
2033 2045 2045
1707 1721 1730
1829 1830 1842
1938 1945 2001
2334 2344 2350
1941 1947 1948
2007 2027 2035
2121 2131 21301844 1850 1900
1920 1922 1924
2132 2140 2143
2132 2140 2208
1730 1746 1758
2103 2117 2140
2033 2035 2058
2027 2030 2038
2323 2325 2330
2112 2114 2124
2017 2032 2035
2032 2034 2030
2032 2045 2045
2204 2208 ?1952 1954 2025
2051 2054 no rel:X:Xl
2040 2056 no repoa
5. CASE STUDIES
The systematic evolution of events depicted schematically in Figure 4 is now demonstrated
for three specific cases drawn from Table I: a hail case (May 22, 1997), a wind case (Oct. 31,
15
1997), and a tornado case (Feb. 23, 1998). The purpose of these comparisons is further
clarification of the physical basis of the precursor signals in total lightning.
The evolution of total flash rate and maximum differential velocity at low levels for the May
22, 1997 Orlando hail storm are shown in Figure 6. Isolated convection developed shortly after
noon local time to the northwest of Orlando International Airport on this day. Within the next
hour, new growth took place throughout the terminal area. The storm in question was too far
from Melbourne to disclose the outflow history with the NEXRAD radar, and so the Orlando
Terminal Doppler Weather Radar (TDWR) was used for this purpose. Richard Ferris, the ITWS
site manager, observed oblate hailstones with diameters in the range of 3/4 inch to one inch at the
site in the interval 1847-1852 UT, as shown in Figure 6. The strongest outflow of the day (72
knots) was recorded by the TDWR at 1856 UT within 8 km of Ferris's location. This storm
therefore took on severe status on the basis of both the hail and the microburst wind.
16

30Q139-1
3OO
C
2_
150
7O
i-og _
m 20
10
22 MAY 1997ISOLATED SEVERE STORM
- 1" HAIL
"Jum_
I I I I I I
1 ° DIAMETERHAIL ON GROUND
-! ! I
1
/
i i I• e i
Wind
l I I I I I1810 1820 1830 1840 1910 1920
e
e
!e
e
e
e
o
e
e
I IDamaging
WindI I
TIME {LIT)
IIg30
Figure 6. May 22, 1997 hailstorm with severe microburst near Orlando.
a. history of total lightning flash rate, and
b. history of differential radial Doppler velocity at the surface.
17
The lightning 'jump' phenomenon was recorded by LISDAD prior to both microbursts (at
1821 UT and 1838 UT), with the second, larger jump (75 fpm per minute) preceding the arrival
of hail by about nine minutes. It is interesting that the large hail precedes the maximum outflow
by four to seven minutes, a possible suggestion that the loading and melting effects of the
smaller-size precipitation are playing the major role in forcing the microburst, and the large hail
fell out early on account of its significantly larger fall speed. The seven-minute lead times
between peak flash rate and peak outflow agree very well with results for non-severe storms
(Goodman, et al., 1988; Williams, et al., 1989; Laroche, et al., 1991; Malherbe, et al.,. 1992;
Stanley, et al.,. 1997), suggesting a similar physical basis for the precursor in both types of
storms. The peak LDAR flash rate prior to the hail and large microburst is 275 flashes/minute,
substantially larger than values characteristic for nonsevere storms (Figure 3).
The selection of case studies from Table 1 for wind and tornado manifestations of severe
weather has a twofold purpose in this study: (1) to explore the vertical development of the storm
and its connection with total lightning precursors to severe weather and (2) to shed further light
on the distinction between supercells that do and do not produce tornadoes, a long-standing
problem both scientifically and operationally (Burgess, et al., 1993). Improved Doppler radar
observations (Burgess, et al., 1993) have led to the realization that the majority of supercell
mesocyclones do not evolve to tornadoes. A challenging issue is the identification of physical
conditions that make the difference. With this challenge in mind, two electrically extreme
supercell mesocyclones in the Florida dry season were selected from the LISDAD archive from
Table 1 to compare-one on February 23, 1998 (that produced an F3 tornado) and another on
October 31, 1997 (for which wind damage was reported, but no tornado). Selected parameters for
comparisons of these two cases are shown in Table 2. Included in this Table are values for
tropopause overshoot and inferred maximum updraft speed, following like calculations made
initially by Vonnegut and Moore (1958). The numbers are for the most part quite similar, thereby
emphasizing the subtlety of the distinction between supercells that do not produce tornadoes. For
18
example,thepeakLDAR flashratesagreeto within 10percentandarebothextraordinarilyhigh.
It is possiblethat theuseof thesame(nonsevere)stormrulesleadsto anovercountingof flashes.
It is worthnoting, however,that bothestimatesareless thanthe valuefor strokerateestimated
by Vonnegutand Moore (1958) for the Worcester,Massachusetts,tornadic storm (600-1200
strokesperminute),theonly visual observation of stroke rate in a night time supercell.
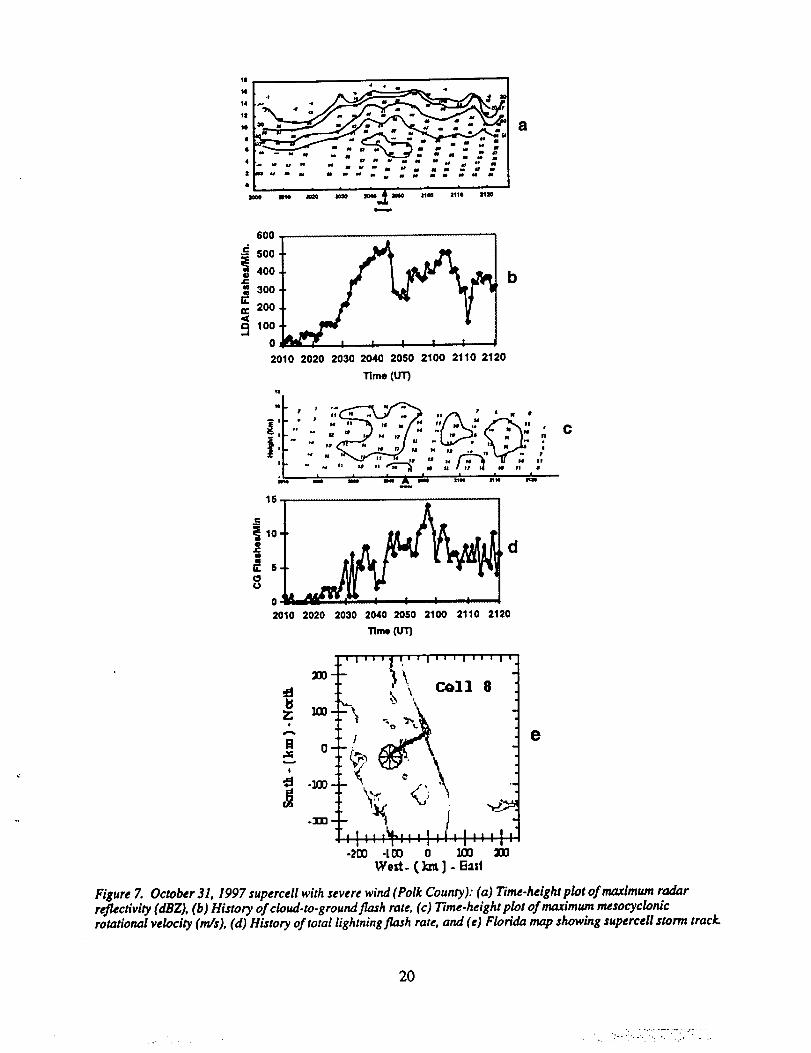
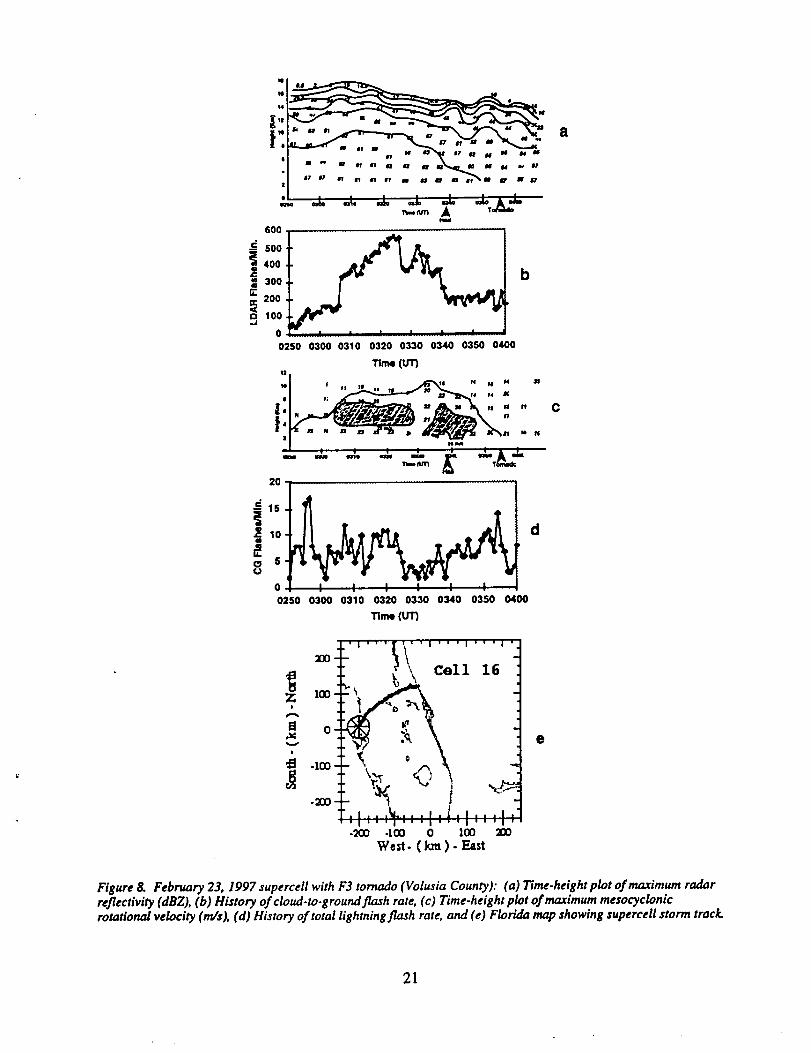
Histories of radar reflectivity and mesocyclonic rotational velocity in time-height format,
together with the lightning (LDAR and NLDN ground flashes) evolutions for the two cases are
shown in Figures 7 and 8. The storm intervals containing the largest lightning jump, maximum
flash rate, and most intense vertical development are included in both cases, and the overall
storm tracks are also shown in Figures 7 and 8. The magnitude of the lightning jump showed the
largest contrast between the two cases among all parameters in Table 2, with the tornado-
producing case showing a substantially larger value (160 fpm/min). Neither storm was
sufficiently close to the Melbourne radar to enable observation of concentrated low-level
vorticity (i.e., the tornado). These time-height comparisons reveal substantially more about the
differences between the two cases than the parameter comparisons in Table 2.
19
" -":: - ,.1t4 I "
1:2 • U
m _ a
| m al ,, •
• m m _ m •m m m U
N • _ m
• 6O0 _ I-_=soo4. _ _t I
.f.300t } _ '_4E 200+ r I/ I
2010 2020 2030 2040 2050 2100 2110 2120
Time (UT)
t|
_, ...-n
....... _ "
lS
lO-
d6-
O' I..__ __ . .
2010 2020 2030 2040 2050 2100 2110 2120
C
"' I ' I ' _' I' ' I ' ' ' I ' ' I '1I ,,,,-5,,,',-,,",o,-¢,
":z:x]-",l,,,_,, , !,I', I ,, , I ,"' I'''1''' I''' I''' I'-290 -I CO 0 100 200
Figure 7. October 31, 1997 supercell with severe wind (Polk County): (a) Time-height plot of maximum radarreflectivity (dBZ), (b) History of cloud-to-ground flash rate, (c) Time-height plot of maximum mexocyclonicrotational velocity (m/s ), (d) History of total lightning flash rate, and (e) Florida map showing $uperc eU storm track.
2O
:n14 ¢
| I U m /7
• 600500
400
300 b
200
100
0
10
0250 0300 0310 0320 0330 0340 0350 0400
Time (UT)
00250 0300 0310 0320 0330 0340 0350
Timo (UII
11
1@ | #| pe )l 11 F4 14 H Jl_
I It; f4 14 E
2O
I 0 I i I Io40o
:_oo-
i 100-0-
-100
-200,I,, ..... I, ,I.,,I,'1 '' '| '' '1 '' '1 '' 'I '
-2C0 -100 0 1(20 2)0
We_. (km ) - East
e
Figure 8. February 23, 1997 supercellwith F3 tornado (Volusia County): (a) Time-height plot of maximum radar
reflectivity(dBZ), (b) History of cloud-to.ground flash rate,(c) Time-height plotof maximum mexocyclonic
rotationalvelocity(re�x),(d) History of totallightningflash rate,and (e) Florida map showing supercett storm track.
21

Comparison
Parameter
Table 2.of Selected Parameters for Two Florida Supercells
pseudoadiabatic CAPE
tropopause height
melting level height
maximum LDAR flash rate
maximum NLDN flash rate
lightning 'jump'
maximum IC/CG ratio
maximum radar cloud top
tropopause overshoot
inferred maximum updraft speed
31 Oct 97
1540 j/kg
12.9 km
4.0 km
554 fpm
14 fpm
60 fpm/min
-230
23 Feb 98
2140 j/kg
12.7 km
3.8 km
567 fpm
17 fpm
160 fpm/min
-200
16-17 km 17-18 km
3-4 km 4-5 km
60-80 m/s 80-100 m/s
22 km 30 km
184 m2/s 2 350 m2/s 2
19 m/s 28 m/s
5-9 km 5-8 km
50-80 krn/hr 90-100 km/hr
diameter of 30 dBZ coreat 7 km
Helicity (0-3 km)
mesocyclone maximumrotational velocib/
typical mid-levelmesocyclone diameter
supercell translational speed
hail (?)
tornado (?)
no hail repoded
no
3/4-inch hail
yes (F3)(wind damage only)
ordinary airmass thunderstorms (Lhermitte and Krehbiel, 1979;
1985; Goodman, et al., 1988; Williams, et al., 1989), these supercells
In comparison with
Lhermitte and Williams,
are far closer to a dynamical steady state in their vertical development. And yet the observations
show in both cases that the unsteady features are of central importance in signaling severe
22

conditions on the ground. The total lightning is perhaps the least steady feature of supercell
evolution, with substantial lightning jumps (in the LDAR flash rate) coinciding with explosive
vertical development (2020-2040 UT on Oct. 31 and 0305-0320 UT on Feb. 23) that are again
precursory to severe weather (at 2045 UT on Oct. 31 and at 0355 UT on Feb. 23). The upward
growth at mid-levels (and in particular in the mixed phase region where the strongest charge
separation is expected) clearly coincides with the enhancement in mid-level rotation, presumably
by stretching of vertical vorticity in the updraft at mid- and upper levels. In both cases, the
maximum in rotational velocity aloft is sustained to the time of maximum LDAR flash rate (2045
UT on Oct. 31 and 0324 UT on Feb. 23). Unlike the behavior of many non-severe thunderstorms
(Byers and Braham, 1949; Williams, 1985a), the peak flash rate does not coincide with the
maximum radar cloud top height. Agreement is better between the vertical extent of radar
reflectivity in the mixed phase region at lower levels, consistent with the idea that supercooled
water is a fundamental ingredient in the electrification process. This leaves unresolved the
question raised by Vonnegut and Moore (1958) concerning the electrical role of the large
quantity of ice particles at altitudes above the mixed phase region in supercell storms. Present
laboratory simulations (Takahashi, 1978; Saunders, et al., 1991) do not extend to this
temperature region. Following the maximum in total flash rate in both cases, an abrupt drop in
flash rate occurs, suggesting a reduction in updraft strength with an attendant reduction in
rotational velocity. Severe wind is reported at the surface for the Oct. 31 case, but no severe
report was logged for Feb. 23 at the equivalent time.
Shortly after the abrupt diminishments in flash rate, in both cases, a secondary maximum in
rotational velocity is observed (2057 UT on Oct. 31 and 0337 UT on Feb. 23) associated with the
most strongly descending reflectivity contours (and declining reflectivity within the respective
mesocyclonic cores), indicative of possible restretching of the vorticity, but in this case by a
downdraft rather than an updraft.
23
At this juncture, thebehaviorof the two cases diverges. The flash rate for Oct. 31 rebuilds
after its short-term decline, whereas the flash rate for Feb. 23, that has dropped to a lower relative
level, does not recover. The mid-level reflectivity for Oct. 31 is sustained, whereas for Feb. 23 at
mid level, reflectivity contours continue the descent that began near the time of cloud top apogee
(0310 UT). An F3 tornado is observed at 0355 UT (with a notable diminishment of rotational
velocity aloft) in the latter case, but no further severe weather is observed in the time frame
shown for the Oct. 31 supercell.
The lightning discussion has thus far centered on the LDAR information on account of the
demonstrated connection with storm vertical development. The sustained lightning jumps that
stand out clearly in the LDAR history are hardly present in the NLDN ground flash history, and
the general level of activity is less than the inferred intracloud development, often by more than
tenfold.
Some tendency is noted for suppressed ground flash activity at times of elevated intracloud
activity (2040 UT on Oct. 31 and 0330 UT on Feb. 23), suggesting a competition between
lightning types for a common source of charge (Williams, 1989; MacGorman, 1993; Williams,
1998).
6. DISCUSSION OF TOTAL LIGHTNING RATE
The flash rates and lightning 'jumps' recorded in Figure 3 and in Table 2 in severe Florida
thunderstorms are extraordinarily large in comparison with ordinary non-severe storms. This
possibly controversial result and the general strategy in defining a storm's lightning activity
therefore deserve some discussion. A central issue in this context is the physical nature of a
lightning flash. Though complicated and still poorly understood (Bernard Vonnegut's pointed
quote on this topic: "What theorist would have predicted lightning?"), the lightning flash is a
well-defined physical entity, supported by numerous measurements. A flash is a connected
plasma whose electrical conductivity is everywhere larger than the air dielectric in which it is
24

embedded.By 'connected'wemeanthatat anyinstantin theflash's lifetime,everypair of points
within the flash are linked by somepath with elevatedelectrical conductivity. For optical
measurementswith limited sensitivity, a flash may appearto ceasein the dark interstroke
interval.However,evidencefrom field changemeasurementsandradar(Hewitt, 1957;Williams,
et al., 1989)supportthe ideathatelectricalcurrent continuesto flow during this interval andthe
flash is sustained.As noted by Heckmanand Williams (1989) and Mazur, et al. (1997),
continuedgrowthof the flashsomewherein spaceinto the surroundingelectricfield is required
for flash sustenance.
Problems naturally arise when a flash is to be documented with inadequately sampled optical
or rf measurements, such as the LDAR maps of flashes discussed here. If the lightning flash
radiated continuously above the measurement noise level as it progressed in space, and if the
measurement sampling were continuous in time, the accurate depiction of all flashes following
the above definition would be straightforward. In practice, lightning does not radiate strongly at
all times, and furthermore, the LDAR sampling and processing is incomplete, with a maximum
sample rate of 10 kHz. These limitations force the selection of rather simple space and time
criteria (but nonetheless, criteria consistent with statistical information on the durations and
extents of lightning flashes) in defining flashes as described in Section 3.
This sampling limitation for flash definition is strongly aggravated when the flash rate
increases to the point where the interflash interval is comparable to or less than the flash duration
and overlap in space and time is prevalent. This study has shown that this condition is very
common in severe weather. This difficulty with the interpretation of LDAR radiation sources has
also appeared recently in the analysis of optical pulses observed by NASA's Lightning Imaging
Sensor (LIS) in space (H. Christian and D. Boccippio, personal communication, 1998). These
problems are best appreciated with some simple pictures of flashes within clouds.
25
Threepossiblescenariosfor the occurrenceof lightning flashesin active storm 'cells' are
illustrated in Figure 9. Here we have assumed (for lack of a more strongly supported alternative)
that every lightning flash is a double-ended 'tree' (Mazur, et al., 1997). Figure 9(a) depicts a
situation with a single flash without overlap in either space or time. Figure 9(b) shows flash
activity in different regions of space but overlapping in time. Finally, Figure 9(c )shows a
scenario with overlapping flashes in both space and time.
Figure 9(a) is the usual picture for an ordinary nonsevere thunderstorm in which the charging
zone and breakdown region are highly localized and in which the interflash interval is larger than
the flash duration. An electrically stressed spark gap presents the same situation. Overlapping
flashes are impossible in such a case, as breakdown prevents the occurrence of new breakdown
to form the next flash. One possible flaw in the grouping algorithm described in Section 3 is the
inadvertent decomposition of single large flashes into multiple smaller ones.
Figure 9(b) shows a possible scenario for a high flash rate supercell with heterogeneous
conditions in both particle charging and in dielectric strength, that leads to simultaneous flashes
in different regions. In storms of this kind characterized by extremes in draft strength, liquid
water content and ice particle size, the strongly heterogeneous conditions in microphysical
growth are obvious. If such conditions are linked with particle charging (Baker, et al., 1987;
Williams, et al., 1991; 1994), then we can expect heterogeneous charging. If large ice particles
are influential in weakening the dielectric strength of the upper storm and aiding in the initiation
of lightning flashes, we can expect multiple breakdown. The scrr cell identification procedure
in this study frequently identifies the entire supercell as one 'cell' (with one pop-up box history).
These cells are often 20-30 km in diameter (Table 2) and 15-17 km deep. The substructure of
these cells is readily apparent in the radar observations (not shown).
26

9wwww,,,w,,w,r,w_,W,,
Figure 9. Lightning configurations in (a) small storm with no flash overlap in space or time, (b) severe storm
with flash overlap in time but not in space, and (c) severe storm with flash overlap in space and in time.
Lightning flashes that overlap in space [as in Figure 9(c)] may not seem a likely possibility
for reasons advanced in the earlier discussion of the spark gap. However, the thunderstorm is a
continuous dielectric that is continuously charged. In the case of solid dielectric materials
(Williams, et al., 1985b) charged continuously with an external electron beam, individual
discharges occasionally overlapped in space. It is not clear to what extent this happens in severe
weather, but if it does, it would present the most difficult problem of flash distinction.
One could escape the flash overlap problem entirely by abandoning the grouping of LDAR
sources into flashes described in Section 3 and monitoring the LDAR source rate alone as a
measure of storm electrical activity. We have not followed this approach for one major reason:
the characterization of the lightning activity is then dependent on the sensitivity of the detection
system (LDAR, in the present context) and on the distance between lightning and detector. If the
system is sufficiently sensitive to record only one source per flash, then we achieve the desired
total flash rate. A characterization of lightning activity that is independent of measurement
system is clearly preferable. Most previous results on electrical activity in severe weather
(reviewed in MacGorman, 1993 and Williams, 1998) are difficult to compare quantitatively with
the present results because insufficient information is available on the physical process being
monitored and counted. This problem may not be so serious for an optical sensor in space (e.g..,
27
.o •

the Lightning Imaging Sensor) that maps optical pulses from lightning in storms all over the
world, but is almost surely a problem for surface measurements on different storms in different
locales.
One objection to the use of 'flash' in quantifying lightning activity is the variable nature of
this unit in energy and charge moment, to name just two physical properties. Indeed, the charge
moments of flashes we define by LDAR groupings may vary from a fraction of a coulomb-
kilometer (for delicate intracloud flashes high in the storm) to several thousand coulomb-
kilometers for the large 'spider' lightning in mesoscale convective systems (Williams, 1998;
Huang, et al., 1998). We view this variability as an inevitable consequence of the meteorological
variability. Furthermore, the history of lightning studies gives us a much better feel for energy
and charge moment of flashes than for the physical processes with which individual LDAR
sources may be associated.
For all of these reasons, we prefer to quantify electrical activity as a flash rate in the severe
weather cases examined. A single rule for grouping LDAR sources into flashes is applied in all
cases. The flash rates we obtain for nonsevere thunderstorms are reasonable ones (Figure 3).
Though errors may arise due to space/time overlap in the severe regime when the flash rates are
quite high, the values obtained are not implausible. As mentioned earlier, Bernard Vonnegut
estimated a lightning stroke rate of 600 per minute in a supercell storm. This value is on the high
end of values documented in this study in Figure 3.
7. CONCLUSIONS
The LISDAD system has revealed a remarkably consistent pattern of total lightning behavior
for severe Florida thunderstorms, with strong upsurges prior to severe weather in all categories
(wind, hail and tornadoes), in both the wet and the dry seasons. The updraft appears to be causal
to both the extraordinary intracloud lightning rates and the physical origin aloft of the severe
weather at the surface. The supercell comparison has disclosed deep reservoirs of vertical
28

mesocyclonicangular momentum(to 10km altitude),with indications of vortex stretchingby
both updrafts initially and by downdrafts at later stages. These cases and additional
tornado/waterspoutcasesconsideredby Goodman,et al (1998) and Hodanish,et al (1998)are
consistentin showing that pronounceddeparturesin dynamical steadystateare neededfor
tornadogenesis.In particular, aslumpingof thecloud andattendantdiminishmentin total flash
rateafter the initial lightning jump appearnecessaryto concentratevorticity nearthe surface.
Continuedexamination of Florida null cases(i.e., mesocycloneswithout tornadoes)with the
LISDAD areneededfor furtherclarificationof mechanisms.
ACKNOWLEDGMENTS
Leslie Mahn prepared the manuscript with patience and precision. Discussions on severe
weather with D. Burgess, C. Doswell, D. MacGorman R. Markson, E. Rasmussen, and W.
Taylor are greatly appreciated. Richard Ferris provided valuable on-site observations of many of
the Florida storms. P. MacKeen, Travis Smith, and M. Eilts provided guidance on the NSSL
algorithm. The LISDAD project has been supported by Jim Dodge of the NASA Earth Science
Enterprise under Contract H-23725D. We thank R. Markson for additional support to Lincoln
Laboratory on a NASA STrR project.
29
• ° i'"

REFERENCES
r.
Baker, B., M.B. Baker, E.R. Jayaratne, J. Latham, and C.P.R. Saunders, The influence of
diffusional growth rates on the charge transform accompanying rebounding collisions
between ice crystals and soft hailstones, Quart., J., Roy. Met. Soc., 113, 1193-1215, 1987.
Boldi, R., E. Williams, A. Matlin, M. Weber, S. Hodanish, D. Sharp, S. Goodman and R.
Raghavan, The design and evaluation of the lightning imaging sensor data applications
display (LISDAD), 19th Conference on Severe Local Storms, AMS, 1998.
Burgess, D.W., R.J. Donaldson Jr., and P.R. Desrochers, Tornado detection and warning by
radar, in The Tornado: Its Structure, Dynamics, Predictions and Hazards, ed., C. Church, D.
Burgess, C. Doswell and R. Davies-Jones, AGU Geophysical Monograph 79, 1993.
Burgess, D., personal communication, 1998.
Byers, H.R. and R.R. Braham, The Thunderstorm, U.S. Government. Printing Office, June 1949.
H. Christian and D. Boccippio, personal communication, 1998.
Goodman, S.J., D.E. Buechler, P.D. Wright and W.D. Rust., Lightning and precipitation history
• of a microburst-producing storm, Geophys. Res. Lett., 15, 1185-1188, 1988.
Goodman, S., R. Raghavan, E. Williams, R. Boldi, A. Matlin, and M. Weber, Total lightning and
radar storm characteristics associated with severe storms in central Florida, 19th Conference
on Severe Local Storms, AMS, 1998.
Heekman, S.J. and E.R. Williams, Corona envelopes and lightning currents, J. Geophys. Res., 94,
13287-13294,1989.
30
Huang,E.W., E. Williams, R. Boldi, S. Heckman, W. Lyons, M. Taylor, C. Wong, and T.
Nelson, Criteria for elves and sprites based on Schumann resonance observations, J.
Geophys. Res., submitted 1998.
Hewitt, F.J., Radar echoes from interstroke processes in lightning, Proc. Phys. Soc. London, B70,
961-979, 1957.
Hodanish, S., D. Sharp, E. Williams, R. Boldi, A. Matlin, M. Weber, S. Goodman and R.
Raghavan, Observations of total lightning associated with severe convection during the wet
season in central Florida, 19th Conference on Severe Local Storms, AMS, 1998.
Johnson, J. T., P. L. MacKeen, A. E. Witt, E. D. Mitchell, G. Stumpf, K. Thomas, The storm cell
identification and tracking Algorithm: An enhanced WSR-88D algorithm. Wea. Forecasting,
13, 1998.
Laroche, P., C. Malherbe, A. Bondiou, M. Weber, C. Engholm, and V. Coel, Lightning activity
in microburst producing storms, 25th International Conference on Radar Meteorology, Pads,
France, 1991.
Lennon, C. and L. Maier, Lightning mapping system, NASA CP-3106, Vol II, International
Aerospace and Ground Conference on Lightning and Static Electricity, 89-I to 89-10, 1991.
Lhermitte, R. and P. Krehbiel, Doppler radar and radio observations of thunderstorms, IEEE
Tran. Geosci. Electron., GE-17, 162-171, 1979.
Lhermitte, R. and E. Williams, Thunderstorm electrification: a case study, J. Geophys. Res., 90,
6071-6078, 1985.
MacGorman, D.R., Lightning in tornadic storms: a review, in The Tornado: Its Structure,
Dynamics, Prediction and Hazards, eds., C. Church, D. Burgess, C. Doswell, and R. Davies-
Jones, Geophysical Monograph 79, American Geophysical Union, 1993.
31

Malherbe,C., J. Pigere, P. Blanchet,O. Deste,A. Bondiou, and P. Laroche,Relation Entre
L'activit6 Electrique D'Orage et le Drveloppement de Microbursts-Experience
MIT/ONERA, Orlando,FL, 1991,RF ONERA# B0516154P4,June1992.
Mazur, V., E. Williams, R. Boldi, L. Maier, and D. Proctor, Initial comparisonof lightning
mappingwith operationaltime-of-arrivalandinterferometricsystems,J. Geophys. Res., 102,
11071-11085, 1997.
Perez, A.H., R.E. Orville, and L.J. Wicker, Characteristics of cloud-to-ground lightning
associated with violent tornadoes, Weather and Forecasting, 12, 428-437, 1997.
Raghavan, R., S. Goodman, P. Meyer, R. Boldi, A. Matlin, M. Weber, E. Williams, D. Sharp, S.
Hodanish, J. Madura, and C. Lennon, A real-time examination of the incremental value of
lightning data in diagnosing convective storm characteristics, Preprints, Seventh International
Conference on Aviation, Range, and Aerospace Meteorology, Long Beach, CA, AMS, 1997.
Rasmussen, E.N. and J.M. Straka, Mobile mesonet observations of tornadoes during VORTEX-
95, AMS Conference on Severe Local Storms, 1-5, San Francisco, CA, February, 1996.
Saunders, C.P.R., W.D. Keith, and R.P. Mitzeva, The effect of liquid content on thunderstorm
changing, J. Geophys. Res., 96, 11007-11017, 1991.
Stanley, M., P. Krehbiel, and W. Rison, Lightning as a Precursor of Outflow and Downbursts
from Thunderstorms, 28th Conference on Radar Meteorology, Austin, TX, American
Meteorological Society, pp. 151-152, 1997.
Storm Data, NOAA (Ashville, N.C.), Vol. 39, No. 10, 1997.
Takahaski, T., Riming electrification as a charge generation mechanism in thunderstorms, J.
Atmos. Sci., 1536-1548, 1978.
32

r
T'
Vonnegut, B., Possible mechanism for the formation of thunderstorm electricity, Bull. Am. Met.
Soc., 34, 378, 1953.
Vonnegut, B., Electrical theory of tornadoes, _/. Geophys. Res., 65, 203-121, 1960.
Vonnegut, B. and C. B. Moore, Giant Electrical Storms, in Recent Advances in Atmos. Elec., Ed.,
L.G. Smith, Pergamon Press, 1958.
Weber, M.E., E.R. Williams, M.M. Wolfson and S.J. Goodman, An assessment of the
operational utility of a GOES lightning mapping sensor, Project Report. NOAA-18, MIT
Lincoln Laboratory, Lexington, MA, 13 February, 1998.
Williams, E.R., Large scale charge separation in thunderstorms, J. Geophys. Res., 90, D4, 6013-
6025, 1985a.
Williams, E.R., C.M. Cooke, and K.A. Wright, Electrical discharge propagation in and around
space charge clouds, J. Geophys. Res., 90, 6059-6070, 1985b.
Williams, E.R., M. Weber, and R. Orville, The relationship between lightning type and
convective state of thunderclouds, J. Geophys. Res., 94, 13213-13220, 1989.
Williams, E.R., The tripole structure of thunderstorms, J. Geophys. Res., 13151-13167, 1989.
Williams, E.R., The positive charge reservoir for sprite-producing lightning, J. Atmos. Terr.
Phys., in press, 1998.
Williams, E.R., S.G. Geotis, and A.B. Bhattacharya, A radar study of the plasma and geometry
of lightning, J. Atmos., Sci., 46, 1173-1185, 1989.
Williams, E.R., R Zhang and J. Rydock, Mixed-phase microphysics and cloud electrification, J.
Atmos. Sci., 48, 2195-2203, 1991.
33

r
Williams, E.R., R Zhang and D. Boccippio, Microphysical growth state of ice particles and
large-scale electrical structure of clouds, J. Geophys. Res., 99, 10787-10793, 1994.
Williams, E.R., The electrification of severe storms, AMS Monograph on Severe Storms, Ed.,
C.A. Doswell, in review, 1998.
34