Simple Fuzzy Name Matching in Solr: Presented by Chris Mack, Basis Technology
1
EXECUTIVE SUMMARY
The many parties that debate insurance issues agree on little, but they do agree that the price one pays
for insurance should be closely linked to how risky one is to insure.
• "The fundamental basis of insurance ratemaking is that rates must be related to risk," writes
Robert J. Hunter, director of insurance for the Consumer Federation of America.1
• “The basis of insurance is matching risk costs based on objective criteria with rates, and then
spreading those risks accordingly across society,” according to the American Property Casualty
Insurance Association, a prominent trade organization.2
• The “ability to set accurate prices is a cornerstone to setting actuarially sound premiums that
are not excessive or inadequate or unfairly discriminatory,” write the Casualty Actuarial Society
and the Insurance Information Institute.3
This document will address the Federal Insurance Office’s request to discuss the affordability of
insurance, but we felt compelled to begin talking about the adjustment of rates to risk. We will maintain
that for automobile insurance, the concept of affordability does not exist in a vacuum. It is necessary to
understand how risk-based pricing is critical for insurance to operate in the best interests of the public.
Attempts to make insurance more affordable can make it harder to get. Making insurance cheaper for
some makes it unfairly expensive for others and can make it more expensive overall.
The Insurance Information Institute has been intimately involved in enlightening such discussions.
Established in 1960, we are in our seventh decade as the trusted source of unique, data-driven insights
on insurance to inform and empower consumers.
We will discuss attempts to address affordability issues in auto insurance, both past and present, and
into the future as well. From our work, four themes emerge:
• Affordability, availability and fairness are inextricably linked in insurance. Any serious effort to
address one of them will need to consider the impact on the others. The Federal Insurance
Office should consider re-examining the affordability issue to properly account for the impact
affordability has on availability and on fairness, as well as address numerous shortcomings that
the FIO’s previous work presents.
1 J. Robert Hunter, “Comments of J. Robert Hunter, FCAS, MAAA, Director of Insurance for CFA Before the Casualty Actuarial and Statistical Task Force of the National Association of Insurance Commissioners February 9, 2021,” February 9, 2021. 2 American Property Casualty Insurance Association, “Re: NAIC Special Committee on Race and Insurance Charges and Workstreams,” 9 10 20, https://content.naic.org/sites/default/files/call_materials/APCIA%20Comments.pdf. 3 Casualty Actuarial Society and Insurance Information Institute, “Insurance Rating Variables: What They Are and Why They Matter,” July 2019, https://www.iii.org/sites/default/files/docs/pdf/ratingvariables_cas-iii_wp072419.pdf.

2
• Insurance companies accurately price their policies. Safer risks pay less for insurance. Greater
risks pay more. Insurers achieve this level of accuracy using a wide variety of rating factors, all of
which must conform to the laws and regulations of the state in which the business is written.
There is no credible evidence that insurers charge more than they should, either across the
broad market or in specific subsegments such as neighborhood, race, income, education or
occupation.
• Regulators occasionally intervene in the rating process to make insurance less expensive for
certain groups, citing the need to make insurance “affordable.” These interventions, however
well-intentioned, can backfire in a spectacular way, raising the overall costs and severely
reducing availability, as well as impeding innovations that could address the issue.
• Real solutions, both short and long-term exist to make insurance more affordable. These
solutions come not from tinkering with how insurers set prices but by addressing the costs that
insurance covers, by improving the transportation environment, and by addressing societal
issues that often force minorities and Low- and Moderate- Income (LMI) individuals to live and
drive in circumstances where auto insurance costs the most.
PART ONE: FIO AFFORDABILITY RESEARCH
The Federal Insurance Office was established in the wake of the 2008 financial crisis under Title V of the
Dodd-Frank Wall Street Reform and Consumer Protection Act. Among its duties is to monitor whether
low- to moderate-income persons and those from other underserved communities have access to
affordably priced insurance.4
In 2017, the FIO issued a report, Study on the Affordability of Personal Automobile Insurance. It created
an Affordability Index for persons who live in ZIP codes where more than half the population were
minorities or LMI. (It calls these affected persons.) If the cost of minimum limits liability coverage
exceeded 2 percent of median income, coverage was considered to be unaffordable.
Nationwide, 845 ZIP codes had insurance rates above the 2 percent threshold. For the 18.6 million
people living in them, according to the FIO criterion, auto insurance was considered unaffordable. 5
In a study published in the Journal of Insurance Regulation, Grace, Laverty and Powell summarized
several of the most common criticisms, 6 some of which enlarge upon caveats that the FIO placed upon
its own work. 7 We have added a bit of commentary to these critiques.
• The FIO notes, “The Affordability Index allows for comparison of ZIP Codes within the same state
but should not be considered for interstate analysis.”
FIO’s acknowledgment suggests that one can conclude that auto insurance in, say, East St. Louis,
Illinois ZIP 62201 – 3.05 percent – is less affordable than Chicago, where no ZIP codes exceed
4 A summary of FIO’s history can be found at Elizabeth F Brown, “Will the Federal Insurance Office Improve Insurance Regulation?,” University of Cincinnati Law Review 81, no. 2 (2013): 551–99. 5 Federal Insurance Office, “Study on the Affordability of Personal Automobile Insurance” (U.S. Department of Treasury, January 2017), https://www.treasury.gov/initiatives/fio/reports-and-notices/Documents/FINAL%20Auto%20Affordability%20Study_web.pdf. 6 Martin Grace, J., Tyler Leverty, and Lawrence Powell, “Cost Trends and Affordability of Automobile Insurance in the U.S.,” Journal of Insurance Regulation 38, no. 7 (2019): 24. 7 Federal Insurance Office, “Study on the Affordability of Personal Automobile Insurance,” 2.
3
the 2 percent threshold. But East St. Louis cannot be compared to St. Louis ZIP 63102, just
across the Mississippi and in the same metropolitan area, where the Affordability Index sits at
1.06 percent.
Grace et al. commend this acknowledgment, noting states differ in the amount and types of
insurance they require. For example, some states mandate no-fault insurance. States also differ
in the minimum limit of liability that need be purchased.
But they scold FIO for not bringing the argument full circle: “These [state-to-state] variations
also influence the national average of auto insurance expenditure to income ratio, which
determines [FIO’s] threshold for ‘unaffordability.’”
We would put it another way: If the Affordability Index doesn’t give one the ability to compare
affordability across state lines, why create a single standard? And if the single standard isn’t
applicable across state lines, why does FIO apply it nationwide, as when it concludes that more
than 18 million people are forced to purchase a supposedly unaffordable product?
• “The study only examines the affordability of affected persons.”
Grace et al. note that FIO (as well as consumer groups) use the study’s findings to show that
high premiums unfairly harm minorities and LMI individuals. But one can’t conclude they are
unfairly hurt without knowing how auto premiums affect all consumers.
FIO’s work, we suggest, invites questions:
o If 18.6 million affected persons can’t afford insurance, how many million more have the
same problem, despite their higher income?
o And if there are scores of millions of persons who fail the FIO’s 2 percent standard,
might the standard be too low?
Yet the FIO makes no attempt to address those questions.
Criticism also focused on the definition of affordability FIO adopted and how that was quantified into a 2
percent threshold.
The FIO adopted a “common sense definition” of the term affordability: A good is affordable if its
acquisition is seen as “being within the financial means of most people.”8 The 2 percent standard was
developed with an eye on the Bureau of Labor Statistics (BLS) survey on consumer expenditures, which
found that “in 2013 and 2015, consumers spent about 1.8 percent of average income (after taxes) on
vehicle insurance.”9 It appears the standard is developed by taking the average of 1.8 and rounding up a
couple of tenths.
Grace et al., noted:
A definition of ‘unaffordable’ that is relative to a national average will always deem auto
insurance as unaffordable for some ZIP codes. For example if the . . . ratio is normally distributed
with a mean of 2 percent, then the FIO definition will always deem 50% of ZIP Codes
‘unaffordable’ and the other 50% as ‘affordable,’ regardless of the magnitude of the premium.
With this definition, premiums could uniformly drop by 30% in all ZIP Codes, and 50% of ZIP
Codes will still be classified as ‘unaffordable’ and the other 50% as ‘affordable.’
8 Michael T. McRaith, “Monitoring Availability and Affordability of Automobile Insurance,” Federal Register 81, 134 (July 13, 2016): 45372-45381. https://www.govinfo.gov/content/pkg/FR-2016-07-13/pdf/FR-2016-07-13.pdf. 9 Federal Insurance Office, “Study on the Affordability of Personal Automobile Insurance,” 9.
4
This criticism turns out to be prescient, for the BLS survey upon which FIO relies changed its
methodology starting with the most recent year available, 2019. 10 Under the old method, insurance the
typical American spent 1.2 percent of their income on auto insurance. Under the new method,
according to BLS, the typical American spends 2.2 percent of their income on auto insurance.11 How can
FIO respond?
FIO, of course, could keep the affordability threshold at 2 percent, but a problem emerges: If spending 2
percent of income makes insurance unaffordable for minorities and LMI individuals, isn’t insurance now
unaffordable for everyone?
Trying to address the problem is even more confusing, because it shows that, using the FIO’s definition,
an acceleration in the cost of insurance, paradoxically, reduces the number of people for whom
insurance is unaffordable.
Here is what we mean: Employing the FIO’s prior methodology, the changes implemented by BLS would
move the affordability threshold to, say, 2.5 percent – being 2.2 percent plus a couple of tenths. Of
course a higher threshold would reduce the number of folks for whom insurance is unaffordable. So, the
fact that insurance got more expensive made it more affordable – or so the FIO methodology would lead
one to conclude.
Under the old methodology, the BLS survey would have shown spending on auto insurance fell to 1.2
percent of income.12 Using that information, FIO’s methodology would have moved the affordability
threshold down to, let us say, 1.5 percent. That would be bad news for the affordability of insurance,
because far more people pay more than 1.5 percent of their income for auto insurance than pay more
than 2 percent. The fact that insurance got cheaper would mean that the product became less
affordable, again if one follows the FIO methodology.
To recap: If insurance gets cheaper, the FIO methodology indicates insurance becomes less affordable. If
it gets more expensive, FIO’s work would have it become more affordable.
10 BLS had been relying on its diary survey for insurance expenditures. It switched to its interview survey for the auto insurance information in 2019. 11 Bureau of Labor Statistics, “Vehicle Insurance Spending in the 2019 Annual Calendar Year Estimates,” U.S. Bureau of Labor Statistics, September 9, 2020, https://www.bls.gov/cex/2019-vehicle-insurance.htm. 12 This is an Insurance Information Institute calculation. BLS reported that the diary survey showed a 15.1 percent decline in auto insurance expenditures from 2018, when they were $976. We estimate the 2019 diary survey estimate to be $829, applied to $71,487 income after taxes, which equals 1.2 percent.
5
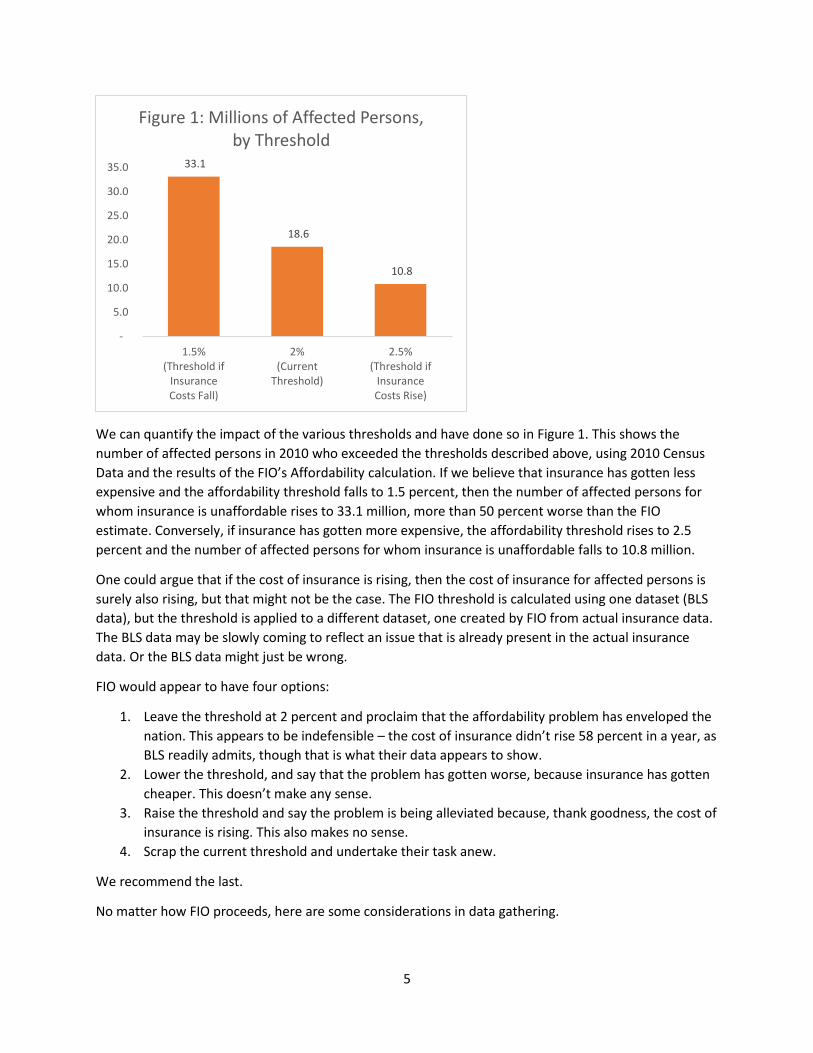
We can quantify the impact of the various thresholds and have done so in Figure 1. This shows the
number of affected persons in 2010 who exceeded the thresholds described above, using 2010 Census
Data and the results of the FIO’s Affordability calculation. If we believe that insurance has gotten less
expensive and the affordability threshold falls to 1.5 percent, then the number of affected persons for
whom insurance is unaffordable rises to 33.1 million, more than 50 percent worse than the FIO
estimate. Conversely, if insurance has gotten more expensive, the affordability threshold rises to 2.5
percent and the number of affected persons for whom insurance is unaffordable falls to 10.8 million.
One could argue that if the cost of insurance is rising, then the cost of insurance for affected persons is
surely also rising, but that might not be the case. The FIO threshold is calculated using one dataset (BLS
data), but the threshold is applied to a different dataset, one created by FIO from actual insurance data.
The BLS data may be slowly coming to reflect an issue that is already present in the actual insurance
data. Or the BLS data might just be wrong.
FIO would appear to have four options:
1. Leave the threshold at 2 percent and proclaim that the affordability problem has enveloped the
nation. This appears to be indefensible – the cost of insurance didn’t rise 58 percent in a year, as
BLS readily admits, though that is what their data appears to show.
2. Lower the threshold, and say that the problem has gotten worse, because insurance has gotten
cheaper. This doesn’t make any sense.
3. Raise the threshold and say the problem is being alleviated because, thank goodness, the cost of
insurance is rising. This also makes no sense.
4. Scrap the current threshold and undertake their task anew.
We recommend the last.
No matter how FIO proceeds, here are some considerations in data gathering.
33.1
18.6
10.8
-
5.0
10.0
15.0
20.0
25.0
30.0
35.0
1.5%(Threshold if
InsuranceCosts Fall)
2%(Current
Threshold)
2.5%(Threshold if
InsuranceCosts Rise)
Figure 1: Millions of Affected Persons, by Threshold

6
• Any new effort should focus on leveraging the considerable data they already have, to create
comparisons over time. That would imply gathering information from statistical agents who
have already gathered the information. Relying on larger carriers alone could miss information
from medium-sized and small carriers that specialize in providing coverage to LMI individuals, of
which there are quite a few.
• Gathering quotations is less precise and less revealing than gathering actual data.
o Quotations are not final rates. They are estimates. So the insurance industry would be
measured on rates that may not be accurate.
o A consumer may receive several quotes but only purchases one. That one is rarely the
most expensive option. As a result, quotations will result in a higher average premium
than consumers actually pay.
o It would be difficult to develop a system of quotations that would be thorough enough
to reach robust conclusions. Designing such experiments can be difficult and subject to
unconscious bias or overinterpretation. One recent study, as an example, sampled rates
for three kinds of grocery store employees and determined that lower-paid workers
would pay more for insurance than people with better paying jobs.13 It is not clear how
such a conclusion could be reached by looking only at grocery store employees and not
the literally thousands of other ways that individuals make a living.
• FIO should refrain from using data from 2020 or 2021. The COVID-19 pandemic played havoc
with driving patterns. The number of miles driven fell 13 percent in 2020 vs. the prior year. (It
had never fallen more than 2 percent any previous year.)14 People drove less, but they drove
less safely. Traffic fatalities rose 24 percent.15 Insurers responded by rebating $14 billion to
customers through a combination of premium discounts and policyholder dividends and booked
them in a variety of ways that would be difficult to untangle and analyze.16
Here are some considerations in measuring affordability, both in creating a threshold and determining
how many people are affected by insurance costs.
• Consider the direction in the movement of premiums over time. Missouri documented that
when holding policy limits and vehicle costs constant, the inflation-adjusted price of insurance
fell 17 percent between 1998 and 2017.17 Grace, et al., cite two studies that have found that
affordability has improved over time, including for LMI individuals, and also one that found that
affordability had not changed over time for households in the second income quintile and had
deteriorated for first-quintile households. Such studies “avoid the inherent subjectivity involved
13 Consumer Reports Digital Lab, “Effects of Varying Education Level and Job Status on Online Auto Insurance Price Quotes,” January 2021, https://advocacy.consumerreports.org/wp-content/uploads/2021/01/Auto-Insurance-White-Paper-Report-FINAL1.26C.pdf. 14 “Traffic Volume Trends,” U.S. Department of Transportation, Federal Highway Administration, 2020, https://www.fhwa.dot.gov/policyinformation/travel_monitoring/tvt.cfm. 15 “Motor Vehicle Deaths in 2020 Estimated to Be Highest in 13 Years, Despite Dramatic Drops in Miles Driven,” National Safety Council, accessed July 13, 2021, https://www.nsc.org/newsroom/motor-vehicle-deaths-2020-estimated-to-be-highest. 16 Maria Sassian and James Lynch, “Here’s What’s Happening to Your Auto Insurance Costs,” Triple-I Blog (blog), May 13, 2021, https://www.iii.org/insuranceindustryblog/tag/covid-19-auto/. 17 Missouri Department of Insurance, Financial Institutions & Professional Regulation, “Private Passenger Automobile Insurance: A Review of the Market in Missouri,” July 2018.
7
in ascribing a specific threshold at which auto insurance is judged unaffordable,” they write, but
they note such studies lack a benchmark for determining whether premium is unaffordable.18
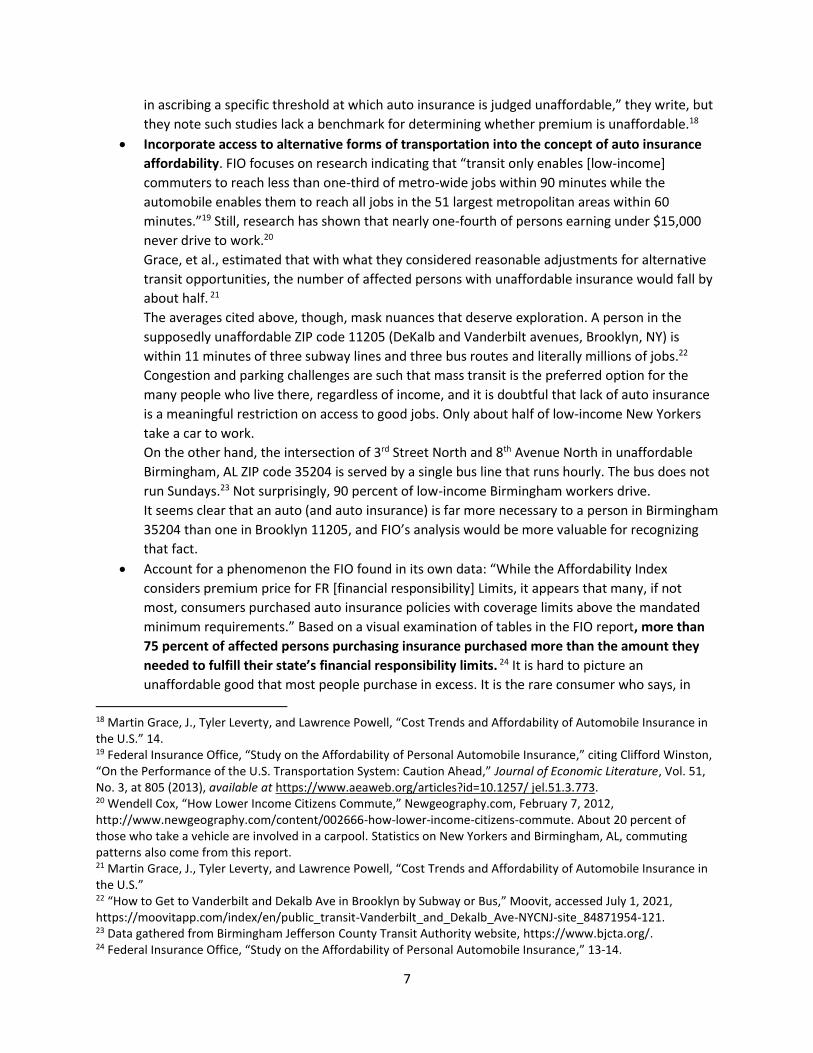
• Incorporate access to alternative forms of transportation into the concept of auto insurance
affordability. FIO focuses on research indicating that “transit only enables [low-income]
commuters to reach less than one-third of metro-wide jobs within 90 minutes while the
automobile enables them to reach all jobs in the 51 largest metropolitan areas within 60
minutes.”19 Still, research has shown that nearly one-fourth of persons earning under $15,000
never drive to work.20
Grace, et al., estimated that with what they considered reasonable adjustments for alternative
transit opportunities, the number of affected persons with unaffordable insurance would fall by
about half. 21
The averages cited above, though, mask nuances that deserve exploration. A person in the
supposedly unaffordable ZIP code 11205 (DeKalb and Vanderbilt avenues, Brooklyn, NY) is
within 11 minutes of three subway lines and three bus routes and literally millions of jobs.22
Congestion and parking challenges are such that mass transit is the preferred option for the
many people who live there, regardless of income, and it is doubtful that lack of auto insurance
is a meaningful restriction on access to good jobs. Only about half of low-income New Yorkers
take a car to work.
On the other hand, the intersection of 3rd Street North and 8th Avenue North in unaffordable
Birmingham, AL ZIP code 35204 is served by a single bus line that runs hourly. The bus does not
run Sundays.23 Not surprisingly, 90 percent of low-income Birmingham workers drive.
It seems clear that an auto (and auto insurance) is far more necessary to a person in Birmingham
35204 than one in Brooklyn 11205, and FIO’s analysis would be more valuable for recognizing
that fact.
• Account for a phenomenon the FIO found in its own data: “While the Affordability Index
considers premium price for FR [financial responsibility] Limits, it appears that many, if not
most, consumers purchased auto insurance policies with coverage limits above the mandated
minimum requirements.” Based on a visual examination of tables in the FIO report, more than
75 percent of affected persons purchasing insurance purchased more than the amount they
needed to fulfill their state’s financial responsibility limits. 24 It is hard to picture an
unaffordable good that most people purchase in excess. It is the rare consumer who says, in
18 Martin Grace, J., Tyler Leverty, and Lawrence Powell, “Cost Trends and Affordability of Automobile Insurance in the U.S.” 14. 19 Federal Insurance Office, “Study on the Affordability of Personal Automobile Insurance,” citing Clifford Winston, “On the Performance of the U.S. Transportation System: Caution Ahead,” Journal of Economic Literature, Vol. 51, No. 3, at 805 (2013), available at https://www.aeaweb.org/articles?id=10.1257/ jel.51.3.773. 20 Wendell Cox, “How Lower Income Citizens Commute,” Newgeography.com, February 7, 2012, http://www.newgeography.com/content/002666-how-lower-income-citizens-commute. About 20 percent of those who take a vehicle are involved in a carpool. Statistics on New Yorkers and Birmingham, AL, commuting patterns also come from this report. 21 Martin Grace, J., Tyler Leverty, and Lawrence Powell, “Cost Trends and Affordability of Automobile Insurance in the U.S.” 22 “How to Get to Vanderbilt and Dekalb Ave in Brooklyn by Subway or Bus,” Moovit, accessed July 1, 2021, https://moovitapp.com/index/en/public_transit-Vanderbilt_and_Dekalb_Ave-NYCNJ-site_84871954-121. 23 Data gathered from Birmingham Jefferson County Transit Authority website, https://www.bjcta.org/. 24 Federal Insurance Office, “Study on the Affordability of Personal Automobile Insurance,” 13-14.

8
effect, “I cannot afford this, so I will buy more than I need to.”
Such behavior would seem to merit removing such a neighborhood from the ranks of the
unaffordable. This would be consistent with the FIO definition of affordability: A good is
affordable if its acquisition is seen as “being within the financial means of most people.”
Neighborhoods where most people purchase more than the minimum amount required would
seem to be neighborhoods where insurance is within the financial means of most people.
• Take into consideration the fact that insurance cost drivers vary, state by state, city by city,
neighborhood by neighborhood. Insurance requirements vary significantly by state, as FIO
acknowledged in correlating insurance affordability and requirements to purchase no-fault
insurance. And accident patterns fluctuate a great deal, even within a city. These are key
considerations in why insurance costs what it does.
This last might not seem important given FIO’s mandate. After all, to a person for whom insurance is not
affordable, the reasons why it is unaffordable seem irrelevant. But understanding the cost drivers of the
insurance product is crucial to understanding why insurance costs what it does, why some people pay
more for it than others do and what solutions are available if the cost is higher than some can afford.
PART 2: EXAMINATION OF INSURANCE COSTS
In its request for information, FIO wants to focus on, among other things: “What should be the role of
non-driving related factors (such as consumer credit history, homeownership status, census tract,
marital status, professional occupation and educational attainment) in personal auto insurance
underwriting and pricing?”25
For this discussion, we first discuss the unique nature of the insurance product and demonstrate that it
is priced appropriately. Then we will demonstrate the need to adjust the price to suit each customer and
how rating factors fulfill that need. Finally we will address what makes a rating variable appropriate and,
using that framework, assess the value of the factors that FIO chooses to focus on.
The pricing of insurance is unique in two important ways:
• Cost-plus pricing. The overwhelming majority of non-insurance consumer products are priced
using the law of supply and demand that is found in an economics textbook. The more demand
exists for a product, the higher its price. If demand ebbs, the price falls. This is so common in the
marketplace that it is easy to think that insurance is priced the same way, but it is not.
Insurance is priced on a cost-plus basis. The insurer estimates what it will pay in all costs – the
cost of the claims it incurs, the cost of settling those claims, administering the business, etc.
There is also a provision for a reasonable profit.
The result is an overall rate. This rate cannot be adjusted because of supply and demand. If sales
are brisk, the price remains the same. If sales falter, no discount can be offered. This highly
unusual economic model is enforced by the laws of every state, all of which embrace, usually in
explicit statutory fashion, that rates must not be excessive or inadequate.26
25 Steven Seitz, Monitoring Availability and Affordability of Auto Insurance; Assessing Potential Evolution of the Auto Insurance Market, Federal Register 86, 101 (May 27, 2021): 28681-28683. https://www.federalregister.gov/documents/2021/05/27/2021-11167/monitoring-availability-and-affordability-of-auto-insurance-assessing-potential-evolution-of-the 26 Rates also must not be unfairly discriminatory, but we will deal with that facet of pricing later.
9
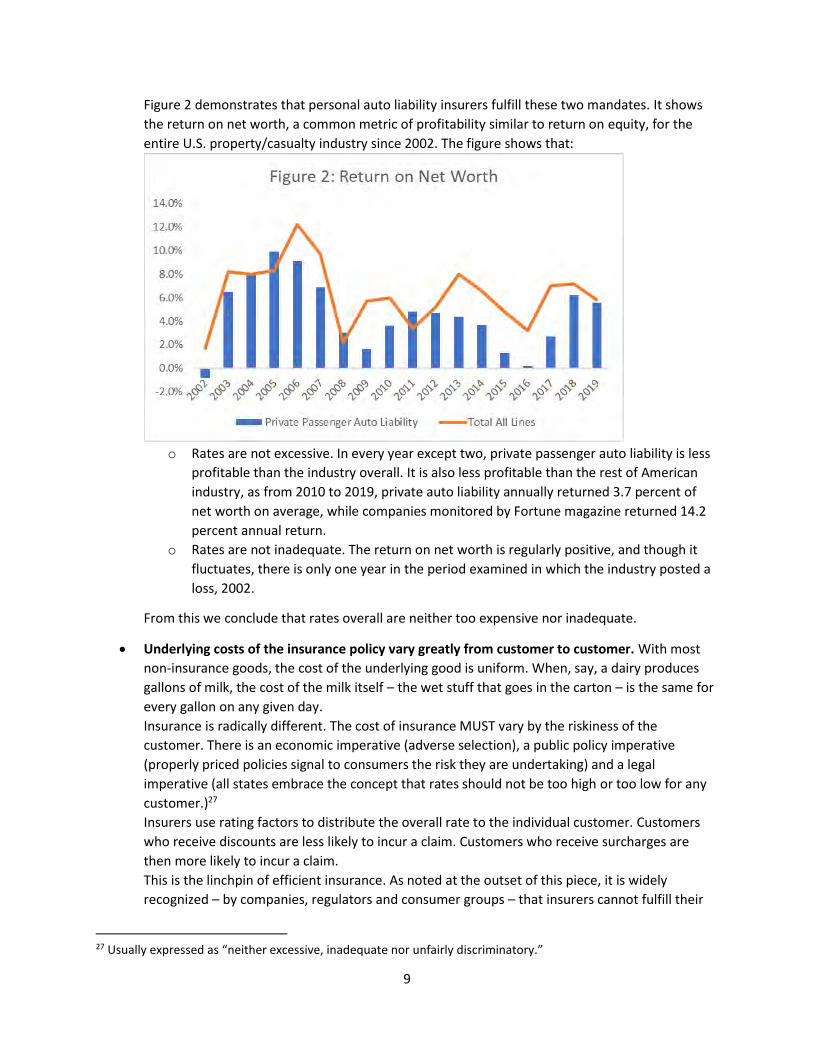
Figure 2 demonstrates that personal auto liability insurers fulfill these two mandates. It shows
the return on net worth, a common metric of profitability similar to return on equity, for the
entire U.S. property/casualty industry since 2002. The figure shows that:
o Rates are not excessive. In every year except two, private passenger auto liability is less
profitable than the industry overall. It is also less profitable than the rest of American
industry, as from 2010 to 2019, private auto liability annually returned 3.7 percent of
net worth on average, while companies monitored by Fortune magazine returned 14.2
percent annual return.
o Rates are not inadequate. The return on net worth is regularly positive, and though it
fluctuates, there is only one year in the period examined in which the industry posted a
loss, 2002.
From this we conclude that rates overall are neither too expensive nor inadequate.
• Underlying costs of the insurance policy vary greatly from customer to customer. With most
non-insurance goods, the cost of the underlying good is uniform. When, say, a dairy produces
gallons of milk, the cost of the milk itself – the wet stuff that goes in the carton – is the same for
every gallon on any given day.
Insurance is radically different. The cost of insurance MUST vary by the riskiness of the
customer. There is an economic imperative (adverse selection), a public policy imperative
(properly priced policies signal to consumers the risk they are undertaking) and a legal
imperative (all states embrace the concept that rates should not be too high or too low for any
customer.)27
Insurers use rating factors to distribute the overall rate to the individual customer. Customers
who receive discounts are less likely to incur a claim. Customers who receive surcharges are
then more likely to incur a claim.
This is the linchpin of efficient insurance. As noted at the outset of this piece, it is widely
recognized – by companies, regulators and consumer groups – that insurers cannot fulfill their
27 Usually expressed as “neither excessive, inadequate nor unfairly discriminatory.”

10
obligations to policyholders, investors, regulators and the common good to appropriately
allocate risk without the use of rating factors.
Insurers must prove, for their own financial well-being and to fulfill state insurance laws, that
the rating factors they use appropriately assign risk.
The combination of these two factors – insurance is a cost-plus product whose underlying costs vary
greatly from customer to customer – means that the appropriate price for an insurance policy varies a
great deal from customer to customer.
The distinction that FIO makes between driving factors and non-driving factors is a recent concept and
not one commonly used within the industry. The vast majority of rating factors have been non-driving
factors. Insurance companies and their actuaries have focused on finding factors that make sure that
every customer pays the appropriate rate. A brief history of rating factors shows that insurers look hard
for potential rating factors, test them, embrace the ones that work and discard the ones that do not.
The first actuarially justified rating factor was a non-driving variable: age. During the 1930s, the
Connecticut Motor Vehicle Department noticed that drivers 25 and younger were far more likely to be
involved in an accident than older drivers. In 1939, a three-factor plan appeared. The factors were age of
driver, mileage and whether the vehicle was used for business.28
Those last two factors - business use and mileage - were not backed by statistical proof but by common
sense. The rate adjustments due to them were slight, as it was felt additional data gathering would allow
them to be refined.
But in the early days, age - the non-driving factor - was a clear differentiator, while mileage, perhaps
somewhat mysteriously - was not.
That changed with World War II and gas rationing. Rationing was enforced by a sticker on the vehicle. A-
stickered vehicles were limited to three gallons a week. C-stickered vehicles were for business use and
were allotted more fuel. A-stickered vehicles enjoyed a lower accident rate. Insurers gave them a
discount. C-stickered vehicles received a surcharge. Note that the rating factor was not mileage. It was
the sticker - a non-driving factor that served as an excellent proxy for a driving factor (mileage).
The stickers were remarkably effective at predicting crash rates, so much so that some said it was
mileage, not age, that was the better accident predictor, though one might note there was a dearth of
males under 25 on the nation's roads during World War II.
Massachusetts tried to gather information on both factors immediately after the war. Insurers were
instructed to collect information on the age and expected mileage of cars by having their brokers and
agents obtain a signed questionnaire.
A funny thing happened. Age regained its predictive power. Miles driven lost its.
The former is easy to understand. The war ended, and young men came home. The ones under 25 drove
the way that young men had driven before and, to a greater or lesser degree, continue to drive.
28 Lawrence W. Scammon, “Automobile Accident Statistics by ‘Age of Driver,’” Proceedings of the Casualty Actuarial Society 37, no. 1 (November 17, 1950): 43–56.

11
What happened to miles driven is a bit more complex, but quite important to understanding what
actuaries look for in a rating factor.
During the war, the rationing sticker objectively revealed how much the vehicle was driven. Cars with A
stickers weren't traveling farther than three gallons could take them (maybe 50 miles).
After the war, the miles-driven rating factor depended on the word of the vehicle owner. A person had
to know how many miles they typically drove in a year. If they were wrong, their error confounded the
ability of the factor to do its job. And apparently a lot of people got it wrong.
So, a rating factor must be objective. Both age and miles driven are objective.29 A person's age is
objective. Either you are under age 25 or you are older. Either you drive less than 7,500 miles per year or
you drive more than that.
And almost as important, it must be verifiable and inexpensive to administer. A driver's license or
other ID can prove one's age, and that age is easy to update annually.
Predicting the miles driven turned out to be much harder to verify. It was also expensive to administer.
One can imagine the paperwork agents generated and the cost, gathering signed questionnaires and
placing them into company files. Then company actuaries had to collate the information (before
computers) and make calculations. Worse still, it was not predictive. So direct gathering of mileage
information was curtailed.
For the 70 or so years since then, the search for rating factors has routinely involved combing through
factors and adopting the ones that do their jobs well. Many of those involve proxies for miles driven.
The history of the gender rating variable can provide insight into some other important considerations
regarding rating variables.
Insurers adopted gender as a rating factor in the 1950s, with women receiving a discount. Women drove
considerably fewer miles than men, because of the way society was structured. Men held more jobs
than women, so drove more work-related miles. And there was a perception that driving was a
masculine behavior, so if a married couple traveled together, the man drove. So, gender was a good
proxy for miles driven, better than having agents collect unreliable estimates. It was easy to verify and
inexpensive to administer. And it was predictive. Women drove less and got into fewer accidents, so
they deserved a lower rate.
In the ensuing decades, the roles of men and women in society have changed, and the predictive power
of the gender rating factor has declined. Women are still involved in fewer accidents than men, but the
difference has shrunk, as women constitute a larger percentage of the workforce and other societal
factors have changed. From 2000 to 2015, for example, the crash rate of male drivers fell 16 percent and
the rate for female drivers has fallen just 7 percent.30
29 A fuller discussion of the statistical, operational, societal and legal issues actuaries consider when creating rating variables can be found in Geoff Werner and Claudine Modlin, Basic Ratemaking, Fifth Edition (Casualty Actuarial Society, 2016), https://www.casact.org/sites/default/files/old/studynotes_werner_modlin_ratemaking.pdf. 30 James Lynch, “General Insurance Headlines – What Will the Post-COVID World Bring General Insurance?” (ASTIN 2021 Online Colloquium, Virtual Event, May 21, 2021).

12
Insurers have adjusted their rating factors, both as society changes and as they have discovered new
rating factors to hone their estimates. These mean that rating factors are not static, and there is an
economic need for insurers to continually update them. Insurers need to have a robust rating system
that predicts as accurately as possible. If they let an old system lie fallow, competitors will find new
factors and revise old ones.
The competitor’s system will price more accurately. Customers who deserve a lower rate will go to the
competitor’s accurate pricing. Customers who should be paying more will stay with the original insurer,
who is undercharging them, and that original insurer will find itself losing money, until it revises its own
rating factors or leaves the marketplace.
This means that all the factors that companies use not only serve their purpose, but they are
constantly re-tested to ensure they serve their purpose. Variables are also regulated by every state, to
which insurers must demonstrate their predictive power. The process ensures that no risk overpays or
underpays for insurance.
Meanwhile, insurers have continued to find rating factors. Some are directly related to driving, such as
being in an accident or receiving a moving violation. Some are not, such as education, occupation or
insurance credit score, which is an amalgam of factors taken from credit reports that when combined do
an excellent job.
If rating factors do their job well, they make insurance relatively inexpensive for some people and
quite expensive for others. In both cases, the assessment is correct. Those who pay less present less
risk.
The fact that rating factors work puts them before considerable scrutiny. Some dislike the nature of the
variable. Some need to see a causal relationship between the variable and the result.
These are important questions from a public policy standpoint. If regulators and the public are repulsed
by the use of certain variables, they can be restricted. Gender is banned in several states. Insurance
credit score is also banned in some states, and it is heavily regulated in the states where it is permitted.
Occasionally the distaste with a variable is accompanied by skepticism as to whether it is effective. The
most prominent recent example was an indictment of the entire system of rating factors. The work,
published by Consumer Reports and ProPublica in 2017, alleged that “some major insurers charge
minority neighborhoods as much as 30 percent more than other areas with similar accident costs.”31
That charge is simply inaccurate and has been proved inaccurate several times over. It resulted from,
among several things, the failure of ProPublica/Consumer Reports researchers to make adequate
adjustments for ZIP codes with small amounts of data. Researchers, regulators and policymakers who
took the allegations seriously, examined them from different perspectives and, in every instance that we
are aware of, found them wanting.32 Summarizing what it found, the Missouri Department of Insurance
31 Julia Angwin et al., “Minority Neighborhoods Pay Higher Car Insurance Premiums Than White Areas With the Same Risk,” ProPublica, April 5, 2017, https://www.propublica.org/article/minority-neighborhoods-higher-car-insurance-premiums-white-areas-same-risk?token=F1W4XoVHukeDvXTmrb8HqM4rO-mJyOjp. 32 James Lynch, “Rating Automobile Insurance: A Critique of Two Studies,” written testimony to Colorado House Committee on Health & Insurance (2021), http://coga.prod.acquia-sites.com/sites/default/files/html-attachments/68d48a036839a0c6872586e3007dd3ae__hearing_summary/21HouseHealth0528AttachB.pdf.

13
succinctly concluded: “No evidence was found that would indicate that higher rated territories are
charged more relative to risk than lower-rated territories,” adding in a footnote, “ProPublica got the
analysis entirely wrong.”33
Insurers do not condone, embrace or practice disparate treatment. To assure this they spend significant
amounts on compliance personnel to verify that their practices adhere to the letter and spirit of all
applicable state and federal laws.
Lawmakers and insurance regulators have vigorously examined accusations of racial bias, either
conscious or unconscious, when they have been leveled against insurers. Last year, as part of the
nationwide re-examination of racial issues in the wake of the death of George Floyd, the National
Association of Insurance Commissioners created a Special Committee on Race and Insurance to consider
how the industry diversify and be more inclusive in hiring as well as to understand industry practices
that might be harmful to persons of color or members of historically underrepresented groups.34
Rating factors work. Companies accumulate the data behind the factors, sometimes by purchasing it,
expend considerable effort to integrate the data with their internal systems, hire teams of actuaries and
data scientists – many of whom make more than $100,000 a year – to study them and employ
departments of compliance workers to file them in every state of the union. Regulators verify their
accuracy. The marketplace acts as final arbiter. If rates are too high, the insurer loses profitable business
to competitors; if too low, it loses money. This process – data collection, analysis, rate filing, regulatory
review, market vindication – is repeated countless times every year, in every state.
They are crucial to creating the price charged for a price-sensitive product, one with, as noted above,
tight profit margins. Everyone in the insurance system – actuaries, underwriters, company executives
and regulators – has enormous incentives to create factors that accurately reflect the risk of loss.
Given the scrutiny they receive, it would be stupefying if they didn’t work.
It is important to confirm the accuracy of rating factors, but dozens of state regulators and the discipline
of the marketplace already ensure this happens. There can also be public policy reasons for curtailing
the use of variables, and state regulators already serve that purpose.
In assessing the role of any rating factor, these are the salient points:
• Rating factors work. They accurately project the likelihood of loss at the individual customer
level.
• Eliminating any factor – for whatever reason – forces those with lesser risk to overpay for
their policy and allows those with greater risk to pay less than they should. This moves the
insurance system away from the principle that we noted everyone agreed to – that insurance
premiums should be related to risk.
• Eliminating factors does not affect the truth that they reveal, and if factors reveal that costs
need to be high for a customer, banning them does nothing to change the underlying costs
33 Missouri Department of Insurance, Financial Institutions & Professional Regulation, “Private Passenger Automobile Insurance: A Review of the Market in Missouri.” 34 Ann Young Black and Carlton Fields, “NAIC Rings in a New Year for Addressing Racial Inequities,” JD Supra, December 21, 2020, https://www.jdsupra.com/legalnews/naic-rings-in-a-new-year-for-addressing-81401/.
14
that are the reason the rate is high. In time insurers will find other factors that will do the work
that the banned factors were not allowed to do. The rating variable is no more responsible for
the cost of insurance than the weather forecaster is responsible for the storm.
The history of insurance is littered with examples of regulatory regimes that decided to supersede the
prices that accurate actuarial work revealed.
PART THREE: CRITIQUE OF REGULATORY SOLUTIONS
One of the points we emphasize in this paper is that awkward attempts to address affordability
problems create availability problems. If rates cannot be set at an adequate level, insurers will shun the
market. The business they do not write moves to the residual market.
Residual markets are widely considered an imperfect solution to providing insurance in a marketplace
intended to be private and competitive. Normally “the worst drivers” occupy the residual market, those
who because of repeated driving violations, numerous accidents or other highly unusual situations are
unable to find insurance in the private market.
In an efficient marketplace, the residual market should be small, as competitors vying for each customer
will seek to find an appropriate rate. In the insurance industry, the saying goes, “Every risk can be
rated.” This will be true as long as constraints on pricing are not too burdensome.
A large or rapidly growing residual market is prima facie evidence of an availability problem. The
residual market would not exist if coverage were available, virtually by definition.
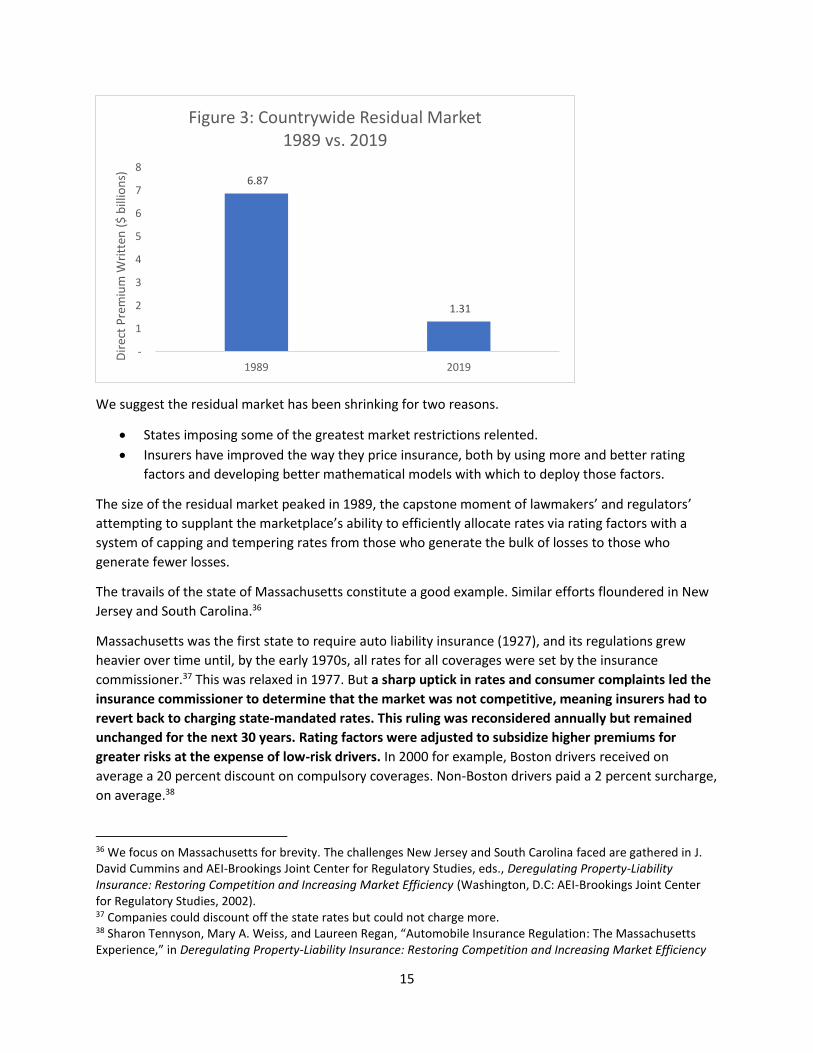
Availability problems are seldom discussed today because the residual market has shrunk nationwide.
Figure 3 shows the remarkable depopulation of the residual market, with premium volume countrywide
falling 81 percent over the past three decades.35 (Adjusted for motor vehicle inflation, the market has
fallen 94 percent in that time.)
35 1989 data from John D Worrall, “Private Passenger Auto Insurance in New Jersey: A Three Decade Advert for Reform” (AEI-Brookings Conference on Insurance Rate Regulation, Washington, DC, 2001), 81, https://economics.camden.rutgers.edu/files/2012/06/FULLPAP.pdf. 2019 data from AIPSO at https://www.aipso.com/Industry-Data.
15
We suggest the residual market has been shrinking for two reasons.
• States imposing some of the greatest market restrictions relented.
• Insurers have improved the way they price insurance, both by using more and better rating
factors and developing better mathematical models with which to deploy those factors.
The size of the residual market peaked in 1989, the capstone moment of lawmakers’ and regulators’
attempting to supplant the marketplace’s ability to efficiently allocate rates via rating factors with a
system of capping and tempering rates from those who generate the bulk of losses to those who
generate fewer losses.
The travails of the state of Massachusetts constitute a good example. Similar efforts floundered in New
Jersey and South Carolina.36
Massachusetts was the first state to require auto liability insurance (1927), and its regulations grew
heavier over time until, by the early 1970s, all rates for all coverages were set by the insurance
commissioner.37 This was relaxed in 1977. But a sharp uptick in rates and consumer complaints led the
insurance commissioner to determine that the market was not competitive, meaning insurers had to
revert back to charging state-mandated rates. This ruling was reconsidered annually but remained
unchanged for the next 30 years. Rating factors were adjusted to subsidize higher premiums for
greater risks at the expense of low-risk drivers. In 2000 for example, Boston drivers received on
average a 20 percent discount on compulsory coverages. Non-Boston drivers paid a 2 percent surcharge,
on average.38
36 We focus on Massachusetts for brevity. The challenges New Jersey and South Carolina faced are gathered in J. David Cummins and AEI-Brookings Joint Center for Regulatory Studies, eds., Deregulating Property-Liability Insurance: Restoring Competition and Increasing Market Efficiency (Washington, D.C: AEI-Brookings Joint Center for Regulatory Studies, 2002). 37 Companies could discount off the state rates but could not charge more. 38 Sharon Tennyson, Mary A. Weiss, and Laureen Regan, “Automobile Insurance Regulation: The Massachusetts Experience,” in Deregulating Property-Liability Insurance: Restoring Competition and Increasing Market Efficiency
6.87
1.31
-
1
2
3
4
5
6
7
8
1989 2019
Dir
ect
Pre
miu
m W
ritt
en (
$ b
illio
ns)
Figure 3: Countrywide Residual Market1989 vs. 2019
16
The state also restricted the ability of companies to leave the market. Despite that, the number of direct
writers in the state fell 39 percent (to 38 companies), much sharper than the 22 percent decline
nationwide. So the ruling that the insurance market was noncompetitive actually made the market
less competitive.
Insurers had to sell a policy to everyone who wanted one, but could cede any risk into the state’s
residual market. Not surprisingly, they ceded risks of subsidized drivers, like young persons – getting the
unprofitable business off their books.
The residual market grew swiftly. In the early 1980s it had been a size typical for highly regulated states,
being less than one-tenth of the total auto market. By 1989, about 70 percent of Massachusetts autos
sat in the residual market. The average vehicle in the residual market was undercharged more than
$160. By attempting to make insurance more affordable, Massachusetts made it less available.
Regulators and legislators gradually relaxed these provisions, and since 2008, the insurance
commissioner has ruled the market to be competitive. Insurers have much more flexibility to use rating
factors, though several factors, including age, gender, insurance credit score are banned.
The residual market itself has shrunk as the regulatory burden has lightened. By 2018, only about 1
percent of auto premium was ceded.39 Still, Massachusetts has the second largest residual market, with
more than $89 million ceded in 2019.40
The swift move to heavy regulation and subsidization created a natural experiment into how restrictive
class plans can distort insurance markets. 41 Here are the lessons relevant in this discussion:
• Attempts to subsidize risks create an availability problem. Insurers will shun underpriced risks,
and if the market is sufficiently disrupted, many companies will leave.
• Extensive subsidies make insurance more expensive overall.
o Low risk consumers are overcharged, so they are less likely to participate in the
insurance pool. So the pool has a higher proportion of high risk consumers.
o Subsidies reduce the benefit of risk aversion, so all consumers face reduced incentives
for loss prevention and safety investments.
o Fraudulent claims become more likely as the incentives to behave are reduced.
o Insurers face inadequate incentives to reduce losses, because the worst risks will be
passed to the residual market.
• Relaxing the subsidies and establishing a fraud bureau mitigated the increase in the size of the
residual market.
(Washington, D.C: AEI-Brookings Joint Center for Regulatory Studies, 2002), 25–88, https://www.aei.org/wp-content/uploads/2011/10/deregulating%20property%20liability%20insurance.pdf. 39 “2018 Annual Report” (Commonwealth of Massachusetts, Division of Insurance), accessed July 8, 2021, https://www.mass.gov/doc/doi-2018-annual-report/download. 40 2019 data from AIPSO at https://www.aipso.com/Industry-Data. The No. 1 state, North Carolina, has a $950 million residual market, constituting nearly 75 percent of the entire U.S. residual market. 41 Richard Derrig and Sharon Tennyson, “The Impact of Rate Regulation on Claims: Evidence from Massachusetts Automobile Insurance,” Risk Management and Insurance Review 14, no. 2 (January 2008): 173–99, https://doi.org/10.2139/ssrn.1115377.
17
In the decade after the state rescinded the ‘noncompetitive’ label, 17 insurers began writing private
passenger auto in the state. The marketplace itself, not the regulator, made the market more
competitive.
Onerous restrictions on rating factors also deter innovation. The best example here is California, which
since the passage of Proposition 103 in 1988 has placed extreme limits on what rating factors can be
used, as well as rating the importance of factors relative to one another.
As a result, there are scant opportunities for innovation in rating factors in the state. The most notable
impact here is in the inability of insurers to use telematics data – driving factors – as rating factors.
Insurers have been increasing their promotion of telematics-based insurance products, both as a way to
more accurately price their product and to create incentives for customers to drive less and drive more
safely.42 Were California-like restrictions in place at the federal level, no insurer would have developed
telematics-based pricing. They would have had nowhere to implement it.43
There has been considerable interest in using telematics data in place of current rating factors. A couple
of points should be noted:
• Insurers have chosen to use telematics to supplement, rather than replace, their current
rating factors. For telematics to be effective as a rating factor, it has to be as predictive as
current factors as well as cost effective. In other words, the precision gained by their use has to
exceed the cost of gathering the new information. This was difficult to achieve in the early days
of the technology. Traditional factors do the job well, and gathering data for them has been
relatively expensive.44 More recently, several insurers have adopted technology that lets the
driver’s smartphone gather information at less expense than prior methods required.45
• Telematics’ success also depends on its acceptance in the marketplace. Though consumer
acceptance of the concept has been growing, at most companies, telematics-based products
constitute less than 10 percent of current business.46
• Telematics to date has largely reinforced the predictive value of existing rating factors.47 So an
embrace of telematics data, perfectly implemented, will likely leave rates more or less where
they are and is unlikely to affect affordability issues, however such issues might be defined.
42 “Telematics/Usage-Based Insurance,” National Association of Insurance Commissioners, May 27, 2021, https://content.naic.org/cipr_topics/topic_telematicsusagebased_insurance.htm. 43 Rating factors can be added in California, but only ones that have been adopted by the commissioner of insurance. 44 James Lynch, “Casualty Actuaries Grapple with the Details of the Telematics Revolution,” Actuarial Review Magazine, May 28, 2014, https://ar.casact.org/casualty-actuaries-grapple-with-the-details-of-the-telematics-revolution/. 45 One insurer, with less than 0.5 percent market share, has pledged to stop using insurance credit scores by 2025. “Drop the Score,” accessed July 11, 2021, https://www.joinroot.com/drop-credit-scores-from-insurance-rate-pricing/. 46 Annmarie Geddes Baribeau, “Getting Personal - Can IoT Do for Homeowners Insurance What Telematics Did for Auto Coverage?” Actuarial Review Magazine, May 26, 2021, https://ar.casact.org/getting-personal-can-iot-do-for-homeowners-insurance-what-telematics-did-for-auto-coverage/. 47 James Lynch, “Casualty Actuaries Grapple with the Details of the Telematics Revolution.”
18
Part 4: REAL SOLUTIONS TO AFFORDABILITY PROBLEMS
Despite the challenges in defining the affordability problem and the shortcomings of some proposed
solutions, most industry observers recognize that auto insurance can be expensive. The structure of
society has, unfortunately, forced many minorities and LMI individuals to live in densely populated
areas, where auto insurance costs are highest.
Affordability problems are best dealt with by addressing issues that drive insurance costs higher. The
Insurance Information Institute does not endorse any specific legislation but raises these issues as
examples of potential ways to reduce costs. Possibilities fall into three general categories:
• Changes to the insurance ecosystem.
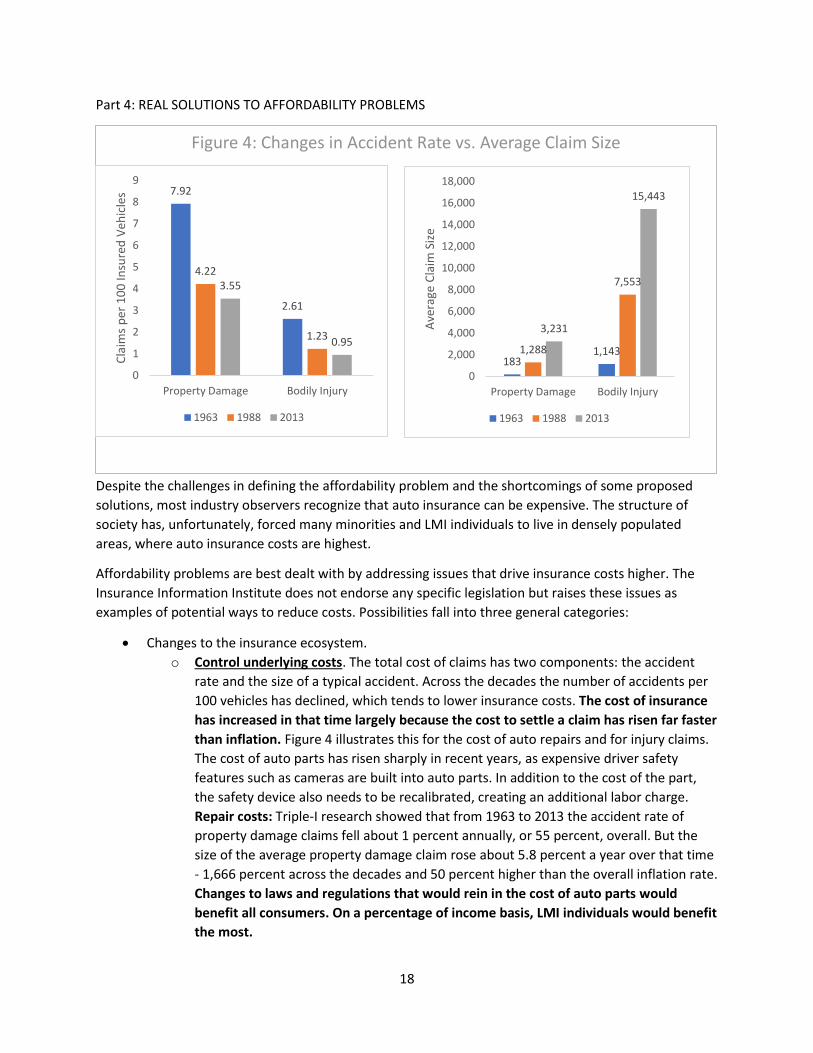
o Control underlying costs. The total cost of claims has two components: the accident
rate and the size of a typical accident. Across the decades the number of accidents per
100 vehicles has declined, which tends to lower insurance costs. The cost of insurance
has increased in that time largely because the cost to settle a claim has risen far faster
than inflation. Figure 4 illustrates this for the cost of auto repairs and for injury claims.
The cost of auto parts has risen sharply in recent years, as expensive driver safety
features such as cameras are built into auto parts. In addition to the cost of the part,
the safety device also needs to be recalibrated, creating an additional labor charge.
Repair costs: Triple-I research showed that from 1963 to 2013 the accident rate of
property damage claims fell about 1 percent annually, or 55 percent, overall. But the
size of the average property damage claim rose about 5.8 percent a year over that time
- 1,666 percent across the decades and 50 percent higher than the overall inflation rate.
Changes to laws and regulations that would rein in the cost of auto parts would
benefit all consumers. On a percentage of income basis, LMI individuals would benefit
the most.
Figure 4: Changes in Accident Rate vs. Average Claim Size
7.92
2.61
4.22
1.23
3.55
0.95
0
1
2
3
4
5
6
7
8
9
Property Damage Bodily Injury
Cla
ims
per
10
0 In
sure
d V
ehic
les
1963 1988 2013
1831,1431,288
7,553
3,231
15,443
0
2,000
4,000
6,000
8,000
10,000
12,000
14,000
16,000
18,000
Property Damage Bodily Injury
Ave
rage
Cla
im S
ize
1963 1988 2013
19
Injury costs: The situation is similar in bodily injury coverage. The accident rate for
bodily injury claims fell 63 percent, but the size of the average claim rose 1,251
percent.48
Auto insurers have little ability to negotiate the medical costs for a liability claim. As a
result, hospitals and other care organizations have shifted costs onto auto insurance
claims.49 Revisions to this arrangement would lower costs, as the Insurance Research
Council is documenting in a separate response to the current FIO inquiry.
As part of its 2019 auto insurance reform, Michigan will require no-fault claims to be
paid according to a schedule. Many services are capped at 200 percent of what
Medicare receives for similar treatment.50 This and other changes promise to reduce
costs and premiums significantly.
o Insurance contract terms and conditions. Most states mandate certain terms of the
insurance contract, such as the minimum limit of liability. States that raise this
minimum will raise the cost of the most affordable insurance; if they lower the
minimum, premiums for that policy fall. Wisconsin saw both sides. There the cost of
minimum liability insurance rose as the state doubled its minimum limit in 2010, then
saw it fall when the state reverted back a year later.51
Michigan also recently reduced the amount of no-fault coverage it required. Before
2020, all policies had no limit on the size of no-fault claims, the only state with an
unlimited coverage. This made Michigan one of the most expensive in the nation for
auto insurance. The average claim in 2017 was $85,700, or more than seven times
larger than the No. 2 state (New Jersey).52
As part of its insurance reform, Michigan now allows customers a choice of no-fault
limits. Persons with certain types of health insurance can effectively opt-out of no-fault
coverage and let their health insurance cover injuries they might receive in an auto
accident.53
The Michigan reforms required insurers to reduce rates. Insurers questioned whether
the reductions were too large but largely agreed that there would be substantial
savings.54
48 Steven Weisbart and James Lynch, “Inflation From All Sides” (Casualty Actuarial Society Spring Meeting, Colorado Springs, CO, May 18, 2015), https://www.iii.org/presentation/inflation-from-all-sides-051915. 49 “Hospitals Shifting Costs to Auto Insurance System, Study Finds,” Insurance Journal, April 21, 2010, https://www.insurancejournal.com/news/national/2010/04/22/109193.htm. 50 Kathleen A. Westfall, “Michigan Auto No-Fault Reform Act: New Fee Schedule Cap Effective July 2, 2021,” Michigan State Medical Society, May 13, 2021, https://www.msms.org/About-MSMS/News-Media/michigan-auto-no-fault-reform-act-new-fee-schedule-cap-effective-july-2-2021. 51 Joe Forward, “Auto Insurance Changes,” Wisconsin Association for Justice, April 20, 2011, https://www.wisjustice.org/?pg=AutoInsuranceChanges. 52 National Association of Insurance Commissioners, “Auto Insurance Database Report 2017/2018,” February 2021, https://content.naic.org/sites/default/files/publication-aut-pb-auto-insurance-database.pdf. 53 J. C. Reindl, “How Michigan Drivers Can Get the Cheapest No-Fault Auto Insurance Rates,” Detroit Free Press, June 27, 2020, https://www.freep.com/story/money/business/2020/06/27/michigan-drivers-july-cheapest-rates/3235498001/. 54 Paul Egan and Kathleen Gray, “Bill to Lower Auto Insurance OK’d by Legislature, Sent to Governor,” Detroit Free Press, 24 2019, https://www.freep.com/story/news/politics/2019/05/24/whitmer-auto-insurance-premiums/1219399001/.
20
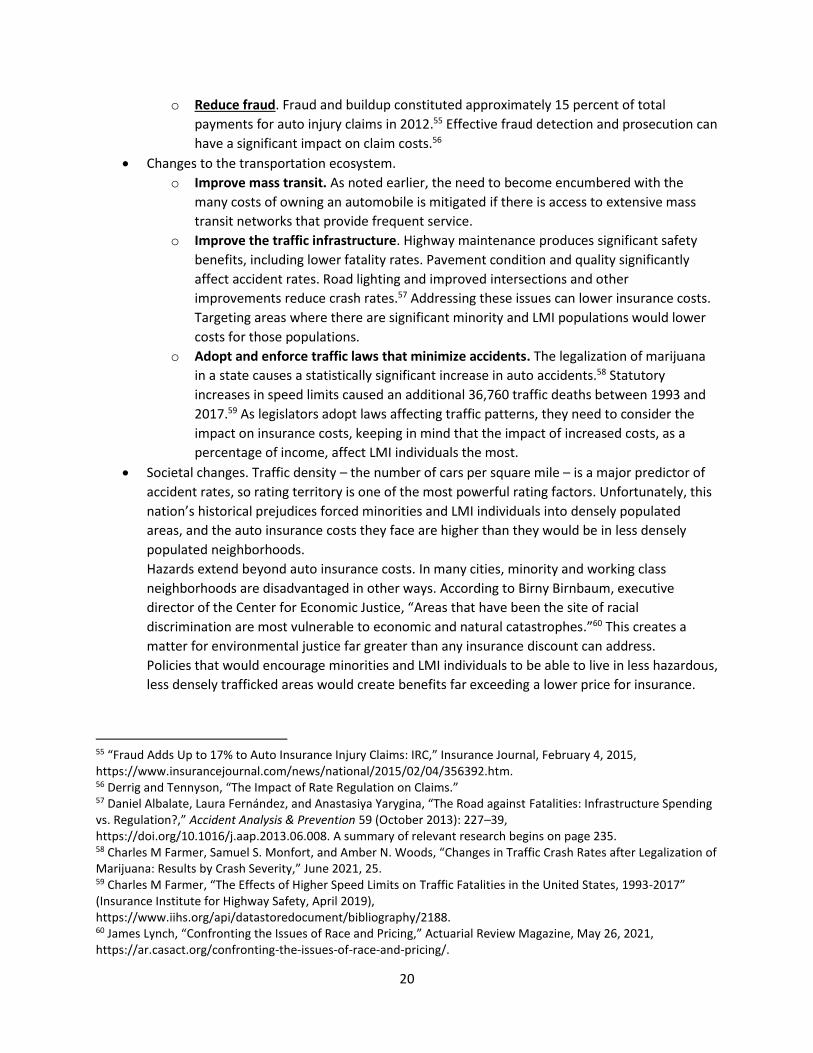
o Reduce fraud. Fraud and buildup constituted approximately 15 percent of total
payments for auto injury claims in 2012.55 Effective fraud detection and prosecution can
have a significant impact on claim costs.56
• Changes to the transportation ecosystem.
o Improve mass transit. As noted earlier, the need to become encumbered with the
many costs of owning an automobile is mitigated if there is access to extensive mass
transit networks that provide frequent service.
o Improve the traffic infrastructure. Highway maintenance produces significant safety
benefits, including lower fatality rates. Pavement condition and quality significantly
affect accident rates. Road lighting and improved intersections and other
improvements reduce crash rates.57 Addressing these issues can lower insurance costs.
Targeting areas where there are significant minority and LMI populations would lower
costs for those populations.
o Adopt and enforce traffic laws that minimize accidents. The legalization of marijuana
in a state causes a statistically significant increase in auto accidents.58 Statutory
increases in speed limits caused an additional 36,760 traffic deaths between 1993 and
2017.59 As legislators adopt laws affecting traffic patterns, they need to consider the
impact on insurance costs, keeping in mind that the impact of increased costs, as a
percentage of income, affect LMI individuals the most.
• Societal changes. Traffic density – the number of cars per square mile – is a major predictor of
accident rates, so rating territory is one of the most powerful rating factors. Unfortunately, this
nation’s historical prejudices forced minorities and LMI individuals into densely populated
areas, and the auto insurance costs they face are higher than they would be in less densely
populated neighborhoods.
Hazards extend beyond auto insurance costs. In many cities, minority and working class
neighborhoods are disadvantaged in other ways. According to Birny Birnbaum, executive
director of the Center for Economic Justice, “Areas that have been the site of racial
discrimination are most vulnerable to economic and natural catastrophes.”60 This creates a
matter for environmental justice far greater than any insurance discount can address.
Policies that would encourage minorities and LMI individuals to be able to live in less hazardous,
less densely trafficked areas would create benefits far exceeding a lower price for insurance.
55 “Fraud Adds Up to 17% to Auto Insurance Injury Claims: IRC,” Insurance Journal, February 4, 2015, https://www.insurancejournal.com/news/national/2015/02/04/356392.htm. 56 Derrig and Tennyson, “The Impact of Rate Regulation on Claims.” 57 Daniel Albalate, Laura Fernández, and Anastasiya Yarygina, “The Road against Fatalities: Infrastructure Spending vs. Regulation?,” Accident Analysis & Prevention 59 (October 2013): 227–39, https://doi.org/10.1016/j.aap.2013.06.008. A summary of relevant research begins on page 235. 58 Charles M Farmer, Samuel S. Monfort, and Amber N. Woods, “Changes in Traffic Crash Rates after Legalization of Marijuana: Results by Crash Severity,” June 2021, 25. 59 Charles M Farmer, “The Effects of Higher Speed Limits on Traffic Fatalities in the United States, 1993-2017” (Insurance Institute for Highway Safety, April 2019), https://www.iihs.org/api/datastoredocument/bibliography/2188. 60 James Lynch, “Confronting the Issues of Race and Pricing,” Actuarial Review Magazine, May 26, 2021, https://ar.casact.org/confronting-the-issues-of-race-and-pricing/.

21
CONCLUSION
Reviewing more than 80 years of rating variables and the myriad ways that companies, regulators and
legislators have approached them leads us to conclude:
• Competition is the most effective way to price auto insurance policies properly. Alternatives risk
sacrificing availability at the altar of affordability.
• Regulatory approaches should be undertaken with great care. This would appear to particularly
be true at the federal level, as any federal imperatives would interact with the significant
restrictions that individual states already place on rating variables.61
• Rating variables allow insurers to charge their customers the correct rate – neither too high nor
too low. Restrictions on rating variables thwart the desire – shared by insurers, legislators,
regulators and consumer advocates – to charge all customers appropriately.
• Affordability problems are best resolved by addressing the factors that drive claim costs higher.
61A compendium of state-by-state pricing laws is 792 pages long: American Property Casualty Insurance Association, “APCIA Risk Based Pricing Laws: 2020-2021 Edition” (American Property Casualty Insurance Association, n.d.).

22
BIBLIOGRAPHY
“2018 Annual Report.” Commonwealth of Massachusetts, Division of Insurance. Accessed July 8, 2021.
https://www.mass.gov/doc/doi-2018-annual-report/download.
Albalate, Daniel, Laura Fernández, and Anastasiya Yarygina. “The Road against Fatalities: Infrastructure
Spending vs. Regulation?” Accident Analysis & Prevention 59 (October 2013): 227–39.
https://doi.org/10.1016/j.aap.2013.06.008.
American Property Casualty Insurance Association. “APCIA Risk Based Pricing Laws: 2020-2021 Edition.”
American Property Casualty Insurance Association, n.d.
———. “Re: NAIC Special Committee on Race and Insurance Charges and Workstreams,” 9 10 20.
https://content.naic.org/sites/default/files/call_materials/APCIA%20Comments.pdf.
Angwin, Julia, Laura Kirchner, Jeff Larson, and Surya Mattu. “Minority Neighborhoods Pay Higher Car
Insurance Premiums Than White Areas With the Same Risk.” ProPublica, April 5, 2017.
https://www.propublica.org/article/minority-neighborhoods-higher-car-insurance-premiums-white-
areas-same-risk?token=F1W4XoVHukeDvXTmrb8HqM4rO-mJyOjp.
Ann Young Black and Carlton Fields. “NAIC Rings in a New Year for Addressing Racial Inequities.” JD
Supra, December 21, 2020. https://www.jdsupra.com/legalnews/naic-rings-in-a-new-year-for-
addressing-81401/.
Annmarie Geddes Baribeau. “Getting Personal - Can IoT Do for Homeowners Insurance What Telematics
Did for Auto Coverage?” Actuarial Review Magazine, May 26, 2021. https://ar.casact.org/getting-
personal-can-iot-do-for-homeowners-insurance-what-telematics-did-for-auto-coverage/.
Brown, Elizabeth F. “Will the Federal Insurance Office Improve Insurance Regulation?” University of
Cincinnati Law Review 81, no. 2 (2013): 551–99.
Bureau of Labor Statistics. “Vehicle Insurance Spending in the 2019 Annual Calendar Year Estimates.”
U.S. Bureau of Labor Statistics, September 9, 2020. https://www.bls.gov/cex/2019-vehicle-
insurance.htm.
Capps, Kriston, and Christopher Cannon. “Historically Redlined Neighborhoods Face Far Higher Flood
Risks.” Bloomberg.Com, March 15, 2021. https://www.bloomberg.com/graphics/2021-flood-risk-
redlining/.
Casualty Actuarial Society and Insurance Information Institute. “Insurance Rating Variables: What They
Are and Why They Matter,” July 2019.
https://www.iii.org/sites/default/files/docs/pdf/ratingvariables_cas-iii_wp072419.pdf.
Consumer Reports Digital Lab. “Effects of Varying Education Level and Job Status on Online Auto
Insurance Price Quotes,” January 2021. https://advocacy.consumerreports.org/wp-
content/uploads/2021/01/Auto-Insurance-White-Paper-Report-FINAL1.26C.pdf.
Cummins, J. David, and AEI-Brookings Joint Center for Regulatory Studies, eds. Deregulating Property-
Liability Insurance: Restoring Competition and Increasing Market Efficiency. Washington, D.C: AEI-
Brookings Joint Center for Regulatory Studies, 2002.

23
Derrig, Richard, and Sharon Tennyson. “The Impact of Rate Regulation on Claims: Evidence from
Massachusetts Automobile Insurance.” Risk Management and Insurance Review 14, no. 2 (January
2008): 173–99. https://doi.org/10.2139/ssrn.1115377.
“Drop the Score.” Accessed July 11, 2021. https://www.joinroot.com/drop-credit-scores-from-
insurance-rate-pricing/.
Farmer, Charles M. “The Effects of Higher Speed Limits on Traffic Fatalities in the United States, 1993-
2017.” Insurance Institute for Highway Safety, April 2019.
https://www.iihs.org/api/datastoredocument/bibliography/2188.
Farmer, Charles M, Samuel S. Monfort, and Amber N. Woods. “Changes in Traffic Crash Rates after
Legalization of Marijuana: Results by Crash Severity,” June 2021, 25.
Federal Insurance Office. “Study on the Affordability of Personal Automobile Insurance.” U.S.
Department of Treasury, January 2017. https://www.treasury.gov/initiatives/fio/reports-and-
notices/Documents/FINAL%20Auto%20Affordability%20Study_web.pdf.
Insurance Journal. “Fraud Adds Up to 17% to Auto Insurance Injury Claims: IRC,” February 4, 2015.
https://www.insurancejournal.com/news/national/2015/02/04/356392.htm.
Geoff Werner and Claudine Modlin. Basic Ratemaking. Fifth. Casualty Actuarial Society, 2016.
https://www.casact.org/sites/default/files/old/studynotes_werner_modlin_ratemaking.pdf.
Gray, Paul Egan and Kathleen. “Bill to Lower Auto Insurance OK’d by Legislature, Sent to Governor.”
Detroit Free Press, 24 2019. https://www.freep.com/story/news/politics/2019/05/24/whitmer-auto-
insurance-premiums/1219399001/.
“Hospitals Shifting Costs to Auto Insurance System, Study Finds.” Insurance Journal, April 21, 2010.
https://www.insurancejournal.com/news/national/2010/04/22/109193.htm.
Moovit. “How to Get to Vanderbilt and Dekalb Ave in Brooklyn by Subway or Bus.” Accessed July 1,
2021. https://moovitapp.com/index/en/public_transit-Vanderbilt_and_Dekalb_Ave-NYCNJ-
site_84871954-121.
J. Robert Hunter. “Comments of J. Robert Hunter, FCAS, MAAA, Director of Insurance for CFA Before the
Casualty Actuarial and Statistical Task Force of the National Association of Insurance Commissioners
February 9, 2021,” February 9, 2021.
James Lynch. “Casualty Actuaries Grapple with the Details of the Telematics Revolution.” Actuarial
Review Magazine, May 28, 2014. https://ar.casact.org/casualty-actuaries-grapple-with-the-details-of-
the-telematics-revolution/.
———. “Confronting the Issues of Race and Pricing.” Actuarial Review Magazine, May 26, 2021.
https://ar.casact.org/confronting-the-issues-of-race-and-pricing/.
———. “General Insurance Headlines – What Will the Post-COVID World Bring General Insurance?”
Presented at the ASTIN 2021 Online Colloquium, Virtual Event, May 21, 2021.
———. Rating Automobile Insurance: A critique of two studies, § House Committee on Health &
Insurance (2021). http://coga.prod.acquia-sites.com/sites/default/files/html-
24
attachments/68d48a036839a0c6872586e3007dd3ae__hearing_summary/21HouseHealth0528AttachB.
pdf.
Joe Forward. “Auto Insurance Changes.” Wisconsin Association for Justice, April 20, 2011.
https://www.wisjustice.org/?pg=AutoInsuranceChanges.
Kathleen A. Westfall. “Michigan Auto No-Fault Reform Act: New Fee Schedule Cap Effective July 2,
2021.” Michigan State Medical Society, May 13, 2021. https://www.msms.org/About-MSMS/News-
Media/michigan-auto-no-fault-reform-act-new-fee-schedule-cap-effective-july-2-2021.
Lawrence W. Scammon. “Automobile Accident Statistics by ‘Age of Driver.’” Proceedings of the Casualty
Actuarial Society 37, no. 1 (November 17, 1950): 43–56.
Maria Sassian and James Lynch. “Here’s What’s Happening to Your Auto Insurance Costs.” Triple-I Blog
(blog), May 13, 2021. https://www.iii.org/insuranceindustryblog/tag/covid-19-auto/.
Martin Grace, J., Tyler Leverty, and Lawrence Powell. “Cost Trends and Affordability of Automobile
Insurance in the U.S.” Journal of Insurance Regulation 38, no. 7 (2019): 24.
Missouri Department of Insurance, Financial Institutions & Professional Regulation. “Private Passenger
Automobile Insurance: A Review of the Market in Missouri,” July 2018.
National Safety Council. “Motor Vehicle Deaths in 2020 Estimated to Be Highest in 13 Years, Despite
Dramatic Drops in Miles Driven.” Accessed July 13, 2021. https://www.nsc.org/newsroom/motor-
vehicle-deaths-2020-estimated-to-be-highest.
National Association of Insurance Commissioners. “Auto Insurance Database Report 2017/2018,”
February 2021. https://content.naic.org/sites/default/files/publication-aut-pb-auto-insurance-
database.pdf.
Reindl, J. C. “How Michigan Drivers Can Get the Cheapest No-Fault Auto Insurance Rates.” Detroit Free
Press, June 27, 2020. https://www.freep.com/story/money/business/2020/06/27/michigan-drivers-july-
cheapest-rates/3235498001/.
Sharon Tennyson, Mary A. Weiss, and Laureen Regan. “Automobile Insurance Regulation: The
Massachusetts Experience.” In Deregulating Property-Liability Insurance: Restoring Competition and
Increasing Market Efficiency, 25–88. Washington, D.C: AEI-Brookings Joint Center for Regulatory Studies,
2002. https://www.aei.org/wp-
content/uploads/2011/10/deregulating%20property%20liability%20insurance.pdf?x91208.
Steven Weisbart and James Lynch. “Inflation From All Sides.” Presented at the Casualty Actuarial Society
Spring Meeting, Colorado Springs, CO, May 18, 2015. https://www.iii.org/presentation/inflation-from-
all-sides-051915.
National Association of Insurance Commissioners. “Telematics/Usage-Based Insurance,” May 27, 2021.
https://content.naic.org/cipr_topics/topic_telematicsusagebased_insurance.htm.
U.S. Department of Transportation, Federal Highway Administration. “Traffic Volume Trends,” 2020.
https://www.fhwa.dot.gov/policyinformation/travel_monitoring/tvt.cfm.

25
Wendell Cox. “How Lower Income Citizens Commute.” Newgeography.com, February 7, 2012.
http://www.newgeography.com/content/002666-how-lower-income-citizens-commute.
Worrall, John D. “Private Passenger Auto Insurance in New Jersey: A Three Decade Advert for Reform,”
81. Washington, DC, 2001. https://economics.camden.rutgers.edu/files/2012/06/FULLPAP.pdf.