The Basics of Candlesticks · PDF fileThe Japanese The Japanese people were the first to use...
59
The Basics of Candlesticks The Basics of Candlesticks Level 1
Transcript of The Basics of Candlesticks · PDF fileThe Japanese The Japanese people were the first to use...
The Basics of CandlesticksThe Basics of Candlesticks
Level 1
The Basics of CandlesticksThe Basics of Candlesticks
Introduction
The Basics
Basic Types of Candlesticks
Size, Frequency and Color
Support and Resistance
Relating Volume to Price Action

Level 1Level 1
Introduction
The JapaneseThe Japanese
The Japanese people were the first to use
technical analysis to trade futures markets,
rice futures, in their case. In the early
1600’s , trading rice futures beget much
speculation, which in turn, created
technical analysis.
HommaHomma
The most famous rice trader in the 1700’s was Munehisa Homma (1724-1803). He was a rice merchant from Sakata, Japan who traded in the Ojima Rice market in Osaka during the Tokugawa Shogunate. He is reputed to have become an honorary Samurai due to his trading success.
Until about 1710, only physical rice was traded but then a futures market emerged where coupons, promising delivery of rice at a future time, began to be issued. From this, a secondary market of coupon trading emerged in which Homma flourished. Stories claim that he established a personal network of men about every 6 Km between Sakata and Osaka (a distance of some 600 Km) to communicate market prices.
He was the first to recognize that sometimes the market perceived a harvest that often turned out totally different than expected. He deduced that the market was strongly influenced by the emotions of the traders.
He understood, before anyone else, that there was a difference in the value and the price of rice. This realization is as valid today in the futures market as it was in the 1700’s. He realized that the psychology aspect of the market was crucial to his trading success.
The Fountain of GoldThe Fountain of Gold
Homma is believed to have written a book by the name of “The Fountain of Gold –The Three Monkey Record of Money” in 1755, the first book ever on technical analysis. In this, he claims that the psychological aspect of the market is critical to trading successfully and that traders' emotions have a significant influence on prices. He notes that this information can be used to position oneself against the market: when all are bearish, there is cause for prices to rise(and vice versa).
The three monkeys are the “see, hear, speak no evil monkeys” we all learned about as children. The meaning of the title is that in order for traders to reach their “fountain of gold” they need to have the same characteristics of the three monkeys.
The Three MonkeysThe Three Monkeys
“See no evil” – when you see a trend, always,
consider the opportunity to make money on a
reversal.
“Hear no evil” – when you hear news (bullish or
bearish), don’t trade on it.
“Speak no evil” – don’t speak to others what you
are doing or going to do in the market.
“See No Evil”“See No Evil”
The book states that even the market has a yin and yang. There is always a balance or rotation of Yin (bearish) and Yang (bullish). Meaning that the market will always try to find a way to balance itself. Within every bull market, there is a bear market ready to bring balance to the market. Within every bear market, there is a bull market ready to bring balance to the market. This may explain why Japanese candlestick techniques place so much emphasis on reversals, rather than trends.
“Hear No Evil”“Hear No Evil”
The book states that it may be safer to
trade a position after the market has
reacted to the news rather than trading
with the news. We should pay less
attention to the news events and pay
more attention to the human reaction to
these news events.
“Speak No Evil”“Speak No Evil”
Don’t talk to people about what you are or about to do in the market. It is safer to only look to the market for direction in what you are going to do. People tend to give bad advise or talk against your position which may affect your actions or give you “cold feet”. If you want to know about the market, ask the market; not your friend or co-worker.
Level 1Level 1
The Basics
The CandlestickThe Candlestick
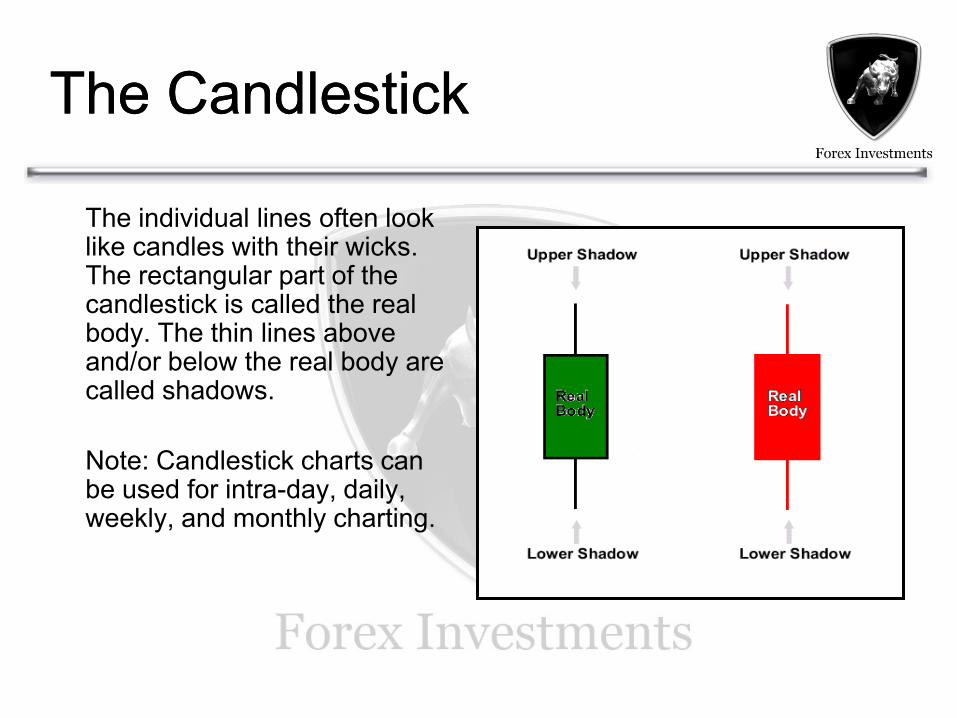
The individual lines often look like candles with their wicks. The rectangular part of the candlestick is called the real body. The thin lines above and/or below the real body are called shadows.
Note: Candlestick charts can be used for intra-day, daily, weekly, and monthly charting.
Candlestick FormationCandlestick Formation
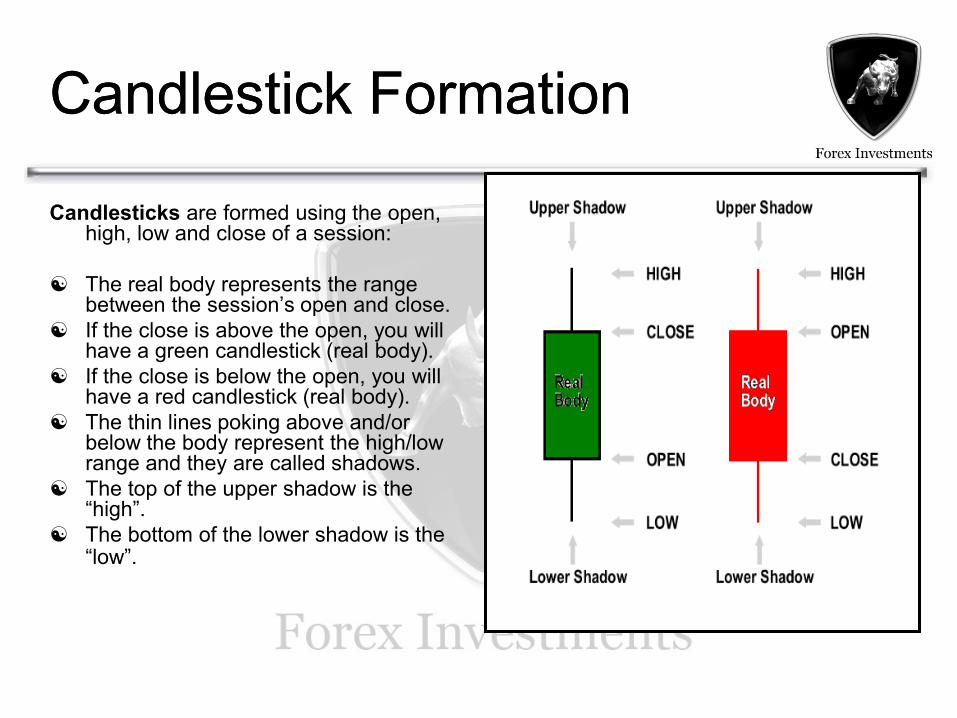
Candlesticks are formed using the open, high, low and close of a session:
The real body represents the range between the session’s open and close.
If the close is above the open, you will have a green candlestick (real body).
If the close is below the open, you will have a red candlestick (real body).
The thin lines poking above and/or below the body represent the high/low range and they are called shadows.
The top of the upper shadow is the “high”.
The bottom of the lower shadow is the “low”.
The Real BodyThe Real Body
The Japanese people believe that the real
body is the key to price movement. The
size and color of the real body gives us
vital clues to understanding and analyzing
the market. Through the height and color
of a real body, we can clearly see if the
session was a bull or bear.
Green vs. RedGreen vs. Red
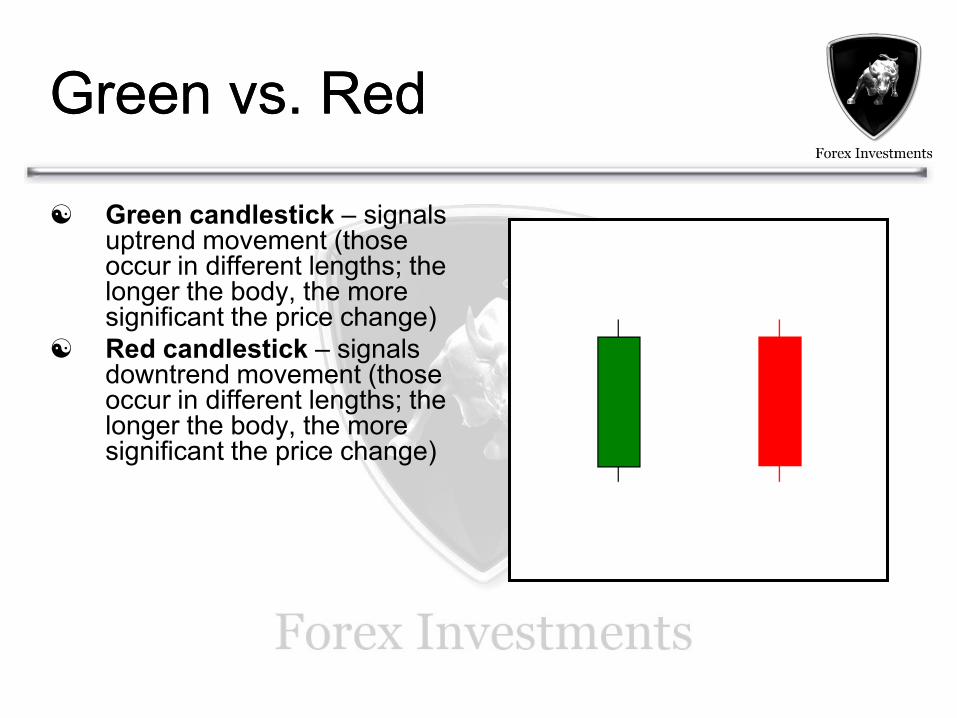
Green candlestick – signals uptrend movement (those occur in different lengths; the longer the body, the more significant the price change)
Red candlestick – signals downtrend movement (those occur in different lengths; the longer the body, the more significant the price change)
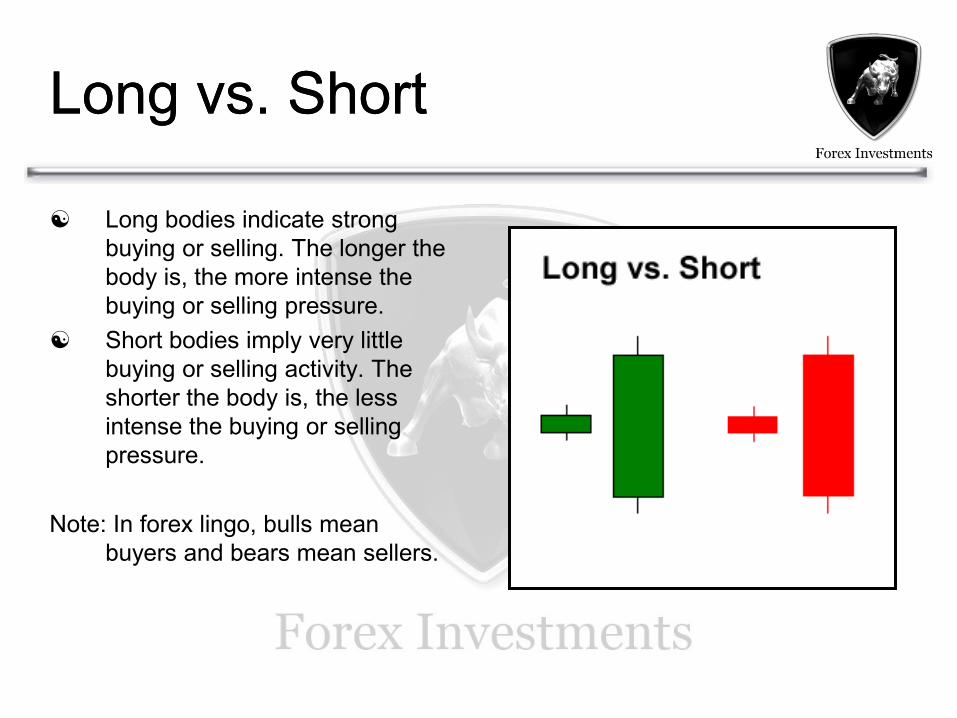
Long vs. ShortLong vs. Short
Long bodies indicate strong
buying or selling. The longer the
body is, the more intense the
buying or selling pressure.
Short bodies imply very little
buying or selling activity. The
shorter the body is, the less
intense the buying or selling
pressure.
Note: In forex lingo, bulls mean
buyers and bears mean sellers.
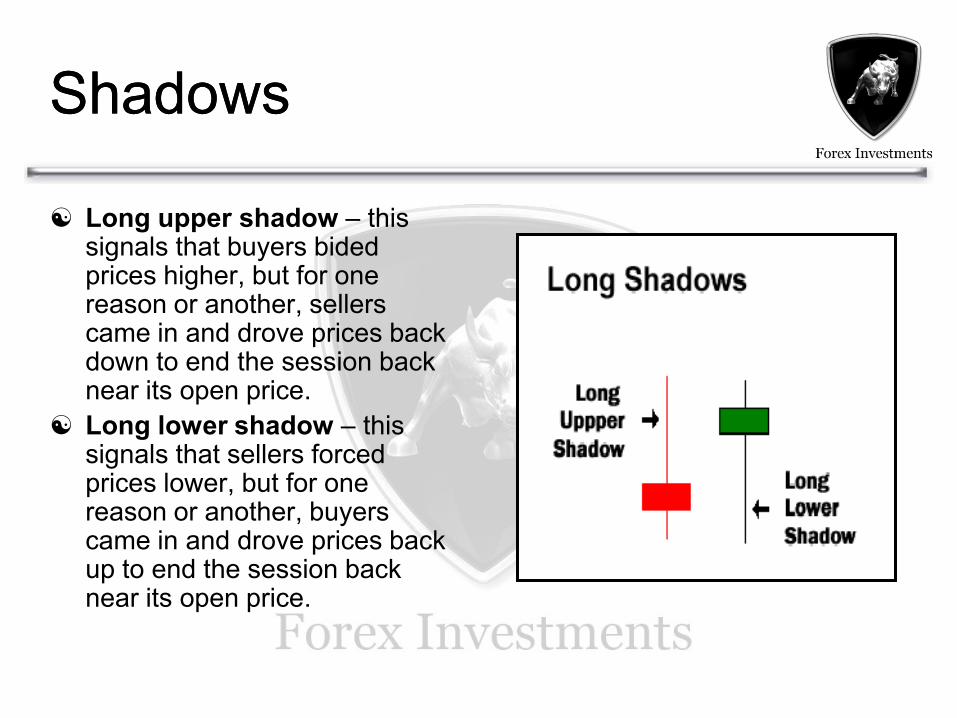
ShadowsShadows
Long upper shadow – this signals that buyers bided prices higher, but for one reason or another, sellers came in and drove prices back down to end the session back near its open price.
Long lower shadow – this signals that sellers forced prices lower, but for one reason or another, buyers came in and drove prices back up to end the session back near its open price.

Level 1Level 1
Basic Types of Candlesticks
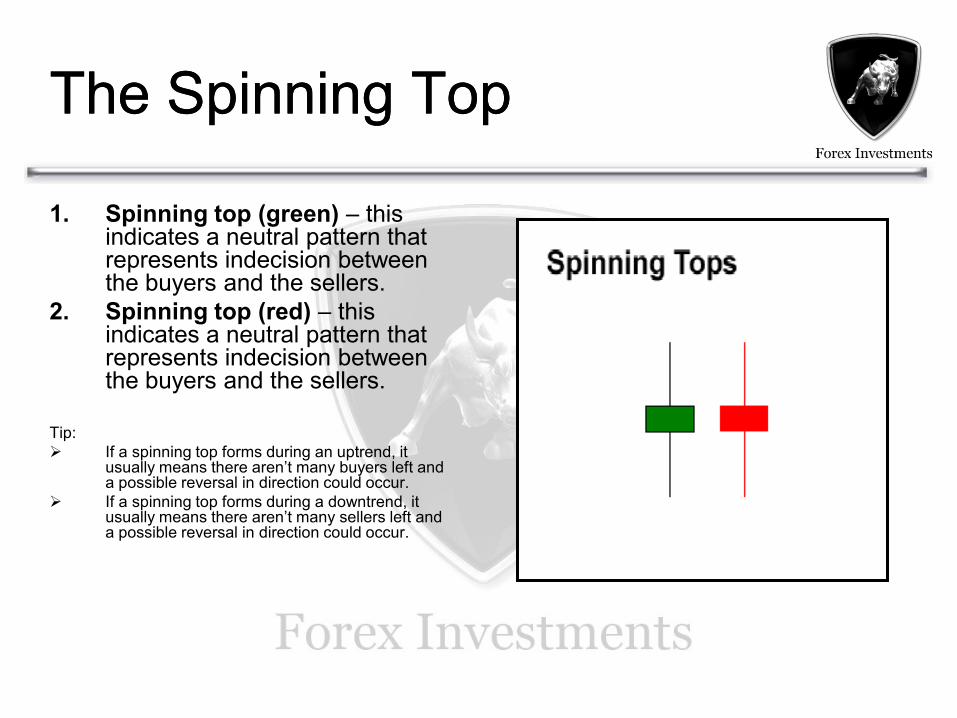
The Spinning TopThe Spinning Top
1. Spinning top (green) – this indicates a neutral pattern that represents indecision between the buyers and the sellers.
2. Spinning top (red) – this indicates a neutral pattern that represents indecision between the buyers and the sellers.
Tip:
If a spinning top forms during an uptrend, it usually means there aren’t many buyers left and a possible reversal in direction could occur.
If a spinning top forms during a downtrend, it usually means there aren’t many sellers left and a possible reversal in direction could occur.
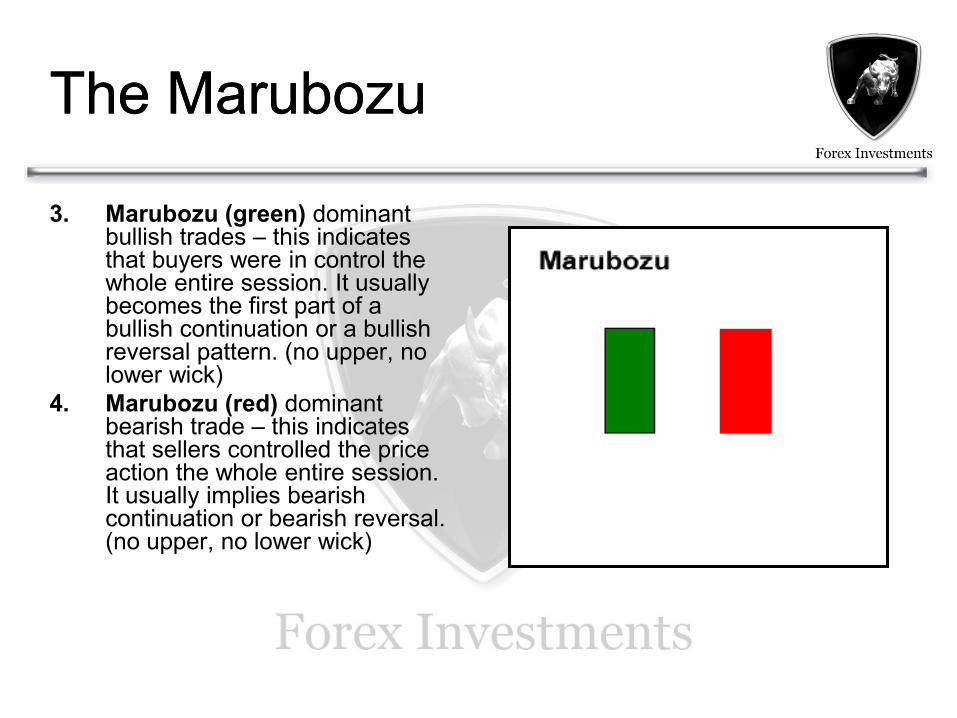
The MarubozuThe Marubozu
3. Marubozu (green) dominant bullish trades – this indicates that buyers were in control the whole entire session. It usually becomes the first part of a bullish continuation or a bullish reversal pattern. (no upper, no lower wick)
4. Marubozu (red) dominant bearish trade – this indicates that sellers controlled the price action the whole entire session. It usually implies bearish continuation or bearish reversal. (no upper, no lower wick)
DojisDojis
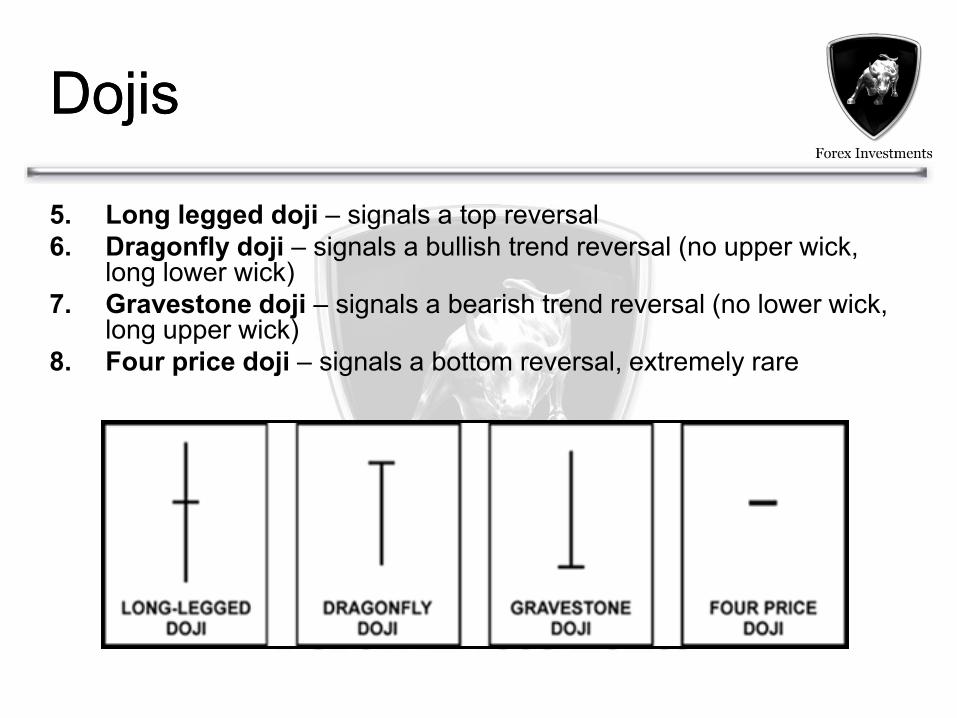
5. Long legged doji – signals a top reversal
6. Dragonfly doji – signals a bullish trend reversal (no upper wick, long lower wick)
7. Gravestone doji – signals a bearish trend reversal (no lower wick, long upper wick)
8. Four price doji – signals a bottom reversal, extremely rare
The HammerThe Hammer
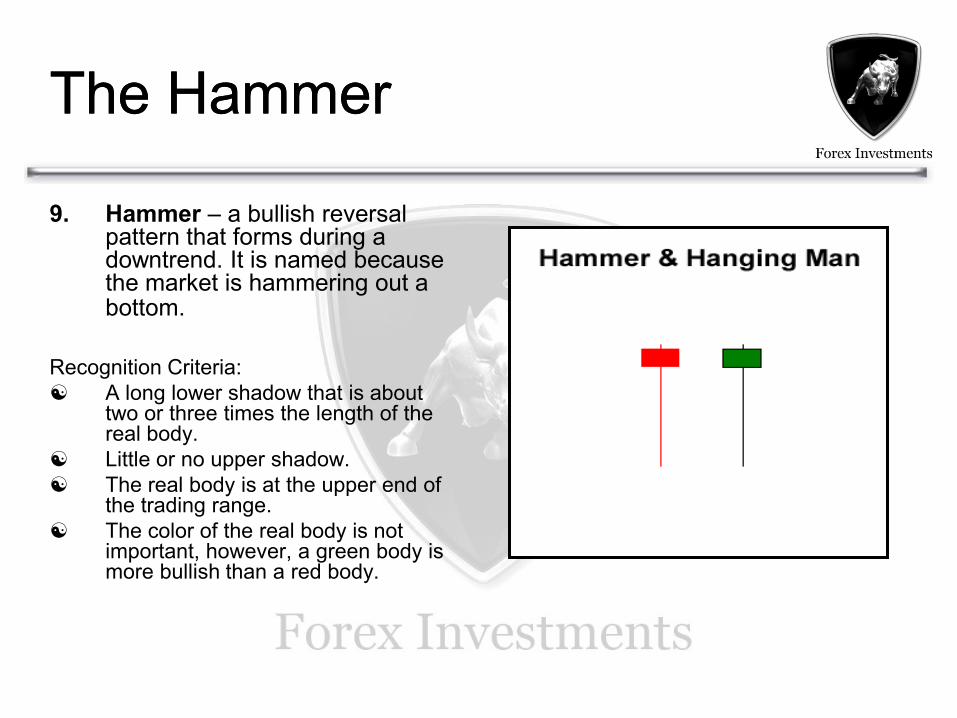
9. Hammer – a bullish reversal pattern that forms during a downtrend. It is named because the market is hammering out a bottom.
Recognition Criteria:
A long lower shadow that is about two or three times the length of the real body.
Little or no upper shadow.
The real body is at the upper end of the trading range.
The color of the real body is not important, however, a green body is more bullish than a red body.
The Hanging ManThe Hanging Man
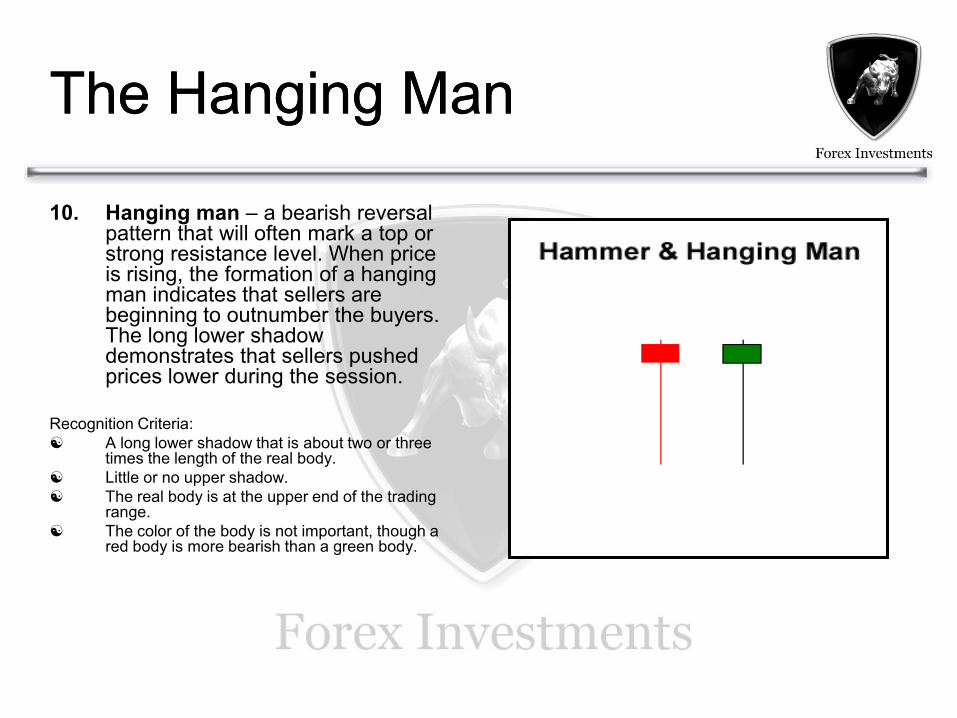
10. Hanging man – a bearish reversal pattern that will often mark a top or strong resistance level. When price is rising, the formation of a hanging man indicates that sellers are beginning to outnumber the buyers. The long lower shadow demonstrates that sellers pushed prices lower during the session.
Recognition Criteria:
A long lower shadow that is about two or three times the length of the real body.
Little or no upper shadow.
The real body is at the upper end of the trading range.
The color of the body is not important, though a red body is more bearish than a green body.
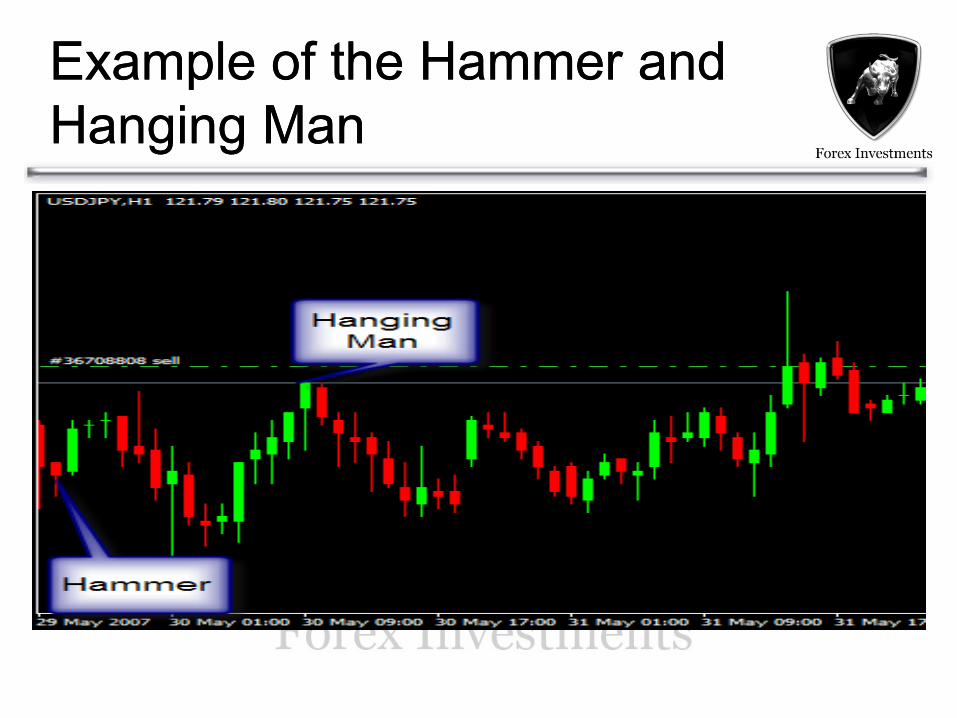
Example of the Hammer and Example of the Hammer and
Hanging ManHanging Man
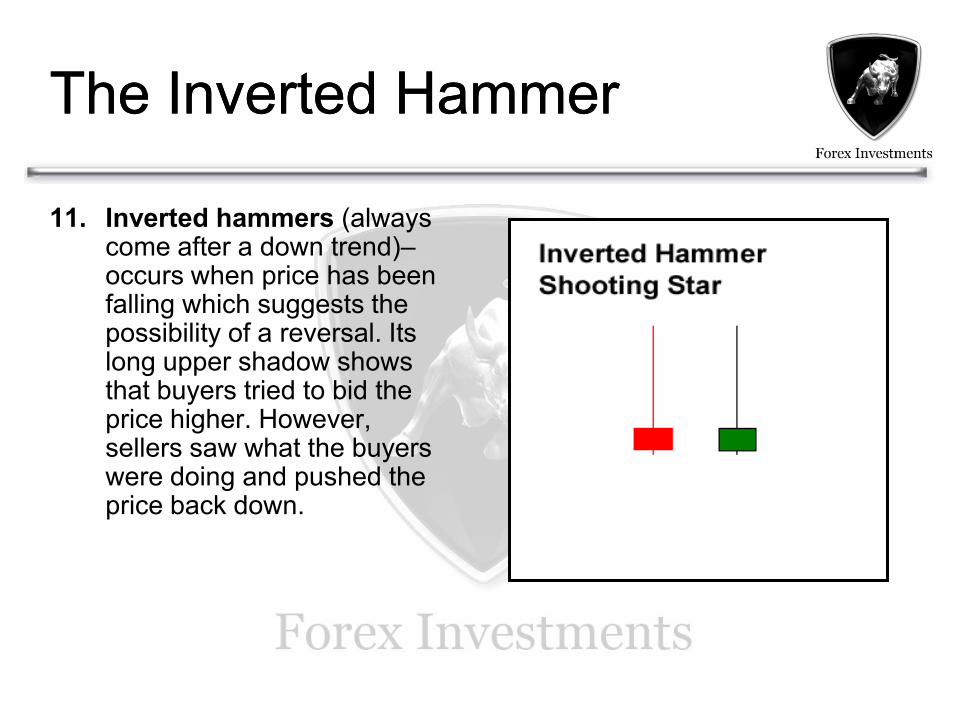
The Inverted HammerThe Inverted Hammer
11. Inverted hammers (always come after a down trend)–occurs when price has been falling which suggests the possibility of a reversal. Its long upper shadow shows that buyers tried to bid the price higher. However, sellers saw what the buyers were doing and pushed the price back down.
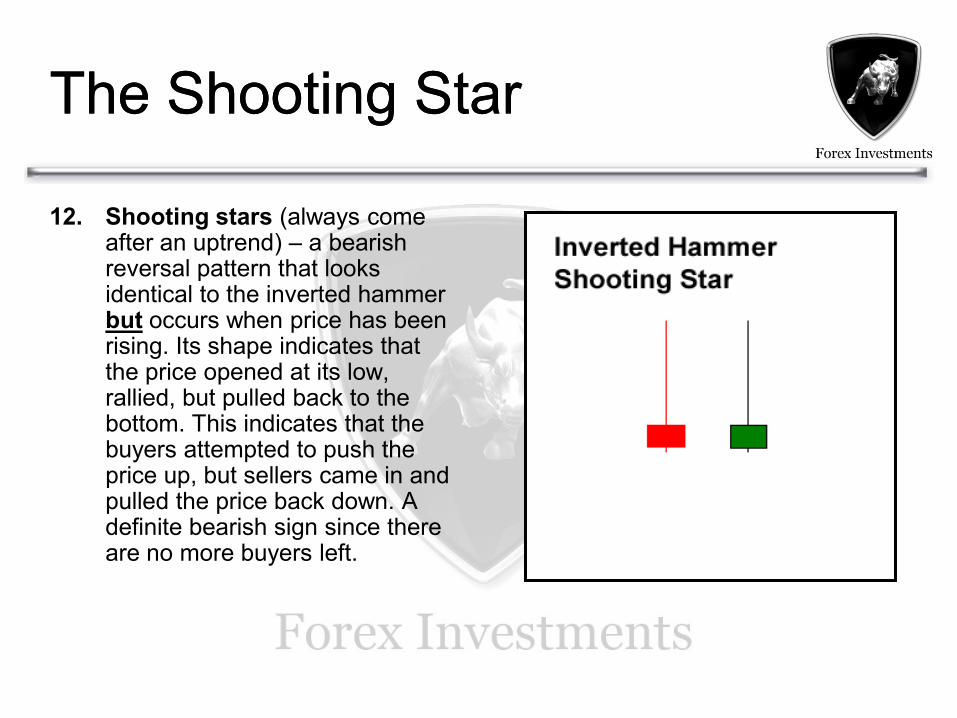
The Shooting StarThe Shooting Star
12. Shooting stars (always come after an uptrend) – a bearish reversal pattern that looks identical to the inverted hammer but occurs when price has been rising. Its shape indicates that the price opened at its low, rallied, but pulled back to the bottom. This indicates that the buyers attempted to push the price up, but sellers came in and pulled the price back down. A definite bearish sign since there are no more buyers left.
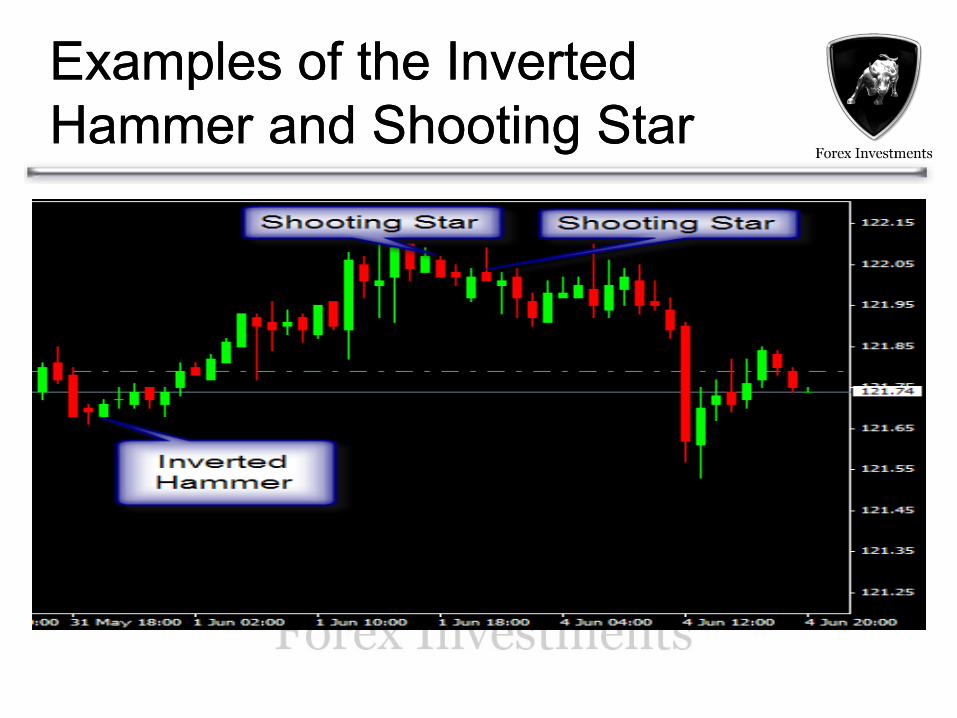
Examples of the Inverted Examples of the Inverted
Hammer and Shooting StarHammer and Shooting Star
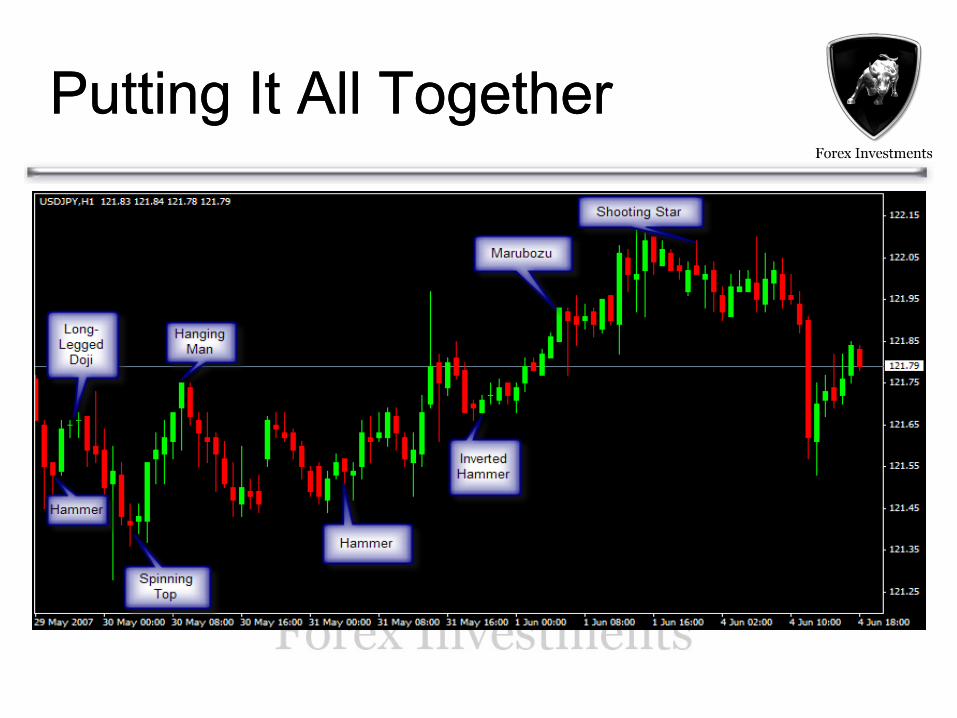
Putting It All TogetherPutting It All Together
Level 1Level 1
Size, Frequency and Color
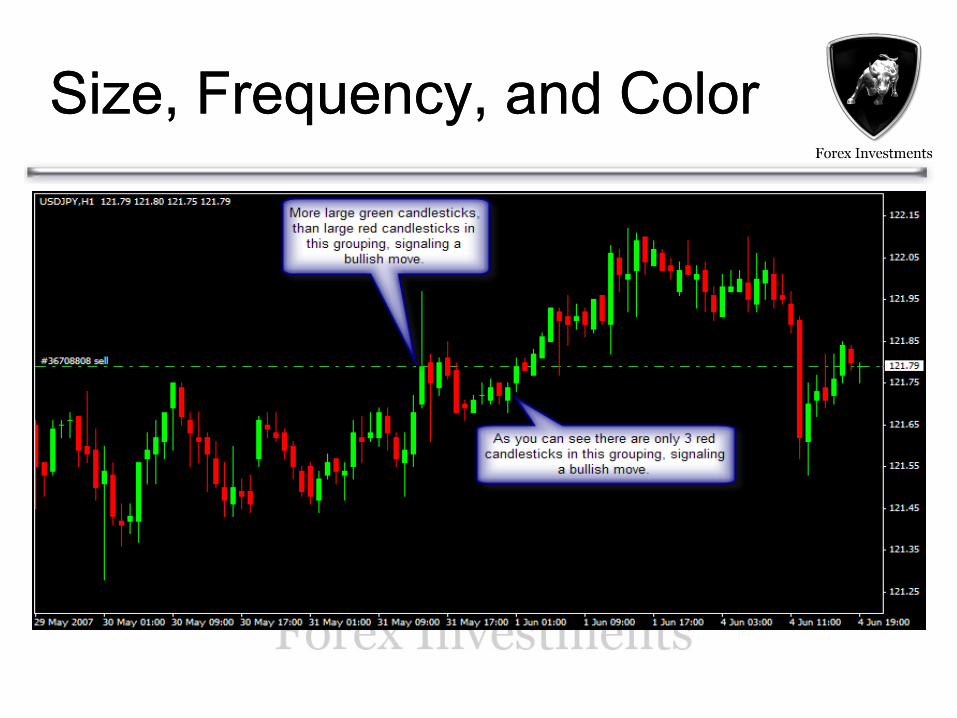
Size, Frequency, and ColorSize, Frequency, and Color
Meshed CandlesticksMeshed Candlesticks
That candlestick is all meshed up! If you are in a channel…take a group of candlesticks and mesh them together. The outcome could show you the upcoming trend. Here’s how:
1. Use the open of the first candlestick in the group as the open of the meshed candlestick.
2. Use the highest high of the candlestick group as the high of the meshed candlestick.
3. Use the lowest low of the candlestick group as the low of the meshed candlestick.
4. Use the close of the last candlestick in the group as the close of the meshed candlestick.
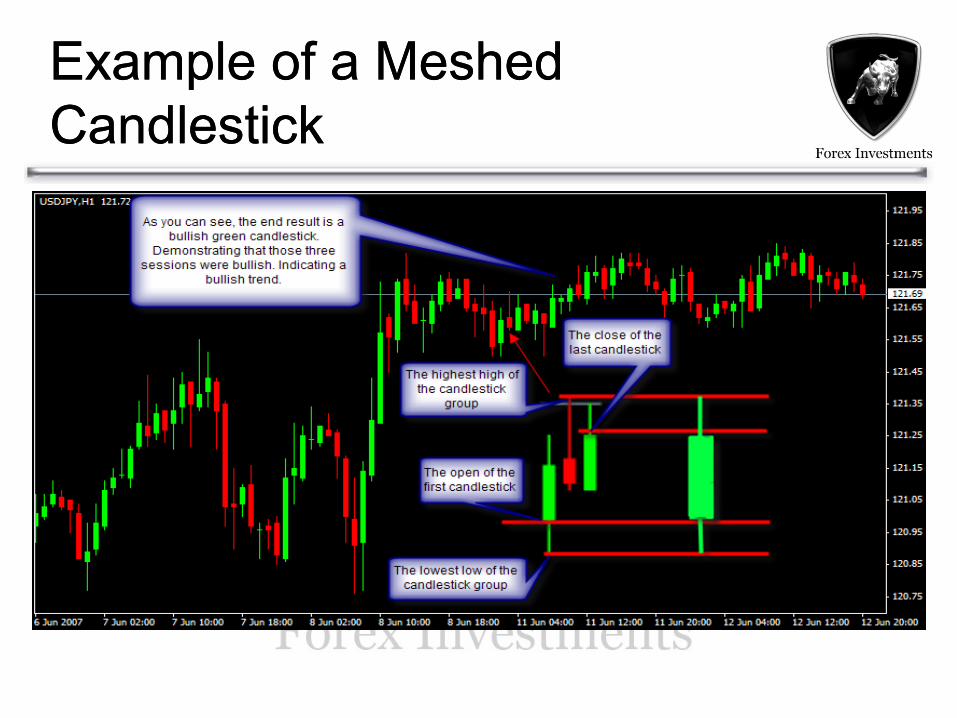
Example of a Meshed Example of a Meshed
CandlestickCandlestick
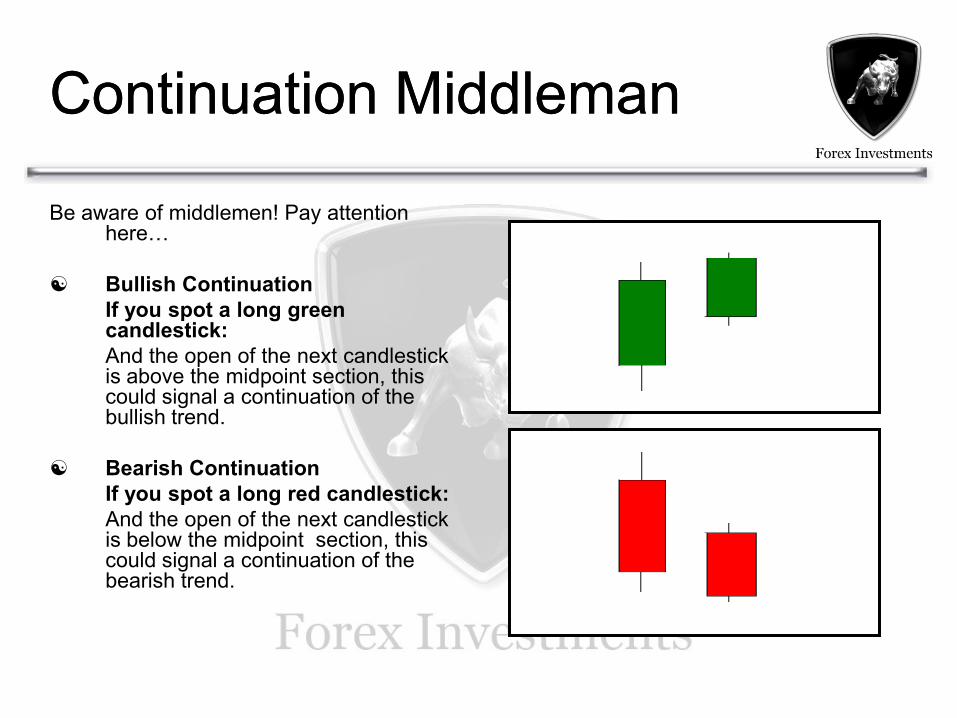
Continuation MiddlemanContinuation Middleman
Be aware of middlemen! Pay attention here…
Bullish Continuation
If you spot a long green candlestick:
And the open of the next candlestick is above the midpoint section, this could signal a continuation of the bullish trend.
Bearish Continuation
If you spot a long red candlestick:
And the open of the next candlestick is below the midpoint section, this could signal a continuation of the bearish trend.
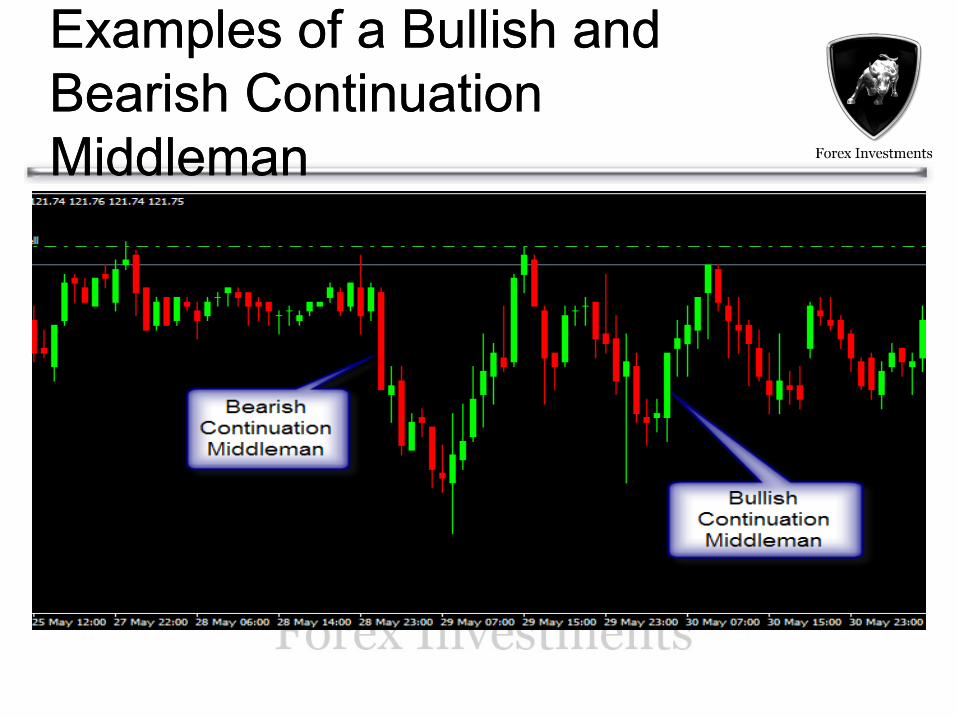
Examples of a Bullish and Examples of a Bullish and
Bearish Continuation Bearish Continuation
MiddlemanMiddleman
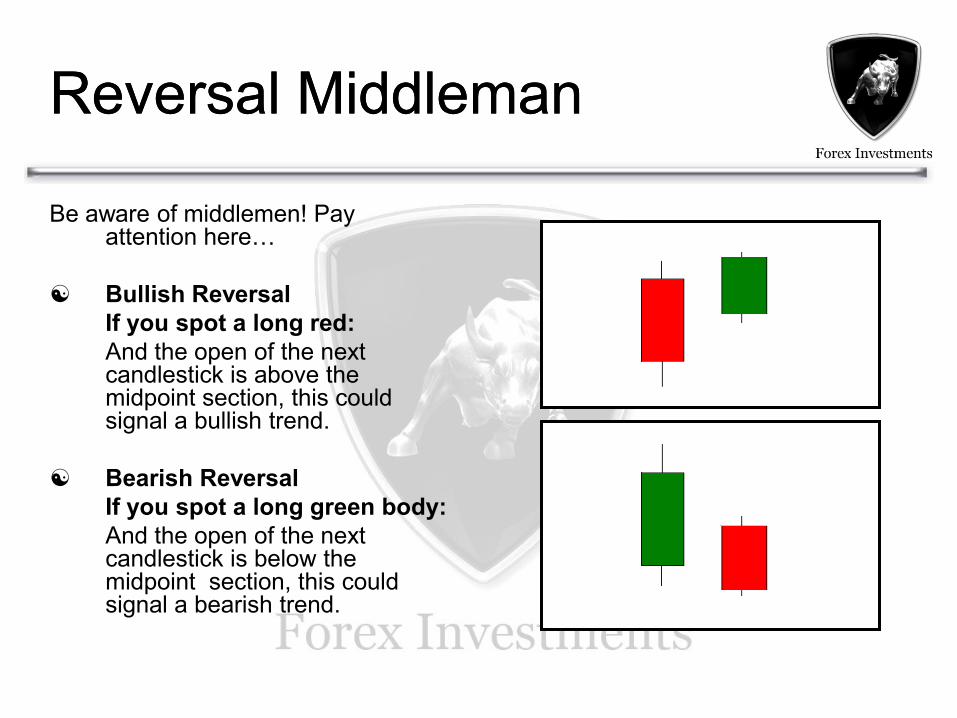
Reversal MiddlemanReversal Middleman
Be aware of middlemen! Pay attention here…
Bullish Reversal
If you spot a long red:
And the open of the next candlestick is above the midpoint section, this could signal a bullish trend.
Bearish Reversal
If you spot a long green body:
And the open of the next candlestick is below the midpoint section, this could signal a bearish trend.
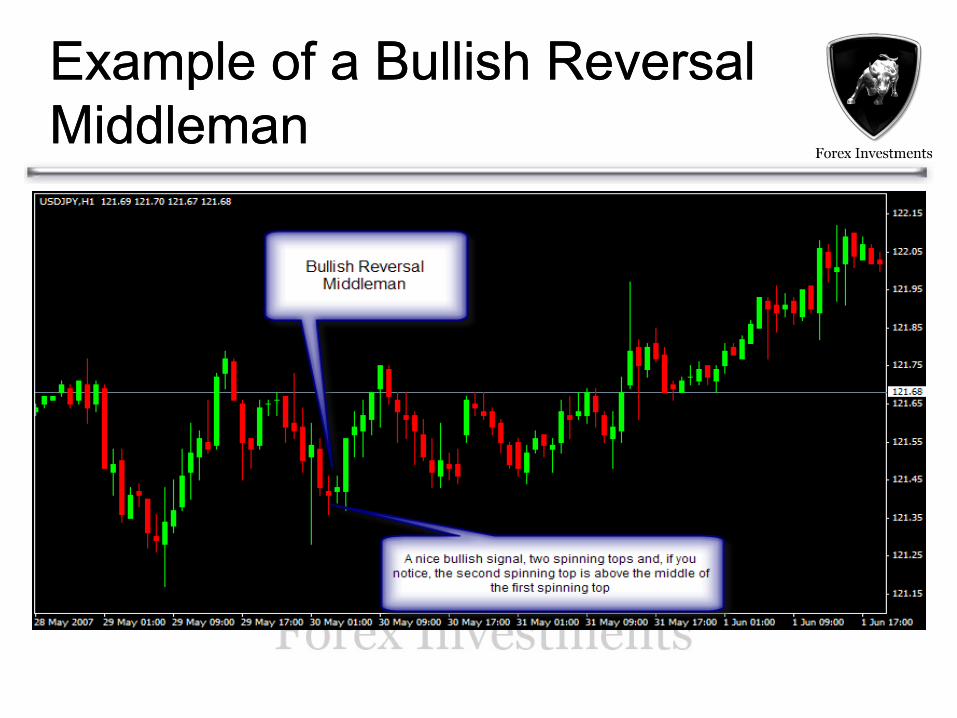
Example of a Bullish Reversal Example of a Bullish Reversal
MiddlemanMiddleman
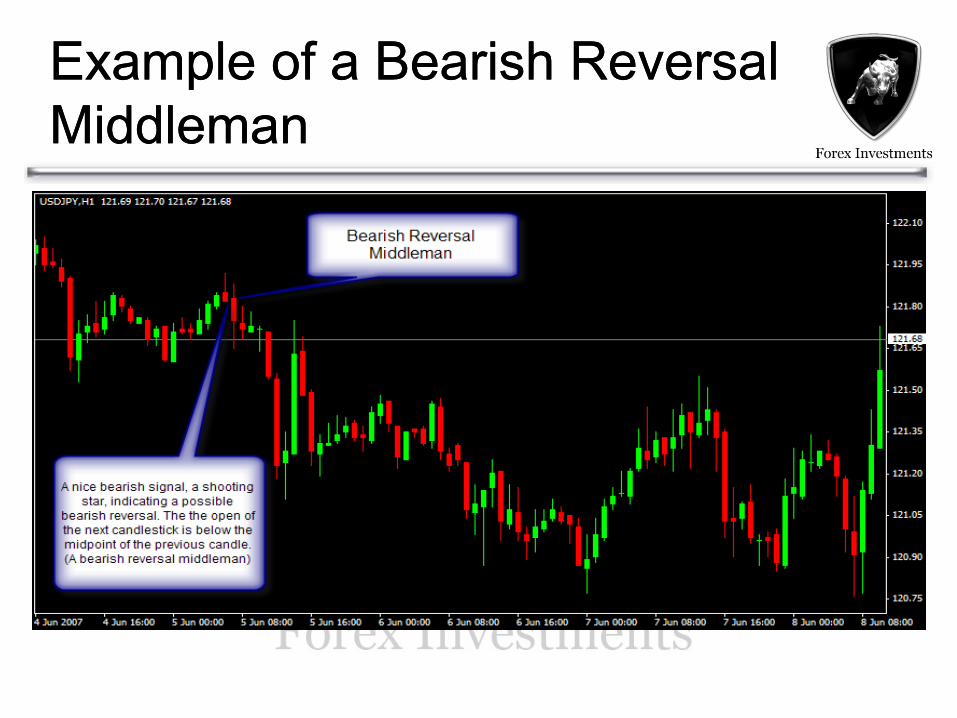
Example of a Bearish Reversal Example of a Bearish Reversal
MiddlemanMiddleman
Size and Frequency of Size and Frequency of
ShadowsShadows
Even though the real body is considered the most important part of the candlestick, we can’t ignore the importance of the shadows. The shadows help to give us the complete picture of what the candlestick is trying to tell us. There is a wealth of information that can be deducted by studying the length and position of the shadows.
Long upper shadow:
If a tall upper shadow appears at a high price or resistance level, it could signal an upcoming bearish trend.
Long lower shadow:
If a long lower shadow appears at a low price or support level, it could signal an upcoming bullish trend.
Note: If you see more than one long shadowed candlestick, it should only confirm the upcoming trend.
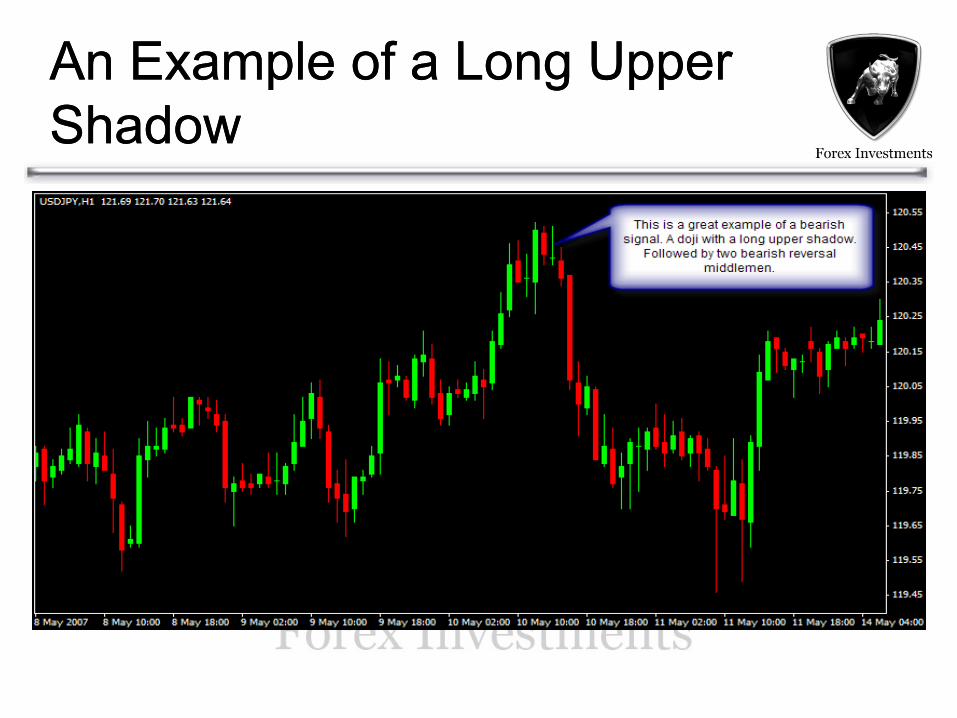
An Example of a Long Upper An Example of a Long Upper
ShadowShadow
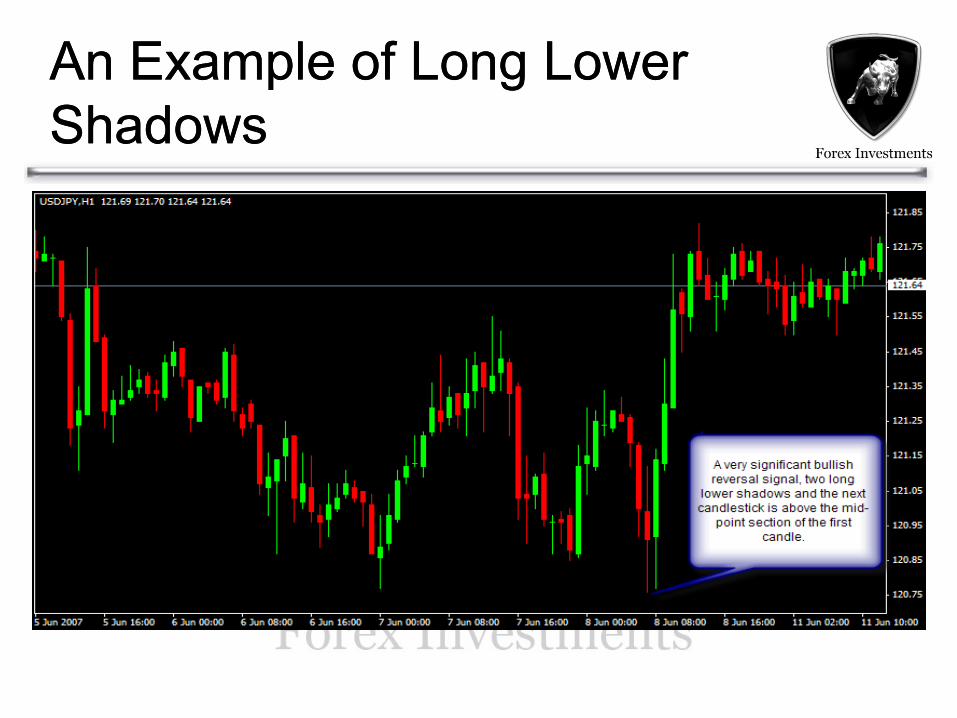
An Example of Long Lower An Example of Long Lower
ShadowsShadows
Level 1Level 1
Support and Resistance
Support and ResistanceSupport and Resistance
Support and resistance is a concept in
technical analysis that the price of a
currency will tend to stop and reverse at
certain predetermined price levels.
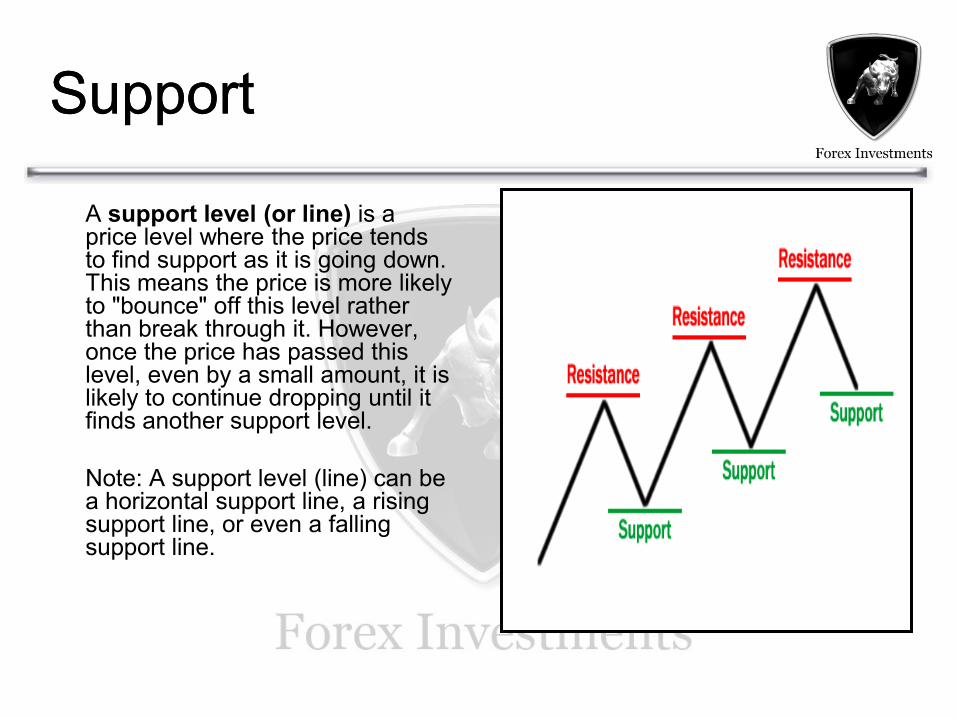
SupportSupport
A support level (or line) is a price level where the price tends to find support as it is going down. This means the price is more likely to "bounce" off this level rather than break through it. However, once the price has passed this level, even by a small amount, it is likely to continue dropping until it finds another support level.
Note: A support level (line) can be a horizontal support line, a rising support line, or even a falling support line.
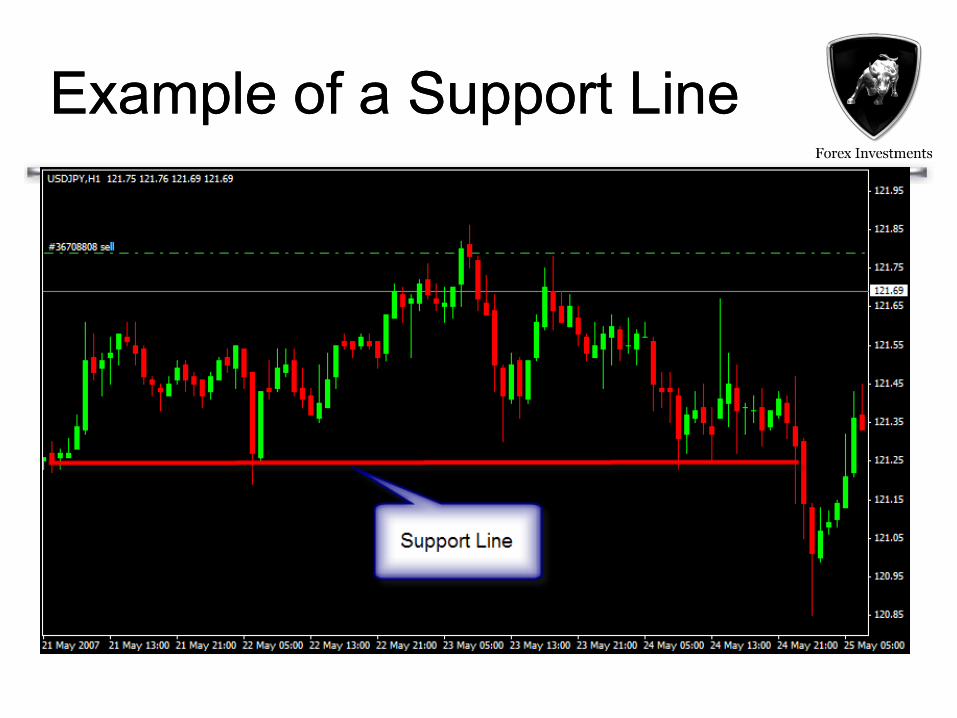
Example of a Support LineExample of a Support Line
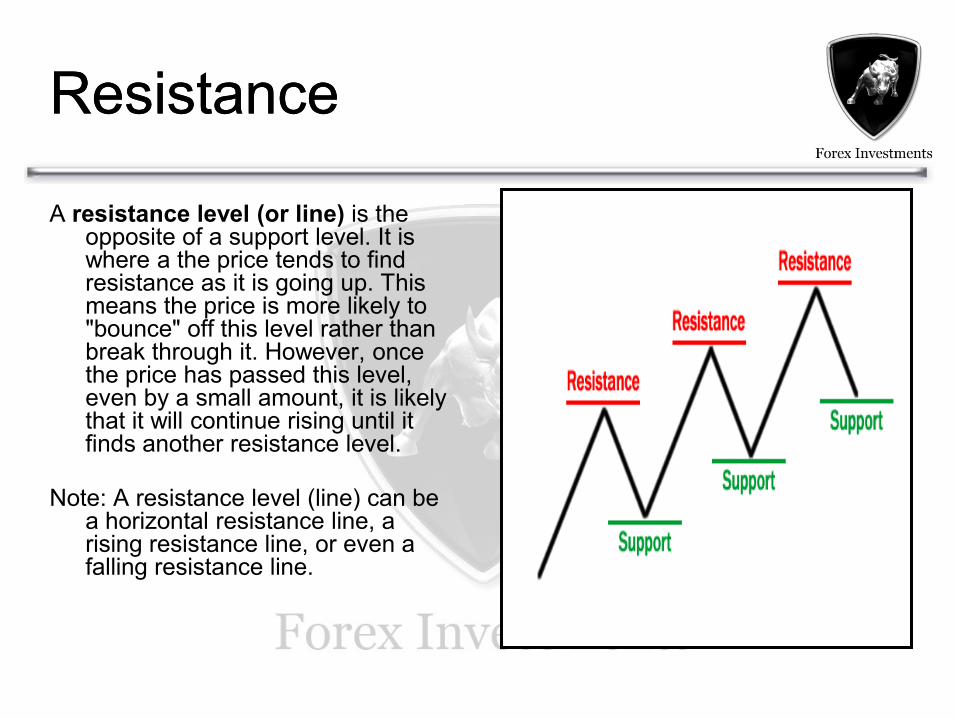
ResistanceResistance
A resistance level (or line) is the opposite of a support level. It is where a the price tends to find resistance as it is going up. This means the price is more likely to "bounce" off this level rather than break through it. However, once the price has passed this level, even by a small amount, it is likely that it will continue rising until it finds another resistance level.
Note: A resistance level (line) can be a horizontal resistance line, a rising resistance line, or even a falling resistance line.
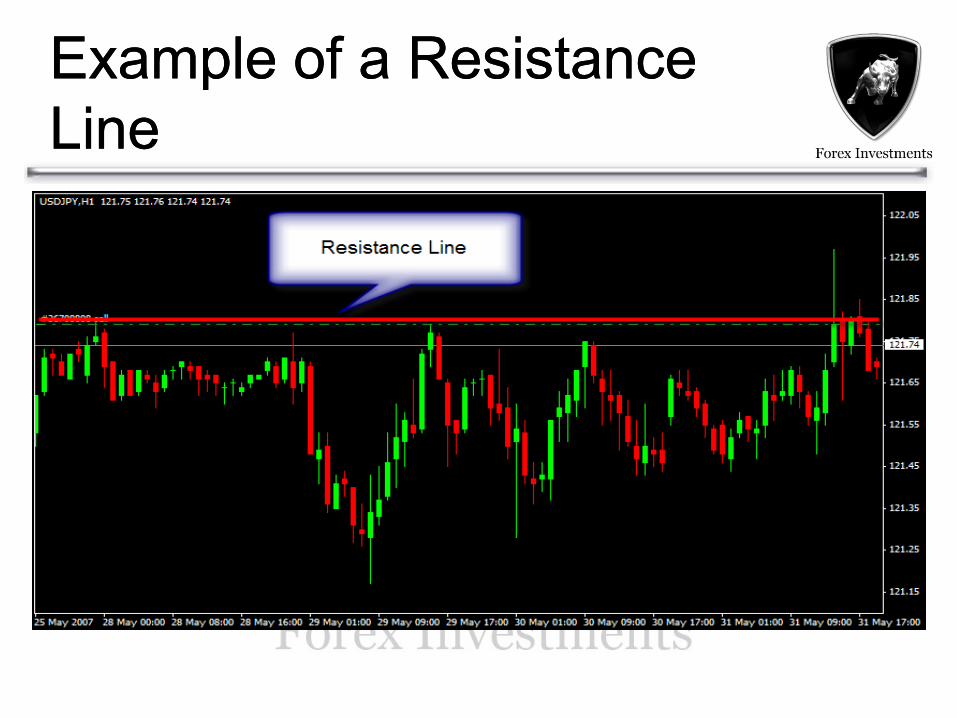
Example of a Resistance Example of a Resistance
LineLine
Long Green CandlesLong Green Candles
As a support confirmation
As a support level
As a resistance breaker
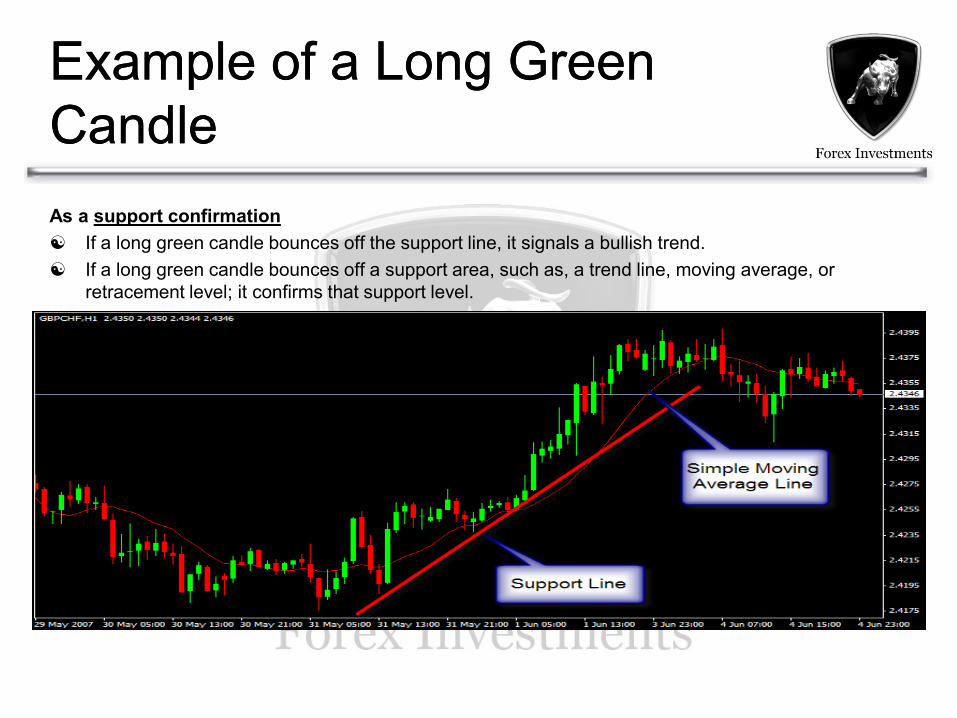
Example of a Long Green Example of a Long Green
CandleCandle
As a support confirmation
If a long green candle bounces off the support line, it signals a bullish trend.
If a long green candle bounces off a support area, such as, a trend line, moving average, or
retracement level; it confirms that support level.
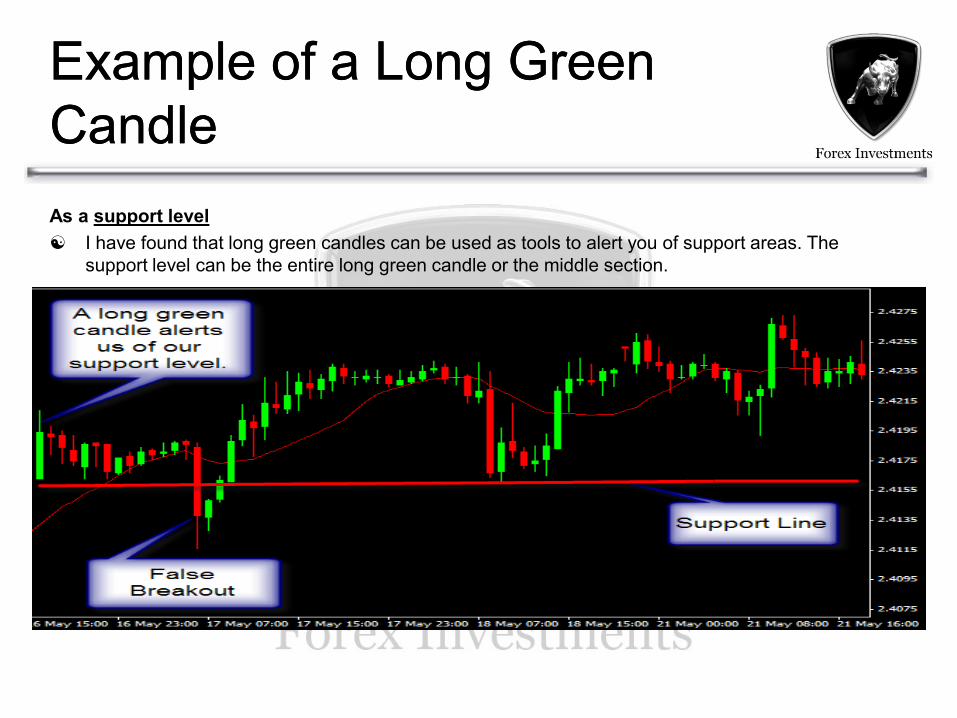
Example of a Long Green Example of a Long Green
CandleCandle
As a support level
I have found that long green candles can be used as tools to alert you of support areas. The
support level can be the entire long green candle or the middle section.
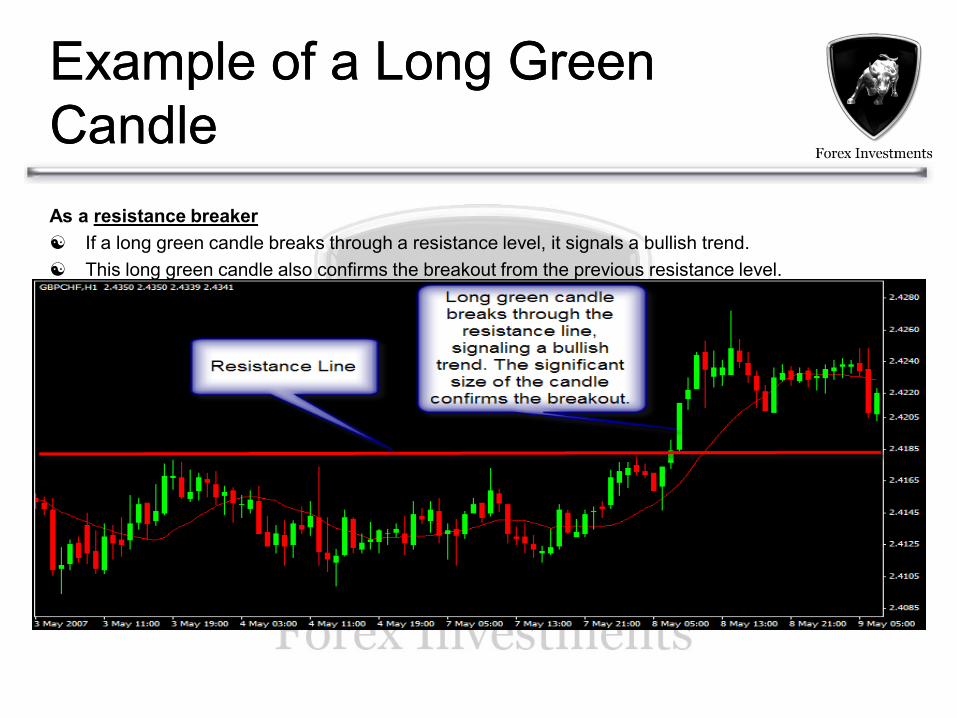
Example of a Long Green Example of a Long Green
CandleCandle
As a resistance breaker
If a long green candle breaks through a resistance level, it signals a bullish trend.
This long green candle also confirms the breakout from the previous resistance level.
Long Red CandlesLong Red Candles
As a resistance conformation
As a resistance level
As a support breaker
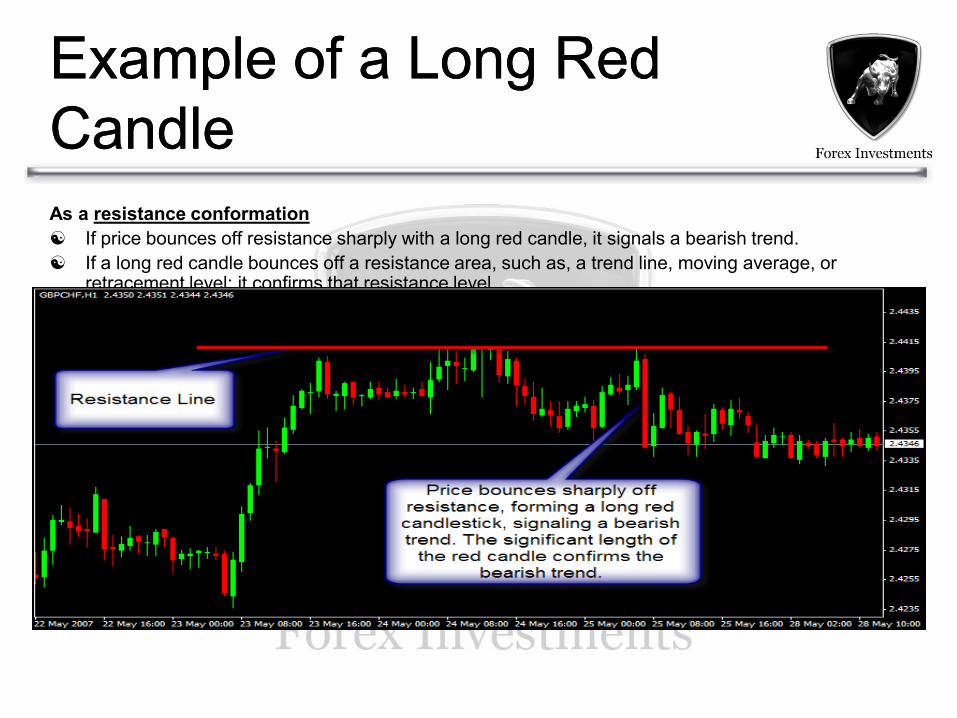
Example of a Long Red Example of a Long Red
CandleCandle
As a resistance conformation
If price bounces off resistance sharply with a long red candle, it signals a bearish trend.
If a long red candle bounces off a resistance area, such as, a trend line, moving average, or retracement level; it confirms that resistance level.
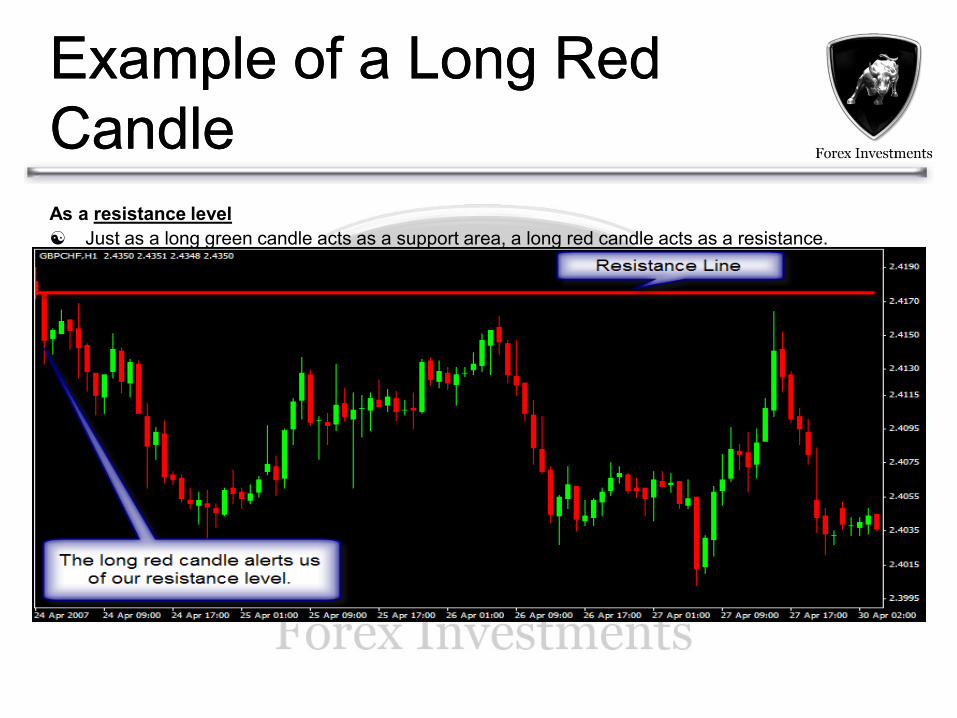
Example of a Long Red Example of a Long Red
CandleCandle
As a resistance level
Just as a long green candle acts as a support area, a long red candle acts as a resistance.

Long Red CandlesLong Red Candles
As a support breaker
If a long red candle breaks through a support level, it signals a bearish trend.
This long red candle also confirms the breakout from the previous support level.
Level 1Level 1
Relating Volume to Price Action
Two key conceptsTwo key concepts
There are two key concepts relating volume to price action. They are accumulation and distribution.
Accumulation
Happens when, at low price levels, price remains the same (or close to the same) even though volume was high during the session.
This could signal an upcoming bullish trend.
Distribution
Happen when, at high price levels, price remains the same (or close to the same) even though volume was high during the session.
This could signal an upcoming bearish trend.
Note: Volume in the Forex Market is suspect because of the lack of a central exchange. The volume indicator on your trading platform only gives us the volume of the price action on that particular platform, it has no way of letting us know the volume of price action in the whole Forex Market.
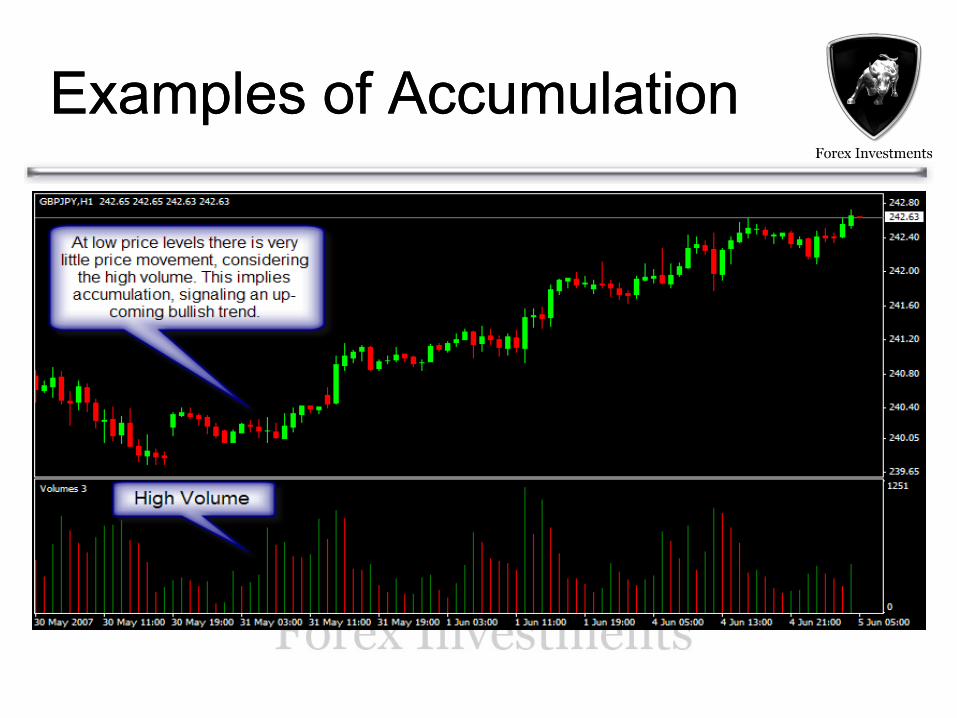
Examples of AccumulationExamples of Accumulation
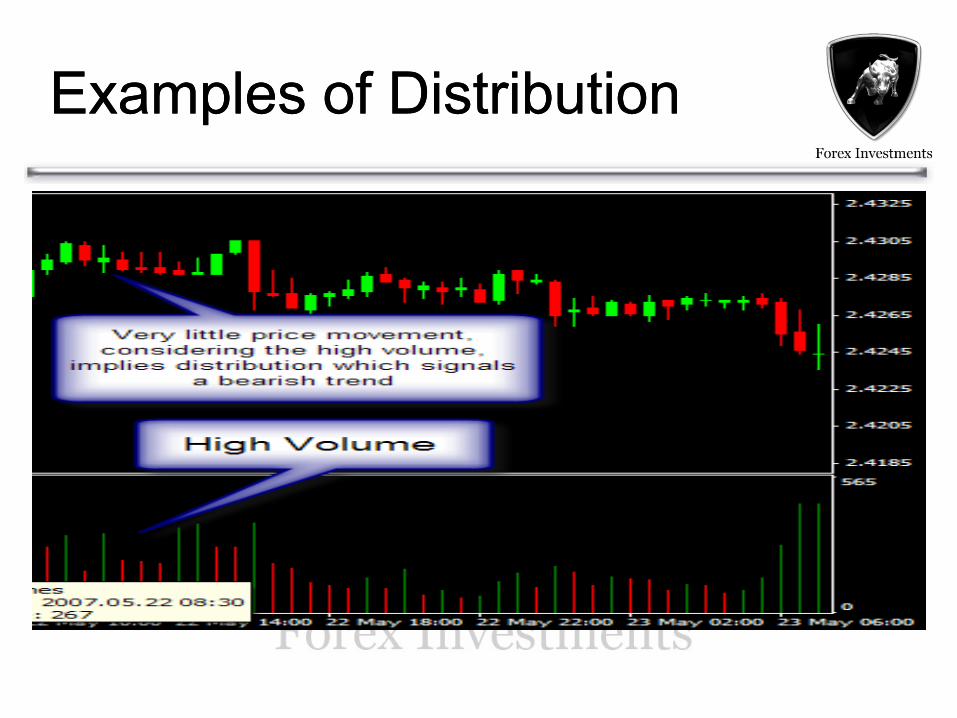
Examples of DistributionExamples of Distribution
Closing RemarksClosing Remarks
Congratulations, you have just completed level 1. Now I suggest that you:
Review level 1
Review level 1 again. Yes I said again. I would review this section several times. If you don’t have the basics down 110%, don’t continue to the next level. Period!
Read and review the glossary of terms for this section in your booklet.