The Basic Argument For Mass Transit and Against Suburban Sprawl
15
The Basic Argument for Mass-Transit and Against Suburban Sprawl J. Bradon Rothschild What started in the 1940’s as a plan to house returning war vets and their growing families through the preceding baby boom grew into one of the most massive and pervasive alterations to the American landscape. While the Levittowns and Pleasentvilles offered lower cost living, much of the cost of living was, and still is, hidden in extraneous costs and externalities such as pollution, loss of farmland, commute times, and car related expenses[i]. In order to build a more economically and ecologically sustainable economy and living space, we should use highway tolls to account for externalities and expand mass transit options. At the close of the Second World War, the United States, as well as Canada and several other nations involved with the war, saw an influx of returning veterans ready to make families and join the reinvigorated workforce. The home front efforts of that same war had changed labor economics in the United States, incorporating women and minorities at higher rates than ever. Legislation such as the G.I. Bill ensured higher education opportunities and the potential for massive economic growth for what would be called the “Greatest Generation”. The new wealth and productive capacity, coupled with the lowest Gini coefficient[ii],[iii] – income and wealth inequality rating – of American history lead to the longest peacetime economic growth. This economic boom was coupled with a population boom, quickly dubbed the baby boom, and a jump in housing demand. In the United States, as elsewhere, housing through the majority of written history to the 1940's was confined to urban centers, where walking, horse-powered, or mass transit would suffice to transport people to work, school, shopping, and home[iv]. The practicality of building housing around such transit confines necessitated dense planning, with small houses and apartments built close together with retailers, schools, and parks. This urban design, however, is
-
Upload
j-bradon-rothschild -
Category
Documents
-
view
41 -
download
2
Transcript of The Basic Argument For Mass Transit and Against Suburban Sprawl
The Basic Argument for Mass-Transit and Against Suburban Sprawl
J. Bradon Rothschild
What started in the 1940’s as a plan to house returning war vets and their growing families
through the preceding baby boom grew into one of the most massive and pervasive alterations to
the American landscape. While the Levittowns and Pleasentvilles offered lower cost living, much of
the cost of living was, and still is, hidden in extraneous costs and externalities such as pollution, loss
of farmland, commute times, and car related expenses[i]. In order to build a more economically and
ecologically sustainable economy and living space, we should use highway tolls to account for
externalities and expand mass transit options.
At the close of the Second World War, the United States, as well as Canada and several other
nations involved with the war, saw an influx of returning veterans ready to make families and join
the reinvigorated workforce. The home front efforts of that same war had changed labor economics
in the United States, incorporating women and minorities at higher rates than ever. Legislation such
as the G.I. Bill ensured higher education opportunities and the potential for massive economic
growth for what would be called the “Greatest Generation”. The new wealth and productive
capacity, coupled with the lowest Gini coefficient[ii],[iii] – income and wealth inequality rating – of
American history lead to the longest peacetime economic growth.
This economic boom was coupled with a population boom, quickly dubbed the baby boom,
and a jump in housing demand. In the United States, as elsewhere, housing through the majority of
written history to the 1940's was confined to urban centers, where walking, horse-powered, or mass
transit would suffice to transport people to work, school, shopping, and home[iv]. The practicality
of building housing around such transit confines necessitated dense planning, with small houses and
apartments built close together with retailers, schools, and parks. This urban design, however, is
predicated on smaller lots in order to facilitate and create short commutes, thereby constricting any
supply curve for housing by geographically restricting where housing can be built in relation with
other destinations .
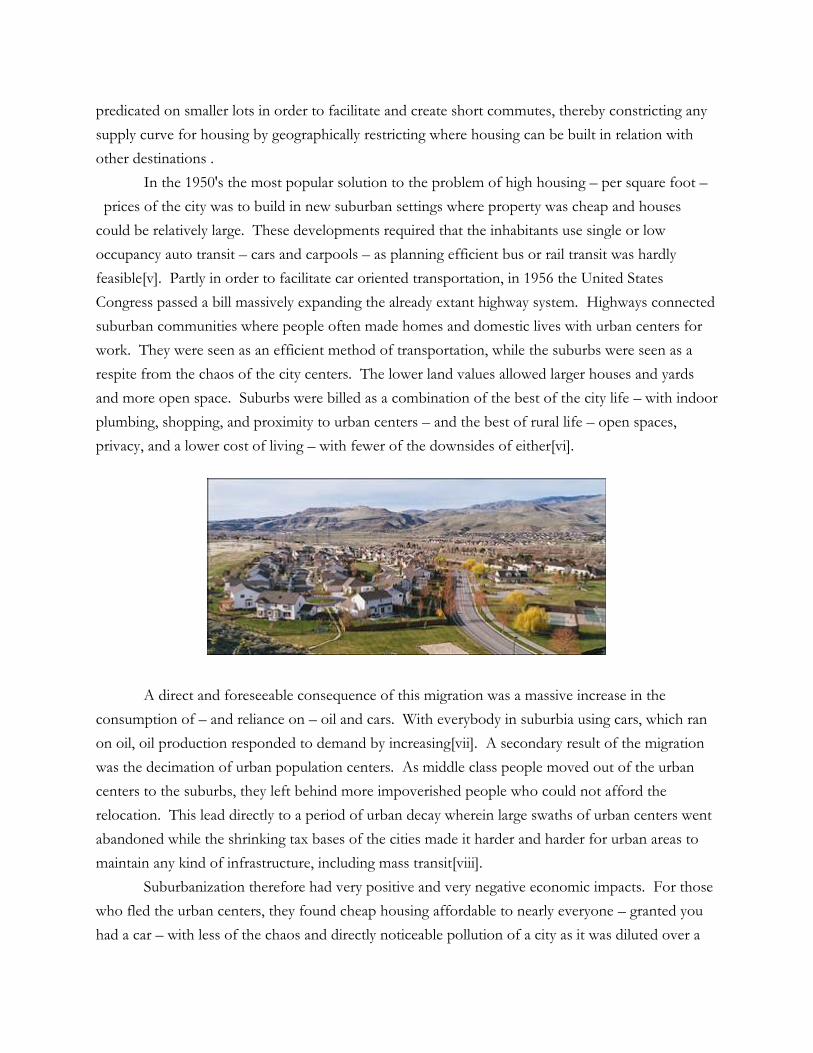
In the 1950's the most popular solution to the problem of high housing – per square foot –
prices of the city was to build in new suburban settings where property was cheap and houses
could be relatively large. These developments required that the inhabitants use single or low
occupancy auto transit – cars and carpools – as planning efficient bus or rail transit was hardly
feasible[v]. Partly in order to facilitate car oriented transportation, in 1956 the United States
Congress passed a bill massively expanding the already extant highway system. Highways connected
suburban communities where people often made homes and domestic lives with urban centers for
work. They were seen as an efficient method of transportation, while the suburbs were seen as a
respite from the chaos of the city centers. The lower land values allowed larger houses and yards
and more open space. Suburbs were billed as a combination of the best of the city life – with indoor
plumbing, shopping, and proximity to urban centers – and the best of rural life – open spaces,
privacy, and a lower cost of living – with fewer of the downsides of either[vi].
A direct and foreseeable consequence of this migration was a massive increase in the
consumption of – and reliance on – oil and cars. With everybody in suburbia using cars, which ran
on oil, oil production responded to demand by increasing[vii]. A secondary result of the migration
was the decimation of urban population centers. As middle class people moved out of the urban
centers to the suburbs, they left behind more impoverished people who could not afford the
relocation. This lead directly to a period of urban decay wherein large swaths of urban centers went
abandoned while the shrinking tax bases of the cities made it harder and harder for urban areas to
maintain any kind of infrastructure, including mass transit[viii].
Suburbanization therefore had very positive and very negative economic impacts. For those
who fled the urban centers, they found cheap housing affordable to nearly everyone – granted you
had a car – with less of the chaos and directly noticeable pollution of a city as it was diluted over a
much larger area[ix]. This great migration offered an opportunity to construction companies to
build great new swaths of housing, strip malls, and the highways to transport the residents back and
forth[x]. To be sure, the 1940's through the early 1960's were a veritable economic golden age for
the United States, in part thanks to this great reconstruction [xi].
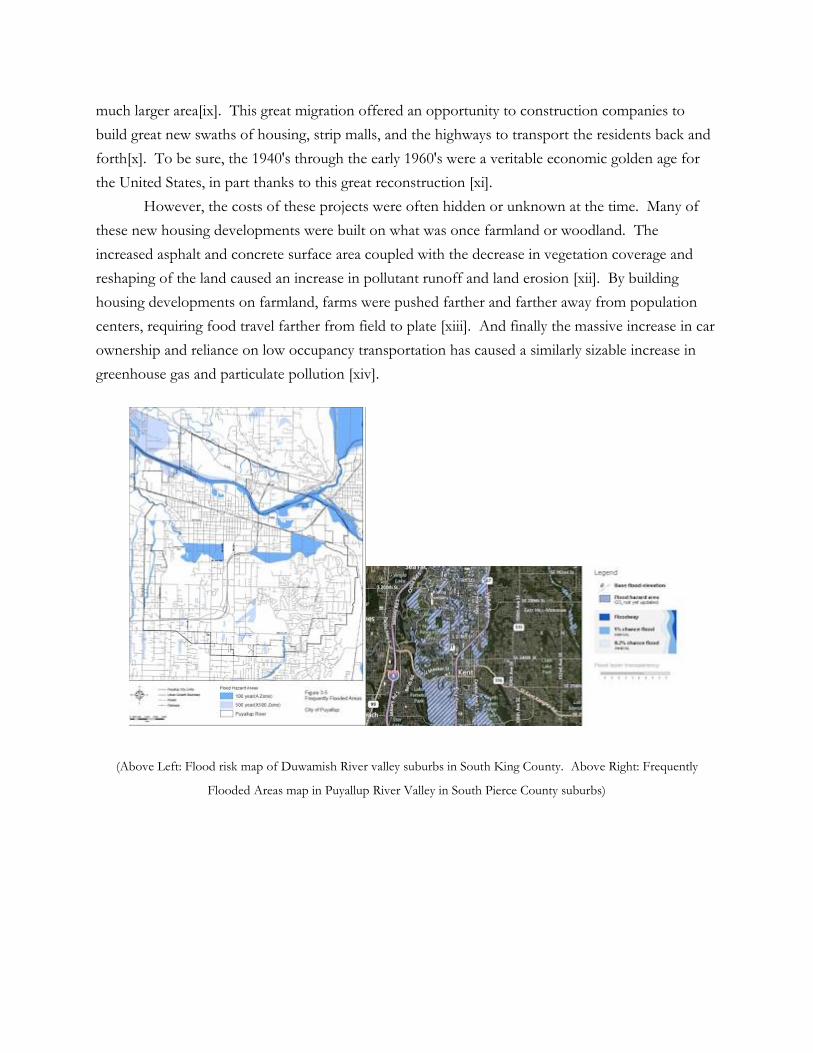
However, the costs of these projects were often hidden or unknown at the time. Many of
these new housing developments were built on what was once farmland or woodland. The
increased asphalt and concrete surface area coupled with the decrease in vegetation coverage and
reshaping of the land caused an increase in pollutant runoff and land erosion [xii]. By building
housing developments on farmland, farms were pushed farther and farther away from population
centers, requiring food travel farther from field to plate [xiii]. And finally the massive increase in car
ownership and reliance on low occupancy transportation has caused a similarly sizable increase in
greenhouse gas and particulate pollution [xiv].
(Above Left: Flood risk map of Duwamish River valley suburbs in South King County. Above Right: Frequently
Flooded Areas map in Puyallup River Valley in South Pierce County suburbs)

(Infographs via: http://www.theatlanticcities.com/housing/2011/12/missing-link-climate-change-single-family-
suburban-homes/650/. Note the higher impact transportation has on carbon footprint in suburban areas. Also the
larger carbon footprint "green" suburbs have, even when compared to conventional urban neighborhoods)
As these side effects are not paid for in the consumption or use of the aforementioned
products – suburban housing, cars, oil, etc. – yet clearly cause at some points immeasurable costs –
burning of oil releases greenhouse gasses, causing climate change – we can safely classify these as
externalities. There have been many attempts to account, at least in part, for some
externalities. Washington State, for instance, imposes a tax on gas per gallon as a way of paying for
freeway maintenance and construction[xv]. Though it is one of the highest gas taxes in the United
States – ranked 9th highest[xvi] – rather than using the tax revenue to pay for externalities of
pollution, the state uses the money to fund continued highway expansion and maintenance.
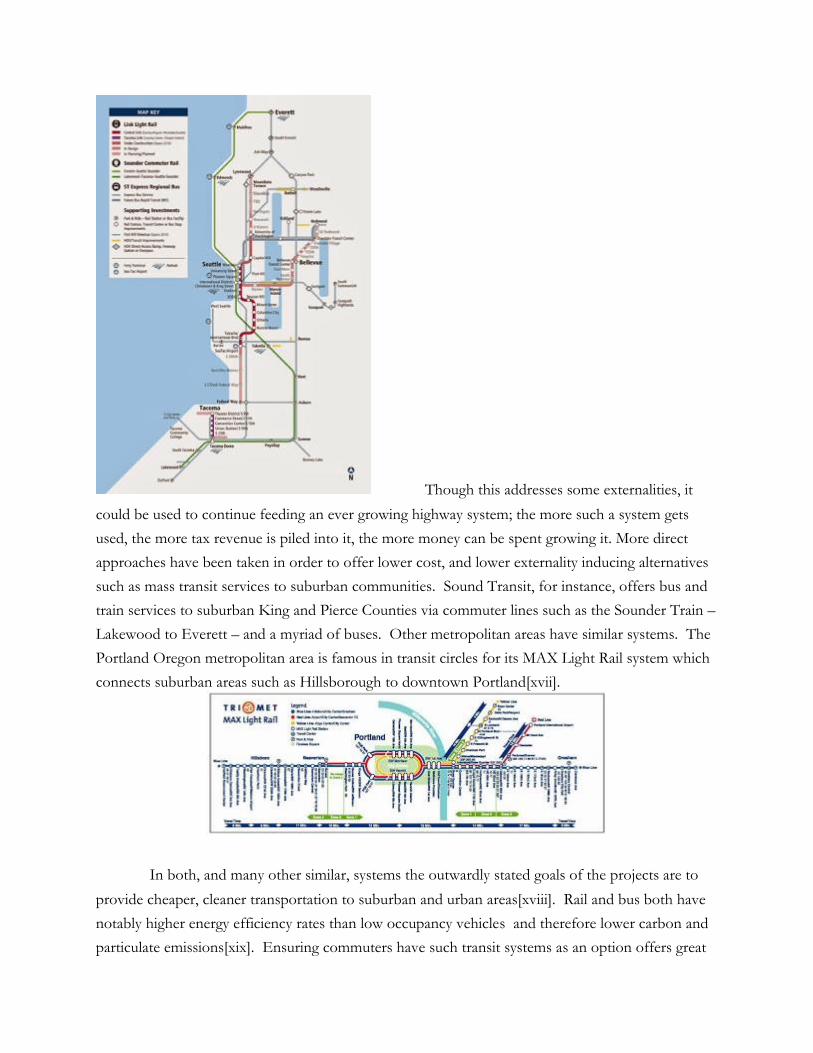
Though this addresses some externalities, it
could be used to continue feeding an ever growing highway system; the more such a system gets
used, the more tax revenue is piled into it, the more money can be spent growing it. More direct
approaches have been taken in order to offer lower cost, and lower externality inducing alternatives
such as mass transit services to suburban communities. Sound Transit, for instance, offers bus and
train services to suburban King and Pierce Counties via commuter lines such as the Sounder Train –
Lakewood to Everett – and a myriad of buses. Other metropolitan areas have similar systems. The
Portland Oregon metropolitan area is famous in transit circles for its MAX Light Rail system which
connects suburban areas such as Hillsborough to downtown Portland[xvii].
In both, and many other similar, systems the outwardly stated goals of the projects are to
provide cheaper, cleaner transportation to suburban and urban areas[xviii]. Rail and bus both have
notably higher energy efficiency rates than low occupancy vehicles and therefore lower carbon and
particulate emissions[xix]. Ensuring commuters have such transit systems as an option offers great
alternatives, but does not in itself encourage use, nor even guarantee viability of mass transit over
low occupancy vehicle. Many suburban areas are simply not designed with mass transit use in
mind. Long distances between houses often necessitates stop-gap measures, often use of low
occupancy vehicles, in order to transport people from home to mass transit depots. To that end,
many transit centers are surrounded by parking garages and lots. This reduces the efficacy of these
transit options, and increases the costs associated with them; parking lots and garages are extremely
expensive[xx] and cause runoff.
In this case it behooves us not simply to offer alternatives to low occupancy vehicles, but to
ensure that the cost of using such transportation includes the cost of the externalities
associated. Gas taxes can go a long way to reduce driving and encourage the use of alternatives. If
we suppose the elasticity of gas demand to be -.5, as many economists have claimed it to be[xxi], a
tax at 25% could reduce consumption by 50%. This would be a positive move as it would directly
address the externality associated most with driving: pollution. However, if the tax revenue were to
be spent on expansion and maintenance of new roads, it could lower the elasticity further, thereby
partially negating the proposed effect. Unfortunately, as mentioned earlier, this is essentially how
the gas tax is spent in Washington State, and is partially what some claim is at root cause of the ever-
expanding state highway system.
An alternative to simply a gas tax would be to toll roads, mainly highways, for use. By
increasing the marginal cost of driving long distances – between suburbs and city centers – the state
would be discouraging people from making such trips, as Tim Hartford pointed out. The merits are
clear and the evidence is readily available. In the year after the new eastbound Tacoma Narrows
Bridge was completed (in 2007), and a toll charge placed on crossing the bridge, ridership on Pierce
Transit – via bus, vanpool, and shuttle options – increased by its largest change to-date by nearly
5%, much of that due to the fact that mass transit does not pay the toll [xxii]. Similarly, Tolls on the
SR 520 floating bridge have been blamed as a deterrent, forcing people to take the parallel and un-
tolled I-90 bridge across Lake Washington, which is often cited as an impetus for tolling that bridge
as well[xxiii] .

In 2008 WSDOT (Washington State
Department of Transportation) opened up toll lanes along SR 167 to single occupancy vehicles –
lanes which would be free for high occupancy and carpool vehicles – as a method of reducing traffic
and monetizing low occupancy highway travel. The revenues generated exceeded expectations by a
significant margin as many people opted into the system. More promising is the success of the toll
collecting system which allows highways to be tolled via scanners rather than toll-both, thereby
cutting labor costs and making the system far more practical[xxiv].
A comprehensive proposition to address the externalities should include marginal cost
increases to both the purchase of gas, to encourage commuters at the very least to “dump the
pump” and buy electric cars with no tailpipe exhaust, as well as tolls on highways to discourage long-
distance commute via low occupancy vehicle. The former would reduce car exhaust and carbon
emissions, while the latter could save property and encourage dense urban development over
suburban sprawl, and reduce the environmental problems associated with it.

In both cases, the effect
the proposals have is essentially simply incorporating the externalities, which are otherwise unpaid
and accounted for, into the cost of low occupancy transit. However, to truly solve the underlying
problems and get commuters to leave behind the long commutes via car, we also have to supply
alternatives. Many cities and urban centers have done just that through multi-modal transit
systems. Vancouver, British Columbia has developed a 2040 plan for transit growth which includes
methods of incorporating suburban areas into a multi-modal system in order to reduce car use and
re-develop what little sprawl the metropolitan area has[xxv]. It includes expansion of the already
existent Skytrain system, new bus services, more light rail, and an emphasis on bike lanes and urban
walk-ability in future planning. Sound Transit in the Puget Sound area has a similar long-term plan
involving an expansion of the Central Link Light Rail as well as Tacoma Light Rail systems into
suburban Seattle-Tacoma metropolitan area[xxvi].
These plans, in essence, are aimed at increasing the elasticity of demand for low occupancy
transportation, while potentially increasing demand for urban living, thereby spurring new urban
residential development in order to offset dwindling suburban housing demand. In many cases
these goals have come to fruition. The South-East Seattle neighborhood of Columbia City
underwent significant development in the years after the Central Link Light Rail opened a stop in
the neighborhood. New developments using “new urban,” multi-modal and transit oriented, walk-
able layouts were implemented in the Rainier Vista neighborhood built around the light rail
station[xxvii]. New development projects have tended to follow the light rail line as new, higher
density construction has occurred at most light rail stations along the Link, including in previously
impoverished neighborhoods such as Othello[xxviii] and Mt. Baker[xxix]. In Portland, both north
and south of downtown have gone through major revitalization after the opening of the Portland
Streetcar as Southwest Portland and the Pearl District in north Portland have seen massive
development projects undertaken to increase the urban population[xxx]. Moreover, these new
projects increasingly cater to middle class income earners, a demographic which for the past several
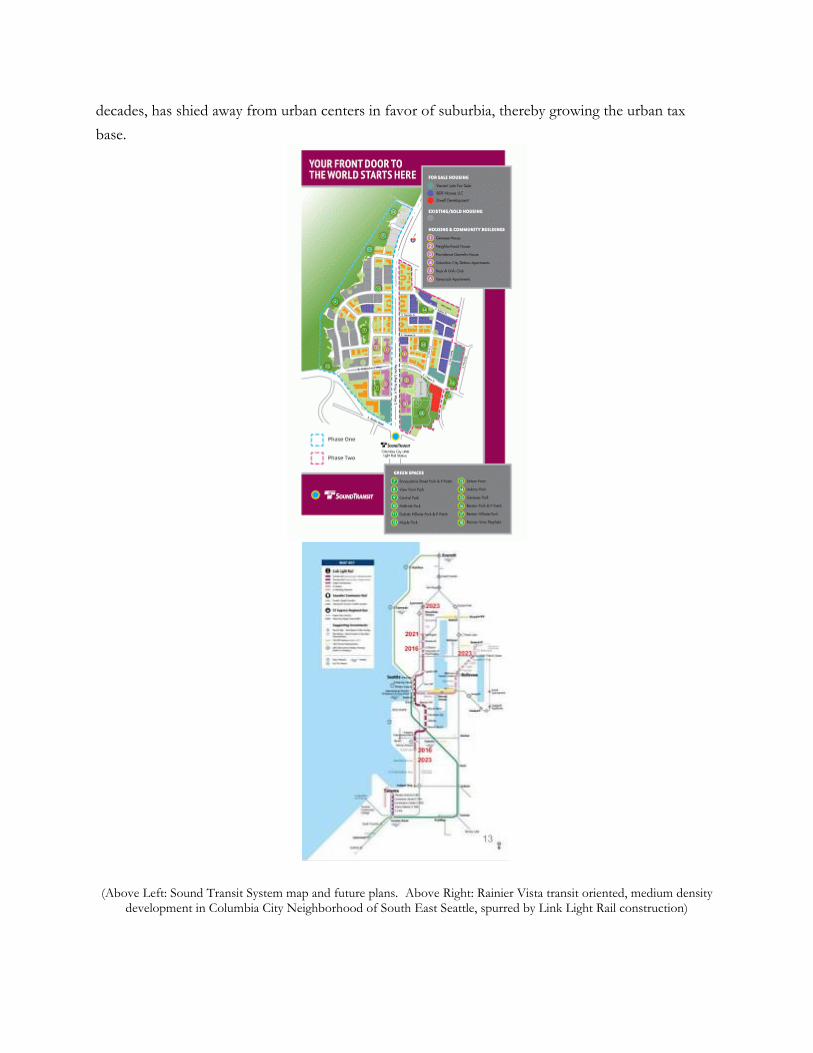
decades, has shied away from urban centers in favor of suburbia, thereby growing the urban tax
base.
(Above Left: Sound Transit System map and future plans. Above Right: Rainier Vista transit oriented, medium density
development in Columbia City Neighborhood of South East Seattle, spurred by Link Light Rail construction)
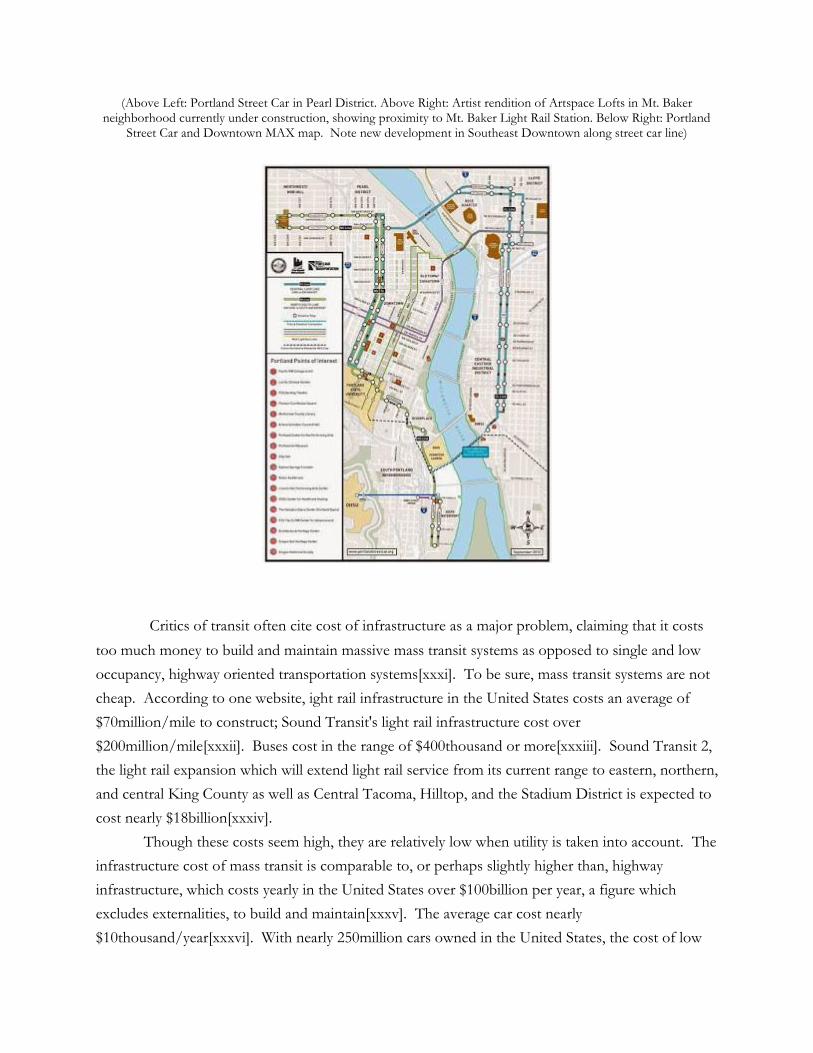
(Above Left: Portland Street Car in Pearl District. Above Right: Artist rendition of Artspace Lofts in Mt. Baker neighborhood currently under construction, showing proximity to Mt. Baker Light Rail Station. Below Right: Portland
Street Car and Downtown MAX map. Note new development in Southeast Downtown along street car line)
Critics of transit often cite cost of infrastructure as a major problem, claiming that it costs
too much money to build and maintain massive mass transit systems as opposed to single and low
occupancy, highway oriented transportation systems[xxxi]. To be sure, mass transit systems are not
cheap. According to one website, ight rail infrastructure in the United States costs an average of
$70million/mile to construct; Sound Transit's light rail infrastructure cost over
$200million/mile[xxxii]. Buses cost in the range of $400thousand or more[xxxiii]. Sound Transit 2,
the light rail expansion which will extend light rail service from its current range to eastern, northern,
and central King County as well as Central Tacoma, Hilltop, and the Stadium District is expected to
cost nearly $18billion[xxxiv].
Though these costs seem high, they are relatively low when utility is taken into account. The
infrastructure cost of mass transit is comparable to, or perhaps slightly higher than, highway
infrastructure, which costs yearly in the United States over $100billion per year, a figure which
excludes externalities, to build and maintain[xxxv]. The average car cost nearly
$10thousand/year[xxxvi]. With nearly 250million cars owned in the United States, the cost of low
occupancy vehicle use, sans externality costs, is $2.5trillion. Meanwhile, the American Public
Transportation Association asserts that the United States spends less than $100billion yearly on over
10billion mass transportation trips[xxxvii].
In any case, it is clear that single and low occupancy vehicle transportation is not an
economically or environmentally sustainable option. The externality costs of single and low
occupancy transportation are high, and sometimes incalculable. To a degree, the system will right
itself. The finite nature of fossil fuels will eventually cause a rise in prices enough to reduce
consumption significantly[xxxviii], but with alternatives and marginal cost adjustments,
municipalities and regions can help to redevelop the landscape back to a more sustainable pattern.

[i] Greene, Gregory. The End of Suburbia: Oil Depletion and the Collapse of the American Dream. Microcinema DVD, 2007. [ii] International Monetary Fund, “Iequality Over the Past Century” Picture This, 2011. Accessed
11/30/2013. http://www.imf.org/external/pubs/ft/fandd/2011/09/pdf/picture.pdf [iii] Piketty, Thomas, and Emmanuel Saez, Income Inequality in the United States, 1913-2002, Berkeley: U.C. Berkeley. 2004. Accessed
11/30/2013. http://elsa.berkeley.edu/~saez/piketty-saezOUP04US.pdf
[iv] Duany, Andres, Elizabeth Plater-Zyberk, and Jeff Speck. 2000. Suburban Nation: The Rise of Sprawl and the Decline of the
American Dream. New York: North Point Press.
[v] Ibid. [vi]Greene, Gregory. The End of Suburbia: Oil Depletion and the Collapse of the American Dream. Microcinema DVD, 2007. [vii] Library of Congress, “History of the Oil and Gas Industry,” Business References Services, 2006. Accessed
11/30/2013 http://www.loc.gov/rr/business/BERA/issue5/history.html [viii] Duany, Andres, Elizabeth Plater-Zyberk, and Jeff Speck. 2000. Suburban Nation: The Rise of Sprawl and the Decline of the
American Dream. New York: North Point Press. [ix] Hoornweg, Daniel, Lorraine Sugar, and Claudia Lorena Trejos Gomez. “Cities and Greenhouse Gas Emmissions: Moving
Forward,” Elements. 2012. [x] Greene, Gregory. The End of Suburbia: Oil Depletion and the Collapse of the American Dream. Microcinema DVD, 2007. [xi] Henretta, James A., David Brody, and Lynn Dumenil. America's History: 6th ed. Boston: Bedford St. Martin's. 2008.
[xii] Rome, Adam. The Bulldoxer in the Countryside: Suburban Sprawl and the Rise of American Environmentalism. Cambridge: Cambridge
University Press. 2001.
[xiii] Kunstler, James Howard. The Long Emergency: Surviving the End of Oil, Climate Change and Other Converging Catastropies of the
Twenty-First Century. New York: Grove Press, 2007. [xiv] Greene, Gregory. The End of Suburbia: Oil Depletion and the Collapse of the American Dream. Microcinema DVD, 2007. [xv] WSDOT, “Where Does the Gas Tax Go?” 2013. Accessed
11/30/2013. http://www.wsdot.wa.gov/NR/rdonlyres/AC3F7237-BDA3-4F2A-A0B9-4A72CB97576C/0/WhereDoestheGasTaxGo2013.pdf
[xvi] The Tax Foundation, “State Gasoline Tax Rates, 2009-2013,” 2013. Accessed
11/30/2013. http://taxfoundation.org/article/state-gasoline-tax-rates-2009-2013 [xvii] Tri-Met, “Rail System Map” 2013. Accessed 11/30/2013. http://trimet.org/maps/railsystem.htm [xviii] Sound Transit, Transit Development Plan, 2011-2016, and 2010 Annual Report. 2011. Accessed
11/30/2013. http://www.soundtransit.org/Documents/pdf/newsroom/2010_TDP_2011AnnualRpt.pdf [xix] Barkan, Chris. Railroad Transportation Efficiency. Urbana: Illinois Railroad Engineering Program.
2009. http://www.istc.illinois.edu/about/SeminarPresentations/20091118.pdf
[xx] Victoria Transport Policy Institute Transportation Cost Benefit Analysis II – Parking Costs. 2013. Accessed 11/30/2013. http://www.vtpi.org/tca/tca0504.pdf
[xxi] Cooper, C.B. John “Price Elasticity of Demand for Crude Oil: Estimates for 23 Countries” OPEC. 2003 Accessed
7/5/2013 http://15961.pbworks.com/f/Cooper.2003.OPECReview.PriceElasticityofDemandforCrudeOil.pdf
[xxii] Pierce Transit, “Ridership,” 2013. Accessed 11/30/2013. http://www.piercetransit.org/ridership/ [xxiii] Vedder, Tracy. “A Year After 520 Tolling Began, State Eying Expansion to I-90,” KomoNews.com 2012. Accessed
11/30/2013 http://www.komonews.com/news/local/A-year-after-520-tolling-began-state-eyeing-expansion-to-I-90-184994281.html
[xxiv] WSDOT, SR 167 HOT Lanes Pilot Project: Third Annual Performance Summary: May 2008- April 2011. Washington State Department of Transportation, 2011. Accessed 11/30/2013. http://www.wsdot.wa.gov/NR/rdonlyres/C198671E-7B2F-4186-9912-A41A0B274103/0/SR167_AnnualPerformanceSummary_113011_FINAL_WEB.pdf
[xxv] The City of Vancouver, Transportation 2040: Plan as Adopted by City Council on October 31, 2012. Vancouver: 2012. Accessed
11/30/2013. http://vancouver.ca/files/cov/Transportation_2040_Plan_as_adopted_by_Council.pdf [xxvi] Sound Transit, Sound Transit 2: A Mass Transit Guide: The Regional Transit System Plan For Central Puget Sound. 2008. Accessed
11/30/2013. http://www.soundtransit.org/Documents/pdf/st2/transitexapansion/ST2_Plan_web.pdf [xxvii] Seattle Housing Authority, “Rainier Vista,” SeattleHousingAuthority.org 2013. Accessed
11/30/2013. http://www.seattlehousing.org/redevelopment/rainier-vista/ [xxviii] Skahan, Kelly, “Here are the Going Rates at The Station at Othello Park,” Curbed.com. 2011. Accessed
11/30/2013. http://seattle.curbed.com/archives/2011/07/here-are-the-going-rates-for-the-station-at-othello-park.php [xxix] ArtSpace, “Artspace Mt. Baker Lofts: Jumpstarting an Urban Village.” Artspace.com. 2012. Accessed
11/30/2013. http://www.artspace.org/our-places/artspace-mt-baker-lofts [xxx] EPA, Encouraging Transit Oriented Development: Case Studies That Work. Environmental Protection Agency. nd. Accessed
11/30/2013. http://www.epa.gov/dced/pdf/phoenix-sgia-case-studies.pdf [xxxi] Smith, Stephen. “U.S. Taxpayers are Gouged on Mass Transit Costs,” Bloomberg.com. 2012. Accessed
11/30/2013. http://www.bloomberg.com/news/2012-08-26/u-s-taxpayers-are-gouged-on-mass-transit-costs.html [xxxii] Urban Transport Factbook, “US Light Rail Costs $70 Million per Mile,” PublicPurpose.com. nd. Accessed
11/30/2013. http://www.publicpurpose.com/ut-lrt00capcost.htm [xxxiii] Sound Transit, Transit Development Plan 2011-2016 and 2011 Annual Report . SoundTransit.org. 2011. Accessed
11/30/2013 http://www.soundtransit.org/Documents/pdf/newsroom/2010_TDP_2011AnnualRpt.pdf [xxxiv] Sound Transit, Sound Transit 2: A Mass Transit Guide: The Regional Transit System Plan For Central Puget Sound. 2008. Accessed
11/30/2013. http://www.soundtransit.org/Documents/pdf/st2/transitexapansion/ST2_Plan_web.pdf [xxxv] “ASCE” 2013 Report Card for America’s Infrastructure: Roads: Overview.” Accessed
11/30/2013.http://www.infrastructurereportcard.org/a/#p/roads/overview. [xxxvi] “Cost of Owning and Operating Vehicle in U.S. Increases Nearly Two Percent According to AAA’s 2013 ‘Your Driving
Costs’ Study: AAA NewsRoom.” Accessed 11/30/2013.http://newsroom.aaa.com/2013/04/cost-of-owning-and-operating-vehicle-in-u-s-increases-nearly-two-percent-according-to-aaas-2013-your-driving-costs-study/.
[xxxvii] American Public Transportation Association, “Facts,” Apta.com. 2013. Accessed
11/30/2013. http://www.apta.com/mediacenter/ptbenefits/Pages/FactSheet.aspx

[xxxviii] Kunstler, James Howard. The Long Emergency: Surviving the End of Oil, Climate Change and Other Converging Catastropies of the Twenty-First Century. New York: Grove Press, 2007.