The Balance of Payments Chapter Three INTERNATIONAL · 2015-03-24 · S 1 6 P S 6 Balance of...
9
10/16/14 1 Copyright © 2007 by The McGraw-Hill Companies, Inc. All rights reserved. 3-0 INTERNATIONAL FINANCIAL MANAGEMENT EUN / RESNICK Seventh Edition Copyright © 2014 by The McGraw-Hill Companies, Inc. All rights reserved. Copyright © 2007 by The McGraw-Hill Companies, Inc. All rights reserved. 3-1 Chapter Objective: This chapter serves to introduce students to the balance of payments – how it is constructed, and how BOP data may be interpreted. 3 Chapter Three The Balance of Payments Copyright © 2007 by The McGraw-Hill Companies, Inc. All rights reserved. 3-2 Chapter Three Outline Balance of Payments Accounting Specific Balance of Payments Accounts Current Account Capital Account Official Reserves Account Statistical Discrepancy Balance of Payments Identity BOP Trends in Major Countries Copyright © 2007 by The McGraw-Hill Companies, Inc. All rights reserved. 3-3 Balance of Payments Accounting The Balance of Payments is the statistical record of a country’s international transactions over a certain period of time presented in the form of double-entry book-keeping. N.B. when we talk about “a country’s balance of payments,” we are referring to the transactions of its citizens and government. Copyright © 2007 by The McGraw-Hill Companies, Inc. All rights reserved. 3-4 BOP: Basic Principle Transactions that lead to an increase in the supply of a country’s currency are recorded as debits in that country’s BOP Examples: importing bicycles from abroad, purchasing foreign assets (financial assets, physical assets, etc.) Transactions that lead to an increase in demand for a country’s currency are recorded as credits in that country’s BOP Examples: exports of goods, services, sales of assets Copyright © 2007 by The McGraw-Hill Companies, Inc. All rights reserved. 3-5 Balance of Payments Example Suppose that Maplewood Bicycle Inc. in Maplewood, Missouri, USA imports $100,000 worth of bicycle frames from Mercian Bicycles Ltd. in Darby, England. There will exist a $100,000 credit recorded by Mercian that “offsets” a $100,000 debit at Maplewood’s bank account. This will lead to a rise in the supply of dollars and the demand for British pounds.
Transcript of The Balance of Payments Chapter Three INTERNATIONAL · 2015-03-24 · S 1 6 P S 6 Balance of...
10/16/14
1
Copyright © 2007 by The McGraw-Hill Companies, Inc. All rights reserved. 3-0
INTERNATIONAL FINANCIAL
MANAGEMENT
EUN / RESNICK
Seventh Edition
Copyright © 2014 by The McGraw-Hill Companies, Inc. All rights reserved. Copyright © 2007 by The McGraw-Hill Companies, Inc. All rights reserved. 3-1
INTERNATIONAL FINANCIAL
MANAGEMENT
EUN / RESNICK
Fourth Edition
Chapter Objective: This chapter serves to introduce students to the balance of payments – how it is constructed, and how BOP data may be interpreted.
3 Chapter Three
The Balance of Payments
Copyright © 2007 by The McGraw-Hill Companies, Inc. All rights reserved. 3-2
Chapter Three Outline
l Balance of Payments Accounting l Specific Balance of Payments Accounts
n Current Account n Capital Account n Official Reserves Account n Statistical Discrepancy
l Balance of Payments Identity l BOP Trends in Major Countries
Copyright © 2007 by The McGraw-Hill Companies, Inc. All rights reserved. 3-3
Balance of Payments Accounting
l The Balance of Payments is the statistical record n of a country’s international transactions n over a certain period of time n presented in the form of double-entry book-keeping.
N.B. when we talk about “a country’s balance of payments,” we are referring to the transactions of its citizens and government.
Copyright © 2007 by The McGraw-Hill Companies, Inc. All rights reserved. 3-4
BOP: Basic Principle
l Transactions that lead to an increase in the supply of a country’s currency are recorded as debits in that country’s BOP n Examples: importing bicycles from abroad, purchasing
foreign assets (financial assets, physical assets, etc.)
l Transactions that lead to an increase in demand for a country’s currency are recorded as credits in that country’s BOP n Examples: exports of goods, services, sales of assets
Copyright © 2007 by The McGraw-Hill Companies, Inc. All rights reserved. 3-5
Balance of Payments Example
l Suppose that Maplewood Bicycle Inc. in Maplewood, Missouri, USA imports $100,000 worth of bicycle frames from Mercian Bicycles Ltd. in Darby, England.
l There will exist a $100,000 credit recorded by Mercian that “offsets” a $100,000 debit at Maplewood’s bank account.
l This will lead to a rise in the supply of dollars and the demand for British pounds.
10/16/14
2
Copyright © 2007 by The McGraw-Hill Companies, Inc. All rights reserved. 3-6
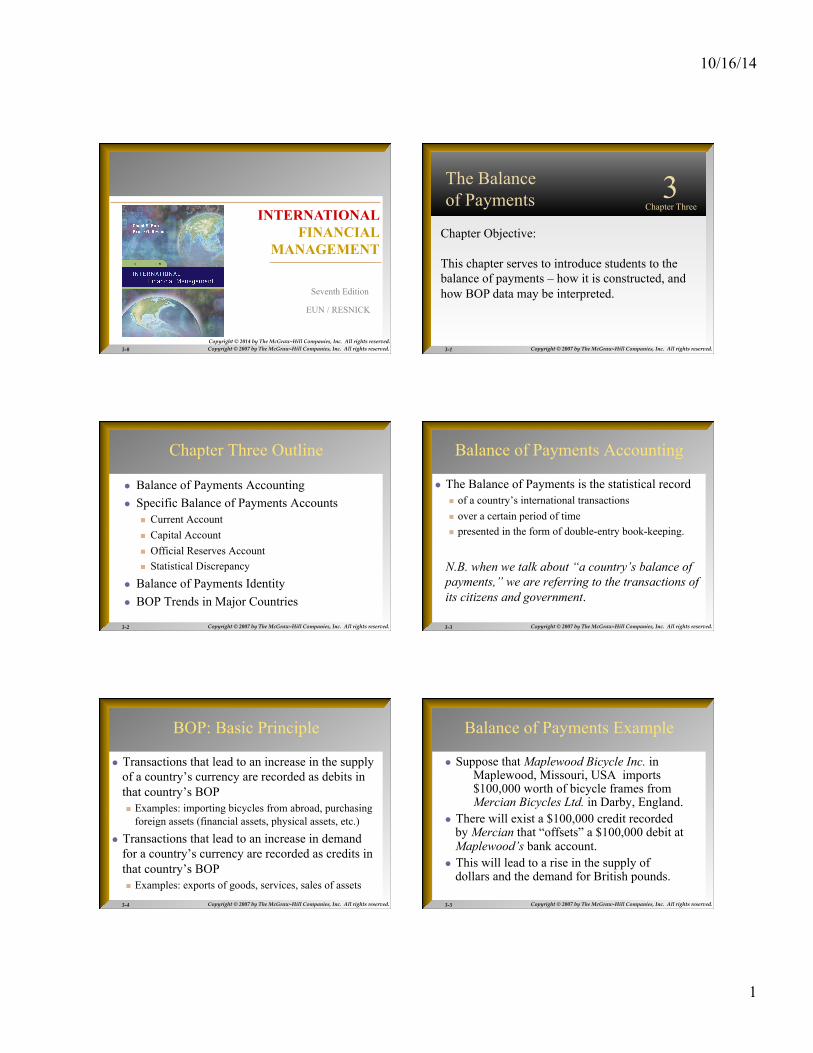
l The balance of payments accounts are those that record all transactions between (i) the residents of a country and (ii) residents of all foreign nations.
l They comprise the following accounts: n Current Account (ACCT-240 analogy: “Profits & Loss”) n Capital Account (ACCT-240 analogy: “Balance Sheet”) n Official Reserves Account n Statistical Discrepancy
A. Balance of Payments Accounts
Copyright © 2007 by The McGraw-Hill Companies, Inc. All rights reserved. 3-7
Balance of Payments Accounts
Copyright © 2007 by The McGraw-Hill Companies, Inc. All rights reserved. 3-8
1. The Current Account (CA)
l Includes all imports/exports of goods & services. n Trade balance (civilian & military goods) n Invisibles balance (services) n Investment income balance
l Accounting n Exports of G&S are entered as credits
u because they create cash inflows for the domestic country
n Imports of G&S are entered as debits u because they lead to cash outflows from the domestic country
Copyright © 2007 by The McGraw-Hill Companies, Inc. All rights reserved. 3-9
The Current Account (CA)
l Includes all imports/exports of goods & services n Trade, Invisibles, Factor income, Foreign aid
l Unilateral transfers of foreign aid n Debit (Idea: “import goodwill”) n Double-entry -> what gets credited? G&S: CA; cash: KA
l If the debits exceed the credits, then BCA<0 n i.e., the country is running a CA (“trade”) deficit
l If the credits exceed the debits, then BCA>0 n i.e., the country is running a CA (“trade”) surplus
Copyright © 2007 by The McGraw-Hill Companies, Inc. All rights reserved. 3-10
The Current Account (CA)
l Much lower deficit in 2009 than in 2008
àWhy?
Copyright © 2007 by The McGraw-Hill Companies, Inc. All rights reserved. 3-11
2. The Capital Account (KA)
l The capital account records domestic residents’ n sales of financial assets to foreigners n purchases of foreign financial assets
l Accounting n Asset sales to foreigners are entered as credits
u “exporting” financial assets leads to cash inflows into the domestic (home) country
n Purchases of foreign financial assets are entered as debits u “importing” financial assets is associated with cash outflows
from the home country
10/16/14
3
Copyright © 2007 by The McGraw-Hill Companies, Inc. All rights reserved. 3-12
The Capital Account (KA)
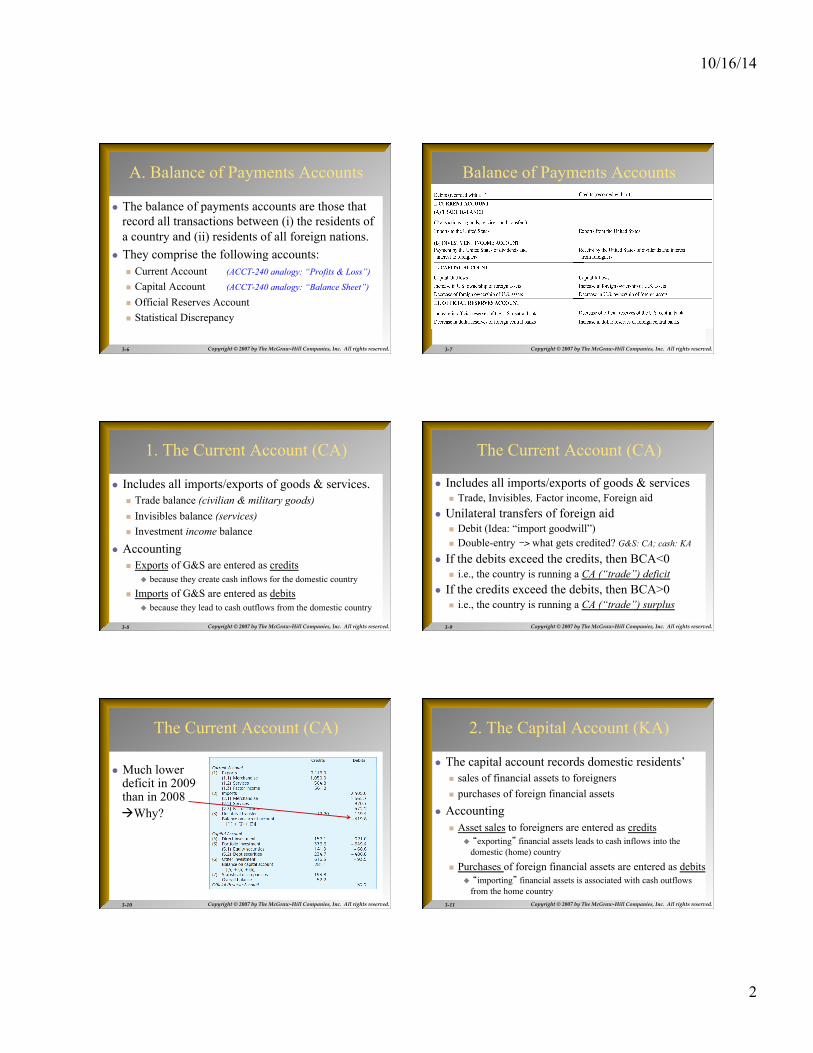
l The KA balance measures the gap between residents’ assets sales to foreigners and the same residents’ purchases of foreign assets.
l The U.S. enjoys a huge KA surplus (2007: $790bn; 2011: $410.1bn)—absent official U.S. borrowing abroad, this surplus “finances” the U.S. trade deficit
l Details for 2011 (from Economic Report to the President) n Increase in foreign-owned assets in USA: $1,001bn n Increase in US privately-owned assets abroad: $ 484bn n See handout: 05b_US_BoP erp_B103&B107 2013
Copyright © 2007 by The McGraw-Hill Companies, Inc. All rights reserved. 3-13
The Capital Account (KA)
l The capital account is composed of
n Foreign Direct Investment u FDI; control 10% or more;
n Portfolio investments u stocks & bonds without control;
n Other investments u trade credits, bank deposits,…
Copyright © 2007 by The McGraw-Hill Companies, Inc. All rights reserved. 3-14
The Capital Account (KA)
l Much lower net flows in 2009 than in 2008
l Why?
Copyright © 2007 by The McGraw-Hill Companies, Inc. All rights reserved. 3-15
Flows vs. Stocks: KA vs. NIIP
l Capital account (KA) n Is a flow measure
u measures capital flows between a country and the rest of the world (ROW)
l Net international investment position (NIIP) n Is a stock measure
u measures whether a country is a net creditor (e.g., China) or debtor (e.g., US) with respect to the ROW.
Copyright © 2007 by The McGraw-Hill Companies, Inc. All rights reserved. 3-16
Flows vs. Stocks: KA vs. NIIP
Copyright © 2007 by The McGraw-Hill Companies, Inc. All rights reserved. 3-17
3. Statistical Discrepancy
l There are going to be some omissions and mis-recorded transactions—so we use a “plug” figure to get things to balance
l Exhibit 3.1 (three slides down) shows discrepancy of +$200bn in 2008, later adjusted to -$59bn n Discrepancy sometimes even larger
u biggest « initial » discrepancies observed in ’91, ’98 & 2008-10 n why? sign? (2008: initial=+$200bn; 2010: initial=+$216.7bn)
u initial discrepancies are often revised in later years n 2000: initial estimate = plus $0.73bn, revised = minus $74bn
10/16/14
4
Copyright © 2007 by The McGraw-Hill Companies, Inc. All rights reserved. 3-18
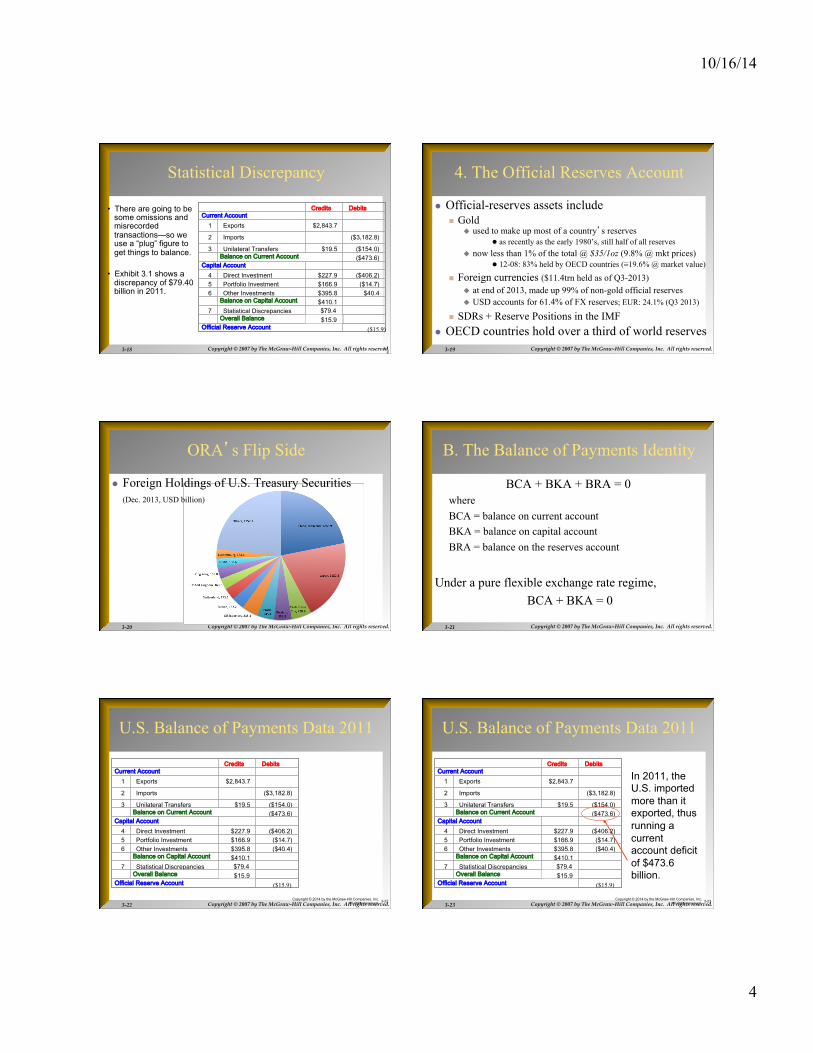
Statistical Discrepancy
Credits
Debits Current Account
1
Exports
$2,843.7
2
Imports
($3,182.8)
3
Unilateral Transfers
$19.5
($154.0)
Balance on Current Account
($473.6) Capital Account
4
Direct Investment
$227.9
($406.2) 5
Portfolio Investment
$166.9
($14.7) 6
Other Investments
$395.8
$40.4
Balance on Capital Account
$410.1 7
Statistical Discrepancies
Overall Balance
$15.9
Official Reserve Account
$79.4
($15.9)
• There are going to be some omissions and misrecorded transactions—so we use a “plug” figure to get things to balance.
• Exhibit 3.1 shows a
discrepancy of $79.40 billion in 2011.
3-18
Copyright © 2007 by The McGraw-Hill Companies, Inc. All rights reserved. 3-19
4. The Official Reserves Account
l Official-reserves assets include n Gold
u used to make up most of a country’s reserves l as recently as the early 1980’s, still half of all reserves
u now less than 1% of the total @ $35/1oz (9.8% @ mkt prices) l 12-08: 83% held by OECD countries (≡19.6% @ market value)
n Foreign currencies ($11.4trn held as of Q3-2013) u at end of 2013, made up 99% of non-gold official reserves u USD accounts for 61.4% of FX reserves; EUR: 24.1% (Q3 2013)
n SDRs + Reserve Positions in the IMF l OECD countries hold over a third of world reserves
Copyright © 2007 by The McGraw-Hill Companies, Inc. All rights reserved. 3-20
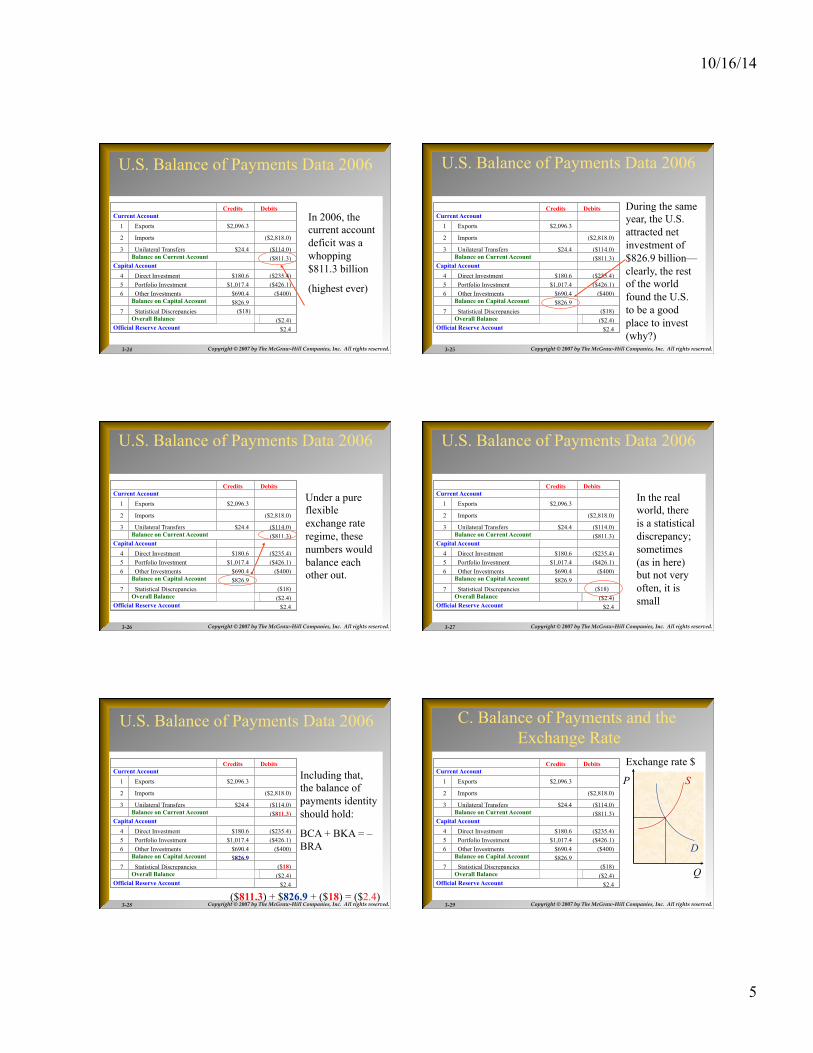
ORA’s Flip Side
l Foreign Holdings of U.S. Treasury Securities (Dec. 2013, USD billion)
Copyright © 2007 by The McGraw-Hill Companies, Inc. All rights reserved. 3-21
B. The Balance of Payments Identity
BCA + BKA + BRA = 0 where BCA = balance on current account BKA = balance on capital account BRA = balance on the reserves account
Under a pure flexible exchange rate regime, BCA + BKA = 0
Copyright © 2007 by The McGraw-Hill Companies, Inc. All rights reserved. 3-22
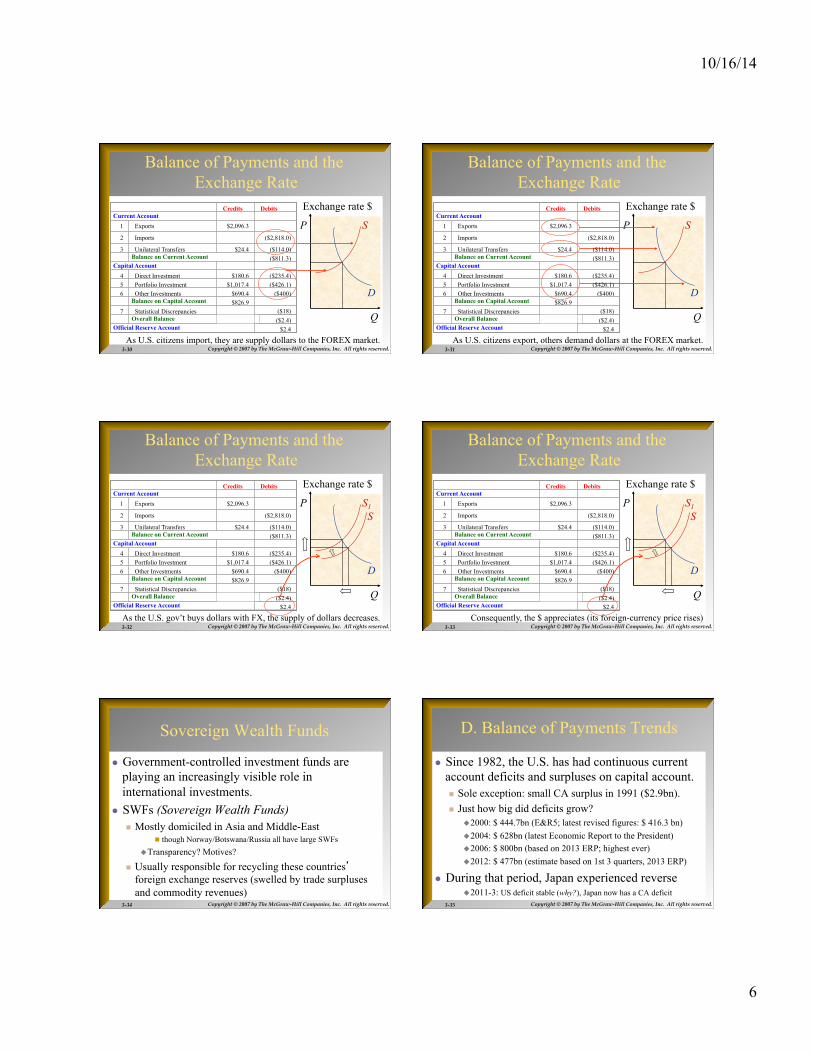
U.S. Balance of Payments Data 2011
Credits
Debits Current Account
1
Exports
$2,843.7
2
Imports
($3,182.8)
3
Unilateral Transfers
$19.5
($154.0)
Balance on Current Account
($473.6) Capital Account
4
Direct Investment
$227.9
($406.2) 5
Portfolio Investment
$166.9
($14.7) 6
Other Investments
$395.8
($40.4)
Balance on Capital Account
$410.1 7
Statistical Discrepancies
Overall Balance
$15.9
Official Reserve Account
$79.4
($15.9) Copyright © 2014 by the McGraw-Hill Companies, Inc.
All rights reserved.
3-22 Copyright © 2007 by The McGraw-Hill Companies, Inc. All rights reserved. 3-23
In 2011, the U.S. imported more than it exported, thus running a current account deficit of $473.6 billion.
U.S. Balance of Payments Data 2011
Credits
Debits Current Account
1
Exports
$2,843.7
2
Imports
($3,182.8)
3
Unilateral Transfers
$19.5
($154.0)
Balance on Current Account
($473.6) Capital Account
4
Direct Investment
$227.9
($406.2) 5
Portfolio Investment
$166.9
($14.7) 6
Other Investments
$395.8
($40.4)
Balance on Capital Account
$410.1 7
Statistical Discrepancies
Overall Balance
$15.9
Official Reserve Account
$79.4
($15.9) Copyright © 2014 by the McGraw-Hill Companies, Inc.
All rights reserved.
3-23
10/16/14
5
Copyright © 2007 by The McGraw-Hill Companies, Inc. All rights reserved. 3-24
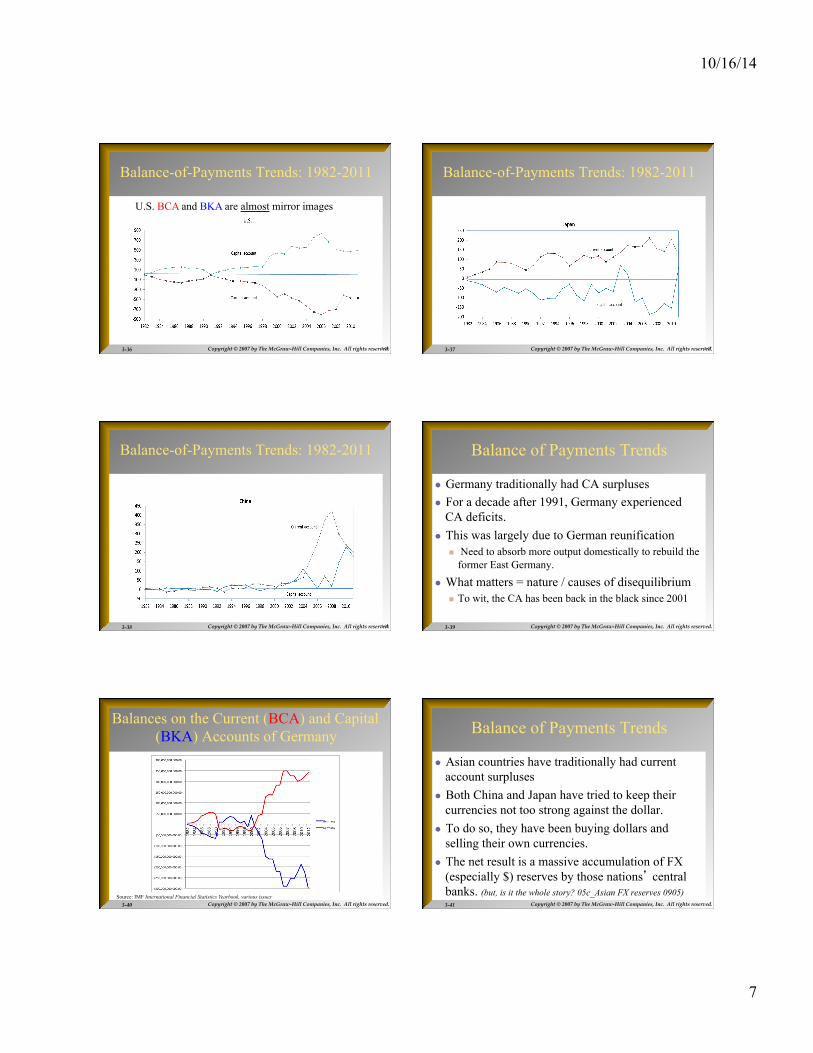
U.S. Balance of Payments Data 2006
In 2006, the current account deficit was a whopping$811.3 billion
(highest ever)
Credits
Debits Current Account
1
Exports
$2,096.3
2
Imports
($2,818.0)
3
Unilateral Transfers
$24.4
($114.0)
Balance on Current Account
($811.3) Capital Account
4
Direct Investment
$180.6
($235.4) 5
Portfolio Investment
$1,017.4
($426.1) 6
Other Investments
$690.4
($400)
Balance on Capital Account
$826.9 7
Statistical Discrepancies
Overall Balance
($2.4)
Official Reserve Account
$2.4
($18)
Copyright © 2007 by The McGraw-Hill Companies, Inc. All rights reserved. 3-25
U.S. Balance of Payments Data 2006
During the same year, the U.S. attracted net investment of $826.9 billion—clearly, the rest of the world found the U.S. to be a good place to invest (why?)
Credits
Debits Current Account
1
Exports
$2,096.3
2
Imports
($2,818.0)
3
Unilateral Transfers
$24.4
($114.0)
Balance on Current Account
($811.3) Capital Account
4
Direct Investment
$180.6
($235.4) 5
Portfolio Investment
$1,017.4
($426.1) 6
Other Investments
$690.4
($400)
Balance on Capital Account
$826.9 7
Statistical Discrepancies
Overall Balance
($2.4)
Official Reserve Account
$2.4
($18)
Copyright © 2007 by The McGraw-Hill Companies, Inc. All rights reserved. 3-26
U.S. Balance of Payments Data 2006
Under a pure flexible exchange rate regime, these numbers would balance each other out.
Credits
Debits Current Account
1
Exports
$2,096.3
2
Imports
($2,818.0)
3
Unilateral Transfers
$24.4
($114.0)
Balance on Current Account
($811.3) Capital Account
4
Direct Investment
$180.6
($235.4) 5
Portfolio Investment
$1,017.4
($426.1) 6
Other Investments
$690.4
($400)
Balance on Capital Account
$826.9 7
Statistical Discrepancies
Overall Balance
($2.4)
Official Reserve Account
$2.4
($18)
Copyright © 2007 by The McGraw-Hill Companies, Inc. All rights reserved. 3-27
U.S. Balance of Payments Data 2006
In the real world, there is a statistical discrepancy; sometimes (as in here) but not very often, it is small
Credits
Debits Current Account
1
Exports
$2,096.3
2
Imports
($2,818.0)
3
Unilateral Transfers
$24.4
($114.0)
Balance on Current Account
($811.3) Capital Account
4
Direct Investment
$180.6
($235.4) 5
Portfolio Investment
$1,017.4
($426.1) 6
Other Investments
$690.4
($400)
Balance on Capital Account
$826.9 7
Statistical Discrepancies
Overall Balance
($2.4)
Official Reserve Account
$2.4
($18)
Copyright © 2007 by The McGraw-Hill Companies, Inc. All rights reserved. 3-28
U.S. Balance of Payments Data 2006
Including that, the balance of payments identity should hold:
BCA + BKA = – BRA
($811.3) + $826.9 + ($18) = ($2.4)
Credits
Debits Current Account
1
Exports
$2,096.3
2
Imports
($2,818.0)
3
Unilateral Transfers
$24.4
($114.0)
Balance on Current Account
($811.3) Capital Account
4
Direct Investment
$180.6
($235.4) 5
Portfolio Investment
$1,017.4
($426.1) 6
Other Investments
$690.4
($400)
Balance on Capital Account
$826.9 7
Statistical Discrepancies
Overall Balance
($2.4)
Official Reserve Account
$2.4
($18)
Copyright © 2007 by The McGraw-Hill Companies, Inc. All rights reserved. 3-29
C. Balance of Payments and the Exchange Rate
Q
P
Exchange rate $
S
D
Credits
Debits Current Account
1
Exports
$2,096.3
2
Imports
($2,818.0)
3
Unilateral Transfers
$24.4
($114.0)
Balance on Current Account
($811.3) Capital Account
4
Direct Investment
$180.6
($235.4) 5
Portfolio Investment
$1,017.4
($426.1) 6
Other Investments
$690.4
($400)
Balance on Capital Account
$826.9 7
Statistical Discrepancies
Overall Balance
($2.4)
Official Reserve Account
$2.4
($18)
10/16/14
6
Copyright © 2007 by The McGraw-Hill Companies, Inc. All rights reserved. 3-30
Balance of Payments and the Exchange Rate
Q
P
As U.S. citizens import, they are supply dollars to the FOREX market.
Exchange rate $
S
D
Credits
Debits Current Account
1
Exports
$2,096.3
2
Imports
($2,818.0)
3
Unilateral Transfers
$24.4
($114.0)
Balance on Current Account
($811.3) Capital Account
4
Direct Investment
$180.6
($235.4) 5
Portfolio Investment
$1,017.4
($426.1) 6
Other Investments
$690.4
($400)
Balance on Capital Account
$826.9 7
Statistical Discrepancies
Overall Balance
($2.4)
Official Reserve Account
$2.4
($18)
Copyright © 2007 by The McGraw-Hill Companies, Inc. All rights reserved. 3-31
Balance of Payments and the Exchange Rate
Q
P
As U.S. citizens export, others demand dollars at the FOREX market.
Exchange rate $
S
D
Credits
Debits Current Account
1
Exports
$2,096.3
2
Imports
($2,818.0)
3
Unilateral Transfers
$24.4
($114.0)
Balance on Current Account
($811.3) Capital Account
4
Direct Investment
$180.6
($235.4) 5
Portfolio Investment
$1,017.4
($426.1) 6
Other Investments
$690.4
($400)
Balance on Capital Account
$826.9 7
Statistical Discrepancies
Overall Balance
($2.4)
Official Reserve Account
$2.4
($18)
Copyright © 2007 by The McGraw-Hill Companies, Inc. All rights reserved. 3-32
Balance of Payments and the Exchange Rate
Q
P S
D
As the U.S. gov’t buys dollars with FX, the supply of dollars decreases.
S1
Exchange rate $
Credits
Debits Current Account
1
Exports
$2,096.3
2
Imports
($2,818.0)
3
Unilateral Transfers
$24.4
($114.0)
Balance on Current Account
($811.3) Capital Account
4
Direct Investment
$180.6
($235.4) 5
Portfolio Investment
$1,017.4
($426.1) 6
Other Investments
$690.4
($400)
Balance on Capital Account
$826.9 7
Statistical Discrepancies
Overall Balance
($2.4)
Official Reserve Account
$2.4
($18)
Copyright © 2007 by The McGraw-Hill Companies, Inc. All rights reserved. 3-33
Balance of Payments and the Exchange Rate
Q
P S
D
Consequently, the $ appreciates (its foreign-currency price rises)
.
S1
Exchange rate $
Credits
Debits Current Account
1
Exports
$2,096.3
2
Imports
($2,818.0)
3
Unilateral Transfers
$24.4
($114.0)
Balance on Current Account
($811.3) Capital Account
4
Direct Investment
$180.6
($235.4) 5
Portfolio Investment
$1,017.4
($426.1) 6
Other Investments
$690.4
($400)
Balance on Capital Account
$826.9 7
Statistical Discrepancies
Overall Balance
($2.4)
Official Reserve Account
$2.4
($18)
Copyright © 2007 by The McGraw-Hill Companies, Inc. All rights reserved. 3-34
Sovereign Wealth Funds
l Government-controlled investment funds are playing an increasingly visible role in international investments.
l SWFs (Sovereign Wealth Funds) n Mostly domiciled in Asia and Middle-East
n though Norway/Botswana/Russia all have large SWFs u Transparency? Motives?
n Usually responsible for recycling these countries’ foreign exchange reserves (swelled by trade surpluses and commodity revenues)
Copyright © 2007 by The McGraw-Hill Companies, Inc. All rights reserved. 3-35
D. Balance of Payments Trends
l Since 1982, the U.S. has had continuous current account deficits and surpluses on capital account. n Sole exception: small CA surplus in 1991 ($2.9bn). n Just how big did deficits grow?
u 2000: $ 444.7bn (E&R5; latest revised figures: $ 416.3 bn) u 2004: $ 628bn (latest Economic Report to the President) u 2006: $ 800bn (based on 2013 ERP; highest ever) u 2012: $ 477bn (estimate based on 1st 3 quarters, 2013 ERP)
l During that period, Japan experienced reverse u 2011-3: US deficit stable (why?), Japan now has a CA deficit
10/16/14
7
Copyright © 2007 by The McGraw-Hill Companies, Inc. All rights reserved. 3-36
Balance-of-Payments Trends: 1982-2011
3-36
U.S. BCA and BKA are almost mirror images
Copyright © 2007 by The McGraw-Hill Companies, Inc. All rights reserved. 3-37
Balance-of-Payments Trends: 1982-2011
3-37
Copyright © 2007 by The McGraw-Hill Companies, Inc. All rights reserved. 3-38
Balance-of-Payments Trends: 1982-2011
3-38 Copyright © 2007 by The McGraw-Hill Companies, Inc. All rights reserved. 3-39
Balance of Payments Trends
l Germany traditionally had CA surpluses l For a decade after 1991, Germany experienced
CA deficits. l This was largely due to German reunification
n Need to absorb more output domestically to rebuild the former East Germany.
l What matters = nature / causes of disequilibrium n To wit, the CA has been back in the black since 2001
Copyright © 2007 by The McGraw-Hill Companies, Inc. All rights reserved. 3-40
Balances on the Current (BCA) and Capital (BKA) Accounts of Germany
Source: IMF International Financial Statistics Yearbook, various issues Copyright © 2007 by The McGraw-Hill Companies, Inc. All rights reserved. 3-41
Balance of Payments Trends
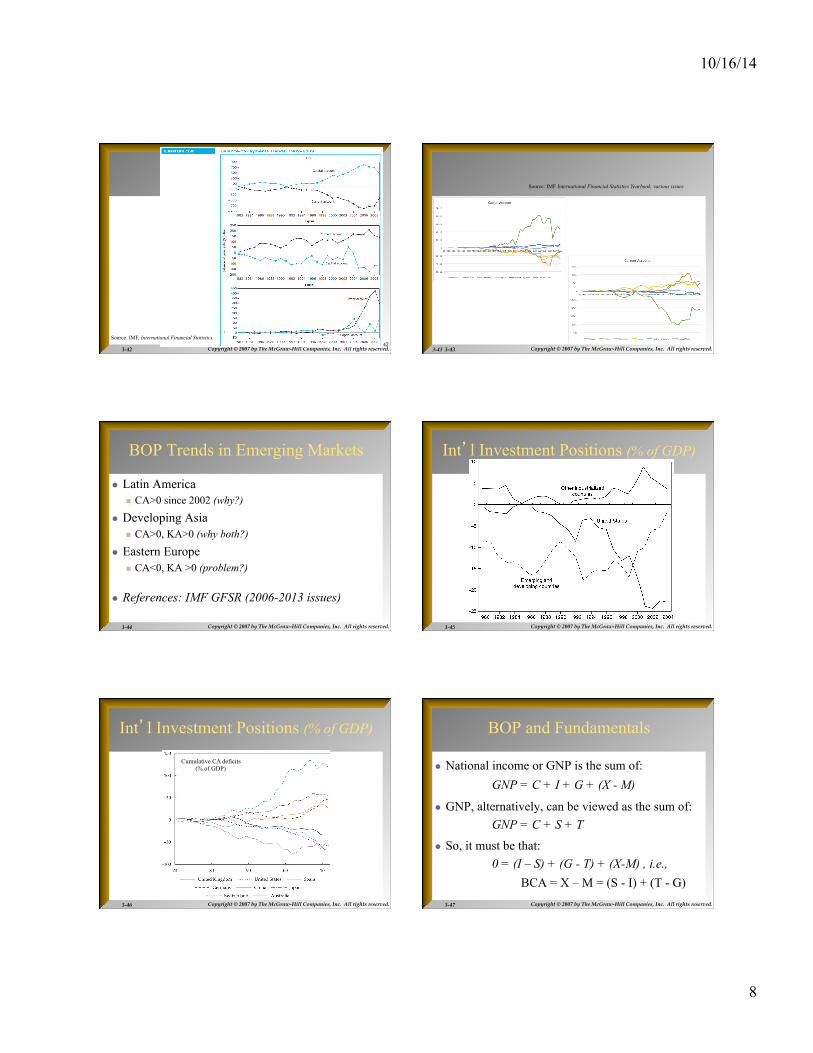
l Asian countries have traditionally had current account surpluses
l Both China and Japan have tried to keep their currencies not too strong against the dollar.
l To do so, they have been buying dollars and selling their own currencies.
l The net result is a massive accumulation of FX (especially $) reserves by those nations’ central banks. (but, is it the whole story? 05c_Asian FX reserves 0905)
10/16/14
8
Copyright © 2007 by The McGraw-Hill Companies, Inc. All rights reserved. 3-42 3-‐‑42 Source: IMF, International Financial Statistics.
Copyright © 2007 by The McGraw-Hill Companies, Inc. All rights reserved. 3-43
Source: IMF International Financial Statistics Yearbook, various issues
3-43
Copyright © 2007 by The McGraw-Hill Companies, Inc. All rights reserved. 3-44
BOP Trends in Emerging Markets
l Latin America n CA>0 since 2002 (why?)
l Developing Asia n CA>0, KA>0 (why both?)
l Eastern Europe n CA<0, KA >0 (problem?)
l References: IMF GFSR (2006-2013 issues)
Copyright © 2007 by The McGraw-Hill Companies, Inc. All rights reserved. 3-45
Int’l Investment Positions (% of GDP)
Copyright © 2007 by The McGraw-Hill Companies, Inc. All rights reserved. 3-46
Int’l Investment Positions (% of GDP)
Cumulative CA deficits (% of GDP)
Copyright © 2007 by The McGraw-Hill Companies, Inc. All rights reserved. 3-47
BOP and Fundamentals
l National income or GNP is the sum of: GNP = C + I + G + (X - M)
l GNP, alternatively, can be viewed as the sum of: GNP = C + S + T
l So, it must be that: 0 = (I – S) + (G - T) + (X-M) , i.e.,
BCA = X – M = (S - I) + (T - G)
10/16/14
9
Copyright © 2007 by The McGraw-Hill Companies, Inc. All rights reserved. 3-48
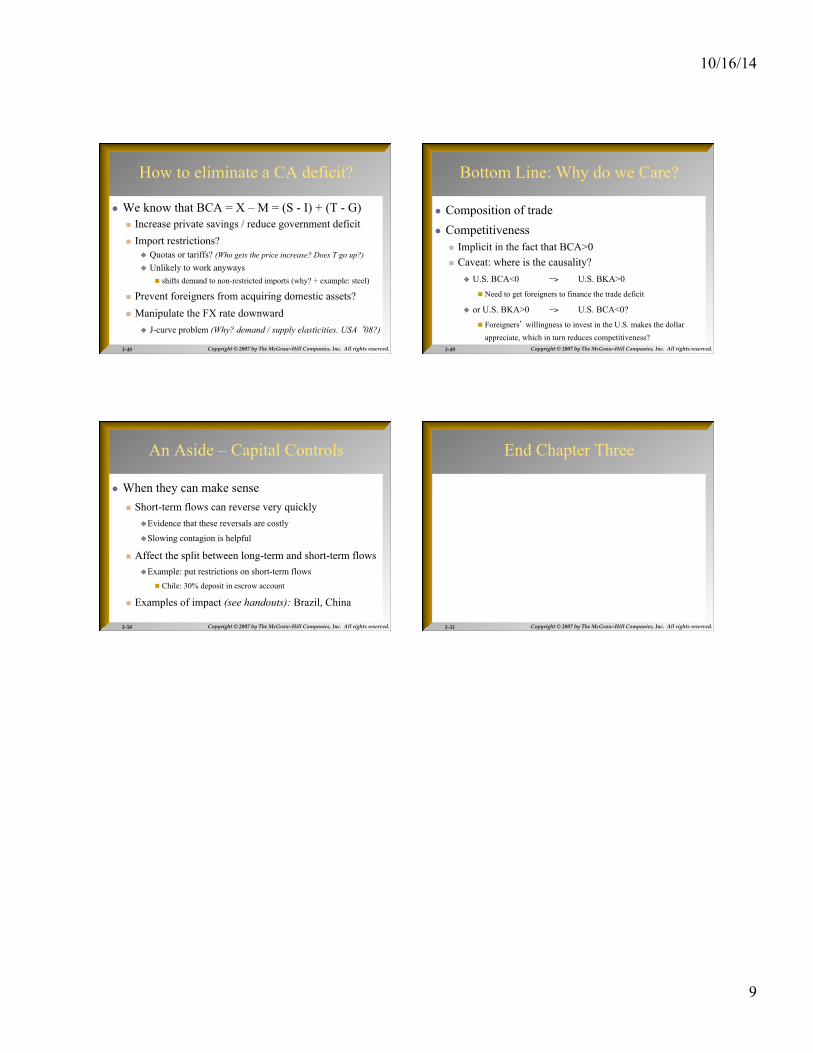
How to eliminate a CA deficit?
l We know that BCA = X – M = (S - I) + (T - G) n Increase private savings / reduce government deficit n Import restrictions?
u Quotas or tariffs? (Who gets the price increase? Does T go up?) u Unlikely to work anyways
n shifts demand to non-restricted imports (why? + example: steel)
n Prevent foreigners from acquiring domestic assets? n Manipulate the FX rate downward
u J-curve problem (Why? demand / supply elasticities. USA ‘08?)
Copyright © 2007 by The McGraw-Hill Companies, Inc. All rights reserved. 3-49
Bottom Line: Why do we Care?
l Composition of trade l Competitiveness
n Implicit in the fact that BCA>0 n Caveat: where is the causality?
u U.S. BCA<0 -> U.S. BKA>0
n Need to get foreigners to finance the trade deficit
u or U.S. BKA>0 -> U.S. BCA<0?
n Foreigners’ willingness to invest in the U.S. makes the dollar appreciate, which in turn reduces competitiveness?
Copyright © 2007 by The McGraw-Hill Companies, Inc. All rights reserved. 3-50
An Aside – Capital Controls
l When they can make sense n Short-term flows can reverse very quickly
u Evidence that these reversals are costly
u Slowing contagion is helpful
n Affect the split between long-term and short-term flows u Example: put restrictions on short-term flows
n Chile: 30% deposit in escrow account
n Examples of impact (see handouts): Brazil, China
Copyright © 2007 by The McGraw-Hill Companies, Inc. All rights reserved. 3-51
End Chapter Three