The Balance of Payments and International Trade Linkages.
44
The Balance of Payments and International Trade Linkages
-
Upload
ann-hensley -
Category
Documents
-
view
234 -
download
3
Transcript of The Balance of Payments and International Trade Linkages.

The Balance of Payments and International Trade Linkages

Organization
• BOP Accounting/ Balance of Payment Categories
• National Income Accounting and International Trade
• Trade Balances: Problem (?) and Solution

Balance of Payment Accounting The purpose is to measure the flow of economic transactions over a period of time. The conventions of double-entry
bookkeeping are used to keep track of what’s going on.• Credit: anything that leaves the country such as an export
good. (It makes sense to think of this as a credit since it triggers payments coming into the country.)
• Debit: anything that comes into the country payments to foreigners

Example An American trades a Mike Modano bobble-head doll to a Canadian for 3 pounds of seal oil.
• Credit: bobble-head Mike
• Debit: Seal oil.

Example: An American sells the doll for $200 accepting a check from the Canadian buyer
• Credit: the doll
• Debit = $200 (remember, anything that comes into the country is a debit, even if it is a financial asset, like an IOU)

Example: An American buys $200 worth of seal oil, paying with a check.
• Credit = $200 demand deposit liability (the IOU is now going to a Canadian)
• Debit: the oil

Example: Honda buys a $50 M parts warehouse in California.
• Credit: $50 M building (of course the building isn’t physically moved from the US to Japan, but the title that asset is transferred out of the US)
• Debit: $50 M liability (the check)

Example: An American sells 5 billion yen to the U.S. Federal Reserve for $50 million. (Think about why the
Fed might be interested in buying these yen).
• Credit: $50 million DD liability owned by a private citizen (the funds are no longer controlled by a private citizen)
• Debit: $50 million “official reserves” (to be defined more carefully later).
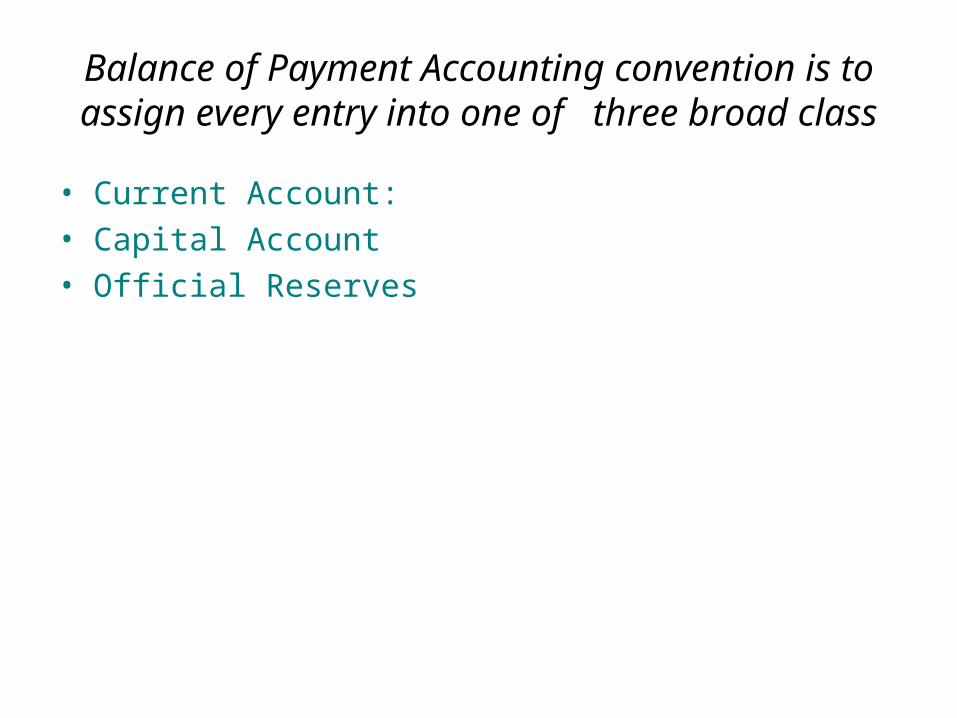
Balance of Payment Accounting convention is to assign every entry into one of three broad class
• Current Account:
• Capital Account
• Official Reserves
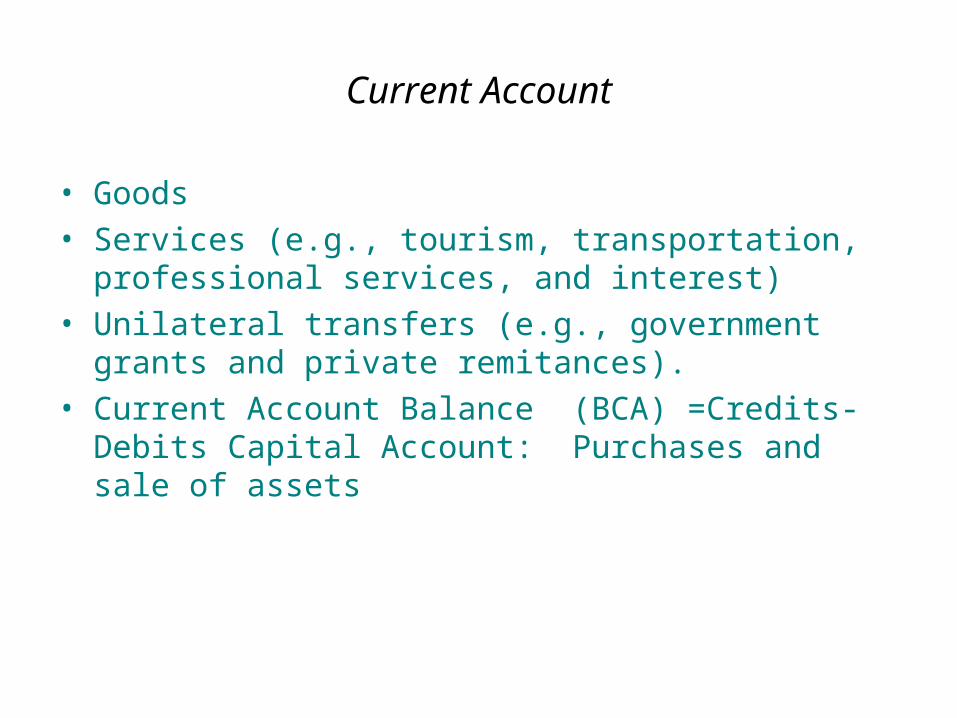
Current Account
• Goods
• Services (e.g., tourism, transportation, professional services, and interest)
• Unilateral transfers (e.g., government grants and private remitances).
• Current Account Balance (BCA) =Credits-Debits Capital Account: Purchases and sale of assets
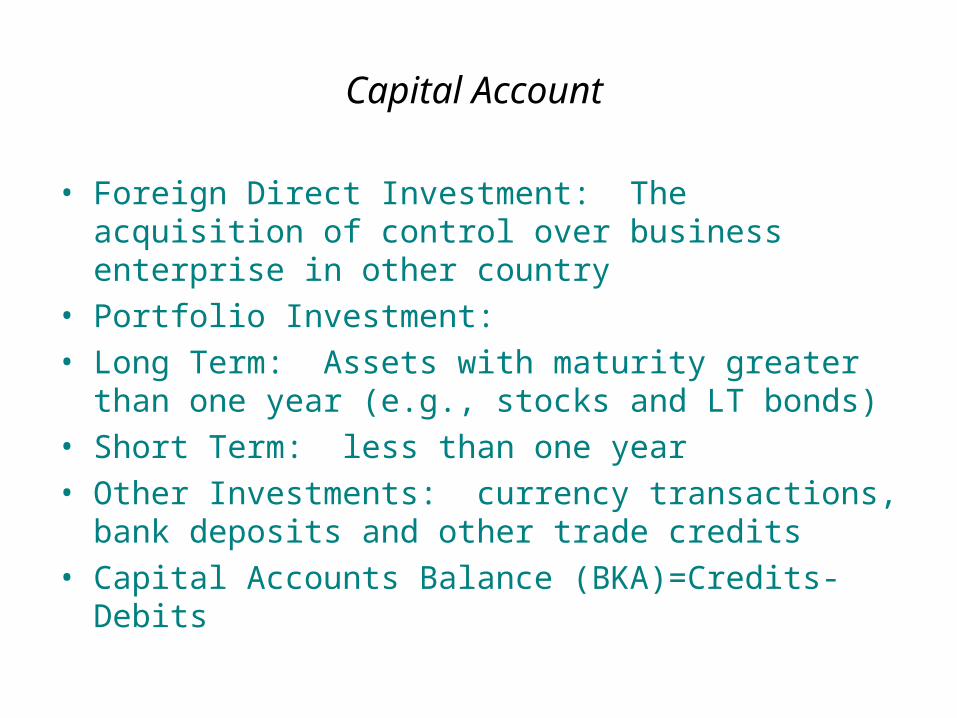
Capital Account
• Foreign Direct Investment: The acquisition of control over business enterprise in other country
• Portfolio Investment:
• Long Term: Assets with maturity greater than one year (e.g., stocks and LT bonds)
• Short Term: less than one year
• Other Investments: currency transactions, bank deposits and other trade credits
• Capital Accounts Balance (BKA)=Credits-Debits

Official Reserve Account: Central Bank Transactions in International Reserve Assets Including
• Foreign exchange
• gold
• “Special Drawing Rights” (SDR’s) a special kind of reserve asset created by the International Monetary Fund
• IMF reserve positions
• Official Reserve Balance (BRA)=Credits-Debits

Balance of Payments Accounting Identity
• Since credits must equal debits, BCA +BKA + BRA = 0
• Interesting observation: if BRA = 0, then BCA = - BKA

Example US exports $300 Billion and is paid by accepting $300 billion in credit from the foreigners
• Credit $300 (CA)
• Debit $300 (KA)

Example: US imports $225 billion and pays by writing checks on foreign bank accounts
• Credit $225 (KA)
• Debit $225 (CA)

Example: US corporations pay $15 billion in dividends to foreigners by writing checks on US banks
• Credit $15 (KA)
• Debit $15 (CA)
ExampleUS tourists spend $30 billion in travelers checks while abroad
• Credit $30 (KA)
• Debit $30 (CA)

Example: US investors buy $60 billion in foreign stocks, paying with checks drawn on foreign banks
accounts
• Credit $60 (KA)
• Debit $60 (KA)

Observation from the example
• BCA = 300 – (225 + 15 + 30) = $30
• BKA = (225+15 + 30 + 60)-(300+60) = -$30
• It would seem that BKA = -BCA
• And of course, this makes sense as an exercise in accounting identities. In the example all the transactions involve current or capital account items and since the accounting rules require that debits must equal credits this identity has to obtain.

But this also makes good economic sense.
• The stuff we get from foreigners has to be paid for somehow. It can be paid for by giving them our stuff, or by giving them financial assets (which are just claims on some undetermined stuff).
• If we exported just as much as we imported (that is, if we paid for their stuff with our stuff), the current account would balance would be zero.
• If we import more than we export, we pay by giving them complicated pieces of paper (called financial assets) which define some claim they have on our stuff .

Complication: what if we want more of their stuff than they want of our stuff, but they are unwilling to accept
private financial assets in payment? Suppose
• US imports $100 billion and pays by writing checks on US banks
• Credit $100 (KA)
• Debit $100 (CA)
• Notice that at this point, BCA = -100 and BKA = 100

Complication (Cont.) But now suppose those foreigners decide they don’t want to hold US demand deposit
liabilities and instead buy something from the Federal Reserve, say gold or their own currency.
• Credit $100 (OR)
• Debit $100 (KA)
• Notice that now BCA = -100, BKA = 100-100 = 0 and BRA =100

U.S. Balance of Payments Data
Credits DebitsCurrent Account
1 Exports $1,516.2
2 Imports ($2,109.1)
3 Unilateral Transfers $16.4 ($89.4)
Balance on Current Account ($665.9)Capital Account
4 Direct Investment $115.5 ($248.5)
5 Portfolio Investment $794.4 ($90.8)
6 Other Investments $524.3 ($483.7)
Balance on Capital Account $611.2
7 Statistical Discrepancies
Overall Balance $2.8 Official Reserve Account $2.8
51.9

U.S. Balance of Payments Data
In 2004, the U.S. imported more than it exported, thus running a current account deficit of $665.9 billion.
Credits DebitsCurrent Account
1 Exports $1,516.2
2 Imports ($2,109.1)
3 Unilateral Transfers $16.4 ($89.4)
Balance on Current Account ($665.9)Capital Account
4 Direct Investment $115.5 ($248.5)
5 Portfolio Investment $794.4 ($90.8)
6 Other Investments $524.3 ($483.7)
Balance on Capital Account $611.2
7 Statistical Discrepancies
Overall Balance $2.8 Official Reserve Account $2.8
51.9

U.S. Balance of Payments Data
During the same year, the U.S. attracted net investment of $611.2 billion—clearly the rest of the world found the U.S. to be a good place to invest.
Credits DebitsCurrent Account
1 Exports $1,516.2
2 Imports ($2,109.1)
3 Unilateral Transfers $16.4 ($89.4)
Balance on Current Account ($665.9)Capital Account
4 Direct Investment $115.5 ($248.5)
5 Portfolio Investment $794.4 ($90.8)
6 Other Investments $524.3 ($483.7)
Balance on Capital Account $611.2
7 Statistical Discrepancies
Overall Balance $2.8 Official Reserve Account $2.8
51.9

U.S. Balance of Payments Data
Under a pure flexible exchange rate regime, these numbers would balance each other out.
Credits DebitsCurrent Account
1 Exports $1,516.2
2 Imports ($2,109.1)
3 Unilateral Transfers $16.4 ($89.4)
Balance on Current Account ($665.9)Capital Account
4 Direct Investment $115.5 ($248.5)
5 Portfolio Investment $794.4 ($90.8)
6 Other Investments $524.3 ($483.7)
Balance on Capital Account $611.2
7 Statistical Discrepancies
Overall Balance $2.8 Official Reserve Account $2.8
51.9

U.S. Balance of Payments Data
In the real world, there is a statistical discrepancy.
Credits DebitsCurrent Account
1 Exports $1,516.2
2 Imports ($2,109.1)
3 Unilateral Transfers $16.4 ($89.4)
Balance on Current Account ($665.9)Capital Account
4 Direct Investment $115.5 ($248.5)
5 Portfolio Investment $794.4 ($90.8)
6 Other Investments $524.3 ($483.7)
Balance on Capital Account $611.2
7 Statistical Discrepancies
Overall Balance $2.8 Official Reserve Account $2.8
51.9

U.S. Balance of Payments Data
Including that, the balance of payments identity should hold:
BCA + BKA = – BRA
($665.9) + $611.2 + $51.9 = ($2.8)
Credits DebitsCurrent Account
1 Exports $1,516.2
2 Imports ($2,109.1)
3 Unilateral Transfers $16.4 ($89.4)
Balance on Current Account ($665.9)Capital Account
4 Direct Investment $115.5 ($248.5)
5 Portfolio Investment $794.4 ($90.8)
6 Other Investments $524.3 ($483.7)
Balance on Capital Account $611.2
7 Statistical Discrepancies
Overall Balance $2.8 Official Reserve Account $2.8
51.9

Current Account Deficit, Private Savings and the Budget Deficits

To understand all of this consider the sources and uses of funds in three increasingly complex worlds

A world where there is no international trade and no government.
• Sources: Producing consumer goods (C) and capital goods (I)
• Uses: Consuming and saving (S)
• Conclusion: C+I=C+S, or S=I

A world where there is international trade, but no government
• Sources: Producing consumer goods, capital goods, government goods,and exports (X)
• Uses: Consuming, saving, paying taxes and imports (M)
• Conclusion: C+I+X=C+S+M or X-M=(S-I)(I.e., CA=net private saving)

A world with government and trade
• Sources: Producing consumer goods, capital goods, government goods,and exports (X)
• Uses: Consuming, saving, paying taxes and imports (M)
• Conclusion: C+I+G+X=C+S+T+M or X-M=(S-I)-(G-T) (I.e., CA=net private saving - budget surplus)

Are Current Account Deficits Bad?
• Bilateral deficits can be interesting but hardly relevant to issues beyond political and economic relationships between the countries.
• Multilateral CA deficit can be interpretted as – An indication that the home country is dissaving (spending more
on I and G than S and T)
– An indication that the home country is a good place for foreigners to invest (remember a CA deficit means that capital is flowing into the home country).

Balance of Payments Trends
• Since 1982 the U.S. has experienced continuous deficits on the current account and continuous surpluses on the capital account.
• During the same period, Japan has experienced the opposite.

Balances on the Current (BCA) and Capital (BKA) Accounts of the United States
Source: IMF International Financial Statistics Yearbook, various issues
U.S. Balance of Payments Trend: 1982-2004
-800
-600
-400
-200
0
200
400
600
800
1981
1982
1983
1984
1985
1986
1987
1988
1989
1990
1991
1992
1993
1994
1995
1996
1997
1998
1999
2000
2001
2002
2003
2004
2005
Year
Bal
ance
of
Pay
men
ts (
$B)
U.S. BCA
U.S. BKA

Balances on the Current (BCA) and Capital (BKA) Accounts of United Kingdom
-50
-40
-30
-20
-10
0
10
20
30
40
1982
1984
1986
1988
1990
1992
1994
1996
1998
2000
UK BCA
UK BKA
Source: IMF International Financial Statistics Yearbook, various issues

Balances on the Current (BCA) and Capital (BKA) Accounts of Japan
Source: IMF International Financial Statistics Yearbook, various issues
-150
-100
-50
0
50
100
150
1982
1984
1986
1988
1990
1992
1994
1996
1998
2000
2002
2004
Japan BCA
Japan BKA

Balances on the Current (BCA) and Capital (BKA) Accounts of Germany
Source: IMF International Financial Statistics Yearbook, various issues
-100
-80
-60
-40
-20
0
20
40
60
80
1982
1984
1986
1988
1990
1992
1994
1996
1998
2000
2002
2004
Germany BCA
Germany BKA

Balances on the Current (BCA) and Capital (BKA) Accounts of China
Source: IMF International Financial Statistics Yearbook, various issues
-20
-10
0
10
20
30
40
50
60
1982
1984
1986
1988
1990
1992
1994
1996
1998
2000
2002
2004
China BCA
China BKA
Balance of Payments Trends
• Germany traditionally had current account surpluses.– From 1991 to 2001Germany experienced current account deficits.– This was largely due to German reunification and the resultant need
to absorb more output domestically to rebuild the former East Germany.
– Since 2001 Germany returned to its earlier pattern.
• What matters is the nature and causes of the disequilibrium.
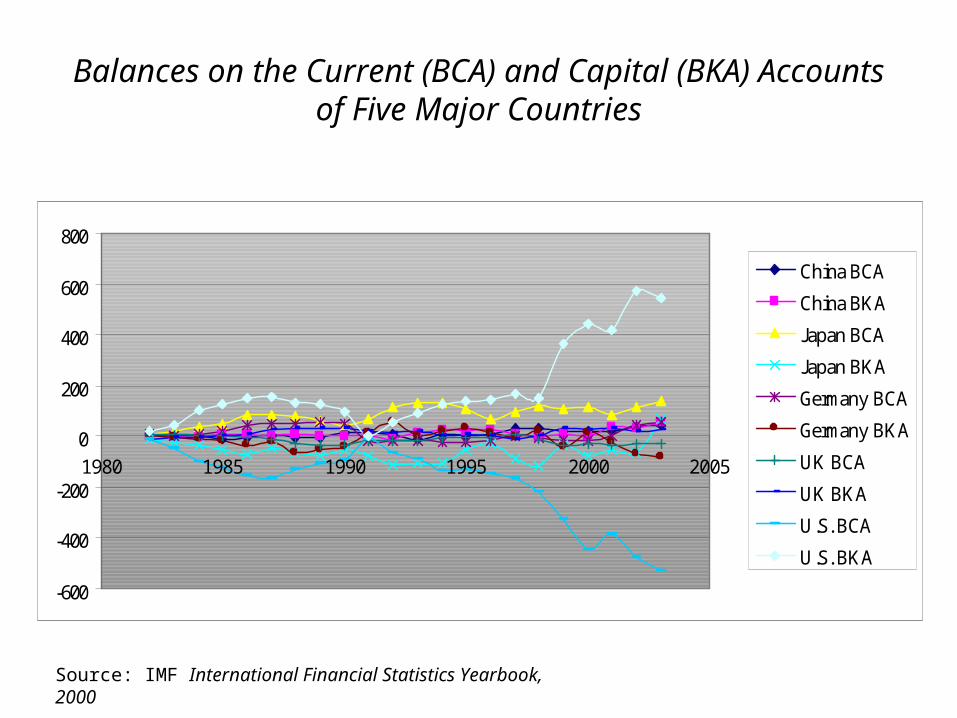
Balances on the Current (BCA) and Capital (BKA) Accounts of Five Major Countries
Source: IMF International Financial Statistics Yearbook, 2000
-600
-400
-200
0
200
400
600
800
1980 1985 1990 1995 2000 2005
China BCA
China BKA
Japan BCA
Japan BKA
Germany BCA
Germany BKA
UK BCA
UK BKA
U.S. BCA
U.S. BKA

How to fix a CA deficit (if you want to)
• Protectionism of various sorts (such as quotas and tarrifs), but– Tariffs and quotas may provoke trading partners to institute
similar policies, reducing exports.
– Tariffs and quotas discourage efficient exchange, lowering national income and reducing exports
• Domestic monetary policy– Raising interest rates
– Controlling inflation

Can devaluations work? (The “J-Curve)
• A devaluation raises the price of imports and so discourages the volume of imports (e.g., the German car that cost $50,000 before the devaluation might cost $55,000 after)
• But, the imports have a higher dollar value and so if the volume of imports drops by a smaller percentage than the price of imports, the dollar value of imports may actually increase, worsening the CA deficit.